Abstract
Renewable energy sources are ecological and sustainable solutions accepted with a common consensus under the sustainable development goals. Energy source exploration has enforced the human race to think about sustainable energy production as fossil fuels are non-renewable and are having a negative impact on ecosystem. Consumer needs and wants are the key for acceptance of renewable energy and making production a possibility. The real challenge is with the consumer market for the acceptance of green energy. The current research is based on the concept of GREEN consumer values synergizing with renewable energy sources, and eco innovation for sustainability in India. The crucial point of study is assessing GREEN consumer values which are the determining factor for consumption. All five renewable energy sources (solar, wind, hydro, geothermal and biomass) have received a higher level of acceptance by respondents which shows that India is on its way to enhancing its capacity for renewable energy. Indian consumer values are very much aligned with eco sustainability, and the market is ready to consume renewable energy.
Keywords:
renewable energy; eco innovation; GREEN consumer values; solar; wind; hydro; geothermal; biomass 1. Introduction
Energy is the most essential requirement for societies all around the world. Energy consumption is increasing with the growing population and growing industries [1]. The race of technological advancement has pressurized the energy demand. It is a fast switch over to the virtual dependency on cloud services for our everyday activities. During the COVID-19 pandemic, virtual access kept the world connected but pressurized the energy demand to run electronic devices. Energy source exploration has enforced the human race to think about sustainable energy production [2,3,4]. Fossil fuels are non-renewable and have a negative impact on ecosystems [5]. Renewable energy sources are ecological and sustainable solutions accepted with a common consensus by country leaders under the sustainable development goals [6].
Solar, wind, hydro, geothermal and biomass are main renewable sources of energy [7,8,9]. Renewable sources of energy are accepted because they are renewable and do not cause permanent damage or loss of resources (Table 1). On one hand, the switchover to the production of renewable energy is required [3], and the other hand, eco innovation is important [10]. Eco innovation is the innovation of environmental friendly products which should have less harm on the eco system and can act as a substitute to existing products with a better acceptance [10,11,12]. Consumer needs and wants are the key to any business survival. If the consumer market accepts the renewable energy only then the production can be possible [13,14]. There were challenges during early days when consumers were not willing to purchase the energy from renewable sources. However, Country ranking (Table 2) is presented, and (Table 3) renewable energy sources scores are presented. Within the last six years, green energy sources are growing with increasing production (Table 4), enhancing the capacity and supplying both the industrial and domestic types of consumers [15].

Table 1.
Repartition of renovated energy sources.
Table 1.
Repartition of renovated energy sources.
| Primary Energy Sources | Sun | Earth Isotope Decay | Moon Gravitation | |||
|---|---|---|---|---|---|---|
| Water | Wind | Sunlight | Biomass | |||
| Natural energy transformation processes | Evaporation, melting of ice and snow, precipitation | Movement of the atmosphere | Ocean currents | Production of biomass | Geothermal source | Water flows |
| Wave energy | Earth surface and atmosphere heaters | |||||
| Sunlight | ||||||
| Technical processes of energy transformation | Hydroelectric power stations | Wind power plants | Ocean current power plants | Heating and thermal power plants | Heating and geothermal power plants | Tidal power plants |
| Wave power plants | Power plants that use the heat of the oceans | Processing device | ||||
| Heat pumps | ||||||
| Collectors and thermal solar power plants | ||||||
| Photo cells and solar power plants | ||||||
| Photosynthesis | ||||||
| Form of obtained energy | Electricity | Heat and electricity | Electricity | Heat and electricity | Heat and electricity | Electricity |
| Electricity | Fuels | |||||
| Thermal energy | ||||||
| Thermal energy | ||||||
| Electricity | ||||||
| Fuels | ||||||
Source: Lewandowski M., Proekologiczne źródła energii odnawialnej. Wydawnictwo Naukowo Techniczne, Warszawa 2001 p. 40.
Current research is based on the concept of renewable energy sources [5], eco innovation [12], and GREEN consumer values [13]. On the course of problem identification, it is observed with literature that green energy sources are the goal for sustainable future [6]. At the same time eco innovation can provide a synergy in reaching the sustainability. The further elaboration has a clear presentation on ranking of top countries of the world (Table 4, Table 5 and Table 6) and the status of India (Figure 1), (Table 7) with five (solar, wind, hydro, geothermal, and biomass) renewable energy sources.
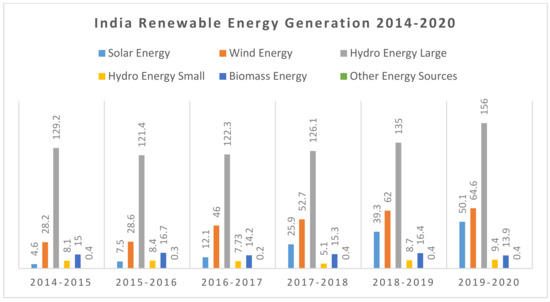
Figure 1.
India Renewable energy generation 2014–2020.
The real challenge is with the consumer market for the acceptance of green energy (Table 8, Table 9, Table 10 and Table 11). The crucial point of study is assessing the GREEN consumer values which is the determining factor for consumption [16]. The research is conducted in India, the country with a growing population and positive participation in green energy production [16,17,18].
1.1. Renewable Energy Sources
The current situation is framed on the viewpoint of reducing emissions and reducing the cost of reduction system with the better efficiency [19]. The European Commission has proposed that the 2030 target be improved and revised [20]. Adopted by the package “to fit 55 elements that are to have appropriate products, that are to create promotional materials” or 40 percent as it was recently, but by 55 percent by 2030 (as part of the exchange of guarantees for the 1990 discussion), complementing the exchange of sources of guarantees. In the 1970s, there was a dynamic development of new technologies, but the inevitable prospect of an energy crisis on the one hand and the continuous devastation of the natural environment as a side effect of the use of conventional energy, on the other, resulted in the search for unconventional (renewable) energy sources (Renewable Energy Sources—RES). Renewable energy sources are an alternative to fossil fuels, and what’s more, they are cheaper and more environmentally friendly [3,5].
Although fuels produced from non-renewable resources are still ACT of 10 April 1997 Energy Law the primary source of all power generated in the world [9], renewable energy sources are currently one of the most dynamically developing sectors of the economy in the world. Moreover, the importance of eco-innovation in successfully tackling environmental problems is increasingly emphasized [21]. It is eco-innovations that today constitute new solutions aimed at improving the efficiency of using energy and other natural resources and reducing greenhouse gas emissions [22]. Climate change and the shrinkage of fossil fuels make it necessary to shift economies to low-emission, resource-efficient paths of development. In the literature on the subject, the concept of eco-innovation is similarly perceived by many authors (Table 1) and, importantly, all these definitions prove that eco-innovation does not harm the environment [23].
The literature on the subject on RES is undoubtedly very rich (Table 1). Therefore, this study provides only the most important information on this subject in connection with the analyzed issue [24]. There are many definitions of this concept in the literature. Without undertaking a deeper analysis, this article recognizes that renewable energy sources include a wide range of self-renewing energy sources (Table 1), such as solar radiation, wind, water flow, the Earth’s internal heat, biomass, etc. These sources can be used primarily for energy production electricity [25], as well as for heating and energy storage (biomass) [26]. Thus, “sources using wind energy, solar radiation, geothermal energy, waves, sea currents and tides, river fall and energy obtained from biomass, landfill biogas, as well as from biogas generated in the processes of sewage discharge or treatment, or decomposition of stored plant debris, in the process of processing and animals” we call renewable energy sources (USTAWA z dnia 10 kwietnia 1997 r. Prawo energetyczne (ACT of 10 April 1997 En-ergy Law) Dz. U. 1997 Nr 54 poz. 348, późn. zm.).
1.2. Eco Innovation
Despite the many studies and articles published so far, research on eco-innovation is still in its early stages [27]. Synonymously another seven terms that are being used with eco-innovation, specifically, ecological innovation, sustainable innovation, environmental innovation, green innovation, sustainability-driven innovation, environmentally sustainable innovation, and sustainability-oriented innovation exists [28]. The first definition was given by [12]. In 1996, the understanding of eco innovation has significantly evolved. Compared with other types of innovations, eco-innovation usually requires firms to collaborate even with competitors [29], as the goal is not only economic performance, but the creation of positive environmental impact. We distinguish product, process, and marketing on eco-innovation. Eco-innovation can now be summarized as the production, assimilation, or exploitation of a product, production process, service or management or business method that is novel to the organization, whether the organization develops or adopts [23]. Schumpeter’s five ‘type cases’ of innovation which recognized product (new good and service) and process (new method of production) as separate distinct types of innovations, is very much applicable in eco-innovation [30].
Ecological innovation (eco-innovation) is one of the strategies for companies and countries to overcome the increasing climate changes and contribute to achieve improved and sustainable environment [31]. According to [10], eco-innovations are basic sources of ecological growth and efficiency which resulted in technological improvements and greater sustainability. Thus, over the past two decades, firms were actively searching for the method on how to implement the principles of eco-innovation into their long and short-term strategies. No common world eco-innovation was established to date. The European index Eco-Innovation Scoreboard (Eco-IS) currently consists of two groups of indicators: indicators connected with eco-innovations and indicators connected with introducing eco-innovations [32]. The indicators connected with eco-innovations include [33]:
- Eco-innovation inputs include investments that stimulate eco-innovation. This applies to both financial investments and investments.
- Eco-innovation activities show the activity of enterprises in the field of eco-innovation.
- Eco-innovation outputs give a picture of the results of eco-innovative activities regarding patents, scientific literature, and mass media news.
The indicators connected with introducing eco-innovations include:
- Resource efficiency outcomes refer to the achievements of eco-innovation aimed at saving resources such as materials, energy and water, and the volume of greenhouse gas emissions.
- Socio-economic outcomes inform to what extent the introduction of eco-innovations gives positive effects from the point of view of social (employment) and economic (turnover, exports) aspects.
As important factors conducive to the introduction of eco-innovation in European enterprises, including Poland, we include high prices of energy and materials [34]. Companies in Poland can compete with countries that are important in this respect on many markets of eco-innovative technologies [11]. For example, in contrast to complex (nuclear) energy technologies, in renewable energy (wind or biogas) there are significant chances of achieving success, if we take into account both the required potential and the support provided to Polish innovators from national and EU funds. The current green transformation in most companies are insufficient and are limited to removing the effects of pollution instead of using cleaner technologies [35]. It seems that the weak level of development of Poland is decisive, which is not encouraging to the demand for eco-innovation from business and, on the other hand, no significant financial resources are allocated to them [36].
1.3. Green Consumer Values
Consumers are a decisive element for the survival of any product of service in today’s competitive market. Many companies are offering competitive value propositions offering to sustain their business [37]. During the early years, green products were not having much awareness among consumers. However, the changing time and the world connectivity, with the growing import and export activities are generating opportunities for green consumption [38,39]. The current era has the exposure to information and is well aware of their needs. Information dissemination has created an awareness for do’s and don’ts. Most widely, advocacy has been for environment- and eco-friendly systems in order to achieve a sustainable future [40]. Governments and policy makers are positively enforcing the acceptance of green products and services, promoting their benefits and offering financial incentives [41]. Consumer value is the preference of a specific offering compared to other available options based on the comparison on benefits [42]. The benefit cannot be visible at the moment with green offerings but it will keep benefitting for generations [43].
The last decade saw a considerable interest in and growth of GREEN consumer values where the concern was to promote environmentally friendly consumption or make the consideration for eco system in consumption behavior [37]. A behavioral practice can lead to consistency in choosing the green products. The advocacy for green consumption is growing everywhere [40], and slowly getting established in the mind of consumers. The growing willingness of consumers for the green consumption, and keeping in mind the ecosystem and sustainability, is a GREEN consumer value. It is a widely trending concept because of the increasing challenges of pollution, scarcity of resources and natural losses. Though the exploration of renewable energy sources also provide a strong support to choose the alternative option [44]. There are many studies on Green practices in different areas as marketing, finance, human resource management, and production but GREEN consumer values are comparatively less explored concepts [40,45]. Understanding the concept can be possible with a justified explanation of values and consumer values concept.
Values are one’s belief which is unique for any decisive action. It is formed with two factors, one is patterns, which is guiding principle nurtured back of the mind and the other is motivation, which is the value extraction with the effort and expression of action [46]. Peoples’ preferences and actions are based on their values. Personal values are the state of acceptance internalized beliefs as guiding criteria for any action. Values are shaped by society, culture, and personality leading to the end state of existence. More broadly, values, as a concept, is the final desirable states for the evaluation or selection of solution influenced by behavior based on priority of selection [16]. Values drive a consumer for the consumption of any product or service over other available options. Consumer beliefs valuing natural resources and cultural norms are another set of decision criteria for green consumption [47]. It is important to understand that a responsible consumer is driven by values. Thus, what are those factors [40] that create green values or GREEN consumer values? Are GREEN consumer values compelling factor for the acceptance of renewable energy sources and eco-innovation. GREEN consumer values of Indian consumers [18,48] for the five renewable energy sources solar, wind, hydro, geothermal, and biomass are derived from the primary data.
2. Materials and Methods
The methodological approach adopted here uses both secondary and primary data [49]. The main theme of this research is to emphasize the usage of renewable energy sources and the assessment of consumer’s acceptance and values for green energy sources [50]. In the process of continuous effort towards reducing environmental depletion, there are many different approaches are triggered with the GREEN concept [51]. The current research is built on the basis of secondary data showing the development in the usage of renewable energy sources worldwide but specifically the situation of India in green energy production [52]. The concept of eco innovation or eco sustainability has been an addition to decision making for renewable energy sources to enhance the support to save the planet [53,54]. Eco innovation or sustainability is the indicator measuring the country’s participation in being innovative supporting ecological usage of product and service performance [21]. This indicator is used to get a more critical evaluation on measuring the strength of the country to be sustainable [55]. Furthermore, a survey is conducted to assess GREEN consumer values in renewable energy sources and eco innovations [13,30]. The research outcome expected to pivot on the theme of enhancing GREEN consumer values promoting the usage of renewable energy sources. The secondary data used reports and articles about renewable energy sources usage and future plan of countries all around the world [56].
Conceptualization of this methodological approach using the secondary data as an explanatory base and primary data as an exploratory base is the core of this study [57,58]. We are living in a consumer centric world, where the consumer’s acceptance is the real implementation of any policy. Certainly, when it is about energy sector which is mostly government regulated and, in most cases, end consumers are obligated to consume. Still, the changing economy structure and shift of government ownership to private ownership or public-private partnerships are creating a wider space for consumer choices [52]. The future is for consumers and they may have options to choose different energy sources as per their convenience and understanding [26]. Automobiles are switching from the usage of traditional fuel to electric/electronic technology [8]. The same is expected with all sectors and industries to align with the goal to be GREEN and pollution-free world [44].
Our secondary report cites India’s commitment towards enhancing the industrial capacity fulfilling the domestic and export demands for goods and services [44]. All industries consume huge amounts of energy by some means. Transformation in production system with energy efficiency and eco innovation is one way supporting the environment but another way is the choice of renewable energy sources [18]. Renewable energy sources in India are receiving attention and securing a good position among world leading countries. India is holding second position in the world for its population which is only 17% of the world total population. Secondary data collected and presented for the trend analysis and the performance of countries on their contribution in the development of renewable energy sources [59]. Reports published within last six years are incorporated to get the current picture and country’s motivation and efforts toward enhancement of green energy production [6]. The study is using well-accepted index and score values to distinguish and compare the Indian performance with world leading country on the specific indicator.
Primary data are collected using the well-structured survey questionnaire having two parts a demographical data and another conceptual data collection [13,48]. GREEN consumer values are assessed on six items for each category of renewable energy sources [13]. There are five renewable energy sources, solar, wind, hydro, geothermal, and biomass, incorporated in the study. Altogether, thirty items are framed in the questionnaire. The questionnaire distributed using online platforms prepared with google forms [60]. Simple random sampling is applied for sample collection [61]. The data collected for this study reflets a sample of 669 respondents across India [57,62,63,64]. Primary data are analyzed using statistical test as mean, Anova, correlation and regression [60,63,65,66]. These statistical techniques are the best suited here for the assessment of GREEN consumer values of Indian consumers [56,62].
2.1. Secondary Data Trend
In July 2021, India ranked third comparing with all countries of the world on the Renewable Energy Country Attractiveness Index (RECAI) ranking given by Earnest Young (EY). Only top ten countries landing in the ranking are incorporated in the study for the purpose of understanding about the contribution of India (Table 2) during the year 2019. On this score US has been at the top where China scored the second position, followed by India [6]. US and China have secured its earlier position, India, the UK, and France have moved up a rank by one, one and two points, respectively [59]. RECAI score is a good base for self-assessment of country’s participation in renewable energy generation.
Table 2.
Country ranking on RECAI score.
Table 2.
Country ranking on RECAI score.
| Country | Score | RECAI Rank | RECAI Rank Previous |
|---|---|---|---|
| US | 70.7 | 1 | 1 |
| China Mainland | 68.7 | 2 | 2 |
| India | 66.2 | 3 | 4 |
| United Kingdom | 65.0 | 4 | 5 |
| France | 64.8 | 5 | 7 |
| Australia | 64.6 | 6 | 3 |
| Germany | 63.8 | 7 | 6 |
| Japan | 61.7 | 8 | 8 |
| The Netherlands | 58.9 | 9 | 9 |
| Spain | 58.6 | 10 | 10 |
Source: [59].
Renewable energy sources are a key requirement for the world. All countries are participating in the switchover and moving towards opportunities with sustainability using renewable energy sources. The RECAI score has ranked many countries’ participation during year 2019, presented in 2021, generating renewable energy sources (Table 3). The study incorporates five sources of renewable energy namely, solar, wind, hydro, geothermal, and biomass. RECAI scores are presented to specific renewable energy sources where solar is broken a solar photovoltaic (Solar PV) [67], where India scores first, and solar concentrated solar power (Solar CSP) where China scores first [68]. The U.S. score first ranking for both onshore and offshore wind energy. Another study reports the government incentives and promotion are important for investment in wind energy [69]. China [70] scores highest for hydro energy followed by Japan and India. Japan gains the highest score in geothermal energy generation followed by the U.S. on second rank. The UK and Japan are leaders and are very close to each other on scores as position one and two, respectively, for biomass energy and China and Germany are very close to each other on rankings three and four, respectively.
We must not forget that the determination of countries are one aspect of choosing the green energy sources [71], but the geographical circumstances and exposure to natural resource abundance are the another and important criteria to implement the decision [72]. Though all score is competitive among countries on the rank, respectively. All five renewable energy sources are showing higher score with most of the countries among top five rank shows the motivation towards green energy consumption. Countries are committed to the development of infrastructure and support for the renewable energy attracting more participants for the global benefit.
Table 3.
Renewable energy sources specific RECAI score.
Table 3.
Renewable energy sources specific RECAI score.
| Country | Renewable Energy Sources Specific Scores | ||||||
|---|---|---|---|---|---|---|---|
| Solar Energy | Wind Energy | Hydro Energy | Geothermal Energy | Biomass Energy | |||
| Solar PV | Solar CSP | Onshore | Offshore | ||||
| US | 57.6 | 46.2 | 58.1 | 60.6 | 40.8 | 46.0 | 45.3 |
| China Mainland | 60.3 | 54.3 | 55.7 | 55.6 | 54.5 | 31.7 | 52.8 |
| India | 62.7 | 49.2 | 54.2 | 28.6 | 46.4 | 23.2 | 47.4 |
| United Kingdom | 46.9 | 11.2 | 57.5 | 61.9 | 36.9 | 30.0 | 56.8 |
| France | 53.3 | 22.4 | 55.1 | 53.5 | 43.9 | 37.3 | 48.4 |
| Australia | 56.1 | 35.8 | 53.9 | 30.6 | 42.1 | 17.9 | 40.8 |
| Germany | 53.0 | 11.5 | 49.0 | 51.5 | 42.9 | 37.2 | 51.2 |
| Japan | 47.8 | 19.5 | 50.8 | 52.4 | 47.5 | 50.2 | 56.6 |
| The Netherlands | 46.3 | 10.7 | 49.7 | 45.4 | 21.4 | 18.6 | 46.3 |
| Spain | 50.7 | 28.0 | 48.7 | 27.5 | 32.7 | 14.6 | 38.2 |
Source: 2019 Renewable Energy Country Attractiveness Index (RECAI), Ernst & Young, 2021.
India holds the second position in population and seventh position for largest total land area. A huge population has a high demand and consumption of all natural resources. Energy is the most common requirement which is directly or indirectly affecting all sectors. India was depending on hydro power since many years but with changing times explored the opportunity for many other energy sources [18,32]. The country is committed to the Sustainable Development Goals, 2030. The data which present the renewable energy production development since year 2014–2015 to 2019–2020 (Table 4) show a year-on-year capacity enhancement for the renewable energy sources. Solar energy has gained the highest development in production of energy and shows the highest development on a year-on-year basis. The total energy utility also is growing with the growing population and industrial growth. The percentage contribution of renewable energy sources are also showing a good growth which strengthens belief in a sustainable future [59].
Table 4.
Renewable energy generation trend in India.
Table 4.
Renewable energy generation trend in India.
| Energy Sources | 2014–2015 | 2015–2016 | 2016–2017 | 2017–2018 | 2018–2019 | 2019–2020 |
|---|---|---|---|---|---|---|
| Solar Energy | 4.6 | 7.5 | 12.1 | 25.9 | 39.3 | 50.1 |
| Wind Energy | 28.2 | 28.6 | 46.0 | 52.7 | 62.0 | 64.6 |
| Hydro Energy Large | 129.2 | 121.4 | 122.3 | 126.1 | 135.0 | 156.0 |
| Hydro Energy Small | 8.1 | 8.4 | 7.73 | 5.1 | 8.7 | 9.4 |
| Biomass Energy | 15.0 | 16.7 | 14.2 | 15.3 | 16.4 | 13.9 |
| Other Energy Sources | 0.4 | 0.3 | 0.2 | 0.4 | 0.4 | 0.4 |
| Total | 191.0 | 187.2 | 204.1 | 228.0 | 261.8 | 294.3 |
| Total Utility Energy | 1105 | 1168 | 1236 | 1303 | 1372 | 1385 |
| Percentage Renewable Energy | 17.28% | 16.02% | 16.52% | 17.50% | 19.1% | 21.25% |
Source: “Renewable energy generation data, March 2020” (PDF). CEA. Retrieved 30 April 2020.
Hydro power was always the source of energy in India having the access to rivers and dams to generate electricity. As presented (Figure 1), for the last six years, there has been growth in hydro energy generation, but not as much as other renewable energy sources. From 2014 to last year, the highest growth has shown in solar energy generation which is almost ten times more in six years. Wind energy generation also showing the double growth which is also a good development [59]. Total green energy production year-on-year decreased for 2015–2016, except this year the total green energy production increased with a huge contribution from the solar, wind and hydro production.
Innovation is the catalyst to the implementation of environmentally friendly resources and technology. Eco innovation or the ecological sustainability assessment is very important to keeping a track on our move towards growth. A secondary data assessment performed to understand the countries participation for innovation on three indicators (Table 5) as Global Innovation Index, Innovation Efficiency Ratio, and Innovation Input Sub-Index [56]. This report is generated in 2020, where these three indicators are considered to be crucial to assessing any country’s involvement in innovation. Countries scoring the highest top ten ranks are presented (Table 4) shows European countries Switzerland and Sweden at the top on Global Innovation Index followed by the USA and UK on 3rd and 4th rank, respectively. Again, European countries are holding strong position as Netherlands, Denmark and Finland are at 5th, 6th, and 7th position, respectively. China and Switzerland are leading with the same score on the Innovation Efficiency Ratio, followed by the Netherlands and UK on 3rd and 4th, respectively, followed by countries from European Union having the same score up to the 10th rank. Singapore and Switzerland are 1st and 2nd on Innovation Input Sub-Index score, followed by Sweden, the USA, Denmark, Hong Kong, the UK, Finland, Canada, and South Korea. Scores presented are near to each other for each consecutive ranked countries on specific indicators.
Table 5.
Country ranking on innovation indicators.
Table 5.
Country ranking on innovation indicators.
| Country Rank | Global Innovation Index | Innovation Efficiency Ratio | Innovation Input Sub-Index | |||
|---|---|---|---|---|---|---|
| Country | Score | Country | Score | Country | Score | |
| 1 | Switzerland | 66.1 | China | 0.9 | Singapore | 70.2 |
| 2 | Sweden | 62.5 | Switzerland | 0.9 | Switzerland | 69.4 |
| 3 | USA | 60.6 | Netherlands | 0.8 | Sweden | 69.2 |
| 4 | UK | 59.8 | UK | 0.8 | USA | 68.8 |
| 5 | Netherlands | 58.8 | Ukraine | 0.8 | Denmark | 66.8 |
| 6 | Denmark | 57.5 | Sweden | 0.8 | Hong Kong | 66.0 |
| 7 | Finland | 57.0 | Germany | 0.8 | UK | 65.8 |
| 8 | Singapore | 56.6 | Luxembourg | 0.8 | Finland | 65.6 |
| 9 | Germany | 56.5 | Ireland | 0.8 | Canada | 64.8 |
| 10 | South Korea | 56.1 | Czech Republic | 0.8 | South Korea | 64.8 |
Source: Global Innovation Index. (2020). Global Innovation Index (Data File). Retrieved from https://www.globalinnovationindex.org/analysis-indicator (accessed on 27 October 2021).
Ecological Sustainability and Research and Development are two sub indicators of innovation indicators (Table 6) and are incorporated in the study to achieve clarity on the importance of eco innovation for countries. Ecological sustainability is the key for Estonia and Switzerland achieving 1st and 2nd rank, respectively. Further European countries are scoring high rankings with very close scores for Romania, the Czech Republic, Ireland, Bulgaria, Croatia, Lithuania, Malta, and Slovakia in the ranking in descending order. Research and development is the indicator that represents countries’ motivation to go ahead with a sustainable future. South Korea is scoring the 1st rank with a high score followed by the USA and Israel at 2nd and 3rd rank, respectively, with a close comparative near scores. Switzerland, Japan, Sweden, Germany, Denmark, the UK, and Finland are the next ranked countries with a decreasing order of rank and score (Table 5). Again, it is showing a strong positioning of European Union countries for the research and development. Although they are not the leading countries, still, they are following the sequence with near scores and shows their willingness to keep continue with Research and Development [56]. These two sub-indicators are key to the eco innovation and sustainability which is the need of time to keep the environment protected and to save coming generations.
Table 6.
Country ranking on key sub-indicators.
Table 6.
Country ranking on key sub-indicators.
| Country Rank | Ecological Sustainability | Research and Development | ||
|---|---|---|---|---|
| Country | Score | Country | Score | |
| 1 | Estonia | 60.9 | South Korea | 88.1 |
| 2 | Switzerland | 60.7 | USA | 77.1 |
| 3 | Romania | 60.1 | Israel | 77.0 |
| 4 | Czech Republic | 59.6 | Switzerland | 76.6 |
| 5 | Ireland | 59.6 | Japan | 74.9 |
| 6 | Bulgaria | 56.8 | Sweden | 74.0 |
| 7 | Crotia | 56.7 | Germany | 72.7 |
| 8 | Lithuania | 56.5 | Denmark | 71.8 |
| 9 | Malta | 56.1 | UK | 67.6 |
| 10 | Slovakia | 55.8 | Finland | 65.7 |
Source: Global Innovation Index. (2020). Global Innovation Index (Data File). Retrieved from https://www.globalinnovationindex.org/analysis-indicator (accessed on 27 October 2021).
Innovation indicators are presented comparing India with the most highly ranked countries on specific indicators. Though India is performing very well for renewable energy sources (Table 3 and Table 4 and Figure 1), specifically with solar, wind and hydro energy generation. Still, the rank on innovation indicators are very poor (Table 7). The Global Innovation Index is led by Switzerland and India on rank 48 with much lower score. China is at the top position on the Innovation Efficiency Ratio while India is at 38th rank. Innovation Input Sub-Index is led by Singapore, where the rank of India is 57. Estonia is having the highest score and 1st position for ecological sustainability and India lands at 98th rank. Research and Development is the core for eco innovation where South Korea is at top position and India is at 35th position. Though on internal comparison of India itself among five indicators, India own position on Research and Development is comparative better than other four indicators [56].
Table 7.
India rank comparing with first rank country on innovation indicators.
Table 7.
India rank comparing with first rank country on innovation indicators.
| Indicators | First Rank Country | Score | India | |
|---|---|---|---|---|
| Rank | Score | |||
| Global Innovation Index | Switzerland | 66.1 | 48 | 35.6 |
| Innovation Efficiency Ratio | China | 0.9 | 38 | 0.6 |
| Innovation Input Sub-Index | Singapore | 70.2 | 57 | 43.5 |
| Ecological Sustainability | Estonia | 60.2 | 98 | 20.2 |
| Research and Development | South Korea | 88.1 | 35 | 32.9 |
Source: Global Innovation Index. (2020). Global Innovation Index (Data File]). Retrieved from https://www.globalinnovationindex.org/analysis-indicator (accessed on 27 October 2021).
2.2. Primary Data Trend
Mean GREEN consumer values are calculated to understand the central tendency of responses (Table 8), which is the presentation of inclination of most respondents. Here, the five renewable energy sources are presented vertically and the six items for each show their mean values on a five point Likert scale [65]. Solar energy has scored values in-between 3.58 to 3.94 which is mostly closer to 4 which is agree on scale. Wind energy has the minimum as 3.59 and the maximum as 4.01, which is showing the acceptance of agree being close to 4 of the Likert scale value. Hydro energy ranges from 3.49 to 3.82 which is not exactly nearing 4 but still will fall in the same criteria of agree considering the scale. Geothermal energy gets the mean values from 3.54 to 3.86 which again somehow trailing towards 4 as agree on the used Likert scale. Biomass scores mean values from 3.46 to 3.79 the least in the category among five renewable energy sources. Mean values represent the acceptance of GREEN consumer values with ‘agree’ as the 4th value on are five-point Likert scale. Mean values are 3.76 (Wind Energy) > 3.75 (Solar Energy) > 3.73 (Geothermal Energy) > 3.66 (Hydro Energy) > 3.64 (Biomass Energy) showing the preference of consumers for Green Energy sources.
Table 8.
Mean GREEN consumer values for renewable energy sources.
Table 8.
Mean GREEN consumer values for renewable energy sources.
| Renewable Energy Sources | Solar Energy | Wind Energy | Hydro Energy | Geothermal Energy | Biomass Energy | |
|---|---|---|---|---|---|---|
| Parameters | ||||||
| It is important to me that the Energy I use do not harm the environment | 3.94 | 4.01 | 3.82 | 3.77 | 3.78 | |
| I consider the potential environmental impact of my actions when making the Energy usage decisions | 3.91 | 3.65 | 3.69 | 3.82 | 3.70 | |
| My Energy consumption habits are affected by my concern for our environment | 3.58 | 3.61 | 3.49 | 3.54 | 3.48 | |
| I am concerned about wasting the resources of our planet when I use Energy | 3.65 | 3.59 | 3.54 | 3.79 | 3.46 | |
| I would describe myself as environmentally responsible using Energy | 3.76 | 3.91 | 3.73 | 3.86 | 3.65 | |
| I am willing to be inconvenienced in order to accept Energy that are more environmentally friendly | 3.67 | 3.83 | 3.72 | 3.65 | 3.79 | |
| Mean | 3.75 | 3.76 | 3.66 | 3.73 | 3.64 | |
Correlation test is showing the relation among the five renewable energy sources for GREEN consumer values. It is important to understand whether or not the different green energy resources display a relationship with one another as they all fall in the category of green energy resources. The five green energy sources incorporated in this study are presented as vertical columns and horizontal rows (Table 9), where there cross meeting point is representing their correlation values [63]. All correlation values are ranging in between 0.492 to 0.712 with each other except itself, which is always 1, and all correlation values are significant at the 0.01 level. Solar energy with Wind energy show the highest correlation as 0.712 and Solar energy with Hydro energy show the least correlation as 0.492. Other correlation values are under acceptable range satisfies the acceptance of data for further understanding.
Table 9.
Correlation of renewable energy sources.
Table 9.
Correlation of renewable energy sources.
| Energy Sources | Solar Energy | Wind Energy | Hydro Energy | Geothermal Energy | Biomass Energy |
|---|---|---|---|---|---|
| Solar Energy | 1 | 0.712 ** | 0.492 ** | 0.521 ** | 0.609 ** |
| Wind Energy | 0.712 ** | 1 | 0.619 ** | 0.522 ** | 0.571 ** |
| Hydro Energy | 0.492 ** | 0.619 ** | 1 | 0.704 ** | 0.605 ** |
| Geothermal Energy | 0.521 ** | 0.522 ** | 0.704 ** | 1 | 0.672 ** |
| Biomass Energy | 0.609 ** | 0.571 ** | 0.605 ** | 0.672 ** | 1 |
** Correlation is significant at the 0.01 level (2-tailed).
An analysis of variance statistical test performed to understand the variance of five renewable energy sources: solar energy, wind energy, hydro energy, geothermal energy and biomass energy with respect to gender, age, and education factors (Table 10). Statistical values are presented for significance and F value are significant at the 0.05 level [57]. The gender factor has shown a statistically significant p value as 0.000 for all energy sources representing there is a difference in mean values except the solar energy where the p value is 0.014. F values are ratios, where a higher value satisfies more on the opinion that there is a higher difference in mean values. Hydro energy (52.647) > geothermal energy (27.418) > wind energy (19.918) > biomass energy (14.496) > solar energy (6.014) are in the decreasing order of F value for the gender factor. The age factor shows a statically significant p value as 0.00, 0.01 showing a significant difference in mean value, except one insignificant as 0.34 shows there is no difference in mean value. F values solar energy (4.300) > wind energy (3.461) > biomass energy (3.399) > hydro energy (3.362) > geothermal energy (1.100) for age factor are presented in decreasing order. The education factor has all p values being statistically significant as 0.000 which shows there is a significant difference in mean value. Education factor shows F value as biomass energy (29.350) > hydro energy (28.109) > geothermal energy (12.291) > wind energy (11.649) > solar energy (10.783) in decreasing order.
Table 10.
Anova renewable energy sources with factors.
Table 10.
Anova renewable energy sources with factors.
| Factors | Gender | Age | Education | ||||
|---|---|---|---|---|---|---|---|
| Energy Sources | |||||||
| F | Sig. | F | Sig. | F | Sig. | ||
| Solar Energy | 6.014 | 0.014 | 4.300 | 0.005 | 10.783 | 0.000 | |
| Wind Energy | 19.918 | 0.000 | 3.461 | 0.016 | 11.649 | 0.000 | |
| Hydro Energy | 52.647 | 0.000 | 3.362 | 0.018 | 28.109 | 0.000 | |
| Geothermal Energy | 27.418 | 0.000 | 1.100 | 0.348 | 12.291 | 0.000 | |
| Biomass Energy | 14.496 | 0.000 | 3.399 | 0.018 | 29.350 | 0.000 | |
Significant at the 0.05 level.
Renewable energy sources are assumed as dependent variables which are latent variables measured for the correlation and effect with the five individual energy sources solar energy, wind energy, hydro energy, geothermal energy, and biomass energy as independent variables. All tests are highly significant with 0.000 under the p < 0.05 [65]. All energy sources have B and Beta values very close to each other for their specific category (Table 11). Geothermal energy (0.587) > solar energy (0.583) > wind energy (0.565) > biomass energy (0.556) > hydro energy (0.555) is in the decreasing order of B values which is the effect on dependent variable Renewable energy sources. Beta is the correlation values of these five sources are biomass energy (0.840) > hydro energy (0.832) > wind energy (0.829) > geothermal energy (0.827) > solar energy (0.802) with the dependent variable renewable energy sources.
Table 11.
Regression analysis renewable energy sources with factors.
Table 11.
Regression analysis renewable energy sources with factors.
| Independent Variables | Dependent Variable Renewable Energy Sources | |||
|---|---|---|---|---|
| Predictor | B | Beta | Sig. | |
| Solar Energy | 0.583 | 0.802 | 0.000 | |
| Wind Energy | 0.565 | 0.829 | 0.000 | |
| Hydro Energy | 0.555 | 0.832 | 0.000 | |
| Geothermal Energy | 0.587 | 0.827 | 0.000 | |
| Biomass Energy | 0.556 | 0.840 | 0.000 | |
Significant at the 0.05 level.
3. Results
The study conducted here uses both secondary and primary data stated in Section 2. The Use of both data is for the clarity of concept of renewable energy sources’ performances and eco innovation status, while freshly evaluating GREEN consumer values in India. Renewable energy sources are explained with secondary data relating to countries’ performance and rankings, whereas the primary data evaluate the consumer views on the present status and future of renewable energy sources in India.
3.1. Renewable Energy Sources
This section presents an analytical explanation of the five renewable energy sources namely solar, wind, hydro, geothermal, and biomass with respect to the opinion of Indian respondents for GREEN consumer values. Considering that each renewable energy source has its own importance the following analysis is divided into subsections, where each subsection is dedicated to each renewable energy source. Secondary data analysis is presented in the earlier section ‘Secondary data trend’ as (Table 4) and Figure 1. The Primary data analysis is presented as ‘Primary data trend’ as (Table 8, Table 9, Table 10 and Table 11). The same is getting a critical review in their specific category.
3.1.1. Solar Energy
Abundant exposure to sunshine makes India a good candidate for solar energy generation. From 2014–2015 to 2019–2020 (Table 4) and Figure 1, the production of solar energy has grown almost eleven times which shows the highest trend for renewable energy generation. Mean values show that GREEN consumer values for solar energy are accepted being, close to the agree value 4, while the mean value of 3.75 (Table 8), the second highest after wind energy with a small difference of 0.01, shows high preference. Variance in opinion based on gender, age, and education for solar energy ranks 5th, 1st, and 5th, respectively. (Table 10) shows that, in reality, it may get placed in 5th, as the observed two ranks on variance ranking is 5th. On the effect analysis, consumers rank solar energy on the 2nd rank (Table 11).
3.1.2. Wind Energy
India’s geographical advantage makes it unique from other countries. India has the blowing wind which can be a good resource for generating energy. Wind energy generation has been doubled (Table 4) and Figure 1 from 2014–2015 to 2019–2020. Wind energy shows the highest mean value, close to 4, as agree, with the 3.76 (Table 8), representing consumer acceptance. An assessment of variance for wind energy shows (Table 10) 3rd, 2nd, and 4th, a varying ranking based on gender, age, and education, respectively, shows on average of 4th rank. Wind energy scores 3rd rank (Table 11) on effect analysis.
3.1.3. Hydro Energy
Traditionally, the most-used source of renewable energy in India was hydro energy. There was a time when hydro was considered the only renewable energy source. Hydro energy generation has shown small growth (Table 4) and Figure 1 between 2014–2015 and 2019–2020. Though it is showing a growth trajectory, still, it is not satisfactory. The 4th rank among these five energy sources is scored for mean value, as 3.66 (Table 8), which is comparatively lesser than other renewable energy sources, though still demonstrates, consumer acceptance. Ranking on variance based on gender, age, and education is 1st, 4th, and 2nd (Table 10), respectively, making it 2nd rank overall. Effect analysis ranks 5th (Table 11) for hydro energy.
3.1.4. Geothermal Energy
India is a country with multiple renewable energy sources. However, the exposure to geothermal energy production is negligible (Table 4) and Figure 1. The year-on-year energy production trend from 2014–2015 to 2019–2020 shows that there is not much care and support for this source of energy. The mean value shows the 3rd rank among the renewable energy sources with a value of 3.73 (Table 8), which is close to 1st-ranked wind and 2nd, solar. Due to the positive consumer response, we can assume a good future for this renewable energy source. It’s ranking based on variance in opinion is 2nd, 5th, and 3rd (Table 10) based on gender, age, and education, respectively, leaving it on 3rd rank. Geothermal scores the 1st (Table 11) position on effect analysis.
3.1.5. Biomass Energy
India is land of fauna and flora, which makes it suitable for the generation of biomass energy. However, the reality is different on the renewable energy generation trend (Table 4) and Figure 1. From 2014–2015 to 2019–2020, the trend of Biomass energy contribution has fluctuated, mostly showing a decreasing contribution. On the mean value, biomass ranked the 5th and last position with 3.64 (Table 8), which shows that though consumers rank biomass as least popular, it is still in the consumer acceptance range. Variance in opinion for biomass places it in 4th, 3rd and 1st (Table 10) position based on gender, age, and education, respectively, leaving it on 1st rank overall. On the effect analysis, the 4th rank (Table 11) is scored by biomass.
3.2. Eco Innovation
Current research finds that eco innovation is a tool which can go hand in hand with renewable energy generation which can generate a synergic advantage. India is land of abundance but always has been in crisis. One of the major issues is technological innovation. Though, on other hand, the country is full of innovations called ‘JUGAAD’, which is the adjustment on requirements for an individual. As such, there is not much development in innovation (Table 5). On eco innovation, India ranks much lower (Table 7) compared to other countries of the world. Still, the government policies are encouraging the development of innovation and the country is highly committed towards eco sustainability leading to eco innovation.
4. Discussion
India has a huge opportunity for renewable energy sources. Results based on the analysis showing mean values, variance, correlation, and effects show a positive acceptance for all the renewable energy sources. Solar energy has the highest growth and future potential. GREEN consumer values are mostly inclined towards solar energy and expect this as the new energy avenue. Wind energy is also well-accepted among consumers but is less attractive as it is more dependent upon the availability of wind, still, the right geographical destination may have another more useful renewable source of energy. Hydro energy is a traditional means of energy production in India but it is getting comparative less acceptance perhaps due to depleting ground water resources and scarcity of water in a huge area of the country.
However, eco innovation can revive rivers and water beds which can reenergize the hydro energy generation. Geothermal energy may have one of the highest potentials for energy generation with technological advancement. Here, respondents have shown higher acceptance for geothermal energy, which shows the future is bright for renewable energy sources. Biomass is one of the oldest methods of producing energy in India. Urbanization has pushed this back and respondents in the current study have designated this the least accepted renewable energy resource. India is the land of huge opportunity being an agrarian economy which is the main source for biomass energy generation. In this research, all five renewable energy sources achieved high acceptance rates by respondents which shows India is on the way to enhancing its capacity for renewable energy. Indian consumer values are very much aligned with eco sustainability, and the market is ready to consume renewable energy.
Earlier studies have shown that hydro energy is the most common renewable energy source in India. Government projects and private company involvement also have made hydro energy more lucrative for investors. Past studies revealed the potential of solar, wind, geothermal, and biomass as green energy sources. India is moving towards a committed green energy transformation. In this series, presently, huge investment is are targeting solar energy. Results obtained in this study are interpreted in the perspective of earlier studies comparing the development in the ranking and the growth potential compared with top-ranking countries. The current study has implications for theory, practice, and policy. Theoretically, it may not be assumed that a country like India is ahead of many countries on renewable energy parameters. GREEN consumer values show strong acceptance for different green energy options. The study complements the government initiatives and hopes to increase the confidence of private investors to participate in global energy transformation. Policymakers can use this study when making decisions on green energy implementation.
5. Conclusions
Taking the above into the account, it may be stated that:
- There will be a strong demand for renewable energy aligned with eco sustainability in the future.
- GREEN consumer values are in the process of manifestation, which will drive future energy needs.
- There must be education on the benefits of renewable energy for future generations.
- Economies will depend on renewable energy for fulfilling their energy requirements.
- Corporates are also investing and promoting renewable energy production and consumption to support government.
Furthermore, the study has some limitations, which is mostly as a result of the scope of the study. There are many concepts that may assess the consumer acceptance, agreement, and consumption pattern for green energy. Still, the study pinpointed the concept of GREEN consumer values, which may have only the limited assessment for the consumer acceptance of green energy sources. Here, the secondary data are based on the country ranking of RECAI providing the most convenient presentation of data. There would have been an analytical presentation of secondary data, but it may present the risk of excess secondary data presentation. One of the limitations is its specificity to India with regards to green energy growth and consumption share among chosen green energy sources.
The future of green energy research presents a wide opportunity for academicians, researchers, and industries. In the context of research development, the study will further be expanded to other countries and the comparative assessment among countries on their GREEN consumer values. The research may add some other green energy sources like hydrogen, more specifically blue hydrogen, as green energy sources. Some other conceptual variables and regulatory frameworks may also derive meaningful research. This study can be a base structure for further research where indicators and renewable energy sources are readily available to leap other problems with the acceptability and implementation of green energy production and distribution.
Author Contributions
Conceptualization, M.R.; methodology, P.B. and U.S.S.; validation, M.R. and P.B.; formal analysis, P.B.; investigation, U.S.S.; resources, M.R.; data curation, P.B.; writing—original draft preparation, U.S.S.; writing—review and editing, P.B., M.R., U.S.S., all authors; visualization, P.B.; project administration, M.R.; funding acquisition, M.R. All authors have read and agreed to the published version of the manuscript.
Funding
This research received no external funding. The APC was funded by the Wroclaw University of Science and Technology, Wroclaw, Poland.
Institutional Review Board Statement
The study was conducted according to the guidelines of the Declaration of Helsinki. Ethical review and approval were not applicable for this study, due to not involving humans or animals. You might also choose to exclude this statement if the study did not involve humans or animals.
Informed Consent Statement
The research excludes the consent statement, because the study did not involve humans.
Data Availability Statement
Authors chose to exclude to report data for public access but can be available on the individual request for the usage in future research.
Conflicts of Interest
The authors declare no conflict of interest.
References
- United Nations. The World Commission on Environment and Development’s 1987 Brundtland Report: Our Common Future; United Nations: New York, NY, USA, 1987. [Google Scholar]
- Bina, O. The green economy and sustainable development: An uneasy balance? Environ. Plan. C Gov. Policy 2013, 31, 1023–1047. [Google Scholar] [CrossRef]
- Güney, T. Renewable energy, non-renewable energy and sustainable development. Int. J. Sustain. Dev. World Ecol. 2019, 26, 389–397. [Google Scholar] [CrossRef]
- Szaruga, E.; Kłos-Adamkiewicz, Z.; Gozdek, A.; Załoga, E. Linkages between energy delivery and economic growth from the point of view of sustainable development and seaports. Energies 2021, 14, 4255. [Google Scholar] [CrossRef]
- Asiedu, B.A.; Hassan, A.A.; Bein, M.A. renewable energy, non-renewable energy, and economic growth: Evidence from 26 european countries. Env. Sci. Pollut. Res. 2021, 28, 11119–11128. [Google Scholar] [CrossRef] [PubMed]
- United Nations Department of Economic and Social Affairs. The Sustainable Development Goals Report 2018; UN: New York, NY, USA, 2018; ISBN 978-92-1-363317-5. [Google Scholar]
- Lewandowski, W.M.; Klugmann-Radziemska, E. Proekologiczne Odnawialne źródła Energii: Kompendium; Wydawnictwo Naukowe PWN: Warszawa, Poland, 2020; ISBN 978-83-01-19067-5. [Google Scholar]
- Marks-Bielska, R.; Bielski, S.; Pik, K.; Kurowska, K. The importance of renewable energy sources in Poland’s energy mix. Energies 2020, 13, 4624. [Google Scholar] [CrossRef]
- Owusu, P.A.; Asumadu-Sarkodie, S. A review of renewable energy sources, sustainability issues and climate change mitigation. Cogent. Eng. 2016, 3, 1167990. [Google Scholar] [CrossRef]
- Tarnawska, K. Eco-innovations—Tools for the transition to green economy. Econ. Manag. 2013, 18, 735–743. [Google Scholar] [CrossRef]
- Bartoszczuk, P. Drivers to eco-innovation in Polish enterprises. Studia I Pr. WNEiZ 2017, 47, 141–151. [Google Scholar] [CrossRef]
- Fussler, C.; James, P. Driving Eco-Innovation: A Breakthrough Discipline for Innovation and Sustainability; Pitman: London, UK, 1996. [Google Scholar]
- Haws, K.L.; Winterich, K.P.; Naylor, R.W. Seeing the world through GREEN-tinted glasses: Green consumption values and responses to environmentally friendly products. J. Consum. Psychol. 2014, 24, 336–354. [Google Scholar] [CrossRef]
- Sultan, F.; Rohm, A.J.; Gao, T. Factors influencing consumer acceptance of mobile marketing: A two-country study of youth markets. J. Interact. Mark. 2009, 23, 308–320. [Google Scholar] [CrossRef]
- Miłaszewicz, D. Change of the paradigm and method of modern economics—The role of behavioral economics. Studia I Pr. WNEiZ 2017, 47, 65–82. [Google Scholar] [CrossRef][Green Version]
- Bailey, A.A.; Mishra, A.; Tiamiyu, M.F. GREEN consumption values and Indian consumers’ response to marketing communications. JCM 2016, 33, 562–573. [Google Scholar] [CrossRef]
- Knapp, L.; O’Shaughnessy, E.; Heeter, J.; Mills, S.; DeCicco, J.M. Will consumers really pay for green electricity? Comparing stated and revealed preferences for residential programs in the United States. Energy Res. Soc. Sci. 2020, 65, 101457. [Google Scholar] [CrossRef]
- Ranjan Srivastava, A.; Khan, M.; Khan, F.Y.; Bajpai, S. Role of renewable energy in Indian economy. IOP Conf. Ser. Mater. Sci. Eng. 2018, 404, 012046. [Google Scholar] [CrossRef]
- Ninno Muniz, R.; Frizzo Stefenon, S.; Gouvêa Buratto, W.; Nied, A.; Meyer, L.H.; Finardi, E.C.; Marino Kühl, R.; Silva de Sá, J.A.; Ramati Pereira da Rocha, B. Tools for measuring energy sustainability: A comparative review. Energies 2020, 13, 2366. [Google Scholar] [CrossRef]
- Gromada, A.; Trebska, P.; Wysokinski, M. Use of Renewable Energy in the European Union—Trends of Change; Warsaw University of Life Sciences: Warsaw, Poland, 2019; pp. 122–128. [Google Scholar]
- The Eco-Innovation Scoreboard and the Eco-Innovation Index. Available online: https://ec.europa.eu/environment/ecoap/indicators/index_en (accessed on 11 December 2020).
- Sulich, A.; Rutkowska, M.; Singh, U.S. Decision towards green careers and sustainable development. arXiv 2021, arXiv:2106.00465. [Google Scholar] [CrossRef]
- Ben Amara, D.; Chen, H. A mediation-moderation model of environmental and eco-innovation orientation for sustainable business growth. Env. Sci. Pollut. Res. 2020, 27, 16916–16928. [Google Scholar] [CrossRef] [PubMed]
- Energy Transition in Poland | 2021 Edition—Forum Energii. Available online: http://forum-energii.eu/en/analizy/transformacja-2021 (accessed on 5 July 2021).
- Jastrzębska, G. Odnawialne Źródła Energii i Pojazdy Proekologiczne (Renewable Energy Sources and Environmentally Friendly Vehicles); Wydawnictwo Naukowo-Techniczne: Warsaw, Poland, 2007. [Google Scholar]
- Apergis, N.; Pinar, M. The role of party polarization in renewable energy consumption: Fresh evidence across the EU countries. Energy Policy 2021, 157, 112518. [Google Scholar] [CrossRef]
- Pereira, R.M.; MacLennan, M.L.F.; Tiago, E.F. Interorganizational cooperation and eco-innovation: A literature review. IJIS 2020, 12, 477–493. [Google Scholar] [CrossRef]
- He, F.; Miao, X.; Wong, C.W.Y.; Lee, S. Contemporary corporate eco-innovation research: A systematic review. J. Clean. Prod. 2018, 174, 502–526. [Google Scholar] [CrossRef]
- Kiron, D.; Kruschwitz, N.; Haanaes, K.; Reeves, M.; Katrin, S.; Kehrbach, F.; Kell, G. Joining Forces: Collaboration and Leadership for Sustainability. Available online: https://sloanreview.mit.edu/projects/joining-forces/ (accessed on 27 August 2021).
- Hellström, T. Dimensions of environmentally sustainable innovation: The structure of eco-innovation concepts. Sustain. Dev. 2007, 15, 148–159. [Google Scholar] [CrossRef]
- Carballo-Penela, A.; Castromán-Diz, J.L. Environmental policies for sustainable development: An analysis of the drivers of proactive environmental strategies in the service sector: Environmental policies for sustainable development. Bus. Strategy Environ. 2015, 24, 802–818. [Google Scholar] [CrossRef]
- Pakulska, J. The eco-innovation versus economic development on the EU example. ERSJ 2021, XXIV, 999–1008. [Google Scholar] [CrossRef]
- Rutkowska, M.; Pakulska, J. The Level of Eco-Innovations in the EU Member States; Working Papers in Management Science (WORMS); Department of Operations Research and Business Intelligence, Wroclaw University of Science and Technology: Wroclaw, Poland, 2018. [Google Scholar]
- Bartoszczuk, P. Ekoinnowacje w gospodarce wodnej. Gospod. Prakt. Teor 2016, 44, 3. [Google Scholar] [CrossRef]
- Cheng, C.C.J.; Yang, C.; Sheu, C. The link between eco-innovation and business performance: A Taiwanese industry context. J. Clean. Prod. 2014, 64, 81–90. [Google Scholar] [CrossRef]
- Database—Eurostat. Available online: https://ec.europa.eu/eurostat/data/database (accessed on 17 December 2020).
- Jan, I.U.; Ji, S.; Yeo, C. Values and green product purchase behavior: The moderating effects of the role of government and media exposure. Sustainability 2019, 11, 6642. [Google Scholar] [CrossRef]
- Cheng, Z.-H.; Chang, C.-T.; Lee, Y.-K. Linking hedonic and utilitarian shopping values to consumer skepticism and green consumption: The roles of environmental involvement and locus of control. Rev. Manag. Sci. 2020, 14, 61–85. [Google Scholar] [CrossRef]
- Testa, F.; Pretner, G.; Iovino, R.; Bianchi, G.; Tessitore, S.; Iraldo, F. Drivers to green consumption: A systematic review. Environ. Dev. Sustain. 2021, 23, 4826–4880. [Google Scholar] [CrossRef]
- Sachdeva, S.; Jordan, J.; Mazar, N. Green consumerism: Moral motivations to a sustainable future. Curr. Opin. Psychol. 2015, 6, 60–65. [Google Scholar] [CrossRef]
- United Nations Department of Economic and Social Affairs. The Sustainable Development Goals Report 2021; United Nations: New York, NY, USA, 2021; ISBN 978-92-1-005608-3. [Google Scholar]
- Yan, L.; Keh, H.T.; Wang, X. Powering sustainable consumption: The roles of green consumption values and power distance belief. J. Bus. Ethics 2021, 169, 499–516. [Google Scholar] [CrossRef]
- Xu, X.; Wei, Z.; Ji, Q.; Wang, C.; Gao, G. Global Renewable energy development: Influencing factors, trend predictions and countermeasures. Resour. Policy 2019, 63, 101470. [Google Scholar] [CrossRef]
- Liu, X.; Zhang, S.; Bae, J. The nexus of renewable energy-agriculture-environment in BRICS. Appl. Energy 2017, 204, 489–496. [Google Scholar] [CrossRef]
- Pinto, D.C.; Nique, W.M.; Añaña, E.D.S.; Herter, M.M. Green consumer values: How do personal values influence environmentally responsible water consumption? Int. J. Consum. Stud. 2011, 35, 122–131. [Google Scholar] [CrossRef]
- Young, W.; Hwang, K.; McDonald, S.; Oates, C.J. Sustainable consumption: Green consumer behaviour when purchasing products. Sust. Dev. 2009, 18. [Google Scholar] [CrossRef]
- Zhang, X.; Dong, F. Why do consumers make green purchase decisions? Insights from a systematic review. Int. J. Environ. Res. Public Health 2020, 17, 6607. [Google Scholar] [CrossRef] [PubMed]
- Abutabenjeh, S.; Jaradat, R. Clarification of research design, research methods, and research methodology: A guide for public administration researchers and practitioners. Teach. Public Adm. 2018, 36, 237–258. [Google Scholar] [CrossRef]
- Lu, L.-C.; Chang, H.-H.; Chang, A. Consumer personality and green buying intention: The mediate role of consumer ethical beliefs. J. Bus. Ethics 2015, 127, 205–219. [Google Scholar] [CrossRef]
- Aldieri, L.; Vinci, C. Green economy and sustainable development: The economic impact of innovation on employment. Sustainability 2018, 10, 3541. [Google Scholar] [CrossRef]
- Erdiwansyah; Mahidin; Mamat, R.; Sani, M.S.M.; Khoerunnisa, F.; Kadarohman, A. Target and demand for renewable energy across 10 ASEAN countries by 2040. Electr. J. 2019, 32, 106670. [Google Scholar] [CrossRef]
- Nermend, K.; Łatuszyńska, M. Experimental and Quantitative Methods in Contemporary Economics: Computational Methods in Experimental Economics (CMEE) 2018 Conference; Springer Proceedings in Business and Economics; Springer International Publishing: Cham, Switzerland, 2020; ISBN 978-3-030-30250-4. [Google Scholar]
- Piwowarski, M.; Miłaszewicz, D.; Łatuszyńska, M.; Borawski, M.; Nermend, K. Application of the vector measure construction method and technique for order preference by similarity ideal solution for the analysis of the dynamics of changes in the poverty levels in the European Union countries. Sustainability 2018, 10, 2858. [Google Scholar] [CrossRef]
- Buckley, R. Economic instruments of environmental policy. In Perspectives in Environmental Management; Buckley, R., Ed.; Springer: Berlin/Heidelberg, Germany, 1991; pp. 80–92. ISBN 978-3-642-76502-5. [Google Scholar]
- Cornell University; Insead; Wipo. Global Innovation Index 2020: Who Will Finance Innovation? World Intellectual Property Organization (WIPO): Geneva, Switzerland, 2020; ISBN 978-2-38192-000-9. [Google Scholar]
- Singh, U.S.; Mishra, U.S. Assessment of need for vertical coordination in supply chain of vegetable industry. Int. Food Res. J. 2015, 22, 1417–1423. [Google Scholar]
- Singh, U.S.; Mishra, U.S. Vegetable supply chain: A conceptual study. Food Sci. Qual. Manag. 2013, 15, 45–60. [Google Scholar]
- Renewable Energy Country Attractiveness Index (RECAI). 2021. Available online: https://www.ey.com/en_gl/recai (accessed on 15 August 2021).
- Singh, U.S.; Mishra, U.S.; Mishra, B.B. Vertical coordination for optimization of the vegetable supply chain. Int. Food Res. J. 2014, 21, 1387–1394. [Google Scholar]
- Bradosti, H.; Singh, U. Public awareness of financial market in Iraqi Kurdistan. Eur. J. Bus. Manag. 2015, 7, 300–308. [Google Scholar]
- Cohen, J. Statistical power analysis. Curr. Dir. Psychol. Sci. 1992, 1, 98–101. [Google Scholar] [CrossRef]
- Sahin, O.; Singh, U.S. A literary excavation of university brand image past to present. IJSSES 2017, 3. [Google Scholar] [CrossRef]
- Singh, U.S. Cost estimation using econometric model for restaurant business. QME 2019, 20, 209–216. [Google Scholar] [CrossRef]
- Hamadamin, Z.F.; Singh, U.S. Analyzing the main marketing strategies leading to customer satisfaction. Int. J. Supply Chain Manag. 2019, 8, 113–123. [Google Scholar]
- Mohinta, S.; Singh, U.; Mishra, U. Retail store brand commitment study of big bazaar and pantaloons. Int. J. Supply Chain Manag. 2017, 6, 139–145. [Google Scholar]
- Sun, P.-C.; Wang, H.-M.; Huang, H.-L.; Ho, C.-W. Consumer Attitude and purchase intention toward rooftop photovoltaic installation: The roles of personal trait, psychological benefit, and government incentives. Energy Environ. 2020, 31, 21–39. [Google Scholar] [CrossRef]
- Mamkhezri, J.; Thacher, J.A.; Chermak, J.M. Consumer preferences for solar energy: A choice experiment study. EJ 2020, 41. [Google Scholar] [CrossRef]
- Campisi, D.; Gitto, S.; Morea, D. Shari’ah-compliant finance: A Possible novel paradigm for green economy investments in Italy. Sustainability 2018, 10, 3915. [Google Scholar] [CrossRef]
- Wang, H.; Wang, J.; Liu, Y.; Chen, L. Marine renewable energy policy in China and recommendations for improving implementation. IOP Conf. Ser. Earth Environ. Sci. 2018, 121, 052069. [Google Scholar] [CrossRef]
- Croutzet, A.; Dabbous, A. Do FinTech trigger renewable energy use? Evidence from OECD countries. Renew. Energy 2021, 179, 1608–1617. [Google Scholar] [CrossRef]
- Piwowarski, M.; Singh, U.S.; Nermend, K. Application of EEG metrics in the decision-making process. Int. Conf. Comput. Methods Exp. Econ. 2018, 187–199. [Google Scholar]
- Sabishchenko, O.; Rębilas, R.; Sczygiol, N.; Urbański, M. Ukraine energy sector management using hybrid renewable energy systems. Energies 2020, 13, 1776. [Google Scholar] [CrossRef]

Publisher’s Note: MDPI stays neutral with regard to jurisdictional claims in published maps and institutional affiliations. |
© 2021 by the authors. Licensee MDPI, Basel, Switzerland. This article is an open access article distributed under the terms and conditions of the Creative Commons Attribution (CC BY) license (https://creativecommons.org/licenses/by/4.0/).