Abstract
The process of underground coal mining fractures the overlying strata and may provide storage and transportation space for gas by changing the roof rock permeability, which is released by pressure after mining. This paper adopts the experimental method of physical similarity simulation and combines the fractal theory to study the permeability characteristics of the fracture network after mining, and it establishes the fractal permeability equation of pressure-relief gas. The results of the study show that the fracture opening shows a positive correlation with the overburden permeability, whereas the tortuosity of the fracture shows a negative correlation with the overburden permeability. The shape of the high permeability area in the fracture network is found to be similar to the hat-shaped elliptical parabolic zone. In the process of permeability evolution, the key layer structure of the overburden rock is considered as the main factor that affects the trend of change in permeability. Furthermore, based on the above research results, this study developed a targeted design of high-level boreholes in the experimental face and reversed the permeability changes around the drainage borehole. The average error between the actual measured value and the theoretically calculated value is found to be 8.11%. The theoretical model and the permeability evolution law obtained from the research results can provide valuable references and insights into further research on the pressure-relief gas flow model in the goaf.
1. Introduction
China is the largest coal-producing country in the world and has the most serious coal mine gas disasters [1,2,3]. The gas endowment in coal seams buried below a depth of 2000 m is about 36.81 trillion m3 [4,5], which is basically equivalent to the conventional natural gas resources on land. The abundance of coalbed methane resources has also led to more serious gas disasters during coal seam mining [6]. The simultaneous extraction of coal and gas is a fundamental way to prevent gas disasters, reduce greenhouse gas emissions in mines, and develop gas resources [7,8,9]. Moreover, it has become an important part of precision mining and the green mining system [10,11,12,13].
In the process of mining coal resources, the methane gas will change from the original adsorption state to the free state due to the extraction of dynamic pressure relief, which will flow and converge in the mining-out space [14,15]. Moreover, it will bring great difficulties to the safe and efficient mining of coal resources. Meanwhile, as the intensity of mining continues to rise, the rate and total amount of pressure-relief gas gushing out will increase significantly. Using a high-level borehole to extract gas from the goaf is one of the important means to solve this problem.
Coal mining usually uses the complete collapse method to manage the roof. Many secondary fractures have been created after the collapse of the overburden, which greatly changes its own permeability characteristics and also provides space for the transport and storage of pressure-relief gas [15]. There are differences in the degree of fracture development in different areas of the fracture network, which causes different degrees of pressure-relief gas and convergence in flow [16]. The generation and expansion of a fracture network play a decisive role in the layout of high-level boreholes [17], but the fundamental influencing factor lies in the change in the permeability of pressure-relief gas in the overburden [18,19]. Thus, scientifically obtaining the distribution and evolution of the permeability of the overburden is the key to ensuring the effect of pressure-relief gas drainage [20].
For the study of the high-permeability area morphology of pressure-relief gas in overburden mining, many scholars have reported different theories [17,21,22], such as the “O-shape” theory [23], the “roof annular fracture ring” theory [24], and the theory of “elliptic paraboloid zone” [25,26]. Qu divided the overburden fracture field after mining into the “fractured gas-interflow zone“, “de-stressed gas-desorption zone“, and “confined gas-adsorption zone” according to the gas transport characteristics of different seams, thus guiding the design of decompression gas extraction during coal seam group mining [27]. The application of the fractal theory in describing the breakage and movement of overburden mining enriched the method of the quantitative description of the chaotic and intricate fracture network formed after coal mining [28,29]. As the law of the spatiotemporal evolution of fractures in engineering practice is difficult to monitor, it is particularly convenient and efficient to analyze and study the evolution of fracture networks by combining the physical similarity simulation experiments with mathematical statistics and the fractal theory [30]. Considering the above results, a large number of research studies have been conducted by scholars on this topic [31,32]. Zhao analyzed the morphology and evolution of the pressure-relief gas migration channel and obtained its shape characteristics under different mining height and inclination conditions according to fractal theory [33,34]. Xue proposed a method to describe the fracture system by using the fractal feature of the rock section [35]. Zhou discussed the evolution characteristics of the fracture network after mining a longwall face based on the results of similar simulation experiments [36]. Some scholars have introduced the percolation theory into the evaluation of the development and changes in overburden fractures after mining, established a percolation model with unit fracture blocks as basic lattice points, and obtained the relationship between the periodic pressure and the percolation characteristics. Normalization technology predicts the phase transition criticality of mining fracture evolution [37,38].
The above research results provide a powerful theoretical and experimental basis for using the fractal theory to study the permeability of overburden rock mining. However, the above studies mainly focus on the qualitative description of the fracture network, without quantitative analysis of the permeability evolution of each area from the perspective of fracture network expansion. In this paper, the fractal permeability equation of the fracture network is first established (Section 2). Moreover, the experimental results of physically similar simulation experiments are used to obtain the fractal dimension distribution regularity of the fracture network (Section 3 and Section 4). Then, combining the fractal percolation model with the fractal dimension, the permeability distribution of the fracture network at each stage of coal seam mining is calculated, and its evolution regularity is analyzed (Section 5). The real variation of overburden permeability is inversed by field tests and compared with the theoretical calculated values (Section 5). Finally, the design of the high-level boreholes is carried out based on the results of the study, and extraction results are obtained (Section 6).
2. Fractal Model and Fractal Permeability Equation of Mining Fracture
2.1. Fractal Model of Mining Fracture
Many studies have shown that the probability density function of fracture opening distribution in a certain unit area can be expressed by Equation (1) [39,40]:
where f(λ) is the probability density function of the fracture opening, Df is the fractal dimension of the fracture opening, λmax is the maximum fracture opening in the unit area (m), and λ is the fracture opening (m).
The actual seepage length of pressure-relief gas in a fractured medium can be described by Equation (2).
where Lt(λ) is the actual seepage path length of gas in the fracture (m), DT is the fractal dimension of fracture tortuosity, and L0 is the straight length of seepage in the fracture (m).
According to Equation (1), the flow area of the pressure-relief gas in the fracture in the unit body can be obtained as shown in Equation (3).
where S is the flow area of the pressure-relief gas in the fractured medium in the unit body (m2), and λmin is the minimum fracture opening in the unit area (m).
2.2. Seepage-Fractal Equation of Pressure-Relief Gas in Mining Fractures
2.2.1. The Basic Assumptions
In the process of mining, the upper and lower corners of the working face are usually set up with a blocking wall to reduce the influence of ventilation on gas migration in the goaf. At the same time, the gas pressure in the goaf is relatively stable, and the gas flow is mainly a stable flow with a low permeability pressure gradient. Based on the above reasons, the following simplification or hypothesis that facilitates the analysis of the permeability characteristics of pressure-relief gas in the goaf is produced:
- The gas flow in the goaf is regarded as seepage, obeys the generalized Darcy’s law, and is an incompressible fluid.
- The gas in the goaf flows at a mainly low-speed steady state.
- Gas migration in the goaf is an isothermal process.
In fact, the maximum pressure gradient that drives the gas flow in the goaf can only reach 0.5~1 kPa without gas extraction [41]. Field measurement shows that the gas pressure in the goaf of a test panel is about 98 kPa. In this case, assuming that the gas in the goaf is an incompressible fluid, the calculated permeability will be larger than the real value. However, due to the small pressure gradient, it can be ignored within the scope of engineering accuracy. Moreover, as the distance into the goaf increases, the temperature of the gas in the goaf will be relatively increased due to the oxidation and heating of the coal [42]. However, the focus of gas migration in the goaf is on the shallow uncompacted area. Therefore, it can be approximately regarded as an isothermal process.
2.2.2. Model Derivation
The mining fracture network can be approximated as a group of single flat fractures. Therefore, the pressure-relief gas seepage in the tiny cells in the fracture network satisfies the cubic law (Equation (4)) [43].
where q(λ) is the gas flow rate per unit width (m3/s), ρ is the gas density (kg/m3), g is the acceleration of gravity (m/s2), µ is the kinematic viscosity coefficient of gas, and is the gas pressure gradient (Pa/m).
Generally, due to the complexity of the rock mass shearing and the tensile breaking, the overflow distance of the pressure-relief gas in the fracture increases as compared to the smooth slab. Therefore, the tortuosity of the fracture can be used to modify the cubic law. The fissure tortuosity is the ratio of the seepage straight-line distance to the actual seepage length, which can be calculated by Equation (5).
where τ is the fracture tortuosity, which can be expressed by the quotient of the actual seepage length of the fracture and the seepage straight-line length.
The cubic law corrected by the tortuosity can be expressed as Equation (6) [44].
According to the law of the conservation of mass, the total flow in the fractured medium can be expressed by Equation (7):
where Q is the total seepage flow in the fracture network in a certain area (m3/s).
Then, according to Darcy’s law (Equation (8)), the permeability coefficient of the unit can be calculated.
where K is the permeability coefficient in the area where the total seepage flow is Q (m2/Pa·s).
Substitute Equation (7) into Equation (8) to obtain the fractal equation of permeability in the fractured network space (as shown in Equation (9)):
where a is λmin/λmax.
3. Methodology
3.1. Engineering Background
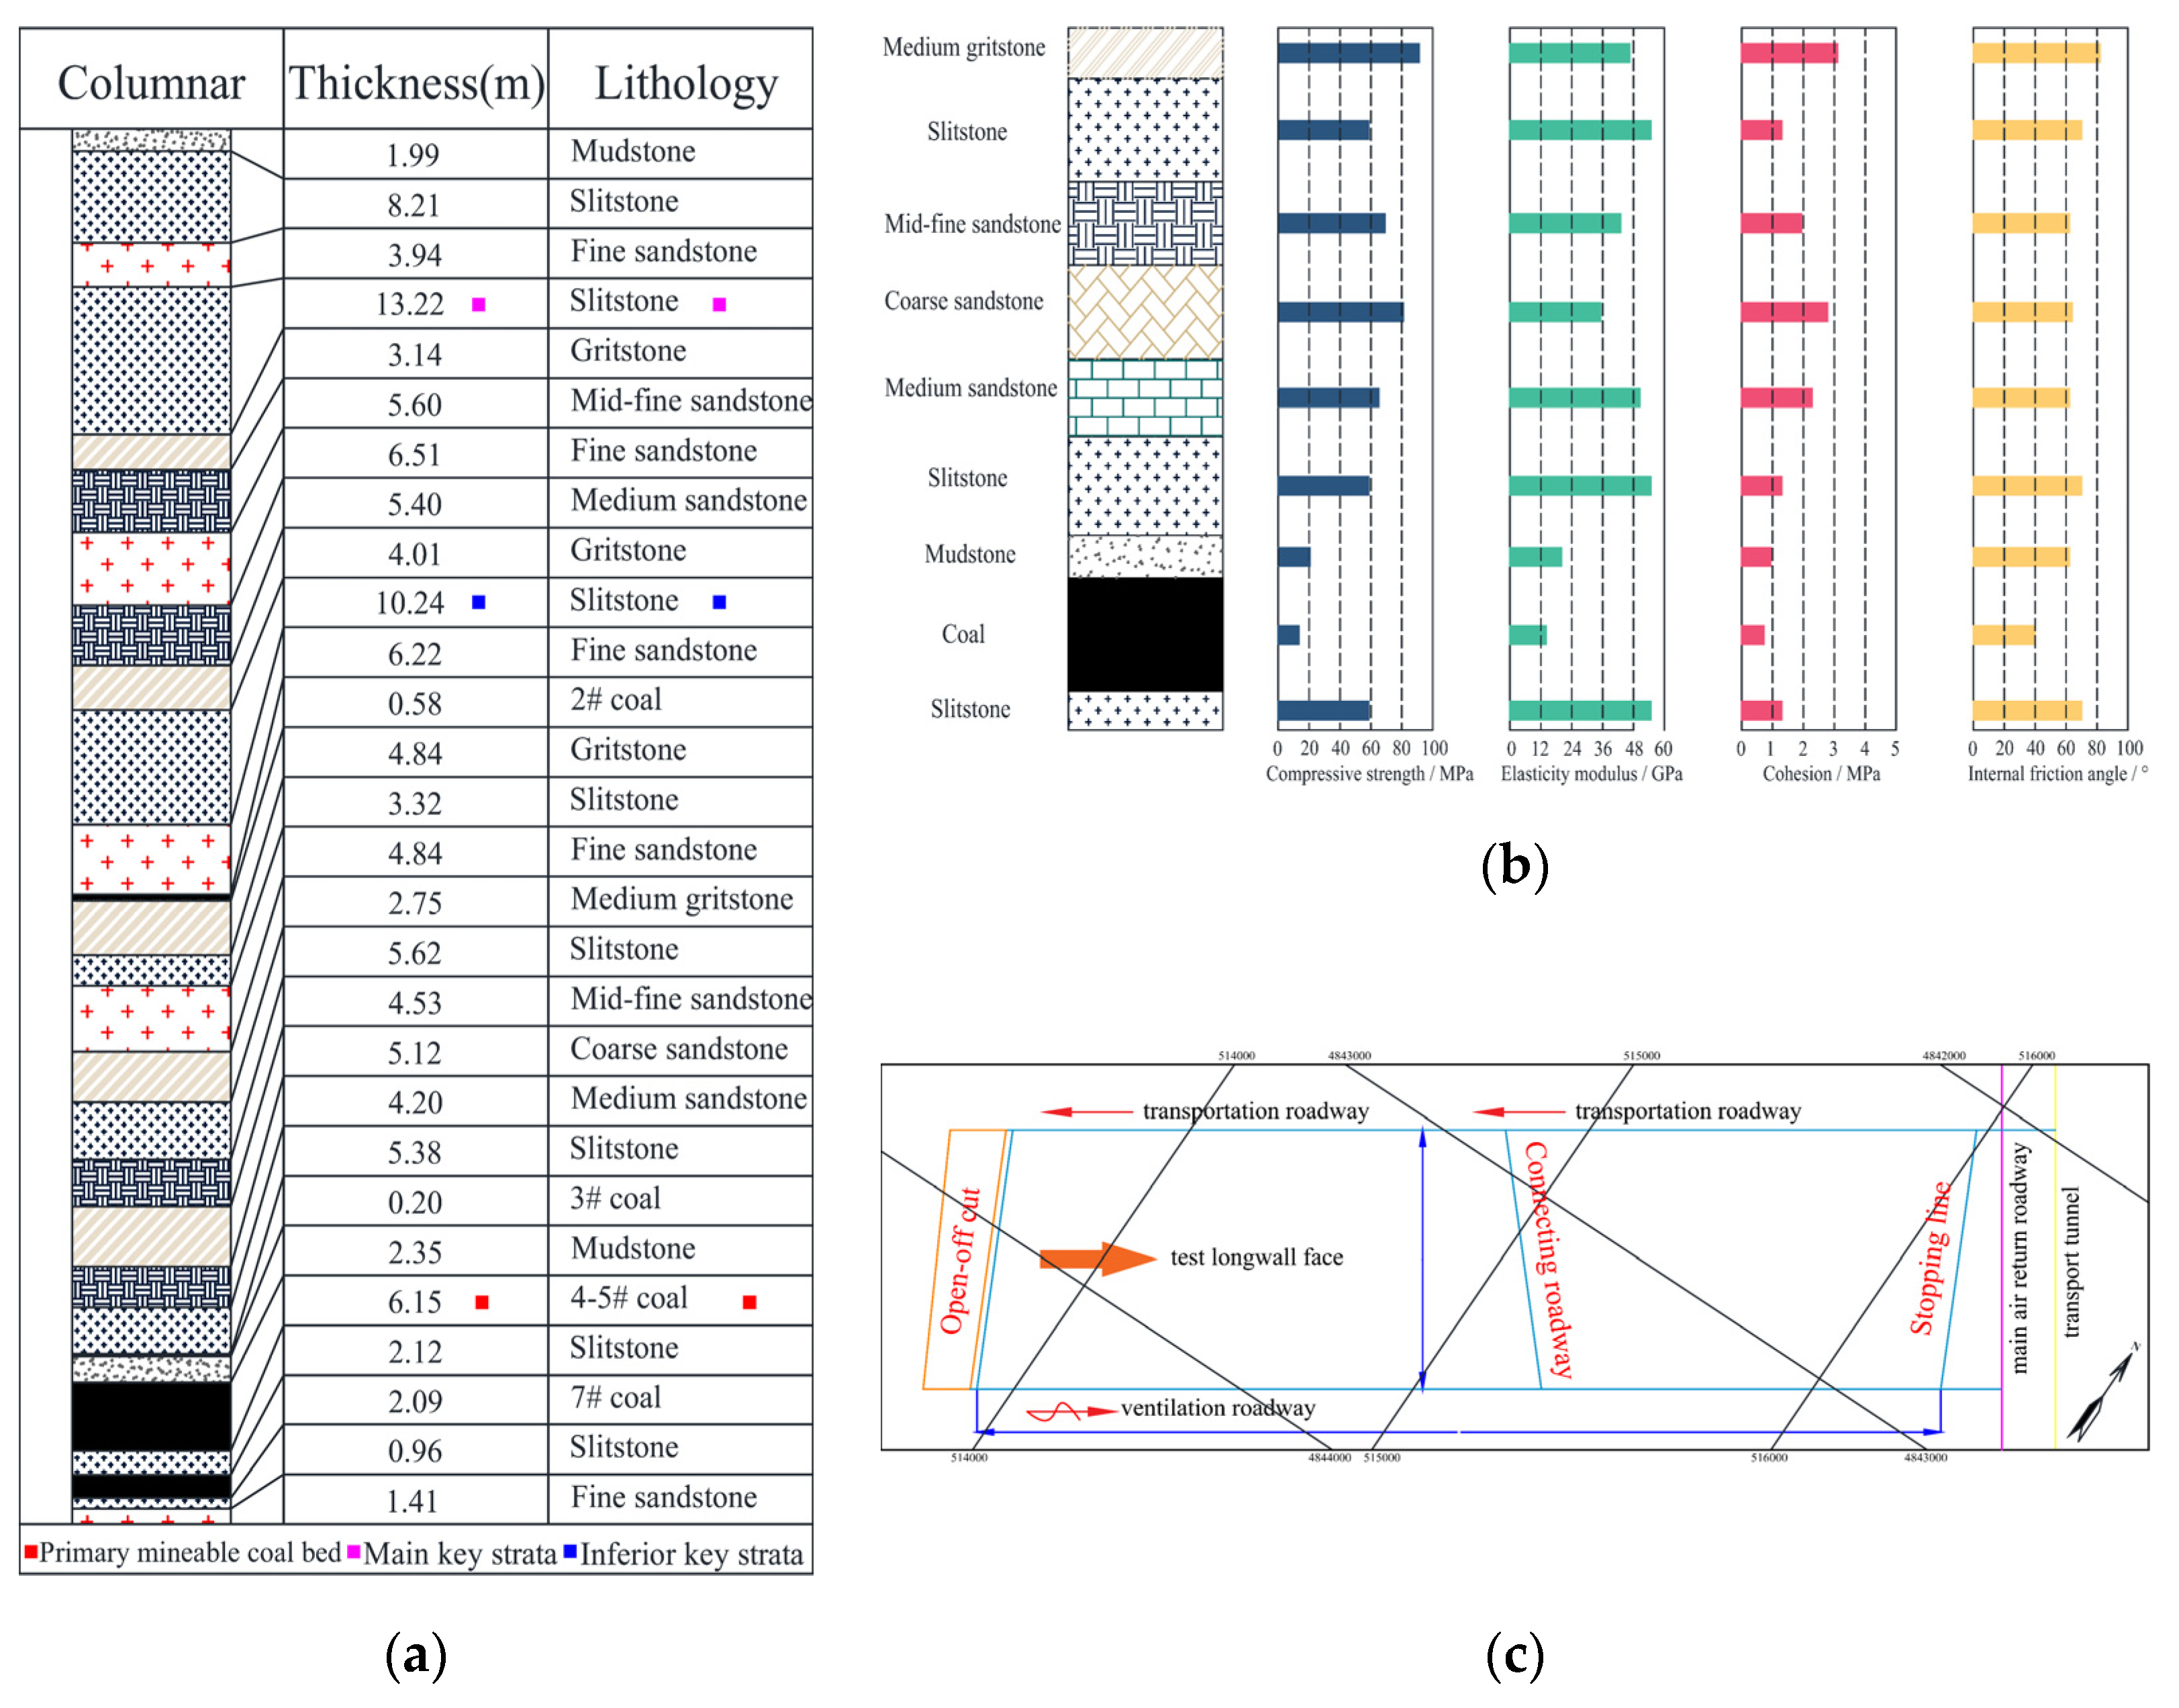
The main coal seam in the (4–5)06 panel in the east of Zhunnan Coalfield, Xinjiang, China, is characterized by an average thickness of 6.15 m, and the larger buried depth is 550 m. The immediate roof, about 1.35 m thick, is carbonaceous mudstone with low strength. The primary layer is hard siltstone located 94.85 m above the coal seam roof. At the same time, there is a 7# coal seam with a thickness of 2.09 m at a distance of 2.32 m from the coal seam floor. The specific overburden thickness and the physical–mechanical parameters are shown in Figure 1a,b.
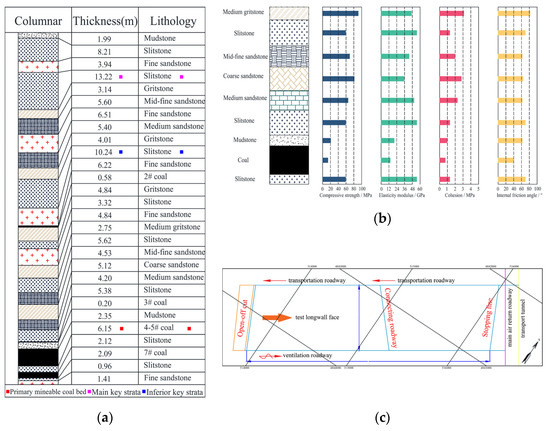
Figure 1.
Basic structure of the test face: (a) histogram of rock strata in the working face; (b) mechanical parameters of the overburden of test longwall face; and (c) schematic diagram of the working face layout.
From Figure 1, there are unminable coal seams within 3 m above and below the main mining seam. Due to the small spacing of several coal seams, the gas in the adjacent seams will gush out of this working face in large quantities during the mining process. Together with the gas gushing out of this seam, gas prevention and control is very difficult. Meanwhile, the primary key layer is about 95 m above the panel, and the huge mining fracture network provides space for the storage and transportation of pressure-relief gas.
The panel layout for the (4–5)06 longwall face is 180 m wide by 1850 m long with a 40-m-wide barrier pillar between the panels. The specific working face layout is shown in Figure 1c. The relative and absolute methane emissions are 3–4 m3/t and 15–20 m3/min, respectively. During the mining of this working face, a large amount of adjacent coal seam gas is poured into the stope space, and its main source is the goaf. Therefore, the extraction of pressure-relief gas in the goaf is imperative.
3.2. Physical Similarity Simulation Experiment Design
3.2.1. The Experimental Equipment
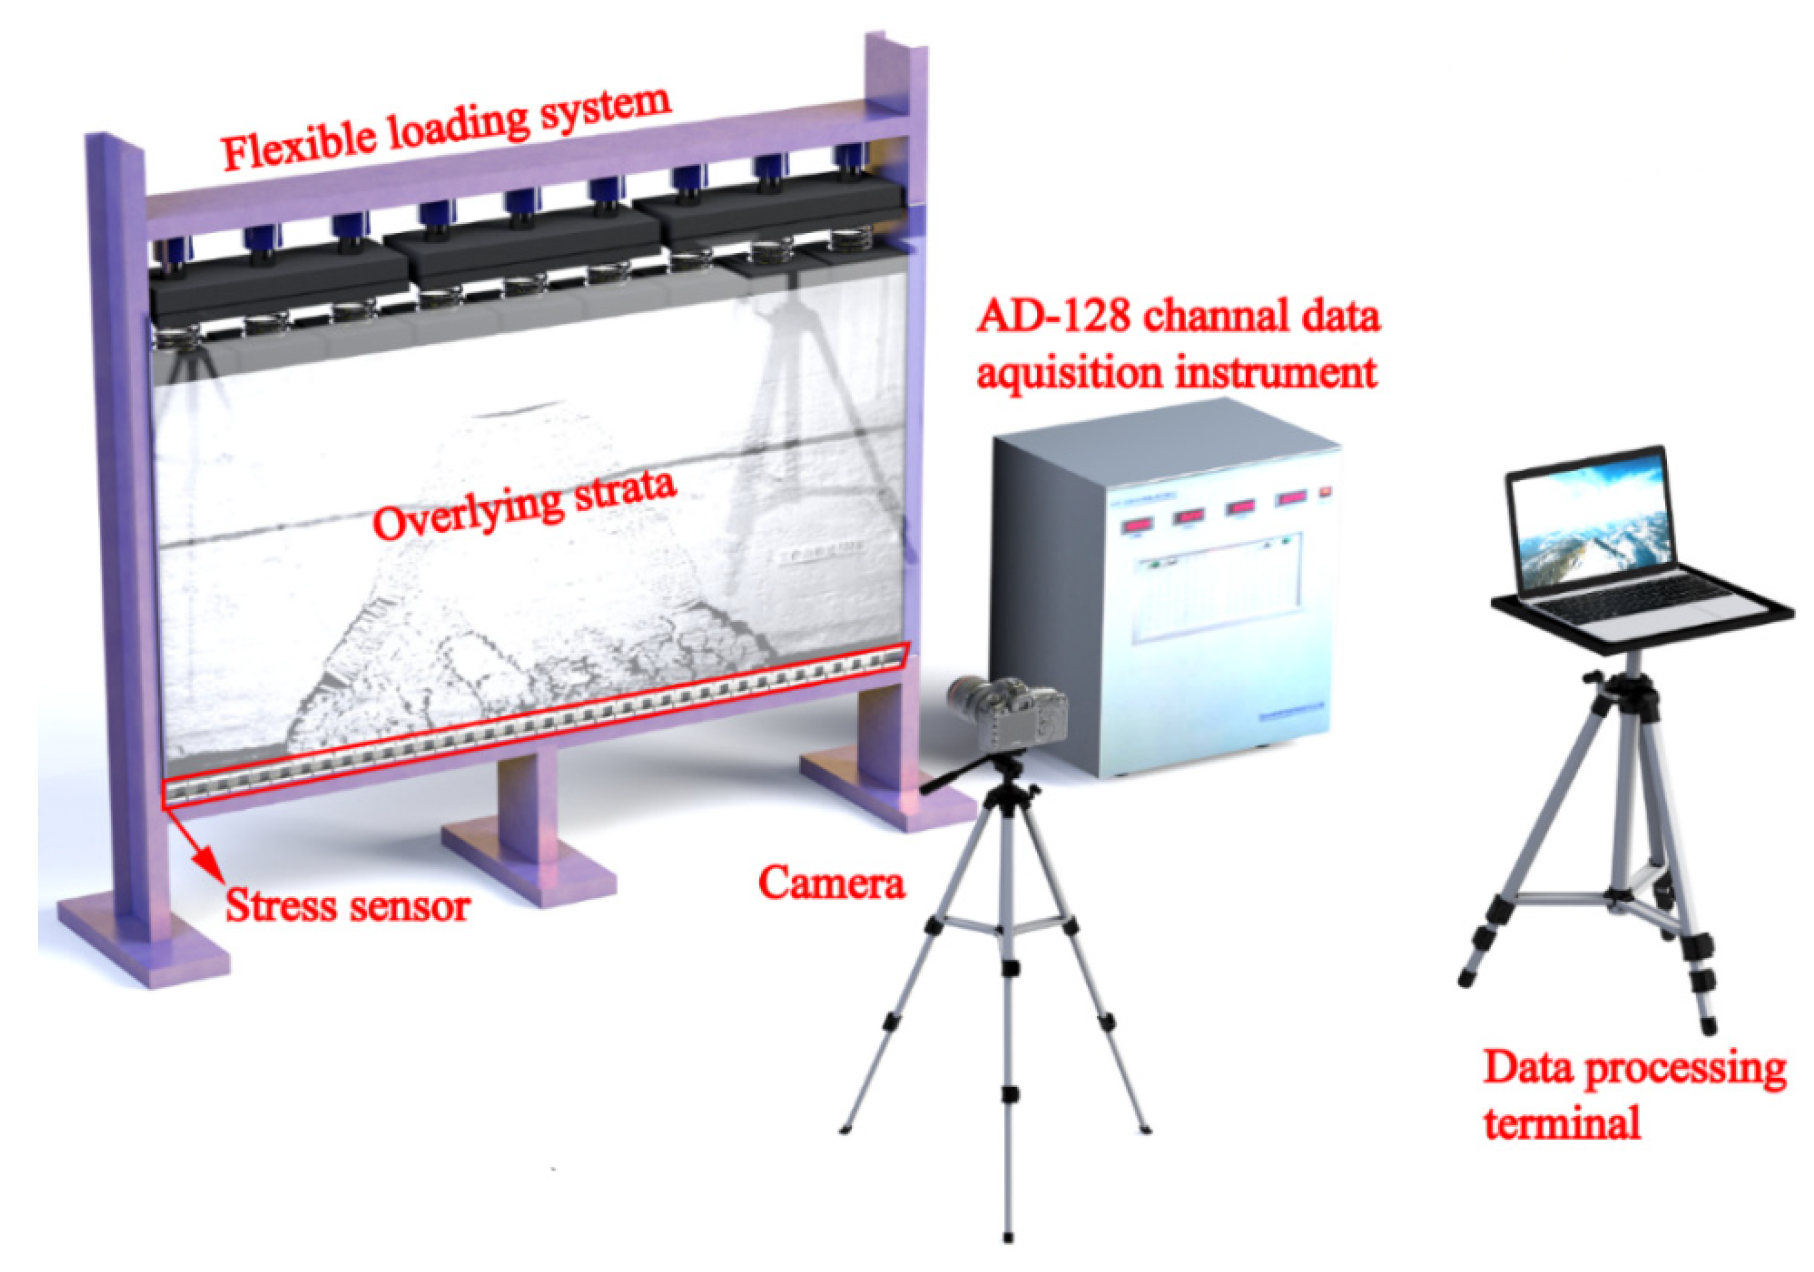
The plane stress loading simulation system is selected for the experiment, as shown in Figure 2. The system consists of a data acquisition system, loading control system, flexible loading system and camera system, which can realize non-linear loading on the top of the model. The experimental device can accommodate a similar model with a size of length × width × height = 2000 mm × 200 mm × 1200 mm, and the load range that can applied on the top of the model is 0~5.0 MPa. The longwall face of the similar model can be excavated step by step under the condition of loadable stability.

Figure 2.
Experimental system diagram.
3.2.2. The Similar Parameter Design of the Model
This simulation experiment mainly studies the movement law of strata above the stope, so it is necessary to consider the height of fracture development after mining when selecting a similar ratio. The empirical equation calculates that the mining-induced fracture zone is 109 m. After comprehensive consideration of factors such as the size of the test bench, the geometric similarity ratio of the experimental model is determined as
The bulk density similarity ratio is
The stress similarity ratio is obtained as follows:
In Equations (10)–(12), the subscript “p” represents the state parameters of the prototype, the subscript “m” represents the state parameters of the model, Lp is the geometric parameters of the prototype, Lm is the geometric parameters of the model, γp is the severity parameter of the prototype, and γm is the severity parameter of the model.
Moreover, because strain ε, friction angle α, friction coefficient f, Poisson’s ratio μ, and other unit dimensions are 1, the following relationship can be obtained:
where Cε is the strain similarity ratio, Cα is the friction angle similarity ratio, Cf is the friction coefficient similarity ratio, Cu is the Poisson’s ratio similarity ratio, CE is the elastic modulus similarity ratio, and Ct is the time similarity ratio.
3.2.3. Model Building and Loading
According to the columnar diagram of the longwall face (Figure 1a), the roof of the face is mudstone and sandstone. In the model, different lithologies can be made of materials such as water, gypsum, calcium carbonate, and sand with different ratios, and the strength and bulk density of similar rock materials with different ratios can meet the requirements of similar ratios though rock mechanics experiments. Conforming to the size of the experimental equipment and the geometric similarity ratio, the size of 200 m ×20 m × 120 m can be simulated in the field. A total of 24 layers of coal seam and strata are laid in the model. The thickness of each layer and the ratio of similar materials are shown in Table 1 and Table 2.

Table 1.
Simulated thickness of rock layer.
Table 2.
Comparison of rock formation and material parameters and the ratio of similar materials.
The model is built from bottom to top after the similar material configuration is completed based on the ratio. Each rock layer is uniformly covered with 8–20 mesh mica powder as stratification material. The model should be naturally air dried for 3 weeks after completion of the model construction, and a uniform load should be applied to the top of the model according to the buried depth of the longwall face.
The buried depth of the working face is about 550 m, but the height of the model is only 120 m, which means the thickness of 430 m is not simulated and is realized by loading. According to Equation (14), the actual vertical stress can be obtained.
where σV is the vertical stress 120 m above the working face (MPa). γ is the average bulk density of the overburden (2.76 kN/m3). Moreover, H is the model burial depth (430 m).
According to the stress similarity ratio, it can be calculated that the load of 0.078 MPa should be applied above the model.
3.2.4. The Extraction of the Model
Coal pillars of 10 cm are left at both ends of the model to eliminate the boundary effect. The field mining advance speed is 5 m/d, and the mining speed of the model is 5 cm/2.4 h, which is based on the time similarity ratio conversion. To restore the advance of the longwall face on site more realistically, the mining speed is cyclically advanced at 2 cm and 3 cm, and the mining time is 0.1 h. After each step of excavation is completed, the interval is 1.1 h.
3.3. Calculation Method of the Fractal Dimension
3.3.1. Calculation Method of the Fractal Dimension of the Fracture Aperture (Df)
The fractal dimension of the mining fracture opening is calculated by using the box-counting dimension model. The box-counting dimension model usually uses regular graphics, such as squares, to calculate the fractal dimension of the research object. The calculation method is to divide the experimentally obtained mining fracture plane pattern into N small square areas with the side length of ε, and the number of squares containing the fracture is N(ε). Its fractal dimension can be calculated by Equation (15) [34].
The Fractal Fox is an open-source digital image box-counting dimension calculation software, which can quickly calculate the fractal dimension of two-dimensional digital images. The images of the fracture network obtained by the physical simulation experiment are processed in binary by using Matlab software and imported into the Fractal Fox software, which can quickly calculate the fractal dimension of the fracture network.
3.3.2. Calculation Method of the Fractal Dimension of the Fracture Tortuosity (DT)
The fracture tortuosity is a physical quantity that reflects the degree of twists and turns of the seepage path of the pressure-relief gas in the fracture channel, and it also indirectly affects the permeability characteristics of the pressure-relief gas in the fracture channel. The research results show that in the two-dimensional plane fracture space, the tortuosity of the fracture is related to the fracture opening and its fractal dimension, and, thus, the following relationship is obtained [40]:
The formula for calculating the fractal dimension of the tortuosity can be obtained by putting Equation (16) into Equation (2):
where L0 is the gas seepage in the fracture medium in the 50 mm × 50 mm grid, and the linear distance of the length is 50 mm. To simplify the calculation, λ in Equation (17) is considered the average fracture opening in each grid.
4. Distribution Characteristics of the Fractal Dimension of the Fracture Network
4.1. Distribution Characteristics of the Fracture Opening Fractal Dimension
By processing the fracture network images at different advancing distances on the working face in binary and dividing them into square images of 50 mm × 50 mm, each advancing degree has a total of 960 images.
For the uncollapsed area, the default fractal dimension is calculated to be 1. After the fractal dimension calculation result is obtained, the contour map of its distribution characteristics is drawn, as shown in Figure 3.
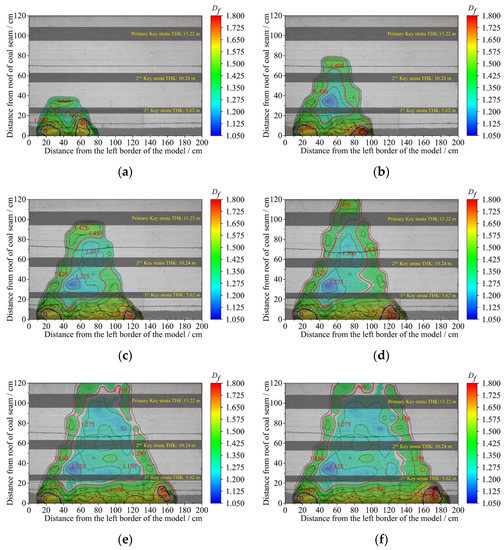
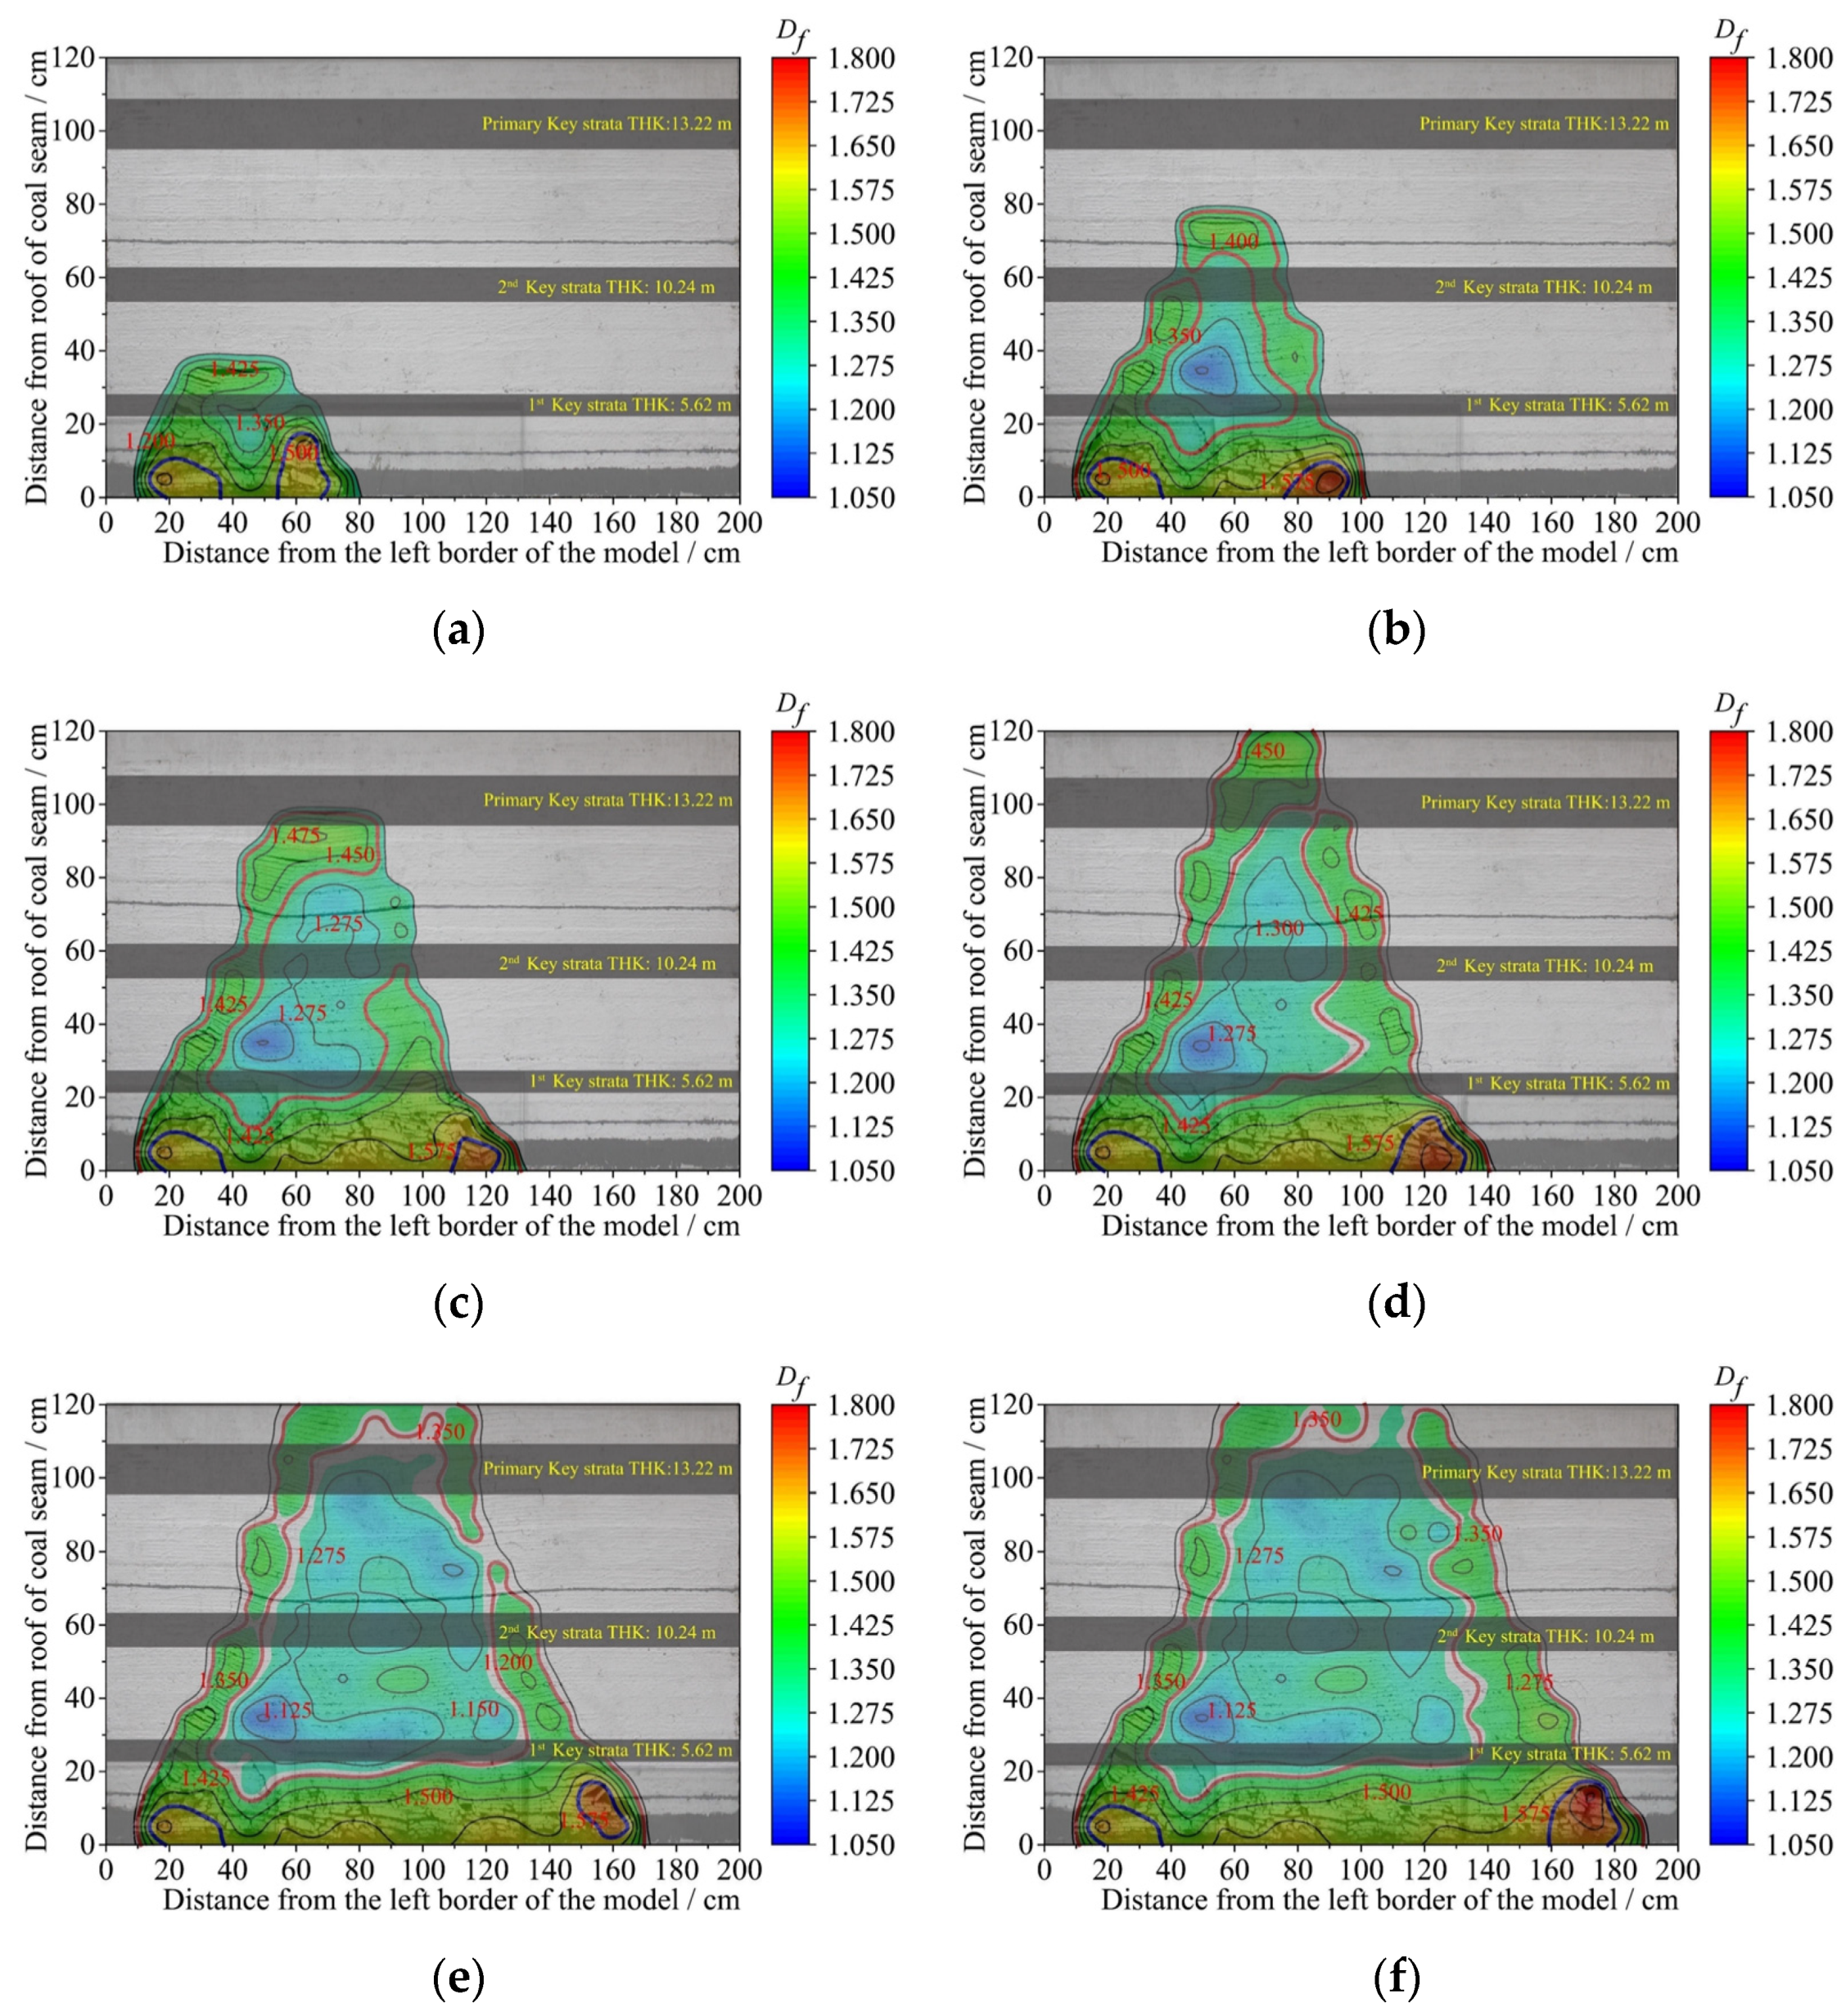
Figure 3.
Isoline graphs of the fractal dimension distribution of the fracture aperture under different advancing distances: (a) 57 cm, (b) 80 cm, (c) 105 cm, (d) 115 cm, (e) 150 cm, and (f) 170 cm. In the figure, the fractal dimension of the area wrapped by the blue contour is greater than 1.575, and the fractal dimension of the area wrapped by the red contour is greater than 1.350.
From Figure 3, in the early stage of mining, the fractal dimension of the fracture network is large, and no large difference is observed in the distribution. The maximum value is observed behind the working face, reaching 1.673, and as the level of the collapsed overburden increases, the fractal dimension gradually decreases. With the advancement in the working face (advancing to 85 m and 105 m), the collapse range of the upper rock layer increases, and the fractal dimension of the fracture opening at the open-off cut and the back of the working face also remains at a level of more than 1.50. The maximum fractal dimension of the local area behind the working face can reach more than 1.7, and the fractal dimension in the middle of the goaf is always retained in the range of 1.2–1.5.
At the same time, the top of the fracture development area is considered the delamination area of the key layer structure, and its fractal dimension can reach a level of more than 1.45. When advancing to 115 m, the opening of the top delamination fracture reaches the maximum value, and its fractal dimension also reaches the maximum value of 1.481. Thereafter, with the advancement in the working face, the fractal dimension of the top area gradually decreases, but it remains between 1.35 and 1.45.
4.2. Distribution Law of the Tortuosity Fractal Dimension
According to the values of the fracture opening fractal dimension obtained in the previous section, the minimum and average values of the fracture opening are put into Equations (13) and (14) to calculate the distribution of the fractal dimension of the tortuosity at different advance distances, as shown in Figure 4. The fractal dimension of the tortuosity of the same uncollapsed area is calculated as 1.
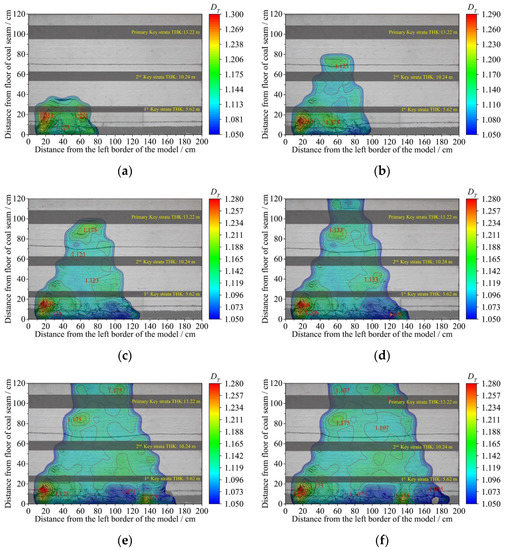
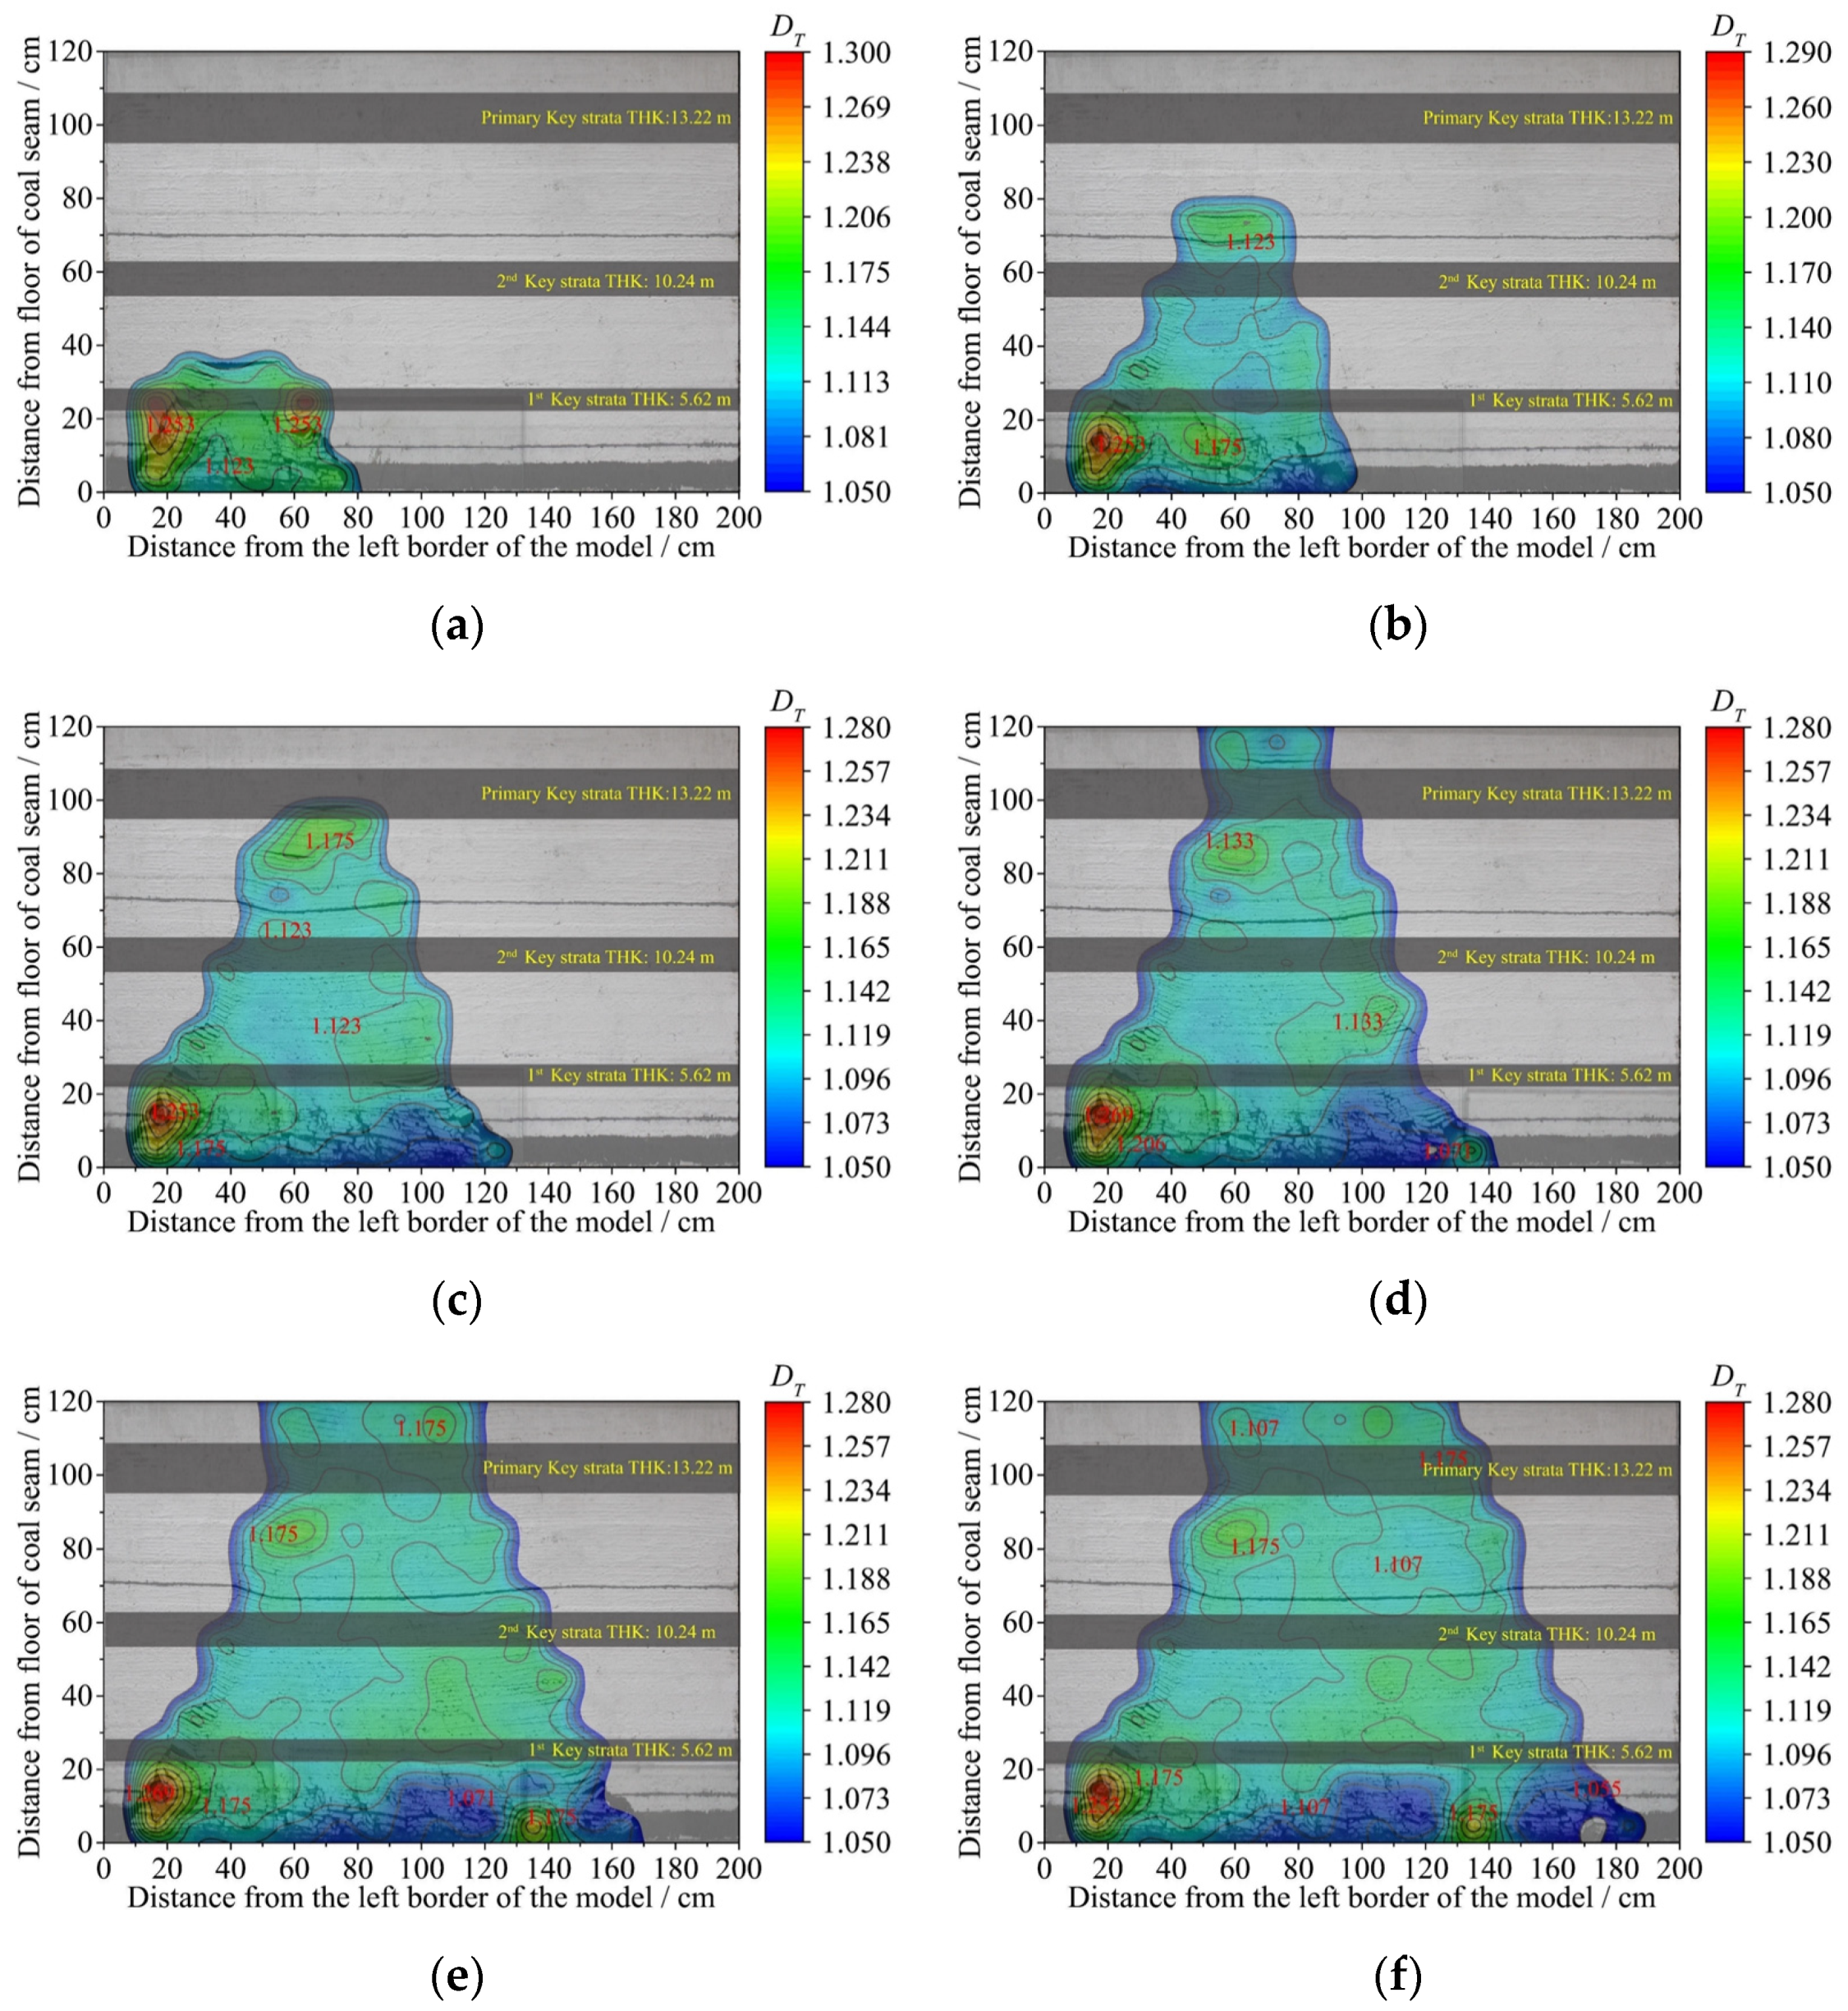
Figure 4.
Isoline graphs of the fractal dimension distribution of the fracture tortuosity under different advancing distances: (a) 57 cm, (b) 80 cm, (c) 105 cm, (d) 115 cm, (e) 150 cm, and (f) 170 cm.
From Figure 4, the tortuosity fractal dimension in the caving zone is found to be at a higher level than that of the entire fracture network area, and the maximum value is observed near the open-off cut and behind the working surface, which can reach 1.50. The tortuosity fractal dimension of the delamination region at the top of the fracture network is found to be slightly smaller than that of the caving zone, which is between 1.20 and 1.35. The tortuosity fractal dimension of the fracture zone is found to be larger than that of the compaction zone. At the same time, the tortuosity fractal dimension is found to be slightly larger than that in the nearby area at the periodic pressure step, and the local maximum can reach 1.28. Before the working face advances to 115 m, the tortuosity fractal dimension of the top delamination area increases as the advancing degree increases. After advancing to 115 m, the tortuosity fractal dimension of the top delamination area decreases as the advancing degree increases.
4.3. Analysis of the Dynamic Evolution Process of the Fractal Dimension
After the coal seam is mined, first, the lower part of the direct roof loses restraint and deflects. Due to the differences in constraints and forces between the rock layers, the tangential displacements of various rock layers are found to be different. In other words, the horizontal shear dislocation occurs between the rock layers, which is a prerequisite for generating separation fractures. At this stage, as the advancing distance increases, the opening of the delamination fracture and its fractal dimension gradually increase. As the working face advances, the overburden load is transmitted to both ends of the rock beam in the form of a stress arch. Then, longitudinal shear fractures are generated at both ends of the rock beam, and longitudinal tensile fractures are generated in the middle of the rock beam. Finally, the longitudinal fractures penetrate the entire rock layer, and the immediate roof collapses for the first time. At the same time, the broken overburden fails to completely fill the entire goaf, the rocks are loosely stacked, and the opening of the fracture and its fractal dimension are found to be large.
As a result, the working face continues to advance, the broken rock mass completely fills the mined-out area, and the inferior key strata bend and touch the broken gangue. A hinged structure with a certain supporting effect is formed after breaking due to the supporting and frictional force of the lower broken rock mass. The stress transfer under the hinged structure is blocked, so the fractal dimension of the fractured overburden near the open-off cut and behind the working face becomes large. When the load on the hinged rock block reaches its bearing limit, the rock block slips or gyratory instability occurs, which compacts the lower rock mass and leads to a decrease in the fracture opening and the fractal dimension in this area. At the same time, a new hinged structure is formed behind the working face, and the joints between the new and old hinged rock blocks are mostly the longitudinal shear and tensile fractures. In the process of stress recovery and compaction in the goaf, a small change is observed in the fracture opening, which also leads to the larger fractal dimension at the periodic compression step.
The trend of change for the fractal dimension of the upper delamination area depends on whether this area touches the lower broken rock layer during the deflection deformation of the primary key strata. Before touching the lower broken rock layer, with the advancement of the working face, the opening of the delamination fracture continuously increases. This also leads to an increase in the fractal dimension of the upper delamination area. When the main key layer structure touches the lower broken rock layer, the key layer subsidence is restricted, and the support of the lower broken rock body offsets the shear dislocation among some rock layers so that the opening of the fracture is relatively reduced. With the advancement of the working face, the delamination fractures tend to be close to each other, and the contact area between the key layer structure and the underlying rock layer increases, which also leads to the closure of the delamination fractures of the underlying rock mass. Therefore, the fractal dimension of the fracture opening in the middle compaction zone and the top delamination zone gradually decreases.
5. Distribution Regulation of Pressure-Relief Gas Permeability and Its Engineering Verification
5.1. Distribution Regulation of Pressure-Relief Gas Permeability of Overburden Rock
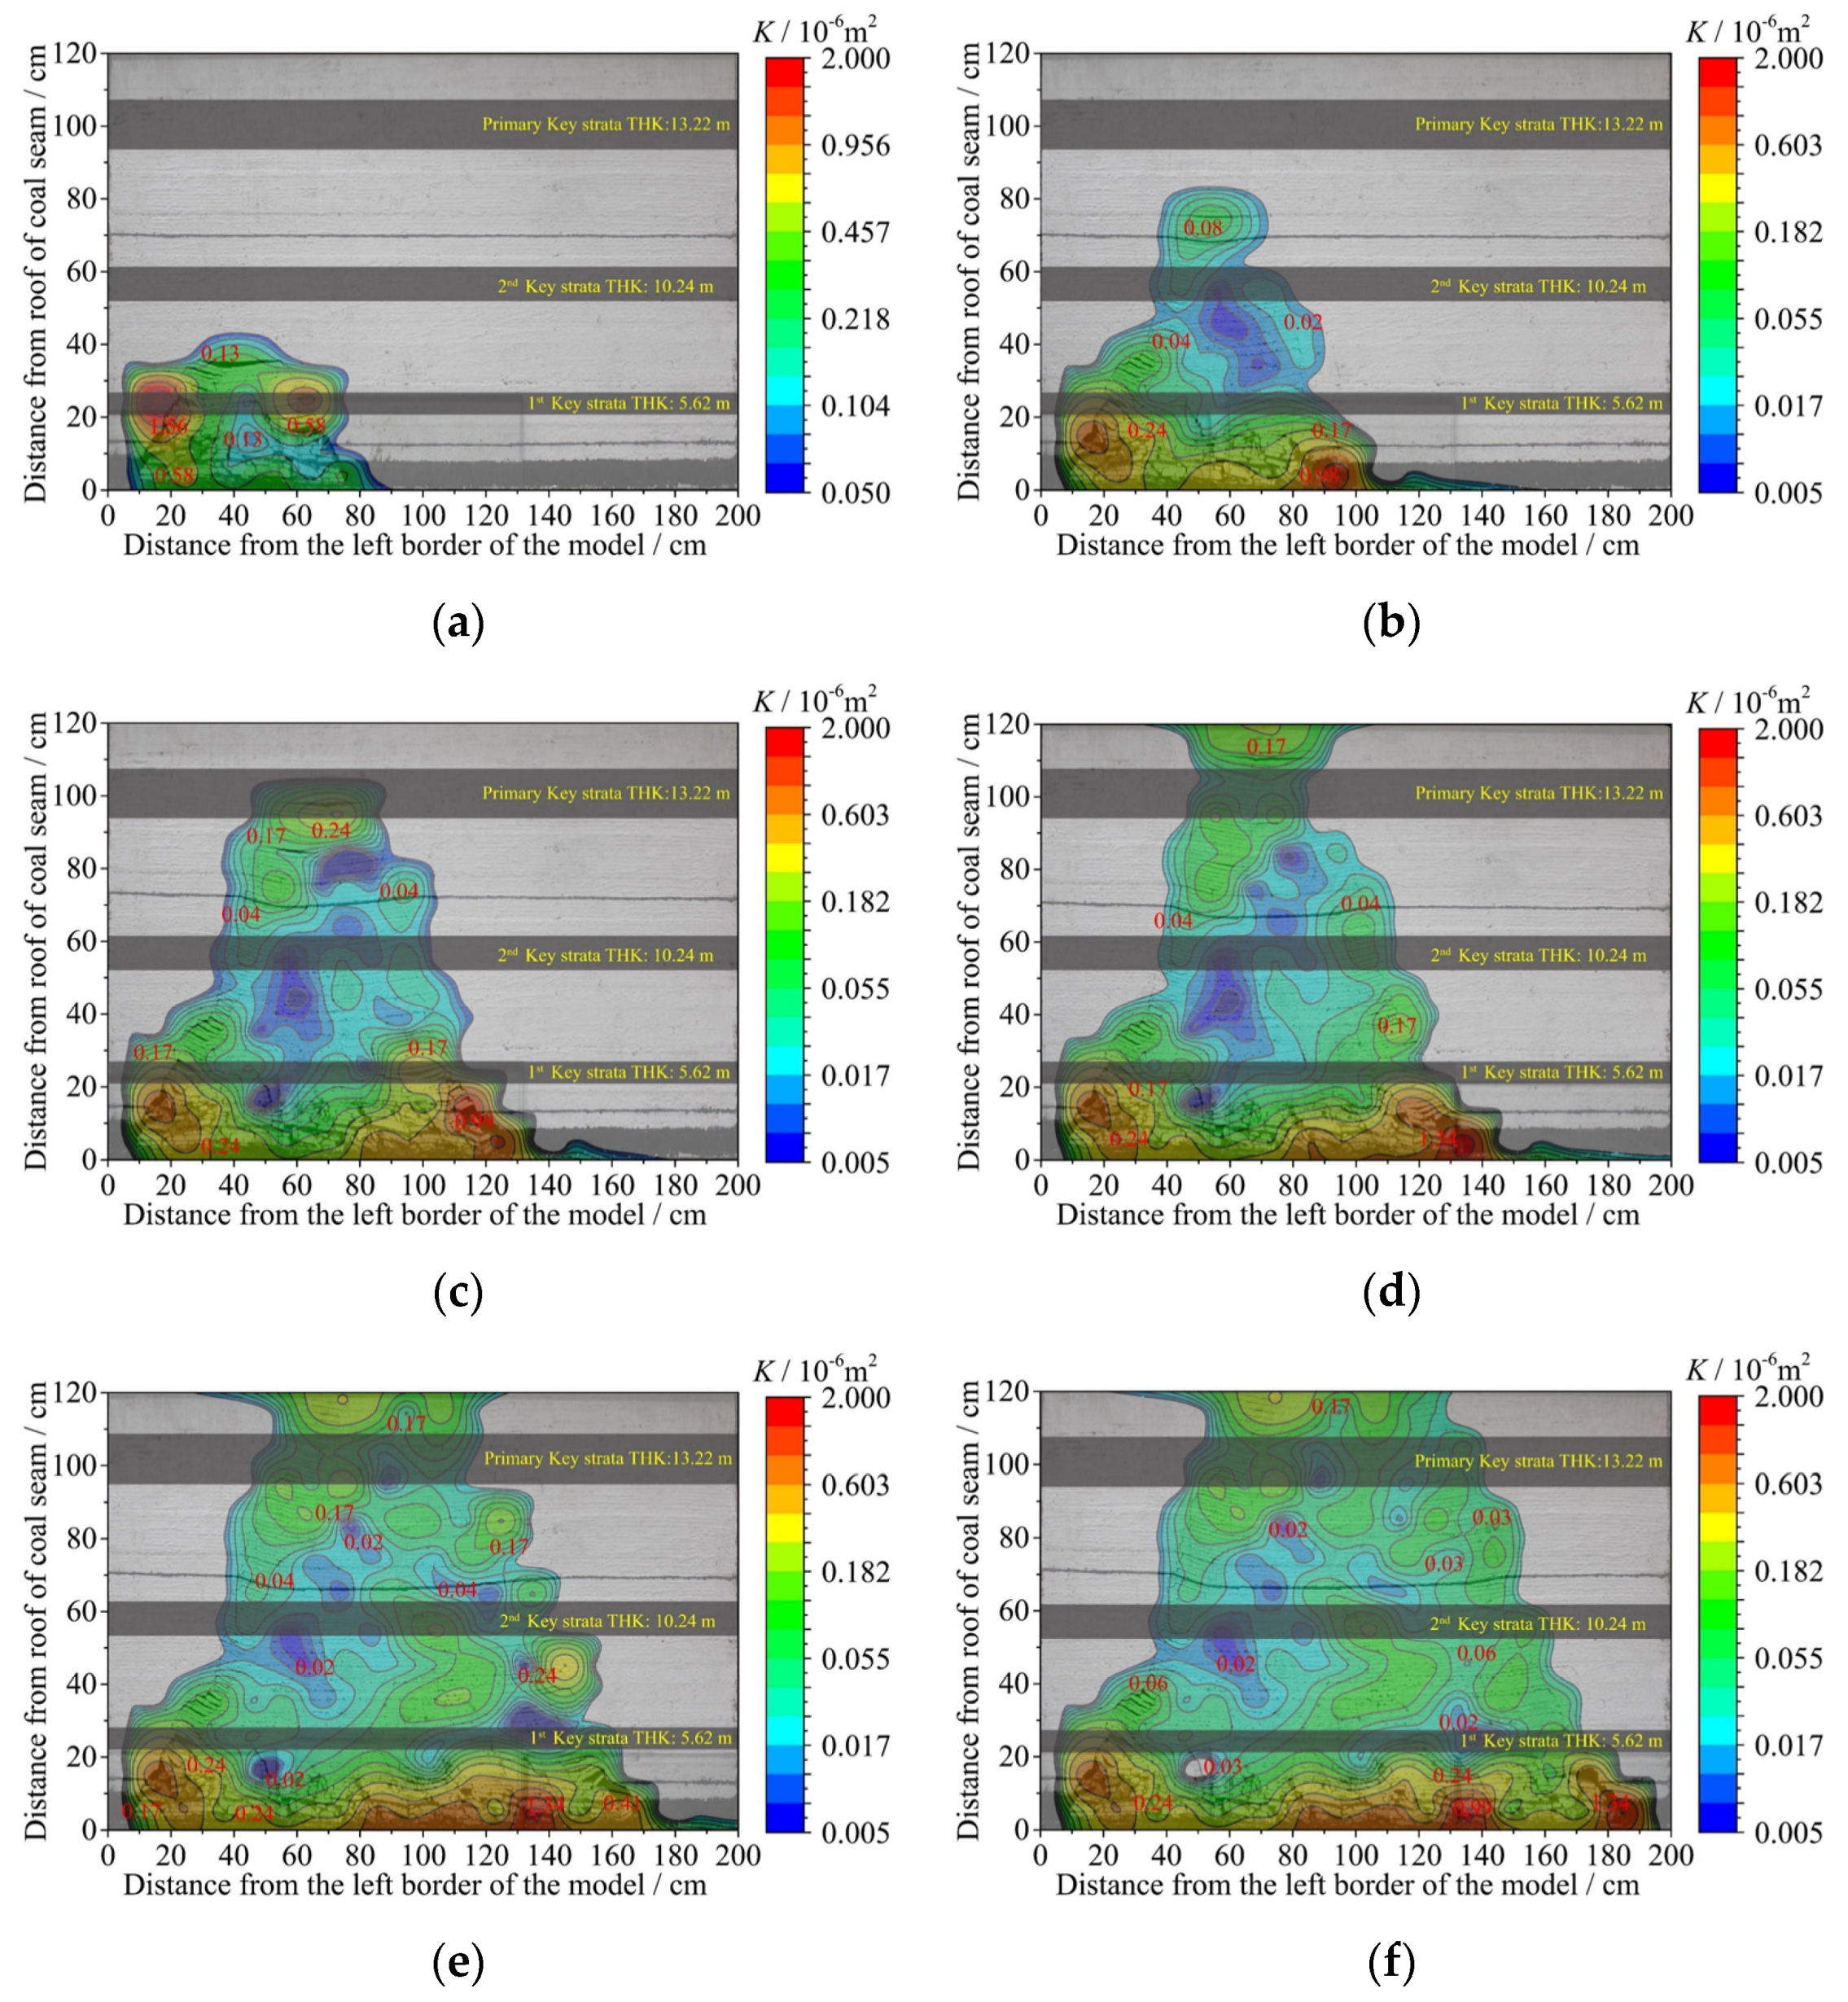
The experimental results of the fractal dimension of the fracture opening tortuosity are applied in the seepage-fractal equation (Equation (8)), and by using Equation (10) to modify gas permeability, contour maps of the permeability distribution of the overburden in the goaf under different advancing distances are obtained, as shown in Figure 5.

Figure 5.
Contour map of the pressure-relief gas permeability distribution under different advancing distances: (a) 57 cm, (b) 80 cm, (c) 105 cm, (d) 115 cm, (e) 150 cm, and (f) 170 cm.
It can be seen from Figure 5 that the maximum pressure-relief gas permeability in the goaf generally occurs near the open-off cutting or within 20 m behind the longwall face. Within 22 m of the coal seam floor, the pressure-relief gas permeability, which remains above 2.0 × 10⁻⁷ m2, is in a high state. At the same time, there is an obvious increase in the periodic breaking of the rock formation. Above the caving zone, the permeability is at a low level, and only the local area near the overburden fault line can reach 2.4 × 10⁻⁸ m2. The lowest permeability of the central compacted zone is only about 5.0 × 10⁻⁹ m2. The top permeability of the fracture zone is also higher than that of the central compaction zone, and the maximum permeability of this zone can reach 2.0 × 10⁻⁷ m2. To intuitively show the change in pressure-relief gas permeability at different advancing distances in different rock layers, the change trend of pressure-relief gas permeability near the key layers is plotted, as shown in Figure 6.
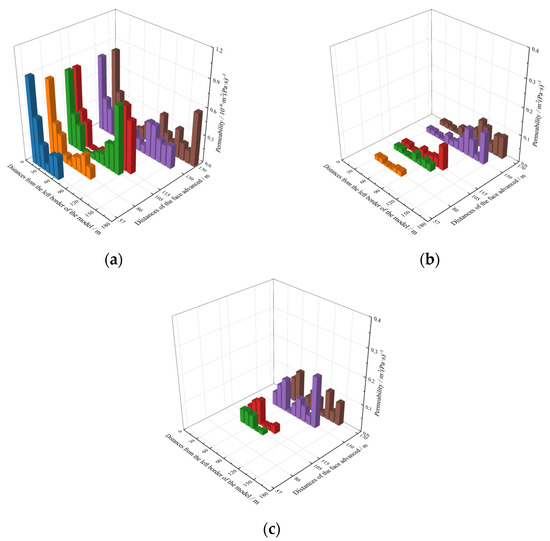
Figure 6.
Evolution characteristics of permeability of different rock formations: (a) 1st key strata, (b) 2nd key strata, and (c) primary key strata.
It can be seen from Figure 6 that for the same rock layer, the permeability at both ends of the layer is larger, while it is smaller in the middle. In the process of mining, the stress in the goaf continues to recover, and the separation fractures tend to close. The axial strain of broken rock block under the action of stress recovery causes the opening of longitudinal fractures to gradually decrease so that the permeability decreases as the distance from the working face increases. For the rock formations of different layers, the low-level rock layer, which is in the caving zone, has the largest permeability, and the permeability of the central compacted zone is the smallest. The permeability at the junction of the fracture zone and bending subsidence zone is between the two areas.
5.2. Analysis of the Evolution Process of the Pressure-Relief Gas Permeability
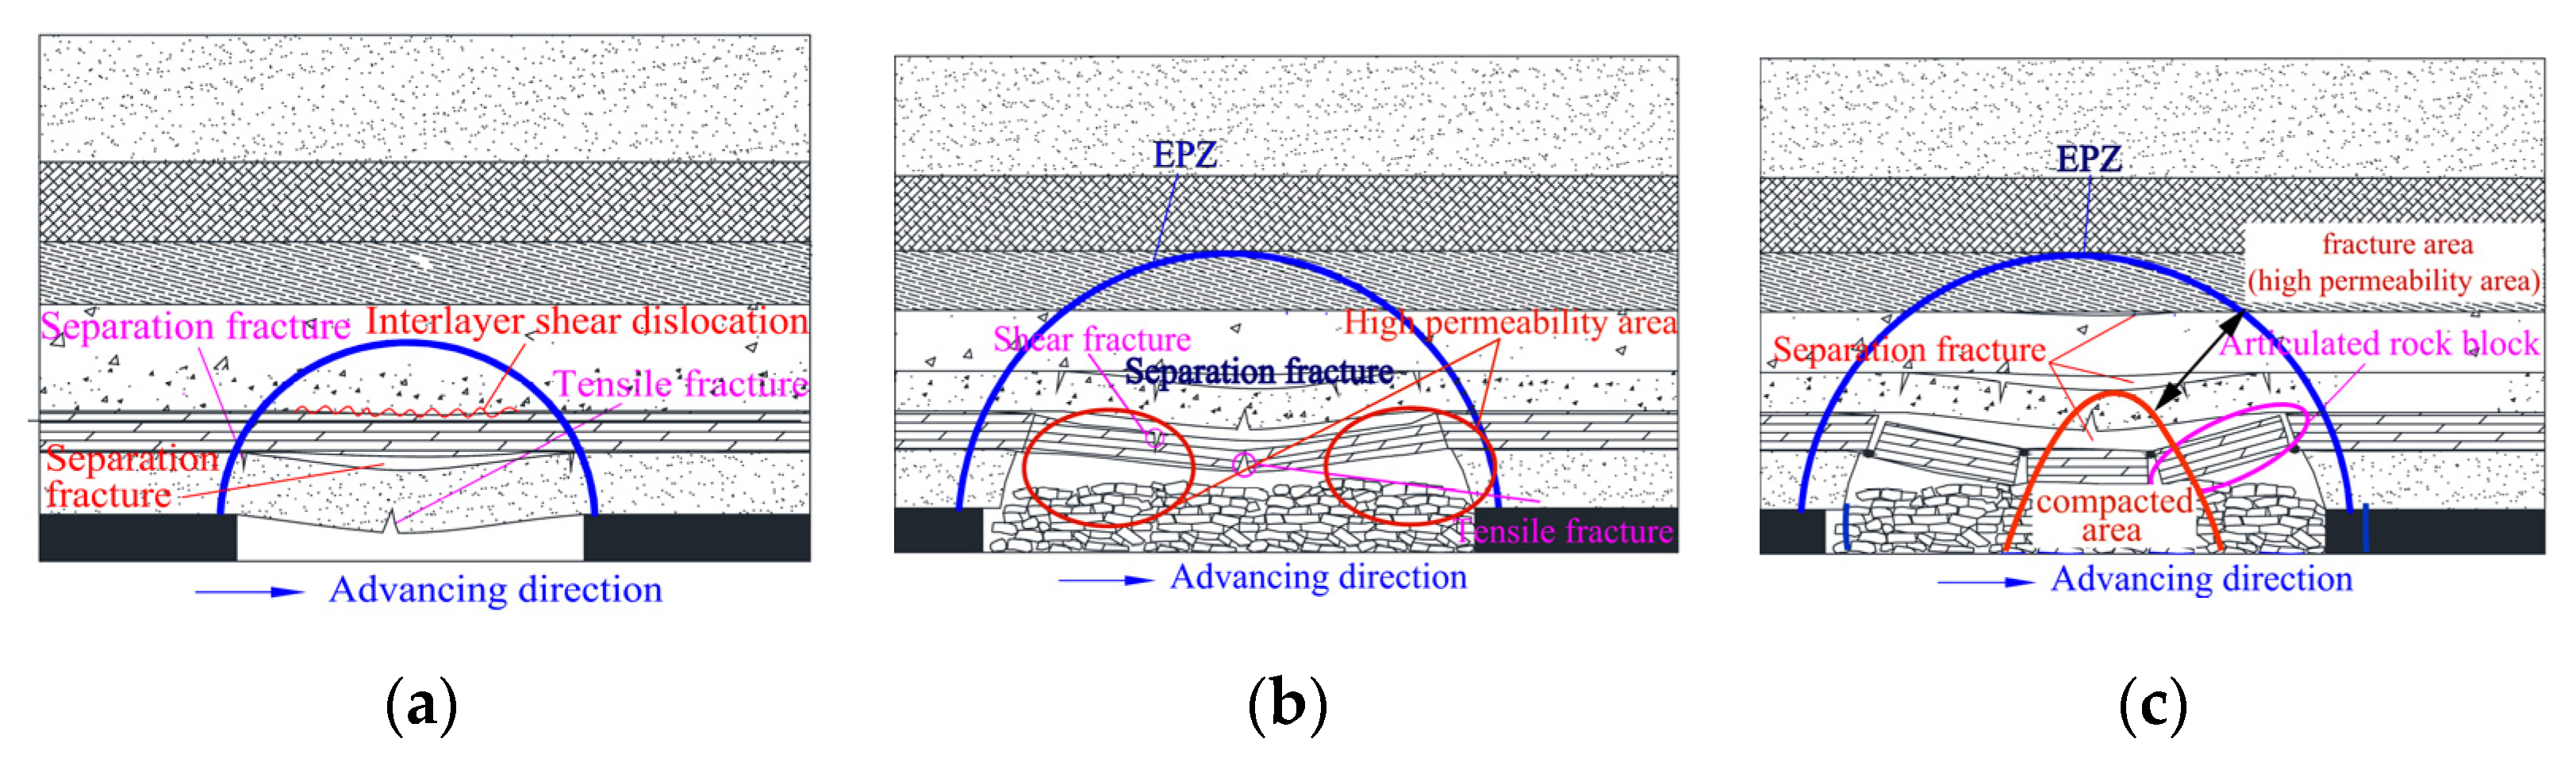
Similar simulation experiments have shown that with the advancement of the working face, the overlying strata demonstrate the obvious characteristics of breaking and separation where, in the stratification, movement develops upward in sequence. In the fracture network, the penetrating layer fracture and the strata layer separation fracture intersect each other, thereby generating an outer boundary that has a shape similar to an elliptical paraboloid, which is called an outer elliptical paraboloid. At the same time, the overburden mining fractures located in the middle of the goaf are basically compacted, and the compacted boundary can also be considered as an elliptical paraboloid, which is called an inner elliptical paraboloid. In the overlying rock layer of the whole mined-out area, a cap-shaped mining fracture zone is formed between the inner and outer elliptical parabolic surfaces, which is called the elliptical parabolic zone (EPZ). As discussed in the previous section, the experimental results show that the elliptical parabolic zone is the high permeability area of the pressure-relief gas. In the process of permeability evolution, the key layer structure controls the evolution trend of gas permeability, which can be summarized in the following three stages.
Before the sub-critical layer breaks to form a hinged structure, the collapsed rock mass is found in a loosely packed state, and the outer boundary of the mining fracture is similar to an elliptical parabola, as shown in Figure 7a. Due to the limited mining distance, the collapse range of the overlying strata is found to be relatively small, the transmission of pressure from the overlying strata to the sub-critical strata is blocked, no compaction zone is formed, and the overall permeability within the collapse zone is found to be relatively large.
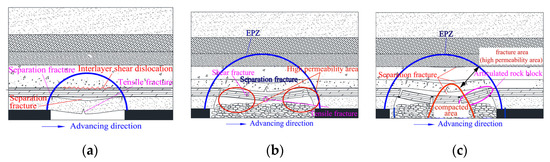
Figure 7.
Schematic diagram of the overburden movement process: (a) the stage of immediate roof bending; (b) before the main roof break; (c) the primary key strata contacts with the broken rock block.
The main key layer is located above the ellipsoidal zone. Once the sub-key layer structure is broken, the collapse of the overlying rock layer transmits pressure to the middle of the goaf so that the separation fractures and broken fractures are gradually compacted. It is obvious that a boundary will be formed between the compaction zone and the external high permeability zone, that is, the formation of the inner ellipsoid, as shown in Figure 7b. At this stage, the height of the outer ellipsoidal surface is found to be consistent with the development height of the overburden fractures, and a certain height difference is also observed between the inner boundary and the outer boundary.
The main key layer divides an ellipsoidal zone (the main key layer touches the lower broken rock layer), and the mine pressure is transmitted downward from the main key layer. The degree of compaction in the middle of the goaf below the main key layer increases with an increase in the advancement distance of the working face. The height of the outer ellipsoidal surface basically remains the same, and the height of the inner ellipsoidal surface continues to develop upward, but the fracture opening around the goaf remains the same. At the same time, the height of the inner ellipsoidal surface remains the same as shown in Figure 7c.
5.3. Inversion of the High Permeability Drilling Drainage Permeability
5.3.1. Permeability Measurement Method
After coal mining, it is a complicated and arduous task to measure the permeability characteristics of pressure-relief gas in overlying rock. The comprehensive testing of it requires huge engineering and has little practical significance. Therefore, the key area of pressure-relief gas, namely the area near the first sub-key layer, was tested to analyze the trend of permeability characteristics in this study. Moreover, the measured results were compared with the theoretical values calculated by the fractal permeability model, which was used to verify the reliability of models. The layout parameters of the test boreholes are shown in Table 3.
Table 3.
Parameters of permeability test boreholes.
After the borehole is completed according to the layout parameters, it should be sealed. Moreover, to prevent the borehole from collapsing during the advancement of the longwall face, wellbore pipes are installed in the entire borehole section. Therefore, the radial flow rate along the borehole during the extraction of pressure-relief gas is negligible compared to the drainage flow rate at the orifice position. Moreover, the impact of gas extraction in the goaf on the overburden fractures is basically negligible. Based on the above reasons, the following assumptions can be made:
- The permeability of pressure-relief gas in the goaf will not change due to extraction.
- The flow process of pressure-relief gas to the borehole is regarded as an isothermal process and conforms to Darcy’s law.
- The influence of the resistance along the way on the axial flow of gas in the borehole is ignored.
In the process of a high-level borehole extraction, the extraction flow rate and the extraction negative pressure of each borehole are monitored, and the permeability evolution around the borehole is calculated by Darcy’s law. For each advancement distance, the extraction data are recorded every 2 h. A single borehole has five sets of data for a total of six sets.
where v is Kbh is the gas permeability around the borehole (m2/(Pa·s)−1), Qbh is the drainage flow rate of the borehole (m3/s), and ΔP is the extraction pressure gradient (Pa/m).
5.3.2. Permeability Inversion Results
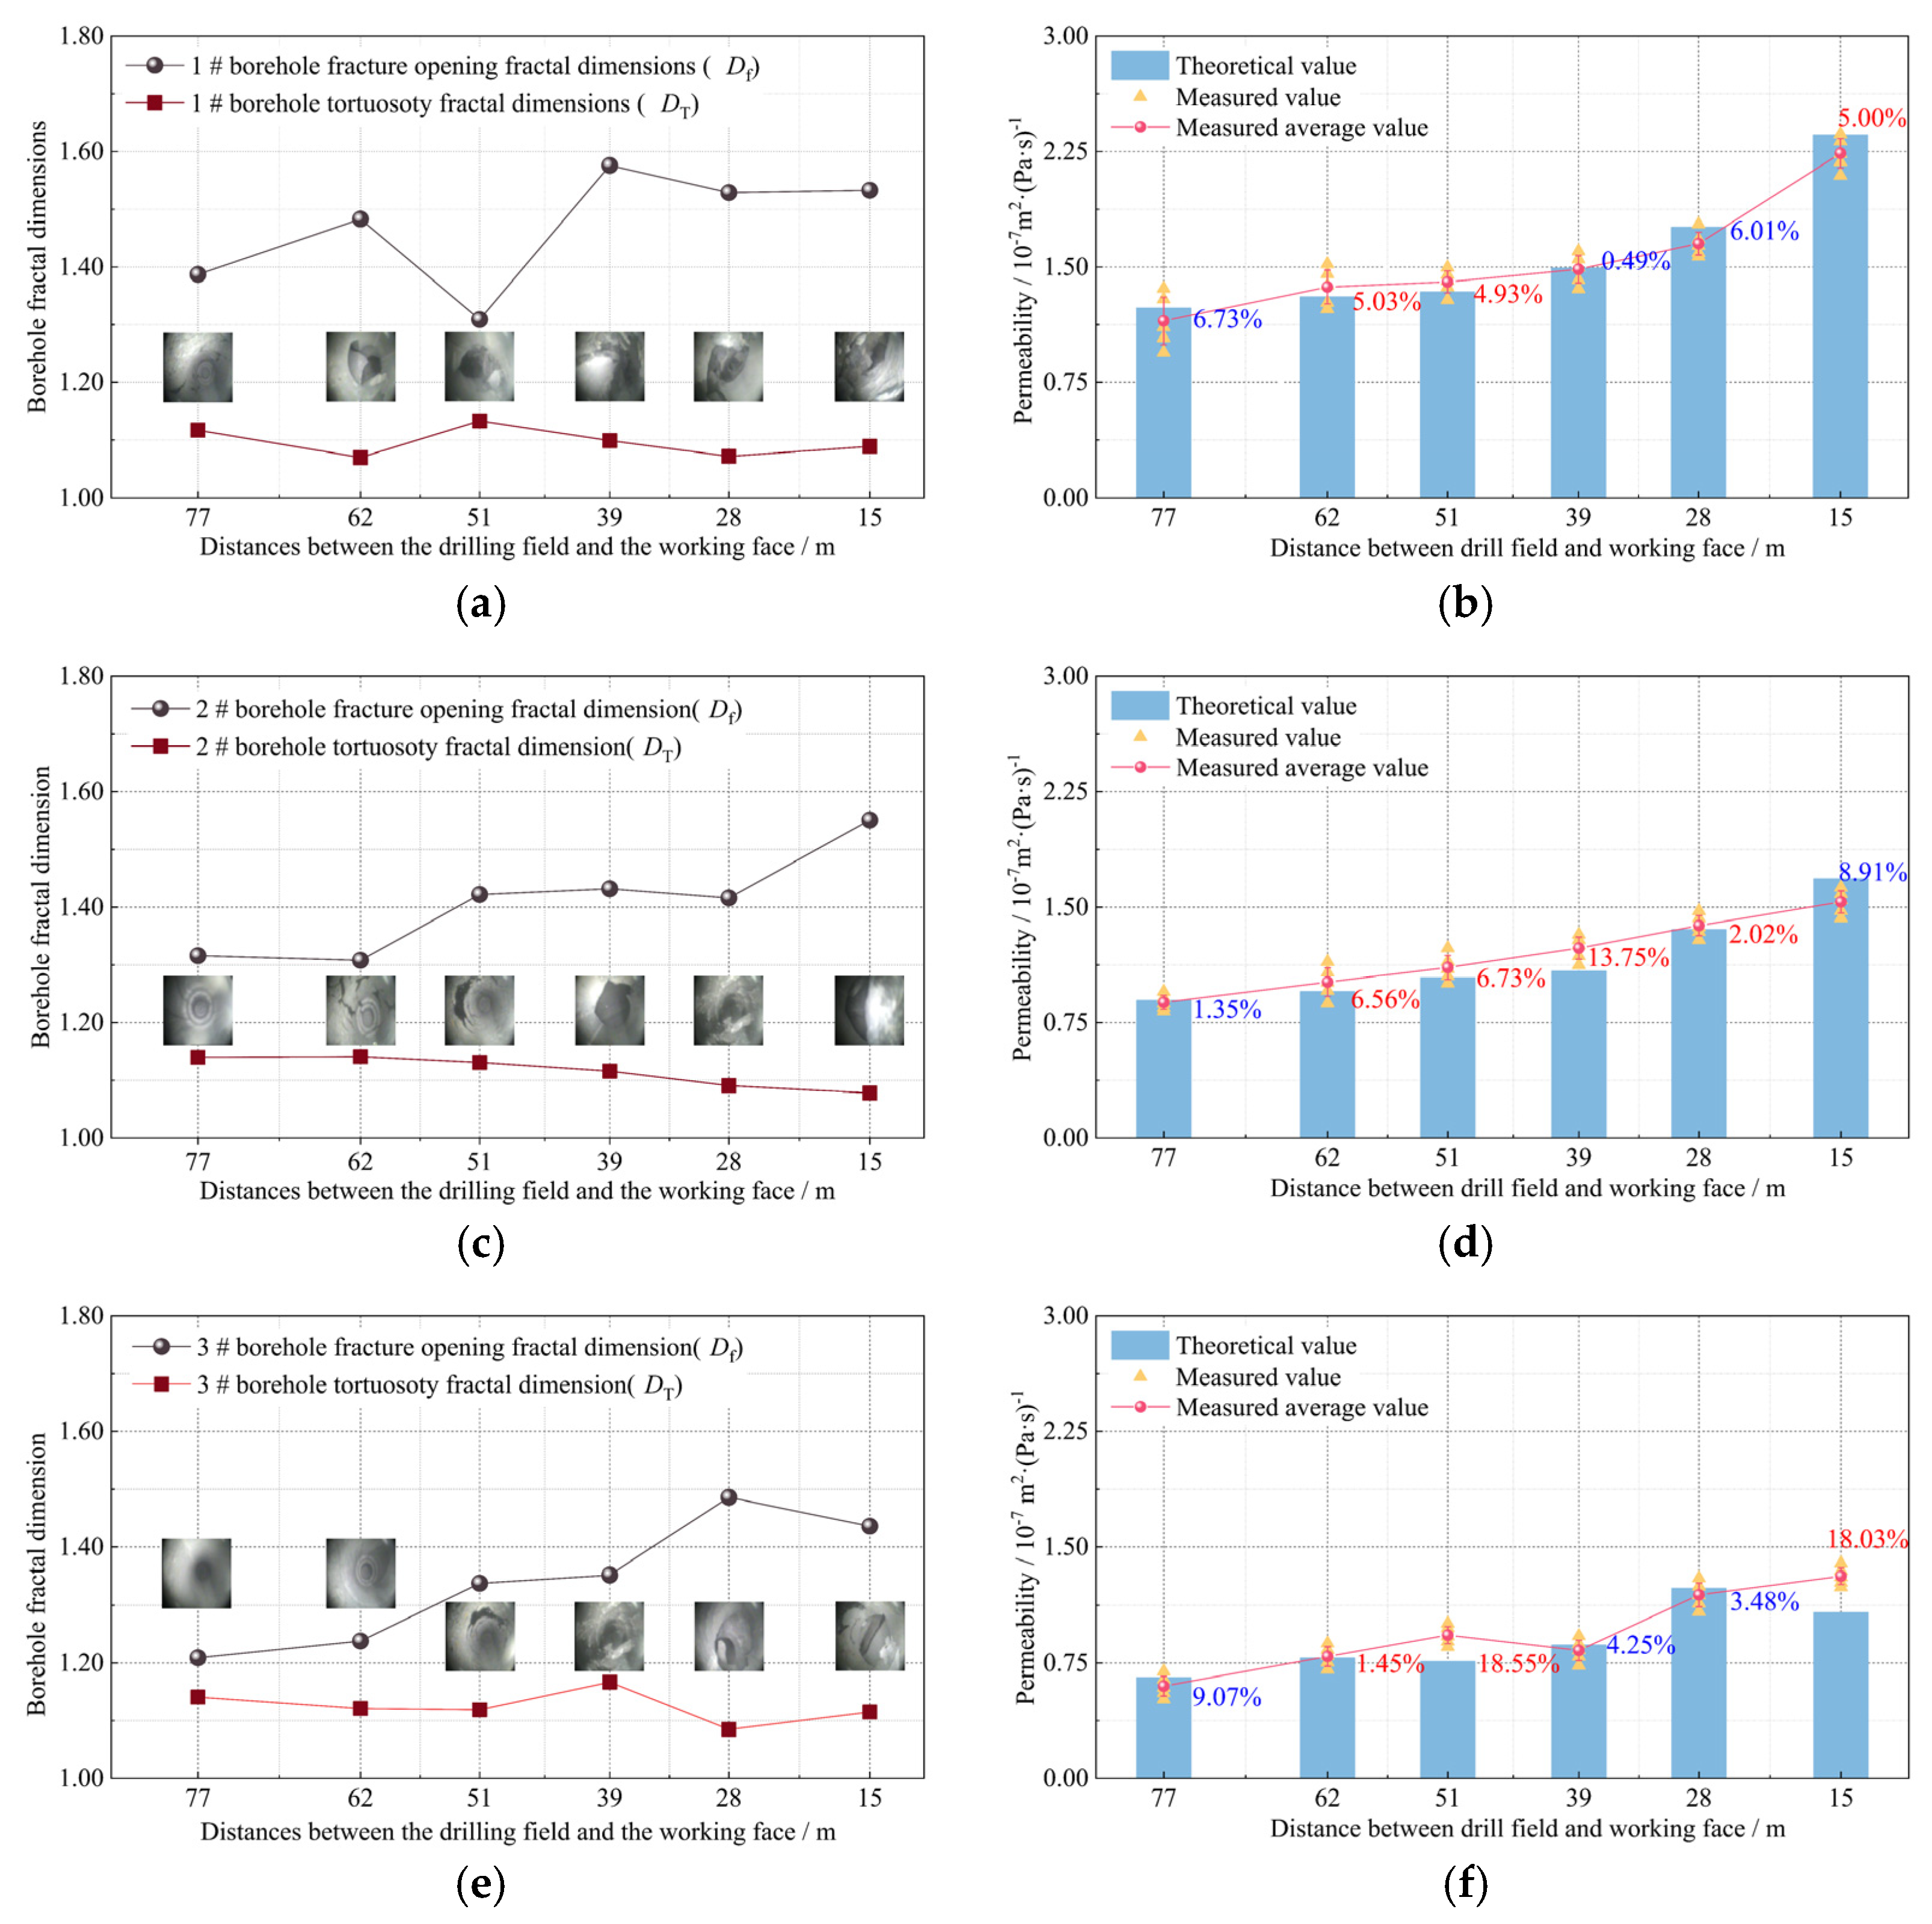
Since wellbore pipes are installed in the entire borehole section, and the resistance along the borehole during the drainage process is not considered, the permeability can be calculated by the fractal dimension of the fracture at the bottom of the borehole. During the monitoring process, the fracture photos around the hole are captured at the corresponding position, and the fractal dimension of the fracture is calculated using software. The hole at the typical position is selected for the analysis, as shown in Table 3. According to the penetration-fractal equation (Equation (18)) obtained in the previous section, the theoretical value of the permeability around the borehole is calculated and compared with the actual observed value, as shown in Figure 8.
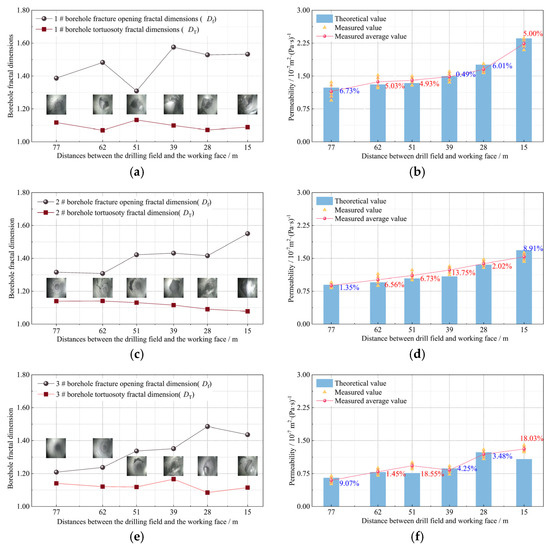
Figure 8.
Fractal dimensions of borehole photos and comparison of the theoretical and measured values of pressure–relief gas permeability: (a) fractal dimension of 1# borehole photos; (b) comparison of theoretical value and actual value of 1#borehole permeability; (c) fractal dimension of 2# borehole photos; (d) comparison of theoretical value and actual value of 2#borehole permeability; (e) fractal dimension of 3# borehole photos; (f) comparison of theoretical value and actual value of 3#borehole permeability. In (b,d,f), the red percentages indicate that the actual measured value is higher than the theoretical calculated value, and the blue percentage indicates that the actual measured value is lower than the theoretical calculated value.
From Figure 8, the closer the distance between the drill field and the working face, the more the end position of the borehole is continuously reduced, and the more the permeability is continuously increased, which is the same as the trend obtained by the physical simulation experiment. The maximum deviation estimated for the theoretical and actual values of 1# borehole is 6.73%, and the minimum deviation is 0.49%. The maximum deviation of 2# borehole is estimated to be 8.91%, and the minimum deviation is 2.02%. For 3# borehole, the maximum deviation of the hole is estimated to be 18.03%, and the minimum deviation is only 1.45%.
According to the permeability distribution reflected by the physical similar simulation results, the permeability of the caving zone is generally higher than that of the fracture zone, and the permeability tends to decrease with the increase in the layer level. From the parameters of high-level borehole arrangement (Table 3), the layer of drill holes increases, so borehole #1 has the largest permeability among the three drill holes, followed by borehole #2, and borehole #3 has the smallest permeability.
The whole length of borehole 1# and borehole 2# is located in the caving zone, and the final position of drill hole 3# is in the fracture zone. As the working face advances, the borehole level decreases, and the final position of drill hole 3# enters the caving zone when the drilling field is 50 m away from the panel. Therefore, the permeability of borehole 1# and borehole 2# increases with the decreasing distance between the working face and the drilling field with strict monotonicity. The permeability of borehole #3 decreases when the panel is 50 m away from the drill filed, which is due to the large lumpiness of the broken rock at the intersection of the caving zone and the fracture zone. Boreholes in this area are prone to shear damage, leading to borehole occlusion. Therefore, the decrease in the permeability of the high-level borehole occurs as it passes through this location, and after this stage, the permeability gradually increases.
There are two reasons for the errors between the measured values and the theoretical calculated values. The first is that the theoretical model assumes that the gas in the goaf is an incompressible fluid, resulting in a larger theoretical calculation, but the error value is within the allowable range of engineering accuracy. The second point is the measurement error. The position and the angle of the camera’s high-brightness light source are difficult to capture in the process of drilling and peeping, which generates the error between the calculated value and the actual value of the fractal dimension of the borehole fracture photo.
The comparison between the theoretical calculation value and the actual observation value can be found so that the trend of change and the specific value generally agree with the results obtained by the physical simulation experiment, thus verifying the reliability of the theoretical calculation model.
6. Engineering Practice of Pressure-Relief Gas Drainage
6.1. Gas Drainage System Layout
6.1.1. Basis for the Layout of the Extraction System
According to the above analysis, the permeability of the overburden relief gas in the vertical direction significantly reduces at the junction of the fall zone and the fracture zone. It can be considered that the gas pressure gradient is equal at the cross-section of the overburden at the same height. According to Darcy’s law, a large decrease in the permeability can lead to a reduction in the rate of the upward pressure gas migration in the fracture channel. Therefore, a small gas accumulation area forms at the junction of the fall zone and the fracture zone. It can be observed that covering this area with the final hole position of the pressure-relief gas drilling hole can significantly improve the gas drainage efficiency, thereby reducing the possibility of exceeding the gas concentration in the mining activity area.
6.1.2. Layout Parameters of the Extraction System
According to the gas emission condition of the test face (15–20 m3/min), the air exhaust gas capacity (5–7 m3/min), and the drilling extraction capacity (single hole extraction capacity is 1–1.5 m3/min), a total of 10 drill holes are designed in each drill field to meet the pressure relief requirement of the goaf. The physical similarity simulation experiment shows that the height of the caving zone of the working face is about 24.8 m, so the height of the final hole position of the drill hole is designed in such a way that it can cover a range of 0–30 m, and the horizontal distance covers 0–20 m inward of the return airway. The schematic diagram of the borehole layout is shown in Figure 9, and the specific layout parameters are presented in Table 4.
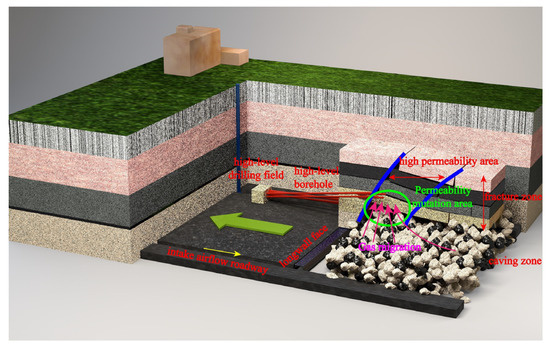
Figure 9.
Schematic diagram of the high-level borehole layout.
Table 4.
Parameters of the high-level borehole arrangement.
6.2. Analysis of the Gas Drainage Effect
During the recovery of the test face, the gas extraction concentration and the efficiency of the high-level drilling field are shown in Figure 10. In the early stages of mining, the gas drainage efficiency of the borehole is found to be low. The main reason is that the fracture and the borehole are not fully connected, and the extraction rate is only about 60%. This stage primarily relies on venting to discharge gas, which significantly relieves the pressure of extraction. After the fracture network and the borehole are completely penetrated, the extraction effect of the high-level boreholes arranged according to the development of the fracture is found to be stable at more than 70%; the maximum extraction rate can reach 93.7%. The methane concentration in the ventilation roadway and the upper corner is controlled below 0.4%. Moreover, engineering applications show that the layout of the high-level drainage borehole mentioned above to extract methane from the goaf can significantly improve the efficiency of gas extraction.
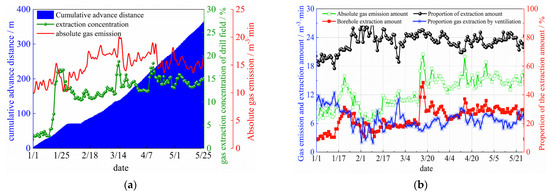
Figure 10.
Gas extraction effect in 2020. (a) Effect of the cumulative advancing distance on the amount of the absolute gas emission and the gas extraction concentration. (b) Gas extraction efficiency of the high-level drilling field.
7. Conclusions
- The plane fracture network obtained by the physical simulation experiment is divided into small scales, and the fractal dimension of each module is calculated. This can clearly reflect the distribution and evolution of the fractal dimension and the tortuosity in different areas of overburden mining. The caving zone, the delamination zone at the top of the fracture network, and the fracture zones at both ends of the goaf are considered high fractal dimension regions where the fractal dimensions are above 1.425, and the maximum value can reach up to 1.70. The central compaction zone above the fall zone is considered a low fractal dimension region where the fractal dimensions are below 1.325. The fractal dimension of the step of a periodic pressure is found to be more than 20% higher than the surrounding area.
- The permeability control equation of the goaf fracture network represented by the fractal dimension does not contain any empirical parameters, and each parameter has a specific physical meaning, which can reveal the influence mechanism of the goaf fracture network permeability. The average error between the theoretical model and the actual value is only 8.11%, which is within the range of engineering accuracy. Meanwhile, it can guide how to use the fractal theory to study the pressure-relief gas flow model in the goaf.
- The high permeability area in the fracture network generally shows the shape of an elliptical paraboloid. Permeability evolution considers the main key layer contact gangue as the critical point that the panel advances to 115 m. Before approaching the main key layer contact gangue, the permeability increases with the advancing distance, and its maximum value is 2.0 × 10⁻⁷ m2. Once the key layer touches the gangue, the permeability gradually decreases.
- During the mining process, the pressure-relief gas drainage system is arranged in the abrupt permeability zone at the junction of the caving zone and the fracture zone, and the maximum pressure-relief gas extraction rate can reach 93.7%, which guarantees the safe and efficient recovery of the test longwall face.
Author Contributions
Conceptualization, S.L. (Shugang Li) and H.L.; data curation, P.X.; formal analysis, Y.D. and H.S. Funding acquisition, S.L. (Shugang Li); investigation Y.D. and S.L. (Sibo Liu); writing—original draft, P.X.; writing—review and editing, Y.T. All authors have read and agreed to the published version of the manuscript.
Funding
This research was funded by the National Natural Science Foundation of China (no. 51734007, no. 51874236, no.52074217, no. 51704227, and no. 51904238).
Institutional Review Board Statement
Not applicable.
Informed Consent Statement
Not applicable.
Data Availability Statement
Not applicable.
Acknowledgments
This study is supported by the National Natural Science Foundation of China (no. 51734007, no. 51874236, no.52074217, no. 51704227, and no. 51904238).
Conflicts of Interest
The authors declare no conflict of interest.
Abbreviations
| f(λ) | Probability density function of the fracture opening | v | Gas seepage velocity in borehole |
| Df | Fractal dimension of fractures opening | a | λmin/λmax |
| λ | Fracture opening | CL | Geometric similarity ratio |
| λmax | Maximum fracture opening | Cγ | Bulk density similarity ratio |
| λmin | Minimum fracture opening | Cσ | Stress similarity ratio |
| Lt(λ) | Actual seepage path length of gas in the fracture | Lp | Geometric parameters of the prototype |
| DT | Fractal dimension of fractures opening | Lm | Geometric parameters of the model |
| L0 | Straight line length of seepage in the fracture | γp | Severity parameter of the prototype |
| S | Flow area of pressure-relief gas in the fractured medium | γm | Severity parameter of the model |
| q(λ) | Gas flow rate per unit width | ε | Strain |
| q′(λ) | Gas flow per unit width after correction of tortuosity | α | Friction angle |
| ρ | Gas density | f | Friction coefficient |
| g | Acceleration of gravity | μ | Poisson’s ratio |
| µ | Kinematic viscosity coefficient of gas | Cε | Strain similarity ratio |
| ΔP | Gas pressure gradient | Cα | Friction angle similarity ratio |
| τ | Fissure tortuosity | Cf | Friction coefficient similarity ratio |
| Q | Total seepage flow in the fracture network | Cu | Poisson’s ratio similarity ratio |
| K | Permeability coefficient | CE | Elastic modulus similarity ratio |
| Kbh | Gas permeability around the borehole | Ct | Time similarity ratio |
| Qbh | Drainage flow rate of the borehole |
References
- Luo, Z.M.; Hao, Q.Q.; Wang, T.; Li, R.K.; Cheng, F.M.; Deng, J. Experimental study on the deflagration characteristics of methane-ethane mixtures in a closed duct. Fuel 2020, 259, 116295. [Google Scholar] [CrossRef]
- Sa, Z.; Liu, J.; Li, J.; Zhang, Y. Research on effect of gas pressure in the development process of gassy coal extrusion. Saf. Sci. 2019, 115, 28–35. [Google Scholar] [CrossRef]
- He, Z.; Wu, Q.; Wen, L.; Fu, G. A process mining approach to improve emergency rescue processes of fatal gas explosion accidents in Chinese coal mines. Saf. Sci. 2018, 111, 154–166. [Google Scholar] [CrossRef]
- Guo, X.; Li, Y.; Zhou, G.; He, Z.; Xu, Y. Stability Analysis and Reasonable Layout of Floor Drainage Roadway above Confined Water and under Mining Influence. Geofluids 2021, 2021, 5578717. [Google Scholar] [CrossRef]
- Zou, Q.; Liu, H.; Cheng, Z.; Zhang, T.; Lin, B. Effect of Slot Inclination Angle and Borehole-Slot Ratio on Mechanical Property of Pre-cracked Coal: Implications for ECBM Recovery Using Hydraulic Slotting. Nat. Resour. Res. 2020, 29, 1705–1729. [Google Scholar] [CrossRef]
- Zhao, P.; Zhuo, R.; Li, S.; Shu, C.-M.; Laiwang, B.; Jia, Y.; Shi, Y.; Suo, L. Analysis of advancing speed effect in gas safety extraction channels and pressure-relief gas extraction. Fuel 2020, 265, 116825. [Google Scholar] [CrossRef]
- Zhang, C.; Tu, S.H.; Zhao, Y.X. Compaction characteristics of the caving zone in a longwall goaf: A review. Environ. Earth Sci. 2019, 78, 27. [Google Scholar] [CrossRef]
- Zhou, F.B.; Xia, T.Q.; Wang, X.X.; Zhang, Y.F.; Sun, Y.N.; Liu, J.S. Recent developments in coal mine methane extraction and utilization in China: A review. J. Nat. Gas Sci. Eng. 2016, 31, 437–458. [Google Scholar] [CrossRef]
- Changbao, J.; Xiaodong, L.; Wensong, W.; Wenhui, W.; Minke, D. Three-dimensional visualization of the evolution of pores and fractures in reservoir rocks under triaxial stress. Powder Technol. 2021, 378, 585–592. [Google Scholar]
- Mark, C. Coal bursts that occur during development: A rock mechanics enigma. Int. J. Min. Ence Technol. 2017, 28, 35–42. [Google Scholar] [CrossRef]
- Warmuzinski, K. Harnessing methane emissions from coal mining. Process Saf. Environ. Prot. 2008, 86, 315–320. [Google Scholar] [CrossRef]
- Karacan, C.O.; Esterhuizen, G.S.; Schatzel, S.J.; Diamond, W.P. Reservoir simulation-based modeling for characterizing longwall methane emissions and gob gas venthole production. Int. J. Coal Geol. 2007, 71, 225–245. [Google Scholar] [CrossRef]
- Jun, L.; Changbao, J.; Zhuo, J.; Wensong, W.; Wanjun, Z.; Huan, Y. Three-dimensional physical model experiment of mining-induced deformation and failure characteristics of roof and floor in deep underground coal seams. Process Saf. Environ. Prot. 2021, 150, 400–415. [Google Scholar]
- Du, F.; Wang, K.; Zhang, X.; Xin, C.; Wang, G. Experimental Study of Coal-Gas Outburst: Insights from Coal-Rock Structure, Gas Pressure and Adsorptivity. Nat. Resour. Res. 2020, 29, 2481–2493. [Google Scholar] [CrossRef]
- Hu, G.; Xu, J.; Ren, T.; Gu, C.; Qin, W.; Wang, Z. Adjacent seam pressure-relief gas drainage technique based on ground movement for initial mining phase of longwall face. Int. J. Rock Mech. Min. Sci. 2015, 77, 237–245. [Google Scholar] [CrossRef]
- Guo, W.; Zhao, G.; Lou, G.; Wang, S. A New Method of Predicting the Height of the Fractured Water-Conducting Zone Due to High-Intensity Longwall Coal Mining in China. Rock Mech. Rock Eng. 2019, 52, 2789–2802. [Google Scholar] [CrossRef]
- Nazife, E. Microstructural investigation of subcritical crack propagation and Fracture Process Zone (FPZ) by the reduction of rock fracture toughness under cyclic loading. Eng. Geol. 2016, 208, 181–190. [Google Scholar]
- Wang, G.; Wu, M.M.; Wang, R.; Xu, H.; Song, X. Height of the mining-induced fractured zone above a coal face. Eng. Geol. 2017, 216, 140–152. [Google Scholar] [CrossRef]
- Wang, G.; Huang, W.; Sun, L.; Wu, M.; Zhang, X. High Drilling Methane Drainage in Fracturing Zones Formed by Water Injection into Boreholes. Arch. Min. Ences 2016, 61, 137–156. [Google Scholar] [CrossRef] [Green Version]
- Wang, F.; Xu, J.; Xie, J. Effects of arch structure in unconsolidated layers on fracture and failure of overlying strata. Int. J. Rock Mech. Min. Sci. 2019, 114, 141–152. [Google Scholar] [CrossRef]
- Cyrul, T. Prediction of rock and gas outburst occurrence. Eng. Geol. 1993, 33, 241–250. [Google Scholar] [CrossRef]
- Cai, J.; Zhang, Z.; Wei, W.; Guo, D.; Li, S.; Zhao, P. The critical factors for permeability-formation factor relation in reservoir rocks: Pore-throat ratio, tortuosity and connectivity. Energy 2019, 188, 116051. [Google Scholar] [CrossRef]
- Qian, M.; Xu, J. Study on the “O-shape” Circle distribution charateristics of mining-induced fractures in the overlying strata. J. China Coal Soc. 1998, 23, 466–469. [Google Scholar]
- Guo, H.; Yuan, L.; Shen, B.; Qu, Q.; Xue, J. Mining-induced strata stress changes, fractures and gas flow dynamics in multi-seam longwall mining. Int. J. Rock Mech. Min. Ences 2012, 54, 129–139. [Google Scholar] [CrossRef]
- Li, S.; Lin, H.; Zhao, P.; Xiao, P.; Pan, H. Dynamic evolution of mining fissure elliptic paraboloid zone and extraction coal and gas. J. China Coal Soc. 2014, 39, 1455–1462. [Google Scholar]
- Shu-gang, L.; Ping-wu, S.; Ming-gao, Q. Distribution features of Mining Fissure Elliptic Paraboloid Zone. Ground Press. Strat. Control 1999, 3, 44–46. [Google Scholar]
- Qu, Q.; Xu, J.; Wu, R.; Qin, W.; Hu, G. Three-zone characterisation of coupled strata and gas behaviour in multi-seam mining. Int. J. Rock Mech. Min. Sci. 2015, 78, 91–98. [Google Scholar] [CrossRef]
- Smith, J.; Ghabraie, B.; Ren, G.; Holden, L. Application of 3D laser scanner, optical transducers and digital image processing techniques in physical modelling of mining-related strata movement. Int. J. Rock Mech. Min. Sci. 2015, 100, 219–230. [Google Scholar]
- Guangming, Y.; Heping, X.; Jianfeng, Z.; Lun, Y. Fractal evolution of a crack network in overburden rock rtratum. Discret. Dyn. Nat. Soc. 2014, 5, 47–52. [Google Scholar]
- Wang, G.Y.; Yu, G.M.; Yu, Y.J.; Lu, S.B.; Kang, Y. Study on Cracks Fractal Evolution Laws of Mining Rock Mass. J. Min. Saf. Eng. 2012, 29, 859–863. [Google Scholar]
- Liu, R.; Li, B.; Jiang, Y.; Huang, N. Review: Mathematical expressions for estimating equivalent permeability of rock fracture networks. Hydrogeol. J. 2016, 24, 1623–1649. [Google Scholar] [CrossRef]
- Pointe, P.R.L. A method to characterize fracture density and connectivity through fractal geometry. Int. J. Rock Mech. Min. Ences Geomech. Abstr. 1988, 25, 421–429. [Google Scholar] [CrossRef]
- Pengxiang, Z.; Risheng, Z.; Shugang, L.; Chi-Min, S.; Yongyong, J.; Haifei, L.; Zechen, C.; Chun-Hsing, H.; Bin, L.; Peng, X. Fractal characteristics of methane migration channels in inclined coal seams. Energy 2021, 225, 120127. [Google Scholar]
- Zhao, P.X.; Zhuo, R.S.; Li, S.G.; Lin, H.F.; Shu, C.M.; Laiwang, B.; Jia, Y.Y.; Suo, L. Fractal characteristics of gas migration channels at different mining heights. Fuel 2020, 271, 117479. [Google Scholar] [CrossRef]
- Xue, D.J.; Zhou, H.W.; Wang, C.S.; Gao, H.L. Percolation model of mining-induced crack evolution of the overlying strata. J. China Univ. Min. Technol. 2013, 42, 917–922. [Google Scholar]
- Zhou, H.W.; Zhang, T.; Xue, D.J.; Xue, J.H. Evolution of mining-crack network in overburden strata of longwall face. J. China Coal Soc. 2011, 36, 1957–1962. [Google Scholar]
- Li, H.-Y.; Wang, W.-H.; Ji, Q.-X.; Zhang, L. Study on fissure development rule of overlying strata influenced by mining based on fractal theory. J. China Coal Soc. 2014, 39, 1023–1030. [Google Scholar]
- Xue, D.J.; Zhou, H.W.; Tang, X.L.; Zhao, Y.F. Evolution of mining induced enhancement and distribution of gas permeability in coal seam and surrounding rock. J. China Coal Soc. 2013, 38, 930–935. [Google Scholar]
- Yu, B. Analysis of flow in fractal porous media. Appl. Mech. Rev. 2008, 61, 050601. [Google Scholar] [CrossRef]
- Wheatcraft, S.W.; Tyler, S.W. An explanation of scale-dependent dispersivity in heterogeneous aquifers using concepts of fractal geometry. Water Resour. Res. 1988, 24, 566–578. [Google Scholar] [CrossRef]
- Si, G.; Jamnikar, S.; Lazar, J.; Shi, J.-Q.; Durucan, S.; Korre, A.; Zavšek, S. Monitoring and modelling of gas dynamics in multi-level longwall top coal caving of ultra-thick coal seams, part I: Borehole measurements and a conceptual model for gas emission zones. Int. J. Coal Geol. 2015, 144, 98–110. [Google Scholar] [CrossRef]
- Deng, J.; Liu, L.; Lei, C.; Wang, C.; Xiao, Y. Spatiotemporal distributions of the temperature and index gases during the dynamic evolution of coal spontaneous combustion. Combust. Sci. Technol. 2021, 193, 1679–1695. [Google Scholar] [CrossRef]
- Neuzil, C.; Tracy, J.V. Flow through fractures. Water Resour. Res. 1981, 17, 191–199. [Google Scholar] [CrossRef]
- Klimczak, C.; Schultz, R.A.; Parashar, R.; Reeves, D.M. Cubic law with aperture-length correlation: Implications for network scale fluid flow. Hydrogeol. J. 2010, 18, 851–862. [Google Scholar] [CrossRef]


Publisher’s Note: MDPI stays neutral with regard to jurisdictional claims in published maps and institutional affiliations. |
© 2021 by the authors. Licensee MDPI, Basel, Switzerland. This article is an open access article distributed under the terms and conditions of the Creative Commons Attribution (CC BY) license (https://creativecommons.org/licenses/by/4.0/).