1. Introduction
Energy harvesting has become an important issue as IoT based low power devices are being used for many different applications. Energy harvesting is particularly important for charging the small batteries used for mobile and wearable devices. Researchers investigated the energy harvesting issue from many different perspectives and different techniques have been proposed [
1,
2,
3,
4,
5]. The energy sources include temperature, photo voltaic and RF electromagnetic waves, sound and vibration, etc. Fringing electric field from power lines as a possible source of energy harvesting is a topic of recent interest [
6,
7,
8,
9,
10]. In unsheathed power cables, there is usually significant fringing electric field that results in capacitive effect between the power line and a metal plate placed in the vicinity. The word ‘vicinity’ does not indicate any specific distance but shorter distances will couple stronger electric fields compared to more distant metal plates. The fringing electric field depends on the voltage of the power line and does not depend on the amount of current carried by the cable. Recent publications show that there have been several attempts to extract energy from fringing electric fields in power lines [
11,
12,
13,
14,
15,
16,
17,
18] using different approaches and with varying circuit arrangements. The researchers used circuit arrangements where they exploited the stray A.C. electric field from the power line to induce voltage in a metal plate and connected the circuit via a half bridge rectifier circuit to the ground at the other end. A large capacitor (~μF) is placed across one of the rectifier diodes that accumulates charge from the rectified induced voltage and gradually builds up voltage that can reach quite high value. As the actual charge accumulation is a slow process, it takes a long time (of the order of tens of minutes) to reach a reasonably high voltage (tens of volts). The reported circuit arrangements are such that they make the extraction system immobile, particularly due to the fixed ground connection. Today’s modern living is inconceivable without electricity and we are virtually immersed in fringing electric field from power lines and different electronic control circuits. So, any effective extraction technology that can harvest useful level of power from the fringing fields can make a big difference in the application of low power IoT devices. Any circuit arrangement that can get rid of the fixed ground connection can extend the application of energy harvesting from the fringing fields to mobile devices as well. This will mean that we will require less frequent charging of the batteries used in mobile phone, pacemakers or other invasive biomedical applications. This will also enhance the longevity of the batteries and can be attractive to different other biomedical applications. While harvesting power for mobile devices, the device distance from the power line will vary and a comprehensive circuit model is needed to understand and simulate the performance of the energy harvesting process. In the reported papers, such a model is absent as none of them considered the possibility of application for mobile devices.
In this paper, we have introduced a full bridge rectifier circuit arrangement so that the charging takes place in both the half cycles, making the actual energy harvesting process faster. In the research reported so far, the main difficulty in making such a mobile charging system comes from the fixed ground connection. A ground connection in such an energy harvesting system is an essential element as all the power systems have ground connections. However, a virtual ground connection is possible via capacitive coupling if we use a second plate instead of a fixed ground connection. We could find only one paper where the researchers have used a full wave bridge rectifier [
19] and presented very useful empirical results. However, there exists no circuit model that can help to visualize the effect of the circuit arrangement, its distance from the power line and the actual amount of power that can be extracted. Although the reported device does not have any fixed ground connection, the device is tightly tied to the power cable and is effectively immobile. In our proposition two plates, one placed close to the power line and the other at a larger distance from the power line were used. Without any physical contact, stray capacitance effect of these plates was exploited to obtain a current flow from the power line to the ground. Presence of stray capacitors in circuit models is reported in energy harvesting using electric fields such as piezoelectric [
20] or triboelectric nanogenerators [
21], but their analyses are not similar to the proposed one due to the difference in physical energy harvesting mechanisms. In this paper a theoretical model has been developed to give insight to the physical mechanism of energy harvesting from power lines without any fixed connection and estimate the charging time and optimum power for such a system when the distance of the plates is varied from the power line. Simulated and experimental results are presented to evaluate the performance of the proposed circuit.
2. The Proposed Scheme
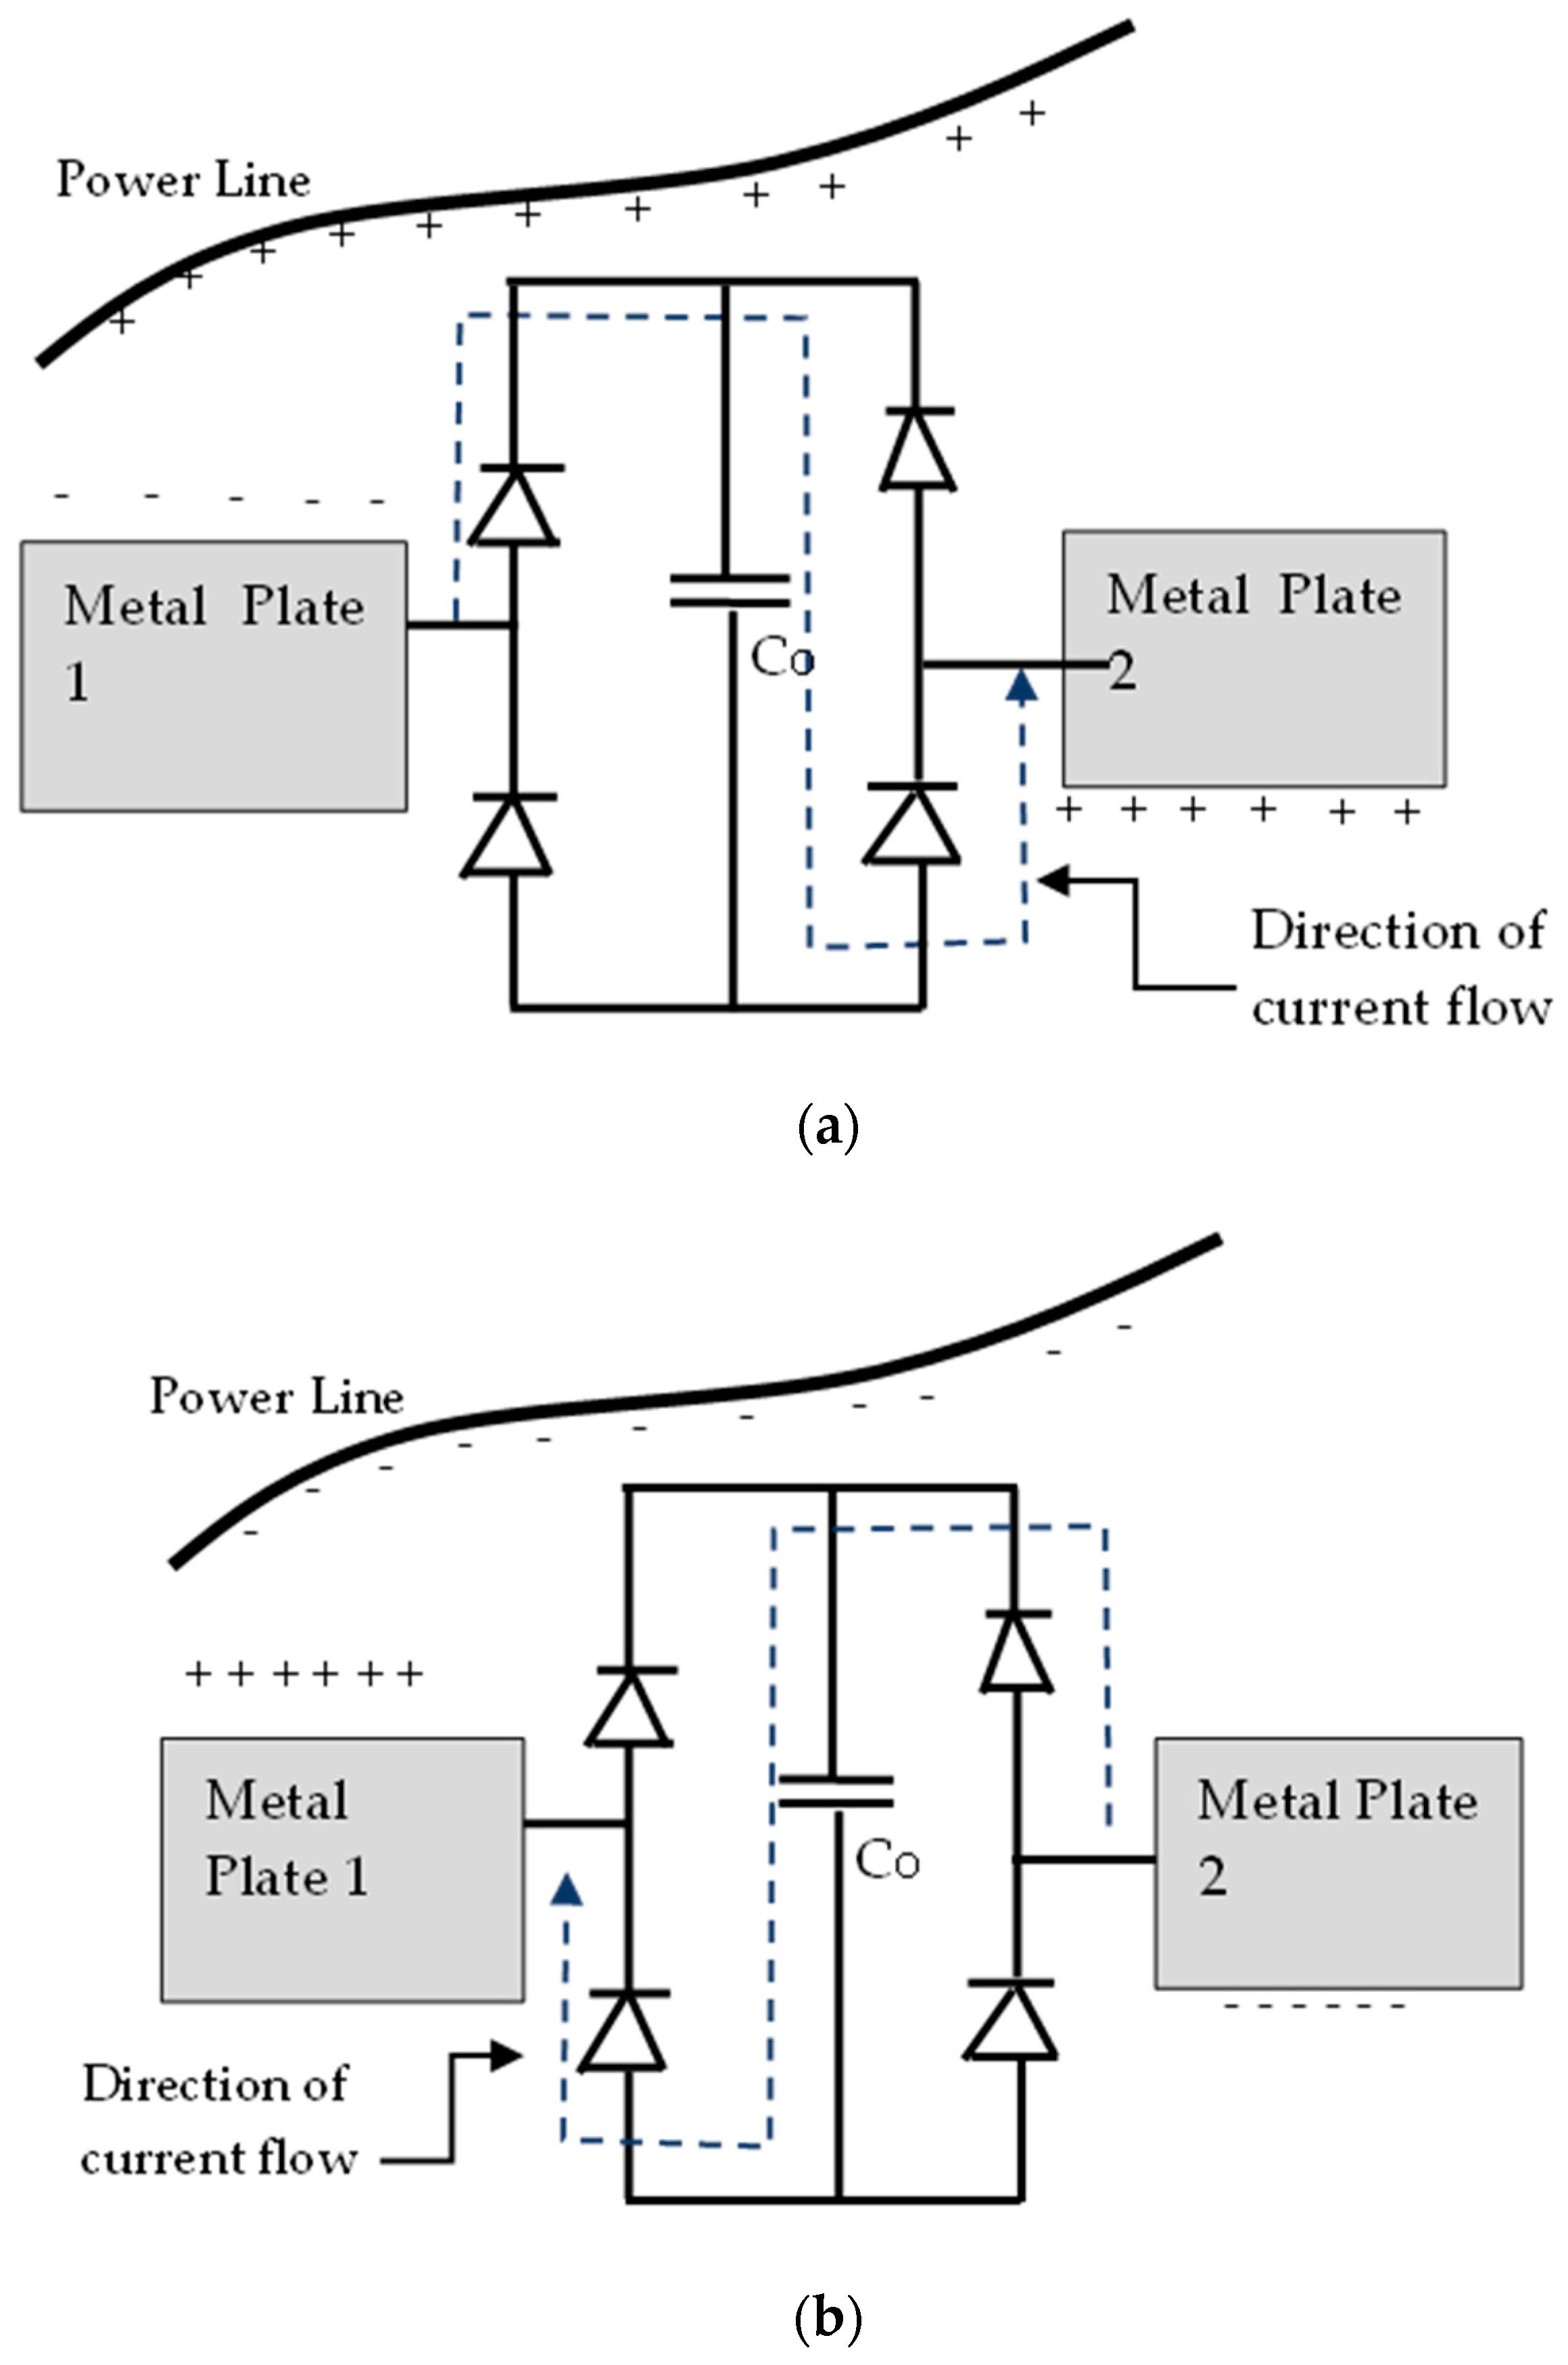
Fringing electric field near the power lines is a well understood phenomenon and there is reported research on the effects of fringing electric fields. However, living in an environment where we are always using different electrical appliances, it is virtually impossible to avoid fringing electric field while remaining in a house or an office building or an industrial installation. Any metal plate or conducting body, when placed close to a power line, will experience induced movement of charges due to the fringing electric field. In this paper, we present an attempt to harvest energy from the charge movements due to the inducing electric fields from the power line by using a simple circuit. Two metal plates are connected to a full bridge rectifier having a capacitor
placed between the +ve and −ve terminal of the bridge rectifier as shown in
Figure 1. The metal plates are placed such that one of them is close to the power line and the other is at a larger distance. So, the effect of the power line voltage is stronger on metal plate 1, as it is closer to the power line. The AC voltage in the power line continuously changes the magnitude of the electric field and it induces a charge movement in the plates that changes direction with the change in the polarity of the line voltage.
When the power line has a +ve voltage, it attracts −ve charges on the metal plate 1 and the −ve charge flows from metal plate 2 through the rectifier circuit and storing the corresponding amount of charge in . During the negative half cycle of the power line voltage, −ve charges are repelled from plate 1 and move to plate 2. So, this charge movement again passes through the rectifier circuit and stores charge in the capacitor . As this process goes on, the capacitor gradually builds up significant charge to produce a voltage across it. In the next section, an analysis is presented to show the effect of the size and distance of the plates, impact of the choice of the diodes, optimum voltage and power that can be achieved and the time required for charging the capacitor for the variation of the circuit parameters.
3. The Proposed Model
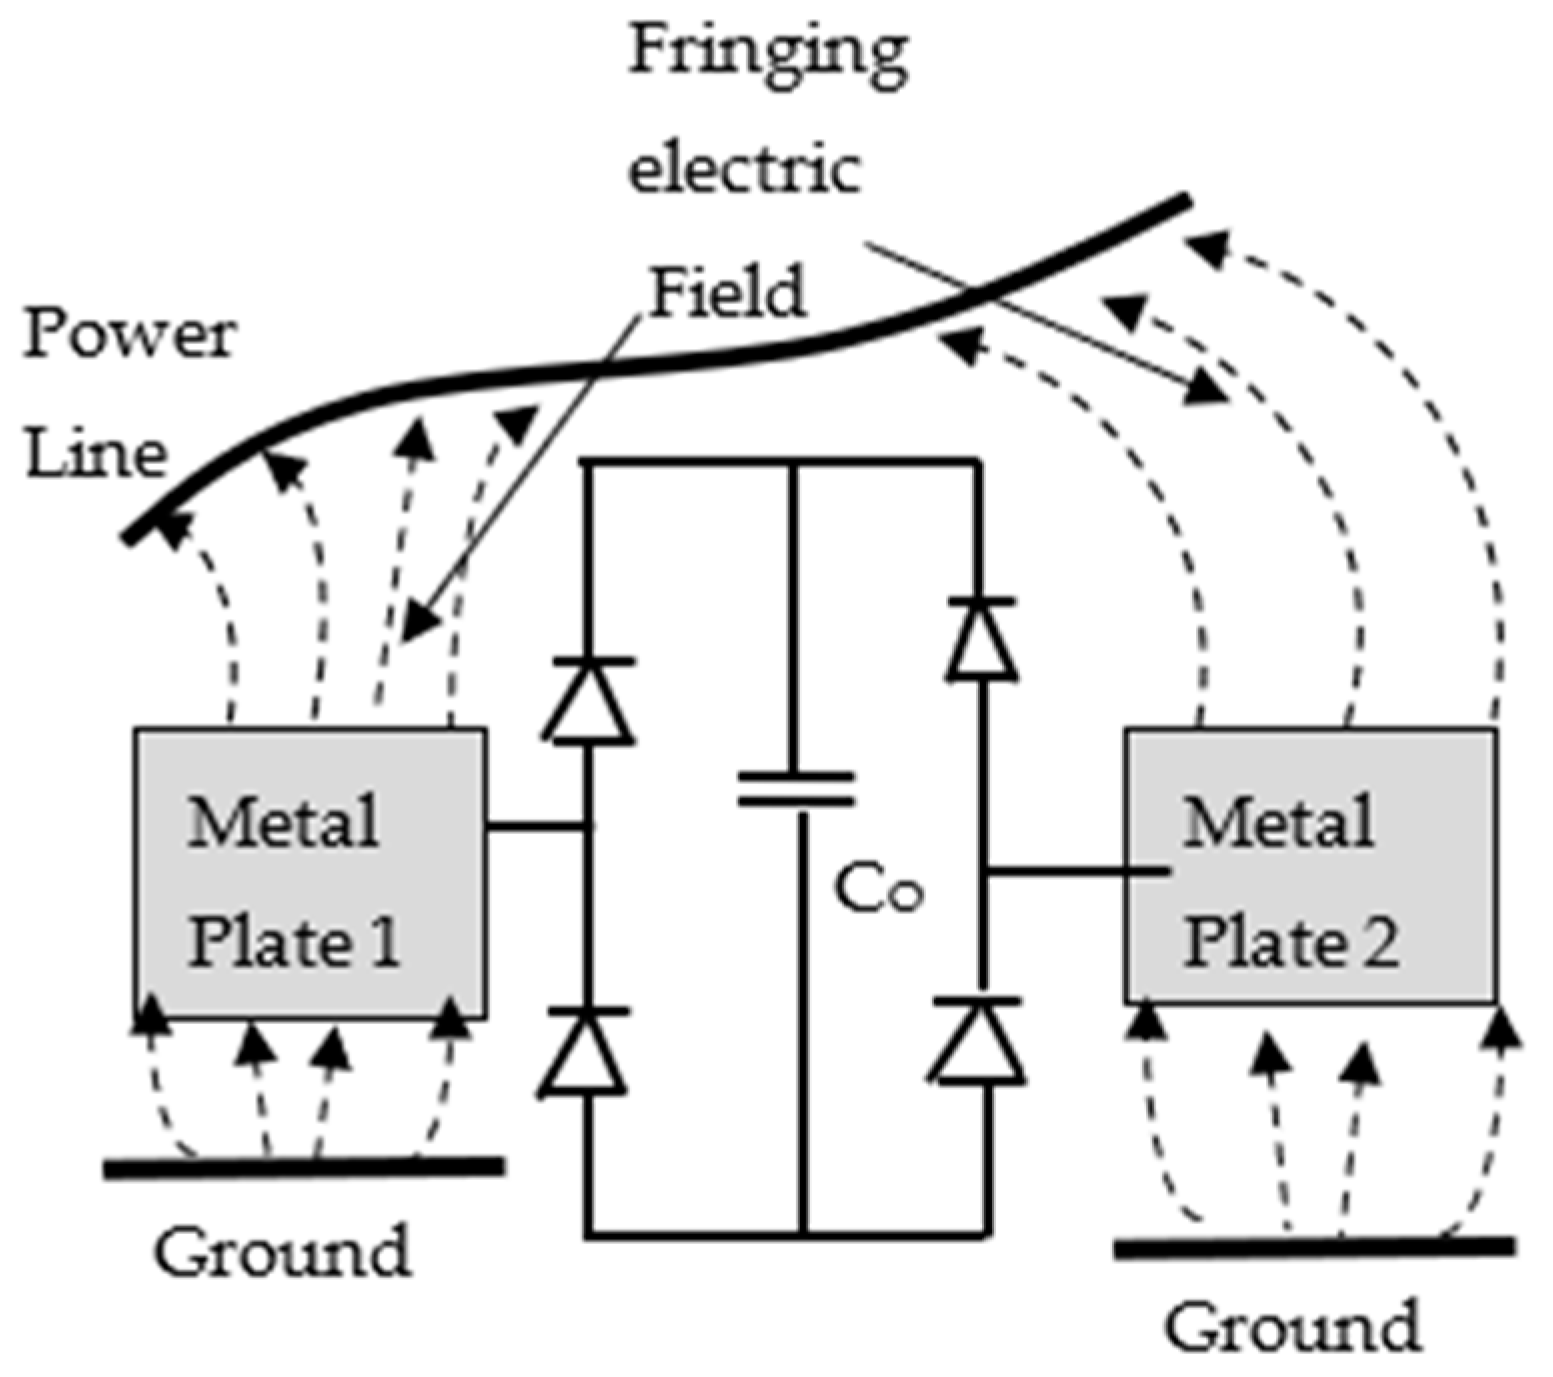
The schematic of the proposed circuit arrangement is shown in
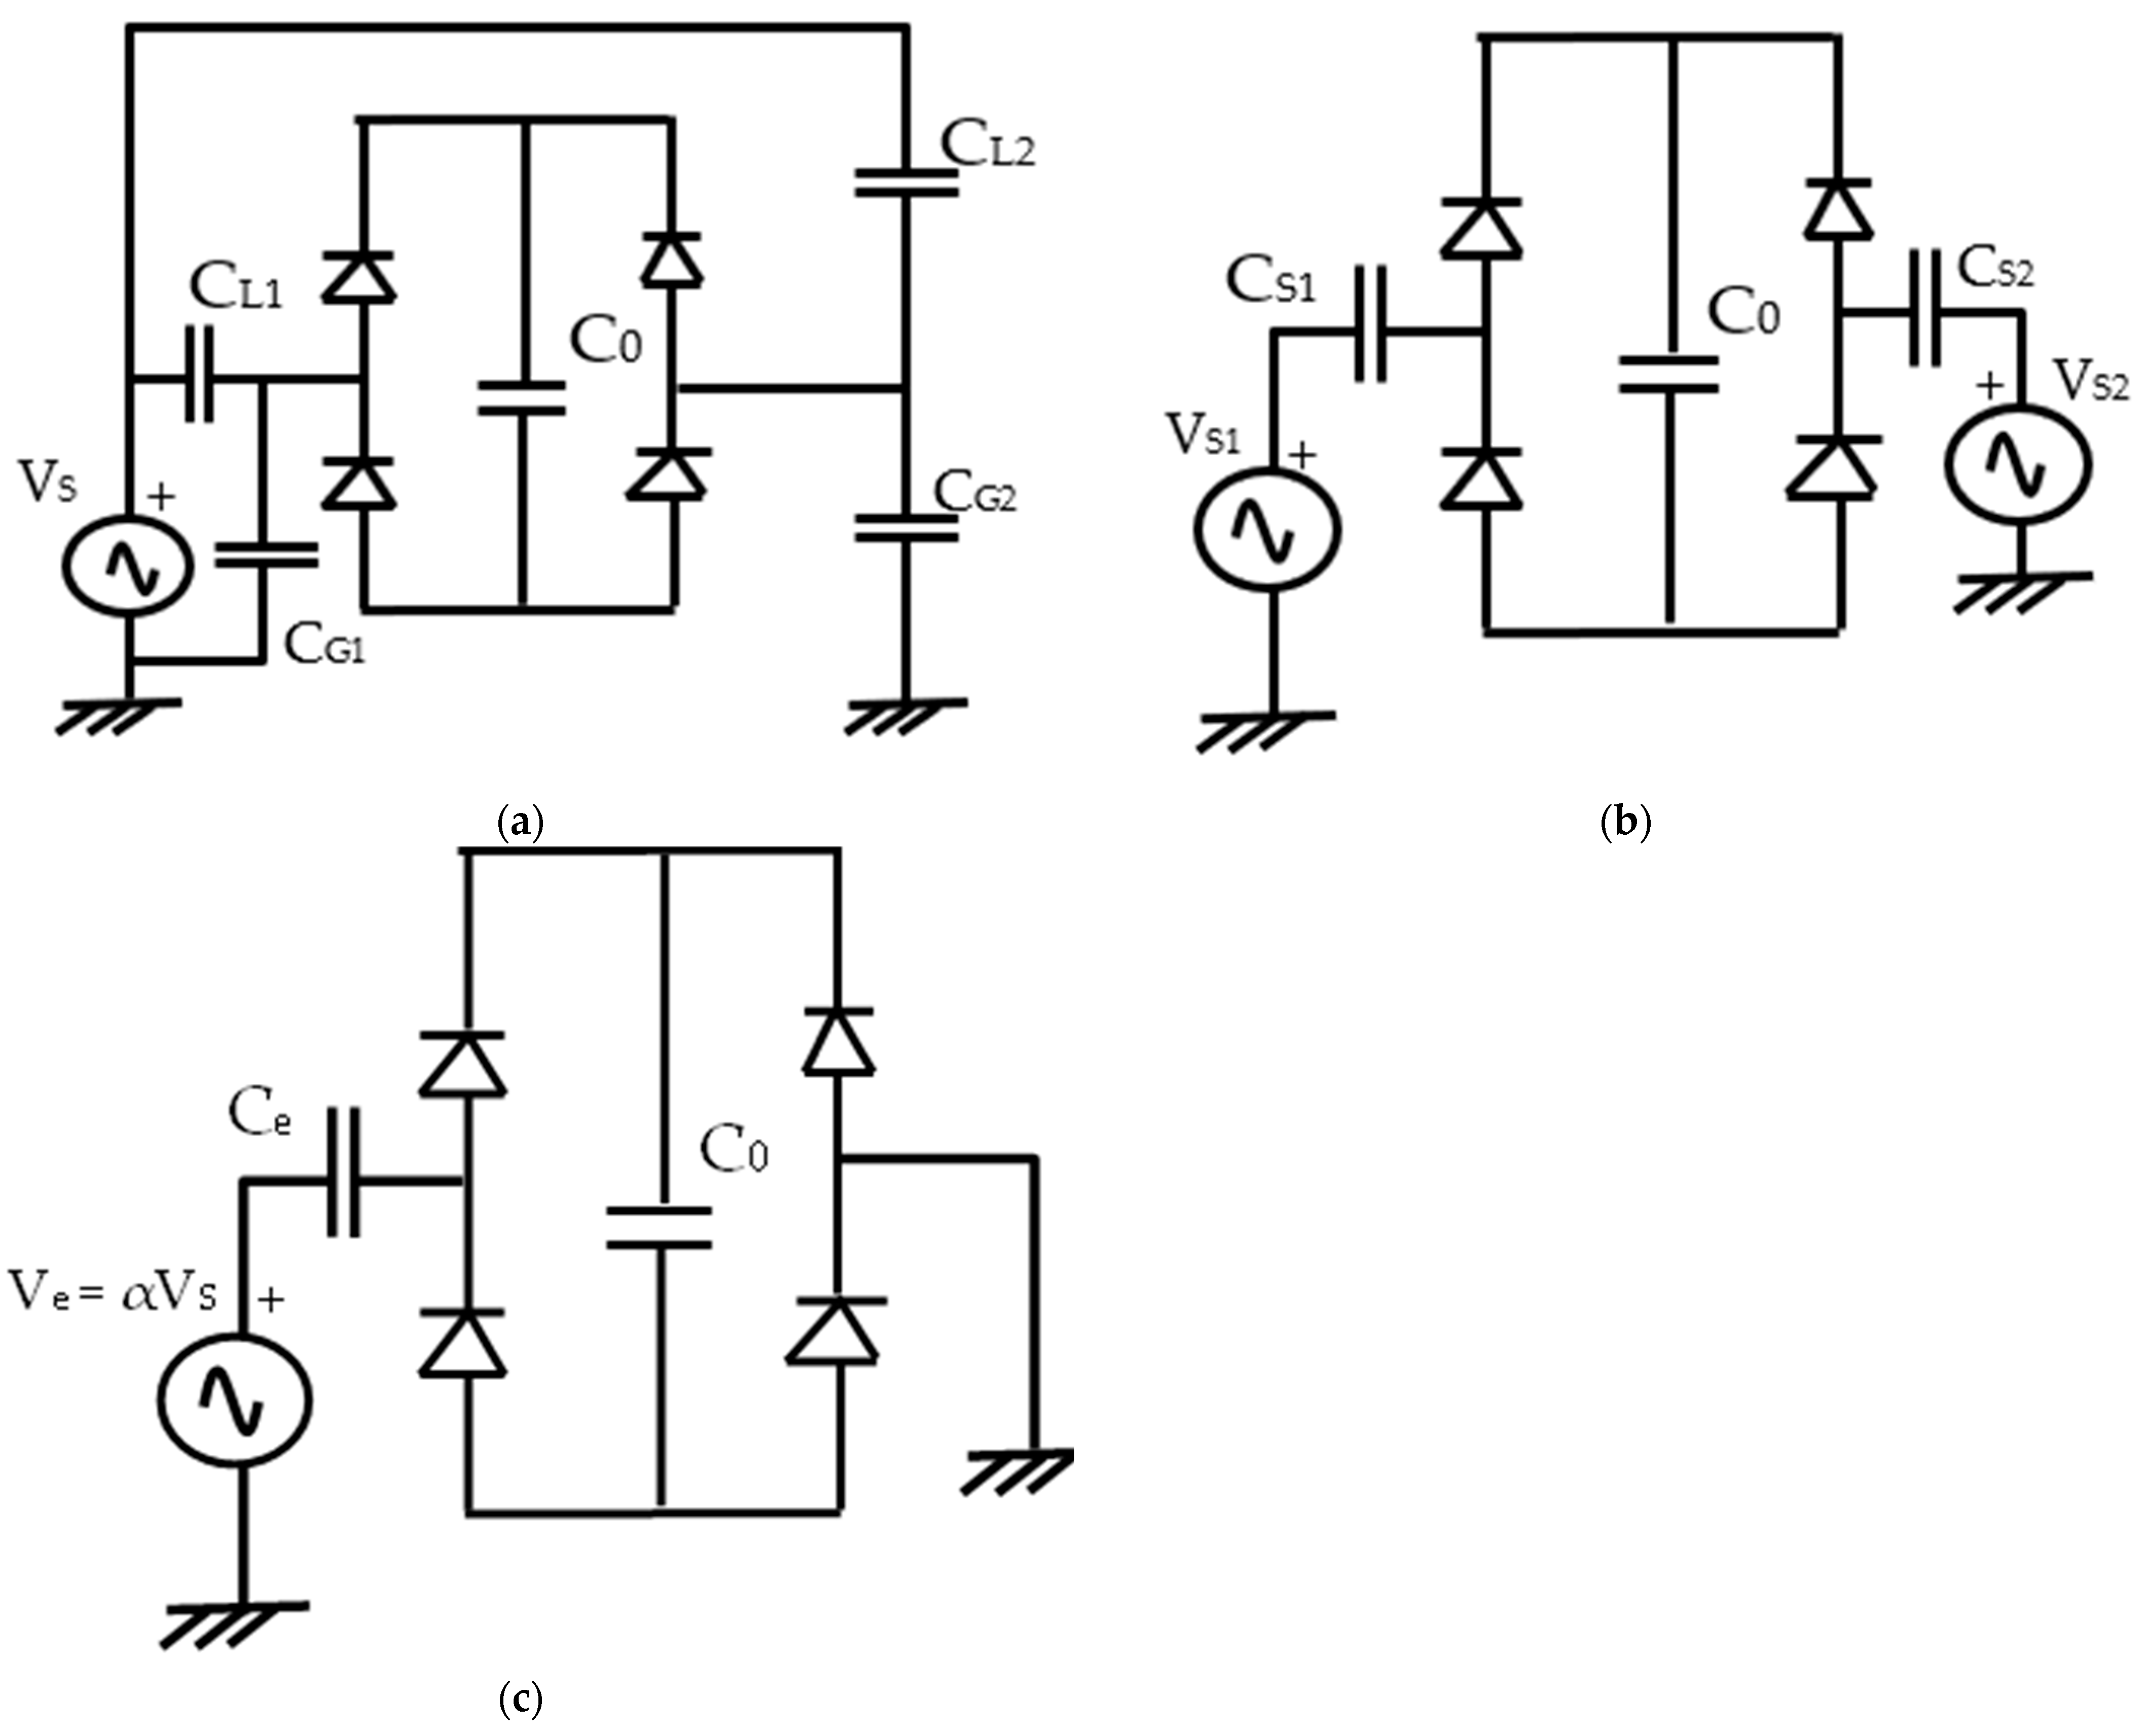
Figure 2. Two metal plates, metal plate 1 and metal plate 2, are connected to a bridge rectifier as shown in the figure. The circuit is placed close to a live power line in such a way that metal plate 1 is closer to the power line than the metal plate 2. The voltage in the power line induces fringing electric fields between the metal plates and the power line. Due to the induced charges in the metal plates, there will also be fringing field between the plates and the ground/earth. The fringing electric fields are shown by the dotted lines in the figure. The fringing electric fields can be represented as stray capacitances in a circuit representation. In
Figure 3a, vs. is the voltage of the power line and the stray capacitances between the metal plate 1 to the power line and the ground are represented by the capacitors
CL1 and
CG1, respectively.
Similarly, the stray capacitances from the metal plate 2 to the power line and the ground are
CL2 and
CG2, respectively. Using Thevenin’s theorem we can replace the metal plate 1 and metal plate 2 by two equivalent sources
VS1 and
VS2 and equivalent capacitances
CS1 and
CS2, respectively, as shown in
Figure 3b, where
where,
and
As seen in
Figure 3b,
VS1,
VS2,
CS1 and
CS2 are all in series and their series equivalent is presented in
Figure 3c where,
and
From the equivalent circuit in
Figure 3c, it is evident that the actual driving voltage for the circuit can be much less than the supply voltage vs. of the power line as, from Equations (1)–(4), we can see that both α
1 and
α2 are smaller than 1. To obtain the highest possible energy harvesting from the circuit, we need to design the plates such that (
α1 −
α2) =
α has the maximum possible value for any given circuit arrangement. This can be achieved in a number of ways such as
- (i)
Keeping the distance of the metal plate 2 from the power line larger than that of the metal plate 1, such that CL1 >> CL2.
- (ii)
Designing the metal plate 1 such that value of CL1 is larger compared to CG1.
- (iii)
Designing the metal plate 2 such that CG2 is larger than CL2.
It is important to recognize that any random change in the area of the metal plates, without considering the geometry, may not be very effective. As for example, if we use a square shaped metal plate 1, then increasing the area of the plate will increase CG1 proportionately; on the other hand the increase in CL1 may not increase linearly with the area of the square plate due to the reason that the capacitance between a line and a square plate does not change in proportion to the area. If we design the metal plate 1 in a rectangular fashion such that its width is small and the length of the plate is along the power line then the we can obtain much higher value of CL1 compared to a square plate of same area. It will be a similar the case with metal plate 2. However, in a mobile device keeping such an alignment may not be easy.
As the actual power harvested in this circuit is not expected to be high, it is very important to operate the circuit as its maximum power point voltage. Please refer to
Figure 3c for the theoretical analysis presented below. The capacitor
stores the harvested energy and the input power to the capacitor is determined by the expression
where
is the voltage across the capacitor
and
is the average current flowing into it. Ignoring the voltage drop across the forward biased diodes and their internal resistances, let the voltage across the stray capacitor
be
at the instant when the input AC voltage αV
S is at its positive peak value
. At this point, the voltage
can be expressed
So, the corresponding charge stored in the capacitor
is given by
In the next half cycle, the input voltage reaches its negative peak to −
. Assuming that any change in the voltage across the capacitor
is very small (as
>>
) during this half cycle,
VO can be considered to remain the same and the charge in the capacitor
will be
As seen from Equations (9) and (10), the charge in the capacitor
Ce changes from
QCe to
−QCe over a time period of
T/2,
T being the time period of the AC supply, and hence the charge pumped to the capacitor
by the stray capacitance
is
This produces an average charging current of
The Equation (12) is obtained by putting the values of
from Equation (11) and
from Equation (9). However, the capacitor
is continuously drained due the leakage current from the diodes, assuming that there is no leakage from the capacitor plates. This leakage current is the reverse saturation current of the diodes and can be considered constant so long as the
is more than a few hundred millivolts (Sze, 1987) [
22]. If
is the total reverse saturation current due to the diodes, then the net charging current for the capacitor
is
Hence, the power P Equation (7) for the capacitor
can be written as
To find out the optimum power point for the capacitor
with respect to the voltage
we put zero for the first derivative of
with respect to
, i.e.,
Solving Equation (15) for
we come up with the optimum voltage
=
for maximum power point
As
Ce << C0, the charging process is a very slow one and it is expected to take significant time to reach the optimum power point. To estimate the time requirement, using Equation (13) we can write
where, the 1st term represents the charging current as given in Equation (13) and the second term is the discharging current due reverse saturation current of the diodes. This is a simple 1st order linear differential equation and we can solve it to get the solution as given below
From Equation (18), it is possible to find the time required to reach the optimum voltage Vom (using Equation (16)).
The analysis presented above give us an idea how much power can be harvested corresponding to a certain design of the harvesting device. It also gives the preliminary analytical framework to estimate the amount of extracted power that can be achieved if the device is mobile and changes its distance and orientation with respect to the power line. In other energy harvesting designs like piezoelectric based devices [
20] or triboelectric harvesters [
21], the device parameters remain approximately fixed once the device is fabricated. So, it is possible to make an analysis for optimum power harvesting from a given source for such devices. However, in the case of power extraction from the fringing electric field the circuit parameter like the stray capacitors vary with location which make it effectively impossible to achieve any unique optimum power extraction solution. Theoretically, using very large plates with one of the plates very close to the power line and the other at a very large distance would produce the best possible results. However, energy harvesting devices have limitations of size and distance between the plates. So, further research will be required to design the size, shape and the placement of the plates relative to each other to achieve the optimum solution for a given volume of the device. Our presented model will be equally useful towards such an effort.
4. Simulation
Using the analytical model presented in
Section 3, we simulated the voltage development in the capacitor
C0 for different values of
Ce, and reverse saturation current of the diodes. As shown in Equations (1), (2), and (5), the value of α depends on the ratios of capacitors
CL1,
CL2,
CG1 and
CG2 and not on their actual values. So, in the simulations, we assumed
Ce (
Figure 3c) and α as independent parameters to observe the effect of distance of the plates from the live power line. The voltage in the power line was 220 VAC 50 Hz, which correspond to a peak voltage of 310 V. The reverse saturation current of power diodes (having high reverse voltage) varies widely from fraction of micro ampere to tens of microamperes depending on the voltage and current rating of the diodes. A high current rating diode effectively has a larger junction area and the corresponding reverse saturation current is also high. In our experimental measurements (results are presented in
Section 5) we observed that reasonably high voltage can be achieved with small current rating diodes like 1N4007, but the voltage developed reduces significantly when larger current capacity diodes are used. In our simulation, we used Equation (18) and the values of reverse saturation current
Ir to be a fraction of micro ampere (tens of nano amperes). The value of
C0 (
Figure 3) used in the simulation is 1.2 μF which was the value we used in the experiment (
Section 5). A larger value of
Co takes longer time for the voltage to develop and a smaller value has the risk of rapid fall in the voltage when the measuring equipment (the usual internal impedance of the voltmeters is 10 MΩ) is connected to measure the voltage. In the experimental results, given in the next section, we observed a development of 50–60 V over a time span of 30 min. In our simulation, we chose our values of
Ce and α to produce values close to the measured results so that we could see the effect of variation of the parameters on the voltage developed and power extracted in capacitor
C0. We accept our limitation that our laboratory does not have the facilities to measure very small values of stray capacitance.
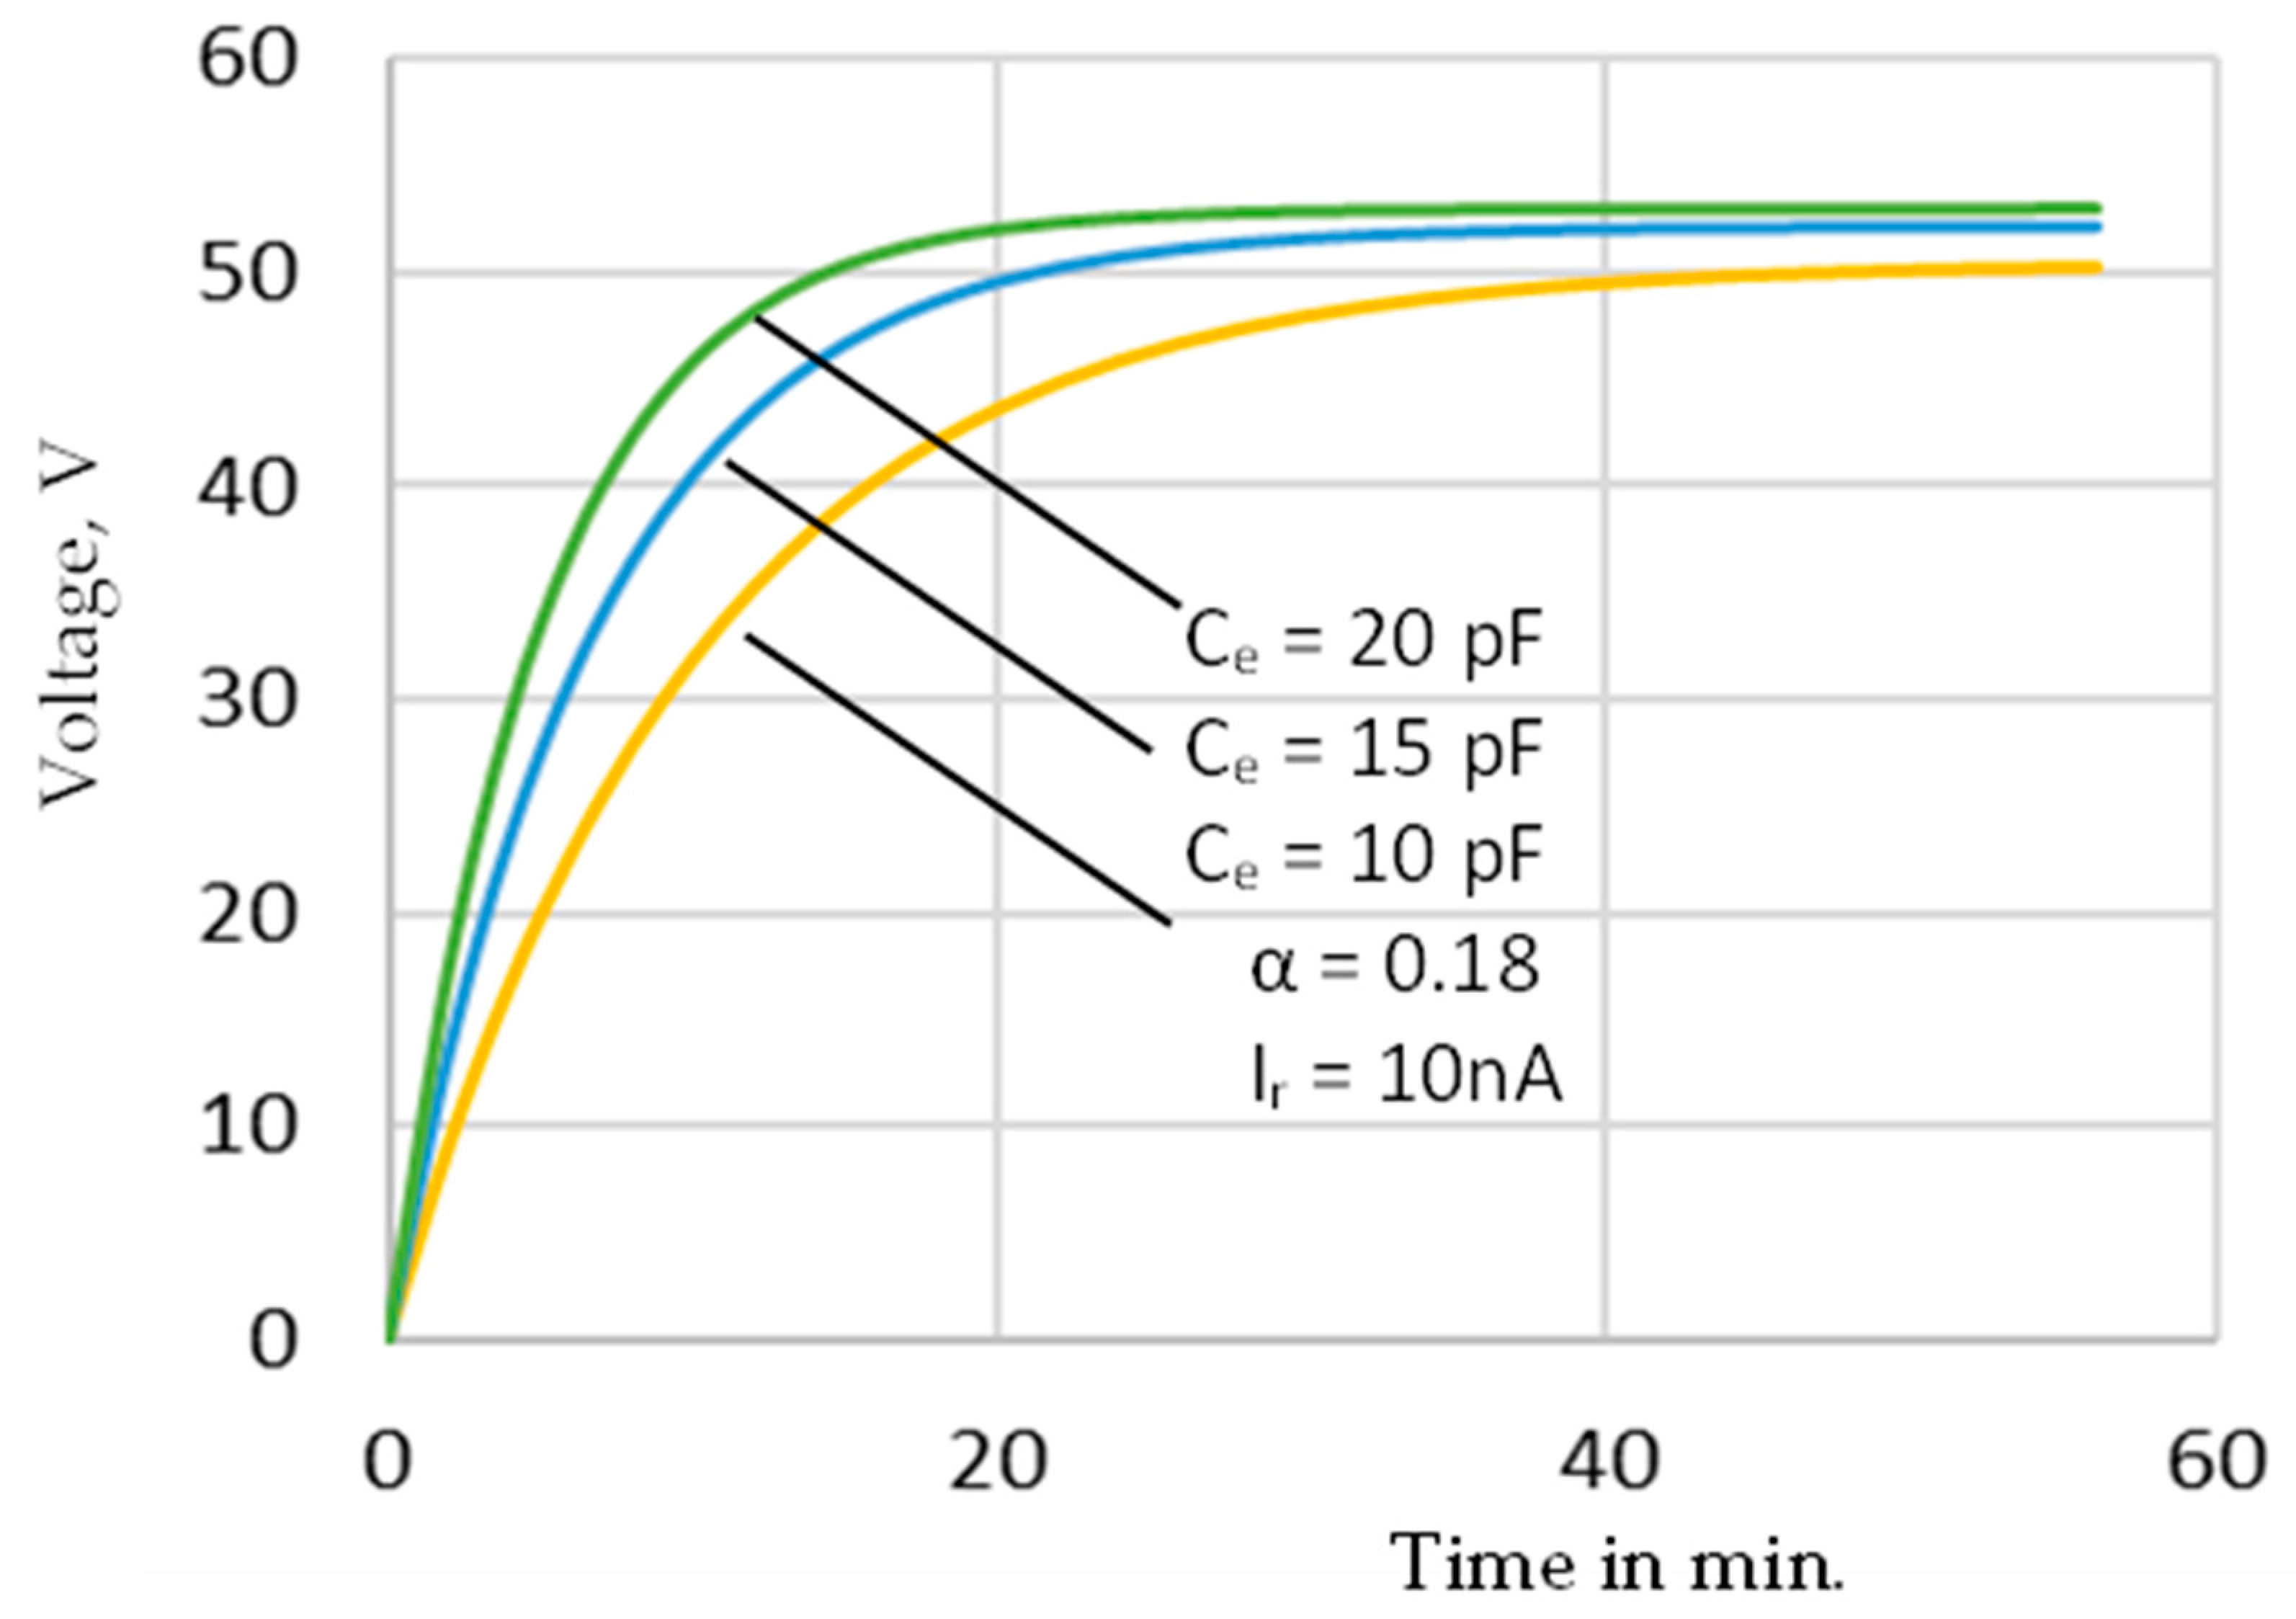
The voltage developed in the capacitor
C0 is shown in
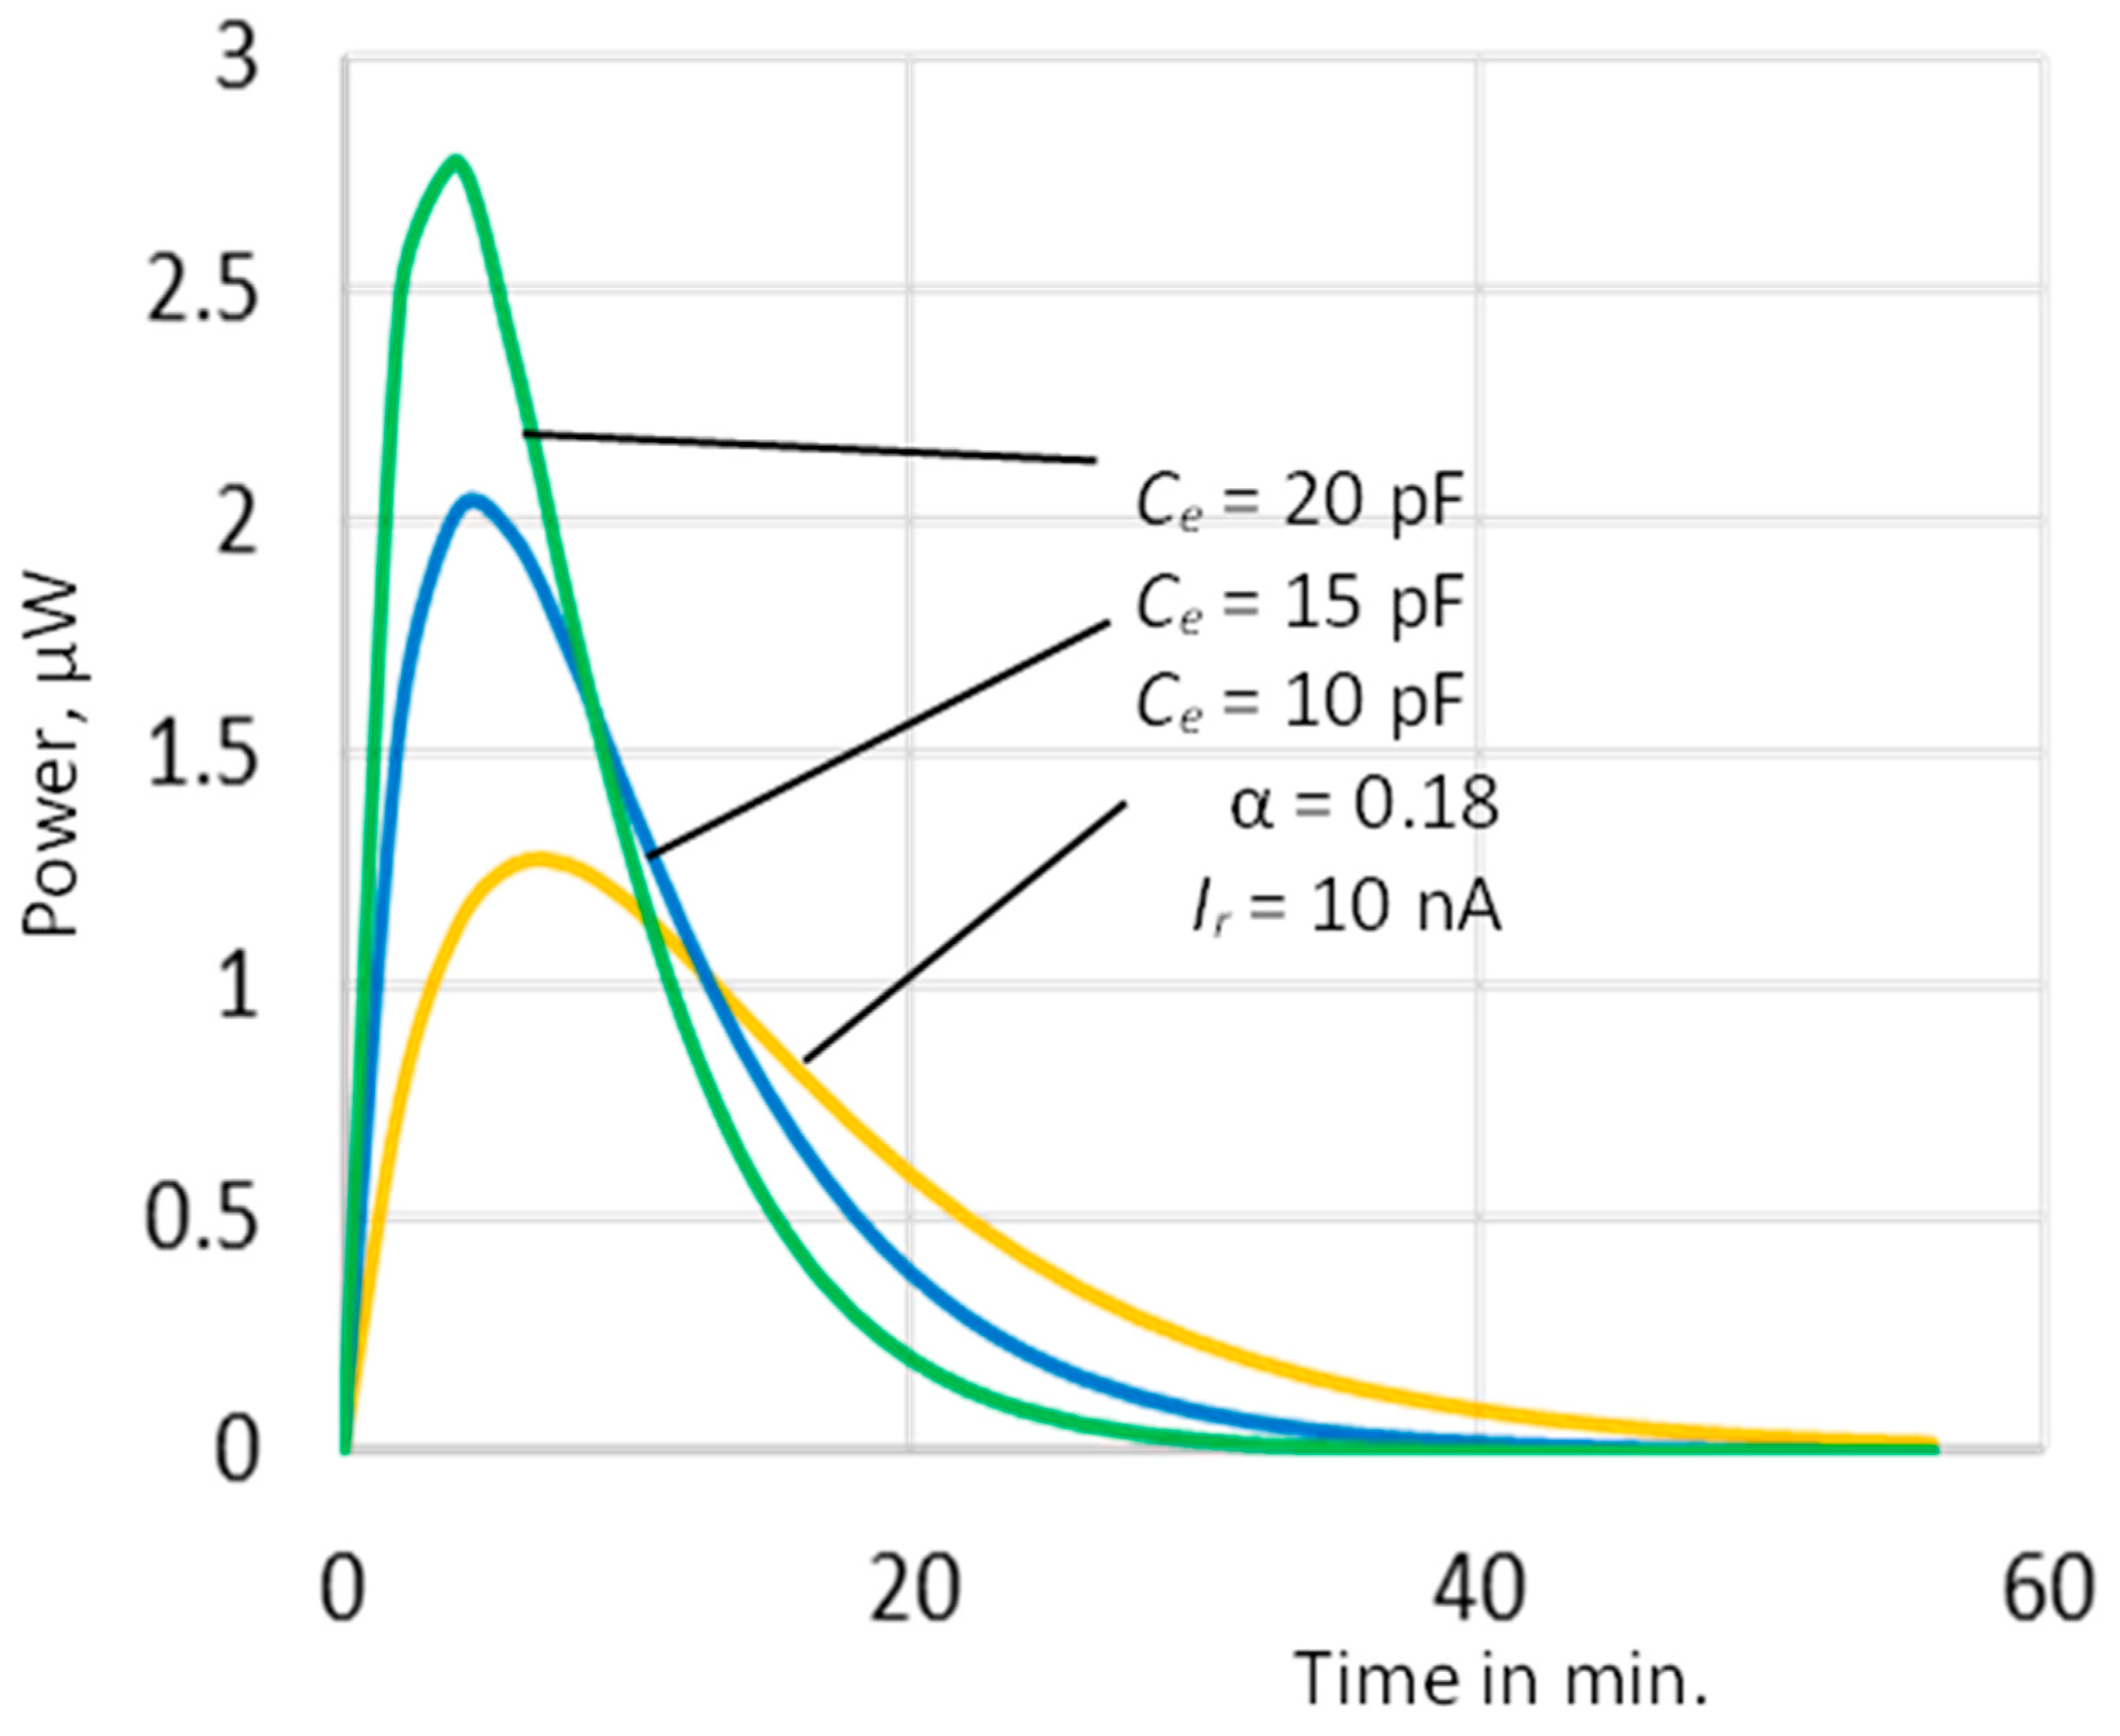
Figure 4. The values used to calculate the results are also mentioned in the figure. The curves shown in the figure are for three different values of
Ce and it is an expected outcome that higher values of
Ce will develop more voltage at a faster rate as this is the effective coupling capacitor with the source. The capacitors for the simulation are chosen such that they represent the realistic values for the given dimension of the metal plates.
Figure 5 shows the power variation in the capacitor
C0. When the voltage across
C0 is low, the current is higher. The current reduces gradually as the voltage buildup. The power at the optimum point comes out to be of the order of microwatt and is presented for three different values of capacitor
Ce.
The voltage developed in the capacitor
C0 is shown in
Figure 4. The values used to calculate the results are also mentioned in the figure. The curves shown in the figure are for three different values of
Ce and it is an expected outcome that higher values of
Ce will develop more voltage at a faster rate as this is the effective coupling capacitor with the source. The capacitors for the simulation are chosen such that they represent the realistic values for the given dimension of the metal plates.
Figure 5 shows the power variation in the capacitor
C0. When the voltage across
C0 is low, the current is higher. The current reduces gradually as the voltage builds up. The power at the optimum point comes out to be of the order of microwatt and is presented for three different values of capacitor
Ce.
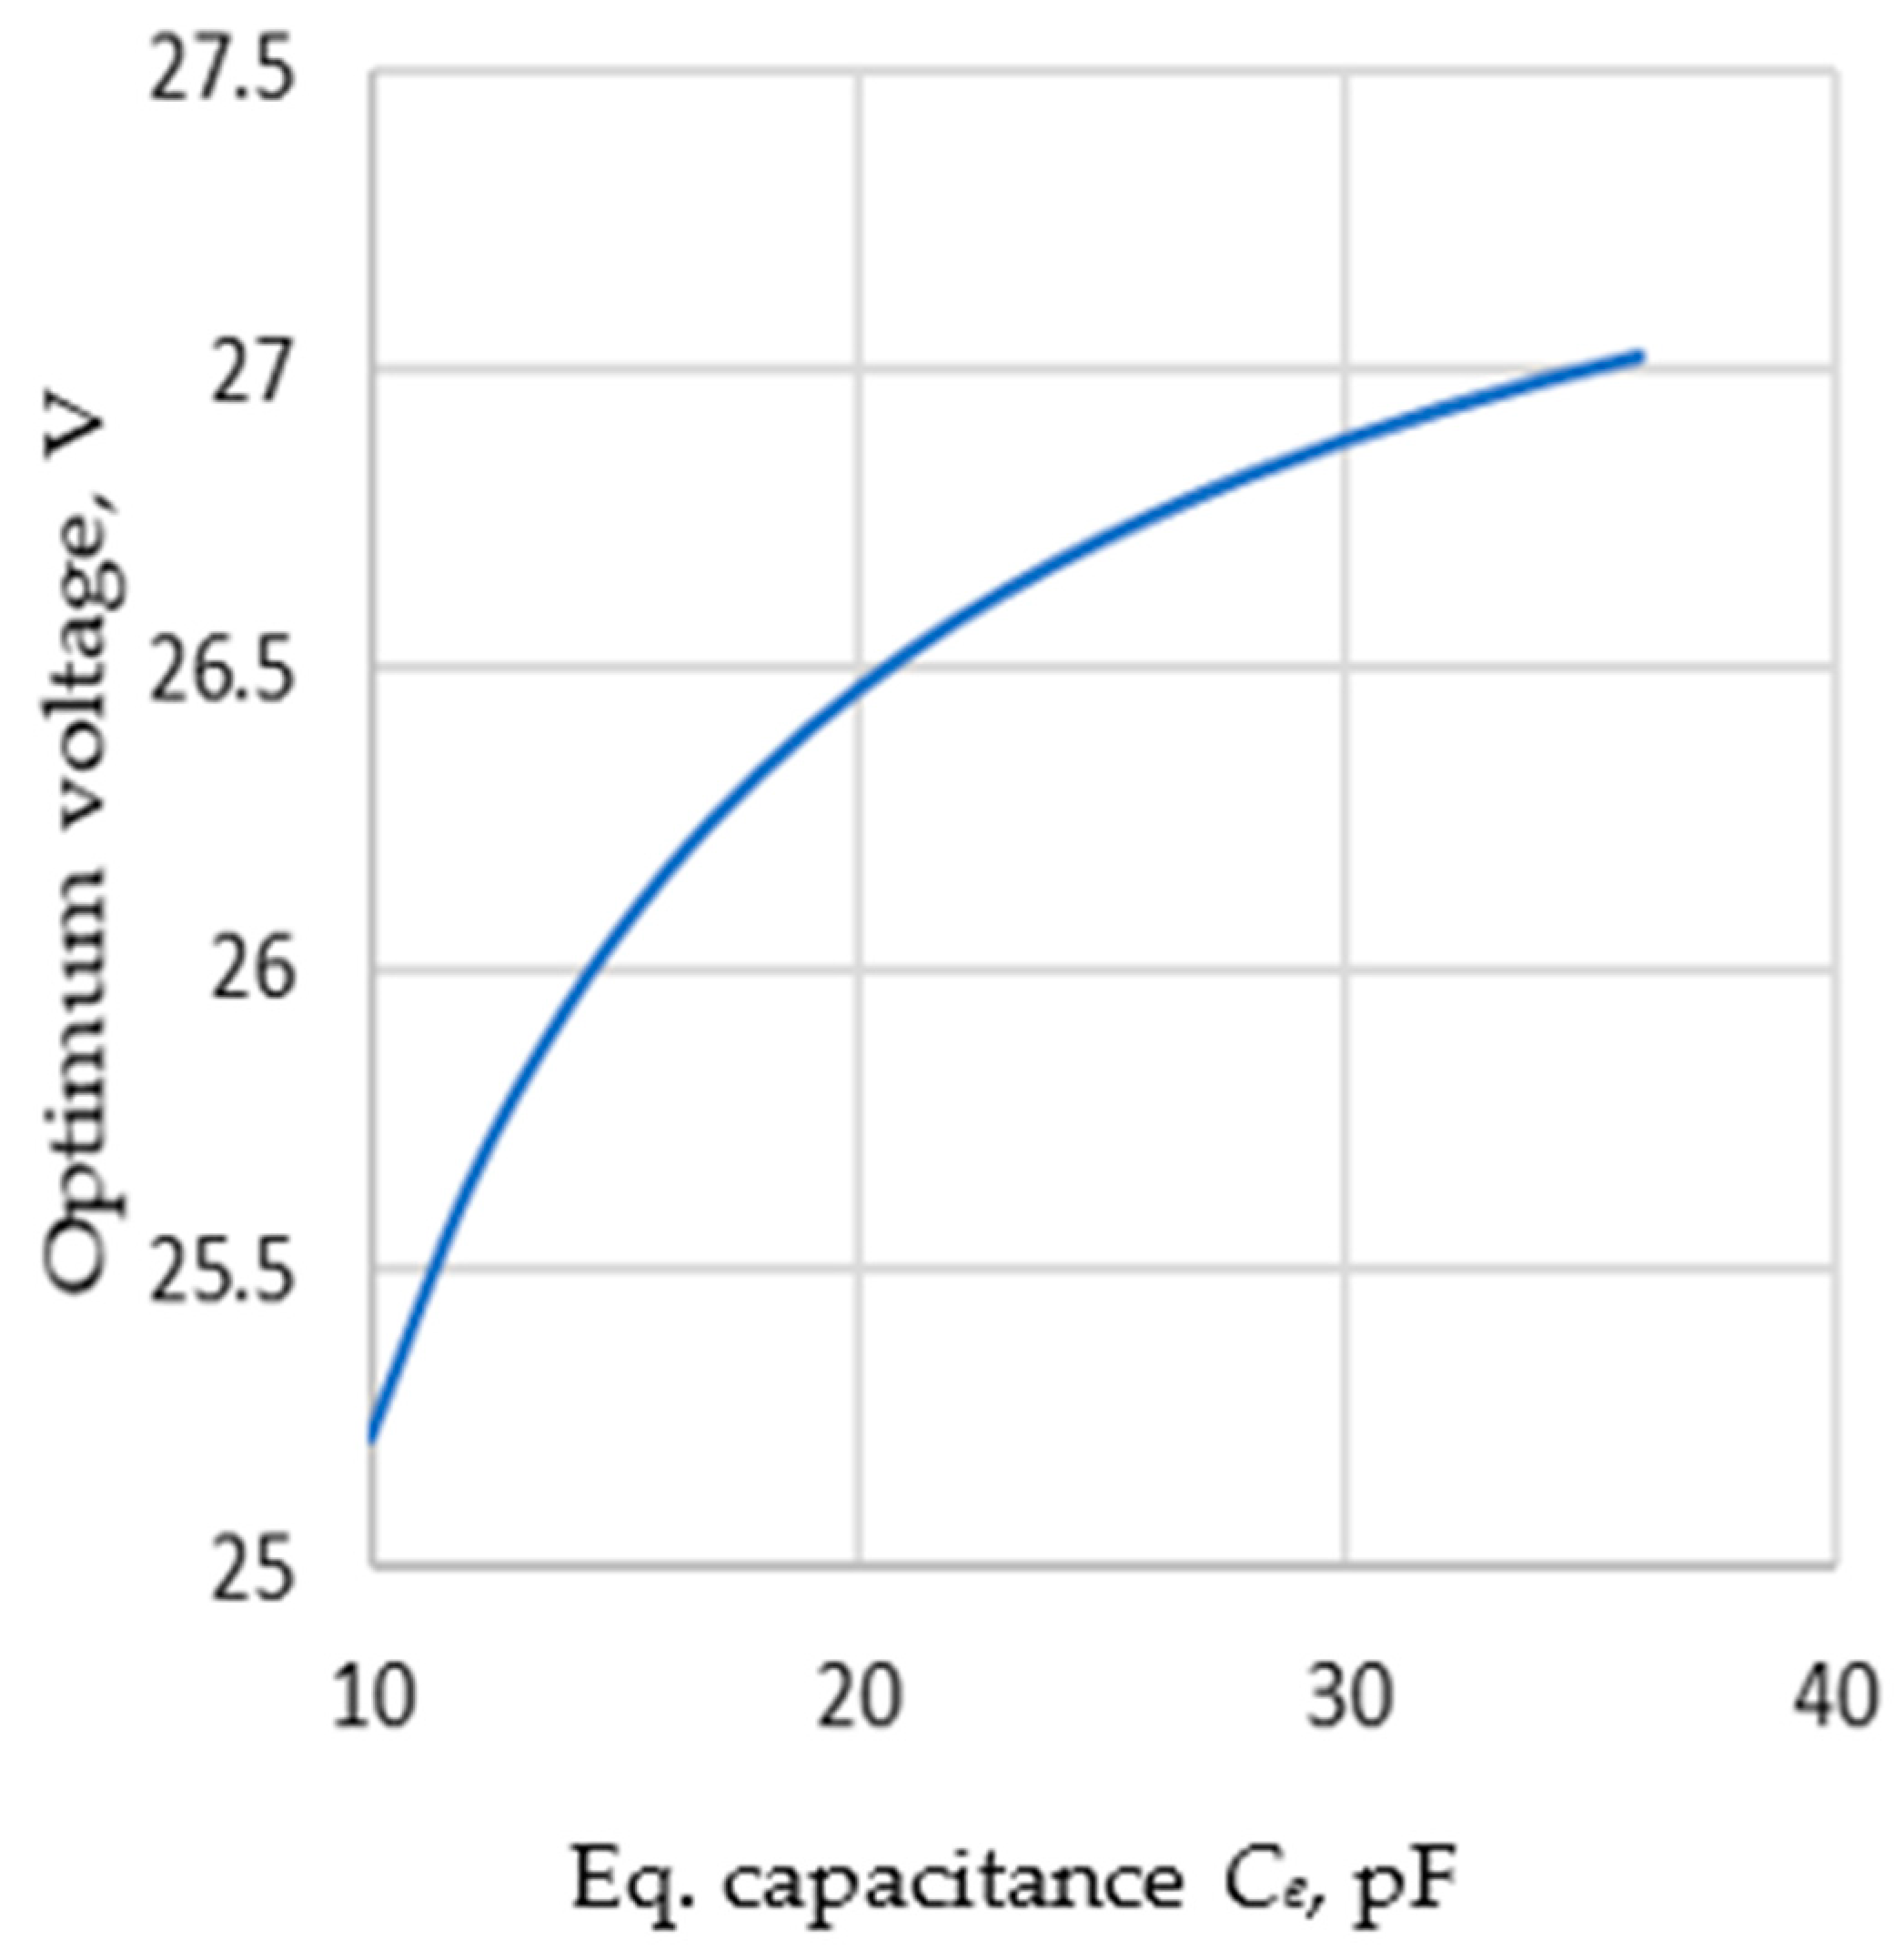
In
Figure 6 the simulated results for the optimum voltage (voltage for maximum power) with the variation of the capacitance
Ce are presented for a given value of
Ir and α. Higher values of capacitor effectively means a higher degree of coupling from the electric field of the power line and we expect to get higher current in the circuit. This makes the value of the optimum voltage higher. If we consider
Figure 5, it is clear that the circuit reaches the maximum power point quicker for higher values of
Ce. In
Figure 6, we show the simulated results due to the variation of optimum voltage for different values of
Ce. The expression for optimum voltage
Vom, as given in Equation (16) shows that the term containing
1/Ce has a negative coefficient and the trend of the graph in
Figure 6 is an expected one. Although we have used the same value of α for all the different values of
Ce, we expect the value of α to change with the change in the value of
Ce.
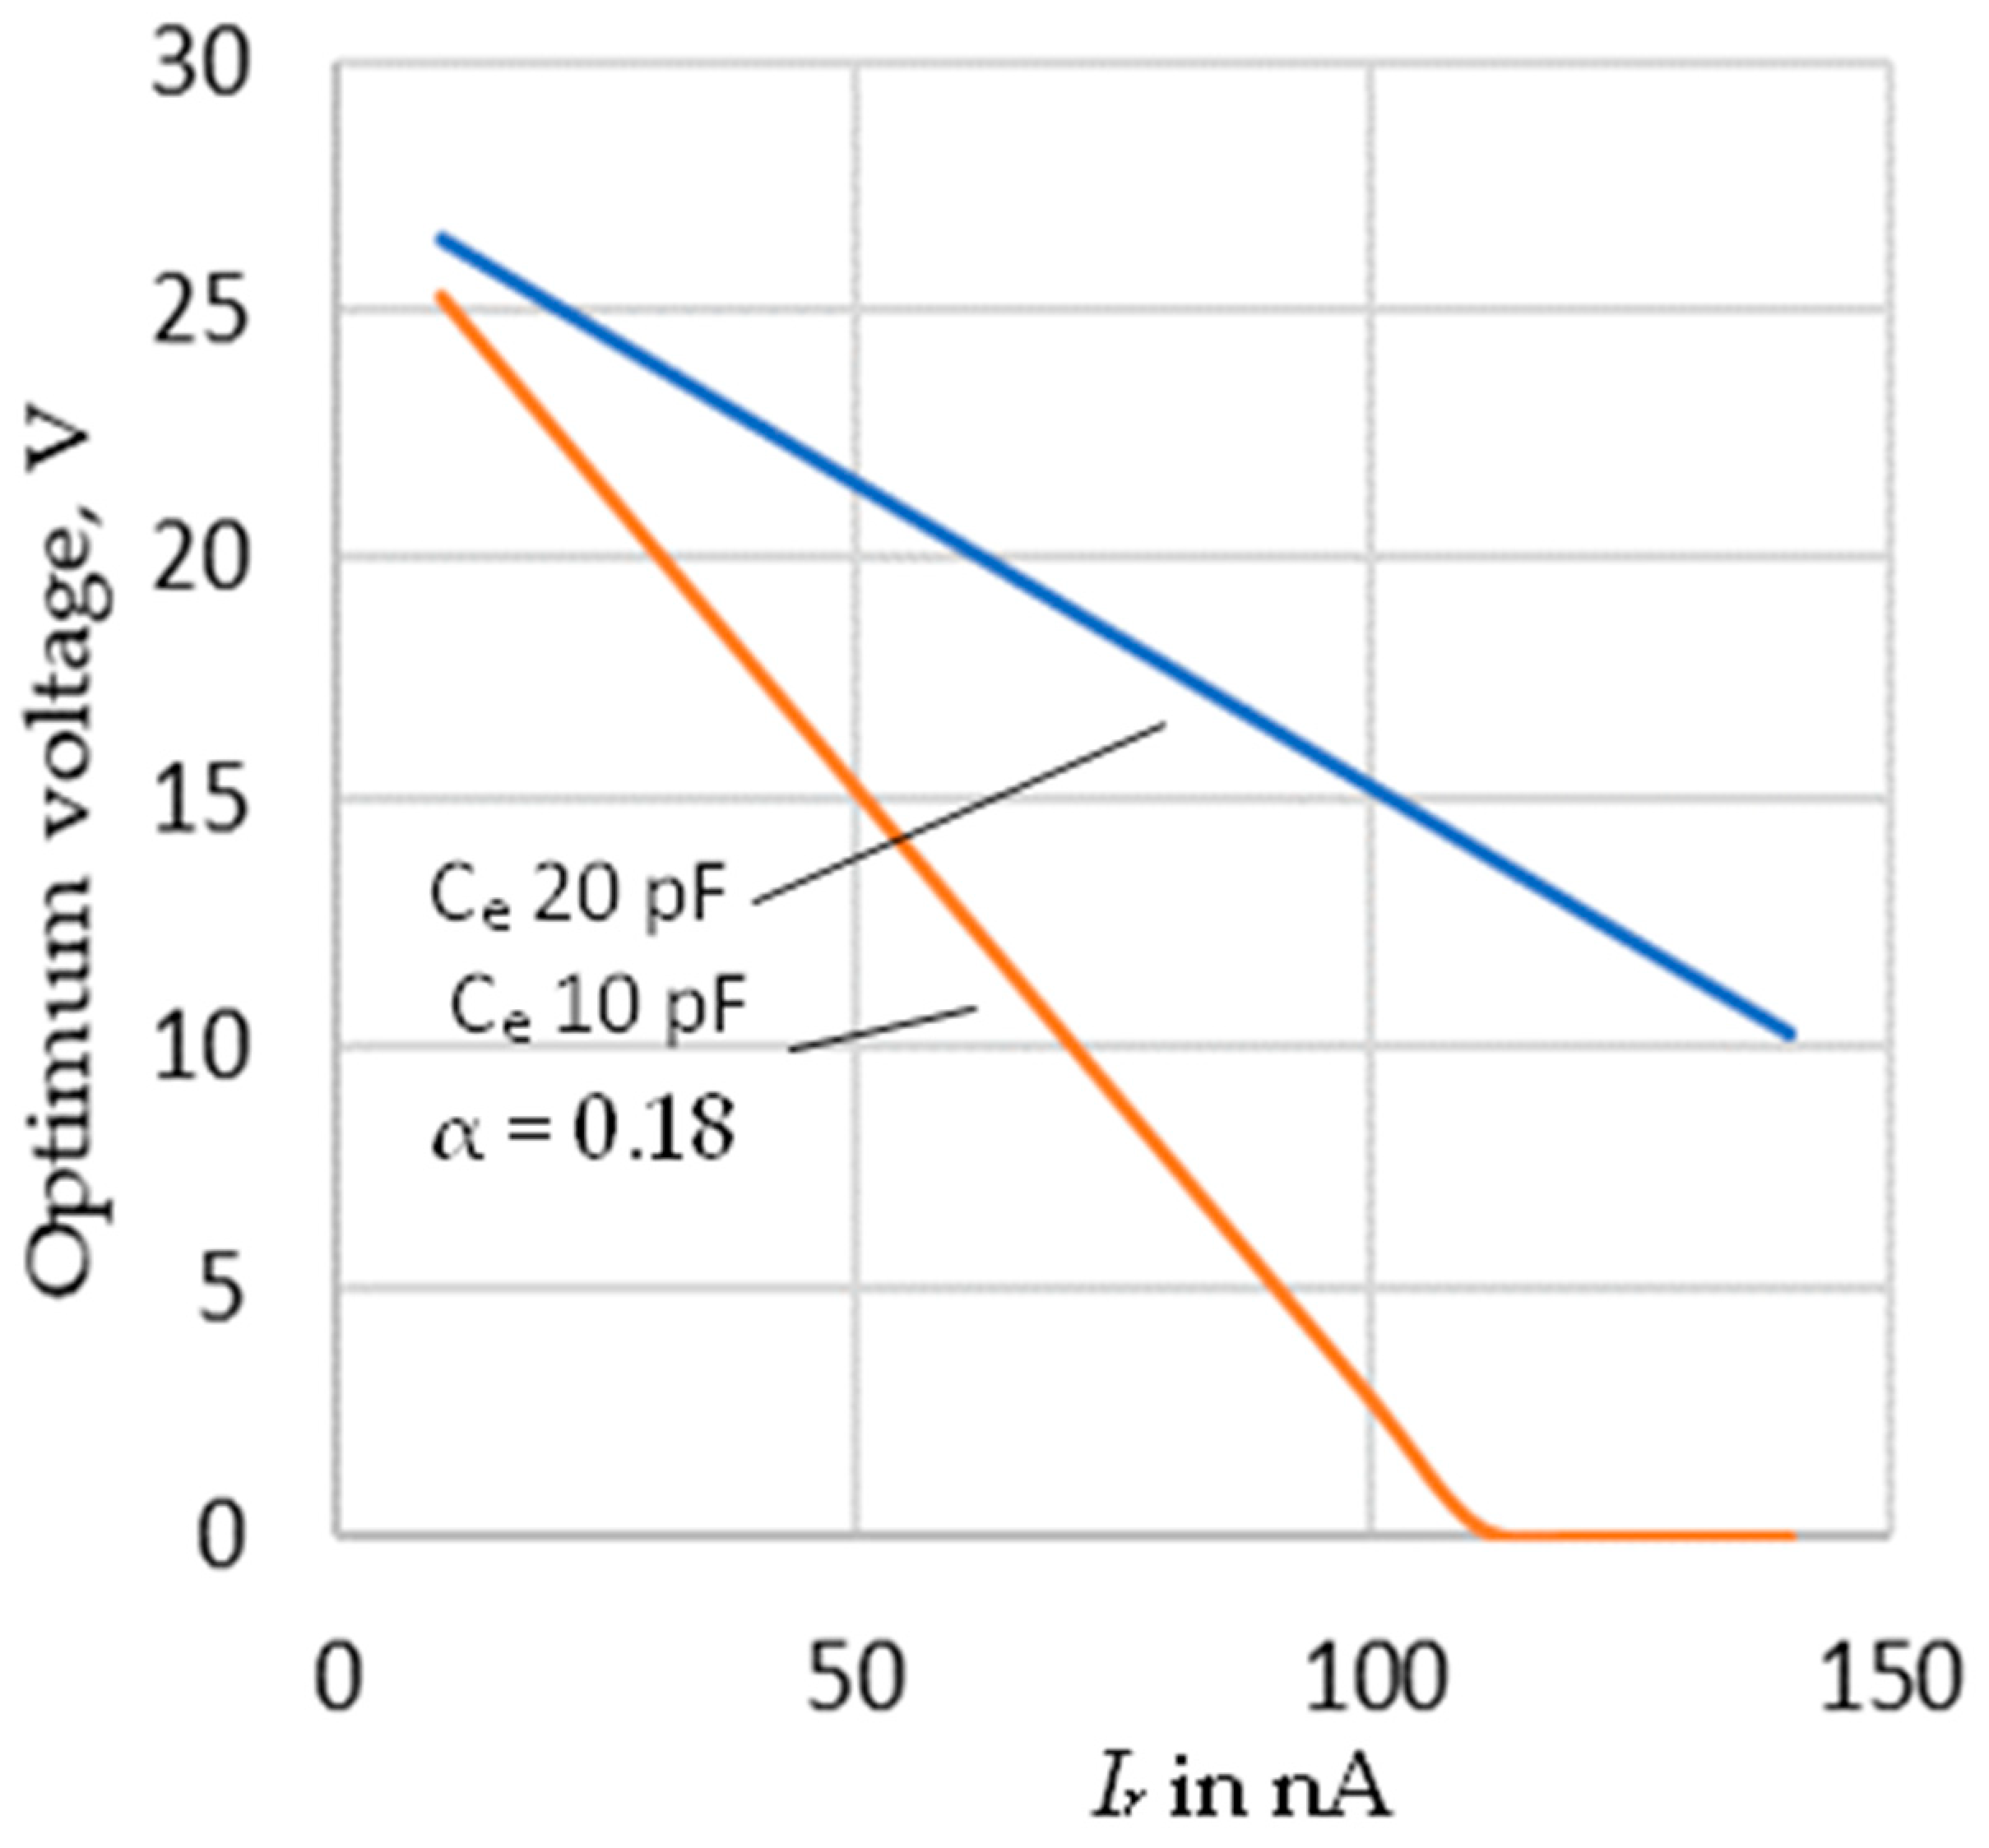
Figure 7 shows that variation of optimum voltage due to the variation of the diode reverse current. Keeping the values of the
Ce same, any increase in
Ir deceases the optimum voltage and there comes a value of
Ir when no voltage will be developed in the capacitor
C0. In the graph for
Ce = 10 pF, the value of the voltage goes to zero when
Ir exceeds 110 nA. Under such a condition, the discharge current
Ir from the diodes becomes high compared to the charging current from the capacitor
Ce. That is why we can see that for a higher value of
Ce, the optimum voltage does not go to zero while a lower value of
Ce shows such a behavior.
5. Experimental Setup and Results
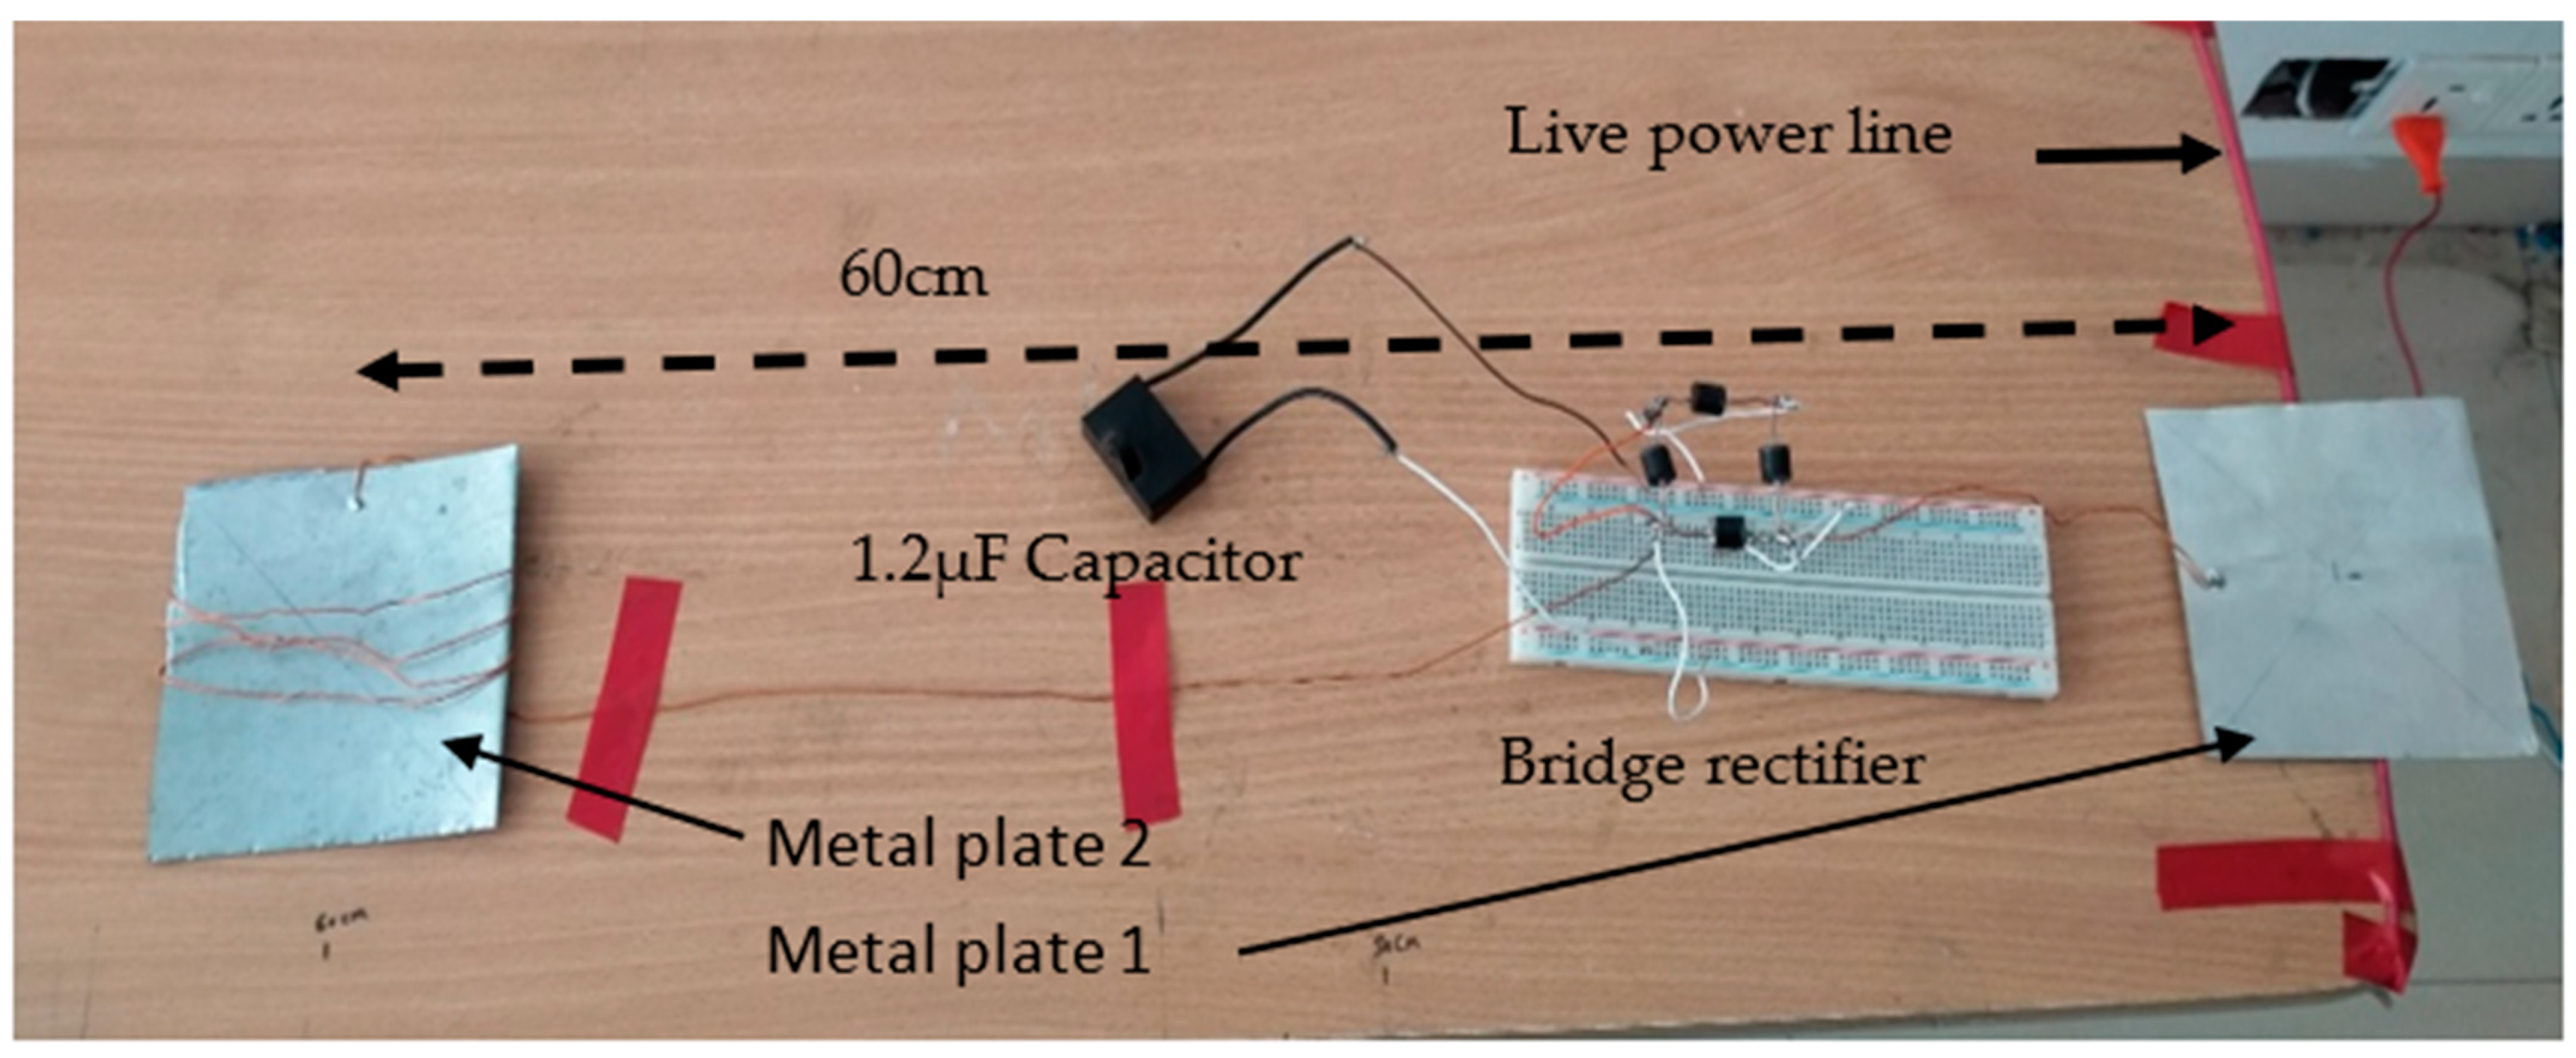
Picture of the experimental setup is shown in
Figure 8. The live wire was a thin insulated copper wire fixed along the edge of the table (left edge of the table in the figure). The voltage in the live wire was 220 V 50 Hz and was drawn from single phase supply line. Two 4”× 4” metal plates, one placed close to the live wire of a power line and the other at a distance farther from the wire. The metal plates, 4 diodes in a full bridge rectifier and a 1.2 μF capacitor as
C0 was connected on a bread board in accordance with the circuit configuration shown in
Figure 1. In the figure, the metal plate 2 is placed at distance of 60 cm from the live wire.
The four diodes used in the full bridge rectifier were 1N 4007. The diodes have the following rating
Diode 1N 4007
Maximum reverse voltage = 1000 V
Steady current rating = 1 A
Reverse saturation current (max.) = 5 μA
Although the maximum reverse saturation current, as mentioned by the manufacturers, is 5 μA, the actual reverse saturation current seldom exceeds a few nanoamperes (usually less than 10 nA).
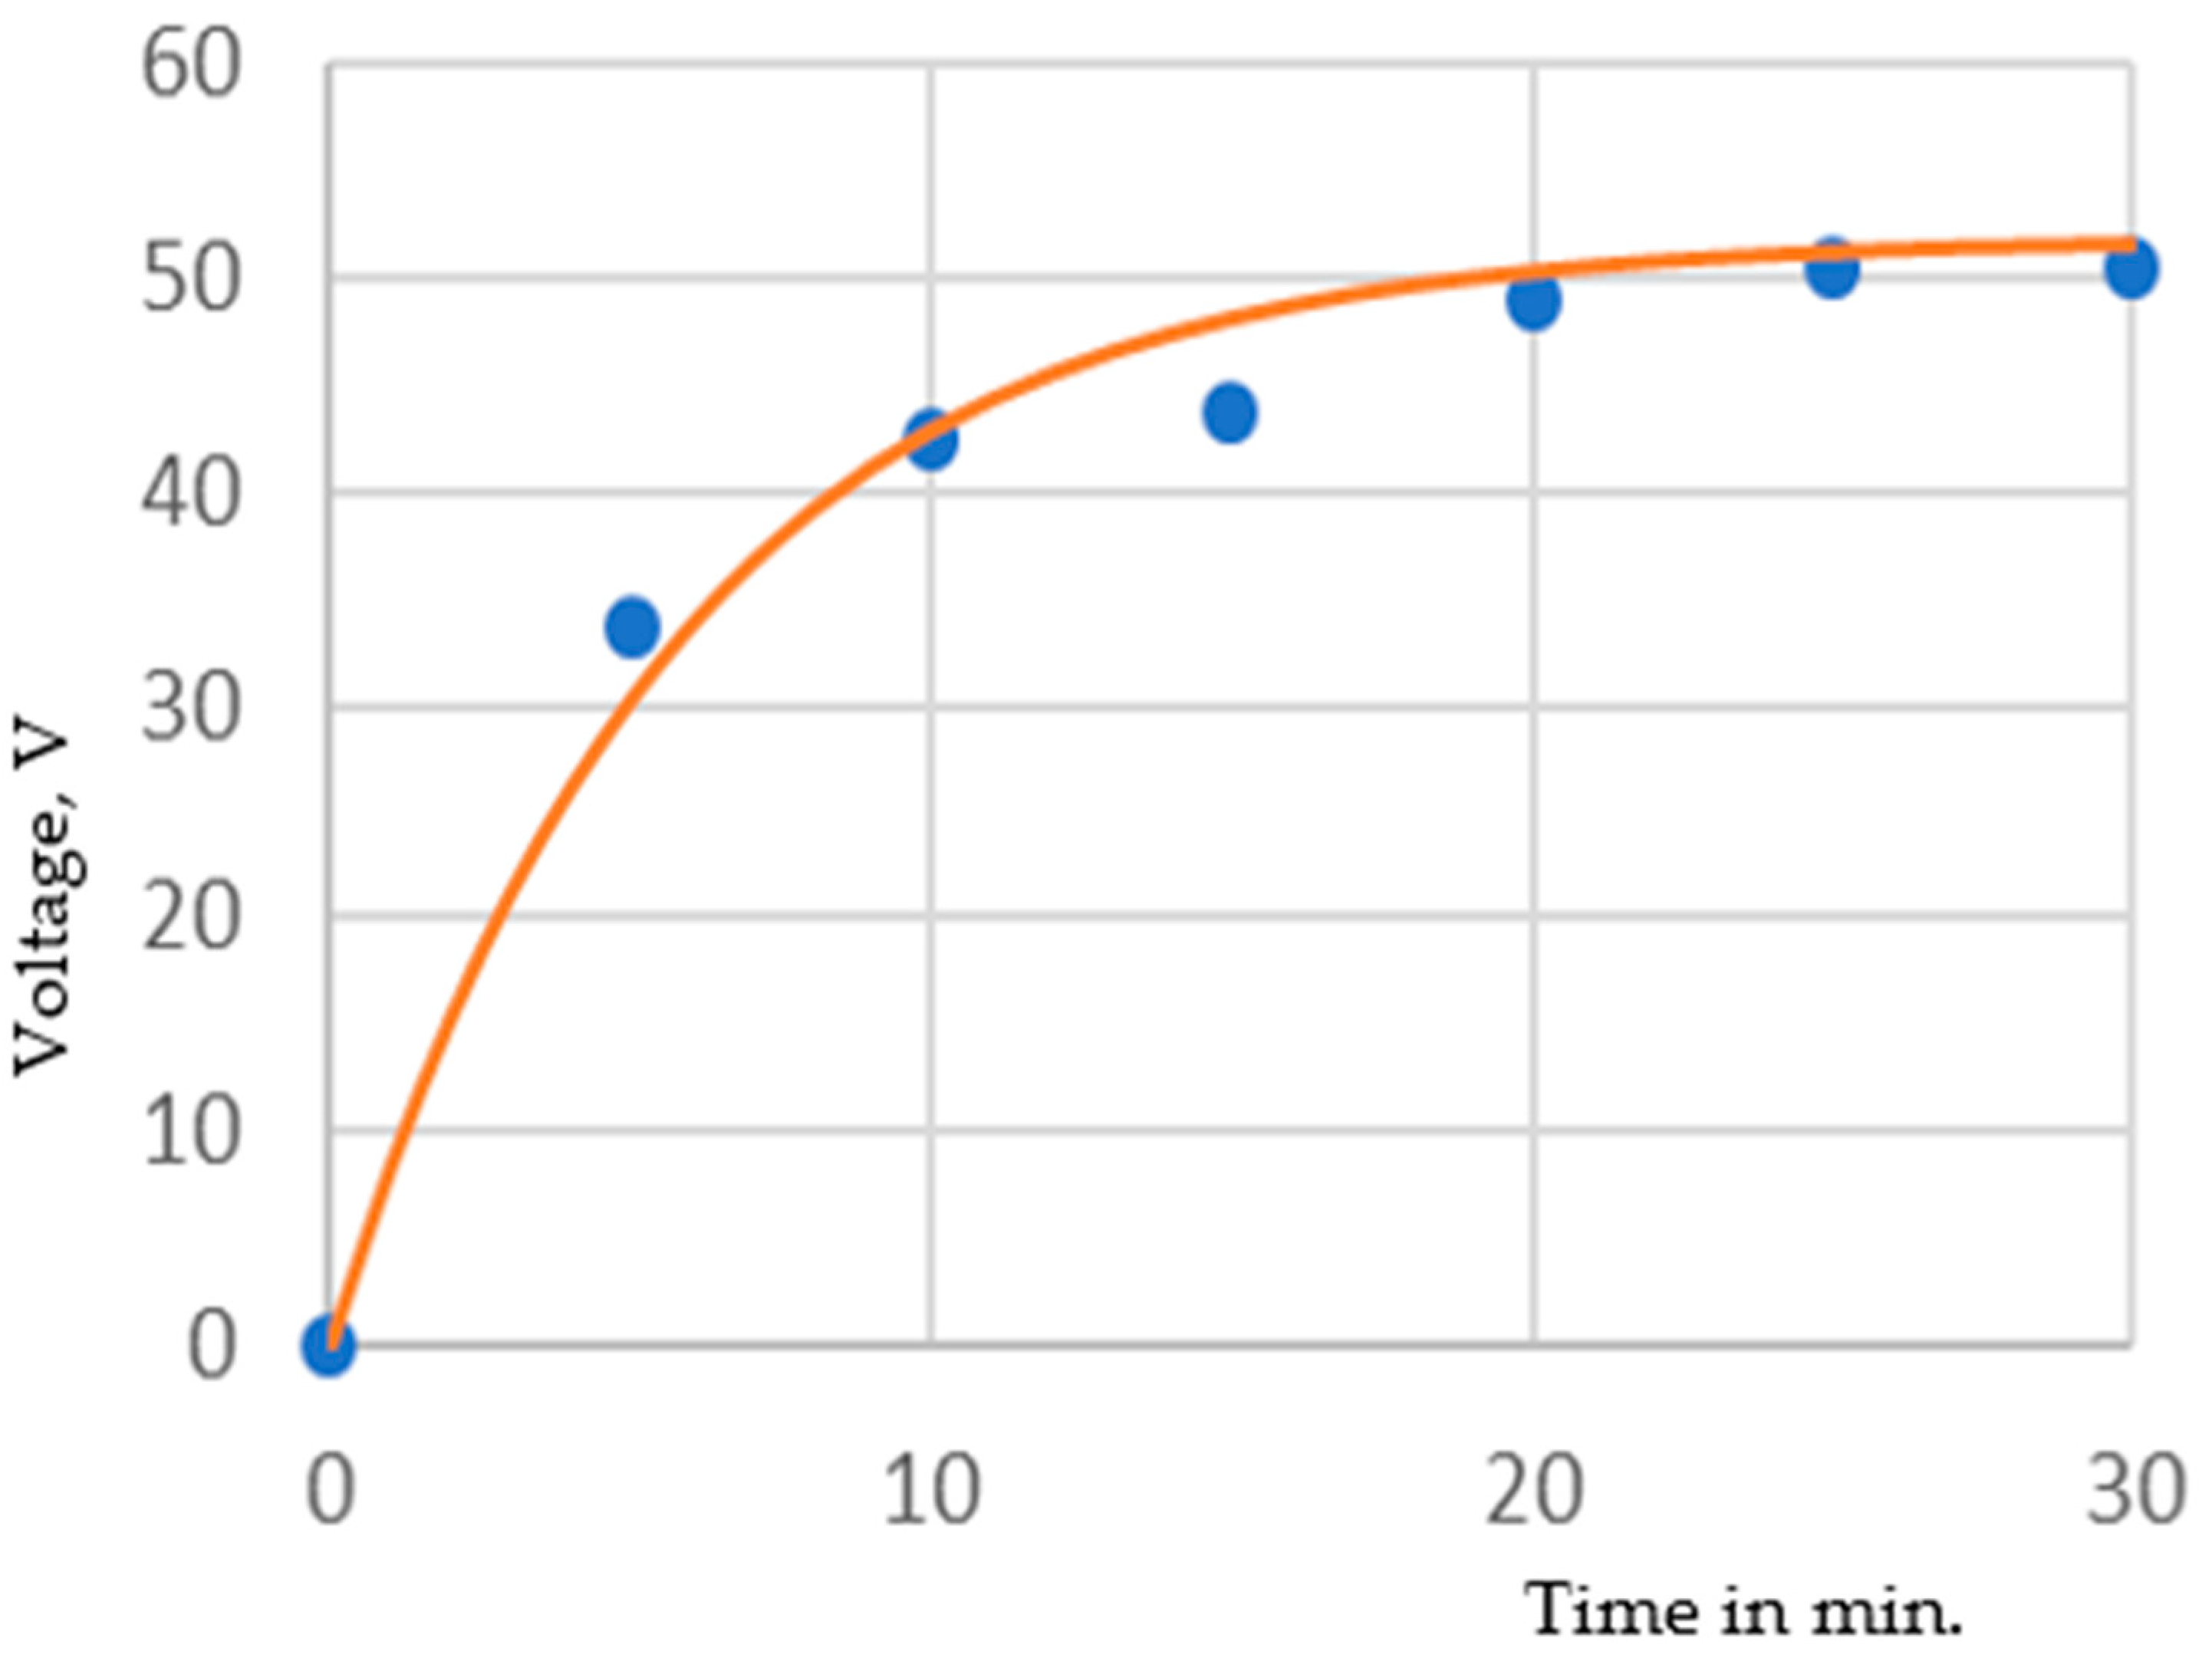
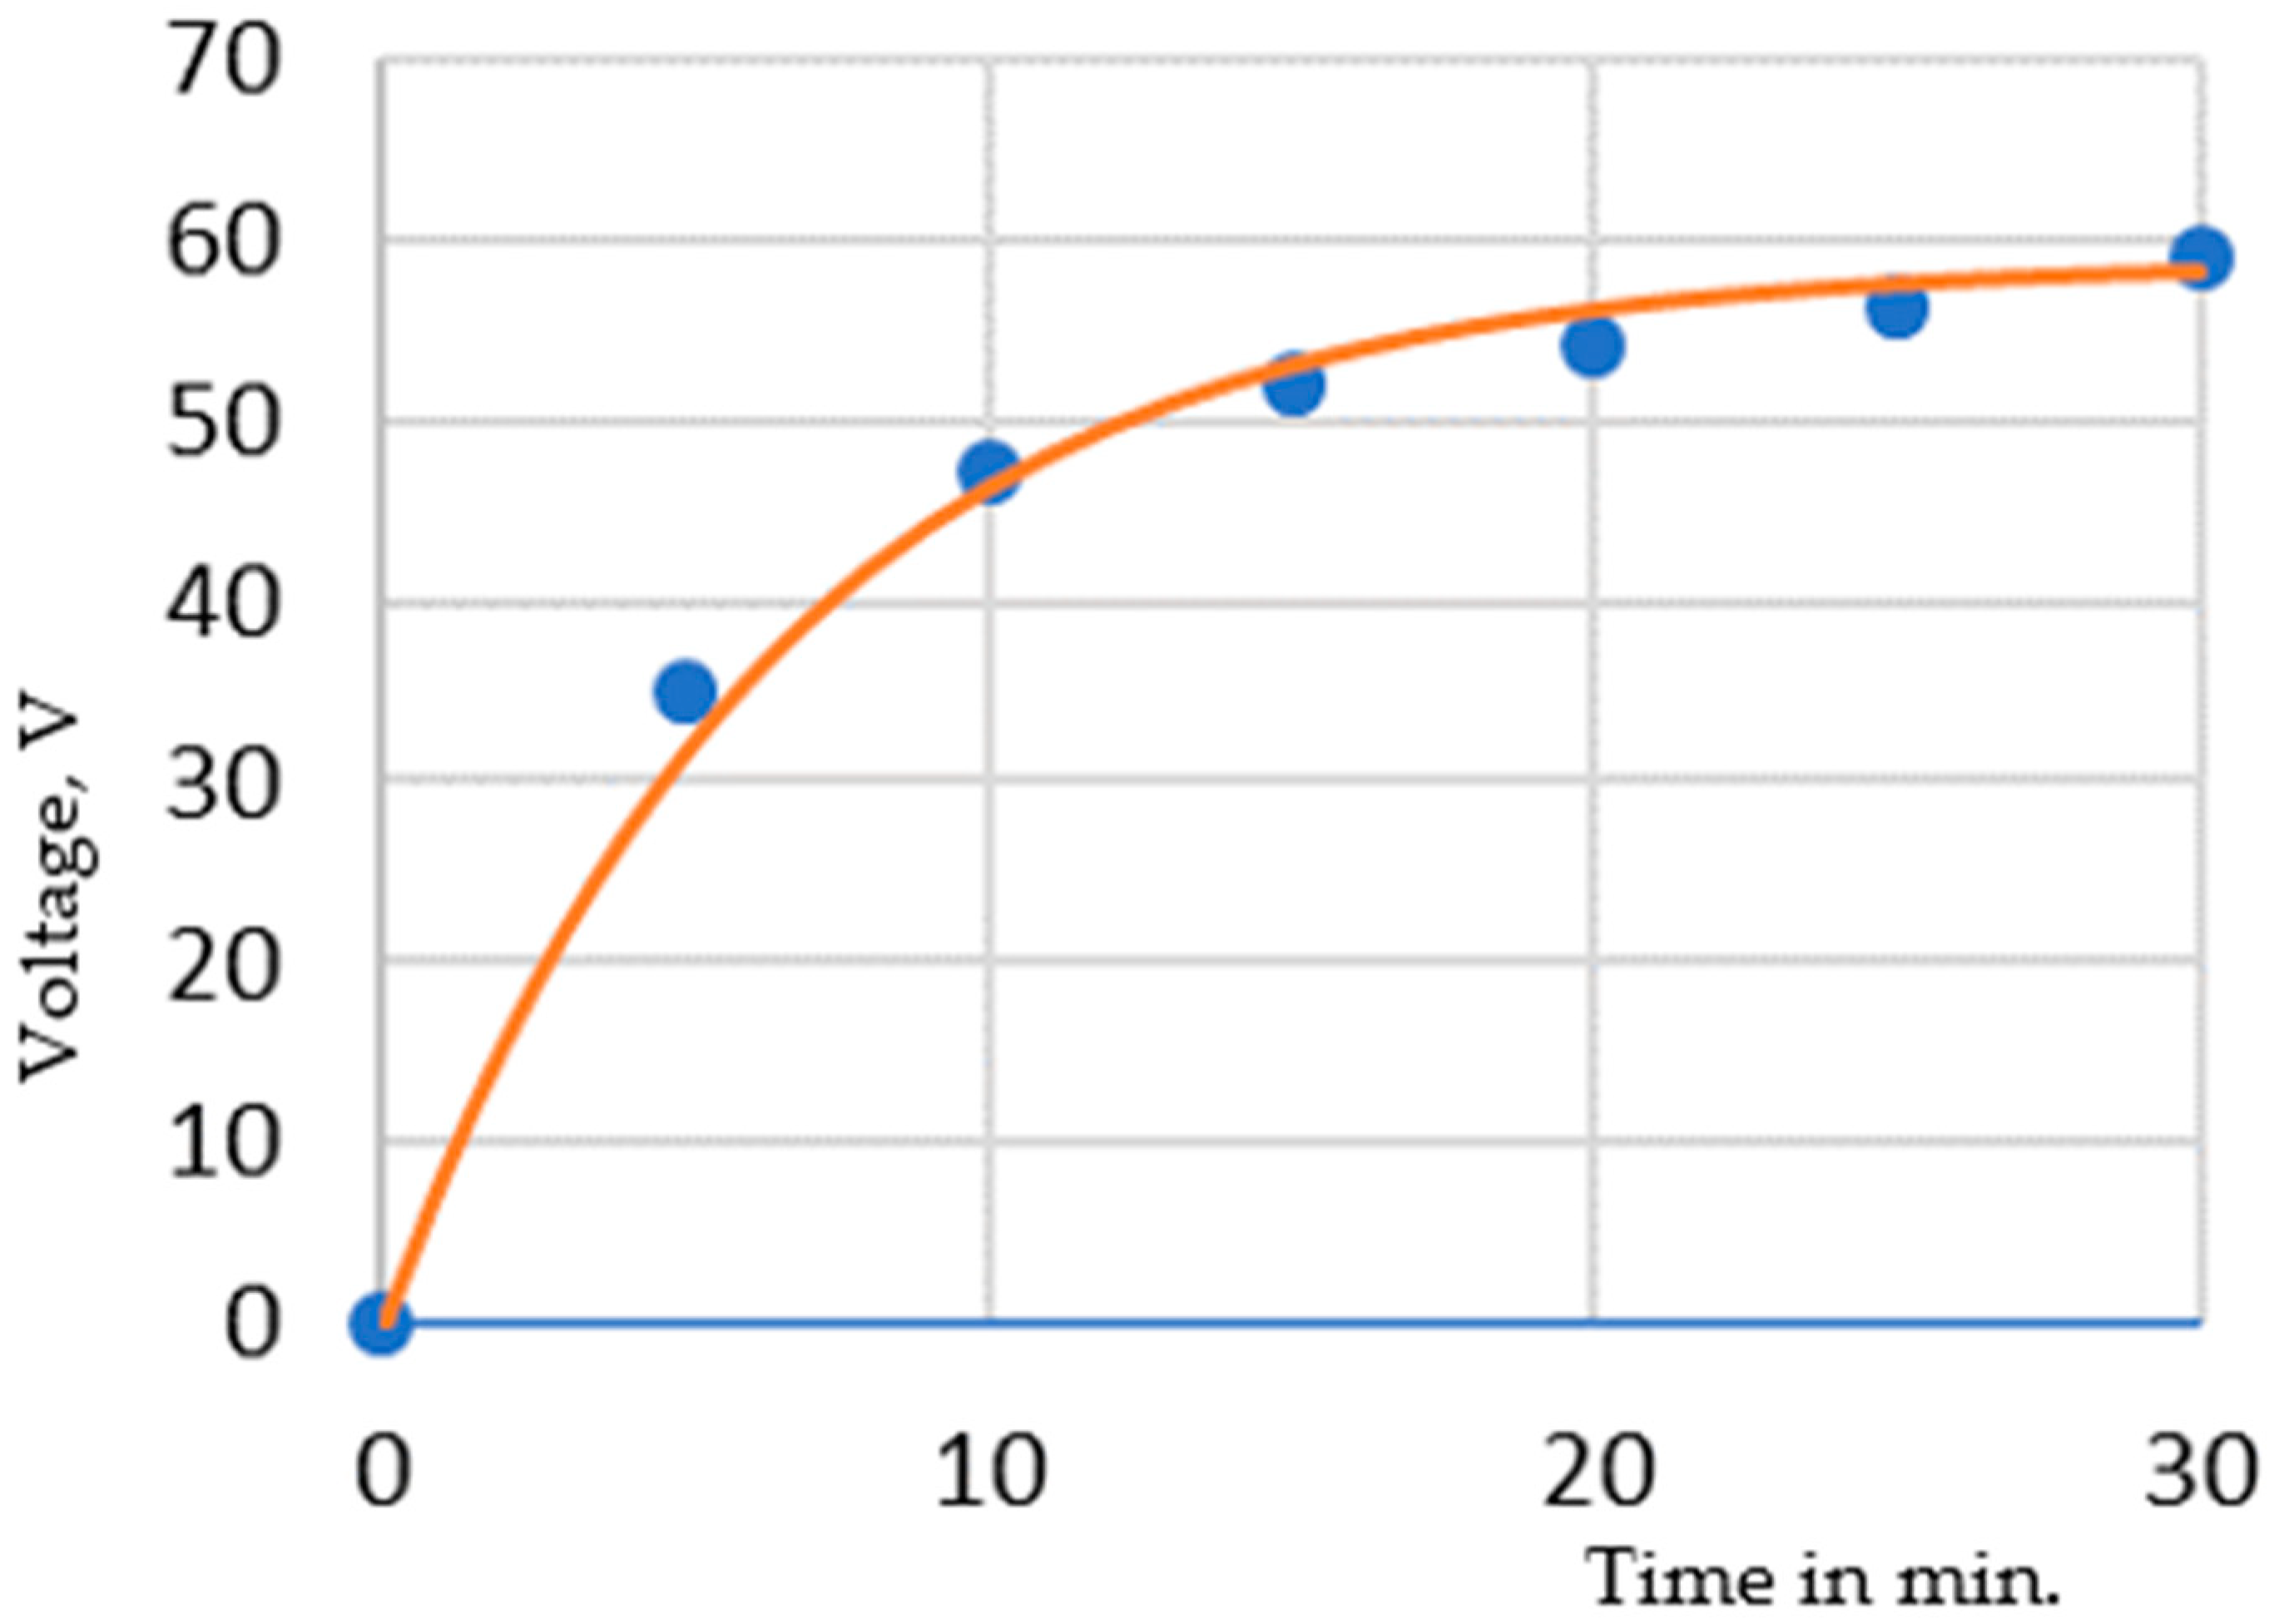
Figure 9 shows the measured charge build up in
C0 for plate 2 placed at a distance of 60 cm from the live wire. The experimental data are indicated by the dots and a fitted curve (using Equation (18)) is also shown in the figure. The fitted curve has the following fitting parameters:
Ir =10 nA, α = 0.1167 and
Ce = 17.5 pF.
Figure 10 shows the voltage development in
C0 for a plate 2 distance of 120 cm from the live wire.
The fitting parameters for the curve in
Figure 10 are
Ir =10 nA, α = 0.19 and
Ce = 15.5 pF. Increasing the distance of plate 2 has increased the value of α, which is expected, as the fringing electric field from the power line to plate 2 is reduced. On the other hand, increase in distance reduces the overall value of the equivalent capacitance
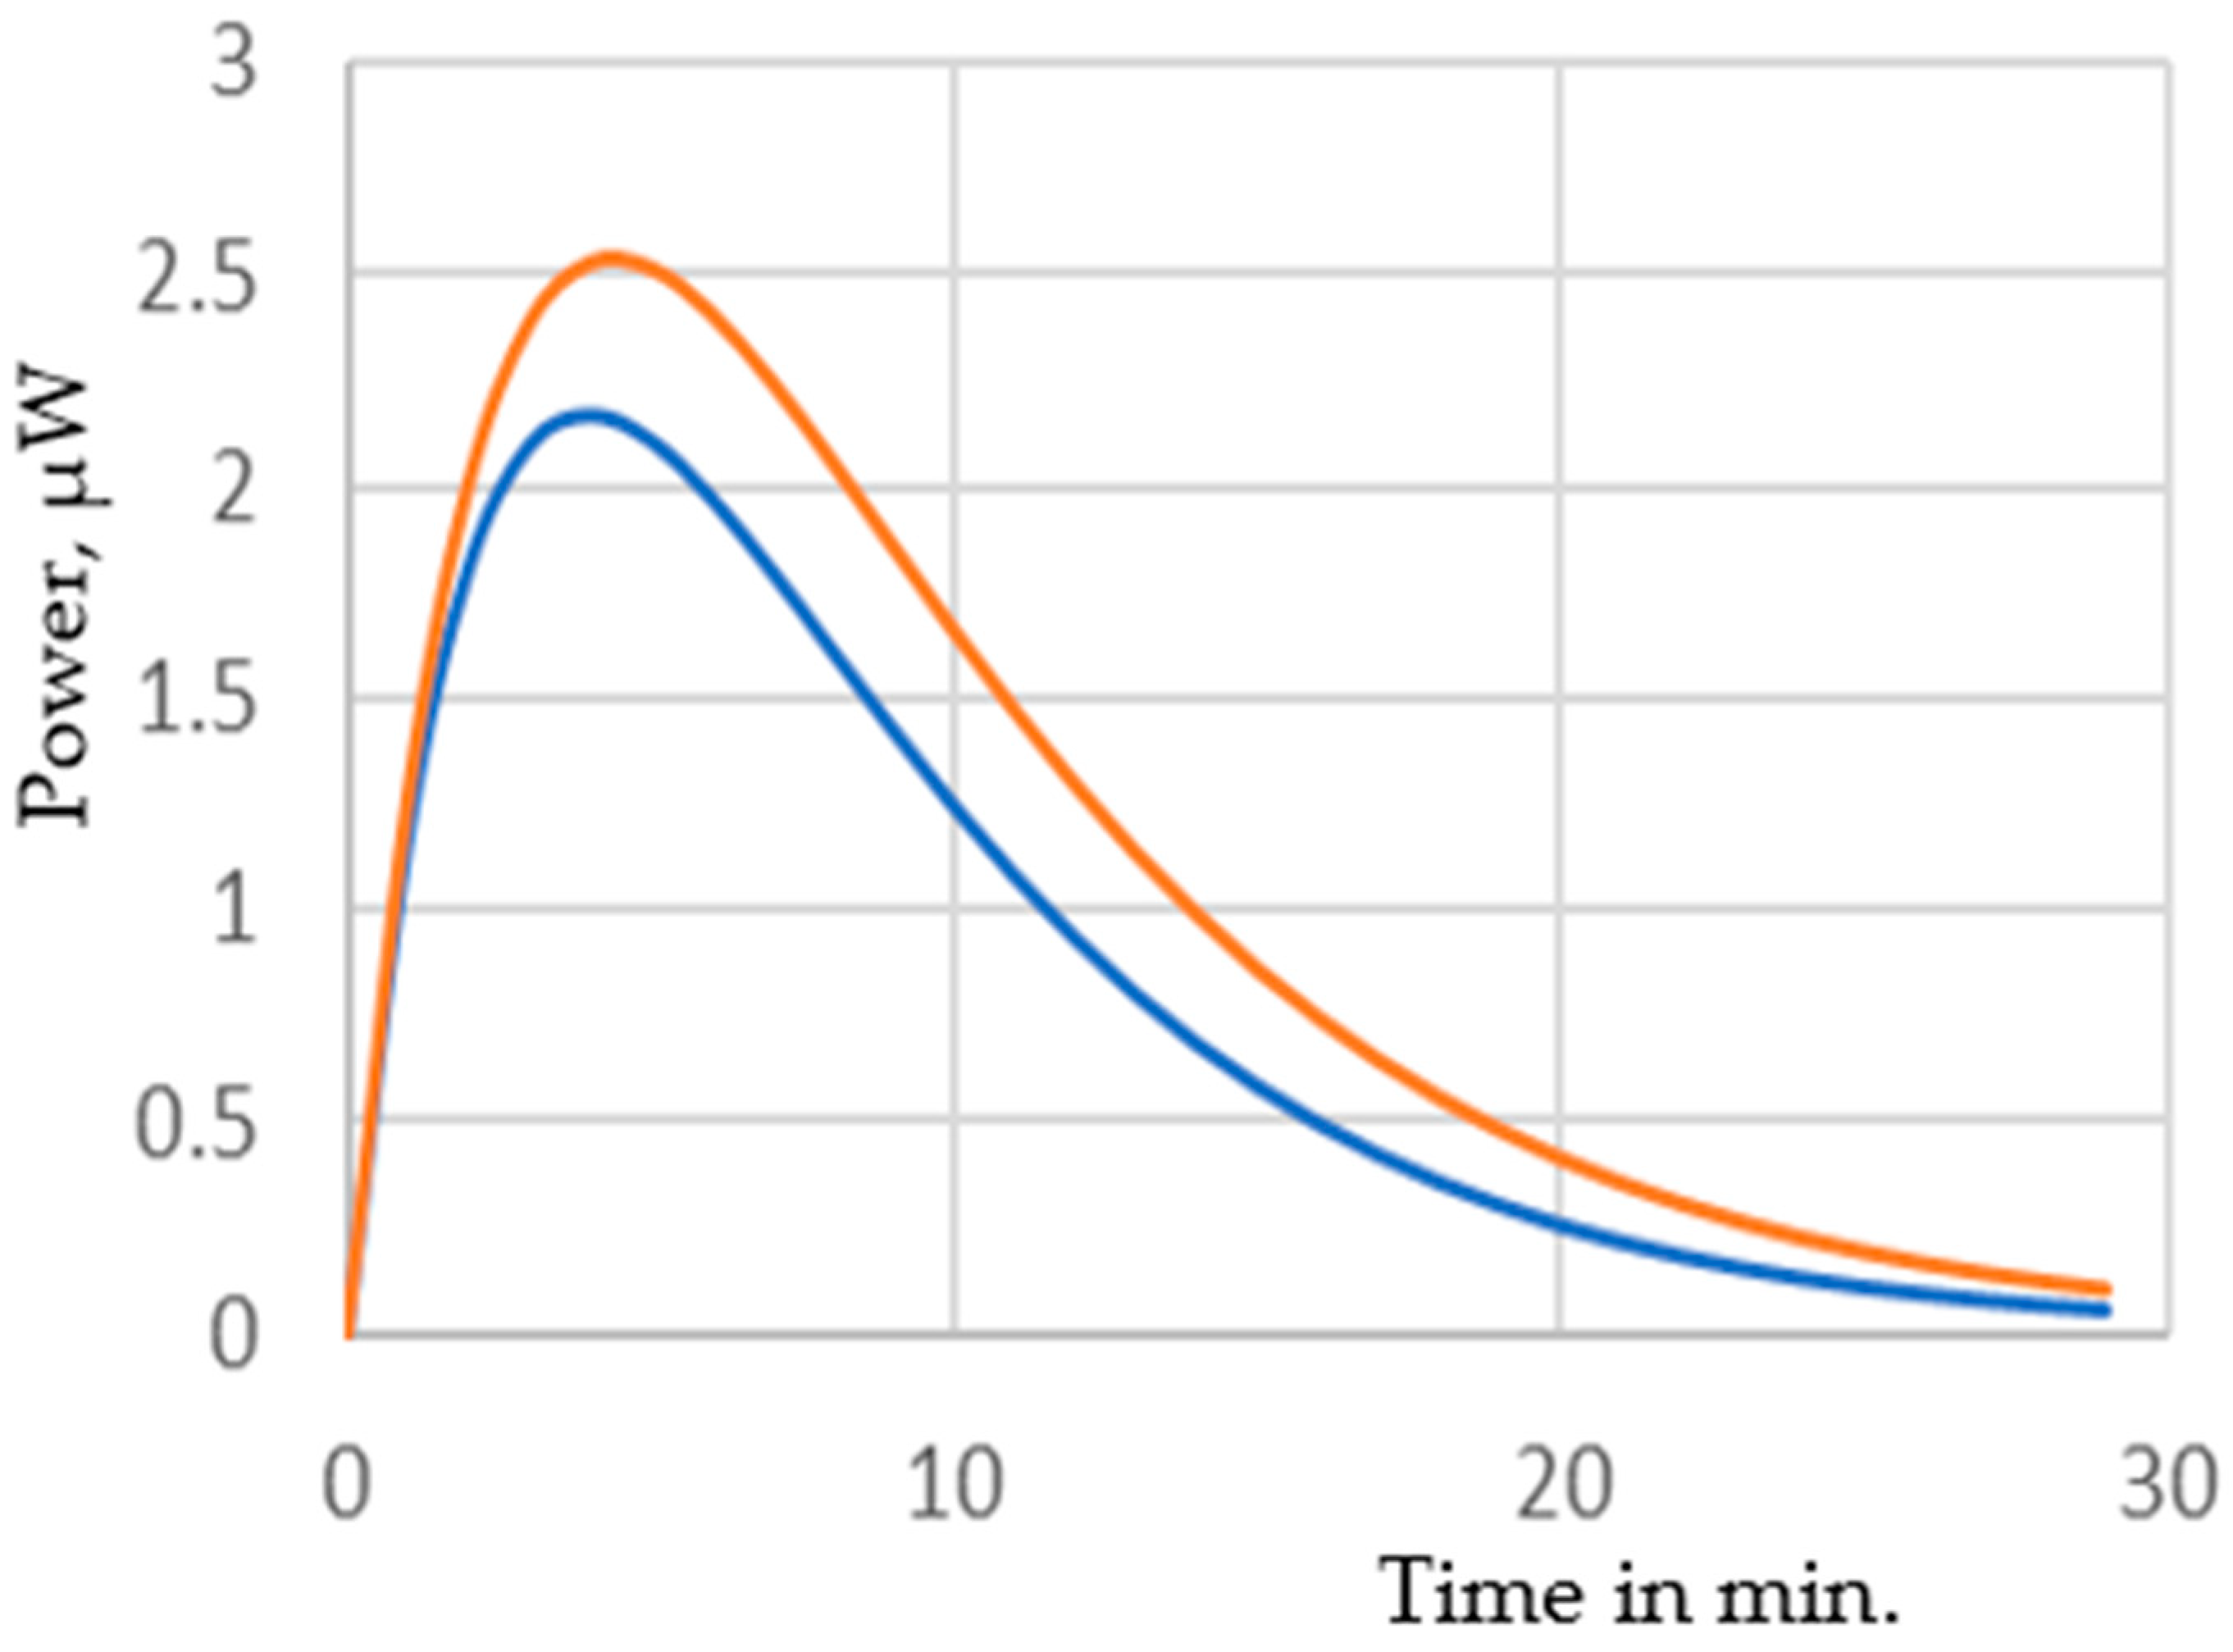
Ce due to deceased capacitance between the power line to the plate 2, which is also apparent from the fitting parameters. The time vs. power curve is presented in
Figure 11 showing higher maximum power for larger distance of plate 2. As the actual value of current is very small, we used the fitted graphs in
Figure 9 and
Figure 10 to calculate the values of
C0 Δ
V/Δ
t at each data point to find out the current to calculate the power presented in
Figure 11. If we compare the experimental results with the simulated ones presented in
Figure 4 and
Figure 5, we can see similar trends in the curves showing very close resemblance to the power values. As no physical contact is used, neither for the power line nor for the ground connection, such a circuit can be moved around. However, the power extraction would vary if the distance of plate 1 from power line live wire is varied.
Comparing the results with other reported research is difficult as the physical structure and circuit arrangements are quite different. However, the voltage achieved are of the order of tens of volts and the time of charging is of the order of minutes, similar to the reported results presented in most of the papers. The results presented in [
19], which has a circuit arrangement closest to ours, extracted less than 1 μW where as the optimum power extraction in our experiment, as shown in
Figure 11, is within 2 to 2.5 μW, which is higher by a factor of more than 2.5. This is probably due to the following reasons—
- (i)
the line voltage used in [
19] was lower (120 V).
- (ii)
the cable attached to the harvesting circuit contained a live wire, a ground wire and a earth wire placed very close to each other. This may have caused reduction in the fringing field from the live wire to the metal plate used for harvesting (as the earth wire diverted the major portion of the electric field from the live wire to the earth wire).
- (iii)
the circuit arrangement did not look for optimized output voltage but switched the storage capacitor at a voltage that is required to drive the load.
Although the power extraction that we achieved in the experimental circuit is not high, it can still be useful for energy harvesting purposes. It is our understanding that there is scope for further research for design improvement and the power extraction is expected to increase with better design of the metal plates and their arrangements.
If we consider the simulation and the experimental results, there may arise a very pertinent question that the size of the plates and the distance between them in the experimental set up is large and does not look realistic. A real life wearable device is expected to be much smaller and so will be the corresponding amount of energy extraction. If we look at the circuit model (
Figure 3), we find that the capacitive coupling between the power line and the plate 2 results in a voltage source that opposes the voltage source due to plate 1 in the equivalent circuit and hence it is the main challenge to reduce this coupling. Theoretically, making the distance of plate 2 infinity is an obvious solution but not a practical one. While designing the energy harvesting circuit, it is possible to place plate 2 in the shadow of plate 1 such that the electric field from the power line is screened by plate 1 reducing the effective coupling with plate 2. This will increase the source voltage of the equivalent circuit to a higher value and will consequently enhance the energy harvesting efficacy of the circuit. Higher value of the source voltage in the equivalent circuit will increase the power extraction proportional to ~ V
2 (approx.) and the actual amount of power extraction can be increased significantly. However, predicting an estimated enhancement of power extraction based on this basic understanding will be inappropriate without going into further experimentation and investigation.


 and
and 