Abstract
High temperature smoke caused by fire is a major cause of casualties. In order to ensure the safety of personnel, it is very important to control the spread of smoke and enable personnel to quickly withdraw from the fire scene. While traditional hard isolation, such as fire doors, may hinder the safe evacuation of people, the use of an air curtain as a flexible isolation has received more and more attention from researchers. In this paper, the influence of jet direction of compound air curtain on the smoke control effect was studied, and six working conditions were designed. The temperature and smoke isolation of the compound air curtain were numerically simulated by using ANSYS FLUENT software. The parameters such as temperature, velocity pressure and velocity streamline were analyzed, and the smoke control effects of six different jet directions were discussed. The simulation results were verified by Pyrosim fire simulation software simulation software. The results show that the direction of jet flow has a significant influence on the smoke control effect, and the fire smoke control effect under working conditions 4 and 5 is better. The working condition 5 (both air curtain A and air curtain B have outward jet direction) has the best smoke prevention effect, which is suitable for a situation that is close to the fire source. Working condition 4 (outward direction of air curtain A and inward direction of air curtain B) has the second-best effect of smoke prevention, which is suitable for situations far from the fire source.
1. Introduction
With the accelerated aging of the world population, the proportion of the elderly population is increasing. According to statistics [1], among the people who died in residential fires in China in 2020, minors and the elderly over 60 years old accounted for 58.3% of the total, and the disabled, paralyzed and mentally ill accounted for 40.9%. Vulnerable groups, such as the elderly, the sick, and the disabled are inconvenient to move, lack physical endurance, and may have difficulty escaping quickly from the scene when a fire occurs. At present, the smoke prevention measures of high-rise buildings exist mainly in the form of a fire door to separate the smoke-proof staircase; the fire door can effectively isolate the smoke. However, in the case of a fire, the temperature inside and outside the door is inconsistent, and there is a difference in air pressure. It may require greater strength to open the fire door, which will make the evacuation of vulnerable groups worse. Therefore, in recent years, many scholars have begun to propose the use of an air curtain to isolate smoke. As a flexible partition, it can not only temporarily block the spread of smoke, but also reduce the obstacles on the evacuation path, making safe evacuation easier. Air curtains began to be applied as early as the 1950s. They were first applied in the medical and health field [2,3], and then gradually applied in dust prevention, insulation, preservation and other fields [4,5,6].
Some scholars put forward the application of air curtains in the field of smoke control in the 1980s. In 2003, Gugliermetti et al. found that the application of air curtains to fire smoke control could isolate air to a certain extent and reduce oxygen at the fire site, thus inhibiting the development of fire [7]. Santarpia et al. also proved that the jet generated by the air curtain can reduce the airflow exchange in a confined space fire, thus improving the fire and smoke situation [8]. Based on CFD, Goncalves et al. found that the jet velocity of the temperature-insulating air curtain increases with the increase of the height of the doorway and the temperature difference on both sides [9]. Felis et al. carried out small-scale experiments on smoke control of tunnel fire with compound air curtain. The compound air curtain was set on both sides of the fire source, and the velocity range of the air curtain was set at 1–20 m/s. The velocity vector field diagram, temperature field diagram, and turbulence intensity diagram were drawn, and it was found that the longitudinal turbulent heat flux led to turbulent transfer [10]. Through FDS numerical simulation, Huo et al. proved that the smoke prevention and heat insulation effect of the vertical air return mode of double-layer air curtain was better than that of the lateral air return mode [11].
Krajewski et al. proposed that, in theory, the smoke-proof air curtain could be divided into core zone, transition zone, development zone, and impact zone. The velocity of the core zone is equal to the velocity of the air curtain jet flow. The analytical expressions of the velocity of the transition zone and the development zone are shown in Formulas (1) and (2). The airflow in the impact zone is very complex, and there is no clear analytical formula for the velocity at present. The height of the impact zone is about 15% of the whole height [12].
Transition zone formula:
Development zone formula:
In the above formula, C1 and C2 depend on the shape of jet inlet and boundary conditions, and the value range is usually:
According to the above research results, in the research on the smoke control effect of air curtains, most predecessors used FDS to evaluate the smoke control effect by measuring the visibility and CO2 concentration on both sides of the air curtain after a number of seconds. However, high-rise buildings need a long evacuation time, and the requirements for the airtightness of the smoke proof air curtain are stricter. The influence of various parameters of the air curtain on its airtightness can be accurately and intuitively reflected by analyzing the parameters of temperature distribution and air curtain jet flow line.
At present, the research mainly focuses on the influence of jet velocity, angle, width, and other factors on the smoke control effect of air curtains [13,14], and there is a lack of detailed research on the jet direction of compound air curtains. This paper carried out numerical simulation on different jet directions of compound air curtain to analyze their influence on the smoke control effect.
The main parameters used in this article are shown in Table 1.

Table 1.
Nomenclature.
2. Geometric Model Setting
2.1. Model Establishment
The essence of the air curtain is a kind of fan which can produce the jet, as shown in Figure 1. So the single air curtain was simplified as a cuboid in this paper, and the compound air curtain was simplified as two cuboids, and the bottom surface of the cuboid was regarded as the jet inlet.
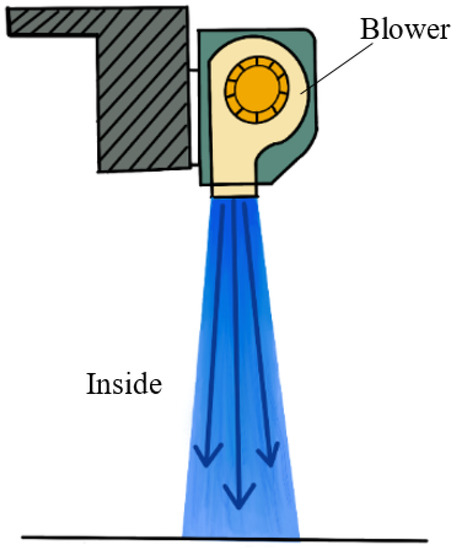
Figure 1.
Working principle of air curtain.
In this paper, the geometric model was established by Auto CAD software, and then imported into ICEM CFD software for model repair. The established geometric model is shown in Figure 2. The research object of all the simulations in this paper is only the air curtain. In order to improve the simulation efficiency, the model was simplified during the modeling without considering the building structures around the air curtain.
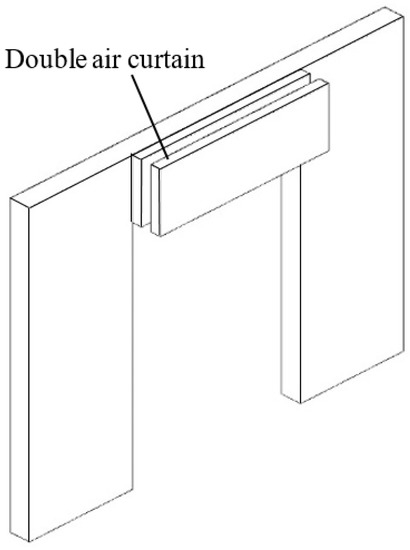
Figure 2.
Simplified geometrical model of double air curtain.
Figure 3 shows the side view of the geometric model. The length of the geometric model is 12 m, the height is 3 m, the width is 4m, the height of the doorway is 2.5 m, and the width of the doorway is 2 m. The velocity inlet on the right represents the side of high temperature smoke generated by fire, and the pressure outlet on the left represents the side of smoke prevention stairwell. The air curtain is a stable jet stream, so the jet stream inlet is set as the speed inlet. d represents the space between the inside and outside of the compound air curtain, and d = 0 indicates that the air curtain is a single air curtain.
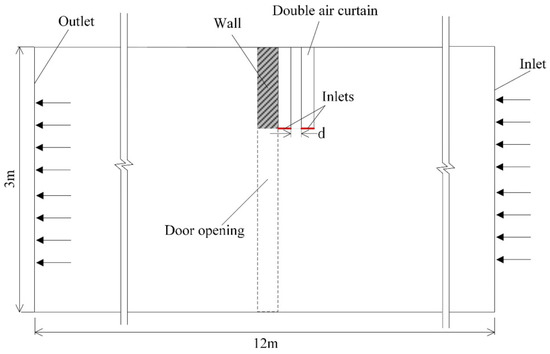
Figure 3.
Side view of geometric model.
2.2. Model Assumptions
(1) The efflux velocity of the air curtain is far less than the speed of sound and there is little difference in air temperature, so the air is regarded as incompressible fluid.
(2) Assuming that the jet velocity of the air curtain is stable and constant, the jet inlet is a regular rectangle.
(3) It is assumed that the air curtain jet is not affected by the ambient temperature and pressure, but is only affected by the lateral force from the right side. During the simulation, the lateral force is simplified into the wind pressure. Considering that the lateral force includes the influence of other factors such as temperature and pressure, the wind pressure can be set slightly higher. Therefore, the horizontal wind with wind speed of 0.5 m/s and temperature of 330 K is set on the right side of this simulation to simulate the transverse force of the air curtain.
(4) The efflux temperature of the air curtain is constant to 300 K, without considering the heat transfer of the wall surface.
3. Calculation Model and Boundary Conditions
3.1. Grid Division
In this paper, ICEM CFD19.0 was used to divide the mesh, and the maximum global mesh size was defined as 0.1, the maximum mesh size at the inlet of the locally infused air curtain was 0.01, and the maximum mesh size at the inlet of the velocity was 0.05. The mesh type was set as tetrahedron, and the octree algorithm was used to generate the mesh. Since the speed inlet in ICEM CFD can only be set at the boundary of the calculation area, and the air flow inside the air curtain was not studied in this paper, the geometric part of the air curtain was not meshed when meshing.
To check the grid quality, 752,210 grids were divided using the quality function. In general, the grids with mass greater than 0.4 belong to grids with good quality. Among them, 2415 grids have mass between 0.32 and 0.42, accounting for 0.321% of the total mesh number. Moreover, these grids were distributed at the corners of the model and did not belong to the key position, so the mesh division quality was good.
3.2. Calculation Model
The calculation model is the basic premise to ensure the accuracy of numerical simulation. At present, the use of Fluent to simulate gas flow has been very mature. In this paper, the calculation model was determined by referring to a large number of studies. The specific parameters were set in Table 2 and Table 3.
Table 2.
Calculation model.
Table 3.
Relaxing factor.
The k-epsilon turbulence model was selected, which was a Reynolds time-averaged simulation. The core of the model was composed of the turbulent kinetic energy k equation and the turbulence dissipation ε equation. The model was divided into three types: standard k-epsilon model, RNG k-epsilon model and realizable k-epsilon model. The three models had unified k equation and ε equation, which were shown in Formulas (4) and (5) [15].
k equation:
ε equation:
This paper simulated the three models. Through practice, it was found that for the simulation involved in this paper, the k-epsilon model can achieve good convergence of the calculation results, while the other two models cannot achieve convergence of the calculation results. The k-epsilon model adopts different viscosity formulas, which meet the Reynolds stress constraint conditions, and has good performance in jet diffusion velocity, circular and flat jet flow, rotary flow, vortex, etc. Air curtain belongs to jet flow and will have swirling flow, so compared with the other two models, the feasible k-epsilon model is more suitable for this simulation.
3.3. Working Conditions and Boundary Conditions
For the convenience of illustration, the structure diagram of compound air curtain, as shown in Figure 4, is drawn. Inlet01 and Inlet02 are the jet inlets of compound air curtain, and solid arrows represent jet direction of the air curtain. Through small-size tunnel fire experiments, Yu Longxing et al. found that the optimal injection angle of the air curtain was 30° [16], so the paper directly adopted 30° as the inclination angle of the compound air curtain. Through FDS numerical simulation, Huang et al. concluded that the optimal thickness of a single air curtain is 0.2–0.3 m [17]. In order to ensure the same effluent flow as that of a single air curtain, the thickness of each side of the compound air curtain in this paper is 0.1 m.
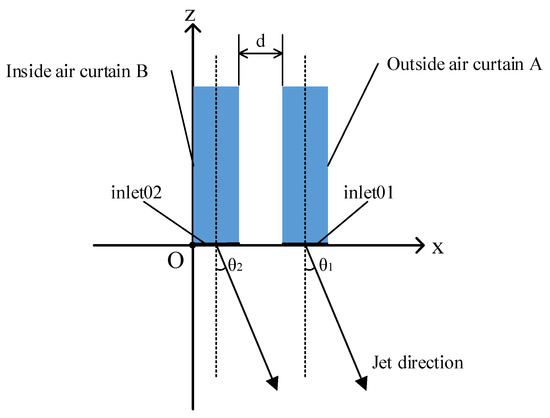
Figure 4.
Side view of double air curtain.
In order to verify the influence of the jet direction on the smoke control effect of the compound air curtain, six working conditions as shown in the Table 4 were set in this paper. The jet velocity of the compound air curtain in each working condition is 15 m/s, the jet inlet thickness on each side is 0.1 m, and the spacing d is 0.1 m. When the angle θ is 0°, it indicates that the air curtain jet direction is perpendicular to the downward direction; when the angle is 30°, it indicates that the air curtain jet direction is biased to the outside; when the angle is −30°, it indicates that the air curtain jet direction is biased to the inside.
Table 4.
Six conditions of numerical simulation.
The air curtain jet inlet was set as the speed inlet. When a fire occurs, the air curtain is subjected to lateral forces such as wind pressure and temperature pressure from the outside world. One side of the air curtain is set as the speed inlet to indicate the lateral forces of the air curtain. The other side of the air curtain is a smoke-proof stairwell, which is set as a pressure outlet. Without considering the smoke control and exhaust facilities in the smoke control stairs, the boundary conditions should be set as free exit, but the air curtain has back flow on the side of the local side, if the boundary conditions are set as free exit, the calculation results will be difficult to converge, and the simulation effect is poorer. When the boundary conditions on the local side are set as pressure exit, the calculation results are better at convergence. The boundary conditions of each working condition are set out in Table 5.
Table 5.
Boundary conditions.
3.4. Model Verification
In order to verify the accuracy of the model and parameters, a tunnel fire experiment [18] was selected in this paper. The results of the experiment are simulated by the above model and parameters. Figure 5 is the comparison of the experimental results and the simulation results. It can be seen that the numerical simulation results are basically consistent with the experimental results. Therefore, the model used in this paper has certain accuracy, and the numerical simulation results using the model also have a reference value.
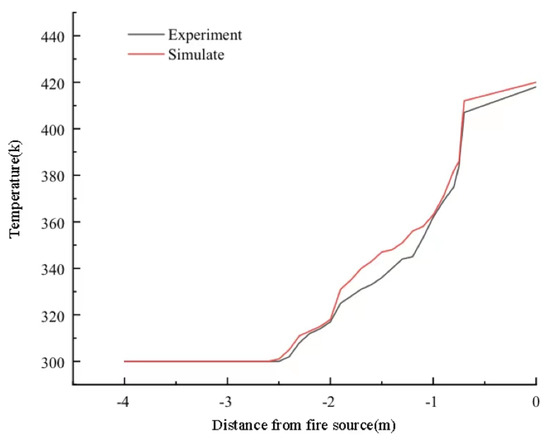
Figure 5.
Comparison of experimental and numerical simulation results.
4. Numerical Simulation
The temperature insulation performance and smoke insulation performance are an important basis for judging whether the air curtain can be used for fire smoke control. The smoke control effect and characteristics of the compound air curtain can be intuitively judged by analyzing the results of numerical simulation.
4.1. Temperature Analysis
The temperature nephogram can directly reflect the temperature insulation performance of the air curtain. Figure 6 shows the temperature nephogram on both sides of the compound air curtain in different jet directions. When the jet flow rate and jet velocity are the same and the cooling area and degree are taken into account, the cooling effect under working condition 3 is the worst and the cooling effect under working condition 5 is the best. In working condition 2, although the total cooling area is small, the blue area of low temperature is the largest.
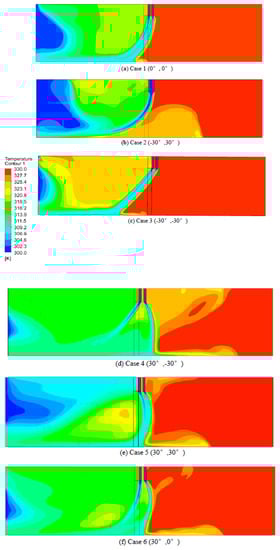
Figure 6.
Temperature nephogram of compound air curtain in different jet.
By comparing the temperature nephogram of working conditions d, e, and f in Figure 6, the angle of screen A is the same, and the angle of screen B is −30°, 30°, and 0° respectively. It is found that the cooling areas under three working conditions are almost the same. With the increase of θ2, the low-temperature blue area increases, and the medium-temperature green area decreases. When the external temperature is not high, working condition 4 can make the inner side of the air curtain have more low temperature areas; When the external temperature is high, working condition 5 can isolate the external high temperature as far as possible to ensure that there are more moderate temperature areas inside the air curtain.
4.2. Velocity Pressure Analysis
A velocity-pressure cloud map can directly reflect the smoke isolation performance of the air curtain. Figure 7 shows the velocity-pressure cloud map on both sides of the air curtain in the retest-test in different jet directions. The impact of air curtain efflux on the ground will cause local pressure to increase. The greater the pressure here, the more violent the impact of air curtain efflux on the ground, and the stronger the ability to resist the external wind. The smoke isolation effect of compound air curtain with the same jet direction is better than that with the different jet direction. However, if the jet angle of the compound air curtain is less than 0, the impact area between the jet and the ground will be located inside the door opening, which will make the smoke enter the room. According to the simulation results of this paper, when the jet angles of curtain A and curtain B are all 30°, the pressure at the junction of the jet and the ground is the maximum and the smoke isolation effect is the best. When curtain A is 30° and curtain B is −30°, the pressure at the junction of jet and ground is the smallest, and the smoke isolation effect is the worst.
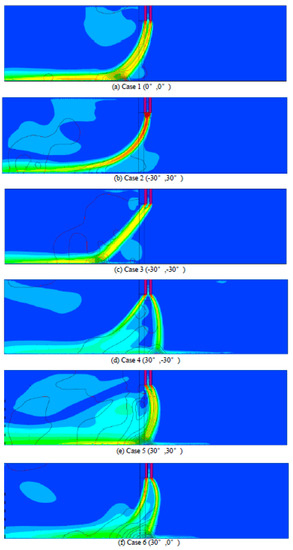
Figure 7.
Velocity-pressure cloud image of compound air curtain in different jet.
4.3. Velocity Streamline Analysis
There are two kinds of fluid in the calculation domain, one is compound air curtain jet and the other is high temperature transverse airflow. In order to further analyze the smoke isolation performance of the air curtain, the side view of jet flow lines in different jet directions of the compound air curtain is drawn, as shown in Figure 8.
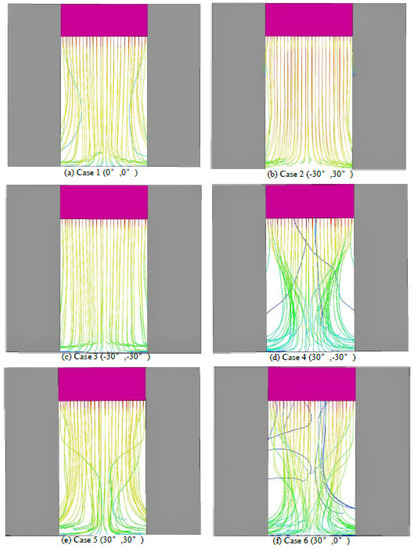
Figure 8.
Side view of air curtain jet flow line under different working conditions.
In the working conditions 4 and 6 in Figure 8, obvious holes appeared in the air curtain streamline, forming an “X-shaped streamline”. External high-temperature smoke would enter the room through the holes, seriously affecting the smoke isolation performance of the air curtain. According to Figure 8a,c,e, no “X-shaped streamline” is formed when the jet direction is the same.
In order to analyze the formation reason of “X-shaped streamline”, the three-dimensional flow diagram of compound air curtain in working condition 4, as shown in Figure 9, is drawn. In condition 4, the outside air curtain A blows to the outer side, and the inside air curtain B blows to the inner side, only air curtain A encounters resistance from horizontal wind force. The ability of the compound air curtain in working condition 4 to resist the transverse wind is actually equivalent to the single air curtain with thickness of 0.1 m, so the working condition of 4 “X to streamline” the most obvious. In working condition 6, air curtain A blows outwardly sideways, while air curtain B blows vertically downward. Both air curtain A and air curtain B can resist the transverse wind, so the “X-shaped streamline” is gentler than that in working condition 4.
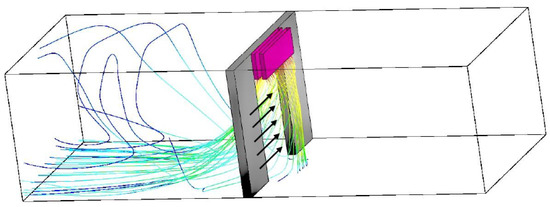
Figure 9.
Jet flow diagram of compound air curtain in working condition 4.
In working condition 2, although the jet direction is different, “X-shaped streamline” does not appear, because the two jet streams of compound air curtain A and B merge, which enhances its ability to resist transverse wind. According to the analysis in Section 4.2, in working condition 2, although the total cooling area is small, the blue area of low temperature is the largest. The reason is that the jet flows of air curtain A and air curtain B offset each other partly in the direction of the X axis, which weakens the resistance to the transverse wind. The location of the impact zone moves to the negative direction of the X axis, making the total cooling area smaller. In the direction of Z axis, the jet velocity is superimposed to strengthen the impact between the jet and the ground, thus increasing the air tightness of the air curtain and achieving the role of temperature isolation.
5. Result Verification
FDS was developed by the National Institute of Standards and Technology of the United States. It adopts the idea of computational fluid dynamics, and is suitable for simulating the low-speed diffusion process of combustion products, the thermal radiation and convective heat transfer process of gas and solid, and the fire suppression of automatic spraying system. It calculates the flow status, temperature, and smoke layer height of toxic and harmful gases such as smoke and CO generated by fire. PyroSim uses FDS simulator, which is a fire simulation software based on the theory of fire dynamics. Unlike FDS, PyroSim has a good human-computer interaction front-end, which provides two-dimensional and three-dimensional modeling functions, and has great advantages in modeling.
PyroSim uses the field model to simulate the flue gas. The field model is based on the laws of mass conservation, momentum conservation, capacity conservation, and component conservation. The model of each part of the fire is established to quantitatively describe the fire phenomenon, such as turbulence model, combustion model, thermal radiation model, etc. The equations are as follows:
Continuity equation:
Momentum equation:
Composition equation:
Energy equation:
Ideal gas-state equation:
5.1. Model Simplification
In order to verify the smoke prevention effect of the compound air curtain, PyroSim software was used to simulate the fire in the corridor and smoke prevention front room of a building. Two kinds of conditions were simulated. A compound air curtain was set in the experimental group, while the control group was not set with a compound air curtain. In the model, the length of the building is 40 m, the width is 15 m, the jet velocity of the compound air curtain is 15 m/s, the jet angle is 30°, the thickness is 0.1 m, spacing d is 0.1 m, and the combustion rate of the fire source is constant, which is 1000 kW/m2.
Figure 10 is the distribution of monitoring equipment. In this section, thermocouples are set in the corridor and the front room with a height of 1.5 m. The distance between thermocouples in the corridor is 1 m, for a total of 39, and the distance between thermocouples in the front room is 0.5 m, a total of 17. The top plane of the staircase A is set as free exit without windows and other exits.
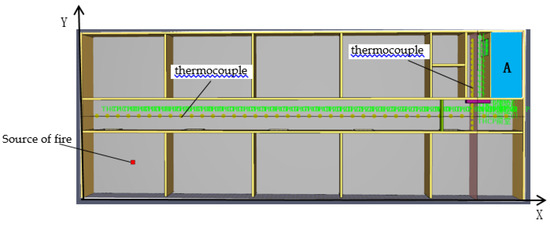
Figure 10.
The distribution of monitoring equipment.
5.2. Simulation Parameter
About the surface setting, the wall is defined by the inert surface, the fire source (heat release rate 1000 kW/m2) is defined by the burner, the air curtain outlet is defined by the supply surface, and the floor and stairs are defined by the layer. The flow rate on the supply surface is set to be 15 m/s and does not change with time.
A polyurethane combustion reaction is used in the simulation. Other parameters are set as the default of the system, and the chemical equation is:
As for the simulation parameter setting, the start time of simulation is set to 0, and the end time is set to 600 s. After enabling 3D smoke visualization, the environmental temperature is set at 26 °C, the environmental pressure is set at 101.325 kPa, the relative humidity is 40%, and the maximum visibility is 30 m. Radiation transfer computing is enabled.
5.3. Modeling Results
Figure 11 shows the smoke flow in the control group at different moments, and Figure 12 shows the smoke flow in the experimental group at different moments. It can be seen from Figure 10 that without air curtain and smoke hanging wall, smoke has completely spread to the front room at 200 s, and smoke has completely spread to the whole floor at 400 s. It can be seen from Figure 12 that when the compound air curtain is set, the airflow of the air curtain is full of the front room and room 8 at the 40 s mark. The pressure on the right side of the floor increases, which effectively resists the spread of smoke from the left side. Therefore, even at 400 s, the smoke has not completely spread to the front room.
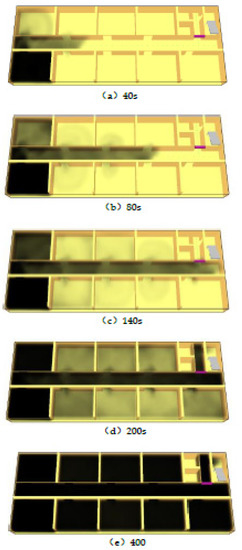
Figure 11.
Smoke movement of control group at different moments.
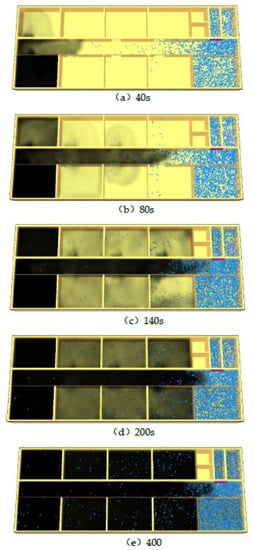
Figure 12.
Smoke movement of the experimental group at different moments.
Figure 13 is the corridor temperature line chart. The temperature difference between the experimental group and control group is not big before X = 31 m, so the compound air curtain will have little impact on corridor temperature. The temperature of the control group and experimental group in the smoke hanging wall temperature increases suddenly, so it can be inferred that the smoke hanging wall and the air curtain formed an effective smoke isolation zone. Figure 14 is the front room temperature line chart. Y = 9 m is the position of the air curtain and the front chamber door opening; the temperature of the control group decreases significantly. If there is no air curtain, the temperature of the front chamber will reach more than 30 °C. If there is an air curtain, the temperature of the front chamber can be maintained at about 27.5 °C and the maximum cooling effect can reach 18%. Therefore, the air curtain can effectively isolate the temperature of flue gas.
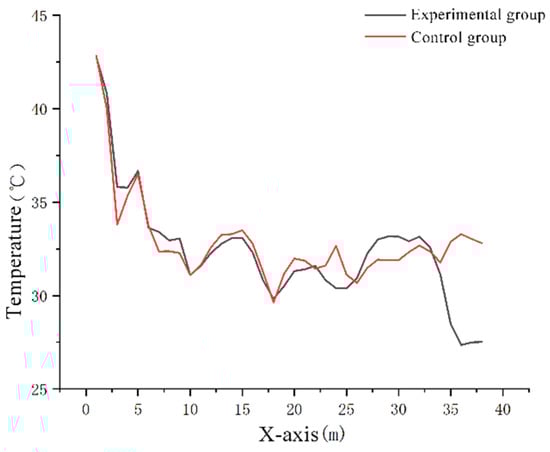
Figure 13.
Broken line diagram of temperature at different positions in the 600 s corridor.
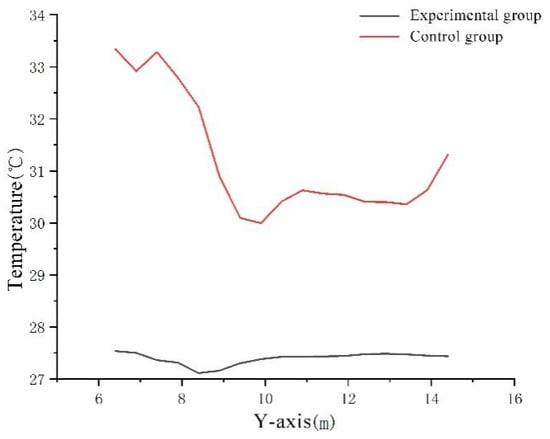
Figure 14.
Broken line diagram of temperature at different positions in the 600 s front chamber.
Pyrosim fire simulation results show that the compound air curtain can indeed have a better smoke prevention effect when the fire occurs, which is consistent with the simulation results of Fluent. Therefore, the numerical simulation results of this paper have certain reference value.
6. Conclusions
Previous studies on air curtains mainly focus on jet velocity, angle and width, etc. Whether the direction of jet has a great effect on the smoke control of air curtain has not been clearly concluded. Therefore, this paper focuses on the study of the jet direction of compound air curtains, and evaluates the smoke prevention effect of air curtains from two aspects: temperature insulation performance and smoke insulation performance. The temperature insulation performance is analyzed by temperature cloud map, and the smoke insulation performance is analyzed by velocity-pressure cloud map and streamline chart. As a result of this study, the following conclusions can be drawn:
(1) “X-shaped streamline” is one of the factors that affect the smoke insulation effect of compound air curtain. The two sides of the development zone of the compound air curtain are affected by the transverse wind, and the streamline is concentrated in the middle. Two holes are formed in the middle of the two sides, forming an “X-shaped streamline”, so that the smoke spreads to the interior. The jet direction of air curtain is related to the formation of “X-shaped streamline”, and the same direction of efflux will not form “X-shaped streamline”.
(2) Human beings can endure about 315 K temperature for a long time, which will not cause danger to human evacuation. In Condition 3, the highest area temperature is above 323 K, which will affect the safety of dispersers: this is the worst insulation effect. The area of low temperature (blue) region in working condition 5 is the largest, and its temperature isolation effect is the best. The medium temperature (green) area of working condition 4 is the largest, and the temperature isolation effect is not as good as that of working condition 5, but it also meets the requirements. Therefore, the following inference can be made: for the compound air curtain with the same jet flow and velocity, the angle θ1 of air curtain A determines the cooling area of the compound air curtain, and the angle θ2 of air curtain B determines the area of the medium temperature (green) area inside the compound air curtain.
(3) In the conditions 1, 2, and 3, the air curtain and ground impact point is located in the inside of the door hole, which will make the smoke enter the room and the smoke isolation effect is poor. Conditions 4, 5, and 6 can effectively isolate smoke; among them, the smoke isolation effect of condition 5 is the best, and the smoke isolation effect of condition 4 is the worst.
(4) Therefore, it is suggested that θ1 ≥ 0, θ2 > 0 should be taken when the outer temperature of compound air curtain is high and the concentration of flue gas is large (close to the fire point), so as to ensure that the maximum temperature of inner air curtain is within the tolerance range of human body. When the outer temperature of the compound air curtain is low and the concentration of flue gas is small (far from the ignition point), θ1 > 0 and θ2 ≤ 0 should be taken to ensure the evacuation at a relatively low temperature.
Author Contributions
Conceptualization, Z.Z. and Y.L.; methodology, Z.Z.; software, Y.C.; validation, Z.Z., Y.L. and Y.C.; formal analysis, Y.L.; investigation, Z.Z.; resources, Z.Z.; data curation, Y.C.; writing—original draft preparation, Z.Z.; writing—review and editing, Y.C.; visualization, Y.L.; supervision, Z.Z.; project administration, Y.L.; funding acquisition, Y.C. All authors have read and agreed to the published version of the manuscript.
Funding
This research received no external funding.
Institutional Review Board Statement
Not applicable.
Informed Consent Statement
Not applicable.
Conflicts of Interest
The authors declare no conflict of interest.
References
- Emergency Management Department Fire and Rescue Department of China. National Fire and Emergency Response in 2020. Available online: https://www.119.gov.cn/article/41kpo4CAQyv (accessed on 1 February 2021). (In Chinese)
- Huszar, R.J. Air curtains for patient isolation. Jama 1969, 207, 549–551. [Google Scholar] [CrossRef] [PubMed]
- Snook, R. A ‘hot air curtain’ for heating an ambulance. Resuscitation 1974, 3, 151–153. [Google Scholar] [CrossRef]
- Ford, V.H.; Hole, B.J. Air curtains for reducing exposure of heading machine operators to dust in coal-mines. Ann. Occup. Hyg. 1984, 28, 93–106. [Google Scholar] [PubMed]
- Ge, Y.T.; Tassou, S.A. Simulation of the performance of single jet air curtains for vertical refrigerated display cabinets. Appl. Therm. Eng. 2001, 21, 201–219. [Google Scholar] [CrossRef]
- Navaz, H.K.; Faramarzi, R.; Gharib, M.; Dabiri, D. The application of advance methods in analyzing the performance of the air curtain in a refrigerated display case. J. Fluids Eng. Trans. Asme. 2002, 124, 756–764. [Google Scholar] [CrossRef][Green Version]
- Gugliermetti, F.; Santarpia, L.; Zori, G. Air curtain applied to fire smoke pollution control. In Advances in Air Pollution Series; Patania, F., Brebbia, C.A., Eds.; WIT Press: Catania, Italy, 2003; Volume 13, p. 541. [Google Scholar]
- Santarpia, L.; Gugliermetti, F.; Zori, G. Ventilation improvement in fire smoke control. In Wit Transactions on Biomedicine and Health; Brebbia, C.A., Popov, V., Fayzieva, D., Eds.; WIT Press: Bologna, Italy, 2005; Volume 9, pp. 241–250. [Google Scholar]
- Goncalves, J.C.; Costa, J.J.; Lopes, A.M.G. Parametric study on the performance of an air curtain based on CFD simulations—New proposal for automatic operation. J. Wind. Eng. Ind. Aerodyn. 2019, 193, 103951. [Google Scholar] [CrossRef]
- Felis, F.; Pavageau, M.; Elicer-Cortes, J.C.; Dassonville, T. Simultaneous measurements of temperature and velocity fluctuations in a double stream-twin jet air curtain for heat confinement in case of tunnel fire. Int. Commun. Heat Mass Transf. 2010, 37, 1191–1196. [Google Scholar] [CrossRef]
- Huo, Y.; Zou, G.; Dong, H.; Gao, Y. Numerical simulation of smoke and heat insulation effect of double layer air curtain with different air supply forms. Chin. Soc. Eng. Thermophys. 2012, 59, 10–18. (In Chinese) [Google Scholar]
- Krajewski, G.; Suchy, P. Verification of CFD Model of Plane Jet Used for Smoke Free Zone Separation in Case of Fire. In Computer Methods in Mechanics; Podgorski, J., Borowa, E.B., Bec, J., Burczynski, T., Kuczma, M., Latalski, J., Warminski, J., Eds.; Polish Soc Comp Methods Mech: Lublin, Poland, 2018; Volume 1922, p. 110010. [Google Scholar]
- Razeghi, S.M.J.; Safarzadeh, M.; Pasdarshahri, H. Evaluation of air curtain and emergency exhaust system for smoke confinement of an enclosure. J. Build. Eng. 2021, 33, 101650. [Google Scholar] [CrossRef]
- Gao, D.L.; Li, T.; Chen, Z.N.; You, S.H.; Wang, Z.K.; Wang, K.H.; Lin, P.; Mei, X.J. Effectiveness of Smoke Confinement of Air Curtain in Tunnel Fire. Fire Technol. 2020, 56, 2283–2314. [Google Scholar] [CrossRef]
- Xiong, L.F.; Lin, Y.; Li, S.W. Turbulence Model and Its Application in Fluent Software. Ind. Heat. 2007, 4, 13–15. (In Chinese) [Google Scholar]
- Yu, L.X.; Liu, F.; Beji, T. Experimental study of the effectiveness of air curtains of variable width and injection angle to block fire-induced smoke in a tunnel configuration. Int. J. Therm. Sci. 2018, 134, 13–26. [Google Scholar] [CrossRef]
- Huang, D. Numerical Simulation of Smoke Control Effect of Single Blown Air Curtain; Southwest Jiaotong University: Chengdu, China, 2008. (In Chinese) [Google Scholar]
- Gao, D. An Experimental Study on Smoke Propagation and Confinement in Longitudinal Ventilation Tunnel; Southwest Jiaotong University: Chengdu, China, 2020. (In Chinese) [Google Scholar]
Publisher’s Note: MDPI stays neutral with regard to jurisdictional claims in published maps and institutional affiliations. |
© 2021 by the authors. Licensee MDPI, Basel, Switzerland. This article is an open access article distributed under the terms and conditions of the Creative Commons Attribution (CC BY) license (https://creativecommons.org/licenses/by/4.0/).