Article

Thermal Calculations of Four-Row Plate-Fin and Tube Heat Exchanger Taking into Account Different Air-Side Correlations on Individual Rows of Tubes for Low Reynold Numbers

Faculty of Environmental Engineering and Energy, Cracow University of Technology, 31-155 Cracow, Poland
*
Author to whom correspondence should be addressed.
Energies 2021, 14(21), 6978; https://doi.org/10.3390/en14216978
Submission received: 27 September 2021 / Revised: 13 October 2021 / Accepted: 20 October 2021 / Published: 25 October 2021
(This article belongs to the Special Issue Numerical Heat Transfer and Fluid Flow 2021)

Abstract

:
Currently, when designing plate-fin and tube heat exchangers, only the average value of the heat transfer coefficient (HTC) is considered. However, each row of the heat exchanger (HEX) has different hydraulic–thermal characteristics. When the air velocity upstream of the HEX is lower than approximately 3 m/s, the exchanged heat flow rates at the first rows of tubes are higher than the average value for the entire HEX. The heat flow rate transferred in the first rows of tubes can reach up to 65% of the heat output of the entire exchanger. This article presents the method of determination of the individual correlations for the air-side Nusselt numbers on each row of tubes for a four-row finned HEX with continuous flat fins and round tubes in a staggered tube layout. The method was built based on CFD modelling using the numerical model of the designed HEX. Mass average temperatures for each row were simulated for over a dozen different airflow velocities from 0.3 m/s to 2.5 m/s. The correlations for the air-side Nusselt number on individual rows of tubes were determined using the least-squares method with a 95% confidence interval. The obtained correlations for the air-side Nusselt number on individual rows of tubes will enable the selection of the optimum number of tube rows for a given heat output of the HEX. The investment costs of the HEX can be reduced by decreasing the tube row number. Moreover, the operating costs of the HEX can also be lowered, as the air pressure losses on the HEX will be lower, which in turn enables the reduction in the air fan power.

Graphical Abstract

1. Introduction

Plate and fin heat exchangers (PFTHEs) are complicated devices. Their construction, which involves cross thin metal sheets and tubes with different numbers of rows, different fin pitches, and tube sizes, causes complicated phenomena on the air- and/or water-side [1]. Each row in PFTHEs operates in a different way. Differences are caused by variations in air and water temperatures, airflow turbulence, or even air velocity. Those elements cause different HTCs in each row [2].
Performance characteristics of tube heat exchangers are most often determined experimentally. This is usually due to the high complexity of the systems studied. An example is the experimental testing of photovoltaic (PV) cells cooled by phase-change materials (PCM) [3]. Fouling phenomena in exchangers are also investigated experimentally. Ali et al. [4] investigated the influence of dust deposited on the surface of two types of PVs, monocrystalline silicon, and polycrystalline silicon modules. Experimental studies are also widely used to determine the flow and heat characteristics of finned tube heat exchangers. Heat transfer correlations are determined on the side of the flowing gas, which is usually air, in a wide range of Reynolds number variations [5]. Additionally, the effectiveness of various types of improvements in the design of heat exchangers, such as oval tubes [6], new fin shapes, or guide vanes forming the air flow in the exchanger [5], is usually evaluated experimentally. Despite the high reliability of the obtained results, a disadvantage is the cost of experimental studies. To determine the experimental characteristics of an exchanger with a different number of rows, tubes, or different construction, it is necessary to build an experimental test facility equipped with a measuring apparatus and a computer data acquisition system. Moreover, the time and therefore costs of experimental investigations are high. Therefore, CFD modelling is increasingly used in the development of tubular cross-flow heat exchangers [7]. The influence of various innovations in the design of the exchanger is modelled in different ranges of Reynolds numbers on the air-side and on the fluid-side flowing inside the tube. Four round-convex strips were placed around the tube to enhance air-side heat transfer [8].
If the experimental testing cannot be fully replaced, then the experiment comes down to verification of a certain part of the results [9]. The CFD modelling gives us increased flexibility in the research and industry. This study shows the newly determined correlations of the air-side Nusselt number for the four-row PFTHE. Those correlations illustrate new functions to determine HTC in a particular row of PFTHE. Individual correlations can also change the way we look at the heat flow inside PFTHE.
Until recently, plenty of Nusselt number, Colburn factor, or HTC correlations were determined. However, the majority are referred to as average correlations. Some studies presented local HTCs and only a few of them showed results or determined Nusselt number correlations for a particular row in multi-row PFTHEs.
The first group of research overviews is about average HTCs in PFTHEs. Khan et al. [10] investigated twisted oval tube HEXs and designated the average Nusselt numbers and pressure drop correlations. Lindqvist et al. [11] conducted CFD research taking into account different tube bundle array angles. They also presented diagrams with the Colburn factors for low Reynold numbers. Łęcki et al. [12] presented a comparison between HTCs obtained using CFD simulation to the one calculated with VDI correlation for three-row inline PFTHE. Sadeghianjahromi et al. [13] determined HTCs and pressure drop factors of PFTHEs with different fin types and circular and flat tubes under dry and wet conditions. Elmekawy et al. [14] showed that attaching the splitter plates to the tubes could increase the Nusselt number and reduce the pressure drop. Okbaz et al. [15] presented different Colburn factors correlations for PFTHEs with different numbers of rows. However, those correlations were averaged for entire PFTHEs. Petrik and Szepesi [16] determined Nusselt number correlations for one and two-row U-shape HEXs. Additionally in another piece of research, Petrik et al. [17] presented Nusselt number correlations but for standard PFTHEs. González et al. [18] presented the average Nusselt numbers as a function of fin material and Reynolds number for two-row PFTHE with inline tube arrangement. Awais and Bhuiyan [19] collected plenty of Colburn factor correlations in their state-of-the art paper. It is possible to present many more average correlations. However, it is not necessary for this research. Adam et al. [20], in a state-of-the-art paper, shows studies of local HTCs and local heat/mass transfers coefficients.
All of the above research is related to the average Nusselt numbers, Colburn factors, or HTC correlations, or presents local HTCs to predict heat transfer correlations for the entire PFTHE. There are only a couple instances of research referring to heat transfer correlations for a particular row in PFTHEs. During the 1970s, Rich et al. [21] showed experimental research where a Colburn factor in a particular row for multi-row PFTHEs, with one-row to eight-rows, was presented. This was the first time when someone showed variation in the HTC inside PFTHEs. Taler et al. [2] determined individual Nusselt number correlations for each row in the case of two-row PFTHE. Despite its high practical importance and current marginal existence in the literature, there is a lack of heat transfer correlations on individual tube rows for heat exchangers with different number of tube rows. Additionally, the literature is full of average Nusselt number, Colburn factor, or HTC correlations for different fin geometries, tube geometries, fin pitches, tube sizes, air velocities, etc.
Only Rich et al. [21] showed that further tube rows in multi-row PFTHEs are inefficient when the air velocity is low and the airflow in the exchanger is laminar. However, correlations on Nusselt number for individual tube rows have not been developed. Taler et al. [22] showed that in a two-row automotive radiator, made with round or oval tubes, the first row of tubes is more efficient than the second row when the air velocity is less than 2.5 m/s. However, coolers with larger tube numbers have not been modelled by CFD or studied experimentally. There are many problems to solve, such as: whether a larger cross-section of a PFTHE, but with a smaller number of rows, would be more efficient than a three-, four-, or five-row PFTHE. Which row is the least effective? Should we consider individual correlations in the case of multi-row PFTHEs?
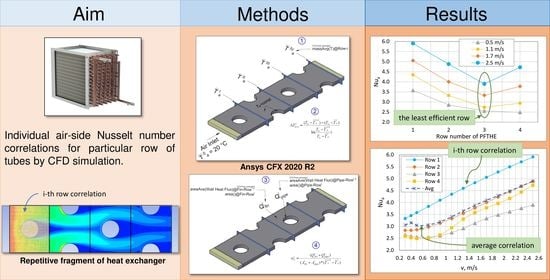
The present research refers to four-row PFTHE with the air velocity before the HEX changing in the range from 0.5 m/s to 2.5 m/s. This paper covers:
  • Determination of individual air-side Nusselt number correlations by CFD simulation;
  • Determination of average air-side Nusselt number correlations by CFD simulation;
  • Comparison of determined correlations to correlations available in the literature.

2. Problem Statement

This paper presents a three-dimensional (3D) steady-state CDF simulation of PFTHE under the following assumptions:
  • Constant air inlet temperature: 20 °C.
  • Air outlet as an open condition with checking the average mass temperature in the air outlet cross-section.
  • Constant air-side wall surface temperature (including tube and fins temperature): 70 °C.
  • Variable air parameters dependent on the temperature.
  • Shear Stress Transport (SST) turbulence model.
  • Relative differences ( e T n ) between different mass average air temperatures in the last (the fourth) row of PFTHE for mesh with particular element numbers ( T n i ) and the reference mass average temperature in the last (the fourth) row of PFTHE for mesh with 6,790,572 mesh elements ( T 6 , 790 , 572 ) are shown in Equation (1). The above reference mesh has been selected for further calculations as the best ratio of calculation accuracy to calculation time.
e T n = ( T n i T 6 , 790 , 572 ) T 6 , 790 , 572
  • Relative differences ( e T w ) between the Nusselt number for a particular fin and tube surface temperature ( N u T w ) and Nusselt number for the reference fin and tube surface temperature: 70 °C ( N u 70   ° C ) as calculated according to Equation (2).
e T w = ( N u T w N u 70   ° C ) N u 70   ° C

3. Description of the Geometry of the Repeating Element of the Exchanger

Figure 1 presents a 3D view and geometry of analysed PFTHE. Directions of air and water flow are shown. Figure 1b illustrates a repetitive fragment of air between one fin pitch in PFTHE (grey colour). In this case, fin pitch equals 3 mm. However, the distance between surfaces of the adjacent plate fins is 2.84 mm. This is because the fin thickness is 0.14 mm. In the same picture, we can observe yellow colours in front and behind the PFTHE. Those fragments are free zones of air for the correct performance of CFD simulation. Each zone is 5 mm in length (Figure 1b). The diameter of the tubes is 12mm. Air Inlet in CFX software is set as a constant temperature: 20 °C. Air outlet is set as an opening condition with checking mass average temperature in the outlet cross section of air. The rest of the boundary conditions of the CFX software are shown in Figure 2a.

4. Mesh Parameters and Mesh Independent Study

Mesh characteristics are presented in 
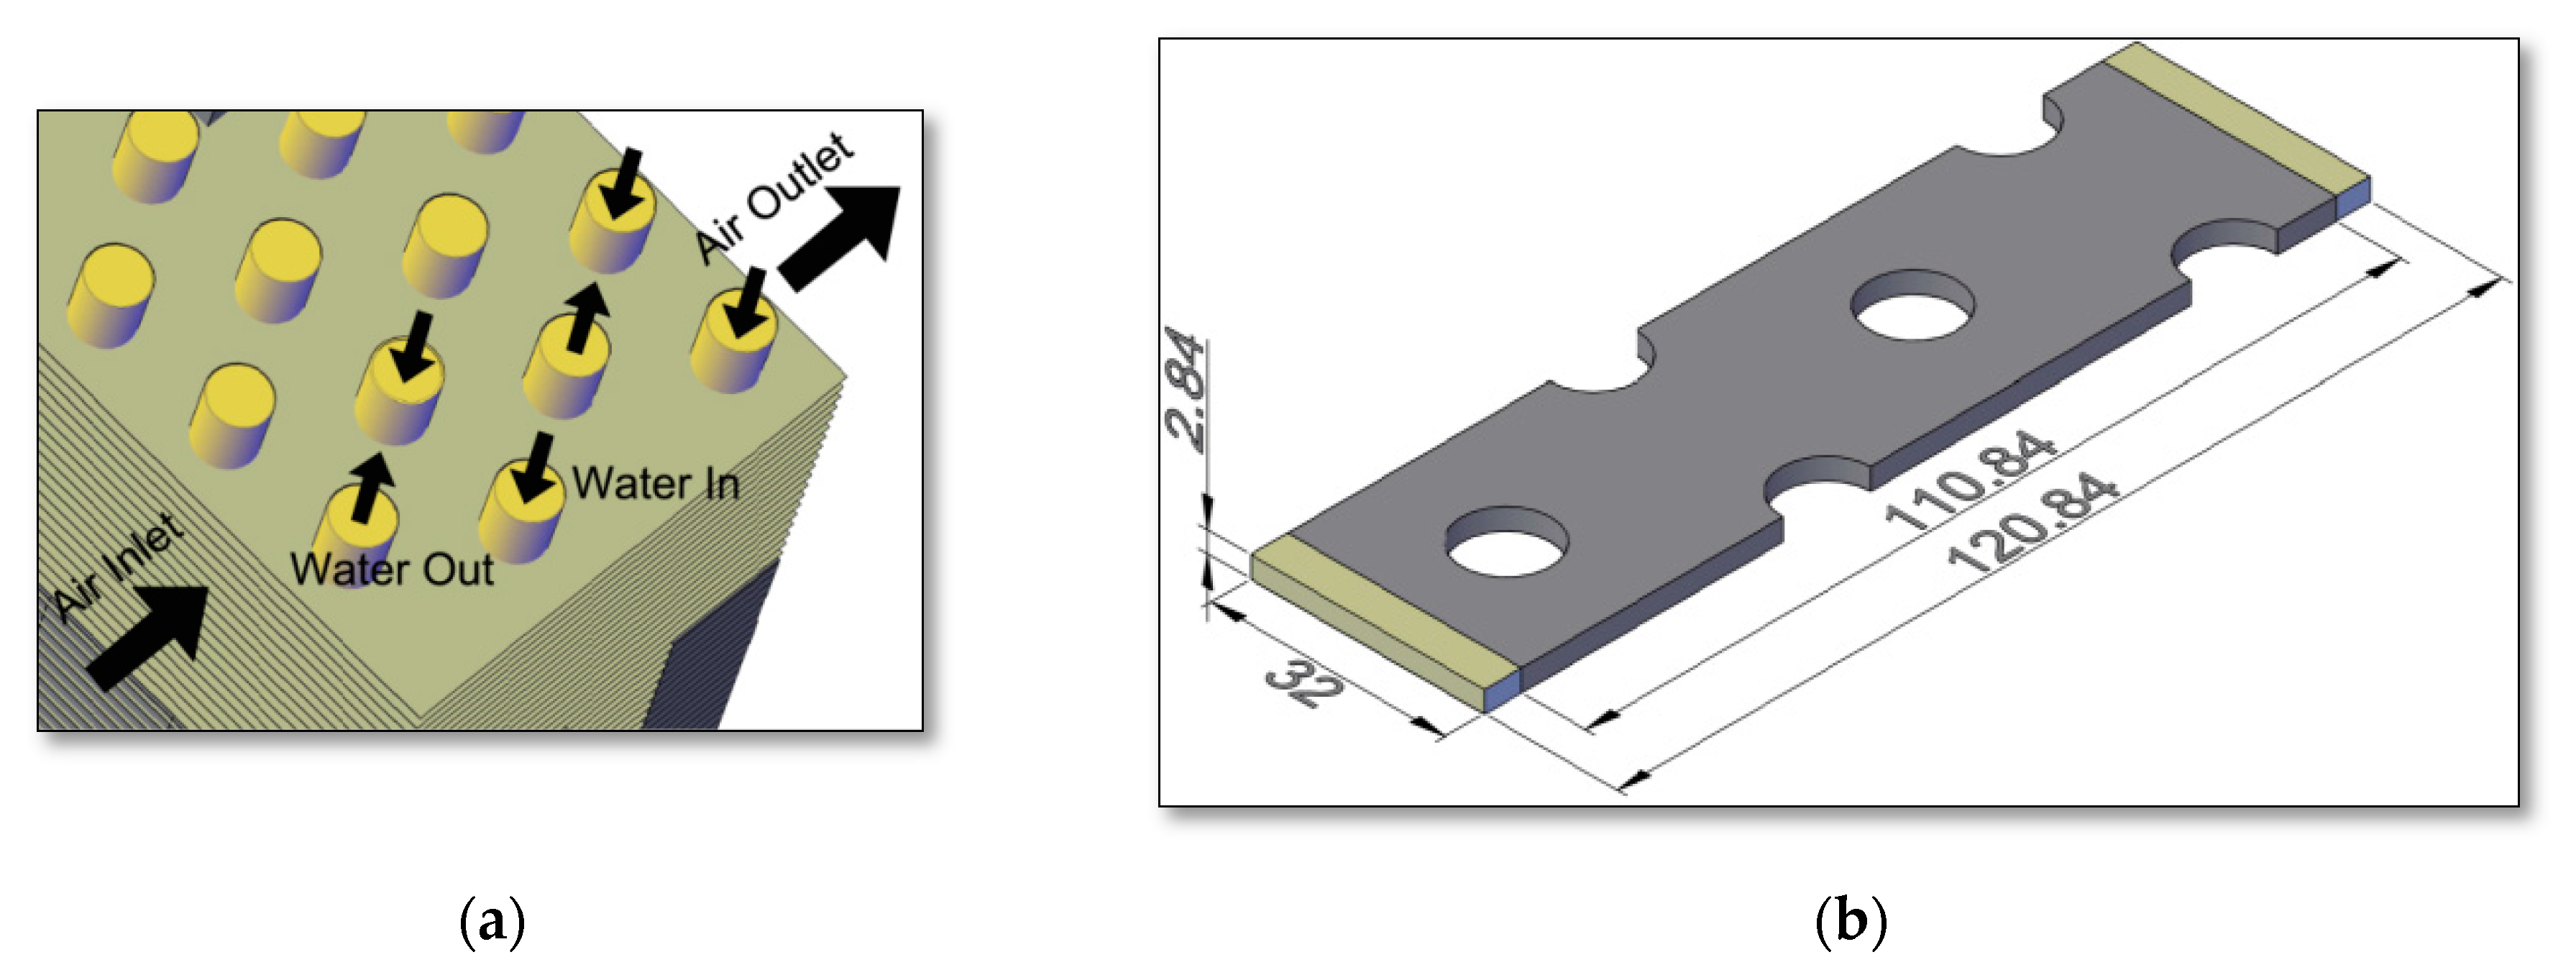
Table 1. The division of the modelled domain into finite elements considers mesh compaction at the junction of the air and fin wall surface and air and tube wall surface (Figure 2b).
All simulations for the entire range of air velocity were preceded by mesh independent studies, separately for all considered air velocities. The final mesh was selected only for the most favourable simulation. Temperature stabilisation for air velocity—4 m/s for the fourth row of PFTHE—is shown in Figure 3. It was observed that, from air velocity in front of PFTHE, more than 2.5 m/s temperature stabilisation is not much different in comparison with temperature stabilisation in the fourth (last) row of PFTHE. Temperature stabilisation showed that, between chosen mesh element size and mesh with almost 30 million elements, relative differences were less than 1% for the fourth row of PFTHE (Figure 3). Moreover, for the first row, even for 10 m/s relative differences between chosen mesh and mesh with over 30 million, elements are less than 0.1% (Equation (1). This shows that, in the considered scenario, the greatest irregularity of flow and turbulence exists in the last row of PFTHE.
A mesh with 6,790,572 elements was selected. Mesh elements’ size belongs to the following CFX mesh sizes: mesh element size: 0.15 mm; mesh max size: 0.25 mm (Table 1). The whole mesh contains cuboidal elements only (Figure 1b).

5. Method of Determining HTC on the Individual Row Based on CFD Simulations

A method for determining HTCs for the individual rows is illustrated with an example of four-row PFTHE (Figure 4). The HTC is appointed, factoring constant fin and tube temperatures, which are equal to 70 °C Further simulations have also been performed for two different temperatures: 60 °C and 80 °C. It has been shown that, for three different surface temperatures of the tubes and fins, the determined HTCs do not differ more than 1.5% (Figure 5), and that proposed procedure for determining the air-side HTC can be successfully used in practice. The method consists of the following steps.
  • Export the average mass flow temperature T ¯ ia from CFX simulations of considered air velocity ranging for each row independently. Cross-section to export temperatures in a half distance between the next two tubes in rows.
  • Calculate the mean logarithmic temperature ( Δ T ¯ m , a ) difference between fin and tube surface temperature (Tw) and average mass flow temperature ( T ¯ a i ) (Equation (3).
Δ T m , a i = ( T w T ¯ a i + 1 ) ( T w T ¯ a i ) l n ( T w T ¯ a i + 1 T w T ¯ a i )
The symbol T w denotes a constant fin and tube surface temperature. The symbols T ¯ a i and T ¯ a i + 1 designate the inlet and outlet mass average air temperature for the i-th row of PFTHE. Then:
  • Export total heat flow rate transferred from fin and tube wall surface to air (Figure 4).
  • Calculate individual HTC for each row (Equation (4) (Figure 4)).
α a i = Q i / ( A w Δ T m , a i )
The following designations are used in Equation (4): Q   i the total heat flow rate for the entire row of the repetitive fragment of PFTHE; α a i the air-side HTC in a particular row.
  • Calculate Nusselt number N u a i = ( α a i   d h ) / λ a and Colburn factor j a i = N u a i / ( R e a i   P r a i 1 / 3 ) .

6. CFD Simulation Results and Nusselt Number Correlations

The CFD simulation results of average mass flow temperatures behind the tube rows are shown in Table 2.
Presented correlations for air-side Nusselt numbers relate to Reynolds numbers. The Reynolds number (Equation (5) is related to the hydraulic diameter, which is calculated using the definition proposed by Kays and London [23], where w max is given by Equation (6). Parameter w max has been calculated for the minimum airflow cross-section between tubes and it can exist in a different place in case of different PFTHE construction. The hydraulic diameter has been calculated by assumption dividing the volume through which air flows in one row by the surface area in contact with the air. Most often, this hydraulic diameter in the case of PFTHE is a bit smaller than double the fin pitch, and using geometry from Figure 1, equals 5.35 mm.
Reynolds numbers ( R e d h , a ) (Equation (5) and maximal velocities ( w m a x ) (Equation (6)) have been calculated for each row separately, due to a different maximum air velocity caused by higher air temperature causing increased air volume. The calculated parameters such as Reynolds numbers, HTCs, Nusselt numbers, and Colburn factors are presented in Table 3, Table 4, Table 5 and Table 6.
R e d h , a = w max · d h ν a
The following designations are used in Equation (5): R e   d h , a is the Reynolds number in case of air hydraulic diameter; d h is the air hydraulic diameter; ν a is the air kinematic viscosity.
w max = ( s · p l ) ( s δ f ) · ( p l d o , m i n ) · ( T ¯ a i ) ( T ¯ a , o ) · w o
The symbol w m a x designates the air velocity in the least cross-section of the air flow. The symbol s denotes fin pitch. Other symbols represent: p l the longitudinal fin pitch δ f the fin thickness, d o , m i n the minimal dimension between tubes, T ¯ a i the mass average air temperature in i-th row of PFTHE, and T ¯ a , o the inlet mass average air temperature.
The approximation function was determined using the least-squares method. Using this function, the Nusselt number was approximated, depending on the Reynolds and Prandtl numbers, according to Equation (7). The range of Reynolds numbers considered is factored in the present study, and is also present in Equation (7).
N u a = x 1 · R e x 2 · P r 1 3                       140   <   R e   <   1500
The heat transfer correlation for the entire heat exchanger is shown in Figure 6. The Nusselt numbers for the first and second rows of tubes as a function of the Reynolds number, calculated separately for each row, are illustrated in Figure 7a,b. The heat transfer correlations for the third and fourth rows of tubes are shown in Figure 8a,b. Figure 6, Figure 7 and Figure 8 also show the confidence intervals for the Nusselt number calculated using Equation (7). The legend of each figure shows the corresponding correlation, either for the whole exchanger (Figure 6) or for a given row of tubes (Figure 7 and Figure 8). Each figure also shows the limits of the 95% confidence intervals for the Nusselt number on a given tube row, where the coefficients x1 and x2 are determined by the least-squares method. For the 95% confidence interval, the values of the Nusselt number calculated for a given Reynolds number (Equation (7)) differ by +/−2 σ, where the symbol σ denotes the mean standard deviation of the Nusselt numbers obtained by the CFD modelling. The process of determining 95% confidence intervals for correlations per Nusselt number obtained by least-squares is detailed in Chapter 11 of Taler’s book [24].

7. Discussion of the Obtained Results

Nusselt number correlations for considered PFTHE (Figure 1) have been determined using the CFD simulation data. New individual correlations (Figure 7 and Figure 8) for particular rows are significantly different from the average Nusselt number correlation for the entire PFTHE (Figure 6), also determined by the CFD simulation. Parameter x2 in Equation (7) determined by the least-squares method is compatible only for the first row with parameters known in the literature [2], while in the second row, there is a 46% discrepancy compared to the parameter x2 found by [2] for the two-row car radiator. The heat transfer correlations for the last two rows, the third, and fourth, are new and there are no existing correlations in the literature for comparison.
Additionally, Nusselt numbers fall between Reynolds numbers from 140 to 500, although they also increase from 500 to 1400. This increase may occur when the air stream does not separate away from the tube for low air velocity (0.3 m/s). The Nusselt number value is larger for higher air velocity (0.5 m/s–0.7 m/s) where the detachment of the air stream from the tube surface occurs.
The determined heat transfer correlations showed that the third row is the least efficient. It has been noticed that, for the entire air velocity range, the Nusselt number falls to the third row and then increases in the fourth row. This could mean that airflow in the penultimate row is less turbulent or airflow has formed only a narrow flow channel, leaving a wide heat transfer dead zone in front of and behind the tubes in the third row.
Experimental verification of derived CFD-based correlations has not been carried out in this paper. Experimental verification is planned as an extension of this research. The future of this research topic also considers a wider Reynolds number range, different tube and fin pitches, and tube diameters of PFTHE.

8. Conclusions

New heat transfer correlations for the air-side Nusselt number have been proposed for four-row PFTHE. Consideration of individual correlations on individual rows of heat exchanger tubes can improve designing of the PFTHEs. In the analysed range of air velocities in front of the heat exchanger from 0.3 m/s to 2.5 m/s, the average HTC for the first tube row has the highest value. In the subsequent tube rows, the HTC is lower compared to the HTC on the first tube row. This paper also presents a simple method for the determination of Nusselt number correlation for individual rows, which can reduce or even eliminate experimental research. The adoption of a constant external surface temperature for the ribs and tubes simplifies the determination of HTC on individual tube rows. It is shown that, for constant fin and tube surface temperatures of 60 °C, 70 °C, and 80 °C, the resulting HTC values for the same airflow velocity differ slightly. However, CFD simulation must be precisely conducted with a proper finite volume mesh and turbulence model for turbulent flows. CFD modelling is an effective tool for determining individual correlations for calculating the air-side Nusselt number on the individual tube rows of the exchanger.

Author Contributions

Conceptualisation, D.T., J.T.; methodology, software, validation, formal analysis, investigation, writing—original draft preparation, M.M.; resources, data curation, M.M., K.W.; writing—review and editing; supervision, D.T., J.T. All authors have read and agreed to the published version of the manuscript.

Funding

This research received no external funding.

Institutional Review Board Statement

Not applicable.

Informed Consent Statement

Not applicable.

Data Availability Statement

The data presented in this study are available on request from the corresponding authors.

Conflicts of Interest

The authors declare no conflict of interest.

Nomenclature

Afinarea of the fin sides, m2
Atubetube outer surface area, m2
dhhydraulic diameter, m
dotube outer diameter, m
erelative differences, %
jColburn factor
nnumber of mesh elements
NuNusselt number
pllongitudinal fin pitch, m
pttransversal fin pitch, m
PrPrandl number
rinouter radius of a plain tube, m
sfin pitch, m
ReReynold number
T ¯ a mass average air temperature, °C
T ¯ a , 0 air inlet temperature, °C
Δ T ¯ m , a log mean temperature difference, °C
Twwall temperature (tube and fin), °C
wair velocity, m/s
Qtotal heat transfer rate, W
x1Nusselt number parameter
x2Nusselt number parameter
y+dimensionless wall distance
αheat transfer coefficient, W/(m2.K)
λthermal conductivity coefficient, W/(m.K)
δffin thickness, m
σstandard deviation
νair kinematic viscosity, m2/s
0, I, II, III, IVnumber of PFTHE row
icurrent row of PFTHE
i+1next row of PFTHE
aair
avgaverage
inext iteration
maxmaximal

References

  1. Thulukkanam, K. Heat Exchanger Design Handbook, 2nd ed.; CRC Press: Boca Raton, FL, USA, 2013. [Google Scholar]
  2. Taler, D.; Taler, J.; Trojan, M. Thermal calculations of plate–fin–and-tube heat exchangers with different heat transfer coefficients on each tube row. Energy 2020, 203, 117806. [Google Scholar] [CrossRef]
  3. Ali, H.M. Recent advancements in PV cooling and efficiency enhancement integrating phase change materials based systems—A comprehensive review. Sol. Energy 2020, 197, 163–198. [Google Scholar] [CrossRef]
  4. Ali, H.M.; Zafar, M.A.; Bashir, M.A.; Nasir, M.A.; Ali, M.; Siddiqui, A.M. Effect of dust deposition on the performance of photovoltaic modules in city of taxila, Pakistan. Therm. Sci. 2017, 21, 915–923. [Google Scholar] [CrossRef]
  5. Li, X.Y.; Li, Z.H.; Tao, W.Q. Experimental study on heat transfer and pressure drop characteristics of fin-and-tube surface with four convex-strips around each tube. Int. J. Heat Mass Transf. 2018, 116, 1085–1095. [Google Scholar] [CrossRef]
  6. Matos, R.S.; Vargas, J.V.C.; Rossetim, M.A.; Pereira, M.V.A.; Pitz, D.B.; Ordonez, J.C. Performance comparison of tube and plate-fin circular and elliptic heat exchangers for HVAC-R systems. Appl. Therm. Eng. 2021, 184, 116288. [Google Scholar] [CrossRef]
  7. Maarawi, A.; Anxionnaz-Minvielle, Z.; Coste, P.; Raimondi, N.D.M.; Cabassud, M. 1D/3D Numerical Approach for Modelling a Milli-Structured Heat Exchanger/Reactor. Chem. Eng. Trans. 2021, 86, 1441–1446. [Google Scholar]
  8. Li, X.Y.; Mu, Y.T.; Li, Z.H.; Tao, W.Q. Numerical study on the heat transfer and pressure drop characteristics of fin-and-tube surface with four round-convex strips around each tube. Int. J. Heat Mass Transf. 2020, 158, 120034. [Google Scholar] [CrossRef]
  9. Marcinkowski, M.; Taler, D. Calculating the Efficiency of Complex-Shaped Fins. Energies 2021, 14, 577. [Google Scholar] [CrossRef]
  10. Khan, M.S.; Zou, R.; Yu, A. Computational simulation of air-side heat transfer and pressure drop performance in staggered mannered twisted oval tube bundle operating in crossflow. Int. J. Therm. Sci. 2021, 161, 106748. [Google Scholar] [CrossRef]
  11. Lindqvist, K.; Skaugen, G.; Meyer, O.H.H. Plate fin-and-tube heat exchanger computational fluid dynamics model. Appl. Therm. Eng. 2021, 189, 116669. [Google Scholar] [CrossRef]
  12. Łęcki, M.; Andrzejewski, D.; Gutkowski, A.N.; Górecki, G. Study of the Influence of the Lack of Contact in Plate and Fin and Tube Heat Exchanger on Heat Transfer Efficiency under Periodic Flow Conditions. Energies 2021, 14, 3779. [Google Scholar] [CrossRef]
  13. Sadeghianjahromi, A.; Wang, C.C. Heat transfer enhancement in fin-and-tube heat exchangers—A review on different mechanisms. Renew. Sustain. Energy Rev. 2021, 137, 110470. [Google Scholar] [CrossRef]
  14. Elmekawy, A.M.N.; Ibrahim, A.A.; Shahin, A.M.; Al-Ali, S.; Hassan, G.E. Performance enhancement for tube bank staggered configuration heat exchanger—CFD Study. Chem. Eng. Process.-Process Intensif. 2021, 164, 108392. [Google Scholar] [CrossRef]
  15. Okbaz, A.; Pınarbaşı, A.; Olcay, A.B. Experimental investigation of effect of different tube row-numbers, fin pitches and operating conditions on thermal and hydraulic performances of louvered and wavy finned heat exchangers. Int. J. Therm. Sci. 2020, 151, 106256. [Google Scholar] [CrossRef]
  16. Petrik, M.; Szepesi, G. Experimental and numerical investigation of the air side heat transfer of a finned tubes heat exchanger. Processes 2020, 8, 773. [Google Scholar] [CrossRef]
  17. Petrik, M.; Szepesi, G.; Jármai, K. CFD analysis and heat transfer characteristics of finned tube heat exchangers. Pollack Period. 2019, 14, 165–176. [Google Scholar] [CrossRef]
  18. González, A.M.; Vaz, M.; Zdanski, P.S.B. A hybrid numerical-experimental analysis of heat transfer by forced convection in plate-finned heat exchangers. Appl. Therm. Eng. 2019, 148, 363–370. [Google Scholar] [CrossRef]
  19. Awais, M.; Bhuiyan, A.A. Heat and mass transfer for compact heat exchanger (CHXs) design: A state-of-the-art review. Int. J. Heat Mass Transf. 2018, 127, 359–380. [Google Scholar] [CrossRef]
  20. Adam, A.Y.; Oumer, A.N.; Najafi, G.; Ishak, M.; Firdaus, M.; Aklilu, T.B. State of the art on flow and heat transfer performance of compact fin-and-tube heat exchangers. J. Therm. Anal. Calorim. 2020, 139, 2739–2768. [Google Scholar] [CrossRef]
  21. Rich, D. The effect of the number of tube rows on heat transfer performance of smooth plate fin-and-tube heat exchangers. ASHRAE Trans. 1975, 81, 307–317. [Google Scholar]
  22. Taler, D.; Taler, J.; Trojan, M. Experimental verification of an analytical mathematical model of a round or oval tube two-row car radiator. Energies 2020, 13, 3399. [Google Scholar] [CrossRef]
  23. Kays, W.; London, A. Compact Heat Exchangers, 3rd ed.; Krieger Pub Co.: Malabar, FL, USA, 1998. [Google Scholar]
  24. Taler, D. Numerical Modelling and Experimental Testing of Heat Exchangers; Springer Nature: Cham, Switzerland, 2019. [Google Scholar]
Figure 1. (a) The analysed PFTHE: 3D view; (b) Repetitive fragment of the PFTHE with run-up zone using in ANSYS-CFX 2020 R2: geometry, mm.
Energies 14 06978 g001
Figure 2. Repetitive fragment of the PFTHE with run-up zone using in ANSYS-CFX 2020 R2: (a) boundary conditions; (b) finite element mesh.
Energies 14 06978 g002
Figure 3. Temperature stabilisation for mesh independent study from the fourth row of PFTHE for 4 m/s air velocity in front of the heat exchanger.
Energies 14 06978 g003
Figure 4. Graphical representation of determining HTC on the individual row based on a CFD simulation. The numbers on the picture show the order of calculation to determine HTC in the case of PFTHE.
Energies 14 06978 g004
Figure 5. Relative differences of Nusselt numbers for each row of PFTHE for different air wall temperatures (constant temperature of fin and tube wall), where reference temperature is 70 °C: (a) 70 °C and 80 °C; (b) 70 °C and 60 °C.
Energies 14 06978 g005
Figure 6. The average value of the Nusselt number as a function of the Reynolds number for the entire PFTHE.
Energies 14 06978 g006
Figure 7. The Nusselt number as a function of the Reynolds number: (a) for the first row of PFTHE; (b) for the second row of PFTHE.
Energies 14 06978 g007
Figure 8. The Nusselt number as a function of the Reynolds number: (a) for the third row of PFTHE; (b) for the fourth row of PFTHE.
Energies 14 06978 g008
Table 1. Specification of the finite element mesh for the model presented in Figure 2b.
Number of Finite Elements6,790,572
Number of nodes6,989,646
The dimension of the element, mm0.15
The maximal dimension of the element, mm0.25
Boundary layerFirst layer thickness: 0.023 mm ( y + = 1 )
Growth rate: 1.1
Number of layers: 12
Minimum orthogonal angleAir: 36°
Mesh expansion factorAir: 12
Maximum aspect ratioAir: 20
Table 2. CFD simulation data.
iwo,i, m/sTIa,i, °CTIIa,i, °CTIIIa,i, °CTIVa,i, °C
10.359.9567.6769.4269.85
20.455.5565.1368.2369.34
30.552.0662.5166.6268.44
40.747.0757.9163.1066.03
50.943.7254.3759.9763.59
61.141.3351.6957.4561.63
71.339.5349.6055.4660.08
81.538.1147.9453.8758.71
91.736.9646.5752.5157.43
101.936.0145.4151.2756.25
112.135.2144.4150.1755.21
122.334.5243.5449.2154.34
132.533.9242.7648.3553.58
Table 3. Calculated thermal parameters for the first row of PFTHE.
iwo,i, m/swmax,i, m/sReIa,iαIa,iNuIa,ijIa,i
10.30.54169.617.073.330.022647
20.40.71227.417.573.450.017474
30.50.89285.418.143.580.014413
40.71.23402.019.323.840.010949
50.91.57519.120.534.090.009035
61.11.91636.321.724.350.007813
71.32.25753.722.894.590.006959
81.52.60871.224.024.830.006325
91.72.94988.725.125.060.005832
101.93.281106.426.195.280.005437
112.13.621224.127.225.490.005112
122.33.961341.828.245.700.004839
132.54.301459.629.225.910.004606
Table 4. Calculated thermal parameters for the second row of PFTHE.
iwo,i, m/swmax,i, m/sReIIa,iαIIa,iNuIIa,ijIIa,i
10.30.54150.915.442.830.021261
20.40.72204.115.312.830.015750
30.50.90258.215.352.860.012582
40.71.25368.215.742.970.009166
50.91.60479.616.443.130.007413
61.11.95591.817.343.320.006379
71.32.29704.618.383.540.005708
81.52.64817.719.493.770.005234
91.72.98931.220.614.000.004876
101.93.331044.921.734.230.004593
112.13.671158.922.834.450.004360
122.34.021273.023.904.670.004165
132.54.361387.424.934.880.003992
Table 5. Calculated thermal parameters for the third row of PFTHE.
iwo,i, m/swmax,i, m/sReIIIa,iαIIIa,iNuIIIa,ijIIIa,i
10.30.55147.614.622.650.020270
20.40.73198.314.232.590.014768
30.50.91250.013.972.550.011563
40.71.26355.613.782.550.008108
50.91.61463.114.022.610.006391
61.11.96571.714.602.740.005429
71.32.31680.915.472.920.004856
81.52.66790.616.543.130.004491
91.73.01900.717.523.330.004191
101.93.361011.318.263.480.003902
112.13.711122.218.913.620.003652
122.34.051233.319.603.760.003452
132.54.401344.820.293.900.003284
Table 6. Calculated thermal parameters for the first row of PFTHE.
iwo,i, m/swmax,i, m/sReIVa,iαIVa,iNuIVa,ijIVa,i
10.30.55146.914.342.590.019199
20.40.73196.513.922.520.013971
30.50.91246.913.702.490.010986
40.71.27349.713.712.510.007826
50.91.62454.514.332.640.006350
61.11.98560.415.882.940.005743
71.32.33666.917.733.300.005419
81.52.68773.919.113.570.005055
91.73.04881.520.143.770.004694
101.93.39989.821.063.960.004389
112.13.741098.522.114.170.004165
122.34.091207.423.454.430.004030
132.54.441316.624.934.720.003939
Publisher’s Note: MDPI stays neutral with regard to jurisdictional claims in published maps and institutional affiliations.

