1. Introduction
This article explores a diesel generator (DG) hybrid operation method involving a Li-ion battery. Although this hybrid operation method is recognized as a technique for increasing fuel consumption efficiency in diesel generators, it is not yet considered practical. The aim of this article is to prove that hybrid DG/Li-ion battery systems are now viable due to the significant decrease in Li-ion battery prices and to search for conditions under which these savings are achievable. In addition to the profit from fuel savings, we investigate the extra savings in cost resulting from reduced DG operating time, as well as the savings from delayed capital investment.
The use of DGs is increasing rapidly due to the increase in global energy demand. According to statistics for current trends, the DG market is expected to be at least USD 27.36 billion by 2022 [
1]. This factor along with figures suggesting a compound annual growth rate (CAGR) of 9.8% [
2] are undoubtedly important signs that the DG market will continue along this smile curve for a long time. This is because DGs offer one of the cheapest and most practical solutions for geographic environments where electricity is not available or where the power produced is insufficient. It would be unrealistic to expect renewable energy sources to completely replace DGs in the near future. Therefore, efforts to increase the efficiency of DGs will continue.
Given the usage rates of DGs worldwide, it is easy to see that their negative externalities in terms of CO
2 emissions are not negligible. For example, the US Environmental Protection Agency’s Carbon Emissions Calculator shows that a DG feeding a 1 MW load for 15 h a day emits 3506 metric tons of CO
2 per year [
3,
4]. Even a marginal global improvement in the fuel efficiency of DGs would lead to a significant global impact in the reduction of CO
2 emissions.
Most DGs deploy fixed-speed diesel engines, and one of the most pressing concerns for a fixed-speed DG is the drastic reduction in fuel efficiency during low-load operations [
5]. Fixed-speed generators operating at low loads consume remarkably more diesel than they do at their rated loads [
6,
7].
There are many methods that have been developed to increase the fuel efficiency of off-grid DGs [
6]. One is to integrate the DG with a storage battery. This method has been known for a long time in the form of hybrid DG/battery systems. In this work, we adopt the term “hybrid DG/Li-ion battery system” since we deploy a Li-ion battery. The basic operational logic of these systems is as follows: A Li-ion battery is added to a DG with the accompanying battery peripheral equipment such as the charger, inverter, and energy management system. This system of batteries is charged during the DG’s fuel-efficient period; that is, when the DG is feeding medium- or high-power loads. Operation of the DG is stopped in periods of very low fuel efficiency while low power loads are fed, and these loads are fed by the Li-ion battery. Thus, savings in fuel are achieved by evading the operating modes of the DG in which it has inefficient fuel consumption.
However, the achievement of these savings in fuel depends on certain factors, such as the DG’s low-load runtime and diesel fuel price and the capital investment in the Li-ion battery system. In addition to savings in fuel, the hybrid DG/Li-ion battery system enhances the system uptime due to the reduced operating time of the DG, thus delaying the next DG investment. With such high capital investments, postponement of new investment yields high economic returns. A significant change in one of the three factors mentioned above has the potential to seriously affect the performance of the hybrid DG/Li-ion battery system economically. However, there are not enough economic analyses on this subject in the literature.
There are hardly any articles focusing directly on hybrid DG/Li-ion battery systems in order to improve fuel efficiency in diesel power generators. Using the wider search index “Battery” instead of a more specific index, such as “Li-Ion Battery”, reveals only about 10 articles, which mostly deal with other important technical issues rather than economic analysis. Furthermore, articles on economic analysis use different perspectives depending on what they deem important. The few existing studies we have encountered generally approach the issue in terms a hybrid DG/battery without focusing on Li-ion batteries. There is a considerable gap in the literature regarding the economic gains of using hybrid DG/Li-ion battery systems. We bridge this gap by investigating the fuel savings and the postponement of the investment in a new DG using proper assumptions.
Arun et al. from the Indian Institute of Technology Mumbai presented an appropriate optimum-sizing methodology for battery-integrated diesel generation systems in 2008 [
8]. They aimed to minimize the investment and operating costs of the system. They increased the overall fuel consumption efficiency using a battery instead of a DG at low loads and reduced the capital cost by using the battery in parallel with the DG at overloads. In another, more recent article they expanded their economic analysis by incorporating uncertainty in demand [
9]. In addition, Simon Sloane from the Eaton Corporation showed that hybrid DG/battery solutions could provide significant fuel and other OPEX savings at a remote telecom site powered by a diesel generator [
10].
Singla et al. proposed that fuel consumption efficiency can be increased by adding a battery to a DG. They proved that a trade-off between battery size and the carbon footprint can be achieved and formulated an optimal schedule for battery charge and discharge [
11]. The same team presented a technique based on stochastic network calculus to choose a battery size to trade off carbon in a housing complex in a follow-up paper. They solved the problem in two steps: First, they studied the problem of eliminating the use of genset and then found the smallest battery size needed to ensure a set target for loss-of-power probability. Second, they studied the trade-off between the size of battery and genset carbon emission [
12].
Kusakana showed that hybrid DG/battery systems provide fuel savings using economic analyses [
13,
14,
15,
16] in four different studies authored and co-authored between 2013 and 2016. These studies focused on hybrid DG/battery systems without Li-ion batteries. Although these studies are closely related to ours in terms of purpose, their models, methods of analysis and findings are different.
In another study, Zhou et al. focused on coordinated power management strategies for a hybrid electric boat (HEB) [
17]. With the aid of the management strategy used, the diesel fuel efficiency was amplified by operating at an optimal level of power-sharing and stopping one of the two variable-speed DGs when it was unnecessary. This study concluded by highlighting the power management performance obtained through the deployed strategy. This research, however, did not highlight the economic dynamics involved in the setup. Kusakana et al. developed an optimal energy management model for an RTG crane fueled by a hybrid DG/Li-ion battery system with economic and environmental analyses. Their work aimed to reduce the energy cost and CO
2 emissions by minimizing the amount of fuel consumed and maximizing the potential energy recovered through regenerative braking during the container lowering phase [
18].
In contrast to the literature on DG/Li-ion battery systems, many PV/DG/Li-ion or wind/DG/Li-ion applications focus on providing energy when renewable energy sources are insufficient and on storing cheap or surplus energy [
19,
20,
21,
22,
23]. While the difference between these studies and ours should be appreciated, they contribute to the topic as they demonstrate the interoperability of Li-ion batteries with DG systems.
Our research contributes the following novelties to the related literature:
Hybrid DG/Li-ion battery systems often contribute to increasing fuel consumption efficiency and reduce CO2 emissions. However, unless the necessary conditions are met, the investment made in the add-on battery and peripheral equipment will not pay for itself. These necessary conditions relate to the battery price, diesel fuel price, and operating times of the DG under low loads. Unlike other studies, we present the implications of these conditions in detail, with economic analysis using up-to-date prices;
We offer a detailed examination of the additional savings arising from postponement of investment in a new DG. We calculated that this saving can reach up to 40% of the profit obtained from fuel savings over a 12 year timeframe;
We focus directly on the Li-ion battery rather than generic batteries. We highlight the advantage of compatibility between the working lives of DGs and Li-ion batteries;
We prove that the significant decline in Li-ion battery prices to USD 130 in 2021 makes hybrid DG/Li-ion battery systems economically attractive;
We share the details of the model developed in the MATLAB Simulink environment, as well as the calculation/comparison blocks we designed for economic analysis.
The most significant contribution of our article is that we prove that a method to increase energy efficiency in DGs is now viable due to the substantial decrease in Li-ion battery prices. We explore the conditions under which and such applications can be realized and to what extent. We make use of marginal analysis from economics studies to model and provide conclusions on the use of DG/Li-ion battery systems.
The obvious gap in the literature on the use of hybrid DG/Li-ion battery systems is primarily related to economic feasibility. However, the consistent drop in Li-ion battery prices [
24] over the last two years has made hybrid DG/Li-ion battery systems viable. Currently, Li-ion battery prices are around USD 130 per kilowatt-hour, making them even more competitive than lead acid batteries of equivalent capacities [
25,
26]. The economic analysis we conducted aims to draw attention to this new field and fill the crucial gap in the literature. We provide insight into the hybrid system from an economic viewpoint. We prove that Li-ion batteries make DGs significantly more efficient in their fuel consumption and that the hybrid DG and Li-ion battery system is competitive at current fuel prices.
We derive the conditions for optimal fuel savings using a Simulink model’s calculation and comparison blocks. In addition, we evaluate the appropriate time for the hybrid system to amortize itself. A marginal cost–benefit analysis is used to provide economic facts on the extra savings resulting from the postponement of the new investment due to the reduced DG operating time. We also provide a 12-year economic analysis to compare the returns from fuel savings and the returns from DG investment postponement.
Section 2 presents the objectives of the model-based economic analysis deployed in this article, detailing the steps taken towards determining the model design criteria and the list of outputs produced by the model.
Section 3 covers the individual functions of the sub-blocks of the model.
Section 4 discloses the way the working scenarios were generated and their results.
Section 5 presents and discusses the analysis used. Finally, the conclusion summarizes and discusses the results.
2. Objectives and Characteristics of the Model
The main objectives of the model are:
- (a)
To prove that the Li-ion battery system add-on enhances DGs’ fuel efficiency and investigate factors that have direct impacts on fuel savings;
- (b)
To determine the levels of savings in fuel that can be achieved through fuel efficiency in different scenarios;
- (c)
To determine how the variable capacity of a Li-ion battery affects fuel savings from an economic perspective, since the capacity of a Li-ion battery added to a DG varies with the power and duration of the loads it needs to feed;
- (d)
To determine the degree to which the working time of the DG is reduced as a result of the addition of a Li-ion battery, as well as the degree that investment in a new DG is postponed and the economic cost saving implied by this postponement;
- (e)
To compare the profits resulting from fuel saving and postponement of new investment.
2.1. Main Characteristics of the Model
We opted to use a 457 kW off-grid DG to demonstrate fuel efficiency in the economic analysis because the wastage caused by fuel inefficiency reveals itself more clearly in high-power DGs.
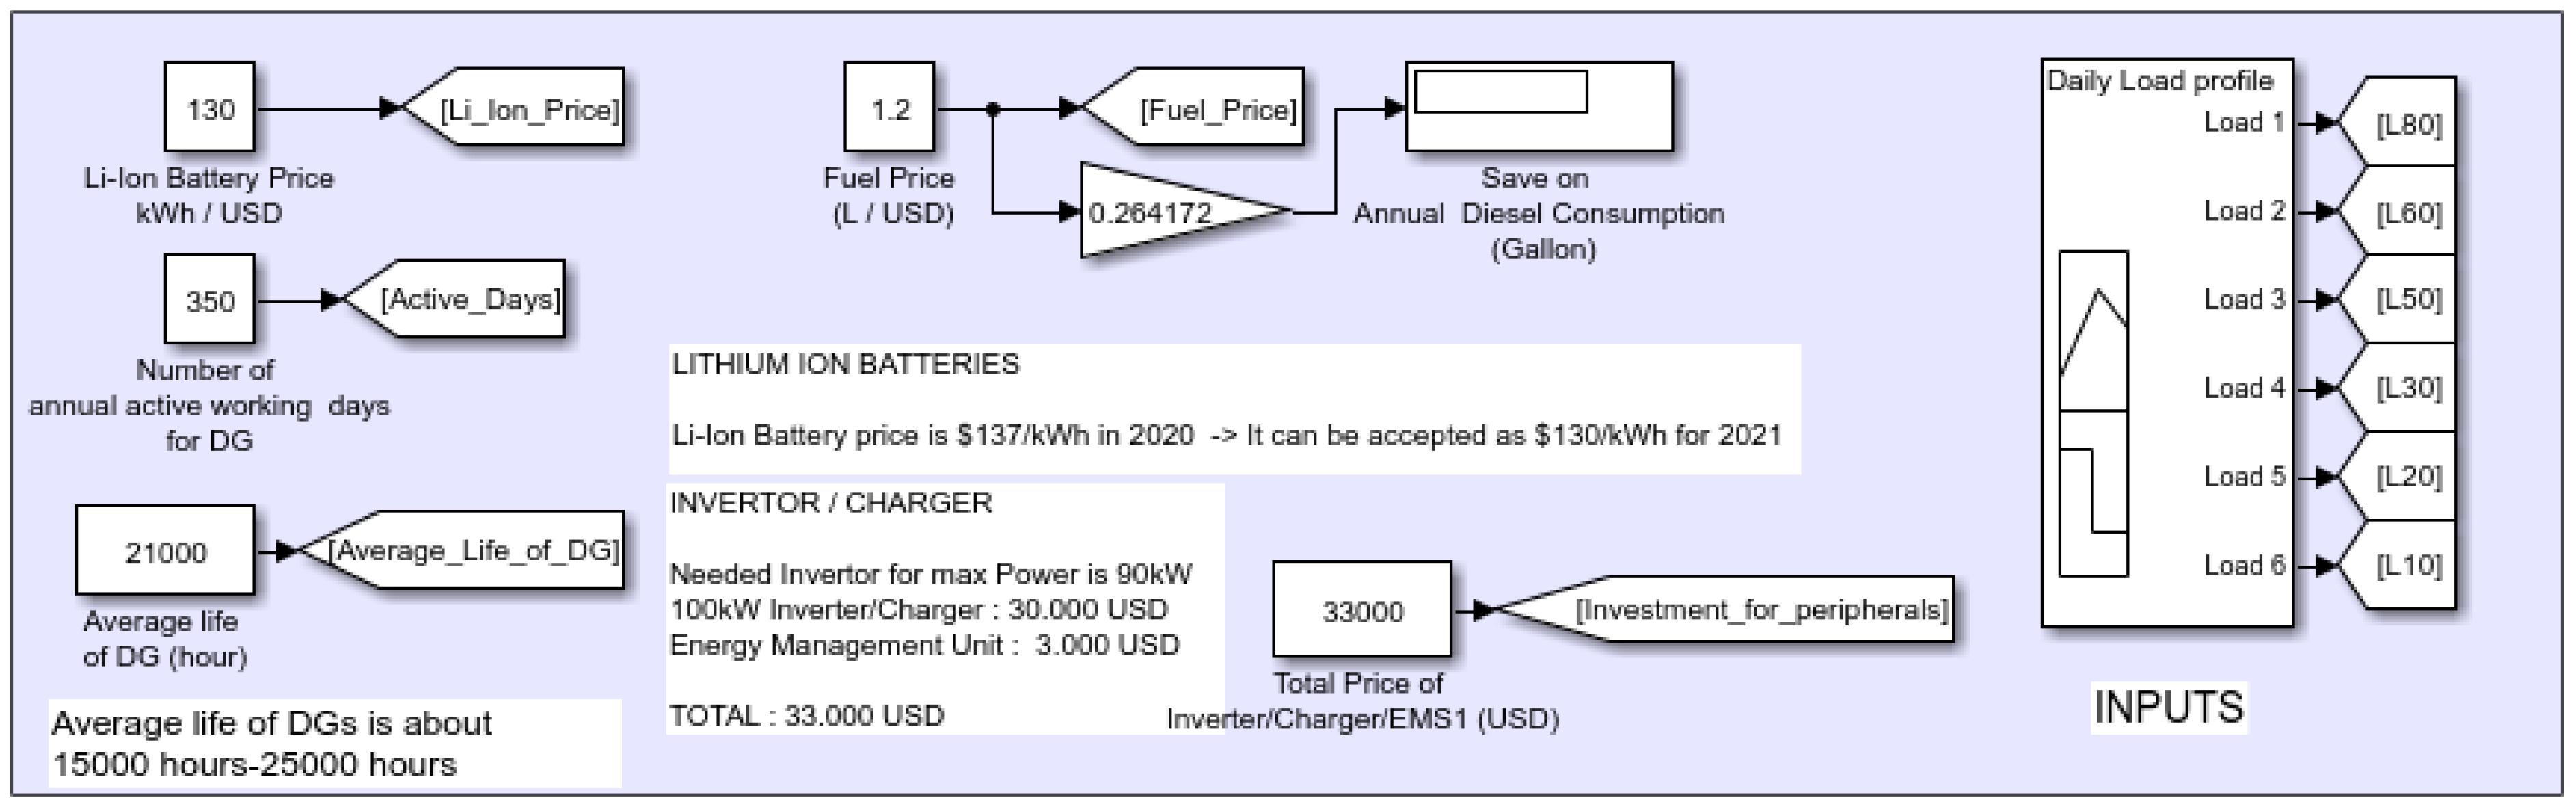
Inputs: The parameters (factors) that affected the performance of the hybrid DG/Li-ion battery system were identified as the inputs of the system. These variables were the Li-ion battery price (in USD/kWh), diesel fuel price (in USD/L), and load profile (in kWh). We used different combinations of these variables to set different operating scenarios.
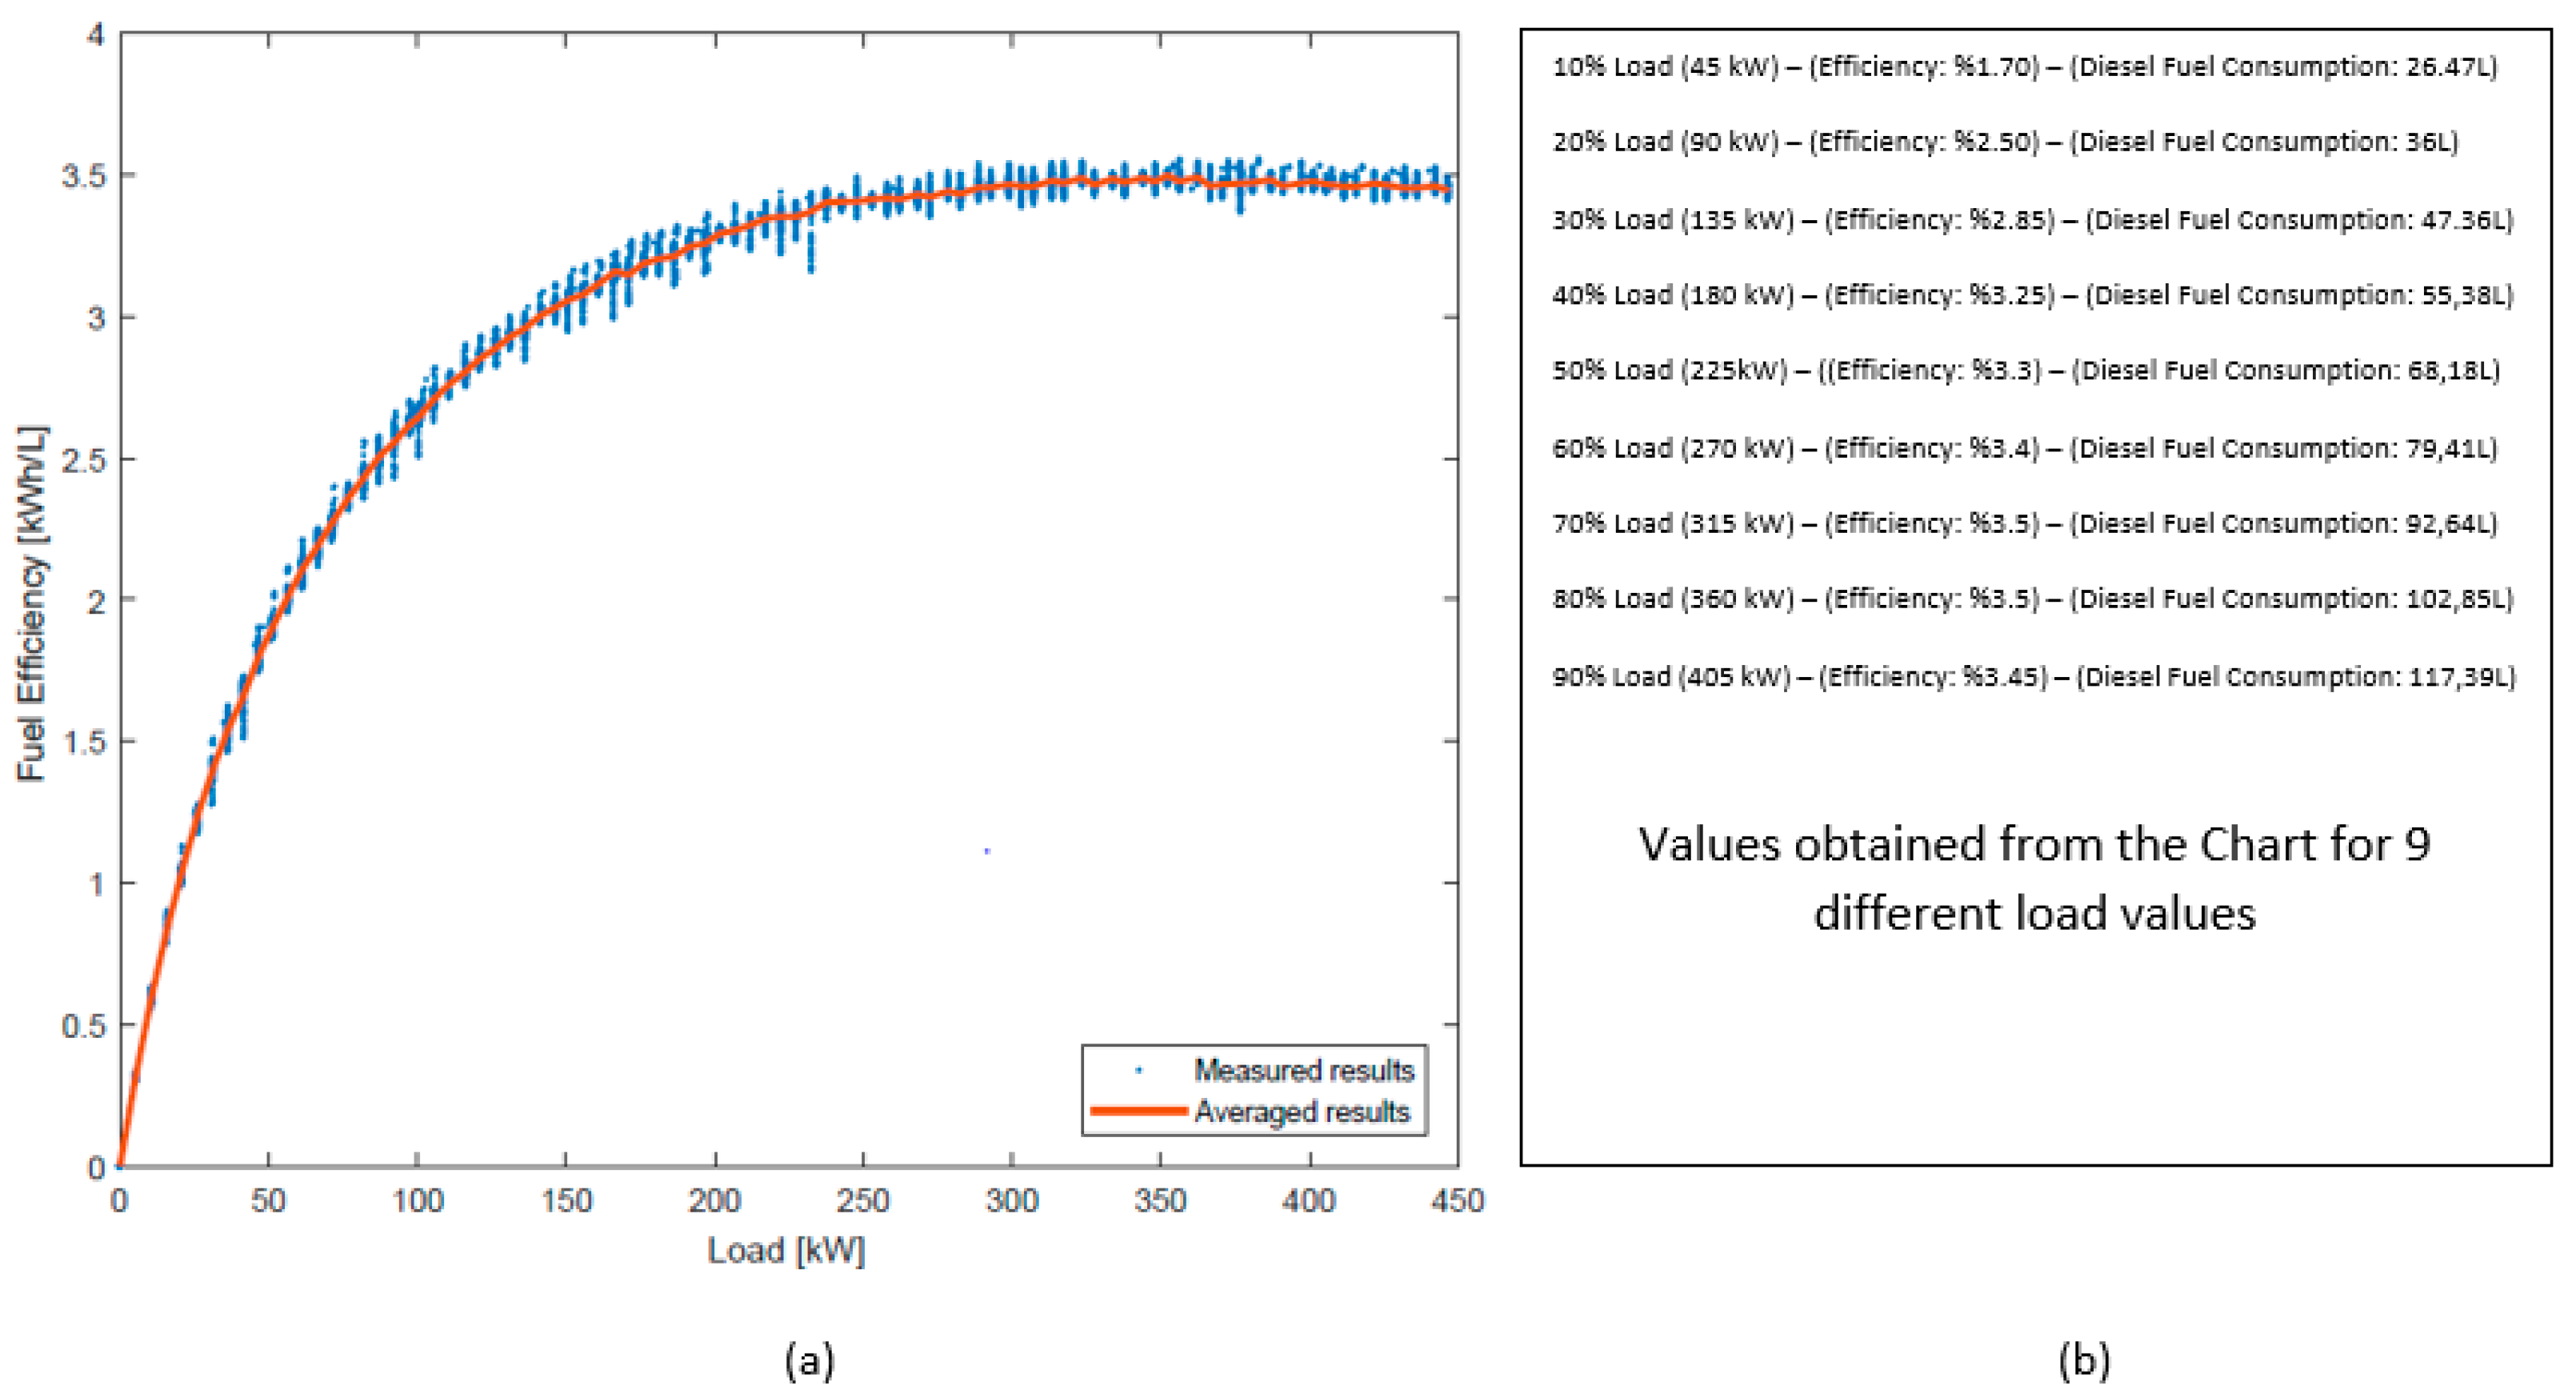
Modeling the change in load profile: Since the maximum load was 457 kW, we calculated other loads as percentages of this maximum load. For example, a 90 kW load corresponding to 20% of the maximum load would be simply 20%L. We defined these loads at six different levels as 10%L, 20%L, 30%L, 50%L, 60%L, and 80%L. We varied the activation times of these loads (in hours) to determine the load profile. Since the load levels were limited, we obtained the corresponding energy efficiency value (kWh/L) for each load from the curve shown in
Figure 1 and used it as constant in the model. This curve was obtained from the real application of the DG, which we used as an example [
7].
Modeling the increase in fuel consumption efficiency: To model the increase in fuel consumption efficiency in the DG, we ran the DG both without and with a Li-ion battery in parallel. We used the same load profile for both modes of operation. Here, our aim was to feed low-power loads, involving in very low fuel consumption, from the Li-ion battery instead of the DG and to charge the Li-ion battery in the period when the DG fed medium- and high-power loads; that is, in the period when energy efficiency was high. Thus, we moved the working period with high energy efficiency to the working period with low energy efficiency.
Modeling the resulting fuel economy: The two operating modes we mentioned above represent the DG working at conventional fuel consumption efficiency and at increased fuel consumption efficiency. High fuel efficiency allows the same job to be done with a smaller amount of fuel. Therefore, by comparing the daily fuel consumption of these two operating modes, we found the daily fuel-saving amount and the economic equivalent of this for different diesel fuel prices. By simulating the model under different scenarios, we determined the conditions under which a level of fuel saving and its economic equivalent could be realized.
Modeling the payback period of the Li-ion battery system: In order to model the payback period of the Li-ion battery added to the DG, the Li-ion battery price had to be determined. In our model, we determined that the Li-ion battery capacity most suitable for each load profile of the DG had to be used. Otherwise, the hybrid DG/Li-ion battery system at stake would lose its economic feature. Taking this reality into account, the model was used to calculate the optimal Li-ion battery capacity for each load profile. Based on this calculation, we determined the total cost of the Li-ion battery system. We calculated the payback time by using the economic equivalent of the annual savings achieved and the total investment amount for the Li-ion battery system.
Outputs: We list all outputs, some of which were intermediate, below:
Diesel fuel consumption amount (L/kWh), calculated with the data received from the real fuel efficiency curve for a 457 kW DG that we used as an example application;
Total daily energy consumption (kWh) for both operating modes;
Total daily diesel fuel consumption (L) for both operating modes;
The amount of energy saved per day and per year (in kWh), based on the difference in total daily energy consumed in both operating modes;
The amount of diesel fuel (L) saved daily and annually, based on the difference in total daily diesel consumption in both operating modes;
The economic value (in USD) of the annual diesel fuel amount (in L) saved, according to the different diesel fuel prices;
The required Li-ion battery capacity (in kWh) and its economic value (in USD), according to the activation times of low-power loads;
The prices of peripherals, such as the charger, inverter, and energy management system (in USD);
The payback time (in years) of the Li-ion battery and peripheral equipment added to the DG, which was obtained by comparing the economic value of the annual amount of diesel fuel saved with the investment in the Li-ion battery and peripheral equipment;
The reduction in daily and annual DG working time (in hours) thanks to the Li-ion battery added to the DG;
The delay in new investment (in years) due to savings in the DG’s operating time, relative to the average DG life;
The increase in the service life of the DG (in years).
2.2. Assumptions
The DG was assumed to work for 350 days a year. The daily working times of the loads varied according to the scenarios but we assumed that each load operates for 2.5 h in total out of 15 h of daily work in order to compute the average payback period;
All loads that made up the load profile were assumed to be resistive, as our aim was to determine the contribution of the Li-ion battery system to the fuel consumption efficiency under the most basic conditions;
When the ratio of the load fed by the diesel generator (DG) fell below 20%L, the DG was deactivated and the loads fed by the Li-ion battery. The battery was charged when the load rate exceeded 50%L. The charging process was reflected in the DG as an extra load;
Delays or technical problems that could have occurred during the activation and stopping of the DG and Li-ion battery were ignored.
There was no energy loss considered during charging and discharging of Li-ion batteries.
3. Functions of the Model Blocks
Figure 1 shows the fuel efficiency curve of a DG [
8], obtained from a real application. A closer examination of the curve reveals that fuel efficiency starts to decrease when the load ratio falls below 50%, with an even sharper decrease when the load ratio falls below 20%. The model uses the fuel consumption values obtained from this real efficiency curve for different load levels.
3.1. Inputs Block
We collected all inputs in a block and named it “Inputs”. These variables were the Li-ion battery price (in USD/kWh), diesel fuel price (in USD/L), and load profile (in kWh). We used different combinations of these variables to set different operating scenarios. Other inputs used in this model, but kept fixed across scenarios, were the annual operating time of the DG (in days); the total cost of the peripheral equipment, such as the charger, inverter, and energy management system (in USD); and the average service period of the DG (in years). We determined the activation times of the loads with the signals we produced in the “Signal Builder” component. These signals were used to determine the activation times of the breakers connected to the loads in the working blocks of the DG with and without a Li-ion battery. We entered the other inputs into the model using the “Constant” components and moved them to the relevant blocks with “GoTo” (
Figure 2).
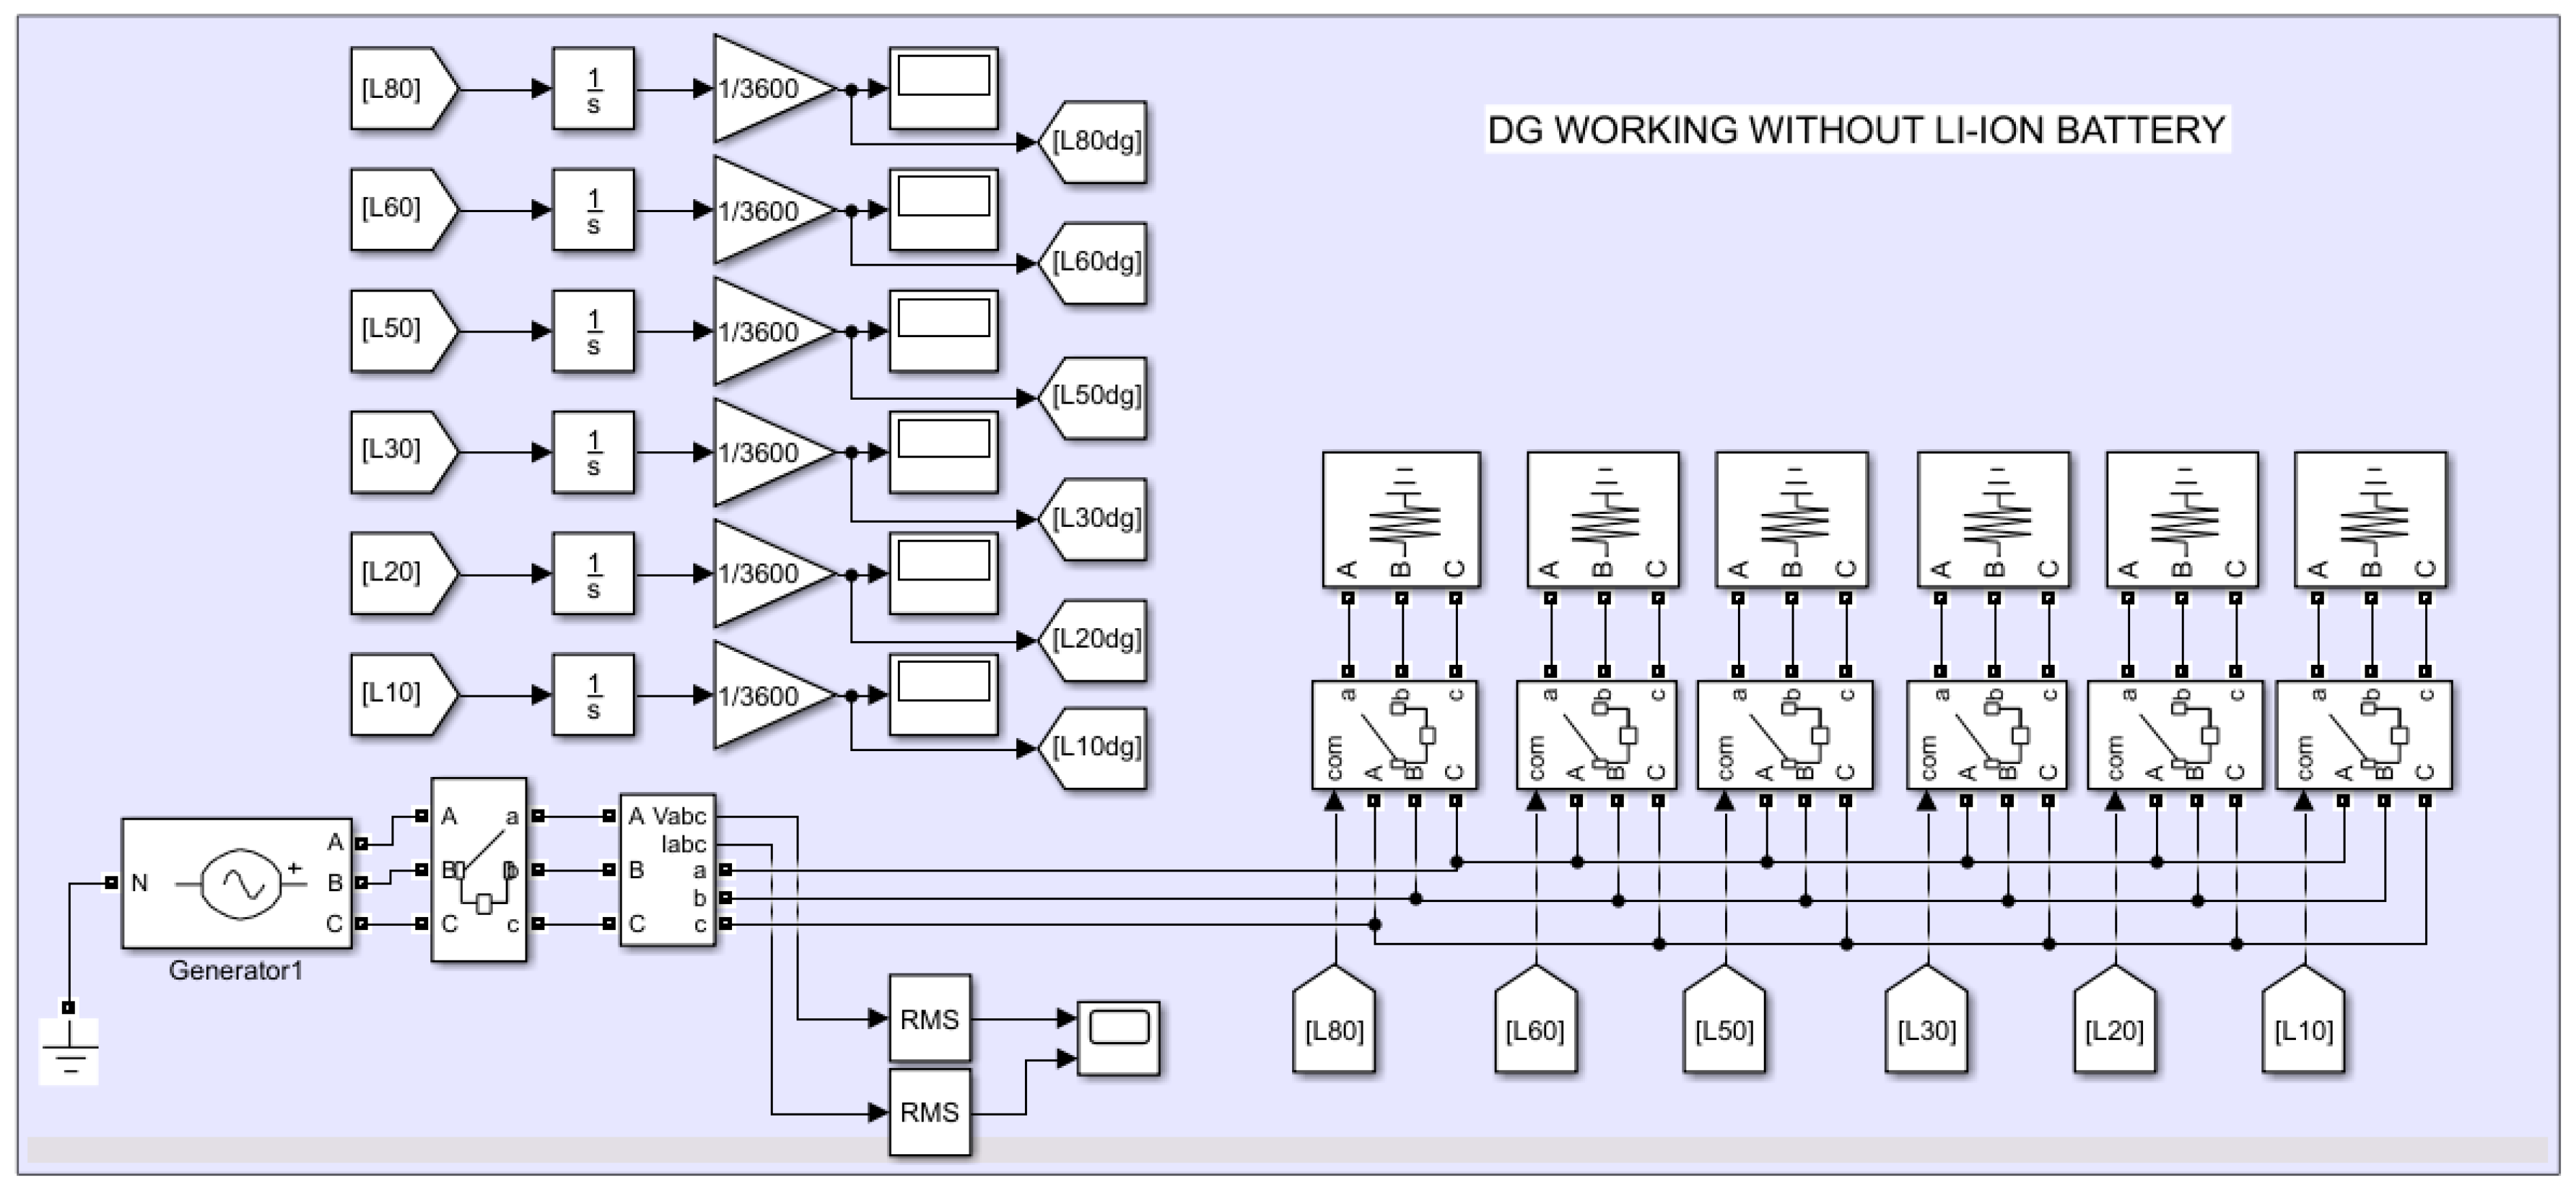
3.2. Blocks Modeled for DG Operation with/without Li-Ion Battery
Figure 2 and
Figure 3 display the blocks where we modeled the operating modes of the DG with and without a Li-ion battery, respectively.
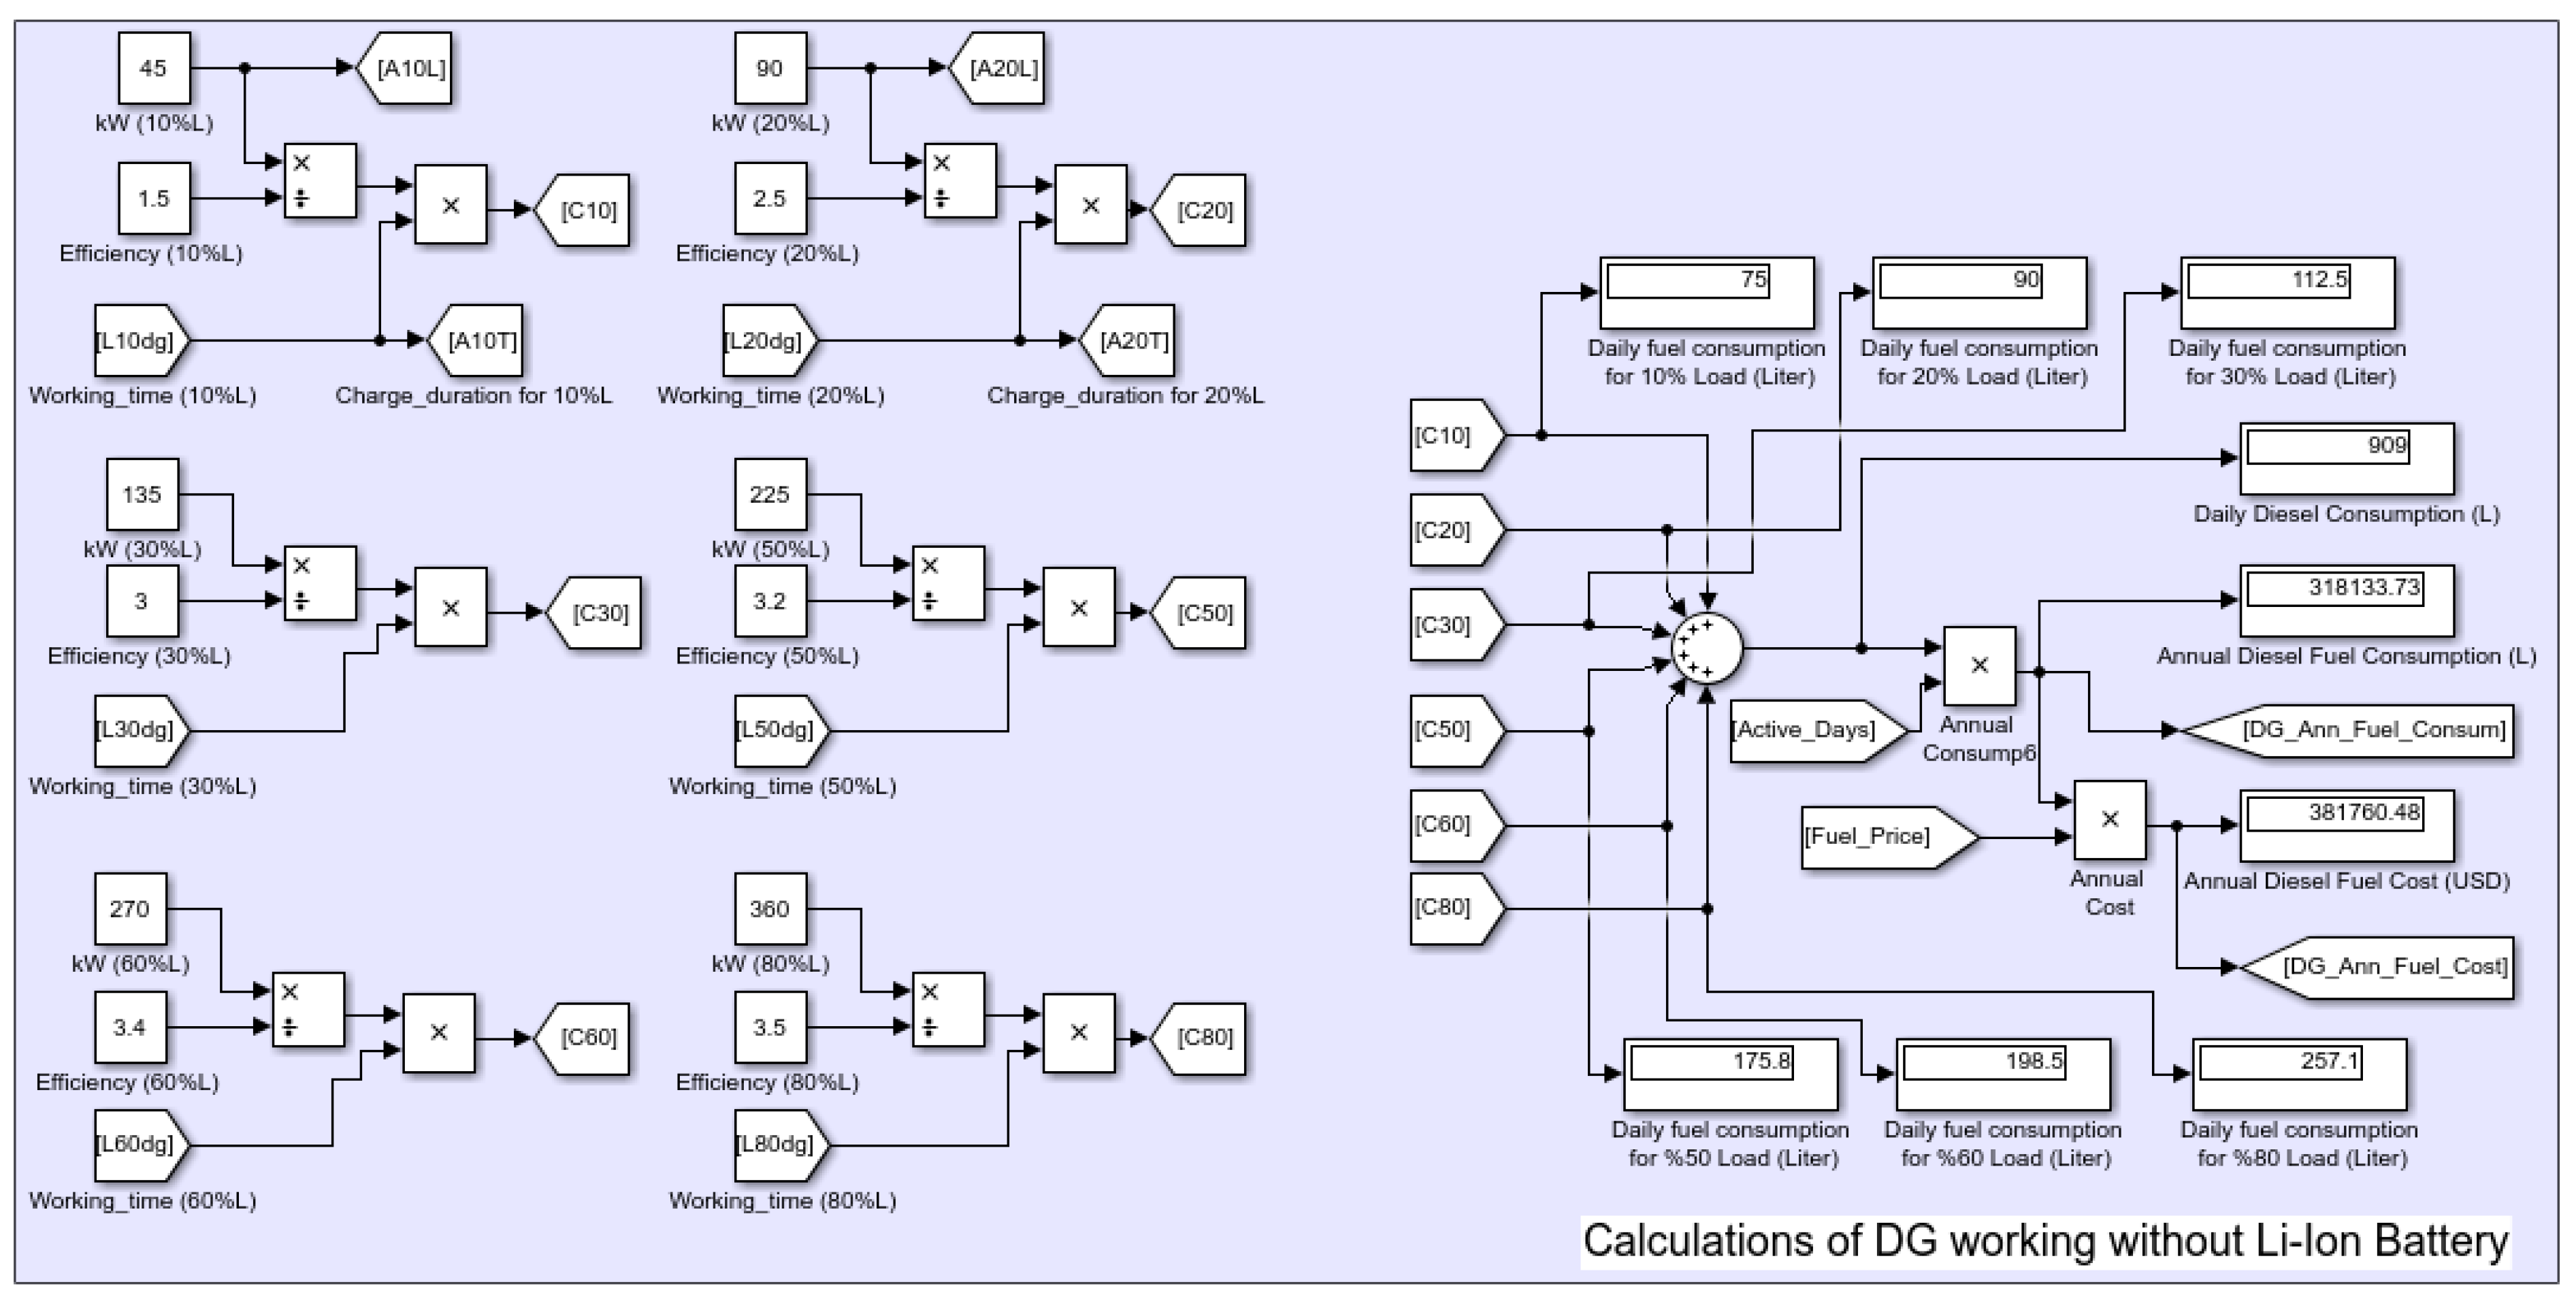
We represented a 457 kW diesel generator with a “Three Phase Programmable Voltage Source” and used the same load profile in both blocks. Each distinct load level was modeled with a “Three-Phase RLC Load” component. We set the power (kW) values of these components as equal in both blocks and then we kept them fixed. We made changes in load profiles by adjusting the activation times of these loads. We carried those signals that we produced with the “Signal Builder” component in the inputs block to these two blocks with the “From” components and we controlled the on/off of the “Breaker” component in front of each load component with these signals. We calculated the activation times of the loads by using the “Integrator” components in these two blocks, so that we did not have to manually enter these values in the other blocks. However, in order to express the calculated values in hours, we performed these transformations by using the “Gain” components after the integral blocks. We sent these results to the “Calculations” blocks.
In the “DG working without Li-Ion Battery” block seen in
Figure 3, all loads were directly connected to the DG. In the “DG working with Li-Ion Battery” block shown in
Figure 4, medium- and high-power loads (30%L, 50%L, 60%L, 80%L) were fed by the DG, while low-power loads (10%L, 20%L) were powered by the Li-ion battery.
While the DG fed the medium- and high-power loads, it also charged the Li-ion battery. We made the transition from the DG to the Li-ion battery using Simulink’s “Step” component and some simple “Logic” components. After the transition to the Li-ion battery, we also used these “Logic” operations to reset the diesel fuel consumption of low-power loads (10%L and 20%L). We used the “Charger” sub-block for the charge process of the Li-ion battery and the “Inverter” sub-block for the discharge process. In both blocks, the current and voltage of the circuits were measured by the “Three-Phase V-I Measurement” component and converted to RMS values with the “RMS” components. These measurement results are shown
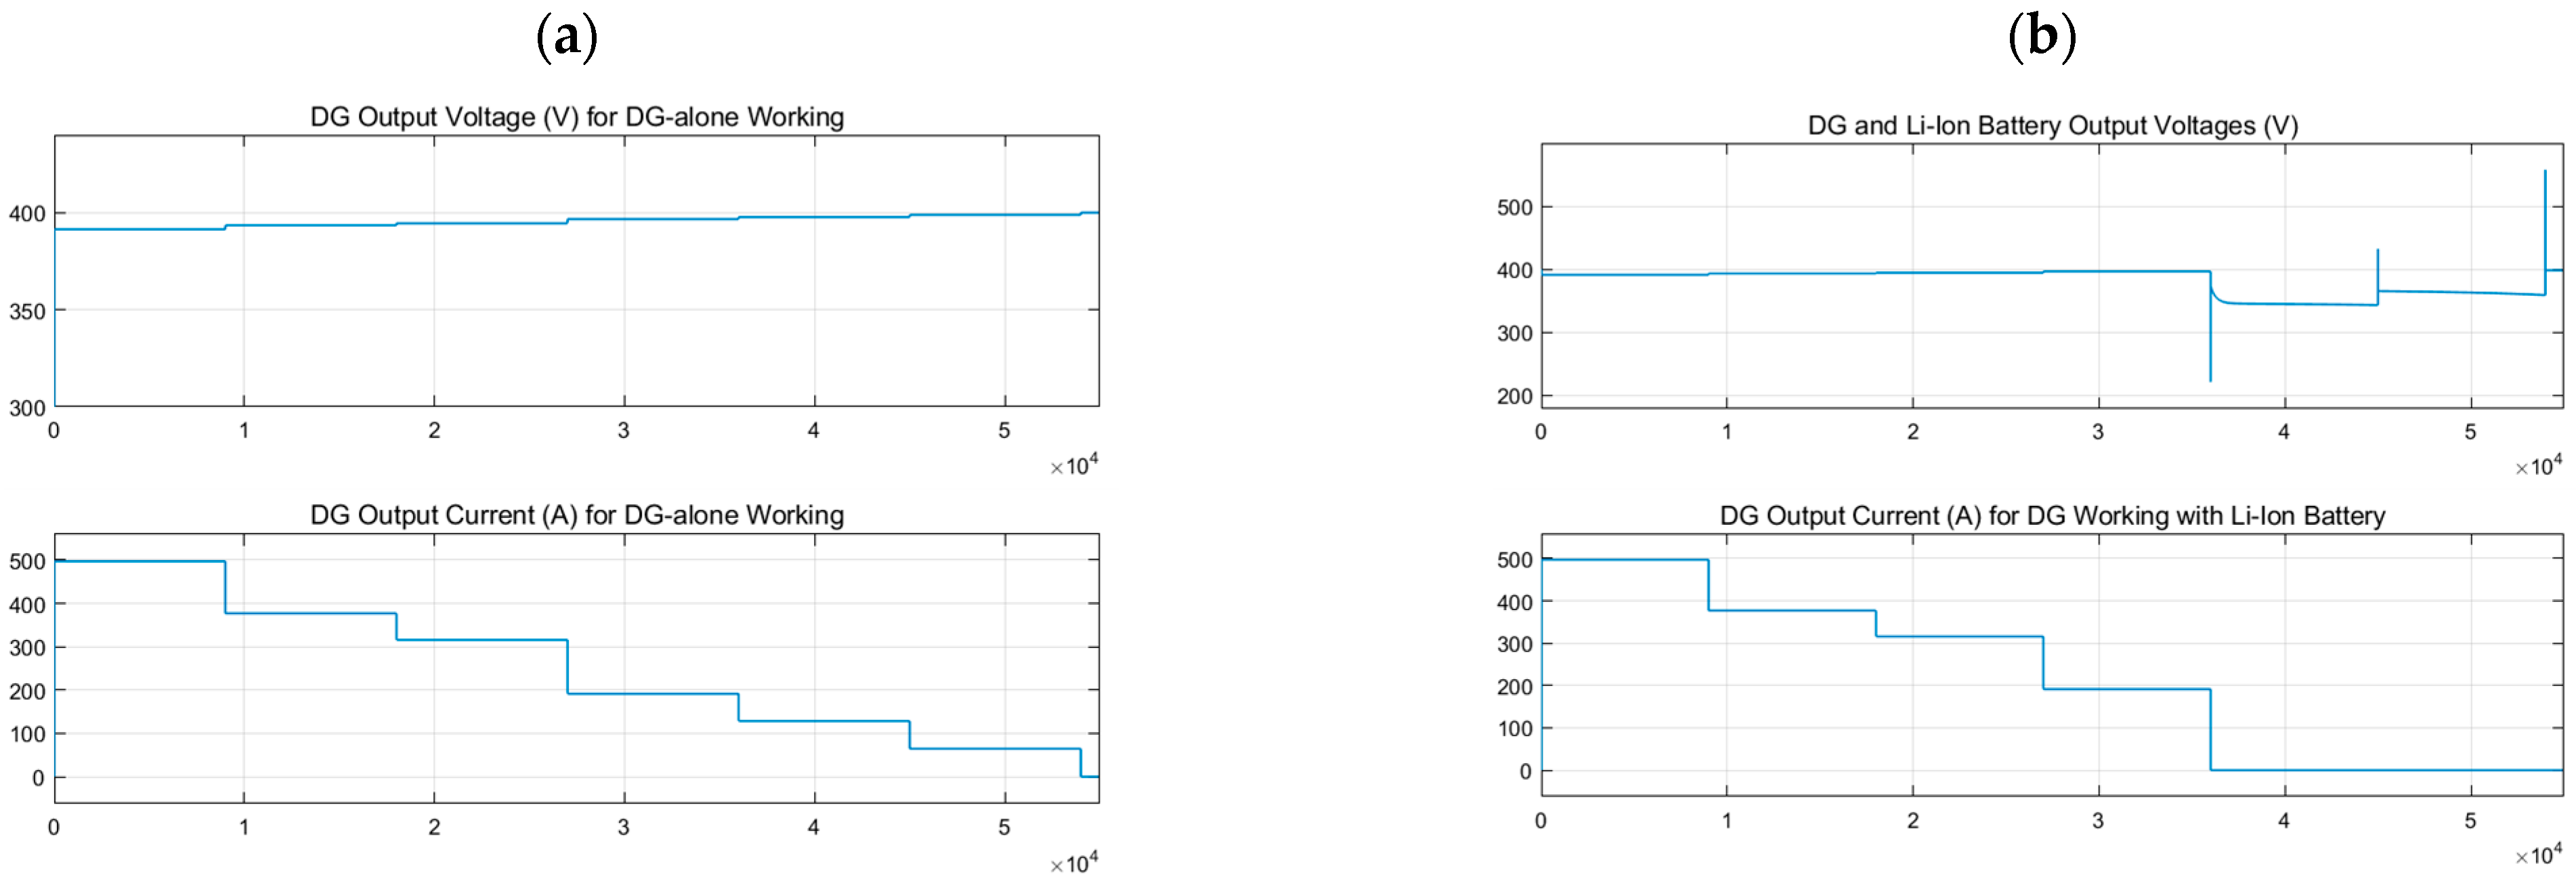
Figure 5a,b.
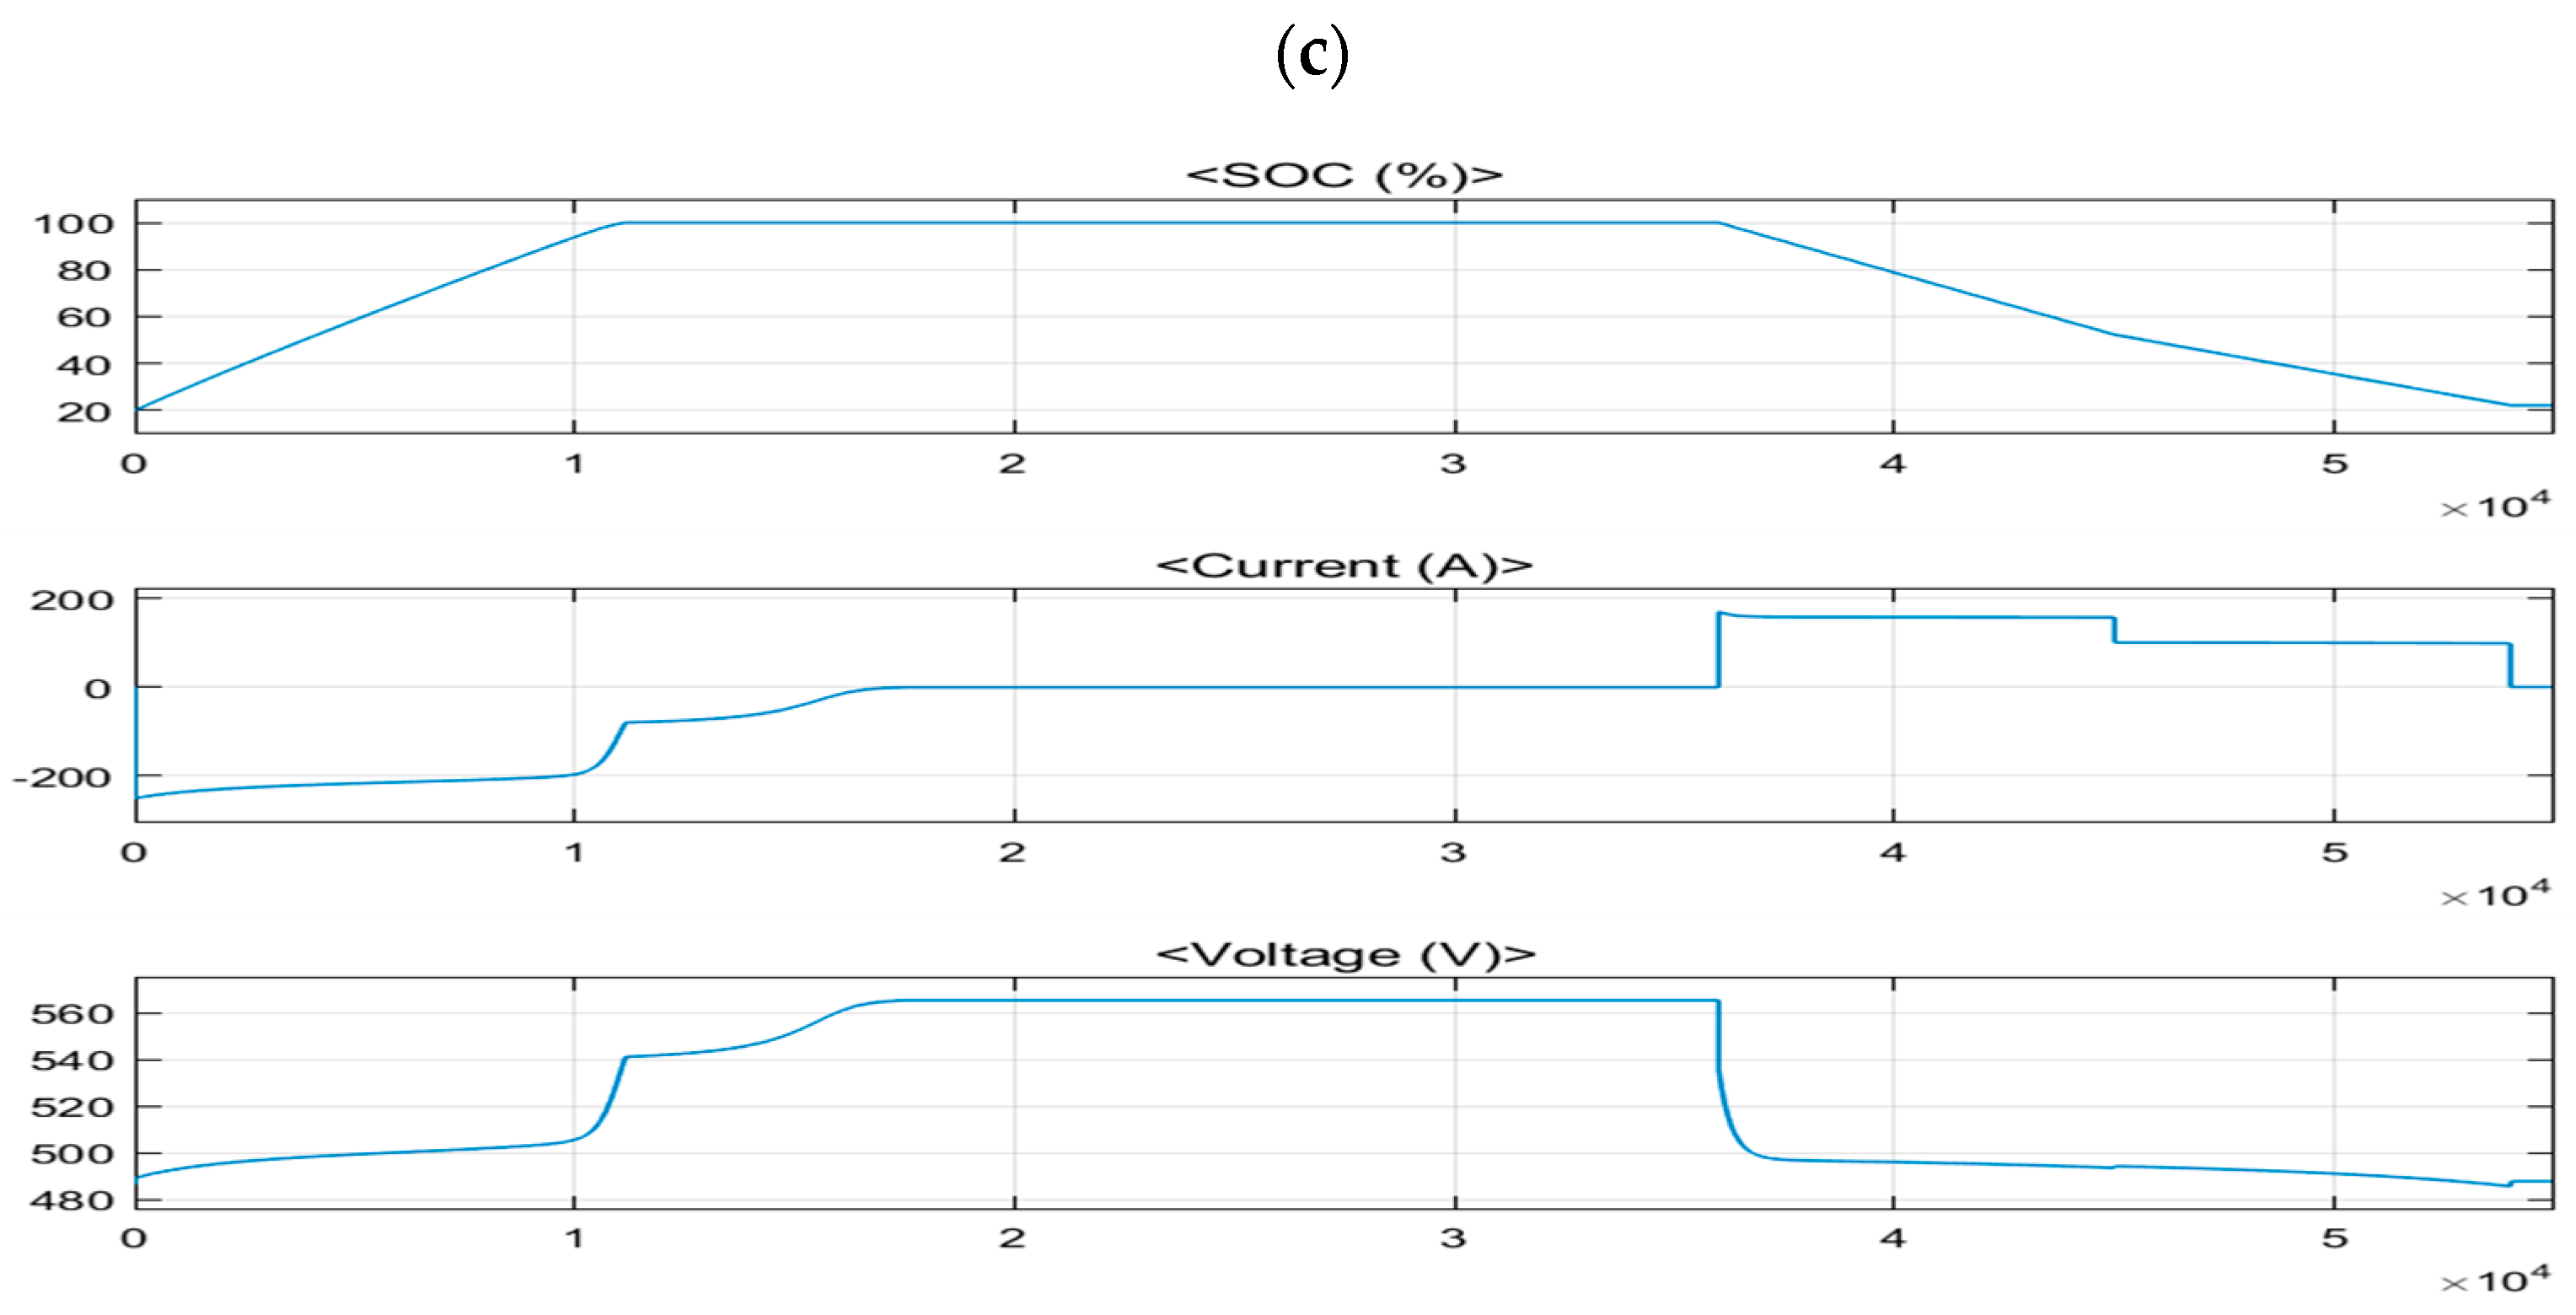
Figure 5c shows the SOC(%), current (A), and voltage (V) values of the Li-ion battery. These values are important in testing the reliability of a model.
Figure 5a shows that, as the load level fed by the DG decreased, the current drawn from the DG decreased, whereas there was a slight increase in the DG output voltage.
Figure 5b shows that the DG stopped at the 36,000th second and the loads started to be fed by the Li-ion battery. We accepted the peak voltage occurring during the transition and the decrease in the voltage level after the transition as normal.
Figure 5c shows the transition in the 36,000th second, with the SOC value, the increase in the discharge current, and the increase in the discharge output voltage. The SOC display also shows that the Li-ion battery discharged quickly when feeding 20%L and demonstrated slower discharge when feeding 10%L. The SOC display proves that the battery capacity calculated by the model was suitable for feeding 10%L and 20%L loads as planned.
3.3. Calculation Block for DG Operation without Li-Ion Battery
In this block, we calculated the daily and annual energy consumption of the DG in the operating mode without a Li-ion battery, the annual fuel consumed, and the cost of the fuel consumed according to the determined diesel fuel price (
Figure 6). We present the equations we used in these calculations below.
In Equation (1), the daily fuel consumption (C
day) is calculated according to how many hours a day each level of load is deployed. Then, this value is multiplied by the annual number of active working days of the DG to find the yearly consumption (C
year) in Equation (2). The annual diesel fuel cost (COST
year) is calculated by multiplying the diesel fuel price by the annual fuel consumption amount (Equation (3)).
where:
Cday: daily fuel consumption (L);
Cyear: annual fuel consumption (L);
Load%: the ratio of instantaneous load to maximum load;
Pload: load (kW);
ɳload: fuel efficiency (kWh/L; for corresponding load);
t: time (hours);
D: number of active working days of the DG;
COSTyear: annual diesel fuel cost;
FP: fuel price (USD).
To create the above equations in the Simulink environment, we manually entered the power value (kW) of each load for six different load levels and the corresponding diesel fuel consumption efficiency using the “Constant” components. However, since the activation times of the loads were calculated in the blocks mentioned above, we transferred those values to this block with the “From” components. Thus, by summing up the amount of diesel fuel consumed for each load, we calculated the daily fuel consumption amount and, multiplying this value by the annual activation time (days) of the DG, we determined the total fuel consumed (L) annually. Multiplying this result by the diesel fuel price, we calculated the annual cost of the total amount of fuel consumed (USD).
3.4. Calculation Block for DG Operation with Li-Ion Battery
The function of this block was the same as that of the block described above. However, since the data entering the block were different, the results produced by the block were also different (
Figure 7). As the fuel efficiency of DG was very low during operations at 10%L and 20%L loads, the generator was deactivated, and these loads were fed by the Li-ion battery. The values of the 10%L and 20%L loads were taken as 45 kW and 90 kW by calculating them in proportion to the nominal load, and these values were multiplied by the operating times to determine the amount of energy that the Li-ion battery should have (Equation (4)).
where E
Li-ion is the amount of energy that the Li-ion battery must provide (kWh).
To model the charge period of the Li-ion battery, we assumed that the energy consumed by the charges was equal to the energy required to charge the Li-ion battery. In this case, we represented the charging process of the Li-ion battery with 10%L and 20%L loads. However, unlike the normal low-power loads, we accepted that the corresponding energy consumption efficiency was high (
Figure 7, green area A). In the discharge period of the Li-ion battery, the loads (10%L and 20%L) were fed by the Li-ion battery, so the working times of the DG were zero (
Figure 7, green area B).
If we assume that the DG works 15 h a day and that each load is active for 2.5 h, because of the Li-ion battery feeding 10%L and 20%L loads, the daily working time of the DG would be reduced to 10 h. The amount of the extra diesel fuel consumption (C
dayBB) in a day’s operation was calculated using Equation (5) below.
3.5. Block of Comparisons and Outputs
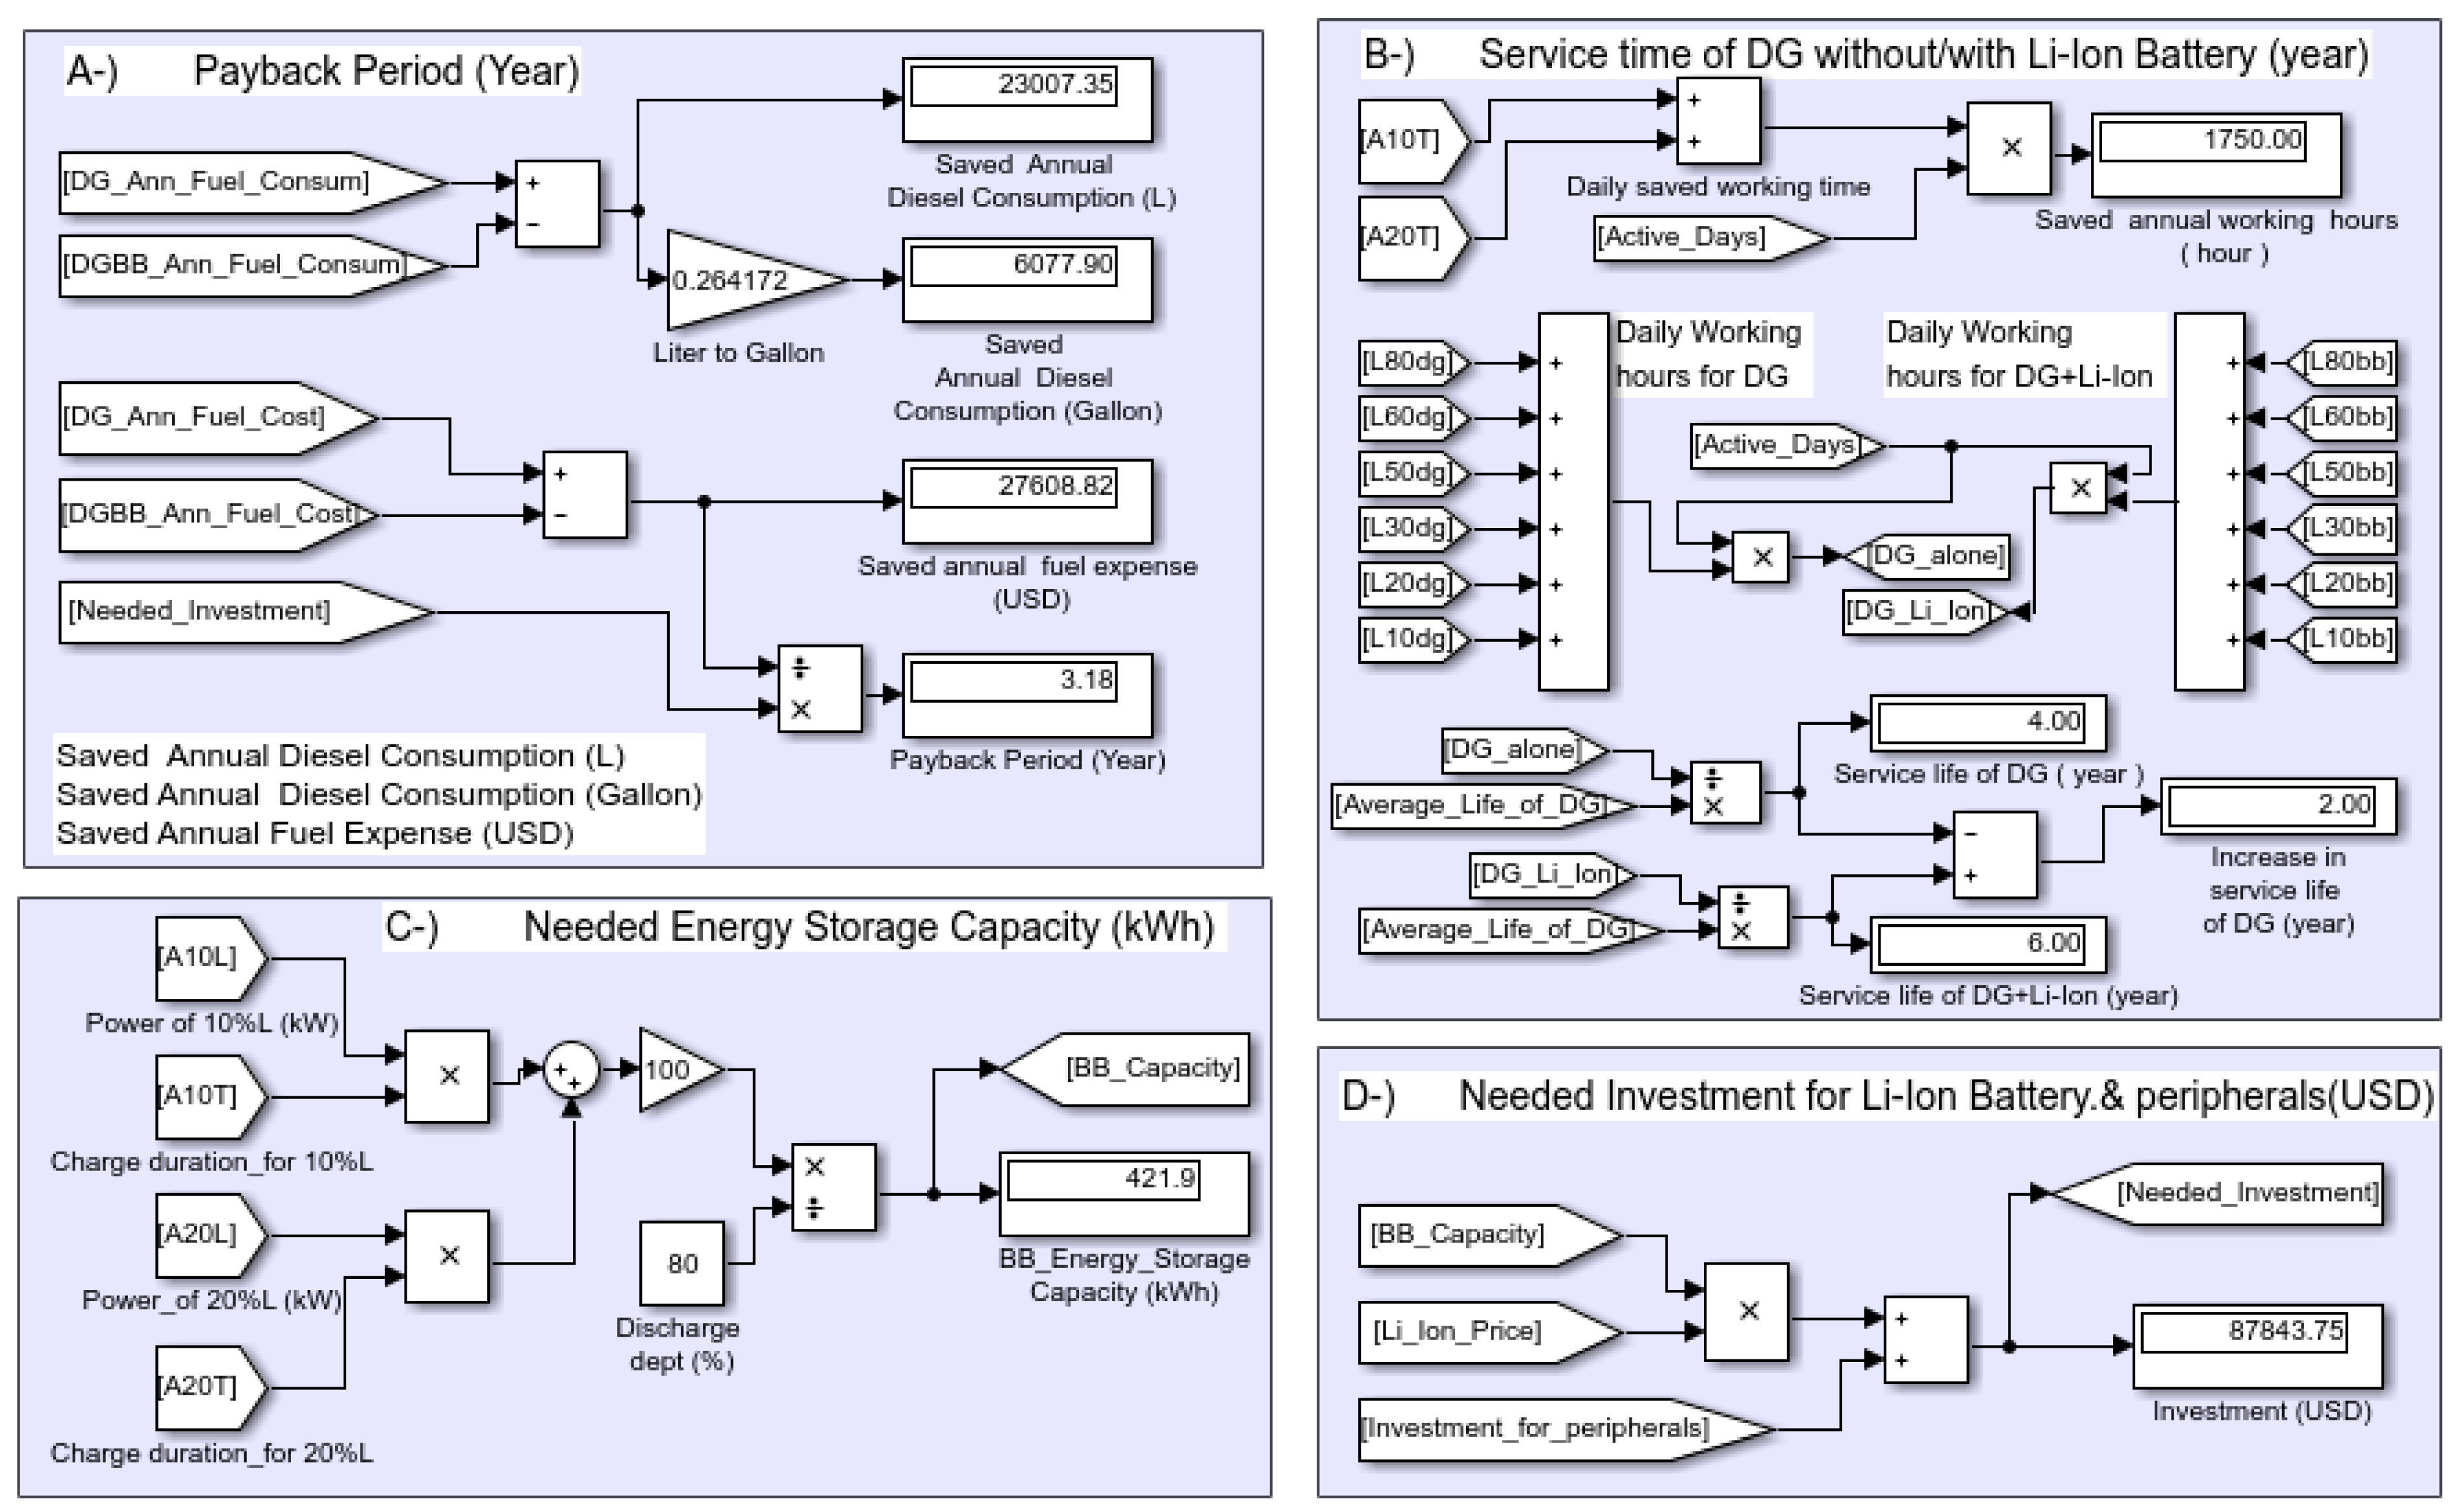
We grouped the calculations performed in the “Comparison” block under four sub-blocks (
Figure 8). The energy storage capacity of the Li-ion battery was calculated in the sub-block at the bottom left. For this calculation, the powers of the loads (A10L, A20L) fed by the Li-ion battery and the feeding times for each load (A10T, A20T) were used. In addition, since the discharge depth rate recommended for Li-ion batteries is 80%, this information was added to the calculation with the “Constant” and “Gain” components. The result obtained (the capacity of the Li-ion battery) was transferred to the sub-block seen in the lower right. In this sub-block, this value was multiplied by the diesel fuel price and the determined price of the inverter/charger and energy management system was added. The output obtained (the needed investment) was transferred to the “Payback Period Calculation” sub-block. In the upper right sub-block, the savings in the DG’s annual working time were calculated in hours. Indeed, this period was equal to the total annual operating time of the Li-ion battery. The time saved as calculated in this sub-block was intended for comparison with the average operating times of the DGs. In the sub-block where the payback period was calculated, the outputs from the working blocks for the DG with and without a Li-ion battery were compared. The formulas used to obtain this information are presented below.
The daily amount of fuel normally required by a DG to provide this same energy was calculated using Equation (6).
The Li-ion battery recovers its discharged energy during the DG’s fuel-efficient operation mode. The amount of fuel consumed in this high fuel-efficiency phase was calculated using Equation (7).
Daily fuel savings (C
save) were determined by comparing the fuel consumption corresponding to charge and discharge operations (given by Equation (8)).
Similarly, daily fuel savings (Csave) were calculated with Equation (9).
where:
Cday_discharge: daily fuel consumption corresponding to the Li-ion battery discharge process (L);
Cday_charge: daily fuel consumption corresponding to the Li-ion battery charge process (L);
Csave: savings in fuel consumption;
t: Load operating time (hours; working time of all loads according to the specified scenario was 2.5 h);
CL10%, CL20%: loads of 10% and 20% compared to the maximum load (kW);
ɳ10%, ɳ20%: DG fuel efficiency rates for different loads (kWh/L).
We examined how the model produced the payback time with an assumed average run time of the DG where the load at each level was fed for 2.5 h: the Li-ion battery price was assumed to be USD 130, based on its market value as of 2021. The investment budget required for a Li-ion battery that can store 422 kWh of energy is USD 52,650. Since the maximum load that would be supplied by the Li-ion battery was 90 kW (20%L), the price of an inverter/charger with a power of 90 kW was assumed to be USD 30,000 [
27]. There was no need to allocate a separate budget for MPPT as the new generation inverters have MPPT features. In the process of adding Li-ion batteries to the DG, both battery management and a special energy management system were needed. We allocate USD 3000 for these processes. Considering the prices of all components and various expenses, the cost of the backup storage system to be added to the DG was valued at USD 88,000.
4. Scenarios and Simulation Results
There are three factors that affect the amount of savings in fuel achieved in hybrid DG/Li-ion battery systems. These factors are the Li-ion battery price, the diesel fuel price, and the DG’s operating time under low loads. In this section, we describe simulations of the effects of these factors using case-by-case scenarios.
The Li-ion battery price used was based on the US energy market. A value of USD 130 was assumed [
25,
26] in all the simulated scenarios as it was not possible to obtain these data for all countries of the world.
The diesel fuel prices we used as case studies for our scenarios were from web-based information sources on global fuel prices. Diesel fuel prices per liter vary between USD 0.03 and USD 1.8 around the world [
28]. In many European countries, the average diesel fuel price is around USD 1.5 (
Table 1).
In scenario 1, we kept the diesel fuel price fixed (USD1) and the working times of all loads increased evenly. This scenario is closer to what is observed in real applications, as consumption can occur at very different levels during the day.
Table 2 shows the values obtained from the simulation of this scenario.
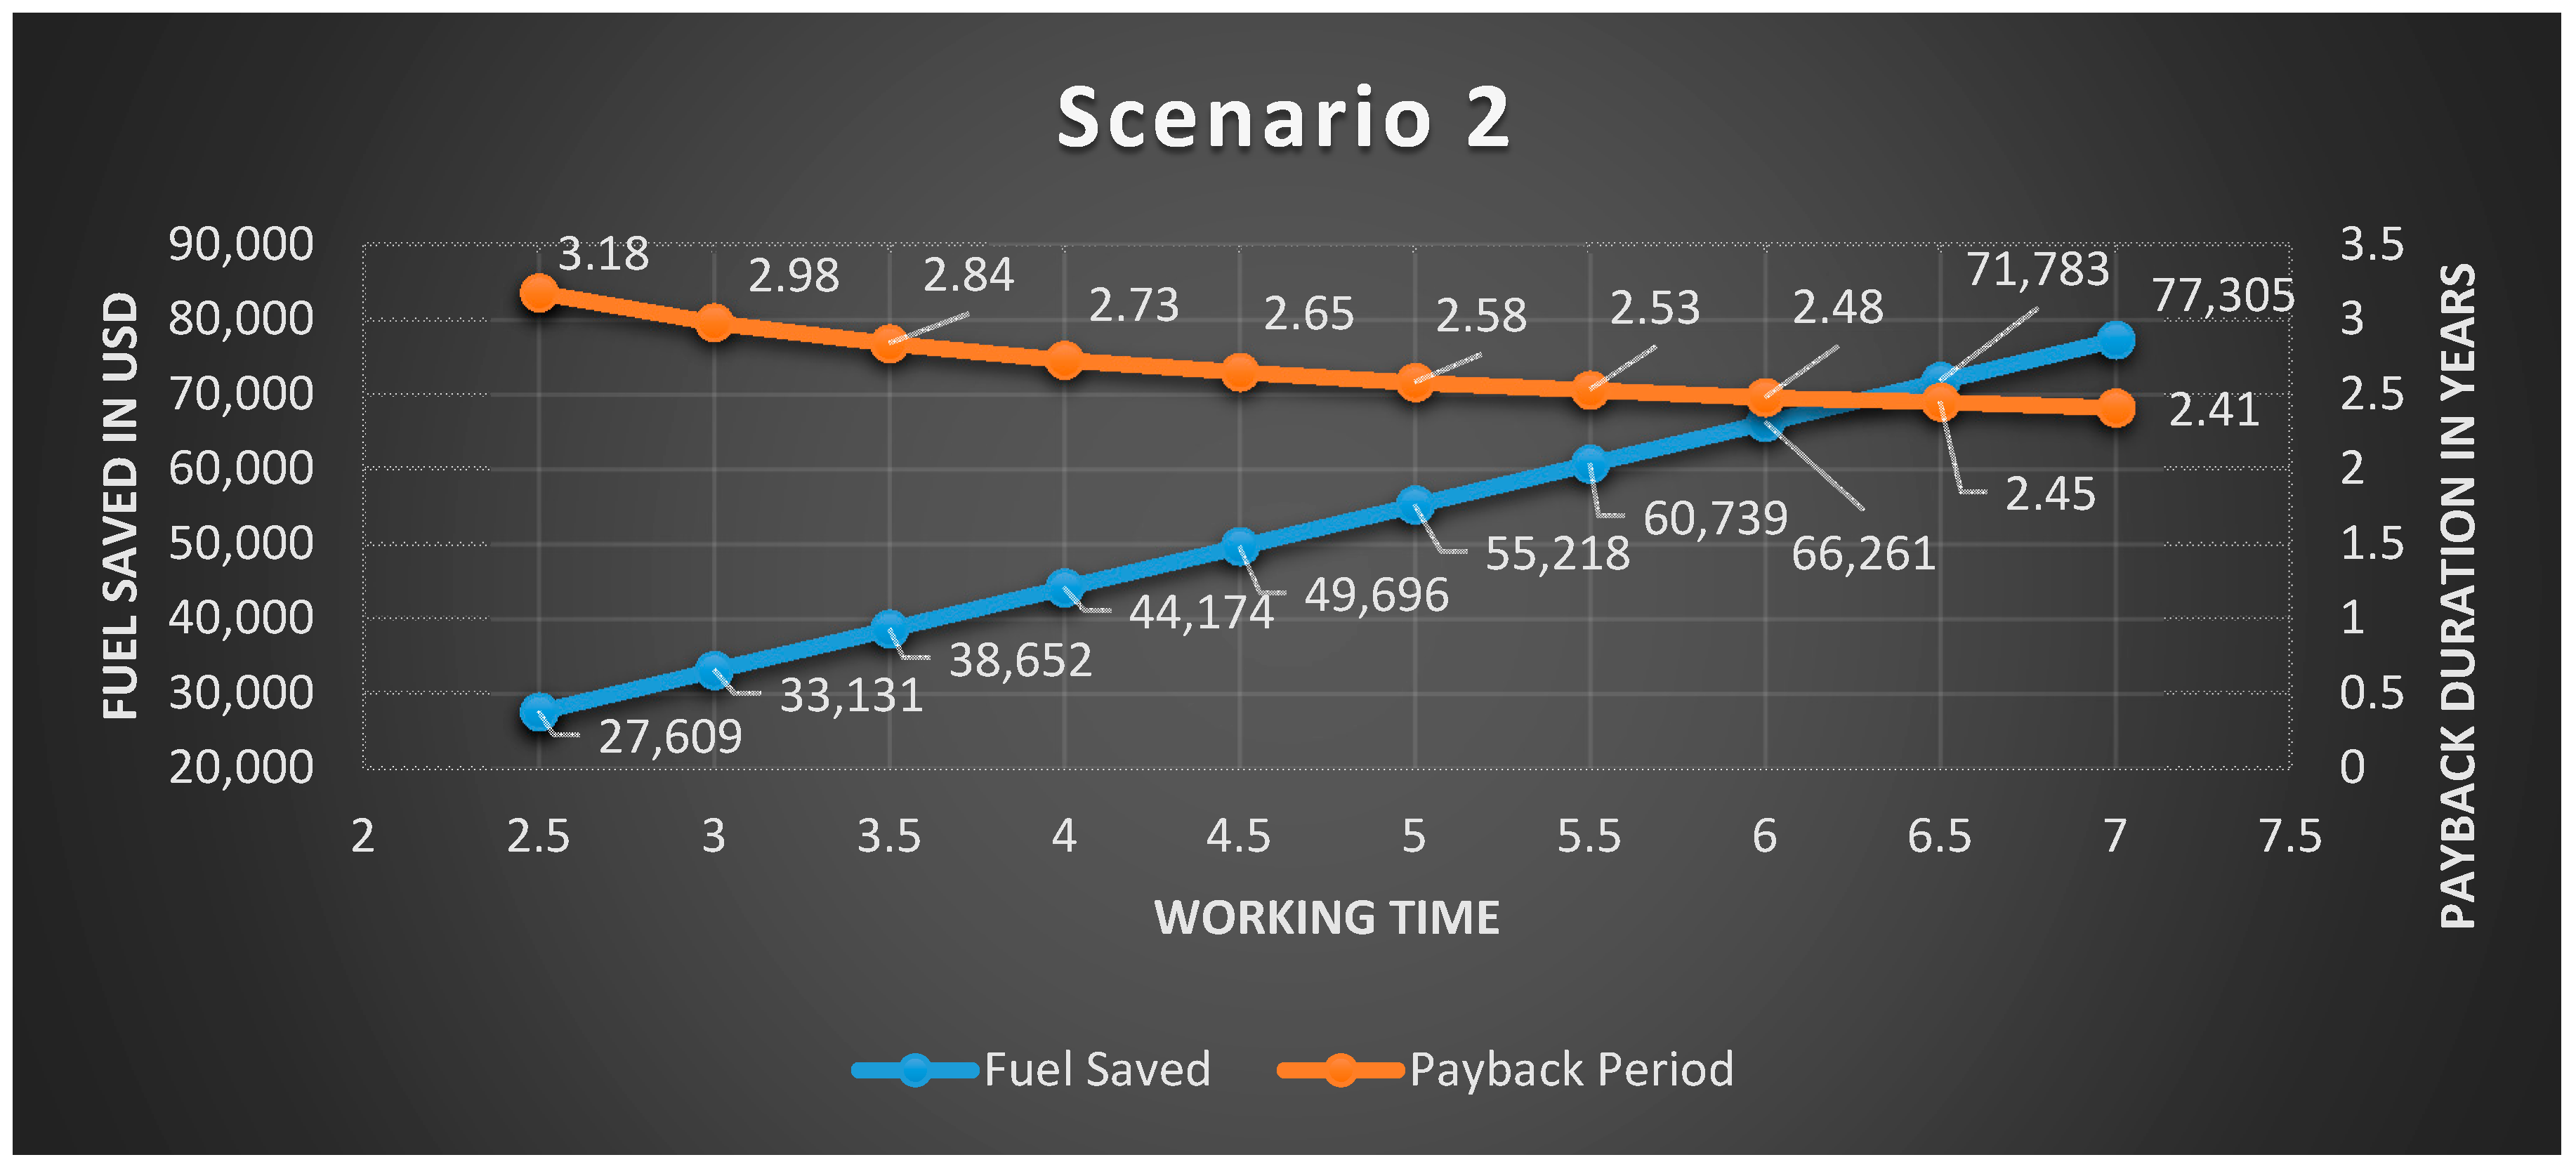
In scenario 2, We aimed to determine the most economical advantage that a Li-ion battery could bring for a per-liter diesel fuel price of USD 1.2. To simulate these conditions, we fixed the active times of the medium- and high-powered loads at 2.5 h, while increasing the operating hours for small-load power.
Table 3 shows the values obtained from scenario 2.
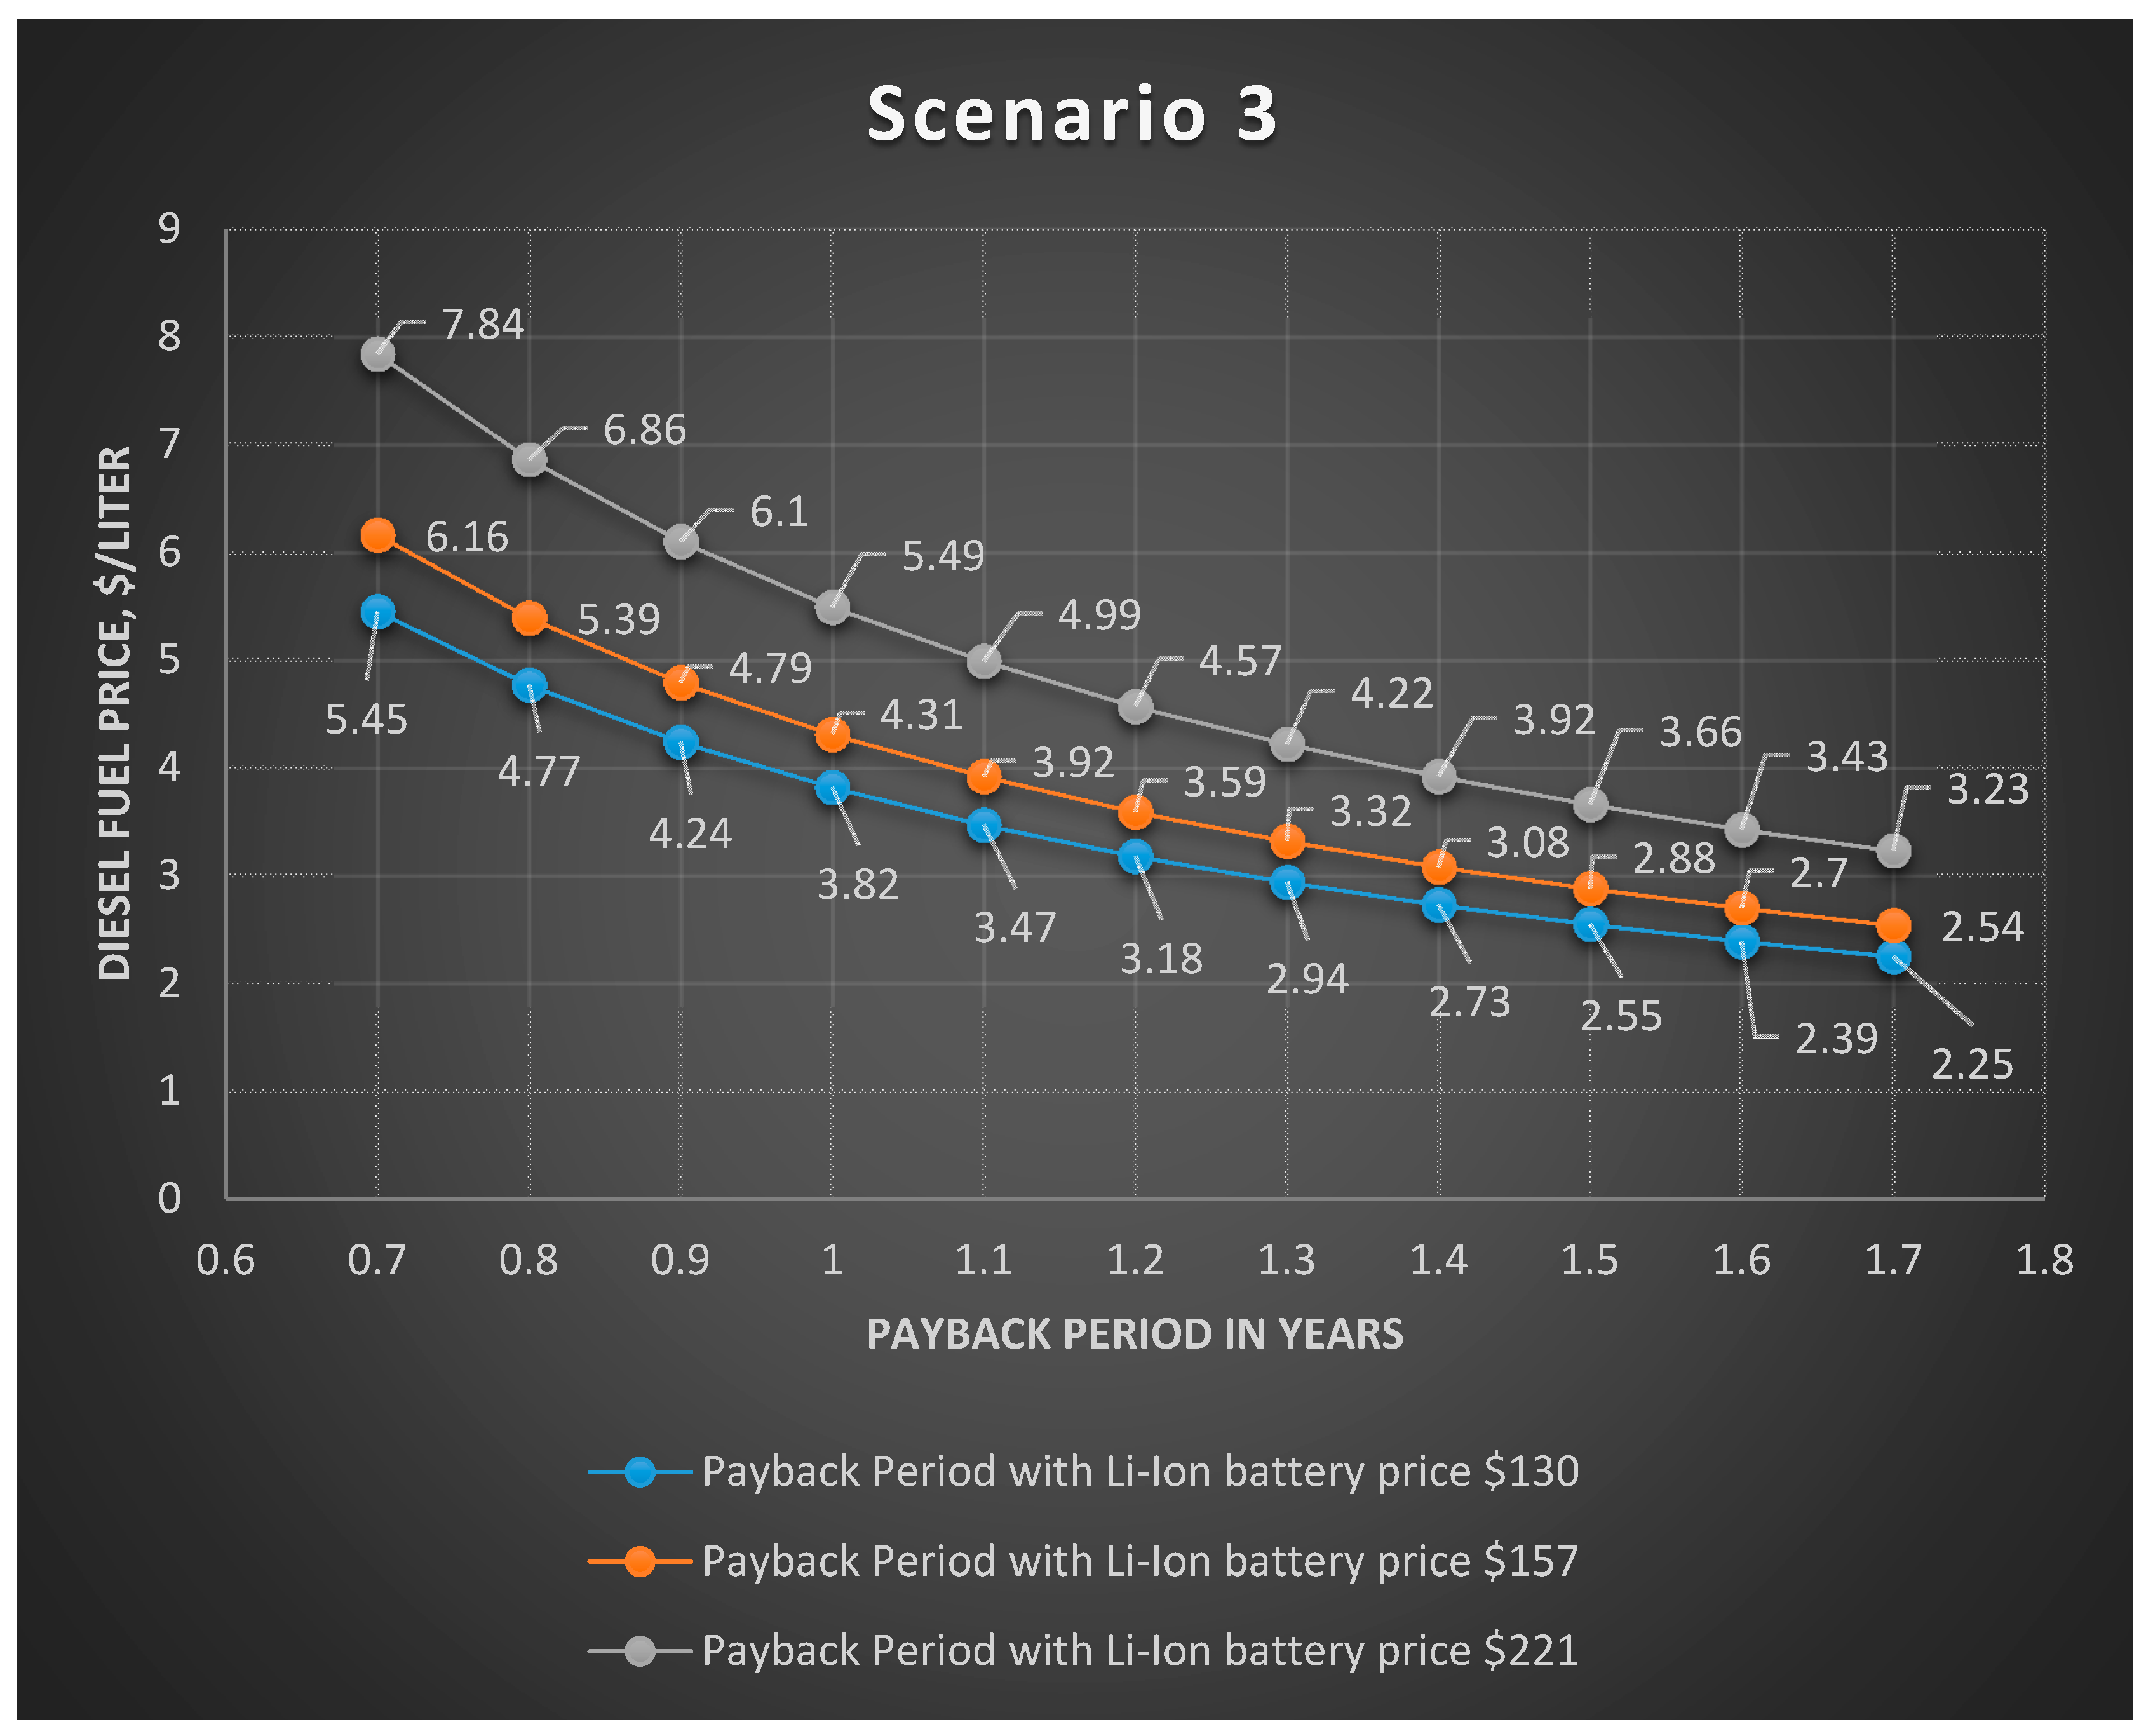
In scenarios 1 and 2, the Li-ion battery prices were fixed at USD 130. However, in scenario 3, we adopted battery prices from two years ago and four years ago to show that hybrid DG/Li-ion battery systems were not very attractive economically due to the high Li-ion battery prices then.
Table 4 shows the values obtained from scenario 3.
The main characteristics of the scenarios were as follows.
Scenario 1:
Six different loads operating for equal times;
The longest total working time was 24 h (6 × 4 = 24);
The shortest total working time was 6 h (6 × 1 = 6);
The diesel fuel price per liter was USD 1.2;
The Li-ion battery price per kWh was USD 130.
Scenario 2:
The loads L10% and L20% operated for between 2.5 and 7 h. The other loads operated for 2.5 h;
The longest total working time was 24 h (7 + 7 + (4 × 2.5) = 24);
The shortest total working time was 15 h (2.5 + 2.5 + (4 × 2.5) = 15);
The diesel fuel price for a liter was USD 1.2;
The Li-ion battery price per kWh was USD 130.
Scenario 3:
Six different loads operating for equal times;
Each load’s working time was 2.5 h and the total working hours was 15 (6 × 2.5 = 15);
The diesel fuel price (USD/L) varied between USD 0.7 and USD 1.7;
The 2021 Li-ion battery price per kWh was USD 130;
The 2019 Li-ion battery price per kWh was USD 157;
The 2017 Li-ion battery price per kWh was USD 221.
We made the necessary changes to the model for each scenario, ran the model, and recorded the simulation results in the tables below.
5. Economic Analysis
We conducted an economic analysis of the scenarios based primarily on the amount of diesel fuel saved (in terms of the liters of fuel, their value in USD, and the value saved converted to the payback period of the Li-ion battery), the years saved in the life of the DG (postponement of new DG purchase), and the reduction in total cost and increase in the total profit.
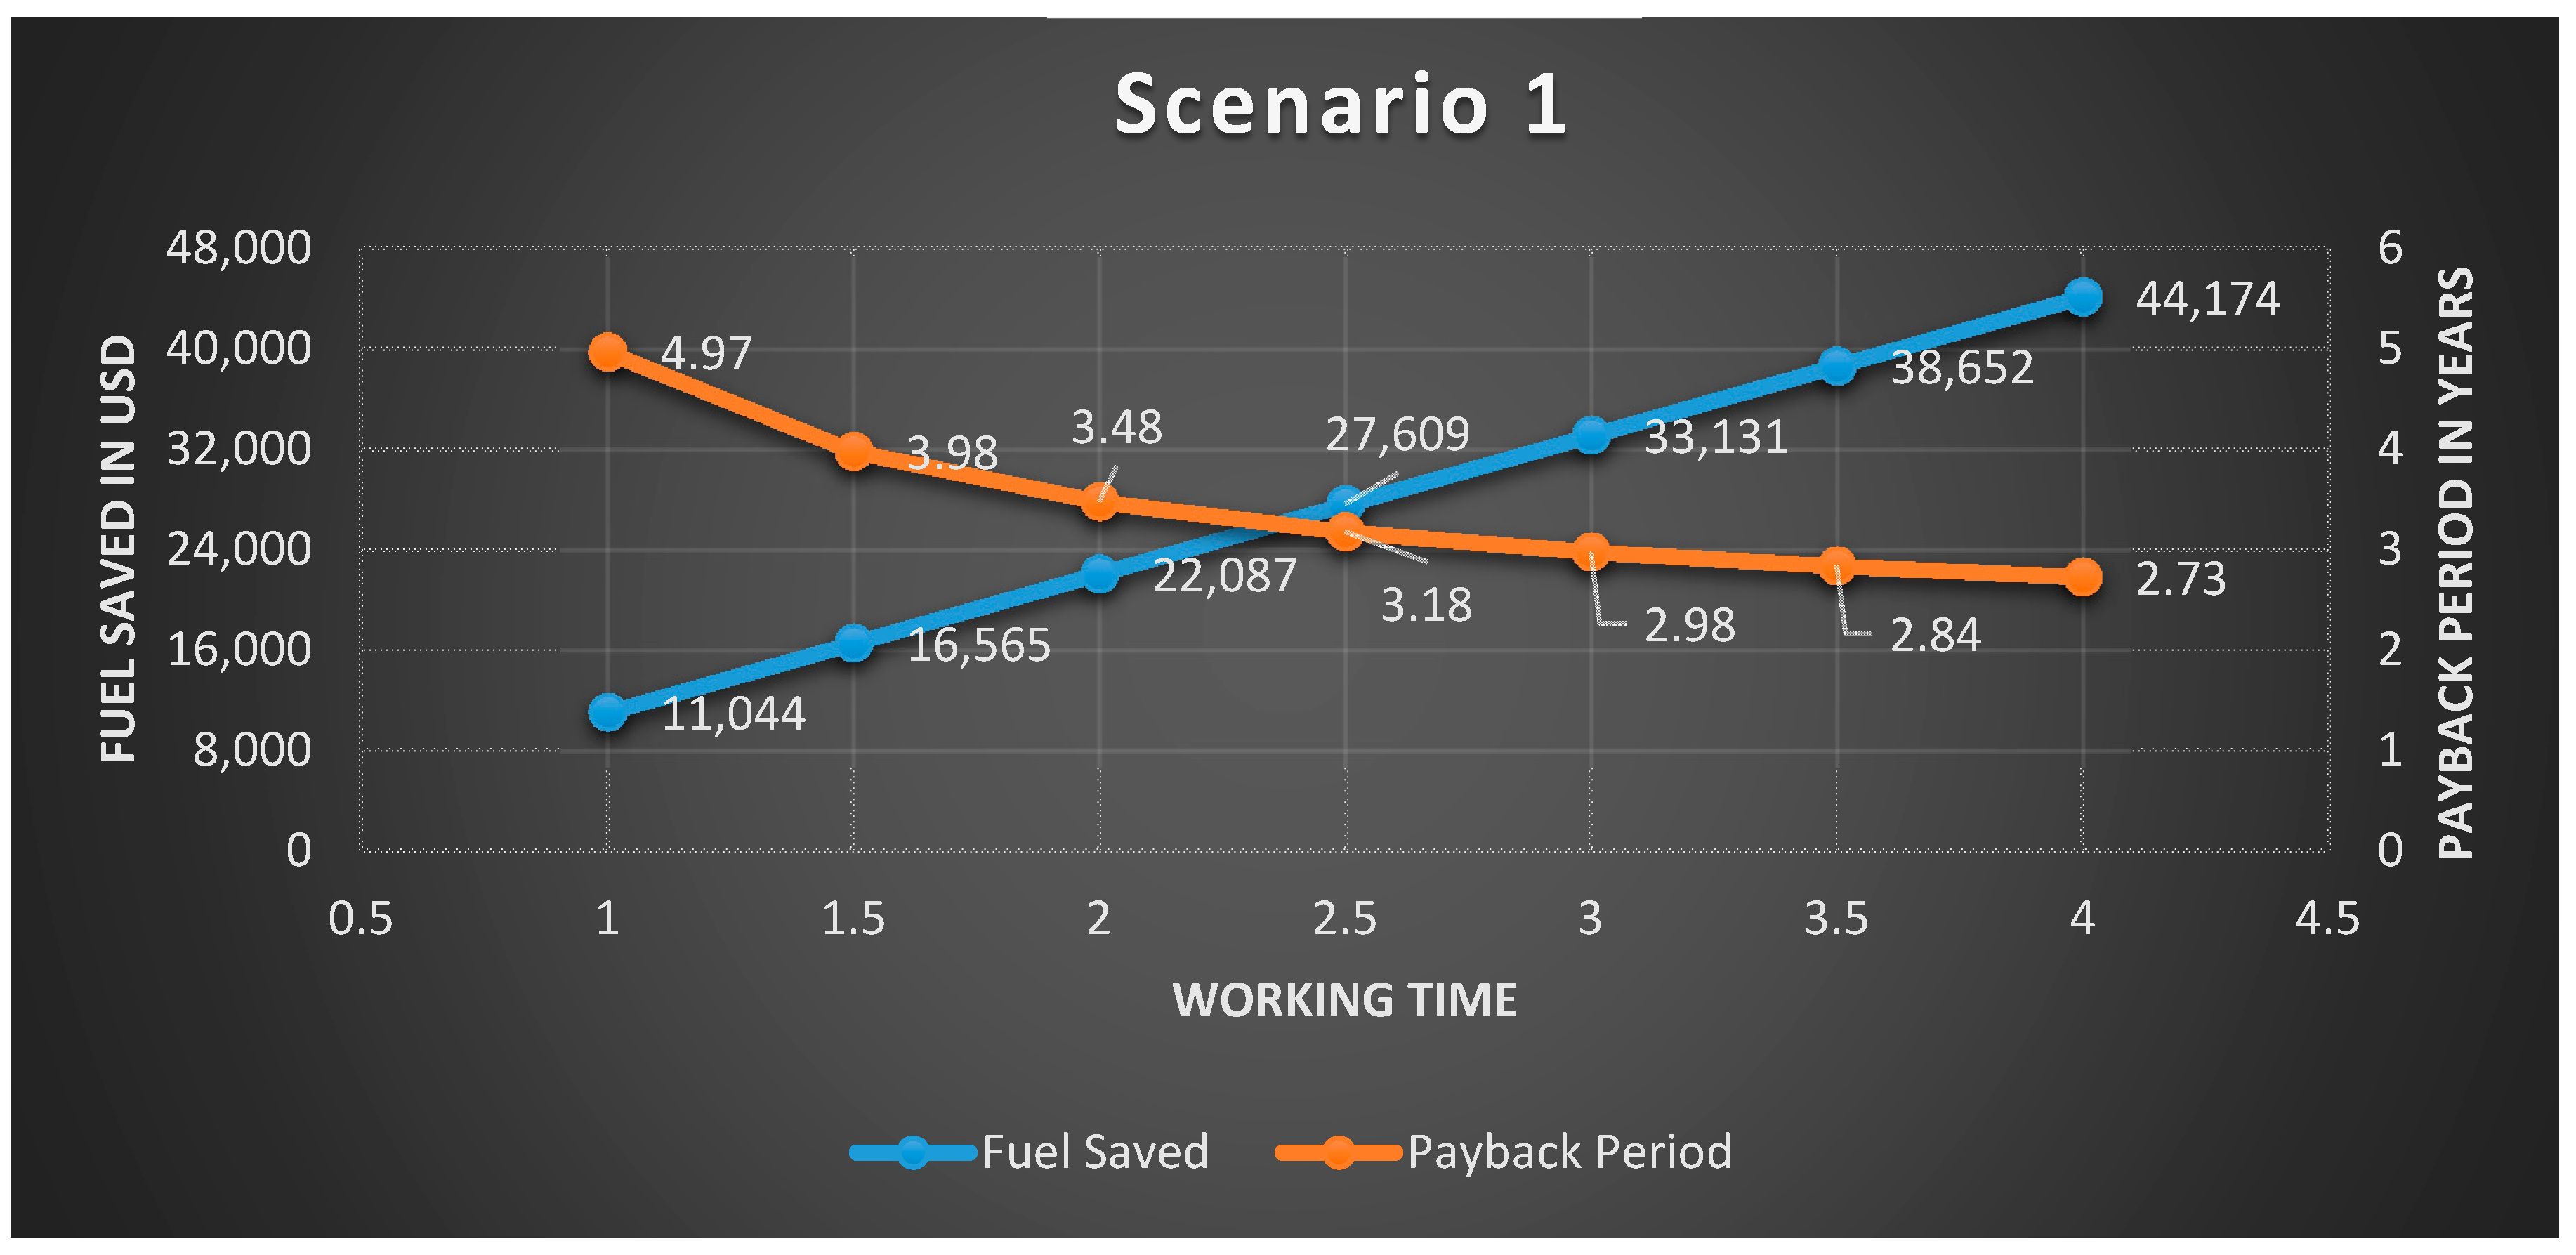
All three scenarios underline the substantial reduction in the runtime of the DG leading to the fuel saved. The amount of fuel saved based on scenario 1 is plotted in
Figure 9, which is based directly on
Table 2. Our model proved that the Li-ion battery added increased energy efficiency to the DG and saved fuel. The amount saved depended on three factors: the Li-ion battery price, the diesel fuel price, and the feeding time of the DG to low loads.
Table 2 and
Table 3 demonstrate how much these savings changed depending on the loads and the varying runtime of the battery. Similarly,
Table 4 displays the significant change in payback time vis-a-vis the diesel fuel price changes while keeping the operating time fixed.
In
Table 2, we set the Li-ion battery price to USD 130, the diesel fuel price to USD 1.2, and the operating times of all loads fed by the DG to the same timeframe in order to compute the payback period as no longer than 4.97 years. As the Li-ion battery was used for 1 h at both 10% and 20% loads, the total amount of fuel saved was 11,044 L per year. The saving increased up to 44,174 L per year when the battery ran for 4 h for both 10% and 20% loads. This is a massive saving in diesel fuel. This amount surged constantly as the Li-ion battery was used to replace the DG for more hours (see
Figure 9 portraying the constant increase in fuel saved in USD).
Although we confined our setup to several scenarios representing average, high, and low working hours of the battery replacing the generator, the savings in fuel were also apparent in other possible scenarios. Our setup was tailored to be extended in order to compute the savings in further scenarios. Similar savings followed in scenario 2, where we set changing working hours for the Li-ion battery. In this scenario, we fixed the diesel fuel price to 1.2 USD/L to compute the payback period for different working hours of the battery. The payback period declined from 3.18 years to 2.41 years as the working time increased from 2.5 to 7 runtime hours a day. The lowest saving in diesel fuel was when the Li-ion battery replaced the DG for 2.5 h with both 10% and 20% loads, for which there was a net saving of 27,609 L per year. This saving increased massively as the battery was run for more hours up to a maximum run time of 7 h for both 10% and 20% loads
Figure 10 visualizes the figures in
Table 3, with an emphasis on the drastic diesel fuel savings scaled on the left axis.
Another major focus of our research was the payback period, which is the duration in years after which the savings in fuel equal the cost of replacing the Li-ion battery with a brand new one.
Figure 10 and
Figure 11 show this period on the right axis in years for scenarios 1 and 2. As expected, the payback period fell when the Li-ion battery was used for more hours. This period reached a maximum of 4.97 years in scenario 1 with a 1 h runtime for the battery with 10%L and 20%L. This period declined to 2.73 years in scenario 1, where the Li-ion battery ran for 4 h at 10%L and 20%L.
Diesel fuel savings can be easily converted into the payback period of the Li-ion battery given the prices of the diesel fuel and the battery. We extended our analysis to include these periods for scenarios 1, 2, and 3. This period was calculated as simply the number of years required to recover the cost of the brand new Li-ion battery with fuel saved. These periods are appended to the columns of
Table 2,
Table 3 and
Table 4. Since this period was at the same time a function of the diesel and battery prices, we made assumptions about both prices to compute the payback period. It was easy to conclude that the payback period would be lower as the battery was run for more hours, and the battery price was lower and the fuel price was higher. The payback periods listed in all three tables are visualized along the right axes of
Figure 10 and
Figure 11 and the left axis of
Figure 11.
Table 4 expands the analysis by changing Li-ion battery prices to account for the drastic change over the past four years. The Li-ion battery prices from past years, presented in
Table 4, give an idea about the possible increases in Li-ion battery prices. Payback periods less than 3.5 years are colored to highlight the differences between such periods. The payback period was higher as the Li-ion battery price became higher, which is underlined by the highest curve in
Figure 11.
One main objective of our research was to compute and report the economic value of the savings we modeled. We already documented the savings in fuel in terms of liters and their value, and we can conclude our economic analysis by highlighting the net decline in cost resulting from the adoption of the hybrid model. This requires a holistic approach including all cost items in scenarios with and without the use of a Li-ion battery and including the assumptions we made. In this regard, we continued with a marginal analysis; that is, an analysis of the net changes in cost items when the Li-ion battery was used. The net assets for the use of the battery were considered to be the costs avoided for the diesel fuel (USD 300,139) and in the postponement of the DG purchase (USD 50,000); i.e., since the DG is run for less time, its life period is longer. On the other hand, the Li-ion battery still has to be paid for (USD 175,688), and this is the liability to be subtracted from the profit.
Table 4 details all these elements and it can be concluded that the net economic benefit of using the hybrid system is USD 174,451.
In a hybrid DG/Li-ion battery system, increased runtime with low-power loads means more efficient use of the Li-ion battery, more economical use of fuel, and shorter payback time. On the other hand, in order to feed low-power loads for a longer time, the Li-ion battery capacity must be increased, which results in the payback time being prolonged. However, it is difficult to understand at first glance how these two opposite situations compare to each other. The “Comparisons and Outputs” block presented in
Figure 8C calculates the required investment for the Li-ion battery system when the operating time with low-power loads increases.
Table 2 and
Table 3 reveal that the operating time with low-power loads increases while the payback time decreases. However, the decrease in the payback time is slower than the increase in the operating time with low-power loads. The reason for this is that the cost of peripheral equipment, such as the charger/inverter and energy management system, added to the cost of the Li-ion battery does not change. This is because the cost of these peripherals varies depending on their operating power (kW) and current (A), not how long they feed the loads.
Table 2 and
Table 3 also show the amount that the operating time of the DG was reduced and the degree to which the new DG investment was postponed. For example, according to the simulation results, a DG working 350 days a year and 15 h a day will have an average working life of 21,000 h over 4 years. When a Li-ion battery is added to this DG, the same DG can complete 21,000 h in 6 years (
Figure 8B).
Looking at the DG prices, it can be seen that the average price of a 457 kW DG is around USD 50,000. Postponing such an investment for a few years in off-grid systems that depend on DGs can be an important economic gain. For example, for this same DG working 350 days a year and 15 h a day, the new investment postponement period would be 2 years.
6. Discussion
We obtained deep insights into the parameters and conditions that would yield the savings targeted from the simulation results through the economic analysis. For realistic results in this research, we assumed that the DG operates for a total of 15 h a day. The DG was assumed to feed low loads for 5 h of this assumed total operation time. This assumption is reasonable for prime DGs, which do not operate for 9 h a day. However, it is still realistic to assume that prime DGs operate even up to 20 h a day; in countries like the UK and Switzerland, where the diesel fuel price is USD 1.8 per liter, much higher savings are possible.
All scenarios presented in this study were also accompanied by conditions under which the incorporation of a Li-ion battery to the DG would be economically impractical. For example, when diesel fuel prices fall below USD 1 per liter and the operating time of the DG at low loads drops below 4 h in total, there are no effective savings.
In addition to the fuel savings achieved, there are additional savings due to the postponement of the new investment. These savings amount to approximately 40% of the profit from fuel savings for a 12-year period. The results obtained for these additional savings are consistent with everyday experience. This is because 15 h of work per day can be considered normal for a prime DG. In addition, a period of 12 years, as used for the economic analysis, is also consistent with observations in off-grid systems, as off-grid systems are generally used in places that are distant from the central energy grid.
It is a fortuitous advantage that the lifetimes of Li-ion batteries and DGs are both around 6 years [
29] and thus compatible. For the power’s electronic components, a lifecycle of 6–8 years is still practical. The lifetime of Li-ion batteries is in the range of 2000–2500 cycles [
30]. For a battery charged and discharged once a day, this amounts to approximately 7 years. To allow for the possibility of more than one cycle in some days, the lifecycle used for the Li-ion battery was downscaled to 6 years.
The estimated lifespan of a DG working 10 h a day instead of 15 h a day is 6 years. This detail was considered when examining the additional savings resulting from the postponement of the new investment. As seen in
Table 5, the costs of the battery systems and add-on peripherals were cumulated and added to the calculation again at the end of the first 6-year period.
In the presented analysis, the money saved from the reduced diesel-fuel transport costs and the reduced breakdown maintenance costs of the DG were not accounted for. However, these costs can be quite high in rural off-grid systems. Along with the economic advantage from the reduced DG operating hours there is the comfort resulting from the reduced environmental noise and sound pollution from the DG.
7. Conclusions
This study presented a model-based economic analysis of hybrid DG/Li-ion battery systems. The study shone light on how the battery systems can be used to increase the energy efficiency of high-power diesel generators.
To provide a detailed and realistic economic analysis, we modeled the DG in its isolated mode and in the mode where it operates in synergy with a Li-ion battery. The model also used a graphical plot of the real power versus the fuel efficiency curve of a 457 kW DG. We obtained simulation results under different operating conditions by changing the Li-ion battery price, diesel fuel price, and operating times of a DG with low loads. The results in their refined forms lead to the following conclusions:
Hybrid DG/Li-ion battery systems, which were previously not very feasible due to the high Li-ion battery prices in past years, have now become more feasible;
Even with the hybrid DG/Li-ion battery systems, fuel savings can only be achieved under certain conditions. The factors that affect these conditions are Li-ion battery prices, diesel fuel prices, and the DG’s feeding time with low-power loads. In this study, we analyzed the effects of these factors in detail critically;
According to the results of the economic analysis, the addition of a Li-ion battery to a DG can pay for itself in between 2.5 and 4 years under certain conditions;
This study creates awareness of additional savings in hybrid DG/Li-ion battery systems that are not covered in the literature. These savings result from the postponement of the investment in a new DG due to the reduction in the working time of the DG. The 12-year-period economic analysis adopted for the study showed that the profit from these extra savings is about 40% of the profit from fuel savings.
By highlighting the fact that DG/Li-ion battery systems are now viable, our work attempts to pioneer research on other aspects of such systems. For instance, the stably growing DG market is a source of concern in terms of CO2 emissions. Research efforts aimed at alleviating the climate effects of this growth are critical. Hybrid DG/Li-ion battery systems can be converted to hybrid DG/PV/Li-ion battery systems or Hybrid/PV/Li-ion battery systems with simple modifications. In this respect, these systems can be used as a step in the transition to renewable energy.
In presenting the economic analysis in this work, we avoided technical details on the specifications of the DG, charger, and inverter, as well as the energy management blocks. These remain open areas that we intend to explore in our future research.


