1. Introduction
Energy efficiency in the water and wastewater industry has become increasingly important in recent years, as wastewater treatment plants are responsible for nearly 35% of the energy consumption of all municipal facilities [
1]. Discharging treated wastewater into receiving bodies in compliance with current legal requirements necessitates the use of efficient pollution removal technologies and sludge treatment processes. Optimal operation of wastewater treatment plants requires the provision of electricity, which is necessary for conducting technological processes as well as for transporting wastewater. The highest demand for electricity is associated with biological wastewater treatment, e.g., in systems with activated sludge where the consumption of electricity for aerating bioreactors is at the level of 50–70% [
2,
3]. Next, about 35% is the electricity consumption for the sewage sludge treatment processes, which depend on the technology adopted and the equipment used. The energy demand of the wastewater treatment plant (WWTP) also depends on the size of the installation (
Table 1) and the technology used for a given wastewater characteristic as well as the required effluent quality.
A conventional municipal WWTP usually consists of primary, secondary and advanced stages. Typically, the energy requirement for conventional activated wastewater treatment plants ranges from 0.30 kWh/m
3 to 1.2 kWh/m
3, with the highest values achieved with the nitrification process due to the need to operate an aeration system [
3]. Running the wastewater treatment process with chemical or chemical–physical methods increases the electricity consumption to 1.3 and even 2.8 kWh/m
3, respectively [
5]. In the EU, power consumption is in the range between 0.3–2.1 kWh/m
3 of treated wastewater, and 0.41 to 0.87 kWh/m
3 in the U.S. Current technology levels indicate that specific power consumption should range between 20 and 45 kWh per PE per year. With some non-modernized WWTP, operating in old technologies may double these energy demands [
6,
7].
The costs generated translate into the price of collecting and treating wastewater [
8]. Therefore, it is justified to optimize the wastewater treatment processes technically and economically by reducing the electricity consumption rates; however, the reduction of the energy intensity of these processes is possible only within certain limits. Therefore, it is necessary, apart from rationalisation of consumption, to look for other methods of obtaining energy. One of the ways of solving this problem and at the same time reducing the emission of harmful combustion products and slowing down the rate of consumption of fossil fuel resources is the use of “clean” technologies of energy generation, in particular the so-called “renewable” energy sources. A renewable energy source is a source that, in the process of energy production, uses wind energy, solar radiation, geothermal energy, waves, sea currents and tides, fall of rivers, and energy obtained from biomass, biogas from landfill, or from the process of anaerobic digestion of sewage sludge.
Currently, the global world production of wastewater reach 380 billion m
3. Among the regions in the world, the greatest amount of wastewater is generated by Asia (159 billion m
3, 42% of global amount), North America (67 billion m
3) and Europe (68 billion m
3). It is expected that the amount of wastewater generated will reach 574 billion m
3 (51% increase over the current level) in 2050 [
9]. For this reason, the energy requirement for this purpose should also increase. The European Union has adopted the 2030 climate and energy framework and has set EU-wide targets and policy targets for 2030 as a 40% reduction in greenhouse gas emissions compared to 1990 levels, and a minimum share of 27% in renewable energy consumption. In the longer term, in 2050 the share of renewable energy may be between 55% and 75% of gross final energy consumption in the European Union [
10,
11].
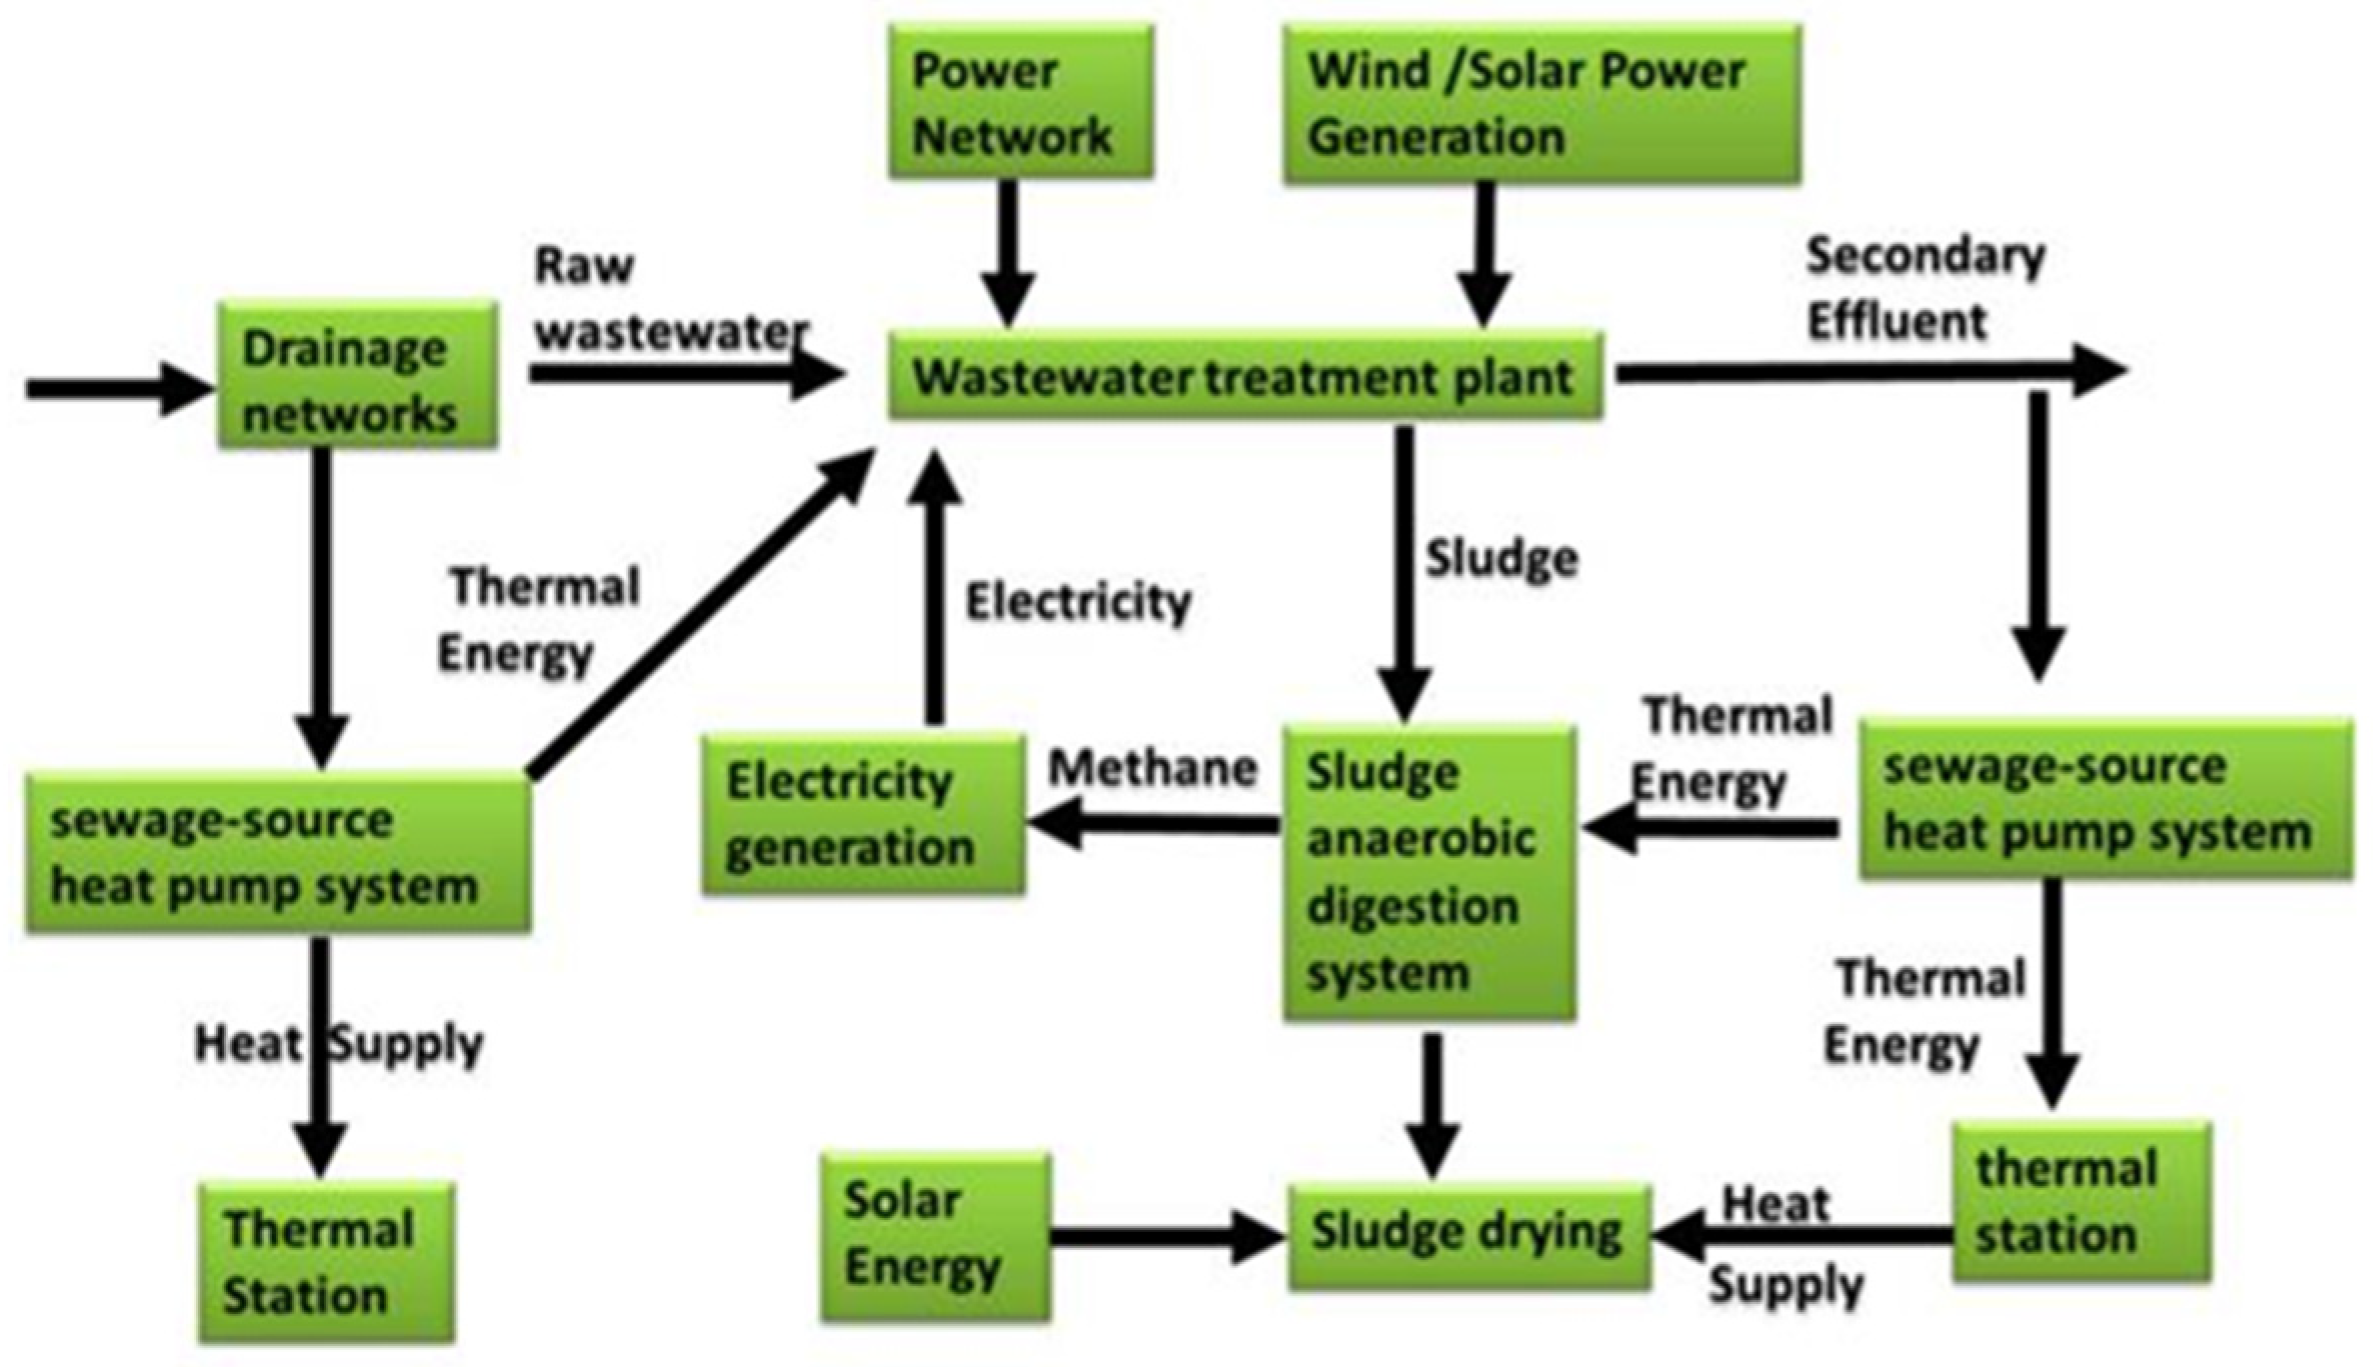
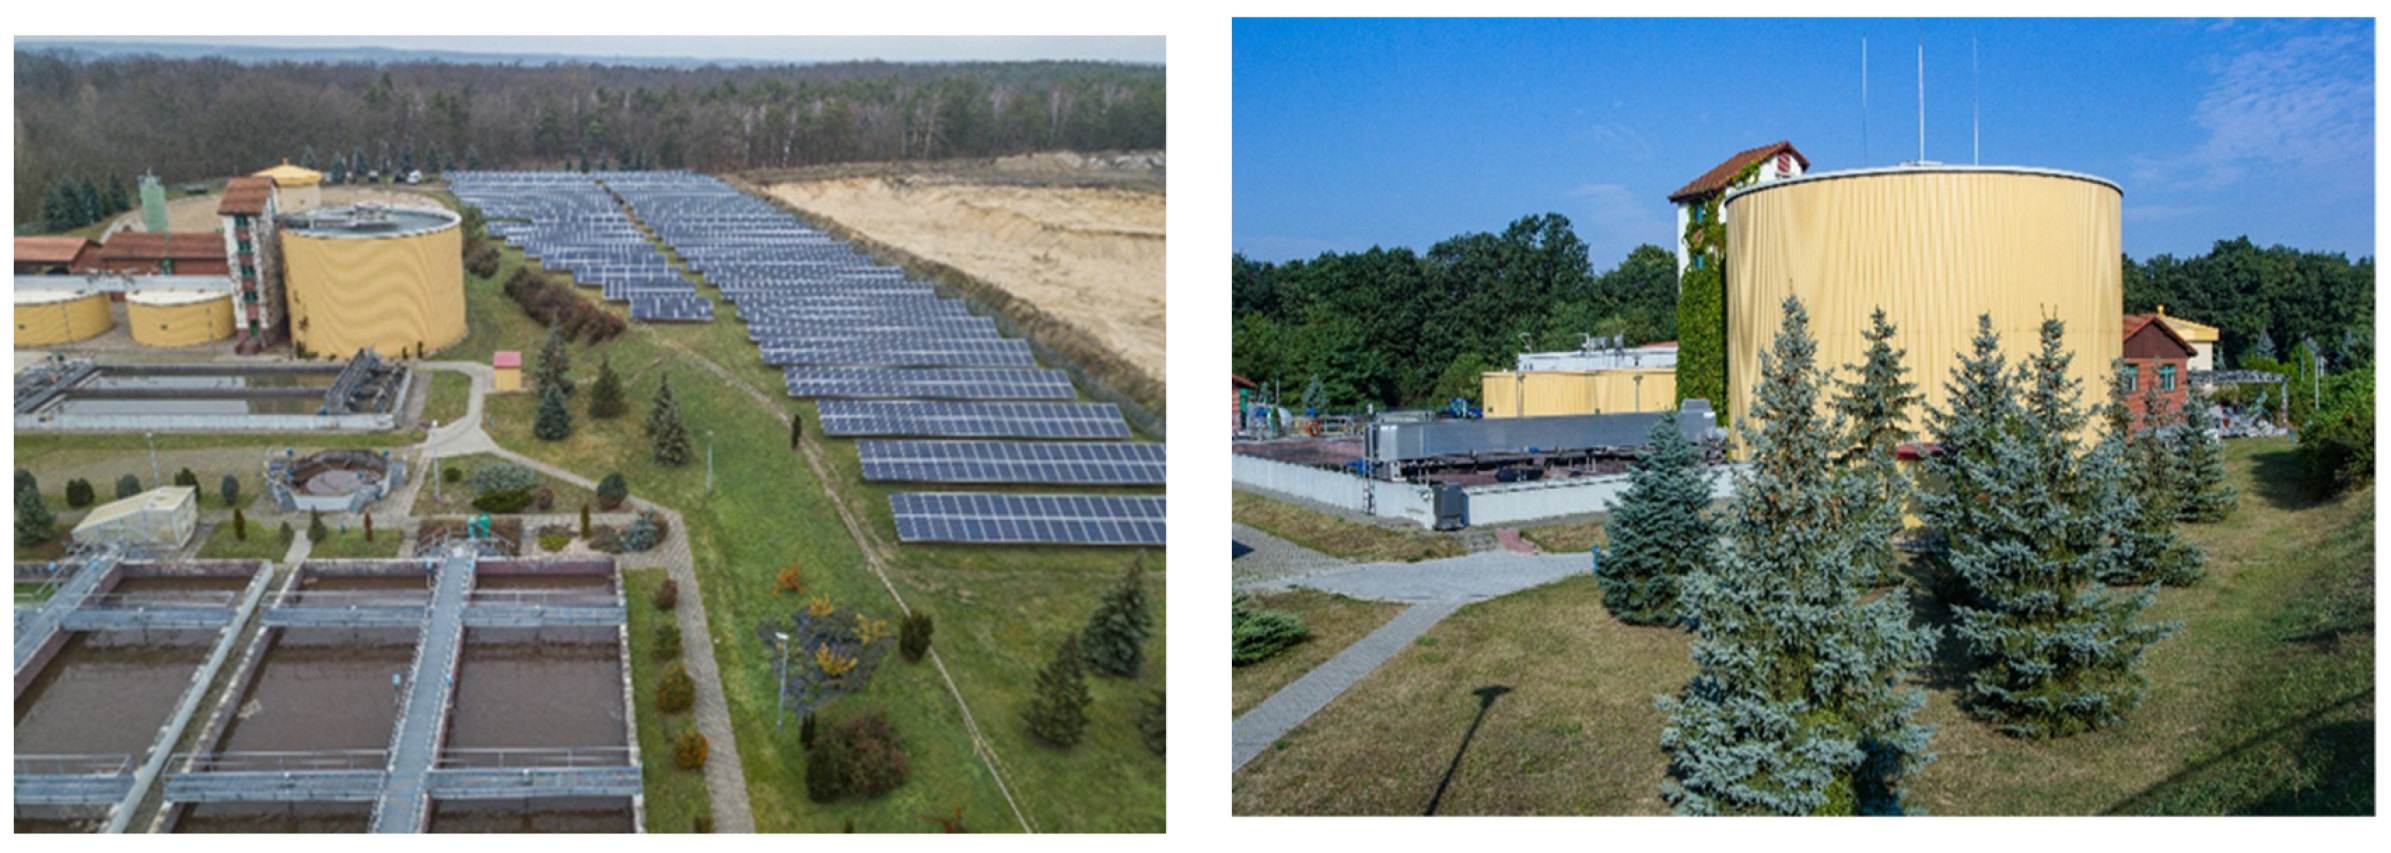
Energy management strategies in municipal wastewater treatment plants commonly include renewable energy production on site. Wastewater and sewage sludge are good material for anaerobic digestion processes, heat recovery and hydropower. The area of the WWTPs is suitable for the use of solar panels (
Figure 1).
Anaerobic digestion process convert organic matter from raw wastewater and sludge into methane-rich biogas. The content of methane and carbon dioxide in biogas varies depending on the substrates and ranges, respectively, 45–80% CH
4 and 34–55% CO
2 [
13]. Myszograj conducted research, which indicated the possibility of an increase in the biogas and methane potential of excess sludge and bio-waste as a result of the thermal disintegration process [
14,
15].
Utilize biogas can be used for heating the wastewater treatment reactors and generating electricity [
16,
17,
18,
19,
20]. According to the data of the Central Statistical Office for 2018, there were approximately 72 MW of electric power installed in Poland using biogas from WWTPs, which allowed to generate approximately 337 GWh of electricity and approximately 160 TJ of heat [
21]. An overview of the development and prospects of biogas in the European Union (EU) and its Member States is described by Scarlat et al., 2018 [
22]. The world leader in the production of electricity from biogas is the EU. It has more than 10 GW and 17,400 biogas plants installed, compared to a global biogas capacity of 15 GW in 2015. Looking at the sources of biogas, anaerobic digesters biogas predominates in Germany, Italy, Denmark, Czech Republic and Austria. In Portugal, Estonia, Ireland, Greece and Great Britain, biogas from landfills dominates the energy market. On the other hand, biogas obtained from sewage treatment plants is prevalent in a few countries, such as Sweden, Poland and Lithuania [
22]. Most wastewater treatment plants in Austria with a capacity of >20,000 PE have a digestion tank and produce biogas [
4]. In Poland, only 140 of 2500 WWTP are equipped with installations for anaerobic digestion of sewage sludge (6% of all WWTP’s) [
2].
Wastewater is also a source of mostly untapped thermal energy [
23]. Thermal energy recovery from wastewater implies the extraction of heat from the consumed water, and depends upon the temperature drop of effluent after energy recovery [
24]. In WWTPs, the heat recovery points can be raw wastewater before treatment, partially treated wastewater, and effluent discharge after treatment [
8]. The treated wastewater is a very good source, because the water flow is higher. Minor water temperature fluctuations affect the efficiency of the heat pump systems. Low concentration of solids means less biofouling and interference in the heat exchanger, thus improving the efficiency of heat exchange [
25]. Studies by Hao et al. [
26] confirmed that water heat pumps can deliver a net electrical equivalent of 0.26 kWh when 1 m
3 of waste water is cooled by 1 K. The heat energy can be directly used when it is used for heating, while it is used indirectly for production electricity [
27]. The research conducted by Pochwała and Kotas [
28] showed that the heat recovered from raw sewage satisfied 98% of the heat demand necessary for a sequential biological reactor (SBR) up to the optimum temperature value for the treatment process. The use of solar energy is growing fastest of all sources. This means that solar electricity grew from just 7.4 TWh in 2008 to 125.7 TWh in 2019 [
29,
30,
31]. WWTPs are covering large areas and therefore the potential in solar energy contribution from WWTPs is relatively high. Photovoltaic (PV) panels are predicted to provide 5% of the world’s electricity consumption in 2030 and 11% in 2050 [
32]. The energy generated from photovoltaic power plants can be used and consumed in wastewater treatment plants. The combination of photovoltaic energy production and wastewater treatment as well as the implementation of an energy management system can significantly reduce the costs of wastewater treatment [
12,
32]. Use of solar energy instead of traditional energy in WWTP was described by Strazzabosco et al. [
33]. Research conducted at 105 wastewater treatment plants in California showed that solar PV often represented the only source of renewable energy. The reported production ranges from 30 to 100% of the energy requirements of these WWTPs [
33].
The use of geothermal energy depends on the source temperature. Geothermal sources are classified as low-enthalpy (lower than 100 °C), medium enthalpy (between 100 and 150 °C) and high enthalpy (higher than 150 °C) [
34]. When the temperature sources are higher than 90 °C, electricity generation is prior to thermal uses, for lower temperature, only thermal uses are considered [
35]. In southern Italy, low- and medium-enthalpy geothermal sources were used, to generate electricity and to dry the sludge. The system covers 100% of the WWTPs electricity requirements with the production of 1.68 kWh per kg of processed sludge. The simple payback time is about 5 years and a CO
2 equivalent emission saving of 628 tons/year [
27].
An analysis of energy consumption and recovery from renewable sources in various wastewater treatment plants around the world showed that in some cases it is possible to achieve an energy independence [
36,
37].
Practical implementation of green technology in WWTPs described by Guo et al. [
12] showed that the WWTP in Eastern China (capacity 800,000 ton/day) generate electricity for onsite using solar photovoltaic power technology and produce 1.04 × 10⁷ kWh of electricity (84% of total energy demand). WWTP in the UK (capacity 63,000 ton/day) can generate 96% of the total energy consumption through biogas. WWTP in Ireland produces 7.6 × 10⁴ kWh (50% of annual energy use). WWTP in Austria (capacity 228,000 ton/day) fully fills the demand of energy using biogas technology.
The article describes the process of energy optimization of a wastewater treatment plant designed for 90,000 PE using renewable energy sources being solar, biogas, and geothermal.
2. The Gubin–Guben Wastewater Treatment Plant
The joint German–Polish Wastewater Treatment Plant (WWTP) was put into operation on 2 May 1998 and is located in Gubin (Poland). A view of the WWTP facilities is shown in
Figure 2. Wastewater from the towns of Gubin (Poland) and Guben (Germany) is fed into the plant. The Lusatian Neisse is the recipient of the treated wastewater.
The Gubin–Guben WWTP is a mechanical-biological treatment plant designed for 90,000 PE and a daily average flow of 12,000 m3/d (dry weather). Gubin is working with 95% of combined sewer and 5% storm sewer, and in Guben there is 90% of sanitary and storm sewer and 10% combined sewer.
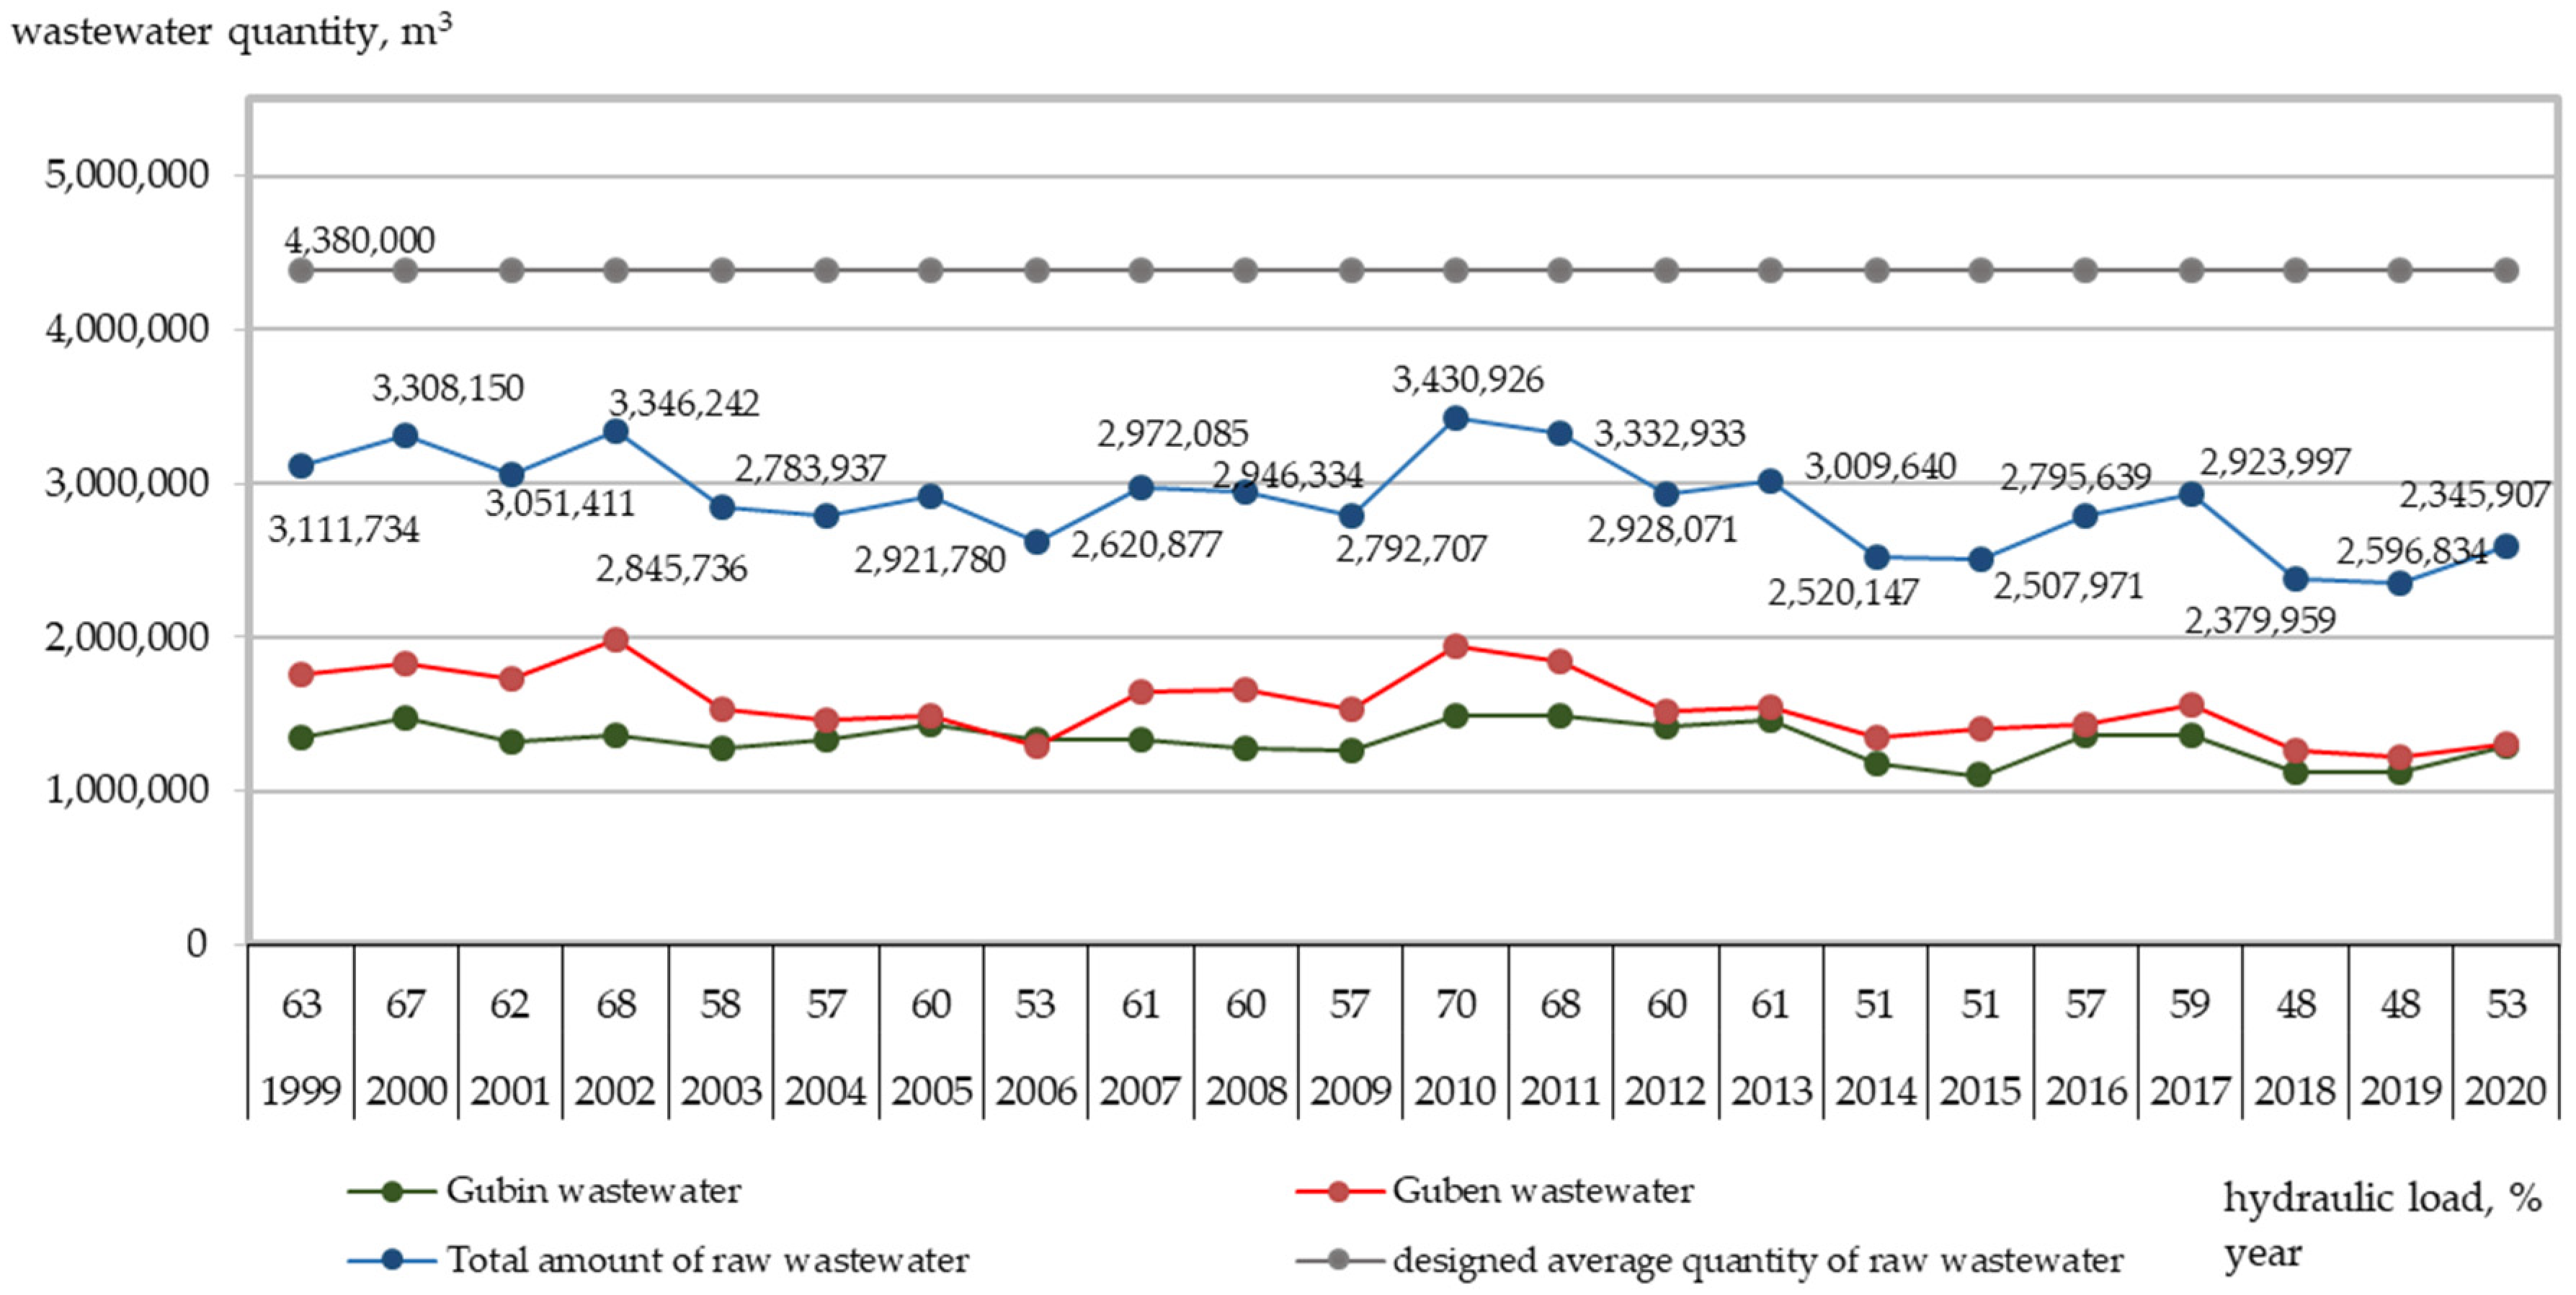
The maximum hydraulic load (70%) of the WWTP was achieved in 2010, with a decreasing trend in subsequent years. On average, in the period 1999–2021, this parameter was 58%, and in 2020, 53% (
Figure 3). In 2020, the average volume of wastewater coming into the plant from Guben was 3591 m
3/d, and from Gubin, 3523 m
3/d.
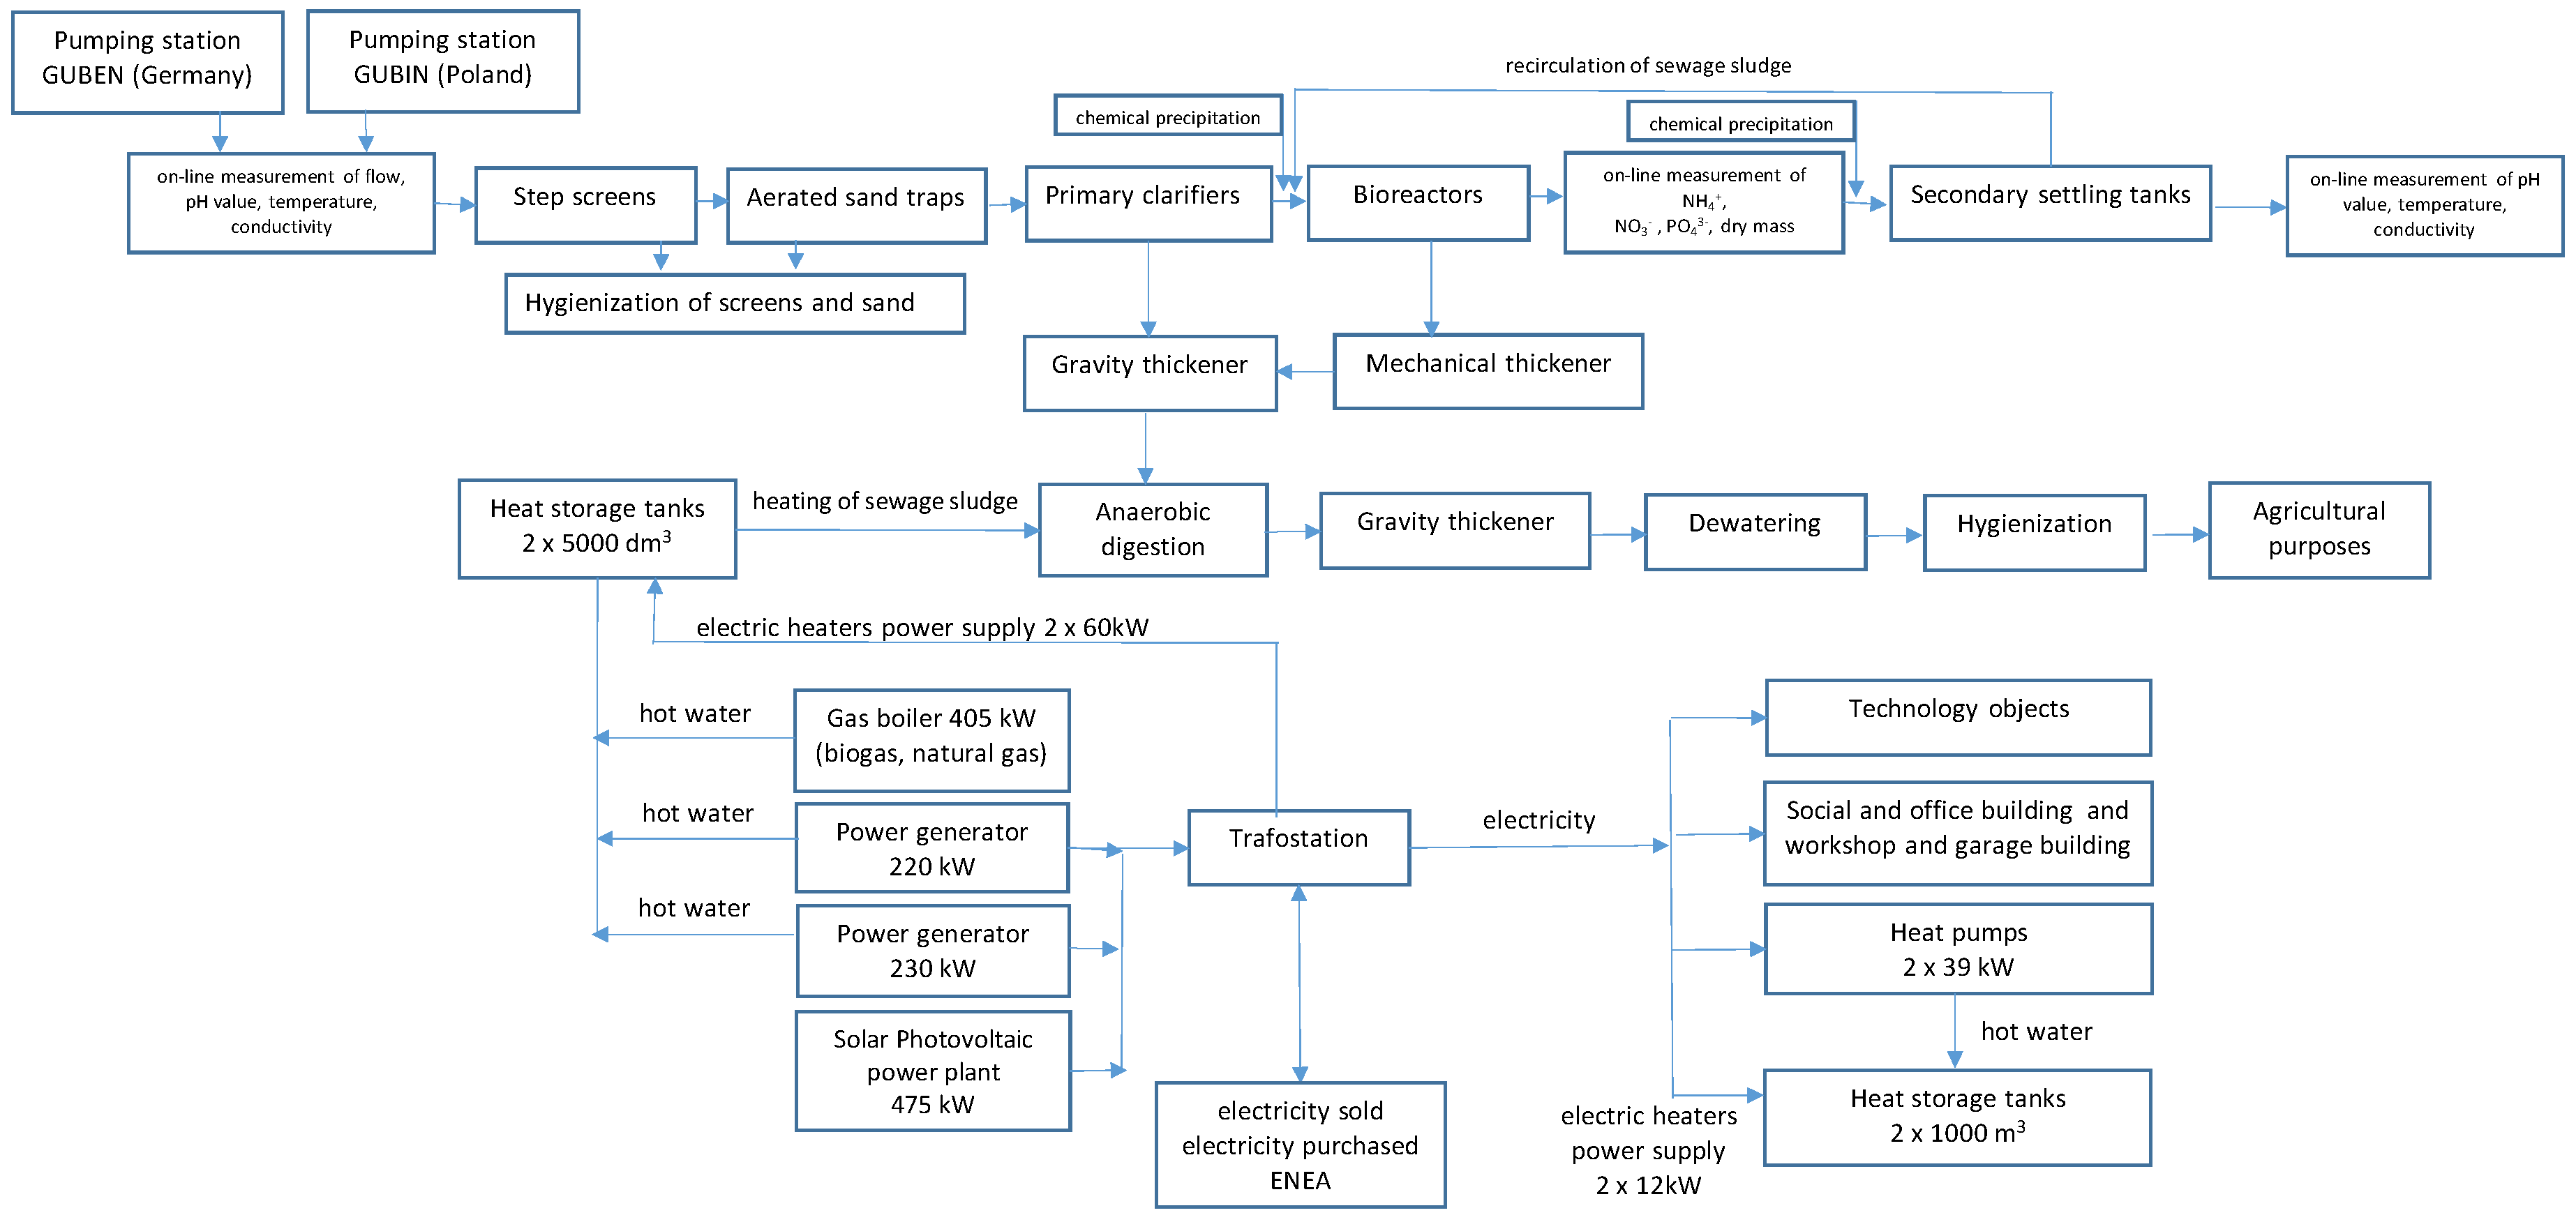
In the bar screens building, the quantity of wastewater from pressure pipes from Guben (1 × Φ400 mm, 1 × Φ300 mm) and Gubin (Φ400 mm) is measured by means of induction flow measurement. In the three chambers where wastewater flows in, “on-line” measuring devices are installed (measurement of pH value, temperature, and conductivity) as well as devices automatically taking wastewater for analytic purposes. In the mechanical section of the WWTP, there are step screens (Q
max = 300 L/s), an aerated sand trap, and a primary clarifier (Vcz = 540 m
3). Wastewater devoid of solids, sand, and suspended solids is directed to the biological section operating with activated sludge technology with nutrient removal. The biological reactor consists of four parallel chambers. In each chamber, there is a defosfatation zone, two denitrification zones, and three nitrification zones. The primary coagulant dosing point for chemical phosphorus precipitation is the separation chamber before the secondary settling tanks. After the sedimentation process in the two secondary settling tanks, the treated wastewater is led to the outlet channel through a double-sided overflow. The excess sludge is mechanically thickened from 1 to 6–7% of the dry matter and is further thickened together with the primary sludge in the gravity thickener and, after heating, is directed to the fermentation bioreactor. The fermentation process is carried out for about 15 days at a temperature of 37 °C. The fermentation gas is directed to a pressureless gas tank with a capacity of 500 m
3. The gas receivers in the plant are gas engines with an electricity generator, central heating boiler, and gas flare. The digested sludge is pumped into the gravitation thickener. After reaching a suitable degree of thickening, the sludge is fed into centrifuges. After centrifugation, the sludge is hygienised with highly reactive lime. The sludge thus prepared, containing approximately 20–23% of the dry matter, is used for agricultural purposes. The technological scheme is shown in
Figure 4.
3. Results
In a wastewater treatment plant, as in many other industrial sectors, the largest cost factor is the electricity and heat consumed, as well as other utilities required to secure the operation of the processing system. The development of energy hybrids that make dependence on external energy sources as independent as possible is a direction that has been consistently pursued at the Gubin–Guben Wastewater Treatment Plant. The project for a joint wastewater treatment plant for the towns of Gubin and Guben already included the possibility of recovering electricity and heat through the process of methane fermentation of sewage sludge.
3.1. Step One–Optimisation of Biogas Production and Use
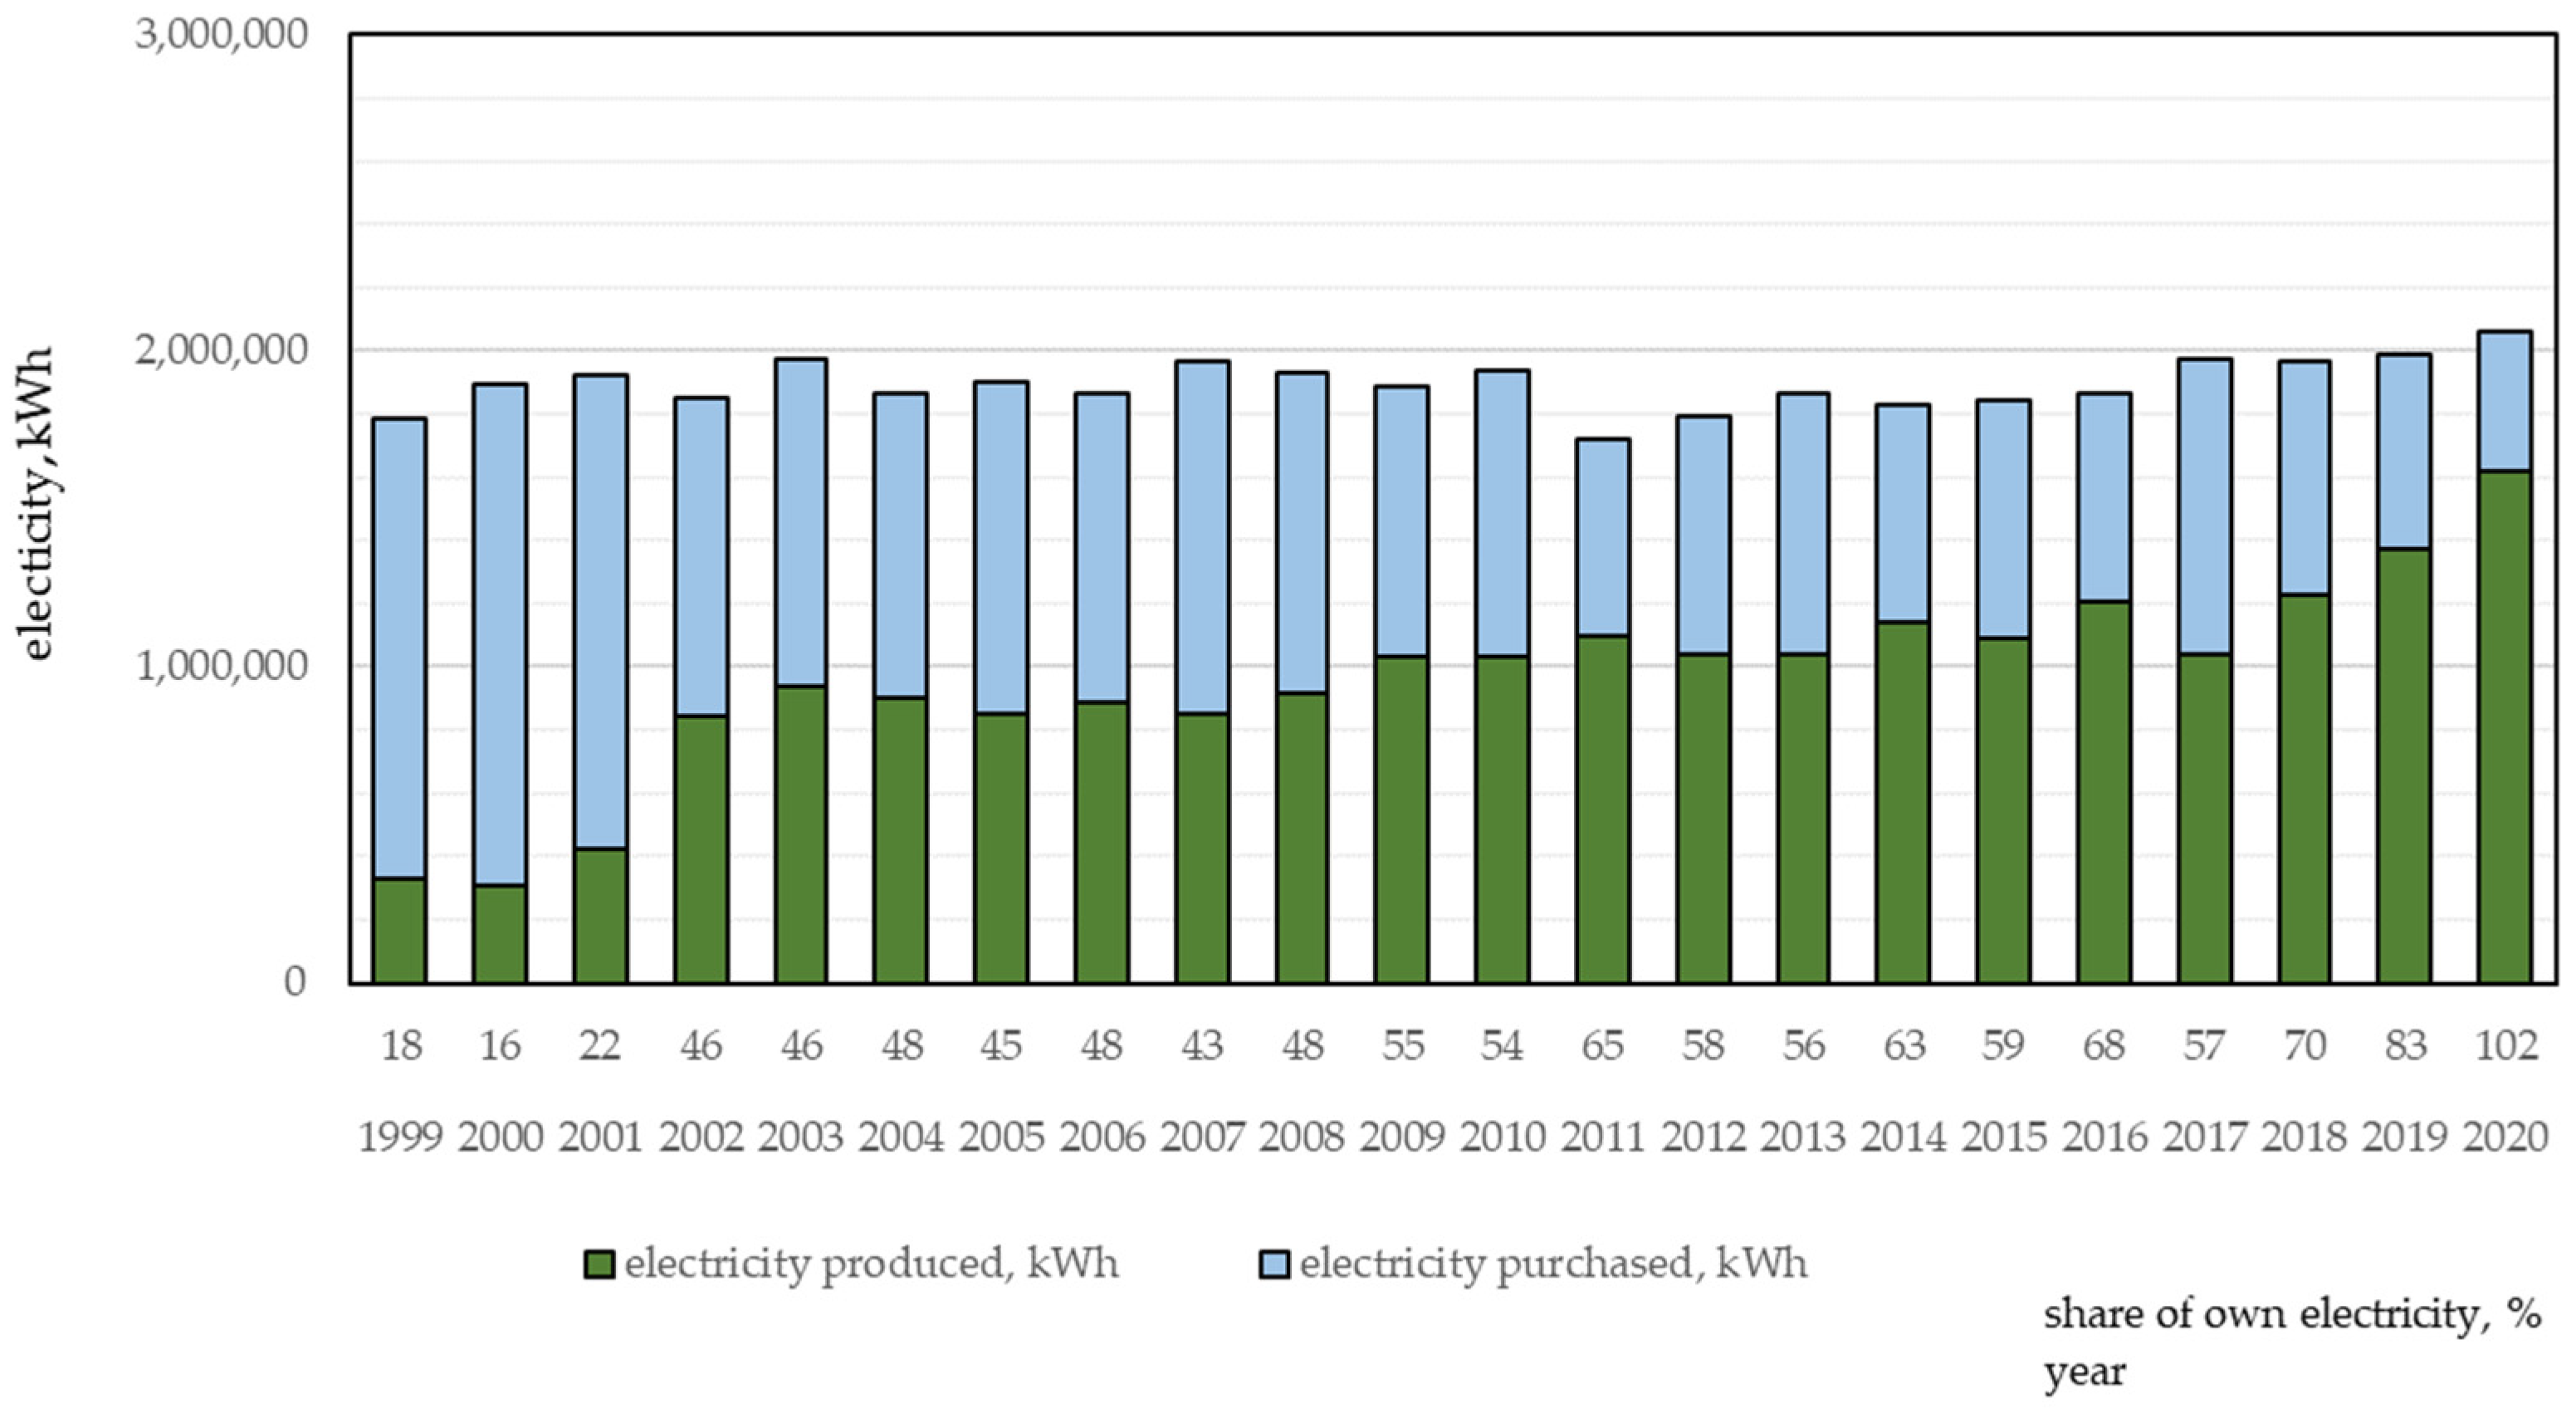
Since the beginning of its operation, the WWTP has been equipped with a generating set with an electric capacity of 230 kW and a thermal capacity of 280 kW, and with a gas boiler with a thermal capacity of 405 kW. In 1999/2000, the gas boiler was fired by biogas from the digester or by fuel oil, while the combustion engine was only powered by biogas. This allowed the WWTP to generate only 16–18% of its own electricity and secure 100% of the heat needed to heat the facilities and maintain the technological processes.
Additionally, the conditions for connection to the power grid allowed the WWTP to produce only 80% of its power in the generating set, and 20% of the power had to be purchased from the electricity supplier (ENEA-the proper name of a Polish company in the energy sector, vice-leader in the production of electricity in Poland), with no possibility of feeding electricity into the grid. In 2002, a natural gas connection was made, and an application was made to ENEA to change the conditions for electricity connection. The maximum production of electricity and heat in the generating set was assumed, with the maximum use of energy for the plant’s own needs, with the possibility of transferring the surplus to the power grid of ENEA. This change in the conditions and operation of the power system has brought tangible economic benefits (
Table 2).
In 2001, the generating set provided 22% of the wastewater treatment plant’s electricity demand, while in 2002 it provided 46%. The financial savings were slightly less, but an increase in the amount of recovered heat was achieved. In subsequent years, this type of energy management made it possible to maintain prices for contractors for the collection and wastewater treatment, and to earn a profit, despite regular increases in electricity and natural gas prices. In 2006, a second generator set was purchased with an electrical capacity of 220 kW and a thermal capacity of 275 kW. One of them worked only with natural gas and the other with biogas or alternatively with natural gas. Since that year, electricity production at the wastewater treatment plant has increased significantly. The cost of purchasing natural gas has risen, but the balance in terms of heat and electricity production has definitely improved. The condition imposed by the electricity supplier required a minimum of 20% of electricity to be purchased from ENEA.
A milestone in the energy independence of the Gubin–Guben Wastewater Treatment Plant was the award in 2011 of a concession for the production and sale of electricity generated from biogas and natural gas. Energy from biogas was recognised as clean energy and was awarded a “green certificate”. Since 2012, the annual production of electricity from biogas and natural gas has been gradually increased, and the surplus is sold to the grid, generating additional revenue. The production of electricity from biogas was at a level of 450–675 MW/year, and this is a source of additional revenue within the framework of the energy certificates of origin “green certificates”, and sales on the energy exchange.
In 2020, 34,810 tonnes of thickened sewage sludge were submitted for methane fermentation at the Gubin–Guben wastewater treatment plant. After anaerobic stabilization and mechanical dewatering, 2517 tonnes of sewage sludge was left for agricultural use. The fermentation process produced 324,475 m3 of biogas, of which 1702 m3 was burned in a gas flare. Therefore, 322,773 m3 of biogas was burned in gas engines and 675 MWh of electricity was produced. The methane content in biogas ranges from 62 to 65%, CO2 content from 37 to 34%, and the remaining gases are 1%. The average calorific value of biogas is 22,500 kJ/m3. In addition, the engines, burning 145,000 m3 of natural gas, produced 493 MWh of electricity. The calorific value of GZ 50 natural gas is 31,000 kJ/m3.
3.2. Step 2-Solar Photovoltaic Power Plant
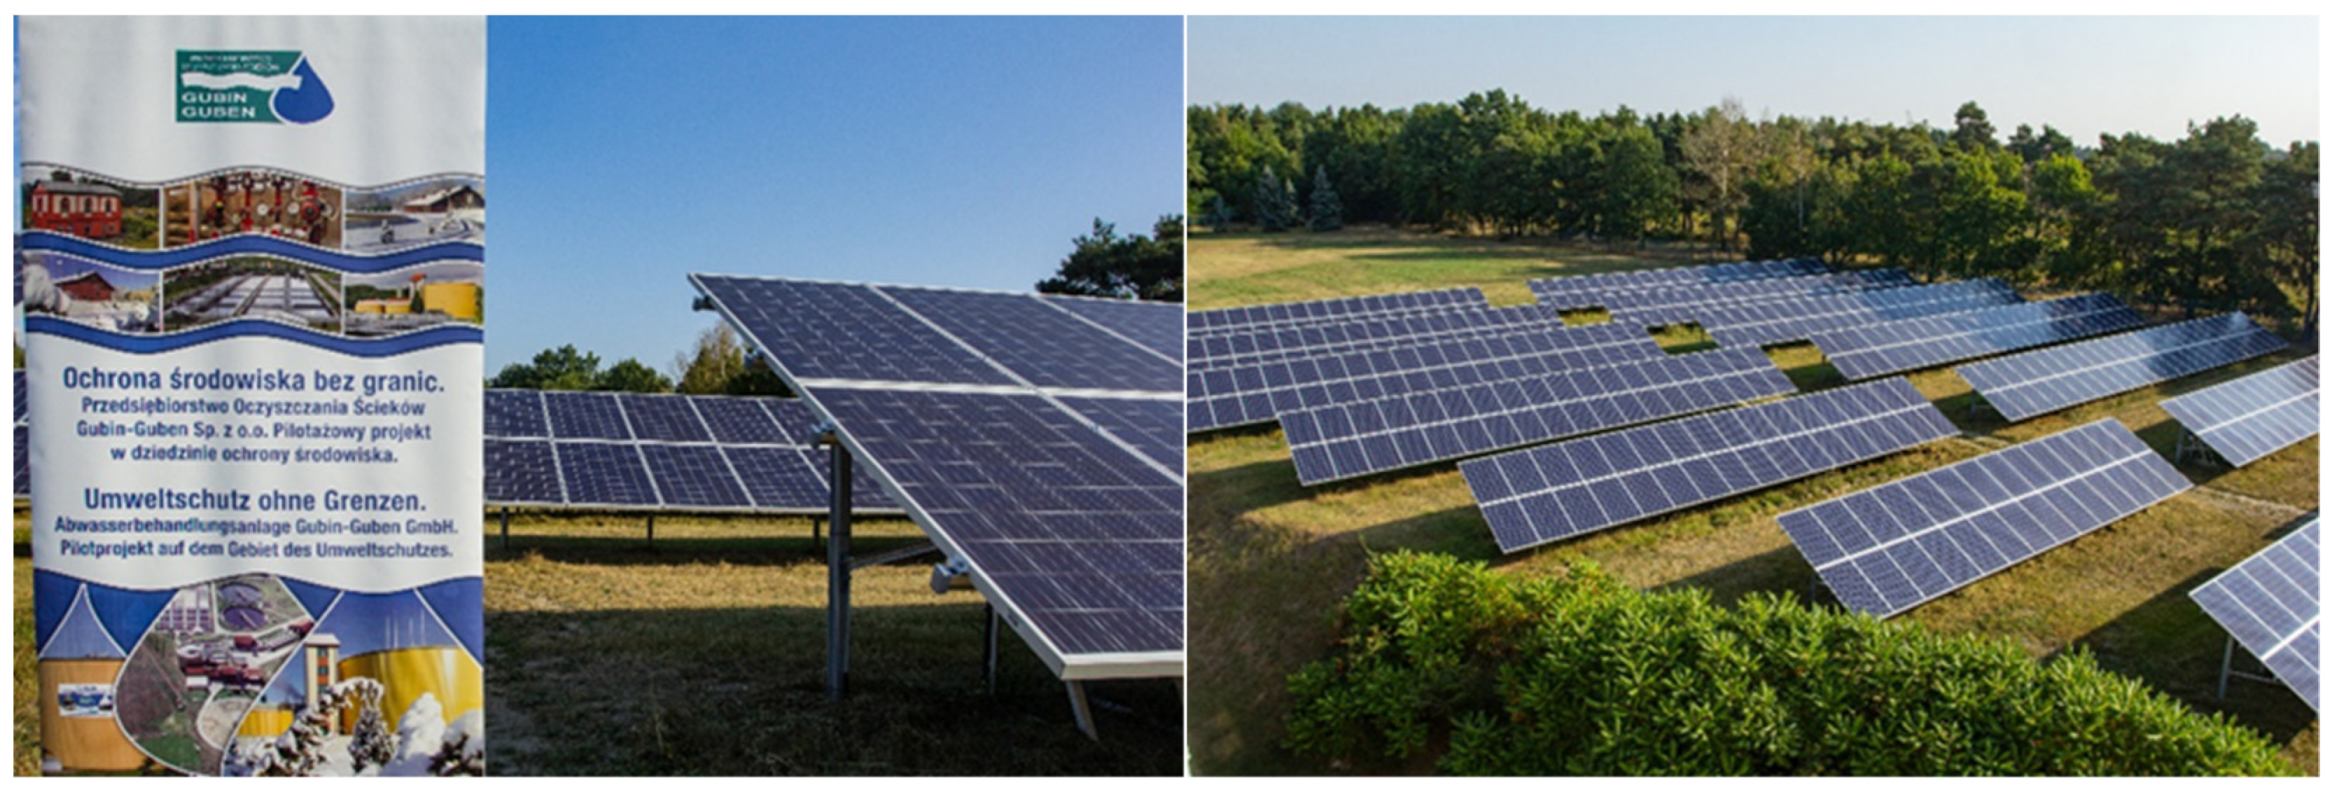
In 2015, a 250 kW solar photovoltaic power plant (PV) was built using the wastewater treatment plant’s own financial resources. Since 30 June 2016, green energy has been produced from solar energy (
Figure 5).
After several years of technical and billing terms and conditions, in 2020, the Gubin–Guben WWTP received new technical terms and conditions from the electricity supplier (ENEA), which finally allowed the power supply of the WWTP to be switched to a hybrid system, i.e., one power connection will be supplied simultaneously by two power sources (biogas/natural gas and PV installation). As a result of this arrangement, 100% of the electricity produced is used for the company’s own needs, and only the final excess is sold to the grid. The staff time spent on maintenance and keeping the PV working efficiently during the year is less when compared to the time that has to be spent on servicing the biogas and gas generating sets. The economic effects have proven to be very promising. The first three years of operation of the PV plant produced very good production results (
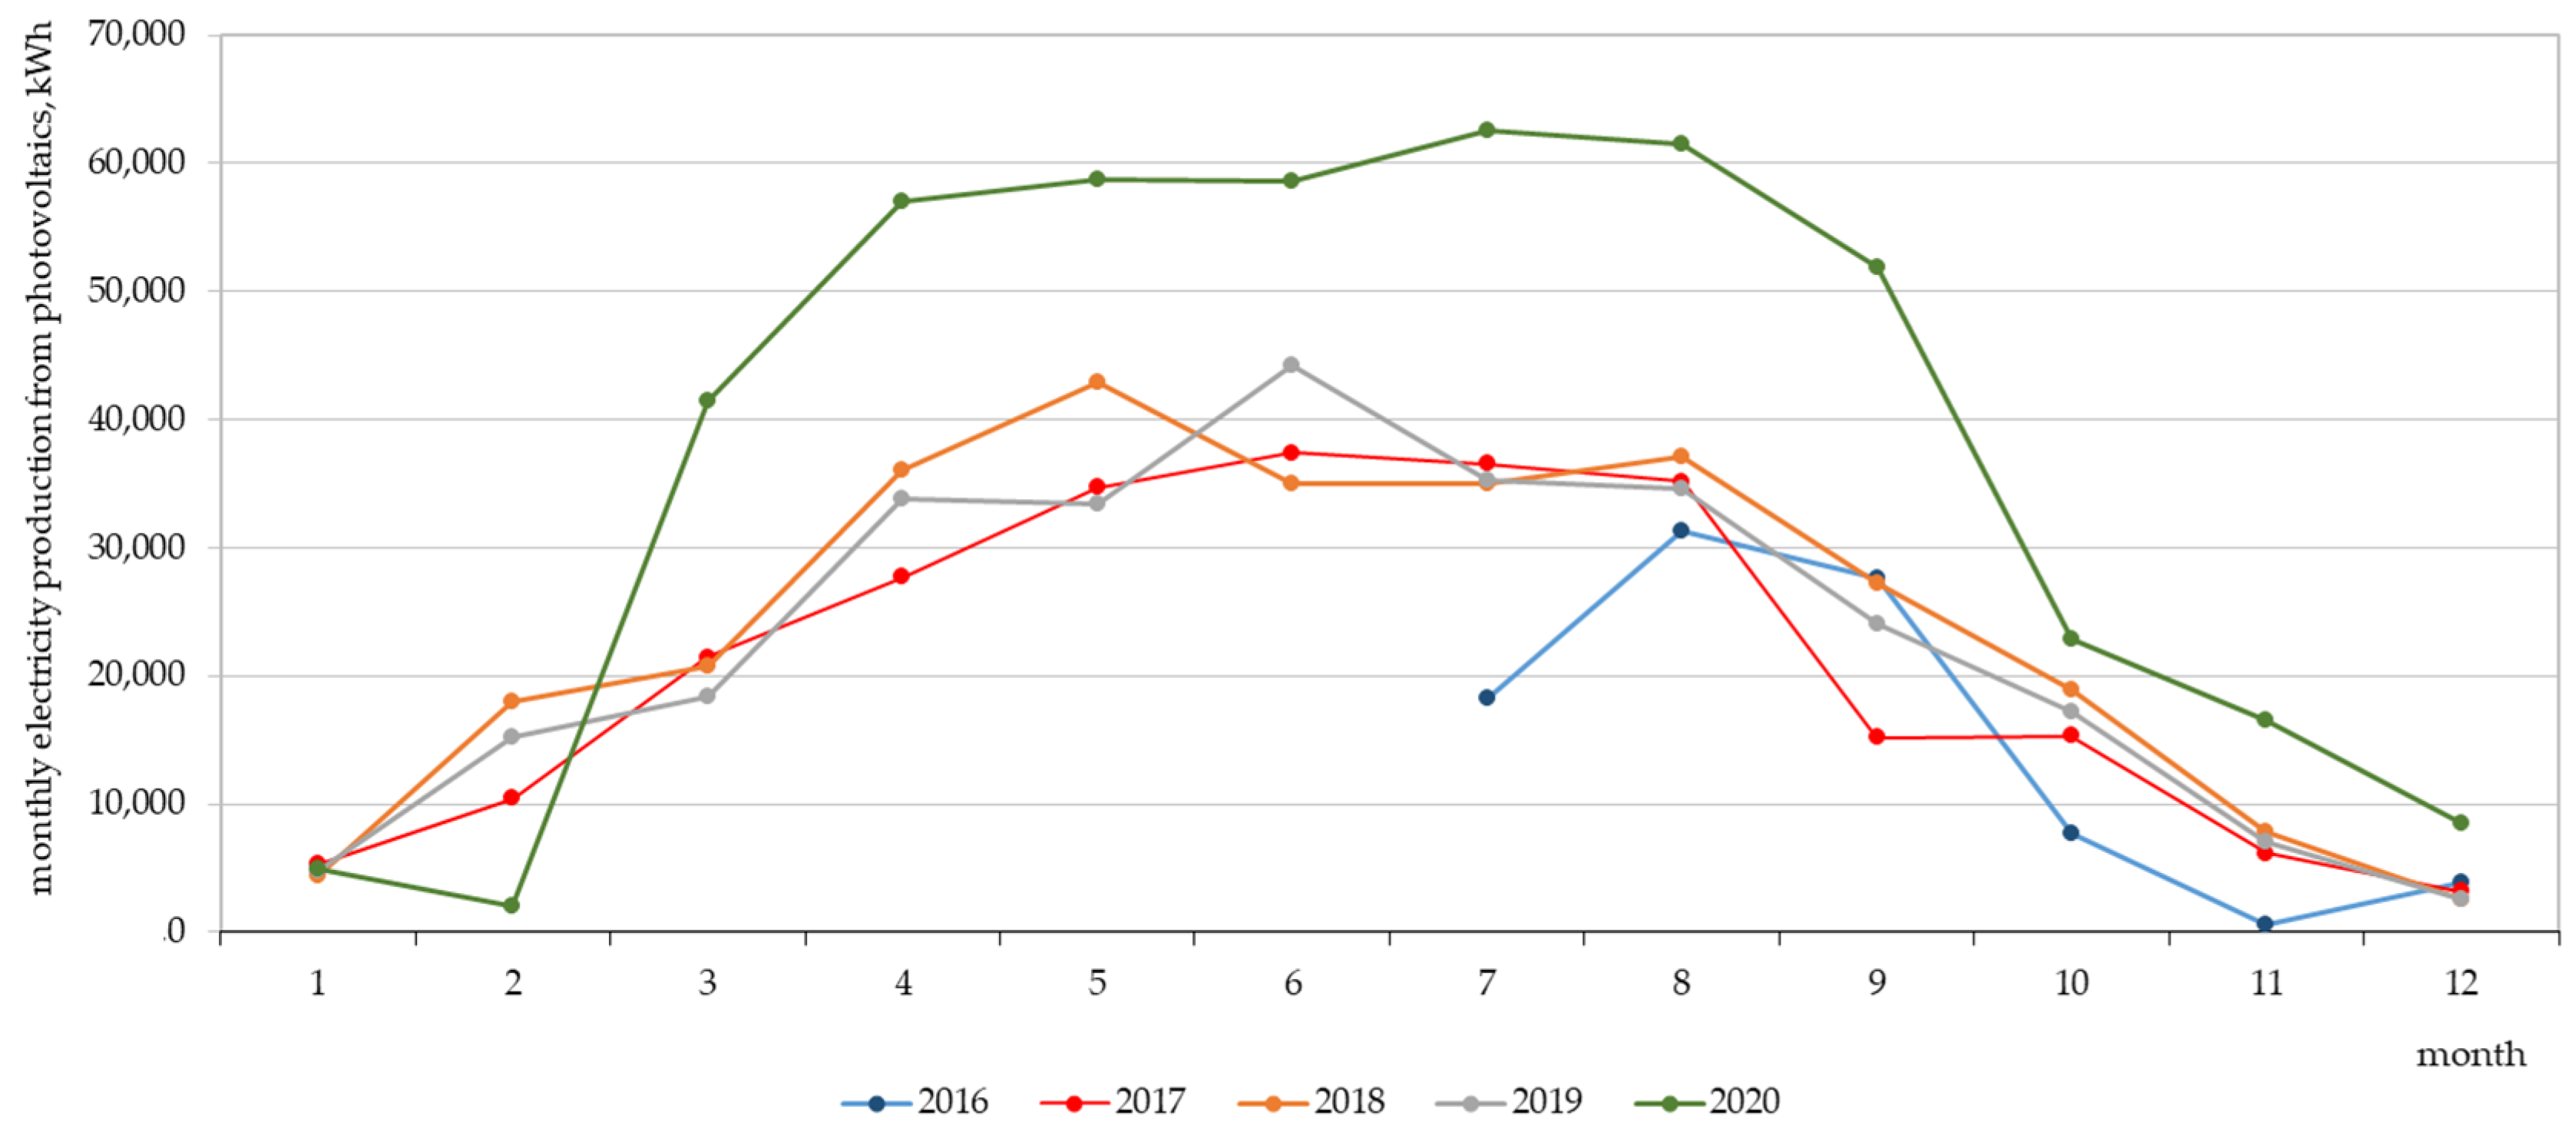
Figure 6). In 2020, the PV plant system was put into operation, expanded to a capacity of 475 kW.
In 2020, 446 MWh of electricity was produced in the PV installation. Photovoltaic electricity production at a consistently high level is achieved between April and September. In 2020, this averaged 58,392 kWh/month during this period, with a maximum value in July of 62,556 kWh/month. The average based on achievements throughout the year was 37,230 kWh/month. Below 10,000 kWh/month was achieved only in the winter months of December, January, and February.
3.3. Step Three–Geothermal Resources
Analysis of the amount of heat consumed in the wastewater treatment plant facilities has shown that transporting heat via underground pipelines from the boiler house located in the sludge dewatering building about 200 m away from the office complex results in significant heat losses. The economic balance showed that an independent heat supply to the buildings of the office and workshop complex would result in large savings. In 2018, two hybrid heat pumps of heating power 39.9 kW and electric power 17.8 kW each were installed, securing the heat demand of the office and workshop complex. Heat pumps set operating parameters: COP 4.49, annual efficiency factor SPF 4.3, number of operating hours of the pumps during the year = 2445 h/year. The heat is used for heating: a social and office building (heat demand Q = 70.30 kW), a workshop and garage building (heat demand Q = 19.71 kW), the total usable area is 1008 m2, and the volume is 434,905 m3.
In addition, the heat pump system provided two heat storage tanks, each with a capacity of 1000 dm3. During the day, when there is a large excess of clean electricity produced, the water is heated to 85 °C by electric heaters. The pumps are then not in operation. At night, the stored 2000 dm3 of 85 °C water is sufficient to provide the heat needed to heat the office and workshop complex. The tanks additionally contribute to shortening the operation time of heat pumps and saving energy purchased from the power grid per year.
In winter, the heat pumps are additionally switched on at very low temperatures. The pumps use heat from nine boreholes almost 200 m deep. In 2020, two tanks were added, each with 5000 dm3, which are heated by solar-powered electric heaters and accumulate hot water during the day, which is used at night to supply a separate digester.
The total annual heat production of the pumps is 219,655 kWh, while the total annual electricity consumption of the heat pumps = 47,581 kWh. The cost of heat generation, assuming the use of own electricity obtained from the photovoltaic installation and biogas, is zero PLN.
4. Discussion
Between 1999 and 2021, the share of electricity produced at the Gubin–Guben WWTP in total electricity consumption increased steadily. The amount of electricity produced and purchased from the power grid is summarised in
Figure 7. In 2020, full energy independence of the WWTP was achieved. The amount of electricity produced during the year exceeded its demand.
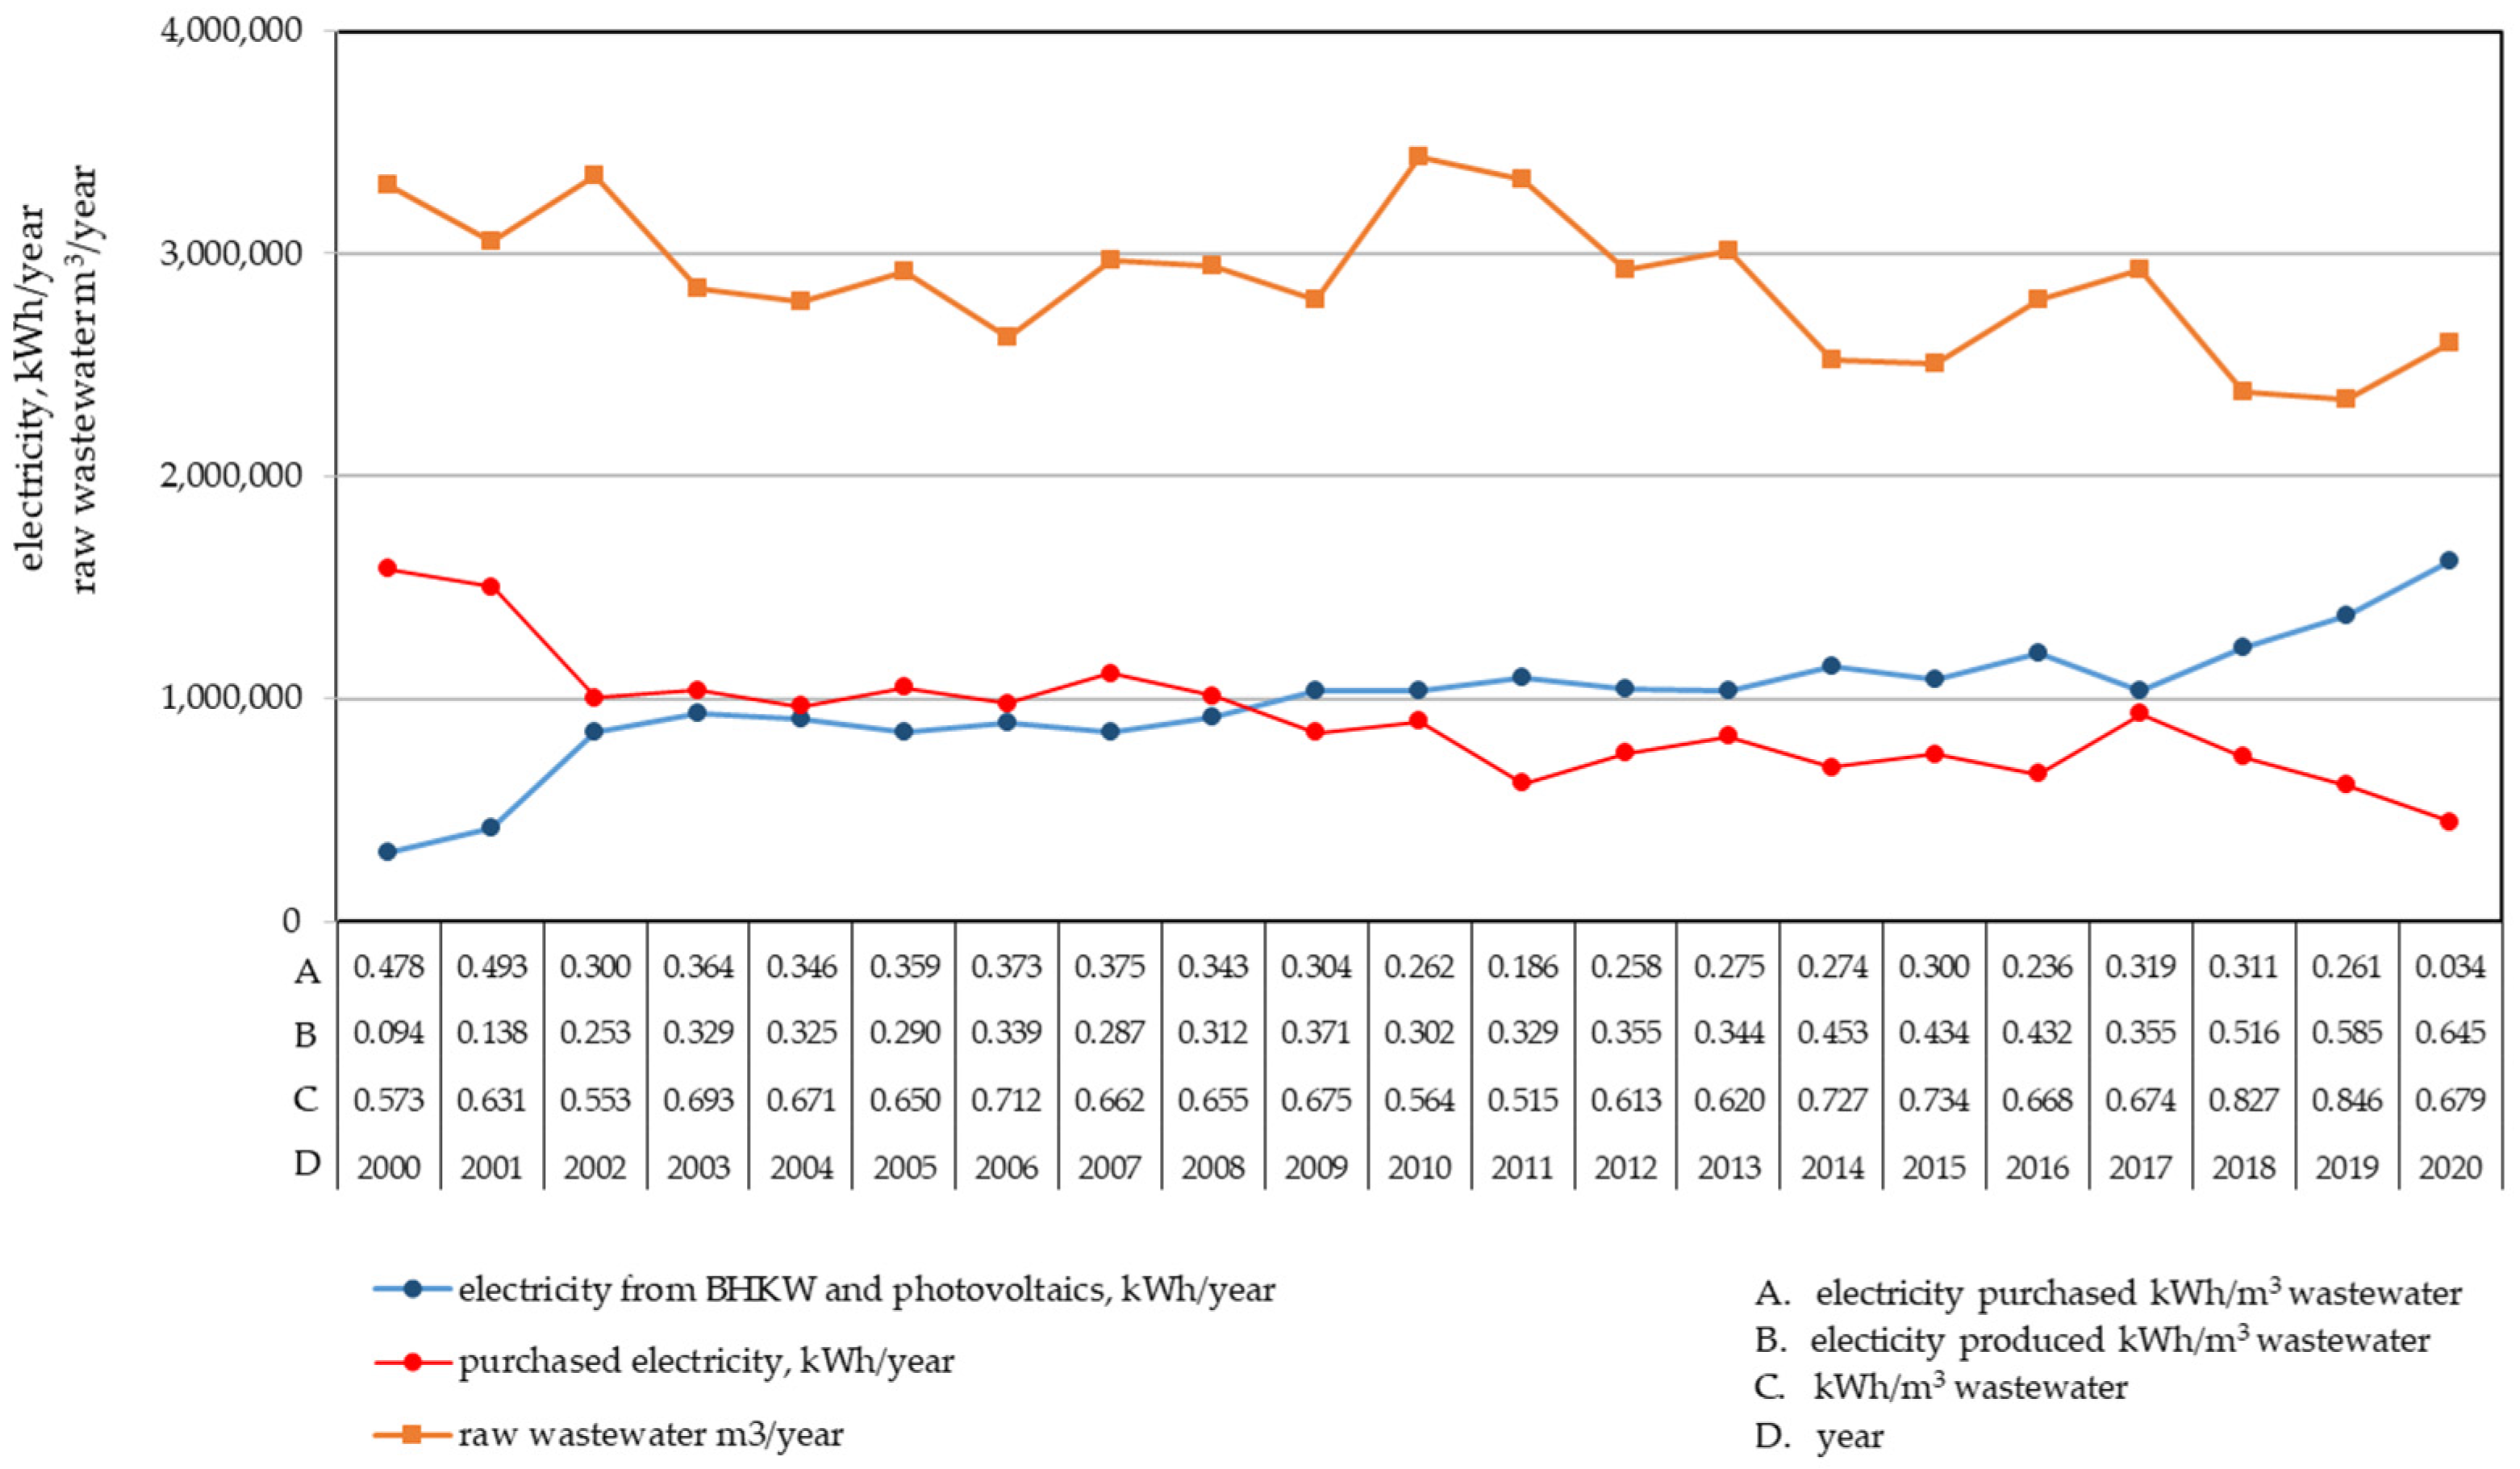
Figure 8 shows the amount of energy produced by the Block Heat and Power Plant (BHKW) and the photovoltaic installation, the amount of electricity purchased, and the amount of raw sewage from 2000 to 2020.
Figure 8 also shows the energy indicators in terms of the amount of electricity (kWh) used to treat 1 m
3 of sewage, taking into account the total energy consumption of the WWTP.
The consumption of electricity required to treat 1 m
3 of wastewater in Gubin–Guben WWTP varied between 2000 and 2020 from 0.573 to 0.846 kWh/m
3. As indicated by data in the literature, this indicator varies in a wide range of values (0.30 to 1.2 kWh/m
3) depending on the equipment of the facilities and the technology of wastewater treatment and sludge treatment [
38,
39]. In the report of the Polish Waterworks Chamber of Commerce, the energy-intensity index for the Polish WWTPs, fixed at 0.71–1.04 kWh/m
3 (data for 2017) [
40], can be found. In the selected Polish WWTPs, the energy index is: the Rzeszów WWTP 0.865 kWh/m
3 [
41], the Krosno WWTP 0.61–1.11 kWh/m
3 [
42], the Opole WWTP 0.723 kWh/m
3 [
43], the Iława WWTP 0.812–1.370 kWh/m
3 [
2], the Lublin WWTP 0.421 kWh/m
3 (consumption of electricity only for aeration system) [
44].
In 2020, the consumption of electricity required to treat 1 m3 of wastewater in Gubin–Guben WWTP was 0.679 kWh taking into account all points of demand for electricity, including non-technological ones.
Many authors point out that the energy assessment of wastewater treatment plants using this parameter seems to be misleading, as underestimated values are obtained in facilities with significant rainwater inflow [
1,
5,
38]. Therefore, it is more meaningful to use indices for energy inputs related to the removal of specific pollutant loads, e.g., BOD
5 or total nitrogen.
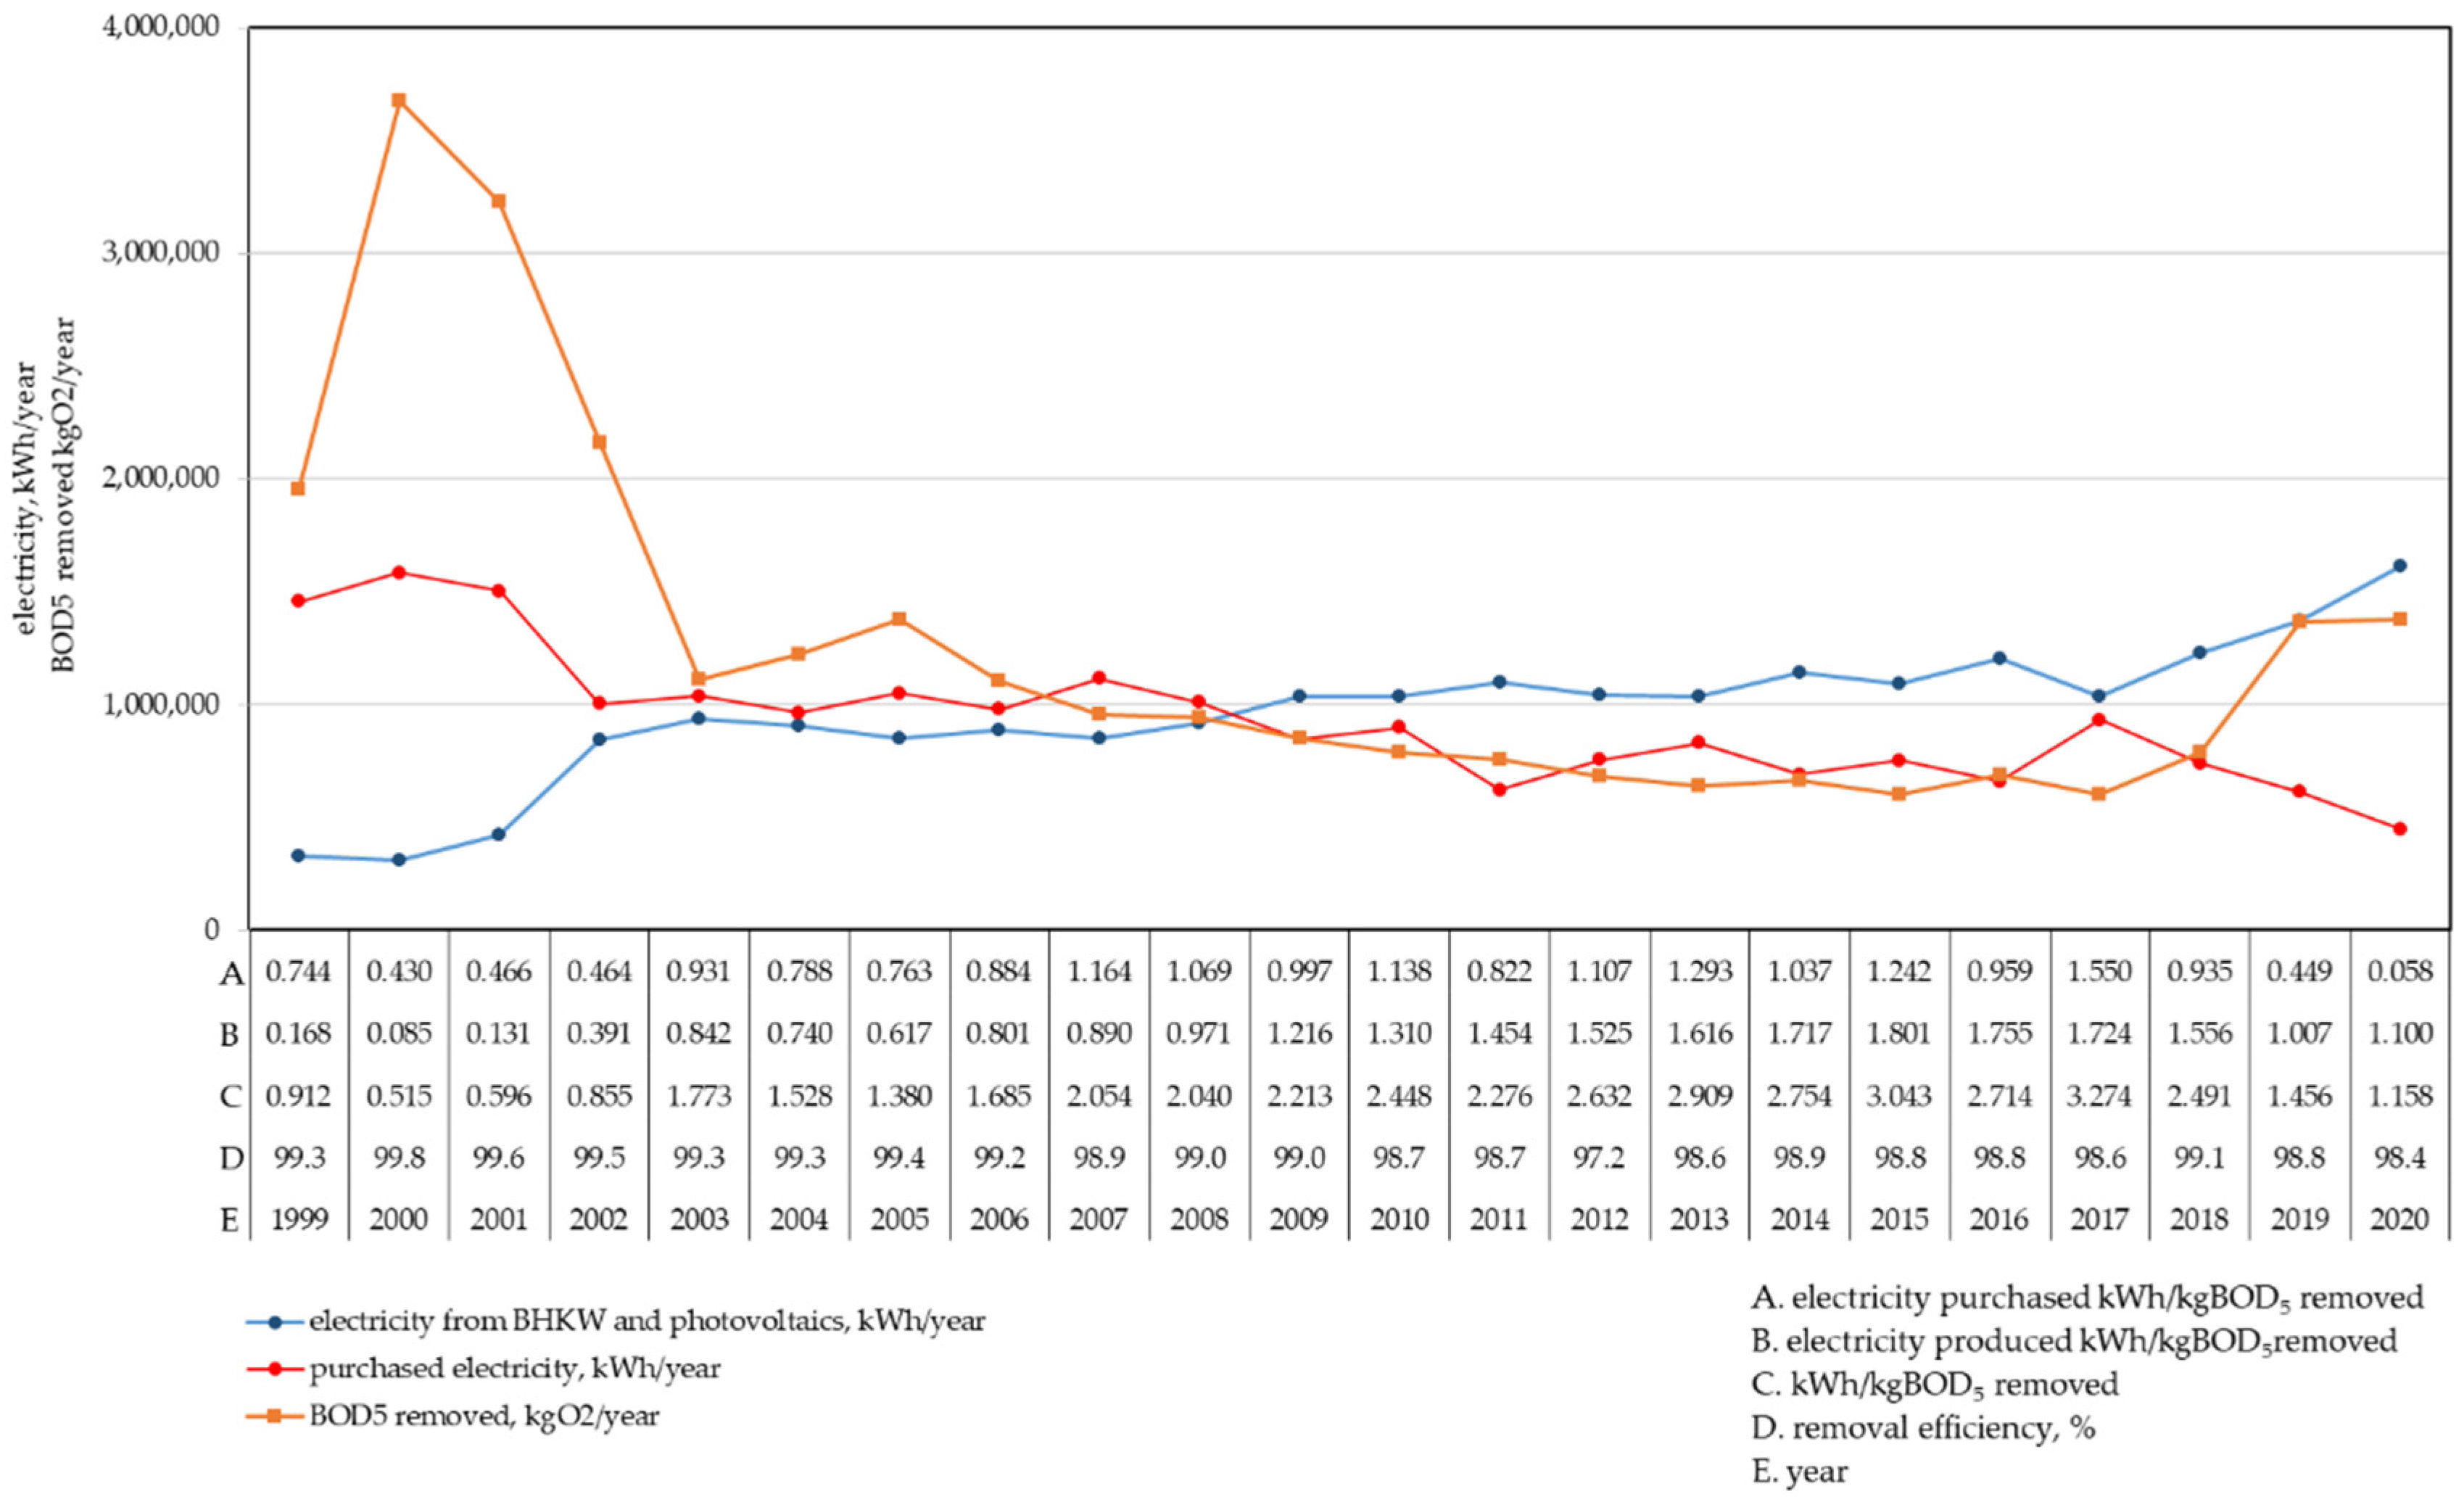
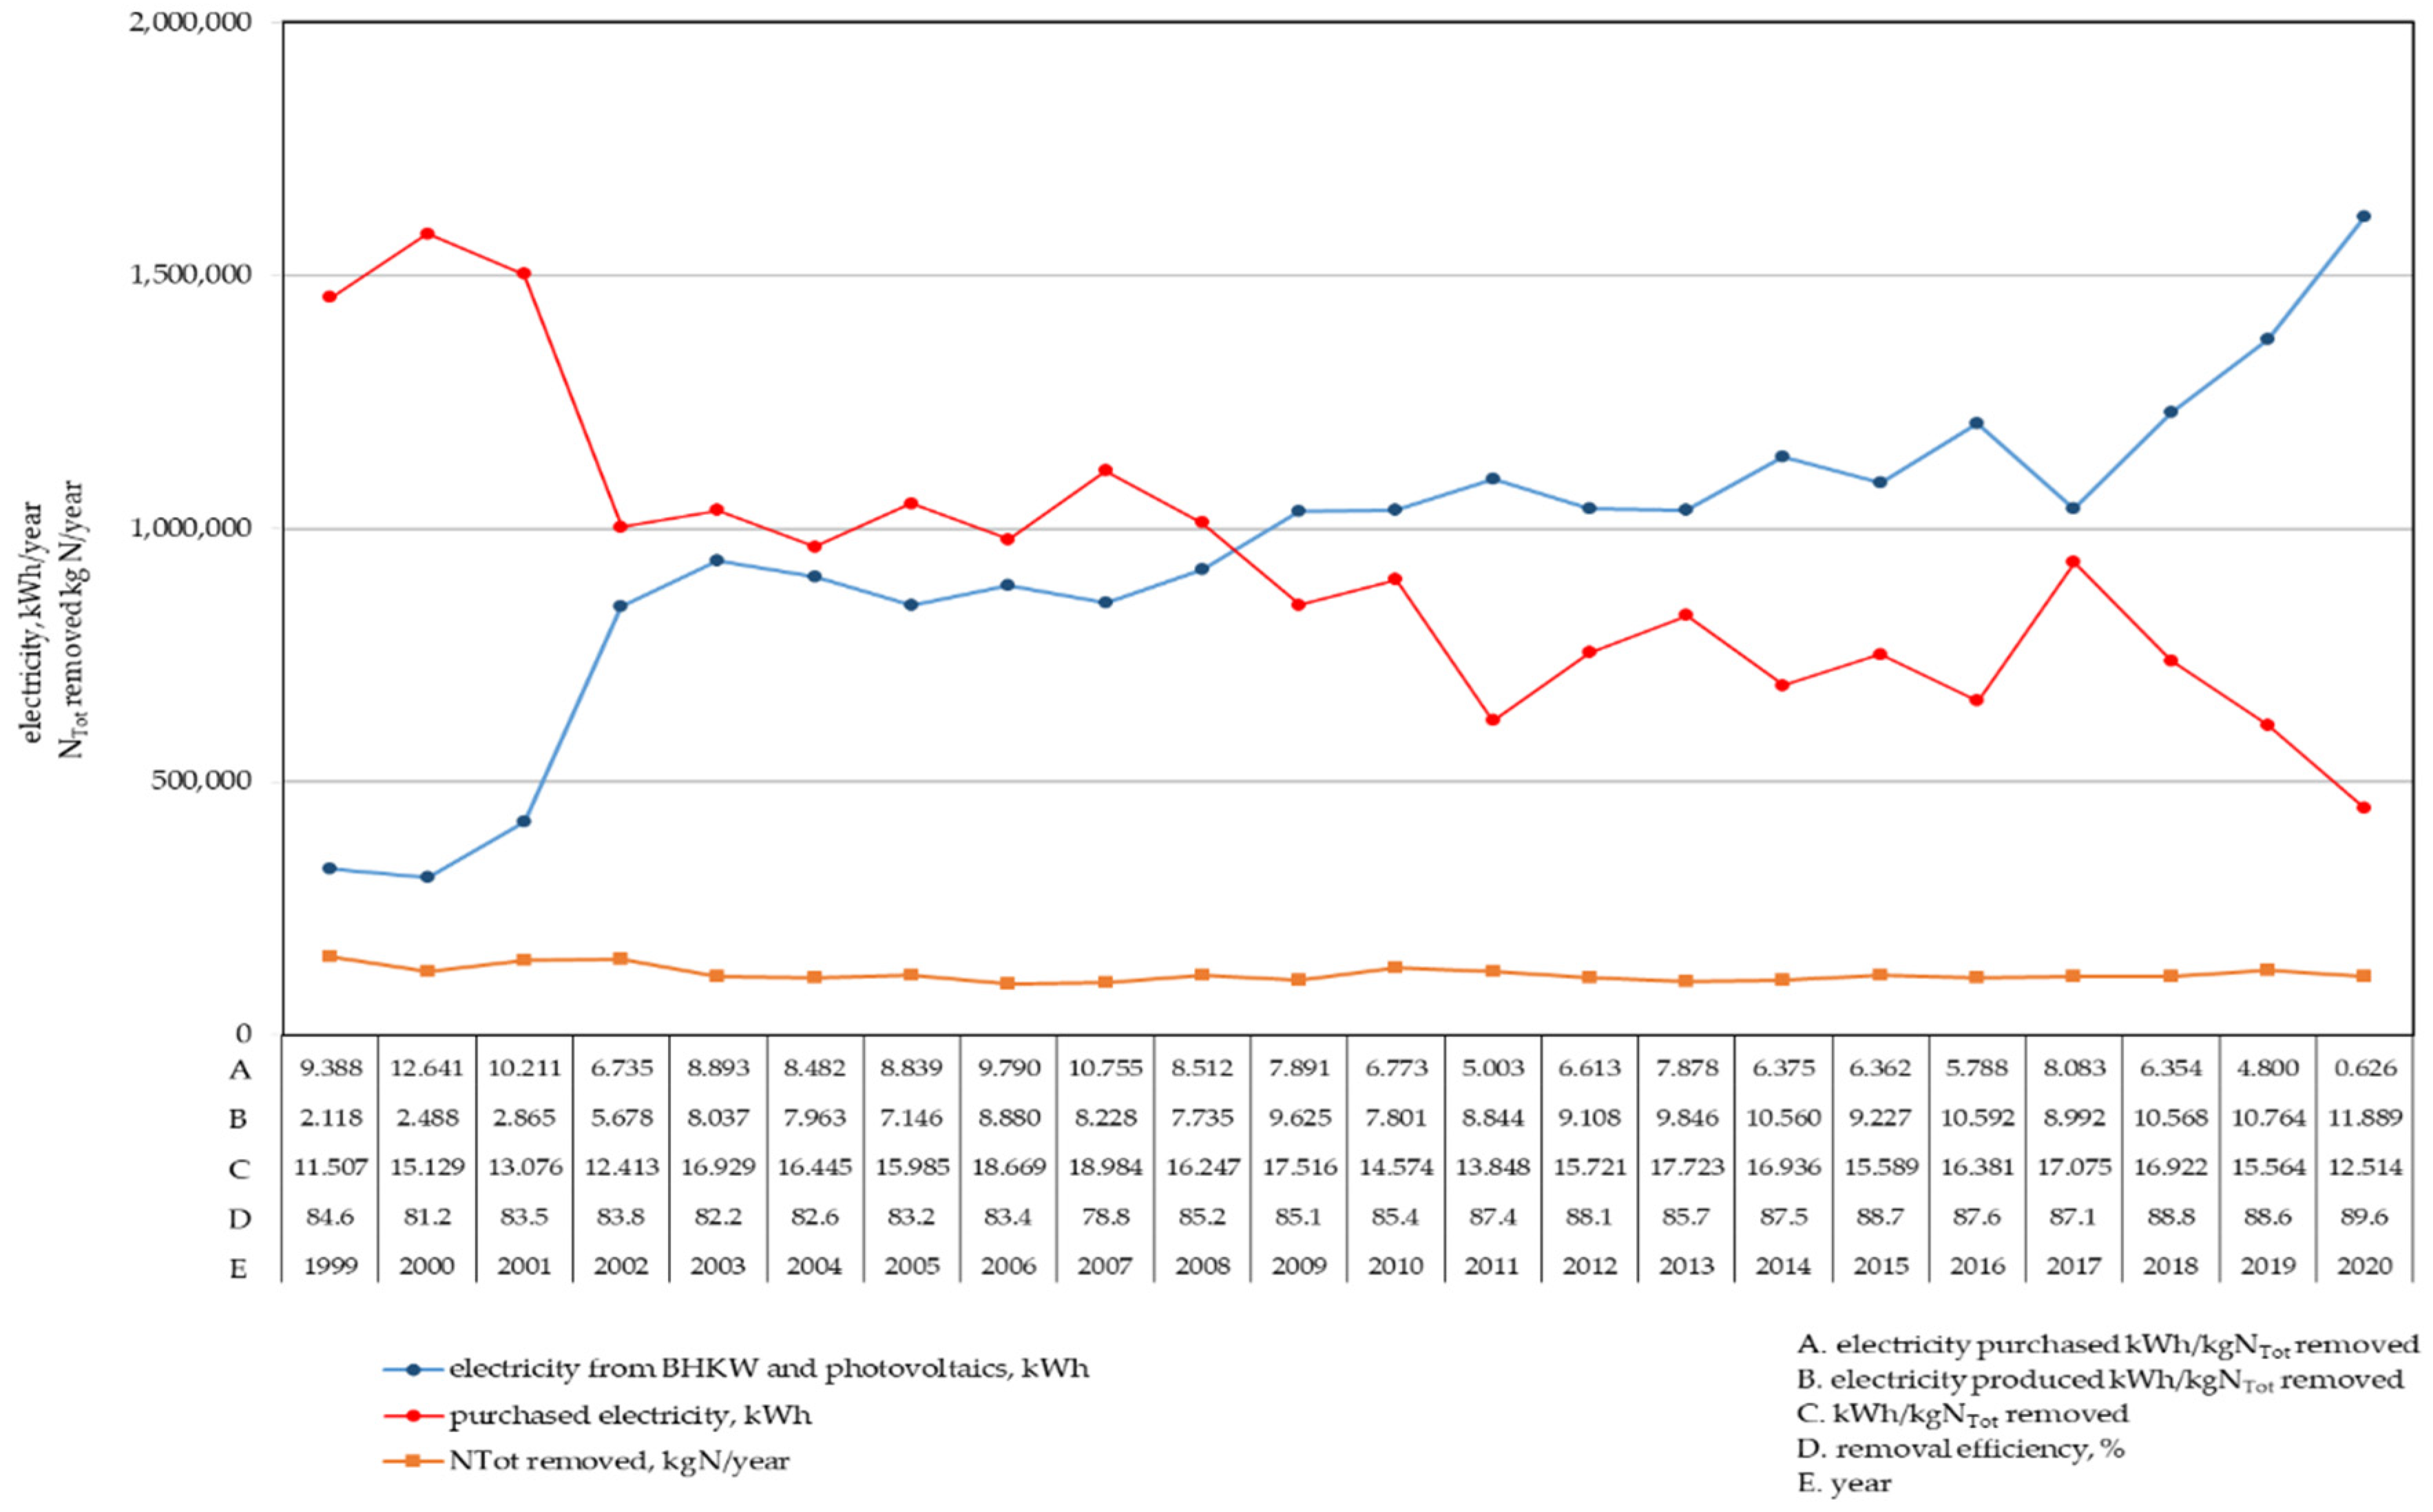
Figure 9 and
Figure 10 show the amount of energy produced by the BHKW and the PV plant, the electricity purchased, and the BOD
5 and total nitrogen removed between 2000 and 2020, respectively. Data on energy indices per amount of electricity (kWh) required to remove 1 kg of BOD
5 and 1 kg of total nitrogen are also presented.
In 2020, the electricity consumption index was 1.16 kWh/kg of BOD
5 removed with a treatment efficiency of 98.4%. However, for total nitrogen it was 12.51 kWh/kg of total nitrogen removed with a treatment efficiency of 88.6%. According to Fighir et al. [
45], for the four wastewater treatment plants analysed, the electricity consumption was found to be: 1.36 kWh/kg BOD
5 removed (2710164 PE), 1.51 kWh/kg BOD
5 removed (52158 PE), 1.92 kWh/kg BOD
5 removed (609601 PE), and 0.98 kWh/kg BOD
5 removed (524158 PE). In the selected Polish WWTPs, the energy intensity is: the Rzeszów WWTP from 1.03 to 1.57 kWh/BOD
5 [
41], the Opole WWTP 1.66 kWh/BOD
5 [
43], the Iława WWTP 0.92–2.13 kWh/BOD
5 [
2]. In contrast, Christoforidou et al. [
46] determined energy factors for size classes of wastewater treatment plants based on the Directive 91/271/EEC: Class A for P.E. > 100,000, Class B for 100,000 > P.E. > 10,000, Class C for 10,000 > P.E. > 2000, and Class D for P.E < 2000. In the A Class, WWTPs’ specific energy values for organic load removal were found to be 5.95 kWh/kg Ν, B Class WWTPs 11.5 kWh/kg Ν, while C-D Class WWTPs are the most energy consuming with 18.46 kWh/kg Ν. If about 300 MWh estimated for non-technological service are subtracted from the total amount of energy used these indicators will be definitely different, because, e.g., for wastewater treatment it will be 0.50 kWh/m
3, for total nitrogen removal N it will be approx. 11.23 kWh/kgN, and for BOD
5 it will be 0.94 kWh/kg BOD
5.
Electricity consumption in the Gubin–Guben WWTP, which was recorded, is the energy used both for the technological process and for servicing the needs of the office, workshop, canteen, area lighting, etc.
Additional investments made in recent years, such as the replacement of devices with energy-saving solutions (blowers, centrifuges), meant that in 2020, the Gubin–Guben wastewater treatment plant consumed 1596 MWh of electricity for operational and social and office purposes. This consumption is lower than in previous years.
An economic analysis of the profits resulting from the production of energy from renewable sources, the costs incurred for energy purposes in 2020 and a comparison with the costs that would be incurred without investments enabling the recovery of electricity and heat from biogas, natural gas, PV and geothermal energy are summarized in
Table 3.
In the current situation, the price for the treatment of 1 m3 of wastewater and the management of sewage sludge in the Gubin–Guben WWTP is 1.50 PLN net for the Polish side and 0.70 EUR net for the German side. The generated net profit ensures financial liquidity at the level of 5.87. This can be regarded as an excellent result for a municipal enterprise which has to carry out its own tasks for the commune and works as a “non-profit” company. In the absence of investments enabling the recovery of electricity and heat from biogas, natural gas, PV energy and geothermal energy, the cost of treating 1 m3 of wastewater and managing sewage sludge would be PLN 2.10 net for the Polish side and EUR 0.85 net for the German side, respectively. This is an indisputable argument for the rightness of investing in renewable energy sources and independence of WWTP from external energy suppliers.
Despite the very good energy effects, the strategy of the WWTP’s operation still includes priority further actions, which, with the recent rapid prices for electricity, will ensure the unchanging price for both cities, Gubin and Guben, for wastewater treatment and financial security for the company. Currently, the construction of a photovoltaic installation has started on all roofs of buildings in the WWTP, as an autonomous network for a given building. This will additionally account for about 160 kW of installed power, which during the day will relieve the energy demand of a given building and devices operating in it. It will also have a direct impact on reducing the amount of purchased natural gas.
The procedure for extending the permit for the treatment of biowaste in the digestion bioreactor is also underway. Currently, the fermentation chamber is underloaded. Supplementing the batch will cause the daily production of biogas to increase at least two times. Thus, the production of own electricity from biogas will reduce the current consumption of natural gas by about 50–70% and the cost of its purchase.
Another investment is the purchase of an “energy bank” with a capacity of approximately 180 kW. This investment will guarantee, during periods of lack of sun, when the photovoltaic installation is not able to provide the power required by the WWTP, a smooth operation, instead of buying energy or keeping gas engines in constant excess of energy production.


 ,
, 


