Review

Health Benefits from Renewable Electricity Sources: A Review

1
CEFUP, Faculdade de Economia, Universidade do Porto, R. Roberto Frias, 4200-464 Porto, Portugal
2
COMEGI, CEFUP, Universidade Lusíada Norte, R. de Moçambique 21 e 71, 4100-348 Porto, Portugal
*
Author to whom correspondence should be addressed.
Energies 2021, 14(20), 6678; https://doi.org/10.3390/en14206678
Submission received: 3 September 2021 / Revised: 28 September 2021 / Accepted: 8 October 2021 / Published: 14 October 2021

Abstract

:
Energy generation has had several negative health impacts over the last few decades, mainly due to air pollution. One of the ways to decrease such impacts is to increase energy generation through renewable energy sources (RESs). These sources have important health co-benefits that need to be taken into consideration. This topic has been included in the literature, but research is scattered. The goal of this article is to show the status of the literature on this topic. We performed a systematic literature review on the health co-benefits of RES use, depicting the state of the art of this literature, some common findings, limitations, and lines for future research. It is clear from our analysis that this literature remains scarce. We found 28 studies fitting the inclusion criteria. Results can be summed as follows: (1) wind and solar power are the most studied RES sources; (2) most studies are for the United States and developing countries are largely understudied; and (3) health benefit results vary widely according to site-specific conditions. Overall, the existing studies show significant health co-benefits from RES use, which are important to consider when performing cost–benefit analysis for energy projects. This is particularly relevant for policy-makers and energy investors.

1. Introduction

Energy has played a major role in the development and growth of human societies, including in the health dimension. However, the increasing energy needs have required the intensive harvesting and burning of fossil fuels, which have had important negative impacts on human health. These impacts can be roughly divided in two main groups. On one side, Carbon Dioxide (CO2) and other Greenhouse Gas (GHG) emissions (such as Methane, Nitrous Oxide, Hydrochlorofluorocarbon, and Hydrofluorocarbon emissions) contribute to climate change, which is itself responsible for strong health hazards. The energy system, including transports, is responsible for nearly two-thirds of GHG emissions worldwide [1]. Climate change has been classified as the greatest historical market failure [2] and as the “biggest global health threat of the 21st century” [3]. Consequently, a large number of countries have implemented measures to mitigate climate change [4].
On the other side, especially in low-income countries, the non-CO2 climate-altering pollutants, also called “traditional air pollutants” [5] (e.g., Ozone (O3), Sulfur Dioxide (SO2), Nitrogen Oxide (NOx), Nitrogen Dioxide (NO2), Particulate Matter (PM), and Benzene), directly harm human health. According to Smith et al. [6], two-fifths of the human population are subject to household air pollution due to inefficient and poor combustion of solid fuels used for cooking and heating. Gallagher and Holloway [5] point out that exposure to health-damaging air pollution is responsible for roughly 4.2 million deaths per year, being the largest environmental impact on human health. These impacts are mainly due to heart attacks, strokes, chronic obstructive pulmonary disease, lung cancer, and acute lower respiratory infections in children [7]. Simultaneously, in 2010, outdoor air pollution was responsible for around 3.3 million deaths [8]. Finally, other health problems are associated with occupational hazards; for instance, offshore oil drilling and coal mining are some of the highest-risk professions [1].
The negative effects of energy and particularly electricity generation arise mainly from the burning of nonrenewable or fossil sources. The heavy pollution resulting from their use severely impacts human health [9,10,11]. Hence, efforts to decrease emissions are crucial. In the energy sector, renewable energy sources (RESs) and energy efficiency (EE) appear to be the most promising contributors to achieve the goal of reducing emissions [7]. These sources do not have harmful emissions or, if the full life cycle is considered, have less emissions than traditional fossil fuels. Therefore, RES use can contribute to a significant decrease in emissions and consequently a drastic reduction in health damages associated with pollution. Knowledge about the health benefits of replacing fossil fuels with RESs is therefore essential.
According to Haines et al. [12], the promotion of access to non-polluting and sustainable energy has a strong potential to improve public health. UN-Energy [13] indicates as a specific world target the duplication of the share of RESs in the global energy mix until 2030, together with the goals of ensuring global access to modern energy services and doubling EE. For the health problems associated with poor indoor air quality (due to combustion of traditional biomass and coal for cooking and heating), which is severe in developing countries, the replacement of these energy sources for electricity and access to clean and reliable energy are crucial. According to UN-Energy [13], about 1.2 billion people worldwide still live without access to electricity. In this regard, for example, biogas produced by anaerobic digestion of organic waste appears to be a relatively clean renewable fuel.
For electricity generation, the main pollutants are coal, lignite, and oil. Coal was estimated to be responsible for 44% of the CO2 emissions resulting from fuel combustion in 2012, while oil held a share of 35%. The impacts of natural gas were smaller (around 20%), and even smaller for nuclear power [14]. Nonetheless, this last option remains controversial due to the risk of accidents, the potential for terrorist attacks, and waste management difficulties. Furthermore, for example, lignite combustion is responsible for around 27 g/kWh of SO2 emissions, while oil and coal are responsible for 14 g/kWh and 8 g/kWh, respectively. For biomass, this value is around 3 g/kWh, and the pattern for PM2.5 emissions is similar [14]. In general, Lelieveld et al. [15] have estimated that 460,000 deaths worldwide are caused by air pollution due to electricity generation annually.
In this paper, we focus on the specific case of the deployment of RESs. These sources have grown steadily over the last few decades. However, some authors argue that they still have high costs when compared with traditional fossil fuels. The consideration of all RES benefits, including the health co-benefits, may decrease their cost disadvantage. The literature on RES health co-benefits has been slowly growing over the last few decades. Given the multidisciplinarity of the topic, there is a strong diversity in contributions. For that reason, we provide a systematic literature review (SLR) of the peer-reviewed published papers that cover health co-benefits of RES use. We aim to determine the status quo of the literature on this topic.
As referred to by Chang et al. [16], the health co-benefits literature has increased considerably since the publication of the series of papers in The Lancet, which connected climate change mitigation strategies to health outcomes. Notwithstanding, it is important to highlight that we are focusing on a niche of this literature; in particular, the one exclusively covering RES deployment. Chang et al. [16] reviewed papers covering modelization of air quality, transportation, and diet co-benefits of climate mitigation. Recently, Gallagher and Holloway [5] reviewed the literature on health quality and health co-benefits of decarbonization strategies in the United States (US) including RES deployment. Climate mitigation strategies can be of several types. Covering all options has its advantages, but an in-depth analysis does not exist. Hence, we build on the work of Gallagher and Holloway [5], extending and complementing the analysis. Our contribution to the literature includes several aspects. Firstly, by focusing exclusively on the particular case of RESs, we deepen the analysis, providing more details on the specific sources deployed and on the technical and economic aspects related to them. In particular, in contrast to what happens in [5], we include life cycle analyses, which allows for a more comprehensive acknowledgement of all impacts of RESs when compared to fossil energy sources. Secondly, we focus on studies that explicitly cover health co-benefits and not only other air quality benefits. This allows us to have a better idea of how important this specific topic has been in the literature. Thirdly, we cover worldwide literature instead of focusing on the US. This aspect is relevant because it allows for the analysis of the spatial dispersion of studies.
The remainder of this paper is organized as follows. Section 2 describes in detail the materials and methods used. Section 3 depicts the results obtained in the SLR. Section 4 contains the discussion. Finally, Section 5 concludes the paper.

2. Materials and Methods

We follow the methodology for a SLR described in [17] and [18], with the aim of presenting a methodology that can be reproducible, transparent, and objective. We want to analyze the state of the art of the literature on the health co-benefits of RESs in physical and monetary terms, applied methods, electricity sources covered, and results obtained.
For this SLR, we included only articles published in peer-reviewed journals, in English, from January 2000 to May 2021, included in the Clarivate Analytics Web of Science (WoS), SciVerse Scopus, Elsevier Science Direct, and PubMed databases.
Our focus on peer-reviewed published papers follows the recommendations in [18] and guarantees a higher quality of the studies included. The covered period starts in January 2000, since, according to our previous research, before 2000 RESs were still in an incipient phase and were therefore not very significant in the literature.
The search criteria used were the same in all databases. The search keywords used were: “Health Benefit * + Renewab * Electricity”, in the title, abstract, and keywords, which returned 355 results, some of which were duplicated (139). After deleting the duplicates form the list, the titles and the abstracts were analyzed to assess whether the criteria of relevance were satisfied, that is, the article should quantify separately the health co-benefits of using RESs. Papers whose abstract did not allow us to conclude precisely if they fell within the scope were also admitted to the next phase. A total of 51 papers were admitted to the next phase. After reading all 51 papers, we verified that only 24 papers fulfilled the inclusion criteria. Some studies calculate the health co-benefits of RESs and other mitigation strategies together (e.g., [19,20,21]); hence, we had to exclude them for not completely meeting the inclusion criteria.
Besides the papers taken from the databases using the keywords, we also included research cited by retrieved papers and manual searching. In the end, we obtained 28 articles. Table 1 summarizes the procedure followed in the SLR.
The final sample was analyzed by all authors using an Excel sheet to identify the main elements of the articles: authors, publication information, the RES used, methodology, and main results and findings.

3. Results

In this section, we describe the selected studies on the health co-benefits of RESs used for electricity generation. A total of 28 papers met the inclusion criteria established and were consequently analyzed.

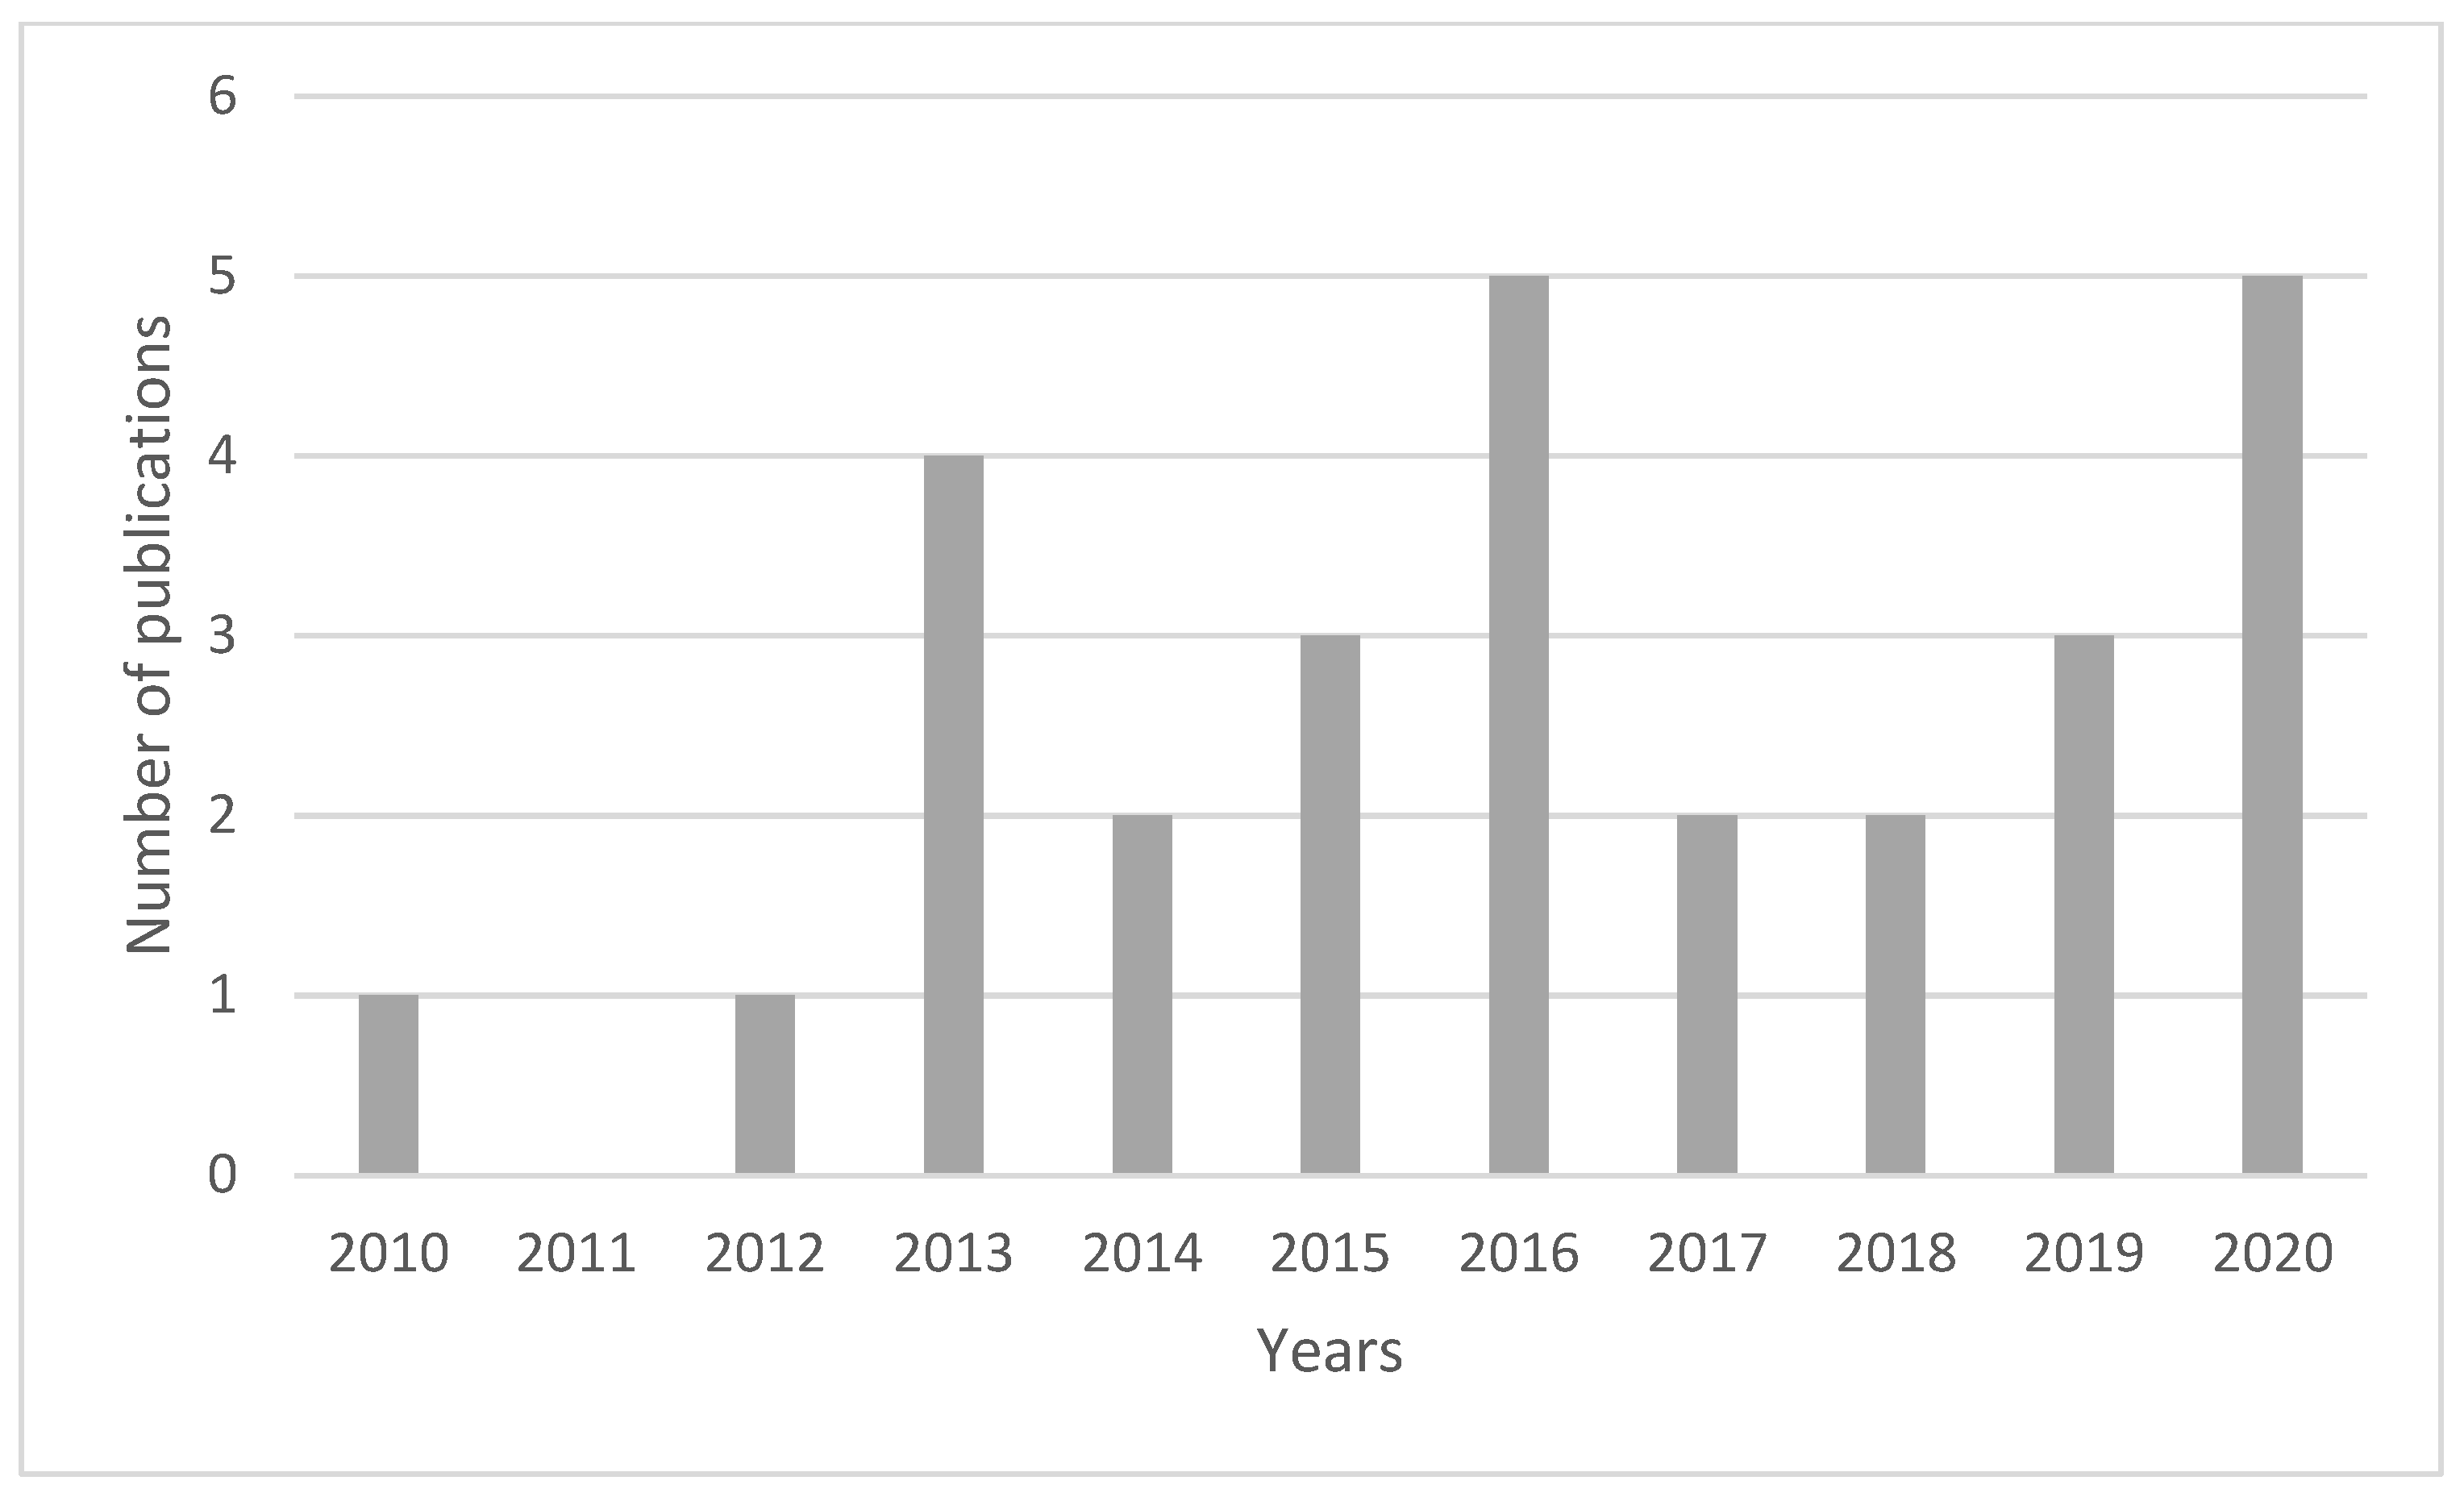
3.1. General Overview

Now, we describe some general features of the publications that met our inclusion criteria. Table 2 depicts the journals where the articles were published.
There is a slight concentration of publications in Renewable and Sustainable Energy Reviews, Energy Policy, and Environmental Research Letters. Still, the ranking of the journals where studies were published varies.
Figure 1 shows the temporal dispersion of publications. Even though our search began in the year 2000, the first publications were found in 2010; hence, Figure 1 only starts in that year.
Contrarily to what could be expected, a clear increasing pattern could not be identified. Still, most studies were published after 2012.

3.2. Spatial Dispersion of Studies

Our analysis revealed an extremely high concentration of studies for the US, either for specific areas or the whole country. This can be explained by the fact that the initial studies of this type were performed by or for the US Environmental Protection Agency [5]. Since then, little expansion from these types of studies to other countries has occurred. Table 3 summarizes the geographic locations covered by the studies.
Despite the higher vulnerability of developing countries to both direct and indirect health impacts of low air quality, very few studies focus on the health co-benefits of RES implementation in these countries. Studies on the health co-benefits of electrification (regardless of the power source) are relatively more common (e.g., [49,50]). Partridge and Gamkhar [35] and Shih and Tseng [31,40] provided the few exceptions in this literature for developing countries, covering China and Taiwan, respectively. This topic relates to the issue of the justice of access to clean energy. In fact, not all countries have equal access to sustainable energy [51]. Countries with higher economic development and institutional quality are in a privileged position [51]. Hence, this aggravated the problem referred to above. Less developed countries, particularly in Asia and sub-Saharan Africa, are more vulnerable to pollution health impacts and simultaneously have less access to clean energy sources, which creates a serious equity problem that can also be called an environmental justice problem [52]. It would therefore be crucial to promote access to clean fuels in developing countries.

3.3. General Methodologies

Our analysis showed that a variety of methodologies have been implemented in this literature. It is worth noting that some studies present the benefits of other policy options, such as EE (e.g., [38,39]), but our inclusion criteria determined that RES benefits had to be provided separately. Table 4 summarizes the methodologies applied in these studies.
Table 4 shows that seven of the studies provide a historic analysis, that is, they use historical data, for example on RES growth, and estimate the corresponding health co-benefits. The remaining studies use simulation analysis. In those cases, the most common approach is to estimate the avoided emissions of the simulation in place compared with the current situation. This mainly depends on the type of fossil fuel displaced [28]. Then, health co-benefits of those avoided emissions are quantified, frequently using premature mortality, Years of Life Lost (YLLs), and Disability-Adjusted Life Years (DALYs). Finally, when possible, a monetary value is attributed to those benefits using methods such as the calculation of willingness to pay or the value of a statistical life [5]. Benefits generally depend on site-specific attributes of the plant under analysis, electrical grid characteristics (such as efficiency, fuel type, and emissions rate), atmospheric conditions, the year under analysis, and population patterns. Hence, the relationship between the total benefits and generation of a specific facility is not linear [28]. For that reason, these simulation studies are typically performed at a micro/local scale and for a specific plant/project.
Other variations in methodologies include scenario comparison, which is relatively frequent, and LCA. This latter methodology is not as common but allows for a more comprehensive calculation of health co-benefits.
Most studies use known models for their calculations of health benefits from emissions reductions. Table 5 summarizes the main models and concepts utilized for this purpose and highlights the multiplicity of methods used, which explains the multiplicity of results obtained.
Despite the diversity of the methods used, which justifies the different results obtained in relation to health co-benefits, there are some methods that have been frequently used, such as VSL, the COBRA Model, AP2, and EASIUR.

3.4. RESs Included

Our analysis shows that most studies cover the case of wind or solar power deployment. These are relatively recent sources but are extremely promising RESs. Hydropower is already a mature source and site locations are increasingly becoming saturated with hydro plants. Biomass has also been studied; however, in this literature the only example meeting the inclusion criteria is Huang and Bagdon [43]. These authors estimated the environmental and health cost savings of using harvested small-sized trees of a national forest to generate electricity instead of being disposed of as they normally are. The authors found this procedure to have significant advantages. Most studies exclusively cover electricity generation, while only three studies combine electricity generation with electric vehicles and/or green hydrogen [33,46,48]. Table 6 summarizes the types of RES covered in the literature.
In general, studies found greater health co-benefits for wind power than for solar power (e.g., [41]). This can be explained by the life cycle approach, where higher negative health impacts are found for solar energy, mainly due to the materials used for panel construction. Furthermore, one of the most important factors for the number of benefits obtained is the type of fossil fuel consumption that is averted. The more polluting the avoided sources, the greater the benefits. Coal is the most polluting source, followed by oil and natural gas. For example, Amor et al. [21] use a life cycle approach to compare the benefits of decentralized electricity generation (using wind and solar) to centralized options. The benefits arise when fossil fuels (oil and coal) are replaced and not when other renewables (for example, hydropower) decrease. Buonocore et al. [28] were the first authors to perform the analysis for offshore wind power.

3.5. Types of Pollutants Considered

One may differentiate between the impacts of GHG emissions (indirect) and the impacts of “traditional air pollutants” (direct), since CO2 for example, which is the most important contributor to climate change, has no direct human health effect. The direct effects include, e.g., cardiovascular diseases, strokes, lung cancer, and acute lower respiratory infections [6]. PM2.5 is the pollutant with the strongest association with mortality [5]. The indirect effects, associated with climate change, include effects due to temperature changes, deaths related to extreme heat and cold, alterations in water quality, alterations in air quality, events such as floods, droughts, and wind storms, effects on food yields, changes in the spatial distribution and demographic structure of populations, changes in water quality, and the proliferation of infectious diseases transmitted by vectors such as mosquitos [12]. Regarding the types of pollutants considered, studies that include CO2 reductions obtain indirect health co-benefits while studies with other pollutants (SO2, NOx, PM, etc.) obtain direct health co-benefits.
Air pollutants are transported by air, water, and soil, and they are distributed far beyond their point of origin [7]. Hence, climate change is a diffuse process, and the causes cannot be rigorously separated out. For that reason, calculations of health co-benefits associated with climate change mitigation due to RES use are harder to perform. For example, avoided CO2 emissions in a project in the US will have benefits in that country (which are calculated in a specific study), but will also have benefits worldwide, which are not easy to calculate. Hence, these indirect benefits tend to be underestimated. The difficulties associated with indirect benefit calculation are, to certain degree, illustrated by Buonocore et al. [39]. In this study, the impacts of averted CO2 did not vary significantly among regions because, according to the authors, the social costs of carbon are independent of the location of emissions. This contrasts with the benefits of averting the emissions of other gases, which are highly dependent on location specificities, namely the type of fossil fuel averted.
Still, many studies calculate the reduction in CO2 emissions and attribute a monetary value to that reduction. Table 7 summarizes the pollutants included in each study.
As can be seen in Table 7, most studies include both types of benefits since they include CO2 and other “traditional air pollutants”. The most frequent pollutants considered in the studies are Sulfur Dioxide (SO2), Oxides of Nitrogen (NOx), and Carbon Dioxide (CO2), combined with other pollutants. In relation to the less-mentioned pollutants, we have Mercury [40]; Ozone (O3) [31,38]; Ammonia (NH3) [43,46]; and Carbon Monoxide (CO) [40]. Methane (CH4) and Nitrous Oxide (N2O) are only considered by Huang and Bagdon [43].

3.6. Physical Benefits

Regarding the types of benefits obtained in each study, we can differentiate between physical benefits (e.g., mortality, morbidity) and the monetary values attributed to them. All studies calculate the physical benefits, but not all studies obtain their monetary value.
Concerning the physical benefits, they can be depicted in absolute terms or in relative terms (for the amount of electricity/energy generated by RESs). Absolute values are hard to compare among studies, especially when the RES installed capacity is not directly provided. This happens when studies state, for example, that RESs are 20% of the electricity mix [26], but the specific amount of installed capacity or electricity generated is not stated. Even when it is possible to calculate the amount of installed capacity, using information contained in the article, this calculation is not straightforward, which makes direct comparison among studies difficult. Table 8 depicts the absolute physical benefits provided by each study while Table 9 summarizes the relative physical benefits found. Comparison of the two tables allows us to see which studies provide both types of benefits and which ones provide just one type.
The different approaches specific to each study justify the diversity of results found in Table 8. For example, the high values presented in Jacobson et al. [47] are due to the fact that the analysis took into account 74 metropolitan areas, as these areas have the highest population concentration; hence, health impacts tend to be higher. Other studies base the analysis on the comparison of different scenarios with a distinct percentage of RESs used (e.g., [32,39]). When authors calculate benefits for several projects or scenarios, we present the interval containing the lower and upper bounds.
Some studies present results for multiyear periods; hence, to standardize and facilitate comparison, we calculate annual values [29,41]. Furthermore, for Buonocore et al. [44] the value of 1544 was obtained by summing wind and solar co-benefits.
Table 9 gives benefits for the unit of energy measure.
This type of result facilitates comparisons among studies. It is worth noting that only two studies present this type of result.

3.7. Monetary Benefits

Finally, to properly analyze RES benefits, it is useful to have a monetary value associated with the resulting health co-benefits. It is worth noting that the vast majority of the studies in this literature provide these calculations. As with physical benefits, monetary results can be given in absolute values or in relative terms. The latter make comparison among studies easier. Table 10 summarizes absolute monetary benefits while Table 11 depicts relative monetary benefits.
Once again, Table 10 shows a high degree of variability in results. Even in a single study [25], the interval for the benefits has a wide range ($0.95 to $230.53 Million). Jacobson et al. [47] estimated a value of $2.6 Trillion for the health co-benefits per year, the highest value in Table 9 since their study involved 74 metropolitan areas. As before, for Buonocore et al. [39] the values reflect the joint health co-benefits of solar and wind energy. When authors calculate benefits for several projects, we present the lower and upper bounds considering all projects. For example, Buonocore et al. [39] find benefits for solar energy in the interval ($37; $100) and for wind energy in the interval ($110; $210). In Table 10, we present the interval ($37; $210).
Table 11 summarizes the results in terms of relative monetary health co-benefits.
The results in Table 11 are diverse due to the different approaches used in each study. For the studies of Siler-Evans et al. [36], Buonocore et al. [39], and Millstein et al. [41], the values presented in Table 11 consider two types of renewable energy: solar and wind. Results depend on the sources replaced and on the population density of locations, among other aspects [41]. Regions with high coal dependence presented greater benefits from its replacement than regions dependent, e.g., on natural gas [39]. A significant variation over time and geography exists [41].

4. Discussion

Our results show that the literature on health co-benefits of RES use remains scarce. Only 28 studies met our inclusion criteria. Regarding the year of publication, we observed that, contrarily to what could be expected, there was not a consistent growth of publications over the last several years. Most publications were from 2013 to 2020 but were relatively distributed over time.
Another important conclusion is that most studies were performed for developed countries, in particular for the US. It would be very important to have studies of this type for developing countries since the highest co-benefits of air quality and climate policies are expected to be found in these countries [53]. This happens because pollutants are transported by air, water, and soil, and are therefore distributed far beyond their point of origin [7]. For that reason, there is a very important international connection related to health issues generated by pollution and effects are not only local but, in fact, there is an important global component to them (including climate change). Most worldwide emissions come from developed countries; however, the resulting health impacts are greater on developing countries where populations have lower adaptation capacities and are more fragile when faced with health threats due to, e.g., malnutrition [12,54].
Most studies in the literature perform simulations on RES growth, with only seven using historical data. Simulation studies are presented for specific projects with specific conditions. Results on the health impacts of electricity generation are therefore uncertain and vary widely, which is reflected in the large range of effects that are found [55].
Wind and solar power are the most studied RESs, which can be explained by their high growth potential worldwide, opportunities for decentralized generation, and increasing economic competitiveness. Only one study [43] covered biomass and two combined RESs with green hydrogen [33,46].
In terms of the pollutants, SO2 and NOx were the most commonly studied given their importance to the human health impacts. A significant number of studies (12) included CO2 emissions in their analysis and therefore included both indirect and direct effects on human health since CO2 emissions are linked to climate change. Notwithstanding, most studies focused on “traditional air pollutants” and their direct impacts on air quality.
Health co-benefits are strongly dependent on the project’s location, the fossil fuels displaced, and the population concentration, among other aspects [36,39,41,47]. Furthermore, results are provided both in physical and monetary terms and using absolute and relative (per unit of energy generated) measures. When results are exclusively in absolute terms, comparison among studies is difficult. However, even when relative monetary values are used, the unit of measure is often different, a problem that has already been mentioned by Siler-Evans et al. [36]. For example, some studies give total benefits, without information on installed capacity, while others provide results in MWh. Despite the variability in results, the existing studies show significant health co-benefits from RES use, which is important to consider when performing cost–benefit analysis for these projects. Policy-makers also need to take these benefits into consideration when planning specific policy interventions or tools, such as subsidies and standards, among others. Still, Patridge and Gamkhar [35] concluded that the benefits of RES implementation did not compensate for their costs.
Our study shows that future research should cover other countries, namely developing countries, and other RES sources (if possible). A uniformization of results (in relative monetary terms) is also desirable. This could enable an easier comparison among studies and a proper acknowledgement of all benefits arising from RES deployment.

5. Conclusions

The energy sector, and particularly electricity generation, have been responsible for the largest pollution shares worldwide. This pollution arises from the use of fossil fuels, degrades air quality, and is responsible for serious human health problems. Renewable energy sources (RESs) are crucial to the mitigation of environmental problems, particularly health problems associated with air pollution derived from the energy sector. These sources can have a significant impact in reducing pollution and therefore alleviate human health problems associated with poor air quality. When assessing the economic viability of RESs, their health co-benefits should be considered in policy, legal, and financial decision-making. This should be done for all energy projects [7]. Specifically, the health co-benefits are important to a full cost–benefit analysis [39].
In this paper, we provide a systematic literature survey (SLR) of studies on the health co-benefits of RES use. This literature is still relatively new and needs to be extended since only a few papers focus strictly on health co-benefits and quantify them separately. Overall, the health co-benefits of RES use found in the literature are significant and non-negligeable, which highlights the importance of including them in a comprehensive cost–benefit analysis.
One of the limitations of our work is that we specifically aimed to focus on studies that depicted RES health co-benefits; that is, the positive impact of RES use. However, there is a fine line between the literature on RES benefits and of negative effects of fossil fuels since RESs usually replace them. This separation was shown to be complex at times.

Author Contributions

S.S., E.L. and I.S. contributed equally to all phases of the research. All authors have read and agreed to the published version of the manuscript.

Funding

This research was financed by Portuguese public funds through FCT-Fundação para a Ciência e a Tecnologia, I.P., in the framework of the project with reference numbers UIDB/04105/2020, UIDB/04005/2020, and UIDP/04005/2020.

Conflicts of Interest

The authors declare no conflict of interest.

References

  1. Wilkinson, P.; Smith, K.R.; Joffe, M.; Haines, A. A global perspective on energy: Health effects and injustices. Lancet 2007, 370, 965–978. [Google Scholar] [CrossRef]
  2. Stern, N. The Stern Review: The Economics of Climate Change; Cambridge University Press: Cambridge, UK, 2006. [Google Scholar]
  3. Buonocore, J. Health and Climate Benefits of Renewable Energy and Energy Efficiency: Evidence from the United States. In Special Lecture in the Celebration of the 50th Anniversary of the Southeast Asian Ministers of Education Organization Tropical Medicine and Public Health Network (SEAMEO-Tropmed); University of the Philippines: Manila, Philippines, 2006; Available online: https://saludsindanio.org/sites/default/files/documents-files/3817/Concept%20Note%20and%20Program%20Dr%20Buonocore%20UP%20Manila%20Mar%2010.pdf (accessed on 2 September 2021).
  4. Schwerhoff, G.; Kornek, U.; Lessmann, K.; Pahle, M. Leadership in climate change mitigation: Consequences and incentives. J. Econ. Surv. 2017, 32, 491–517. [Google Scholar] [CrossRef]
  5. Gallagher, C.L.; Holloway, T. Integrating Air Quality and Public Health Benefits in U.S. Decarbonization Strategies. Front. Public Health 2020, 8. [Google Scholar] [CrossRef] [PubMed]
  6. Smith, K.; Frumkin, H.; Balakrishnan, K.; Butler, C.; Chafe, Z.; Fairlie, I.; Kinney, P.; Kjellstrom, T.; Mauzerall, D.L.; McKone, T.E.; et al. Energy and human health. Annu. Rev. Public Health 2013, 34, 159–188. [Google Scholar] [CrossRef] [Green Version]
  7. Wang, J.; Orris, P.; Healthy Energy Initiative. The Health Impacts of Energy Choices: A Briefing Paper for the Health Community; Health Care Without Harm: Brussels, Belgium, 2015; Available online: http://www.healthyenergyinitiative.org/wp-content/uploads/2015/10/Health-Impacts-of-Energy-Choices_DigitalVersion.pdf (accessed on 2 September 2021).
  8. Lim, S.S.; Vos, T.; Flaxman, A.D.; Danaei, G.; Shibuya, K.; Adair-Rohani, H.; AlMazroa, M.A.; Amann, M.; Anderson, H.R.; Andrews, K.G.; et al. A comparative risk assessment of burden of disease and injury attributable to 67 risk factors and risk factor clusters in 21 regions, 1990–2010: A systematic analysis for the Global Burden of Disease Study 2010. Lancet 2012, 380, 2224–2260. [Google Scholar] [CrossRef] [Green Version]
  9. Kim, C.; Henneman, L.R.F.; Choirat, C.; Zigler, C.M. Health effects of power plant emissions through ambient air quality. J. R. Stat. Soc. Ser. A Stat. Soc. 2020, 183, 1677–1703. [Google Scholar] [CrossRef]
  10. Hirschberg, S.; Bauer, C.; Burgherr, P.; Cazzoli, E.; Heck, T.; Spada, M.; Treyer, K. Health effects of technologies of power generation: Contributions from normal operation, severe accidents and terrorist threat. Reliab. Eng. Syst. Saf. 2016, 145, 373–387. [Google Scholar] [CrossRef]
  11. Bridges, A.; Felder, F.A.; McKelvey, K.; Niyogi, I. Uncertainty in energy planning: Estimating the health impacts of air pollution from fossil fuel electricity generation. Energy Res. Soc. Sci. 2015, 6, 74–77. [Google Scholar] [CrossRef]
  12. Haines, A.; Smith, K.R.; Anderson, D.; Epstein, P.R.; McMichael, A.J.; Roberts, I.; Wilkinson, P.; Woodcock, J.; Woods, J. Policies for accelerating access to clean energy, improving health, advancing development, and mitigating climate change. Lancet 2007, 370, 1264–1281. [Google Scholar] [CrossRef]
  13. United Nations—Energy. Background Note, Energy: A Brief Discussion on Goals, Targets and Indicators; United Nations: New York, NY, USA, 2014; Available online: https://sdgs.un.org/sites/default/files/publications/1262Background%20Note%20on%20Energy%20Goals%2C%20Targets%20and%20Indicators%20%28Update%2028%20May%202014%29.pdf (accessed on 2 September 2021).
  14. Pablo-Romero, M.; Román, R.; Sánchez-Braza, A.; Yñiguez, R. Renewable Energy, Emissions, and Health. In Renewable Energy—Utilisation and System Integration, 1st ed.; Cao, W., Hu, Y., Eds.; IntechOpen: Rijeka, Croatia, 2016; pp. 173–198. [Google Scholar]
  15. Lelieveld, J.; Evans, J.; Fnais, M.; Giannadaki, D.; Pozzer, A. The contribution of outdoor air pollution sources to premature mortality on a global scale. Nature 2015, 525, 367–371. [Google Scholar] [CrossRef]
  16. Chang, K.M.; Hess, J.J.; Balbus, J.M.; Buonocore, J.J.; Cleveland, D.A.; Grabow, M.; Neff, R.; Saari, R.K.; Tessum, C.W.; Wilkinson, P.; et al. Ancillary health effects of climate mitigation scenarios as drivers of policy uptake: A review of air quality, transportation and diet co-benefits modeling studies. Environ. Res. Lett. 2017, 12, 113001. [Google Scholar] [CrossRef]
  17. Tranfield, D.; Denyer, D.; Smart, P. Towards a Methodology for Developing Evidence-Informed Management Knowledge by Means of Systematic Review. Br. J. Manag. 2003, 14, 207–222. [Google Scholar] [CrossRef]
  18. Kraus, S.; Breier, M.; Dasí-Rodríguez, S. The art of crafting a systematic literature review in entrepreneurship research. Int. Entrep. Manag. J. 2020, 16, 1023–1042. [Google Scholar] [CrossRef] [Green Version]
  19. Ou, Y.; Shi, W.; Smith, S.; Ledna, C.M.; West, J.J.; Nolte, C.G.; Loughlin, D.H. Estimating environmental co-benefits of U.S. low-carbon pathways using an integrated assessment model with state-level resolution. Appl. Energy 2018, 216, 482–493. [Google Scholar] [CrossRef]
  20. Luderer, G.; Pehl, M.; Arvesen, A.; Gibon, T.; Bodirsky, B.L.; Sytze de Boer, H.; Fricko, O.; Hejazi, M.; Humpenoder, F.; Iyer, G.; et al. Environmental co-benefits and adverse side-effects of alternative power sector de-carbonization strategies. Nat. Commun. 2019, 10, 5229. [Google Scholar] [CrossRef] [PubMed] [Green Version]
  21. Ben Amor, M.; Lesage, P.; Pineau, P.-O.; Samson, R. Can distributed generation offer substantial benefits in a Northeastern American context? A case study of small-scale renewable technologies using a life cycle methodology. Renew. Sustain. Energy Rev. 2010, 14, 2885–2895. [Google Scholar] [CrossRef]
  22. Barbose, G.; Bird, L.; Heeter, J.; Flores-Espino, F.; Wiser, R. Costs and benefits of renewables portfolio standards in the United States. Renew. Sustain. Energy Rev. 2015, 52, 523–533. [Google Scholar] [CrossRef] [Green Version]
  23. Descateaux, P.; Astudillo, M.F.; Ben Amor, M. Assessing the life cycle environmental benefits of renewable distributed generation in a context of carbon taxes: The case of the Northeastern American market. Renew. Sustain. Energy Rev. 2016, 53, 1178–1189. [Google Scholar] [CrossRef]
  24. Brown, P.R.; O’Sullivan, F.M. Spatial and temporal variation in the value of solar power across United States electricity markets. Renew. Sustain. Energy Rev. 2020, 121, 109594. [Google Scholar] [CrossRef]
  25. McCubbin, D.; Sovacool, B.K. Quantifying the health and environmental benefits of wind power to natural gas. Energy Policy 2013, 53, 429–441. [Google Scholar] [CrossRef]
  26. Burgos-Payán, M.; Roldán-Fernández, J.M.; Trigo-García, L.; Bermúdez-Ríos, J.M.; Riquelme-Santos, J.M. Costs and benefits of the renewable production of electricity in Spain. Energy Policy 2013, 56, 259–270. [Google Scholar] [CrossRef]
  27. Barbose, G.; Wiser, R.; Heeter, J.; Mai, T.; Bird, L.; Bolinger, M.; Carpenter, A.; Heath, G.; Keyser, D.; Macknick, J.; et al. A retrospective analysis of benefits and impacts of U.S. renewable portfolio standards. Energy Policy 2016, 96, 645–660. [Google Scholar] [CrossRef] [Green Version]
  28. Buonocore, J.J.; Luckow, P.; Fisher, J.; Kempton, W.; Levy, J.I. Health and climate benefits of offshore wind facilities in the Mid-Atlantic United States. Environ. Res. Lett. 2016, 11, 074019. [Google Scholar] [CrossRef] [Green Version]
  29. Wiser, R.; Bolinger, M.; Heath, G.; Keyser, D.; Lantz, E.; Macknick, J.; Mai, T.; Millstein, D. Long-term implications of sustained wind power growth in the United States: Potential benefits and secondary impacts. Appl. Energy 2016, 179, 146–158. [Google Scholar] [CrossRef] [Green Version]
  30. Dimanchev, E.G.; Paltsev, S.; Yuan, M.; Rothenberg, D.; Tessum, C.W.; Marshall, J.D.; Selin, N.E. Health co-benefits of sub-national renewable energy policy in the US. Environ. Res. Lett. 2019, 14, 085012. [Google Scholar] [CrossRef] [Green Version]
  31. Shih, Y.-H.; Tseng, C.-H. Cost-benefit analysis of sustainable energy development using life-cycle co-benefits assessment and the system dynamics approach. Appl. Energy 2014, 119, 57–66. [Google Scholar] [CrossRef]
  32. Wiser, R.; Mai, T.; Millstein, D.; Barbose, G.; Bird, L.; Heeter, J.; Keyser, D.; Krishnan, V.; Macknick, J. Assessing the costs and benefits of US renewable portfolio standards. Environ. Res. Lett. 2017, 12, 094023. [Google Scholar] [CrossRef]
  33. AlRafea, K.; Elkamel, A.; Abdul-Wahab, S.A. Cost-analysis of health impacts associated with emissions from combined cycle power plant. J. Clean. Prod. 2016, 139, 1408–1424. [Google Scholar] [CrossRef]
  34. Chen, H.; Wang, Z.; Xu, S.; Zhao, Y.; Cheng, Q.; Zhang, B. Energy demand, emission reduction and health co-benefits evaluated in transitional China in a 2 °C warming world. J. Clean. Prod. 2020, 264, 121773. [Google Scholar] [CrossRef]
  35. Partridge, I.; Gamkhar, S. A methodology for estimating health benefits of electricity generation using renewable technologies. Environ. Int. 2012, 39, 103–110. [Google Scholar] [CrossRef] [PubMed]
  36. Siler-Evans, K.; Azevedo, I.L.; Morgan, M.G.; Apt, J. Regional variations in the health, environmental, and climate benefits of wind and solar generation. Proc. Natl. Acad. Sci. USA 2013, 110, 11768–11773. [Google Scholar] [CrossRef] [PubMed] [Green Version]
  37. Greene, J.S.; Morrissey, M.L. Estimated Pollution Reduction from Wind Farms in Oklahoma and Associated Economic and Human Health Benefits. J. Renew. Energy 2012, 2013, 924920. [Google Scholar] [CrossRef]
  38. Jacobson, M.Z.; Delucchi, M.A.; Ingraffea, A.R.; Howarth, R.W.; Bazouin, G.; Bridgeland, B.; Burkart, K.; Chang, M.; Chowdhury, N.; Cook, R.; et al. A roadmap for repowering California for all purposes with wind, water, and sunlight. Energy 2014, 73, 875–889. [Google Scholar] [CrossRef]
  39. Buonocore, J.; Luckow, P.; Norris, G.; Spengler, J.; Biewald, B.; Fisher, J.; Levy, J. Health and climate benefits of different energy-efficency and renewable energy choices. Nat. Clim. Chang. 2015, 6, 100–105. [Google Scholar] [CrossRef]
  40. Shih, Y.-H.; Tseng, C.-H. Co-benefits of mercury reduction in Taiwan: A case study of clean energy development. Sustain. Sci. 2015, 10, 61–73. [Google Scholar] [CrossRef]
  41. Millstein, D.; Wiser, R.; Bolinger, M.; Barbose, G. The climate and air-quality benefits of wind and solar power in the United States. Nat. Energy 2017, 2, 17134. [Google Scholar] [CrossRef]
  42. Abel, D.; Holloway, T.; Harkey, M.; Rrushaj, A.; Brinkman, G.; Duran, P.; Janssen, M.; Denholm, P. Potential air quality benefits from increased solar photovoltaic electricity generation in the Eastern United States. Atmos. Environ. 2018, 175, 65–74. [Google Scholar] [CrossRef]
  43. Huang, C.-H.; Bagdon, B.A. Quantifying environmental and health benefits of using woody biomass for electricity generation in the Southwestern United States. J. For. Econ. 2018, 32, 123–134. [Google Scholar] [CrossRef]
  44. Buonocore, J.; Choma, E.; Villavicencio, A.; Spengler, J.; Koehler, D.; Evans, J.; Lelieveld, J.; Klop, P.; Sanchez-Pina, R. Metrics for the sustainable development goals: Renewable energy and transportation. Palgrave Commun. 2019, 5, 136. [Google Scholar] [CrossRef]
  45. Rodgers, M.; Coit, D.; Felder, F.; Carlton, A. Assessing the effects of power grid expansion on human health externalities. Socio-Econ. Plan. Sci. 2019, 66, 92–104. [Google Scholar] [CrossRef]
  46. Fragiacomo, P.; Genovese, M. Technical-economic analysis of a hydrogen production facility for power-to-gas and hydrogen mobility under different renewable sources in Southern Italy. Energy Convers. Manag. 2020, 223, 113332. [Google Scholar] [CrossRef]
  47. Jacobson, M.Z.; Von Krauland, A.-K.; Burton, Z.F.; Coughlin, S.J.; Jaeggli, C.; Nelli, D.; Nelson, A.J.H.; Shu, Y.; Smith, M.; Tan, C.; et al. Transitioning All Energy in 74 Metropolitan Areas, Including 30 Megacities, to 100% Clean and Renewable Wind, Water, and Sunlight (WWS). Energies 2020, 13, 4934. [Google Scholar] [CrossRef]
  48. Gai, Y.; Minet, L.; Posen, I.D.; Smargiassi, A.; Tétreault, L.-F.; Hatzopoulou, M. Health and climate benefits of Electric Vehicle Deployment in the Greater Toronto and Hamilton Area. Environ. Pollut. 2020, 265, 114983. [Google Scholar] [CrossRef]
  49. Diallo, A.; Moussa, R.K. The effects of solar home system on welfare in off-grid areas: Evidence from Côte d’Ivoire. Energy 2020, 194, 116835. [Google Scholar] [CrossRef]
  50. Peng, W.; Yang, J.; Lu, X.; Mauzerall, D.L. Potential co-benefits of electrification for air quality, health, and CO2 mitigation in 2030 China. Appl. Energy 2018, 218, 511–519. [Google Scholar] [CrossRef]
  51. Cary, M. Increasing Access to Clean Fuels and Clean Technologies: A Club Convergence Approach. Clean Technol. 2019, 1, 247–264. [Google Scholar] [CrossRef] [Green Version]
  52. Banzhaf, S.; Ma, L.; Timmins, C. Environmental Justice: The Economics of Race, Place, and Pollution. J. Econ. Perspect. 2019, 33, 185–208. [Google Scholar] [CrossRef] [Green Version]
  53. Nemet, G.; Holloway, T.; Meier, P. Implications of incorporating air-quality co-benefits into climate change policymaking. Environ. Res. Lett. 2010, 5, 014007. [Google Scholar] [CrossRef]
  54. Haines, A.; McMichael, A.J.; Smith, K.R.; Roberts, I.; Woodcock, J.; Markandya, A.; Armstrong, B.G.; Campbell-Lendrum, D.; Dangour, A.; Davies, M.; et al. Public health benefits of strategies to reduce greenhouse-gas emissions: Overview and implications for policy makers. Lancet 2009, 374, 2104–2114. [Google Scholar] [CrossRef]
  55. Markandya, A.; Wilkinson, P. Electricity generation and health. Lancet 2007, 370, 979–990. [Google Scholar] [CrossRef]
Figure 1. Studies according to the publication year.
Energies 14 06678 g001
Table 1. Procedure followed throughout the review (source: own elaboration).
StepDescriptionWoSScopusScience DirectPubMedTotal
Step 1Papers with selected keywords1321338010355
Step 2Deleting duplicate papers----216
Step 3Eliminating the non-relevant papers after reading the titles and abstracts----51
Step 4Eliminating the non-relevant papers after reading the full texts----24
Step 5Manual searching/Cross references----4
Final Sample 28
Table 2. Journal of publication (source: own elaboration).
JournalCountReference(s)
Renewable and Sustainable Energy Reviews4[21]
[22]
[23]
[24]
Energy Policy3[25]
[26]
[27]
Environment Research Letters3[28]
[29]
[30]
Applied Energy2[31]
[32]
Journal of Cleaner Production2[33]
[34]
Environment International1[35]
Proceedings of the National Academy of Sciences1[36]
Journal of Renewable Energy1[37]
Energy1[38]
Nature Climate Change1[39]
Sustainable Science1[40]
Nature Energy1[41]
Atmospheric Environment1[42]
Journal of Forest Economics1[43]
Nature1[44]
Socio-Economic Planning Sciences1[45]
Energy Conversion and Management1[46]
Energies MDPI1[47]
Environmental Pollution1[48]
Table 3. Countries covered in existing studies (source: own elaboration).
CountryCountReference(s)
US17[36]
[37] (Oaklahoma)
[25] (California and Idaho)
[38] (California)
[39] (Mid Atlantic and Great Lakes)
[22,27]
[29]
[28] (New Jersey and Maryland)
[32] (Columbia)
[41]
[42] (Eastern US)
[43] (Arizona)
[30]
[44]
[47]
[24]
Canada4[21]
[33]
[23]
[48]
China2[35]
[34]
Taiwan2[31,40]
Spain1[26]
Italia1[46]
74 metropolitan areas1[47]
Table 4. Studies included in the SLR and their methodology (source: own elaboration).
ReferenceSpecificitiesDescription
Historic analysis
[37] Estimation of the health co-benefits from wind power growth in Oklahoma from 2003 to 2011
[26] Overview of the growth in Spain of RESs, from 2005 to 2010, and estimations of the corresponding health co-benefits
[22] Estimation of the health co-benefits of implementing renewable portfolio standards in the US from 2010 to 2013
[42] Estimation of the health co-benefits of wind and solar power growth in the US from 2007 to 2015
[44] Estimation of the health co-benefits if investing in RESs for a set of renewable electricity companies
[24] Estimation of the health co-benefits due to the operation of Independent System Photovoltaic Operators at over 10,000 locations in the US from 2010 to 2017
[27]LCA/Scenario comparisonEstimation of the health co-benefits of implementing renewable portfolio standards in the US in 2013
Simulation analysis
[35] Simulation of replacement of coal-fired generation with 117 wind projects and 298 small hydro projects
[36] Simulation of replacement of fossil fuels for wind and solar projects in several US locations from 2009 to 2011
[25] Simulation of replacement of natural gas with wind power in two locations: a 580 MW wind farm in California and a 22 MW wind farm in Idaho
[38] Simulation of conversion of California’s all-purpose energy infrastructure to one relying exclusively on RESs
[39] Simulation of the health co-benefits of four different EE/RES installation types (two of RESs) in six different locations in the US
[40] Simulation of the replacement of coal-fired plants with RESs and estimation of the associated health co-benefits
[28] Simulation of implementation of two offshore wind power facilities in two different locations and in two years (2012 and 2017)
[33] Simulation of use of hydrogen (collected from RESs) in a natural-gas-fueled combined cycle power plant
[42] Simulation of a 17% share of solar photovoltaic generation in the electricity generation mix in the Eastern US
[46] Simulation of hydrogen (produced using RESs) use in hydrogen mobility and hydrogen injection in the natural gas grid/pipeline in three different locations in Italy
[47] Simulation of the transition to 100% RESs in all energy sectors in 74 Metropolitan Areas until 2050
[29]Scenario comparisonSimulation of wind power growth in the US from 2013 to 2050, comparing different scenarios (different shares)
[32]Simulation of different scenarios for the evolution of Renewable Portfolio Standards in the US, from 2015 to 2050
[30]Simulation of evolution of sub-national RPS or carbon pricing in the US until 2030
[45]Simulation of an expansion of electricity generation and estimation of the health co-benefits of using RESs (promoted by RPS) instead of fossil fuels
[34]Simulation of the evolution of energy demand and carbon emissions in China, from 2020 to 2050, in response to different climate policies
[48]Simulation of different penetration shares of Electric Vehicles (EVs) powered exclusively with RESs in a large metropolitan area
[23]LCA/Scenario comparisonSimulation of an increasing share of distributed generation (RESs) and estimation of resulting health co-benefits under different carbon tax levels from 2006 to 2008
[21]Simulation of replacement of centralized generation for distributed generation of two types of grid-connected photovoltaic panels and three types of micro-wind turbines
[31]LCASimulation of RES growth from 2010 to 2030 in Taiwan
[43]Simulation of use of small-sized trees to generate electricity instead of disposing them
Table 5. Approaches used to estimate health co-benefits.
ReferenceConnection between Pollution and Health Benefits
[21]IMPACT 2002+
[35]Intake fractions, dose–response function; Value of a Statistical Life (VSL)
[36]APEEP 1 Analysis Model
[37]Historical data, external reference that uses the ExternE 2 Project, VSL
[25]COBRA 3, BenMAP 4
[26]Regression model based on historical data
[31]ARCoB 5 Model, VSL
[38]Top-down approach based on computer simulations and a bottom-up approach analyzing air quality in California
[39]EPSTEIN 6 Model
[40]Exposure–Response Model, VSL
[22]Several studies to obtain estimated emissions and corresponding monetary benefits for different US states
[27]AVERT 7, AP2 8 Model, COBRA 3, VSL
[29]ReEDS 9 Model, AP2 8
[28]EPSTEIN 6 Model
[33]AQBAT 10
[23]IMPACT 2002+
[32]ReEDS 9, AP2 8, EPA-RIA 11, EASIUR Model 12
[41]AVERT7, EASIUR 12 Model, AP2 8, EPA-RIA 11, COBRA 3, VSL
[42]CMAQ 13 Model, BenMAP 4, AVERT7
[43]APEEP 14
[30]USREP 15 Model, InMAP 16, VSL
[44]EDGAR 17 and Regression Model
[45]CMAQ 13, BenMAP 4, COBRA 3
[24]AP2 8; EASIUR 12 Model; VSL
[34]LEAP 18 Model
[46]COBRA 3, CaRBonH 19
[47]Regression model
[48]EASIUR 12, Concentration response function, VSL
Source: own elaboration. 1 Air Pollution Emission Experiments and Policy; 2 External Costs of Energy; 3 Co-Benefits Risk Assessment Tool; 4 Environmental Benefits Mapping and Analysis Program; 5 Air Resource Co-benefits; 6 Environmental Policy Simulation Tool for Electrical grid INterventions; 7 AVoided Emissions and geneRation Tool; 8 Air Pollution Emission Experiments and Policy analysis; 9 National Renewable Energy Laboratory; 10 Air Quality Benefits Assessment Tool; 11 Environmental Protection Agency regulatory impact analysis; 12 Estimating Air pollution Social Impacts Using Regression; 13 Community Multiscale Air Quality; 14 Air Pollution Emission Experiments and Policy; 15 United States Regional Energy Policy; 16 Intervention Model for Air Pollution; 17 Emissions Database for Global Atmospheric Research; 18 Long range Energy Alternatives Planning System; 19 Carbon Reduction Benefits on Health.
Table 6. Types of RES covered in the literature (source: own elaboration).
Renewable EnergiesReference(s)
Solar[42]
[24]
Wind[21]
[37]
[25]
[29]
[28]
Wind, Hydropower[35]
Wind, Solar[36]
[39]
[23]
[41]
[44]
Solar, Wind, Waste[40]
Solar, Wind, Hydropower[38]
[26]
Solar, Wind, Hydrogen[33]
Solar, Wind, Hydrogen, Geothermal[46]
Solar, Wind, Hydropower, Geothermal[47]
Wind, Geothermal, Biomass, Waste, Hydropower[31]
[32]
Renewable Portfolio Standard (RES)[22]
[27]
[30]
[45]
[34]
Woody Biomass[43]
EV + RES[48]
Table 7. Types of pollutants included in the literature (source: own elaboration).
PollutantsReference(s)
PM10[35]
PM2.5[42]
[30]
[25]
SO2, NOx[26]
[45]
SO2, NOx, PM2.5[36]
[27]
[29]
[32]
[24]
SO2, NOx, CO2[37]
[39]
[22]
[28]
[23]
SO2, CO2, PM2.5,[21]
SO2, NOx, CO2, PM2.5[41]
[44]
SO2, NOx, PM2.5, PM10[34]
SO2, NOx, CO2, PM10, O3[31]
SO2, NOx, CO, PM10, Mercury[40]
SO2, NOx, PM2.5, PM10, VOCs[48]
SO2, NOx, CO2, PM2.5, PM10, NH3, VOCs[46]
SO2, NOx, CO2, PM2.5, CH4; N2O; NH3; VOCs[43]
NO2, PM2.5[33]
PM2.5, O3[38]
CO2 and non-specified air pollutants[47]
Table 8. Absolute physical benefits (source: own elaboration).
Type of Physical BenefitReference(s)Values
Premature Mortality Avoided per year[35](0.6; 2.3)
[26]897.53 thousand days of human life lost prevented
[31]3469.8
[38]12,500
[39](9; 22)
[27](320; 1100)
[29](586.49; 1316.22)
[28](7; 55)
[32](342.86; 4742.86)
[41](375; 1587.5)
[42]1424
[30](467; 1999)
[44]1544
[34]345
[47]408,000
[48]330
Emergency department visits for asthma avoided per year[27](160; 290)
[29]27,591.89
[34]8409
Hospitalizations avoided per year[35](1.6; 5.8)
[27](195; 310)
[29]402.7
[34]1546
Emergency department visits for Bronchitis avoided per year[35](0.1; 0.4)
[29]724.32
[34]30,954
Emergency department visits for Respiratory Symptoms avoided per year[29]183,297.29
Non-fatal heart attacks avoided per year[27](40; 560)
[29]683.78
Lost Work Days per year[27](38,000; 64,000)
[29]59,235.14
Minor restricted-activity days per year[29]352,610.81
School loss days per year[29]66,475.68
Table 9. Relative physical benefits (source: own elaboration).
Type of Physical BenefitReference(s)Values
Premature Mortality per year[44](26; 166.4) GWh
Disability Average Life Years (DALYs) per year[21](1.53 × 10−8; 5.01 x 10−8) DALY/KWh
Table 10. Absolute monetary benefits (source: own elaboration).
Absolute Monetary BenefitsReference(s)Values
Health co-benefits per year[37]$5.25 Million
[25]($0.95; $230.53) Million
[26]€135.56 Million
[38]$103 Billion
[31]€6142.45 Million
[39]($37; $210) Million
[40]$1.1 Billion
[27]($2.6; $9.9) Billion
[29]($1.41; $7.35) Billion
[32]($1.37; $26.2) Billion
[41]($0.16; $13.49) Billion
[42]$13.1 Billion
[30]($4.7; $21) Billion
[45]$616 Billion
[34]($26,78; $222.84) Billion
[46](€235,000; €550,000)
[47]$2.6 Trillion
[48]$3.8 Billion
Note: Billion indicates ten raised to the 9th and trillion indicates ten raised to the 12th.
Table 11. Relative monetary benefits (source: own elaboration).
Relative Monetary BenefitsReference(s)Values
Co-benefits per year[35](1.4; 5.2) $/MWh
[36](10; 100) $/MWh
[39](63; 170) $/MWh
[40]113 $/MWh
[22](4; 23) $/MWh
[27](20; 101) $/MWh
[29](0.1; 0.6) $/MWh
[28](25; 83) $/MWh
[33]1.14 $/MWh
[23](0.00018; 0.00065) $/MWh
[41](40; 73) $/MWh
[43]934.941 $/MWh
[30](80; 130) $/MWh
[46](1.32; 3.08) €/Kg of Hydrogen
[23](15; 200) $/KWac
Publisher’s Note: MDPI stays neutral with regard to jurisdictional claims in published maps and institutional affiliations.

