Article

Selective Identification and Localization of Voltage Fluctuation Sources in Power Grids

Institute of Electrical Engineering and Electronics, Faculty of Control, Robotics and Electrical Engineering, Poznan University of Technology, Piotrowo Street, No. 3a, 60-965 Poznan, Poland
Energies 2021, 14(20), 6585; https://doi.org/10.3390/en14206585
Submission received: 7 September 2021 / Revised: 28 September 2021 / Accepted: 9 October 2021 / Published: 13 October 2021

Abstract

:
The current study presents a novel approach to the selective identification and localization of voltage fluctuation sources in power grids, considering individual disturbing loads changing their state with a frequency of up to 150 Hz . The implementation of the proposed approach in the existing infrastructure of smart metering allows for the identification and localization of the individual sources of disturbances in real time. The proposed approach first performs the estimation of the modulation signal using a carrier signal estimator, which allows for a modulation signal with a frequency greater than the power frequency to be estimated. In the next step, the estimated modulating signal is decomposed into component signals associated with individual sources of voltage fluctuations using an enhanced empirical wavelet transform. In the last step, a statistical evaluation of the propagation of component signals with a comparable fundamental frequency is performed, which allows for the supply point of a particular disturbing load to be determined. The proposed approach is verified in numerical simulation studies using MATLAB/SIMULINK and in experimental studies carried out in a real low-voltage power grid. The research carried out shows that the proposed approach allows for the selective identification and localization of voltage fluctuation sources changing their state with a frequency of up to 150 Hz , unlike other methods currently used in practice.

1. Introduction

One of the typical disturbances in power grids is voltage fluctuation [1]. According to the International Electrotechnical Commission (IEC) definition, voltage fluctuations are defined as fast changes of the instantaneous root mean square (RMS) value of voltage [2]. The occurrence of this phenomenon may lead to incorrect operation of other loads supplied from the same network that supplies the noxiousload [3,4,5,6]. If these loads are light sources, the voltage fluctuation can cause an obnoxious flicker [7,8], which may induce depressive or epileptic states. Incandescent and discharge light sources are the most sensitive to voltage fluctuations. However, research results from recent years show that LED lamps with built-in switching power supplies or supplied directly from the power grid are also sensitive to voltage fluctuations [9], which is also shown on the basis of a signal from a photodiode with a spectral sensitivity similar to that of the human eye [10,11]. Therefore, it is important to detect the voltage fluctuation [12,13,14], to locate voltage fluctuation sources [15] (e.g., by using histogram analysis for voltage fluctuation indices [16]; voltage fluctuation amplitude analysis [17]; kernel density estimation analysis for voltage fluctuation indices [18]; a multi-level perceptron neural network [19]; a Jacobian matrix for gradients of voltage amplitudes [20]; analysis of power of voltage fluctuations [21]; or analysis of active power changes [22]), and to eliminate disturbances caused by them [23].
Nowadays, appropriate steps to minimize voltage fluctuations in a power grid are undertaken when a complaint is filed by a power consumer. In this case, there is a need to identify disturbing loads in the power grid. Single-point methods for the identification of sources of disturbances are dominant in the literature (e.g., methods using analysis of interharmonic power direction [24]; analysis of the correlation of changes in the flicker severity and/or changes in the active and reactive power [25]; analysis of voltage/current harmonics [26]; analysis of the power of voltage fluctuations [21]; or analysis of active power changes [22]). However, in most cases, single-point methods only allow for one side (the power consumer or power supplier) to be determined at the point of common coupling, which is the main source of disturbance. Often, a multi-step iterative process is required to locate the dominant source of voltage fluctuations in the power grid. Multiple-point methods are characterized by greater diagnostic possibilities, which with the use of simultaneous measurements in the power grid allow one to determine the point of supply of the main source of disturbances in one step [16,17,18,19,20,27,28]. If many disturbance sources occur, then the identification of individual disturbing loads on the basis of one period of simultaneous measurements is possible only after eliminating the main source of disturbances. Moreover, the current solutions proposed in the literature do not allow for the identification of sources of voltage fluctuations that change their operating state with a frequency greater than the power frequency f c [29,30] (e.g., power electronic devices [31,32,33,34,35]). These disturbance sources can cause an obnoxious flicker, because in the demodulation process of the IEC flickermeter, the components of the modulating signal with the frequency f i in the band from f c to 3 f c (associated with the disturbance source) become components of the flicker with the frequency | 2 f c f i | . The current methods of identifying sources of disturbance proposed in the literature do not differentiate sources changing their operating state with a low frequency from sources changing their operating state with a frequency greater than f c (e.g., in the case of two disturbance sources changing their operating state with a frequency f i and 2 f c + f i current solutions proposed in the literature identify these two sources as one source and indicate only the supply point of the disturbing load, which is the most distant from the substation).
The current paper proposes a novel approach that allows for the selective identification and localization of many significant disturbance sources on the basis of one period of simultaneous measurement of the instantaneous voltage in the power grid. Localization is understood to indicate the supply point of the disturbance load. Identification is understood as the estimation of parameters associated with individual disturbance loads (e.g., by estimating the rate of changes in the operating state of individual disturbance loads). Identification allows a preliminary assessment of disturbance source types, and localization allows for the determination of which point in the power grid is supplied by a specific disturbance source. Selectivity is understood to indicate the supply point and parameters associated with particular disturbing loads. The proposed approach allows for identification of the supply point of a noxious load, considering the sources of voltage fluctuations changing their operating state with a frequency of up to 3 f c (up to 150 Hz for f c = 50 Hz or up to 180 Hz for f c = 60 Hz ). The proposed approach uses a statistical assessment of component signal propagation of the estimated real voltage AM modulating signal. The implementation of the proposed approach in the existing infrastructure of smart metering allows for the individual source of disturbances in real time to be identified. The proposed approach is a complex concept, but the implementation of the algorithm in the smart metering infrastructure allows for the identification and localization of disturbing loads without expert knowledge. Currently, there are no solutions in the literature with the presented advantages of the proposed approach.

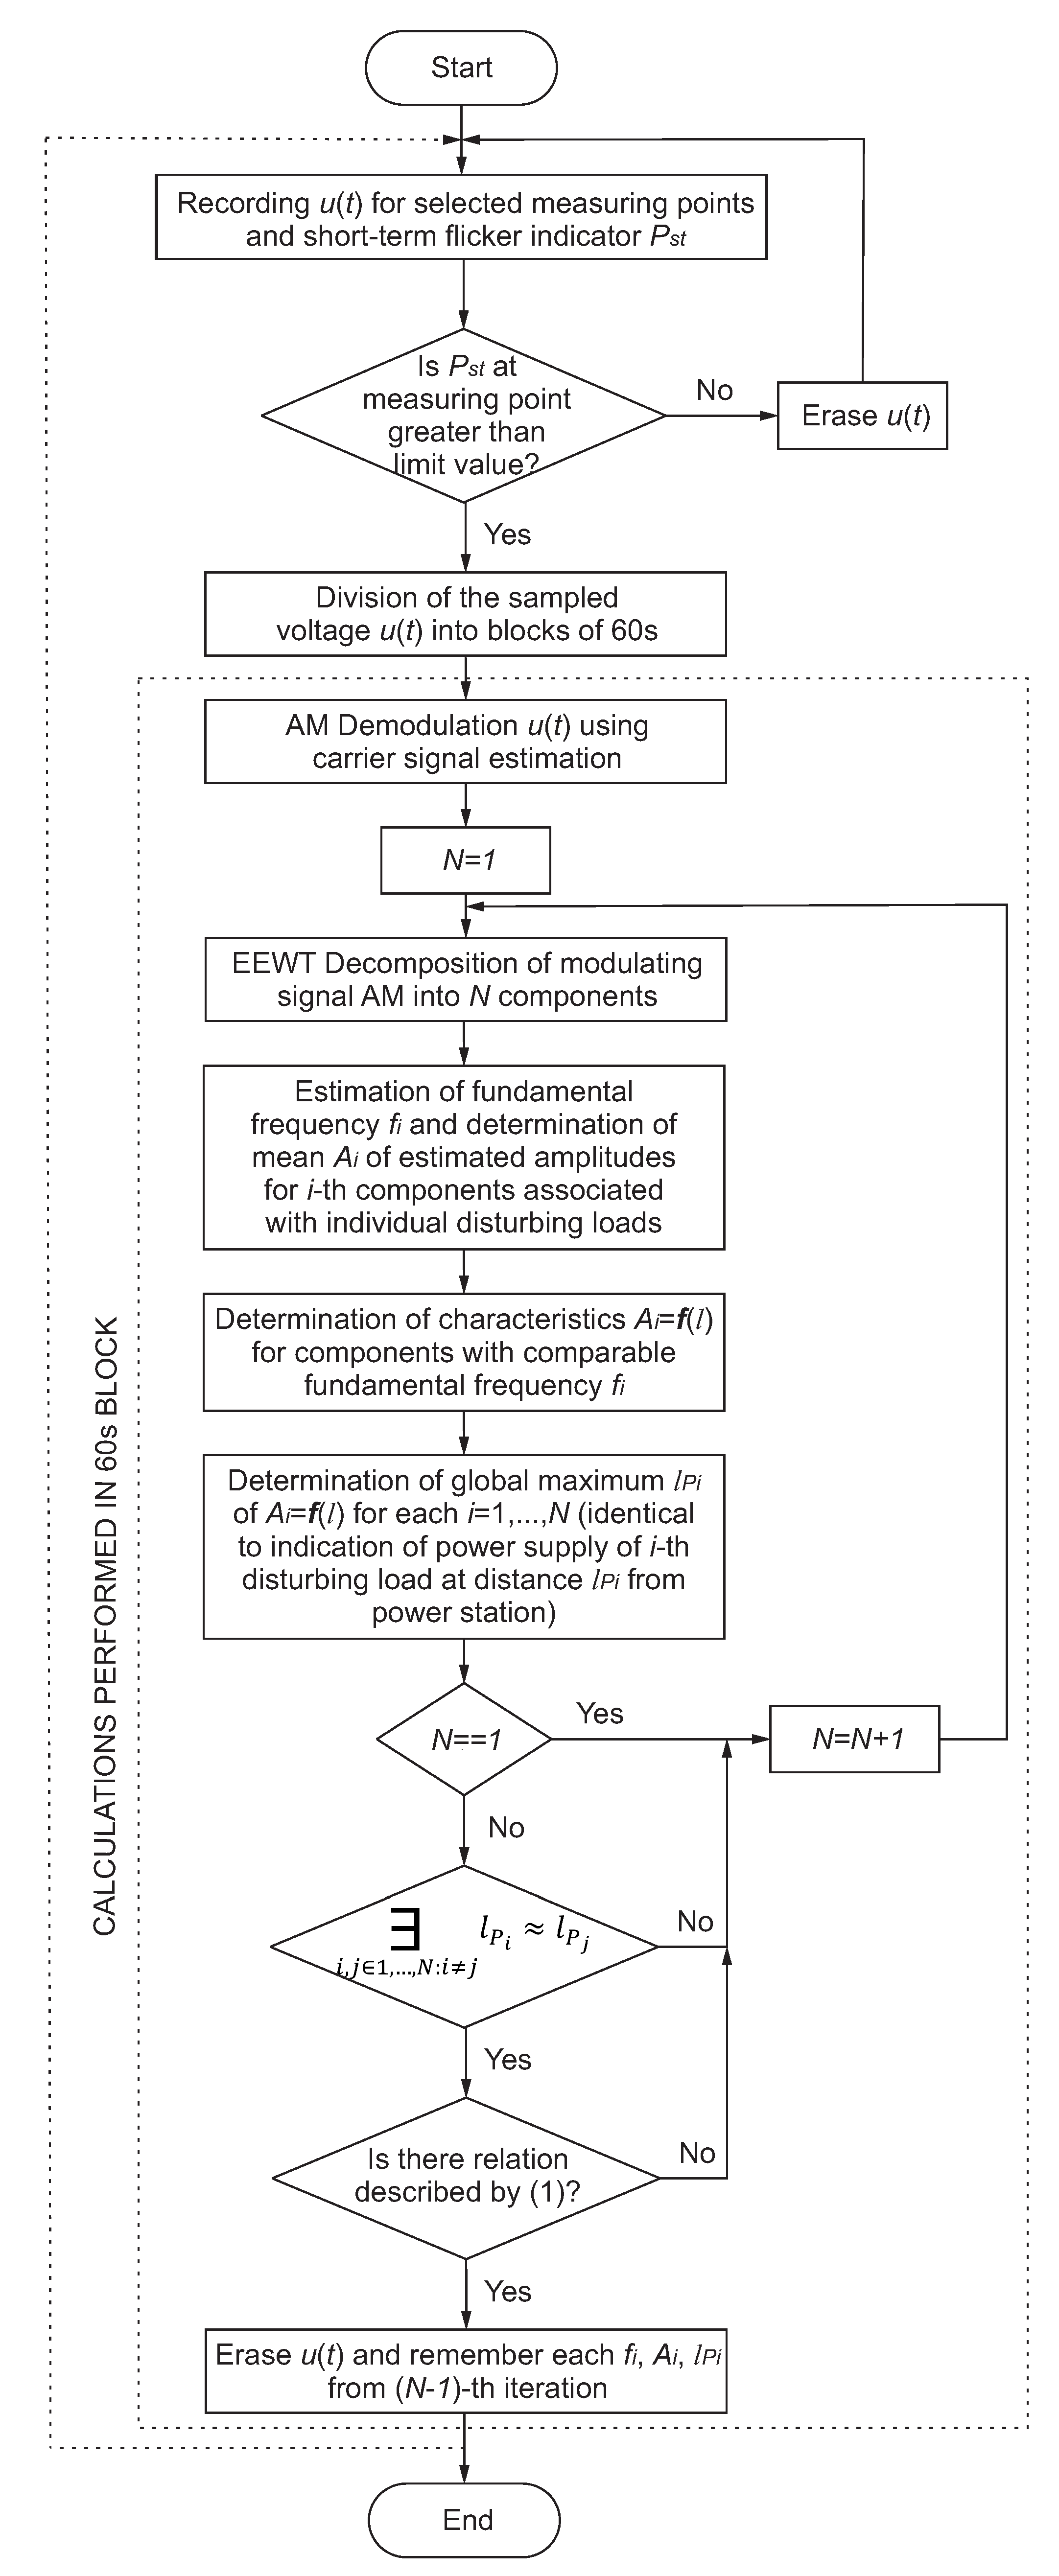
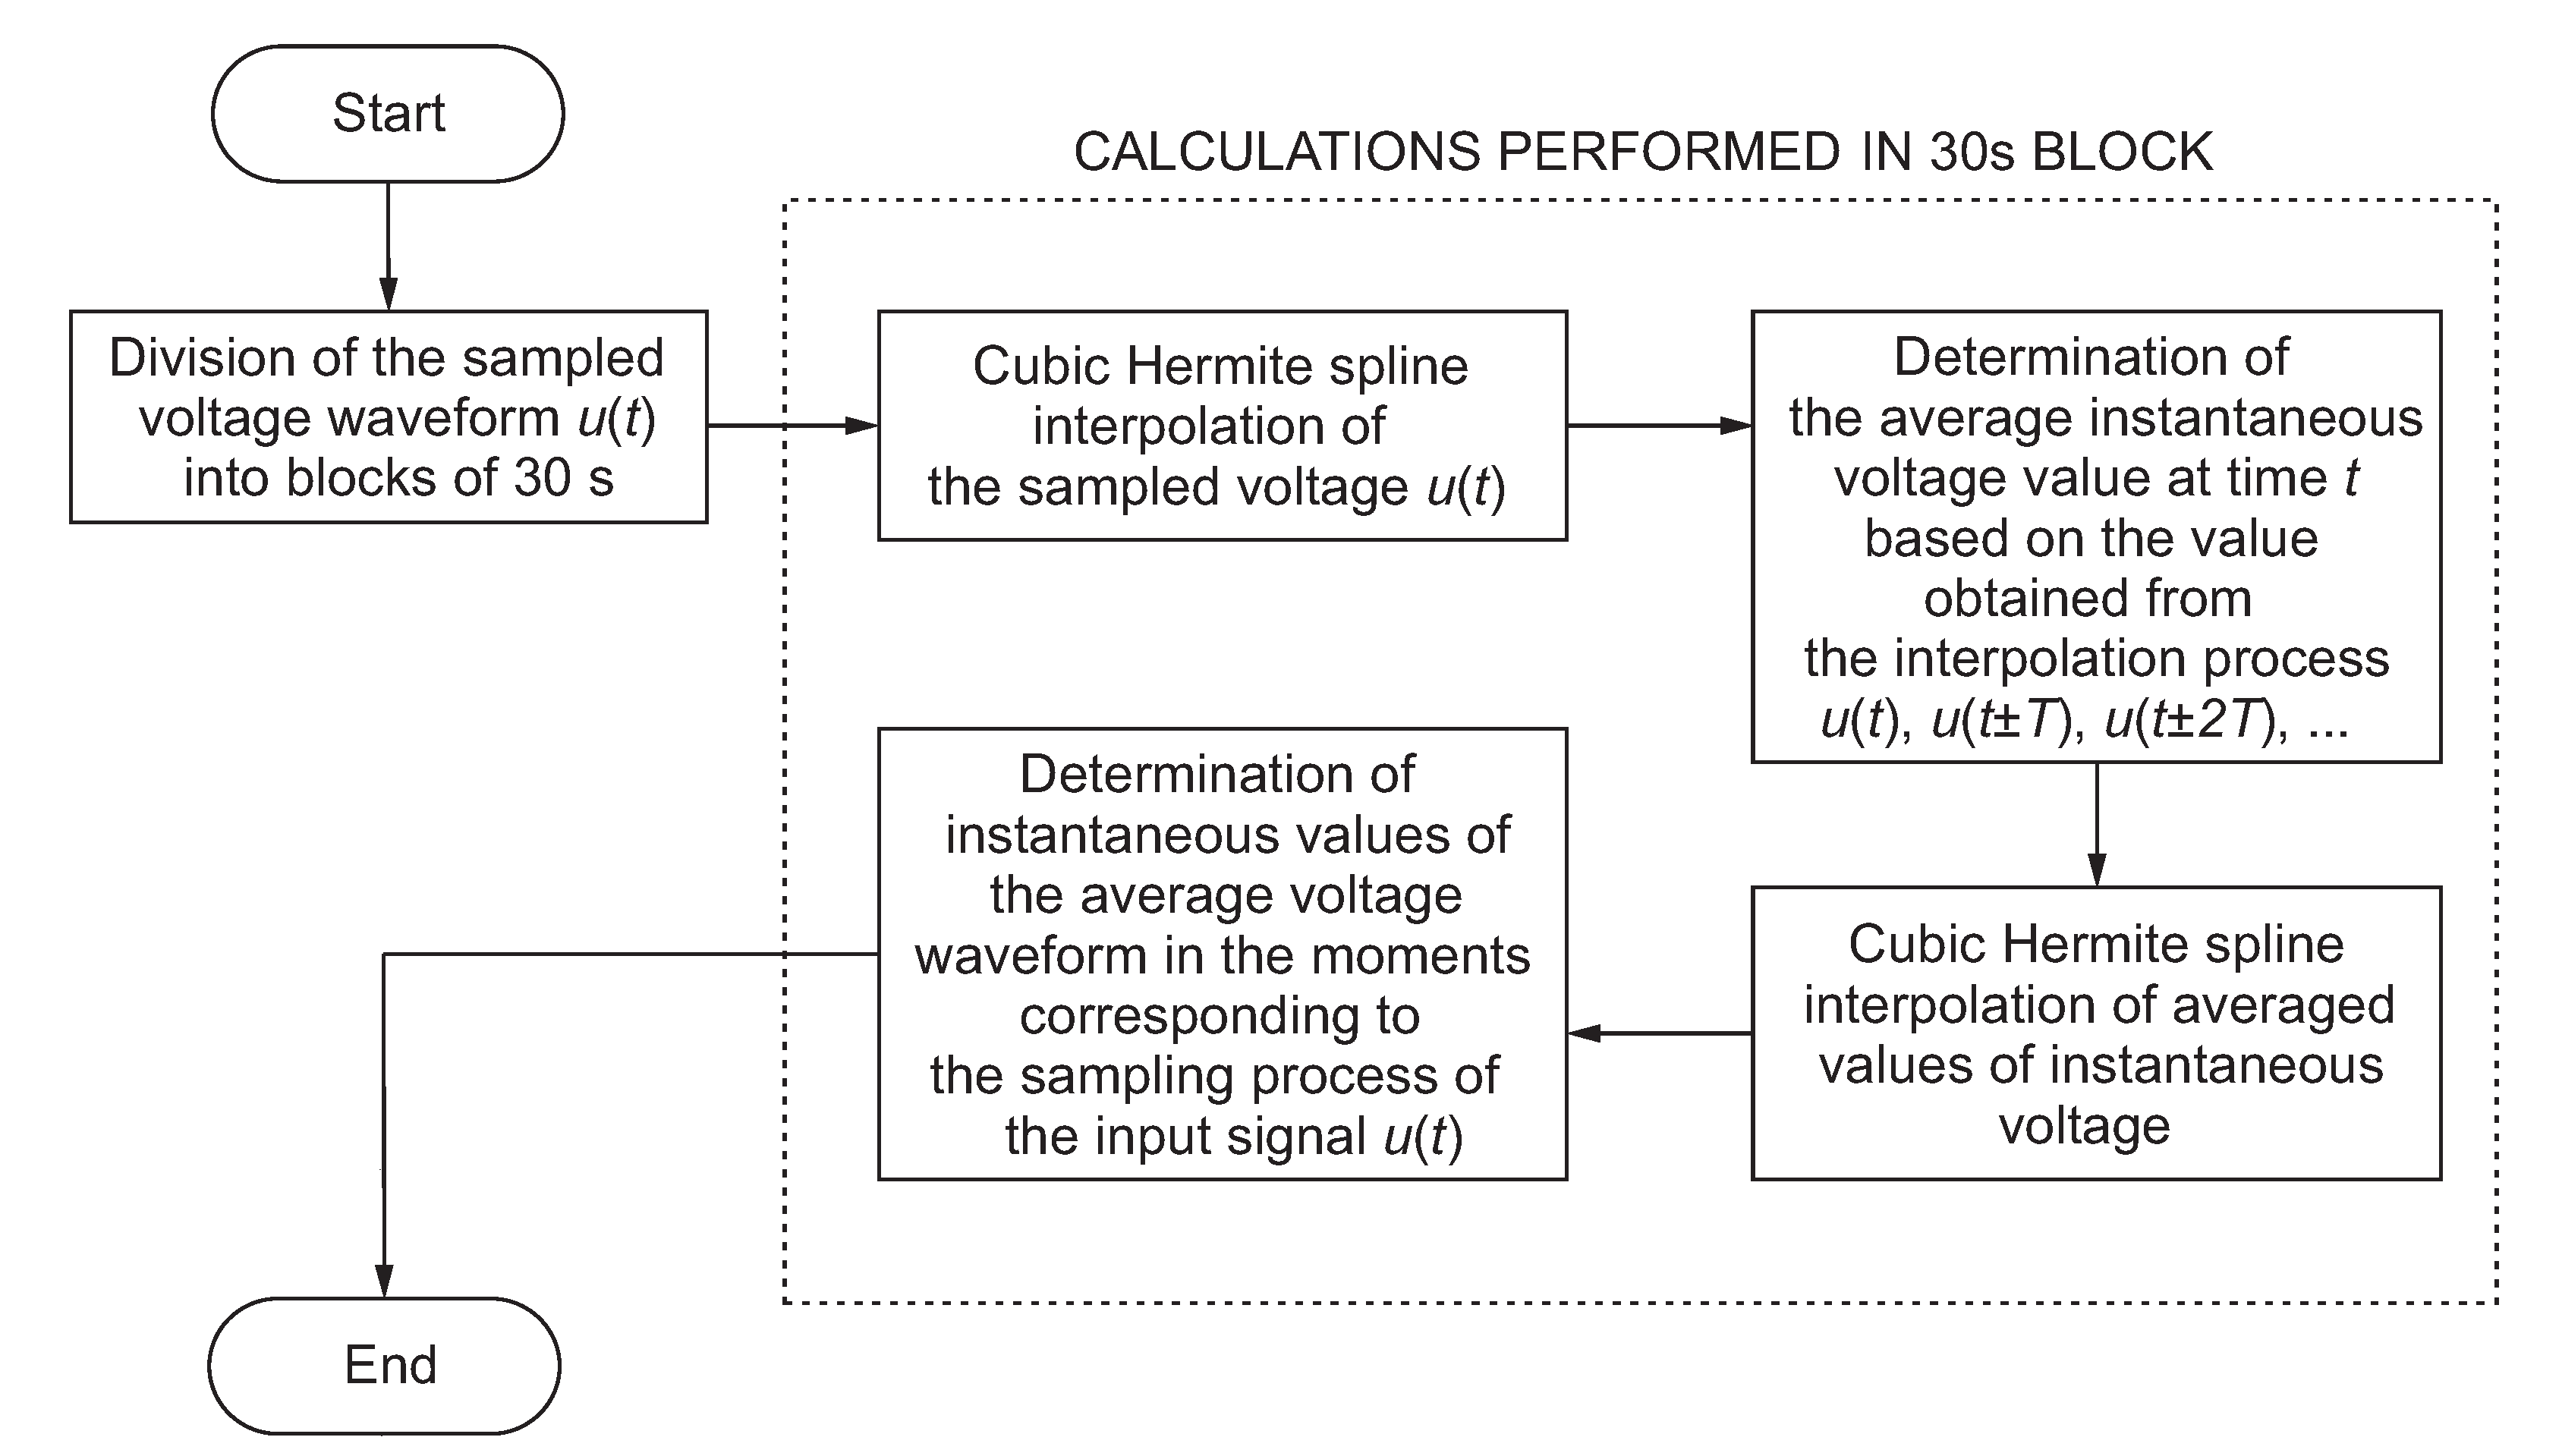
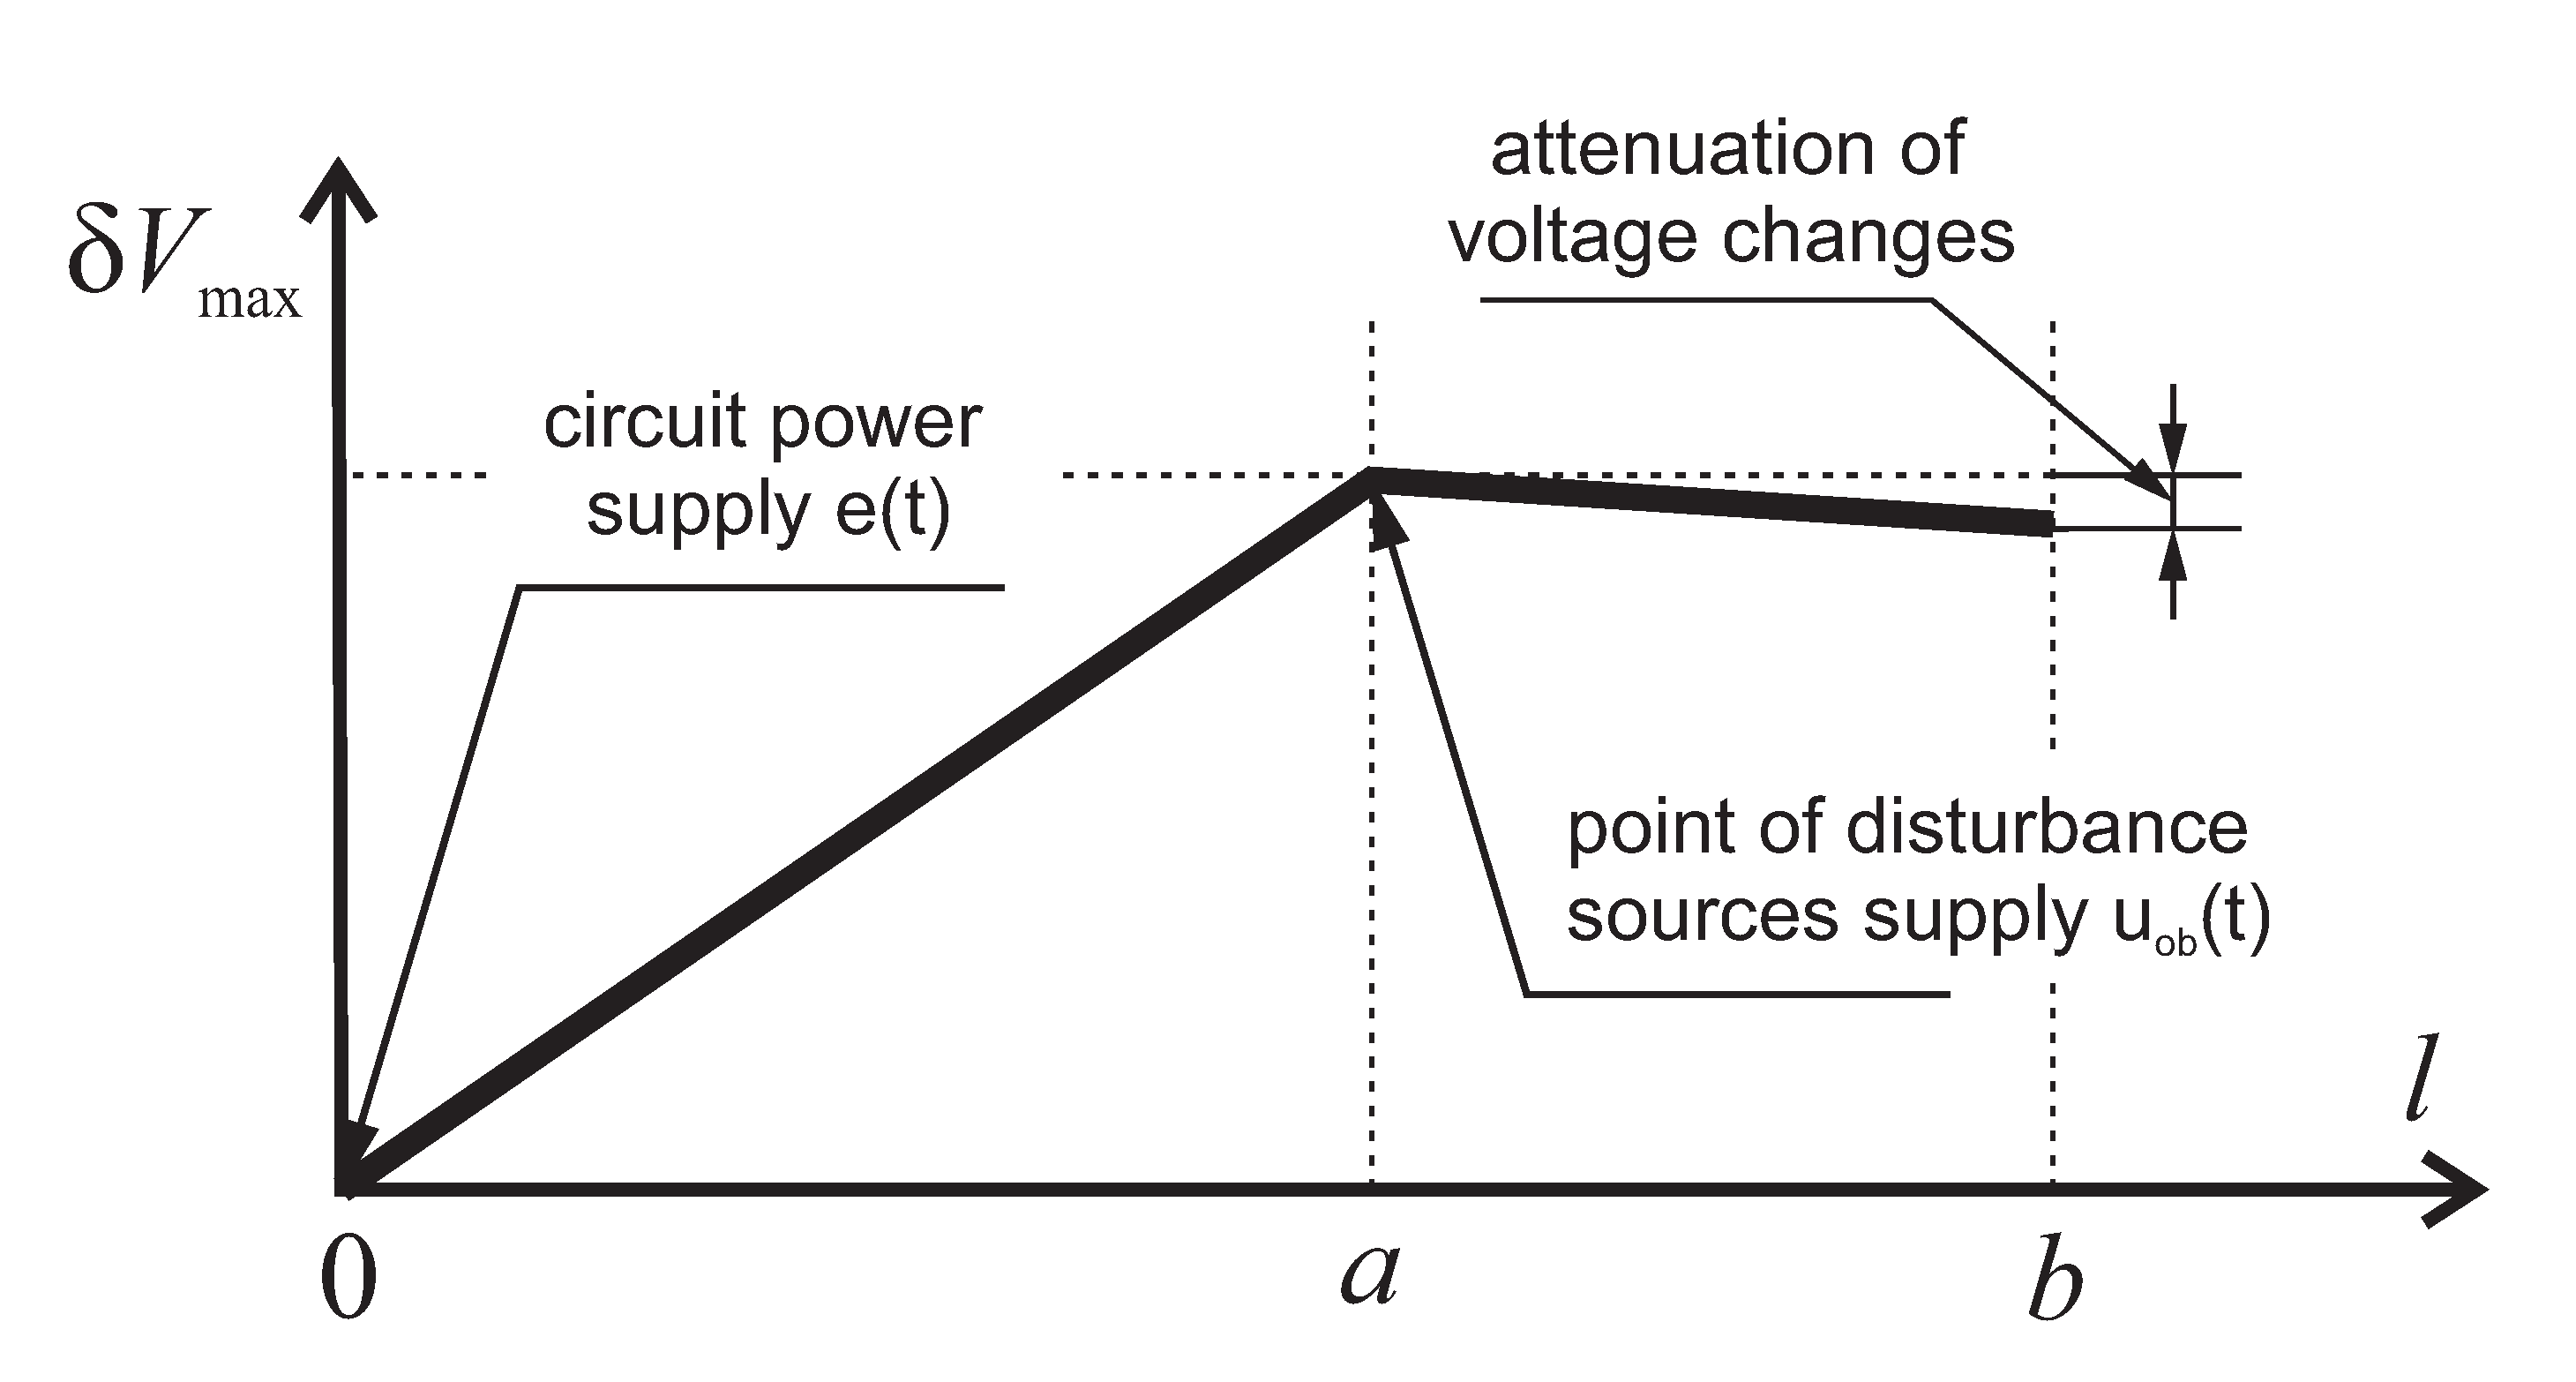
2. Algorithm for Selective Identification and Localization of Voltage Fluctuation Sources

The proposed algorithm for the selective identification and localization of individual voltage fluctuation sources is presented in Figure 1. The proposed approach consists of three main steps and is performed in an iterative process for 1 min intervals. In each iteration, first, the real AM modulating signal is estimated using carrier signal estimation according to the algorithm presented in Figure 2. A detailed description of the selected AM demodulation method, verification of its correctness, and its limitations are presented in [36].
In the next step, the estimated voltage modulating AM signal is decomposed using the enhanced empirical wavelet transform (EEWT) into N components. For individual i-th components, the fundamental frequency f i and the average of the amplitudes of voltage changes A i are determined (excluding outliers). The fundamental frequency f i is defined as the global maximum of the spectrum of the autocorrelation function of the i-th component signal. In the case of noisy non-stationary component signals, the estimation of the fundamental frequency should be performed for the spectrum after the regularization process using the moving average. The amplitudes of changes k i 1 , k i 2 , of the i-th component signal are determined as a half of the difference between the values of local extremes separated by a period of time equal to at least 1/(1.5 f i . The selection of the boundary for the distance between the adjacent extremes results from the quasi-periodic changes in the operating state of voltage fluctuation sources, so f i is the average fundamental frequency of the i-th component signal. Hence, the distance between the individual amplitudes k i 1 , k i 2 , of the i-th component signal can have a deviation from the estimated value of 1/ f i The mean A i (excluding outliers) of the amplitudes of changes k i 1 , k i 2 , of the i-th component signal after filtration with a moving average filter with a cut-off frequency of 2 f i is used to selectively identify sources of disturbances. Averaging with the exclusion of outliers is carried out to take into account the random nature of the real sources of voltage fluctuations and to exclude local changes resulting from switching processes. The correctness of the decomposition of the real voltage modulating AM signal and the determination of selected parameters associated with the influence of the i-th disturbing source is described in [37].
Finally, the selective identification and localization of voltage fluctuation sources are carried out by assessing the propagation of the i-th component of the modulating AM signal, assuming that the propagation of this component proceeds in the same way as the propagation of the resultant voltage fluctuation in the power grid (resultant modulation signal) [16,17,18,38]. The propagation of the resultant voltage fluctuation can be discussed with the use of the simple diagram shown in Figure 3. Without loss of generality, it is assumed that the impedance of the neutral line is zero, the transients in the circuit tend to zero, the supply voltage e(t) is undistorted, and the single-phase power system is considered. For the presented case, it is possible to use the representation of rotating vectors on the complex plane. Considering that voltage fluctuations are caused by disturbing loads that change their operating state, the impedance of a disturbing load can be described by the relation Z o b ̲ t = | Z o b ̲ t | e j φ t . Based on the impedance, the admittance can be determined as Y o b ̲ t = 1 Z o b ̲ t . Should the load be cyclically turned on and off, then the load admittance | Y o b ̲ t | = | 1 Z o b ̲ t | cyclically changes from a value equal to 0 to a determined value Y o b . For chaotic loads (e.g., arc furnaces) or loads equipped with additional soft-start systems, it is commonly observed that also after being switched on, the module and the argument of Z o b ̲ t or Y o b ̲ t are changed with time. For other power loads and the supply line, it is assumed that their impedance Z l is constant. In addition, for the impedance of individual line sections, it is assumed that their impedance modulus is proportional to the distance l.
Considering the assumptions and using Kirchhoff’s current and voltage law, the voltage at the load power supply terminals at the distance l = a is as follows:
u o b ̲ ( t ) = Z o b ̲ ( t ) U m e j ( ω t + φ ( t ) γ z ( t ) ) l 2 Z l ̲ 2 + Z o b ̲ ( t ) 2 + 2 l Z l ̲ · Z o b ̲ ( t ) cos ( ψ φ ( t ) )
where:
γ z ( t ) = arg l Z l ̲ cos ψ + Z o b ̲ ( t ) cos φ ( t ) + + j l Z l ̲ sin ψ + Z o b ̲ ( t ) sin φ ( t ) .
Equation (1) can be identified with amplitude and angle/phase modulation (AM-PM/FM) [39]. For a stiff power grid, the frequency change is usually not greater than ±50 mHz [40]. Hence, simplifying for such power grid, the voltage fluctuation can be identified with amplitude modulation AM [41,42,43,44]. Equation (1) shows that the voltage fluctuation depends on the distance l. For l = 0 m , the voltage amplitude is constant, so there is no voltage fluctuation. The greatest fluctuations occur for l = a m ; that is, at the point of supply of the disturbing load. The rate of the increase in the amplitude of voltage changes on the section from l = 0 m to l = a m depends on the parameters of the supply line and the value of the load impedance seen from the terminals e(t). For loads supplied from the same circuit, not being the source of voltage fluctuations, at a distance of l > a m , the voltage fluctuations are constant or are slightly suppressed by the supply line [16,17,18]. The discussed situation with a linear approximation of the dependence of the voltage fluctuation on the distance is shown in Figure 4. The propagation assessment for branching radial topology is carried out in the same way as for the assumed single-phase power supply circuit [16,45].
Assuming that the propagation of the modulating signal component proceeds in the same way as the propagation of the resultant voltage fluctuation in the power grid, the indication of the supply point of a noxious load is carried out by determining the distance l P i for which the mean value of the amplitude changes in the i-th component signal (with a comparable fundamental frequency for selected measuring points) achieves its global maximum value.
The iterative process starts with N=1 (the number of decomposition signals associated with the individual voltage fluctuation sources) and is repeated with an increase in N until any two i-th component signals lead to the indication of the same supply point. N − 1 iteration is important in the process of locating supply points for disturbing loads. However, for the process of identifying (recognizing) disturbing sources, the N-th iteration can be used (or subsequent iterations with an increase in N), provided that for the fundamental frequencies of any two component signals whose propagation assessment leads to the indication of the same point, dependence:
i , j 1 , , N : i j l P i l P j f i = 2 f c f j f i = n f j
is not satisfied, where n 1 , 2 , 3 , 4 , 5 , f c is the power frequency, i.e., 50 Hz or 60 Hz . The dependence described by (3) for the fundamental frequency of any two component signals, whose propagation assessment leads to the indication of the same point, can result from an incorrect carrier signal estimation or an incorrect (redundant) decomposition of the modulating signal. A graphic representation of the process of selective identification and localization of voltage fluctuation sources is shown in Figure 5.
The algorithm performs selective identification and localization of disturbing loads on the basis of simultaneous recordings of instantaneous voltage values with a sampling frequency of at least 12 kHz for the period of discrimination in which the influence of the disturbing source occurred. The sampling frequency of 12 kHz results from the Kotelnikov-Shanon theorem and the necessity to consider the band of the signal up to the 40th harmonic of the modulating signal with the fundamental frequency equal to the maximum assumed rate of changes in the disturbing load state (the analysis up to the 40th harmonic results from the fact that in the case of an asymmetrical operating cycle of disturbance sources, the signal energy is concentrated around higher harmonics [37]). The selection of the period of discrimination that should be stored can be made dependent on the monitoring of the selected voltage fluctuation indicator. In the paper, the main consideration is a low-voltage network with a radial topology with branches (the topology most commonly used in low-voltage networks). Therefore, in the paper, the recording periods of instantaneous voltage values are stored when the short-term flicker P s t at the end of the line is greater than 0.8. The adopted limit value results from the fact that the acceptable limit value of the indicator P s t in the low-voltage network is 1.0 and considering the situation when voltage fluctuations may be suppressed by the capacitive nature of the line, resulting in a reduction in the P s t value on the end of the line. In the future, the selection of the period of discrimination can be performed automatically by using the infrastructure of smart meters, which, within a separate structure of the power grid, will simultaneously record the instantaneous voltage values and store them in 10-min intervals ( P s t measurement period), if the indicator P s t at the end of the line achieves the limit value. For the registered voltage samples, the algorithm presented in Figure 1 will be triggered, then the devices can delete recorded voltage samples from the memory and store in the memory only the result of the proposed algorithm.

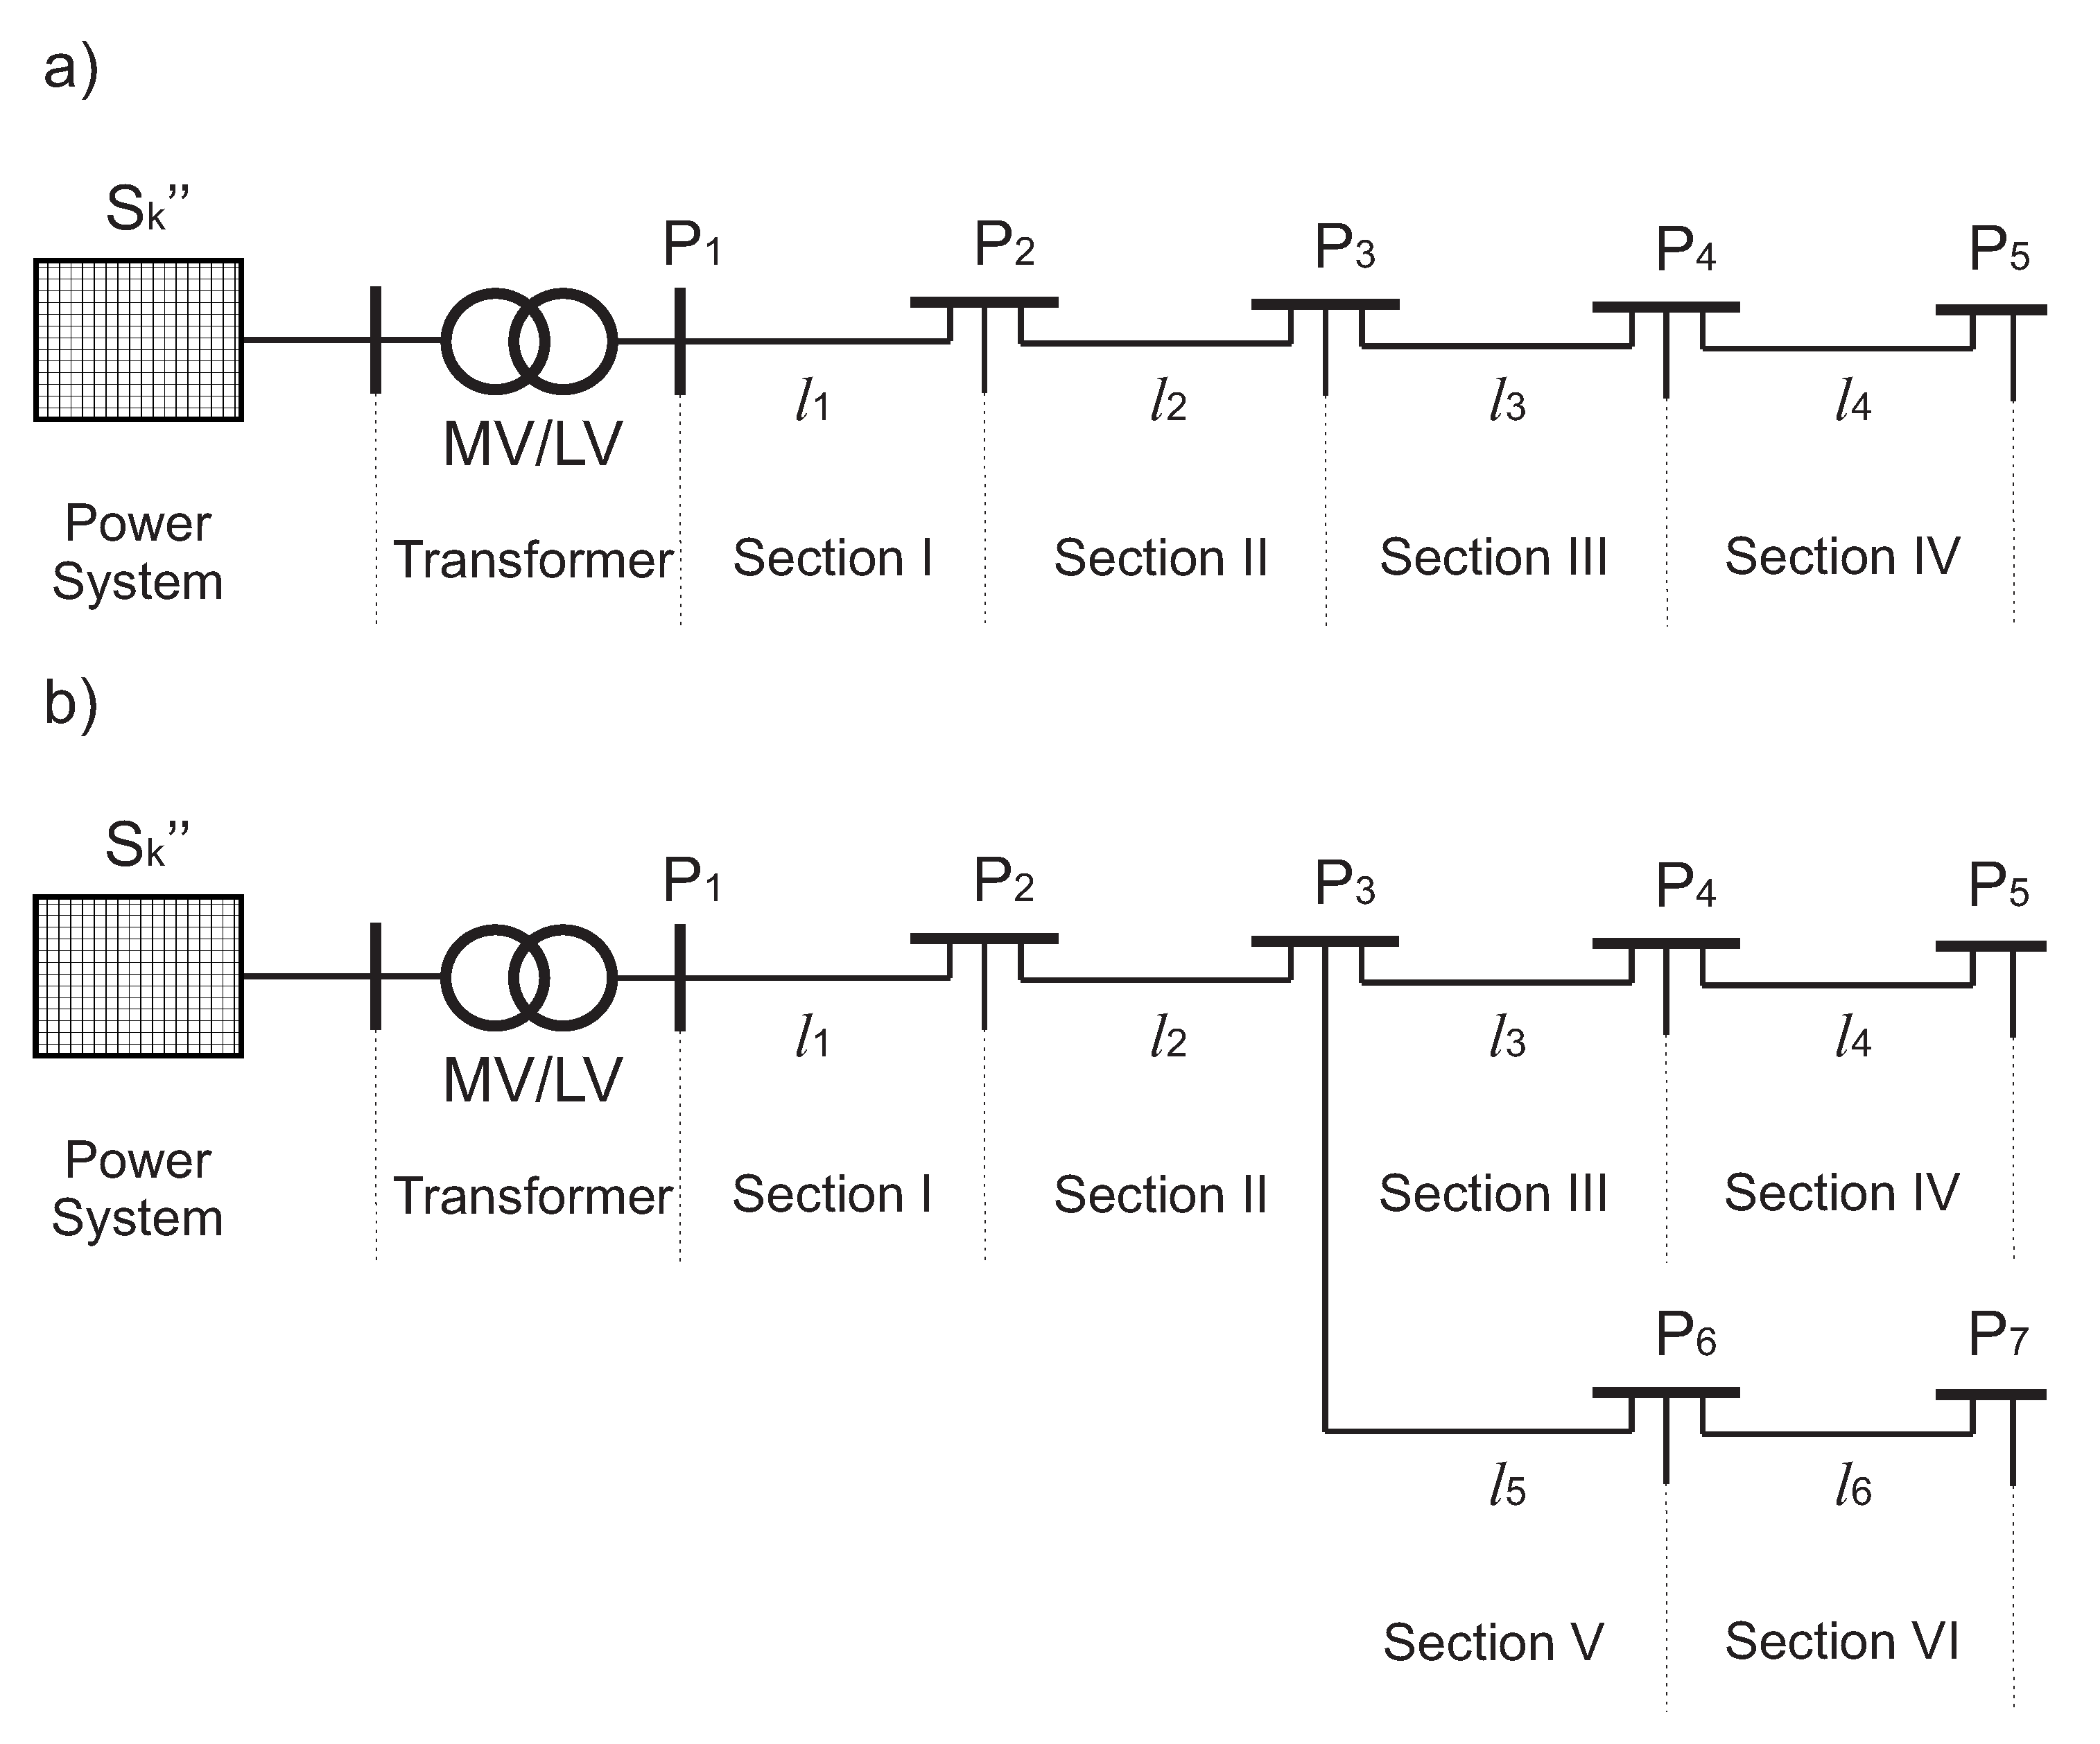
3. Selected Configurations of Low-Voltage Networks

The research focused mainly on low-voltage networks, because the voltage fluctuations most often occur in them. Currently, most of the low-voltage networks in Poland are radial topologies with branches. The proposed approach was verified in experimental studies in a real power grid with the structure shown in Figure 6b and in simulation studies using the MATLAB/SIMULINK program, in which the network structures presented in Figure 6 were modeled.
Considering the negative impact of voltage fluctuations on other loads supplied from the same network as the disturbing load and technical limitations, experimental verification could only be performed in one network configuration. Therefore, additional simulation studies were carried out with consideration of many configurations of the low-voltage power network with the topology shown in Figure 6. The parameters of selected power networks presented in Figure 6 are presented in Table 1, Table 2, Table 3 and Table 4.

4. Verification of the Algorithm for Selective Identification and Localization of Voltage Fluctuation Sources

Simulation verification of the proposed algorithm for the selective identification and localization of voltage fluctuation sources was carried out for many power grid topologies, considering the influence of many disturbing sources that change their operating state with different frequencies. Considering the paper’s clarity, only five cases described in Table 5 were selected for each line presented in Section 3. Experimental verification of the proposed algorithm for the selective identification and localization of sources of voltage fluctuation was carried out for five cases described in Table 5 and for line 4.
The rates of changes in the operating state of disturbing loads in individual cases were selected in such a way that the adopted limit value P s t = 0.8 was exceeded at the end of the line. The presented cases include the following:
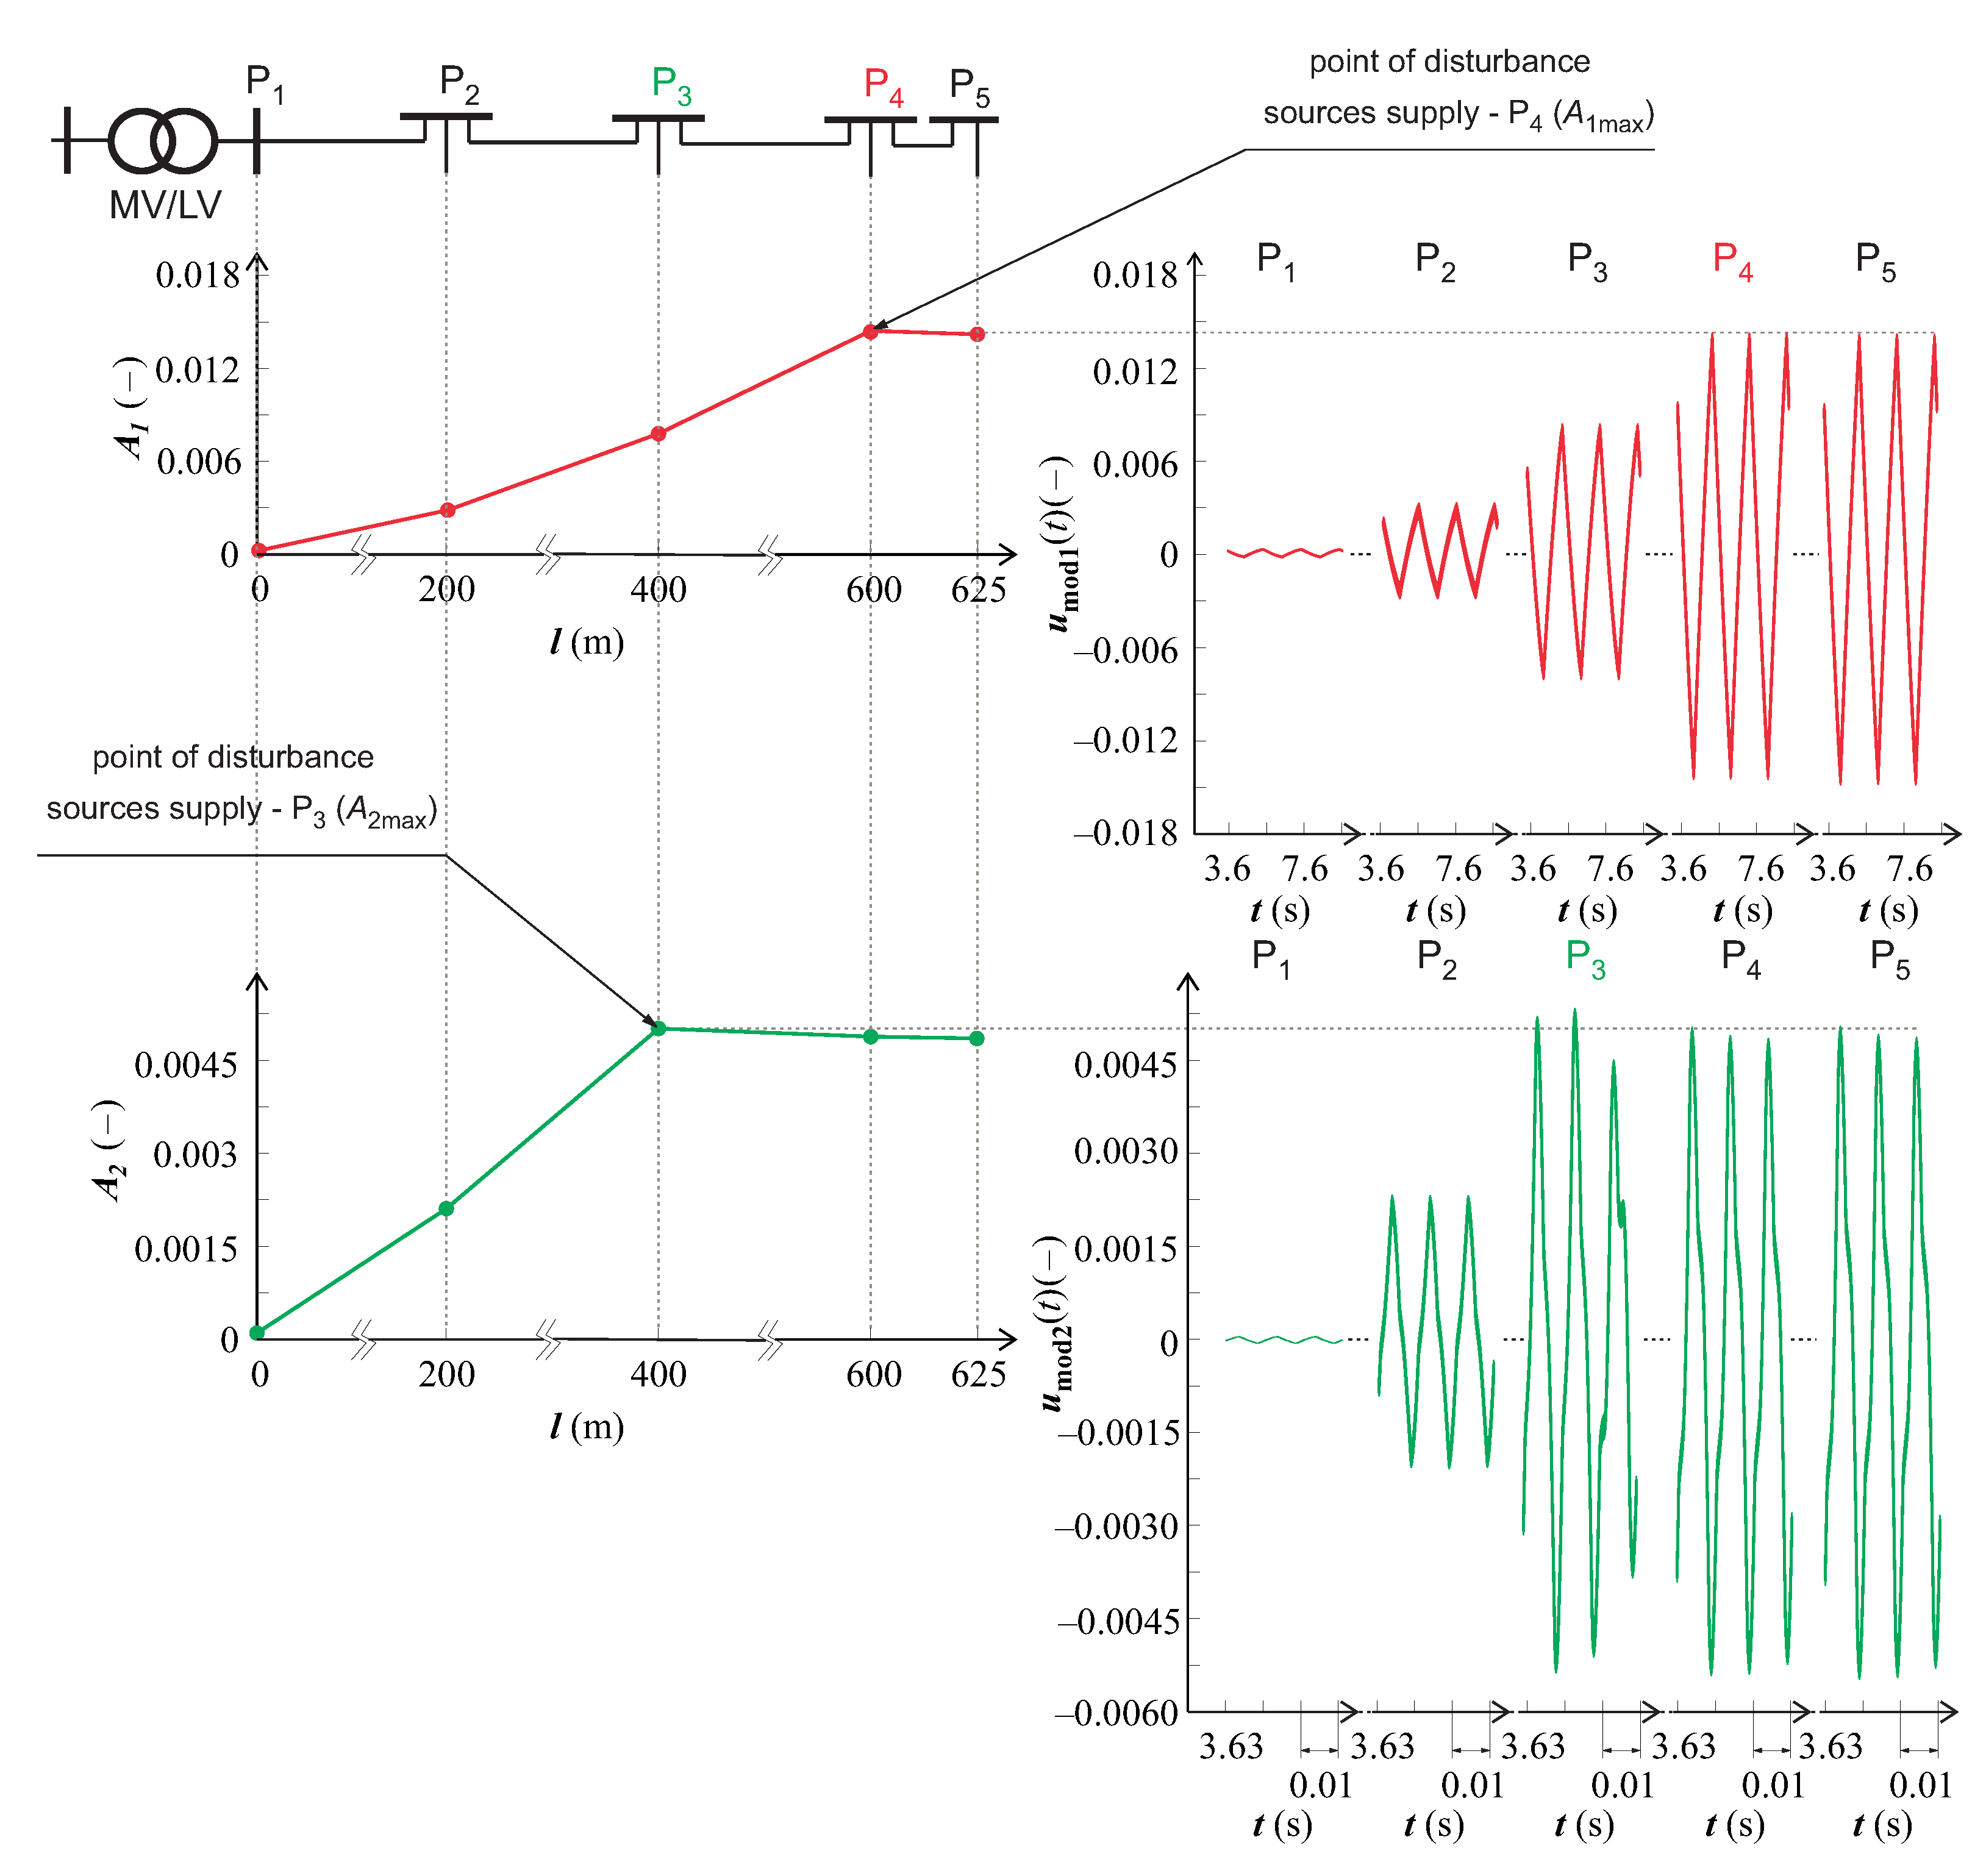
  • identification of a “slow” voltage fluctuation source (changing its operating state with a frequency lower than the power frequency) and a “fast” voltage fluctuation source (changing its operating state with a frequency greater than the power frequency), which are supplied from the same supply point or a separate supply point;
  • identification of two “slow” sources of voltage fluctuation, which are supplied from the same supply point or a separate supply point;
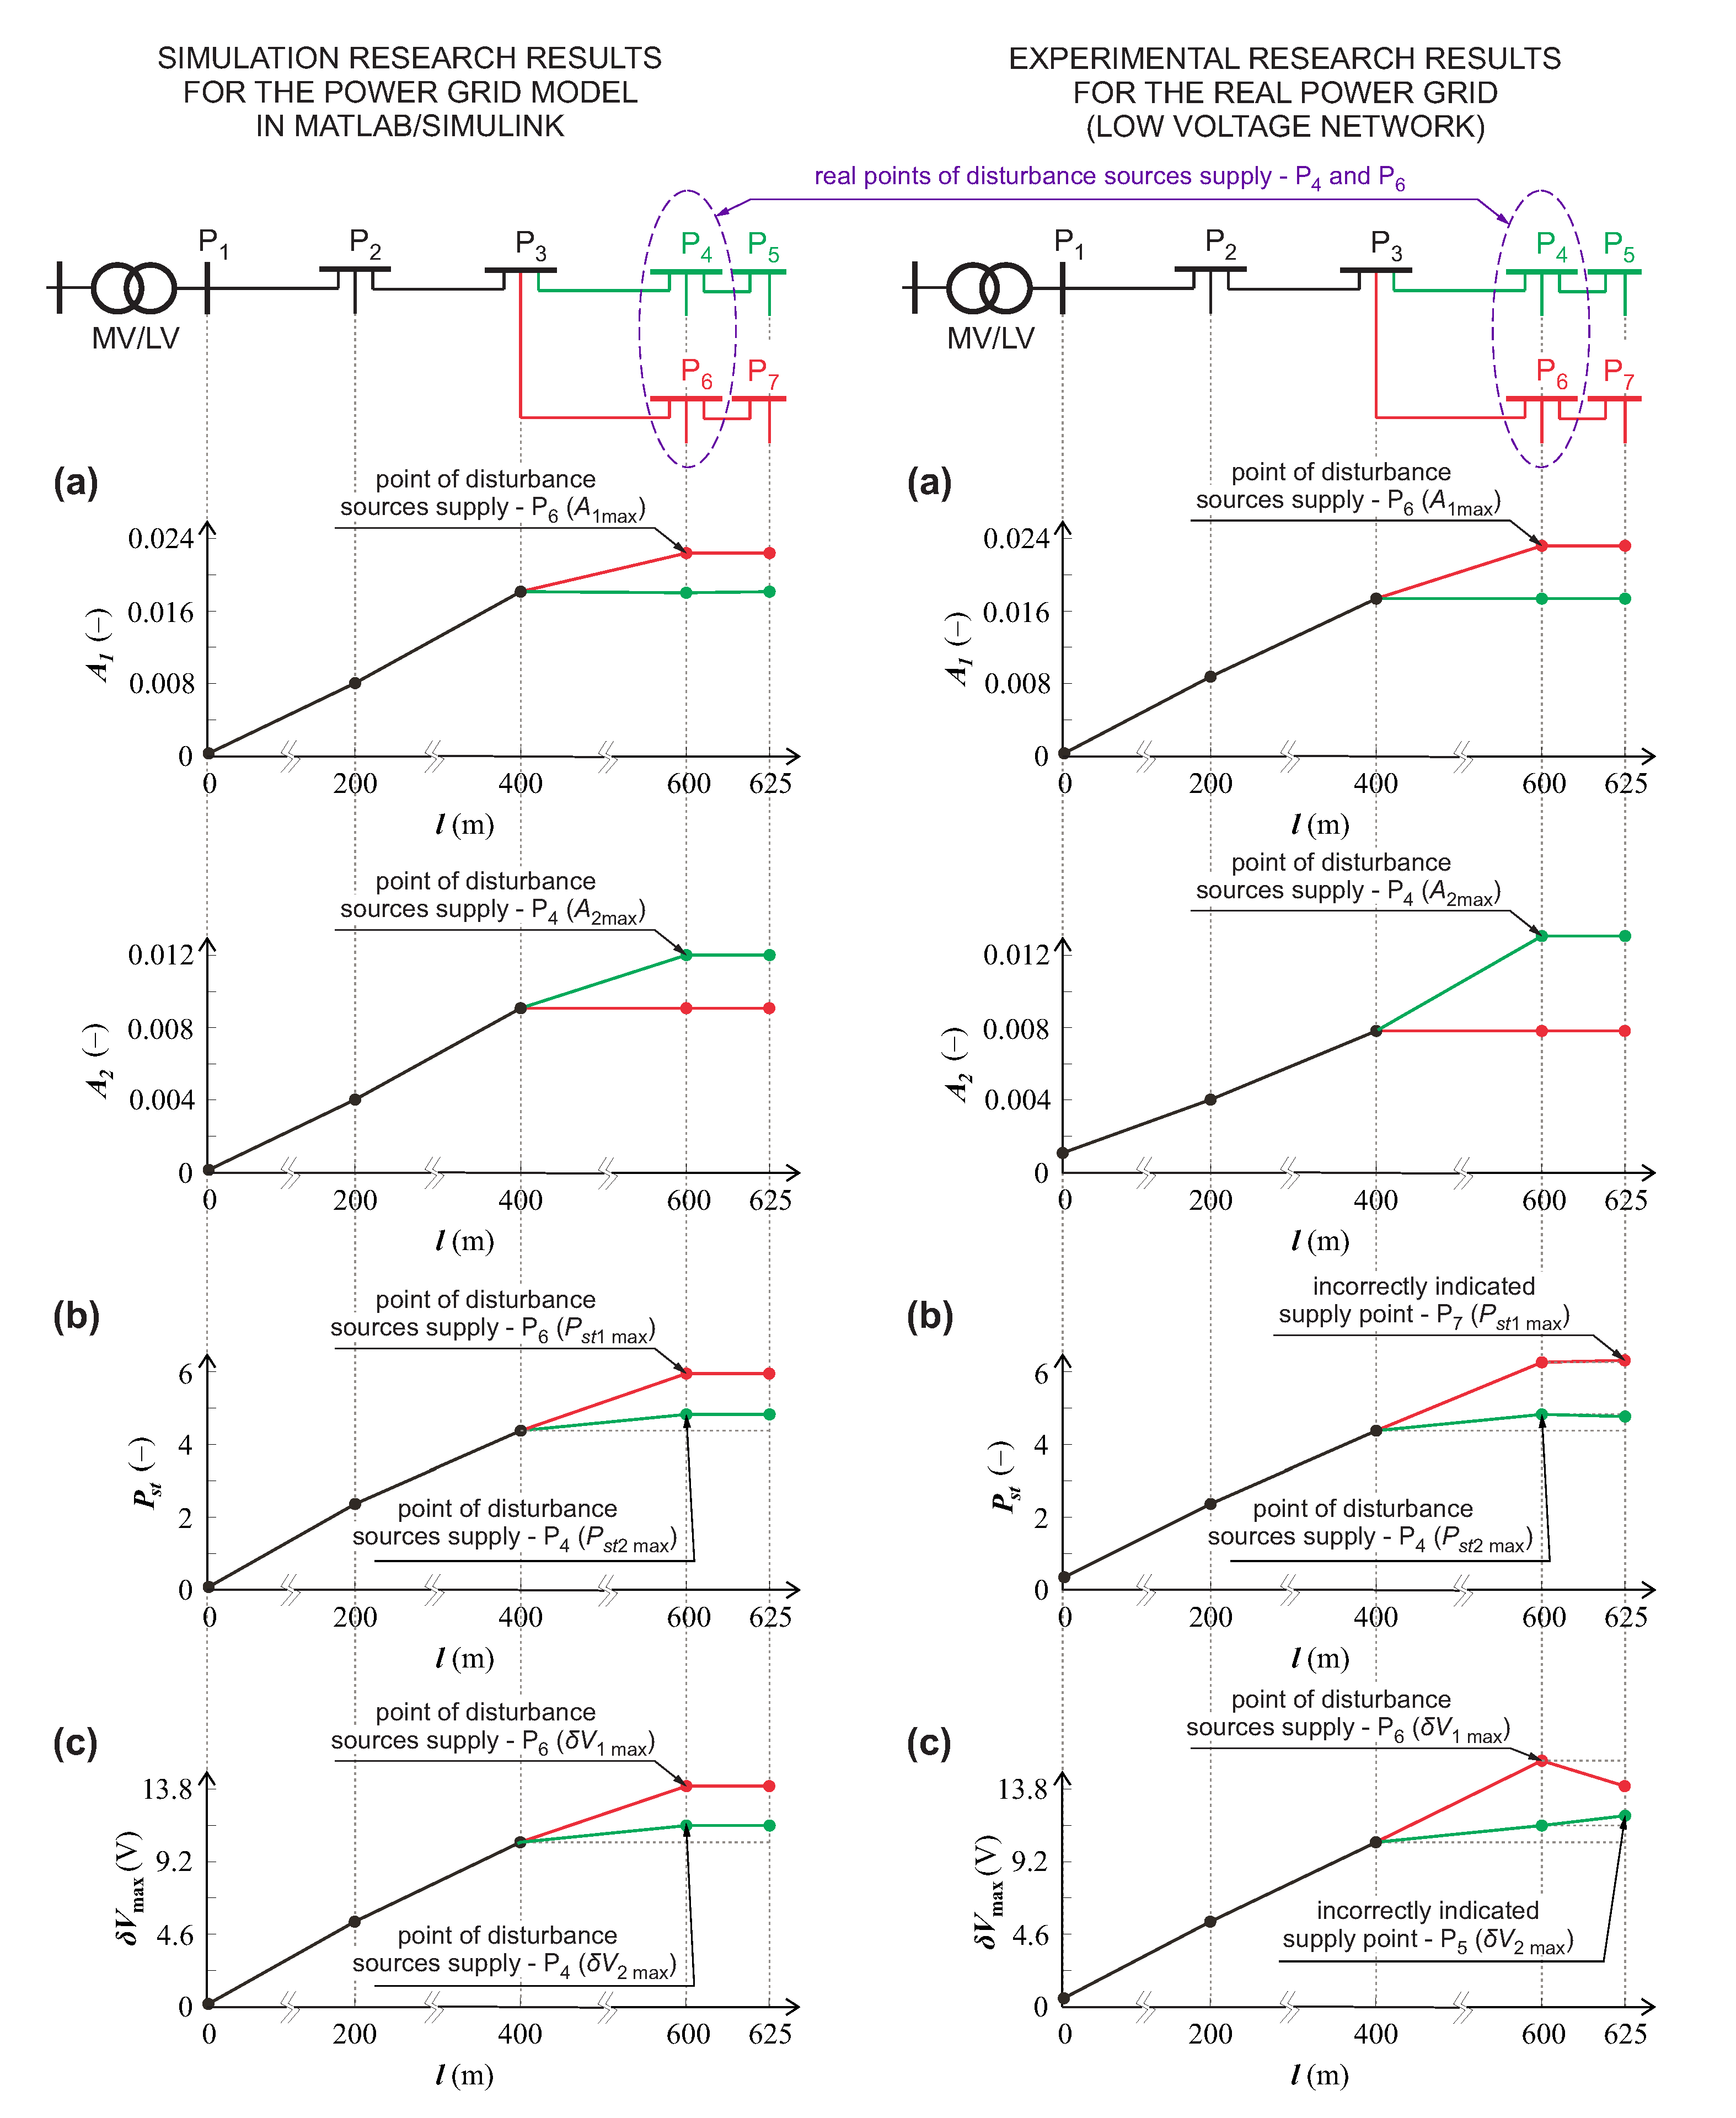
  • identification of a “slow” source of voltage fluctuation and a “fast” source of voltage fluctuation, which result in a flicker of the same frequency and are supplied from a separate supply point.
For the selected frequency values, in most cases, it is impossible to correctly identify all the disturbing sources using other methods of voltage fluctuation source identification available in the literature. In the experimental verification, the source of interference was a 3 kW convection heating system with the SSR-TRIAC control system (switching the heating system with a frequency of up to 50 Hz ) and a 2 kW convection–radiation heating system with the SSR-MOSFET control system (switching the heating system up to 150 Hz ). In the simulation verification, the sources of voltage fluctuation were modeled as in the experimental verification to compare the results of simulation and experimental studies. In the research, disturbing sources were single-phase supplied, so all results presented in Section 4 are limited only to the phase in which the disturbance occurred. The presented approach can be performed in a similar way in the other phases, if voltage fluctuation occurs in them. In addition, a random operation of other loads supplied from the same network by random switching on and off of resistive loads up to 1 kW at individual points P 1 P 7 of the network was modeled in the simulation verification.
Figure 7 shows a graphical representation of the proposed approach for Case I for Line 1. The results for all cases considered are shown in Table 6, Table 7, Table 8 and Table 9. The individual tables present the simulation and experimental results (shown in brackets) of the proposed approach and compare them with other exemplary methods of identifying sources of voltage fluctuation using the statistical analysis of the rms value changes δ V [16,17,18,45] or the value of the short-term flicker indicator P s t [24,25,46], which are currently used in real power grids to locate disturbing sources. Bold font with a grey background indicates the supply point of the disturbing load, which was determined using the proposed approach (columns and A i ) and the currently used methods (columns P s t and δ V m a x , where δ V m a x is the maximum change in the rms value of voltage in the period of discrimination). Figure 8 shows a graphical representation that allows comparison of the proposed approach with other methods used in practice for Case I of Line 4 (numerical simulation research results for the power grid model in MATLAB/SIMULINK and experimental research results for the real power grid (LV network)).
The instantaneous voltage values at individual points in the network (the input data of the proposed approach) were recorded synchronously in the simulation variant and asynchronously with a 2 min delay in the experimental variant. The asynchrony of the measurements in the experimental variant resulted from hardware limitations. It is worth noting that with the de-synchronization of the measurements in the experimental variant, there are visible problems in the correct location of the disturbing sources by the currently used identification methods. As a consequence, the currently used methods can incorrectly indicate a supply point of a disturbing load (see Table 9) when de-synchronization of the measurements occurs. Moreover, the currently used identification methods mainly allow one to locate the dominant source of disturbance. The problems of locating more sources of voltage fluctuation (especially in the case of the radial network) by the currently used methods of identifying the sources of voltage fluctuations are presentedin [16,17,18,38]. For the proposed approach, small de-synchronization (up to 2 min ) of voltage measurements at individual points of the network does not cause problems in the correct location of disturbing loads. The proposed approach in each considered case allows the sources of disturbances in the power grid to be identified and for their supply point to be determined.

5. Conclusions

The current paper has presented a proposed algorithm for the selective identification and localization of the sources of voltage fluctuation in a power grid, which allows the determination of the supply point of individual disturbing loads. The presented approach first considers sources of voltage fluctuation, which change their operating state with a frequency greater than the power frequency. These types of disturbances are caused, for example, by power electronic devices, whose number in the power grid shows an increasing trend. Apart from the presented algorithm of selective identification and localization of disturbing loads, there are no solutions that would allow for the identification and localization of disturbing sources with the consideration of rapid voltage changes with a frequency of up to 150 Hz .
The correctness of the proposed approach was verified in experimental and simulation studies. The research considered the branching radial topology common in low-voltage networks. The correctness of identification was verified for selected hybrid configurations of power networks in the considered topologies (network consisting of overhead and cable lines of different cross-sections and with different short-circuit power of the network and medium-voltage/low-voltage transformer). The considered sections of different line impedance and line nature can cause incorrect identification and localization of disturbing sources using the currently used statistical methods. This problem does not affect the accuracy of the proposed approach. The presented research results show that only the proposed algorithm for the selective identification and localization of voltage fluctuation sources allows the identification of voltage fluctuation sources and determination of their supply points with consideration of disturbing sources changing their operating state with a frequency of up to 150 Hz . For disturbing loads that change their operating state with a frequency lower than the power frequency, there are problems with the correct identification of voltage fluctuation sources when using other methods used in practice for a stiff power grid with significant short-circuit power or for the measurement of de-synchronization at individual points in the network. In such a case, the proposed approach allows sources of voltage fluctuation to be identified (determination of the frequency of changes in the operating state of the disturbance source) and for their supply points to be determined.
The limitations of the proposed approach include the problem of correct identification of disturbing sources supplied from one point in the case of the relationship described by (3), which is closely related to the demodulation method used with carrier signal estimation. The second significant limitation may be the identification of sources changing their state with a comparable frequency because of the problem of correct division of the signal spectrum in the decomposition process with the use of the EEWT, which is described in [37]. The solution to the presented limitations can be the use of the decomposition method, in which the base signals will be a function describing the shape of voltage fluctuations caused by the influence of typical sources of voltage fluctuation in the power grid. The acquisition of base signals that require long-term recordings of instantaneous voltage values at many points in the power grid and the use of demodulation with carrier signal estimation will be the subjects of further research.

Funding

The work was partially supported by the Foundation for Polish Science (FNP) under Stipend START 45.2021, and the Ministry of Education and Science under Grant numbers 0212/SBAD/0539 and 0212/SBAD/0541.

Institutional Review Board Statement

Not applicable.

Informed Consent Statement

Not applicable.

Data Availability Statement

Not applicable.

Conflicts of Interest

The author declares no conflict of interest.

Abbreviations

The following abbreviations are used in this manuscript:
AMAmplitude modulation.
EEWTEnhanced empirical wavelet transform.
u(t)Instantaneous values of voltage.
e(t)Instantaneous values of sinusoidal (undistorted) nominal supply voltage.
f c Power frequency (50 Hz or 60 Hz )—nominal voltage frequency (carrier frequency).
f i Estimated fundamental frequency of i-th modulating signal component in period of discrimination.
k i j Estimated j-th amplitude of i-th modulating signal component in period of discrimination.
A i Mean of estimated amplitudes of i-th modulating signal component in period of discrimination (excluding outliers).
NNumber of voltage modulating signal components obtained using EEWT.
lDistance from power station.
l P i Distance from power station of supply point of i-th disturbing load.
P s t Short-term flicker indicator.
P i i-th supply point of loads in the power grid.
Z l Line impedance per unit length.
Z o b t Load impedance at time t.
Y o b t Load admittance at time t.
δ V m a x The maximum change in rms value of voltage in the period of discrimination.
LVLow voltage.
MVMedium voltage.
SCable/overhead line cross-section.
RCable/overhead line resistance of the length l i .
XCable/overhead line reactance of the length l i .
ZCable/overhead line impedance of the length l i .
SCPShort-circuit power.
SSRSolid-state relay.

References

  1. 6th CEER Benchmarking Report on all the Quality of Electricity and Gas Supply 2016. 2016. Available online: https://www.ceer.eu/ (accessed on 1 September 2021).
  2. Voltage Fluctuation. International Electrotechnical Commission Standard IEV Number 161-08-05. 2003. Available online: http://std.iec.ch/iec60050 (accessed on 1 September 2021).
  3. Mindykowski, J.; Tarasiuk, T. Problems of power quality in the wake of ship technology development. Ocean Eng. 2015, 107, 108–117. [Google Scholar] [CrossRef]
  4. Ghaseminezhad, M.; Doroudi, A.; S.H. Hosseinian, A.J. Analysis of voltage fluctuation impact on induction motors by an innovative equivalent circuit considering the speed changes. IET Gen. Transm. Distrib. 2017, 11, 512–519. [Google Scholar] [CrossRef]
  5. Jhala, K.; Natarajan, B.; Pahwa, A. The Dominant Influencer of Voltage Fluctuation for Power Distribution System. IEEE Trans. Power Syst. 2019. [Google Scholar] [CrossRef]
  6. Geiger, D.L.; Halpin, S.M. Flicker Limit Compliance Assessment in the Presence of Background Disturbances. IEEE Trans. Power Deliv. 2018, 33, 3028–3035. [Google Scholar] [CrossRef]
  7. Otomanski, P.; Wiczynski, G.; Zajac, B. Flicker Vision of Selected Light Sources. Meas. Sci. Rev. 2017, 17, 232–240. [Google Scholar] [CrossRef] [Green Version]
  8. Geiger II, D.L.; Halpin, S.M. Assessing Voltage Fluctuations and Lamp Flicker Using RMS Voltages. IEEE Trans. Power Deliv. 2017, 32, 2481–2488. [Google Scholar] [CrossRef]
  9. Putz, L.; Bednarek, K.; Nawrowski, R. Disturbances Generated by Lighting Systems with LED Lamps and the Reduction in Their Impacts. Appl. Sci. 2019, 9, 4894. [Google Scholar] [CrossRef] [Green Version]
  10. Petrinska, I.; Ivanov, D. Estimation of Flicker of Contemporary LED Lamps and Luminaires. In Proceedings of the 2019 11th Electrical Engineering Faculty Conference (BulEF), Varna, Bulgaria, 11–14 September 2019; pp. 1–4. [Google Scholar] [CrossRef]
  11. Petrinska, I.; Ivanov, D.; Pavlov, D.; Kassev, K. Photometric Flicker of LED Luminaires According to Driver Type. In Proceedings of the 2020 21st International Symposium on Electrical Apparatus Technologies (SIELA), Bourgas, Bulgaria, 3–6 June 2020; pp. 1–4. [Google Scholar] [CrossRef]
  12. Alam, M.R.; Bai, F.; Yan, R.; Saha, T.K. Classification and Visualization of Power Quality Disturbance-Events using Space Vector Ellipse in Complex Plane. IEEE Trans. Power Deliv. 2020. [Google Scholar] [CrossRef]
  13. Maksic, M.; Papic, I.; Blazic, B. Simple Continuous Assessment of Transmission-Network Flicker Levels Caused by Multiple Sources. IEEE Trans. Power Deliv. 2016, 31, 2546–2552. [Google Scholar] [CrossRef]
  14. Bastos, A.F.; Santoso, S. Universal Waveshape-Based Disturbance Detection in Power Quality Data Using Similarity Metrics. IEEE Trans. Power Deliv. 2020, 35, 1779–1787. [Google Scholar] [CrossRef]
  15. Hanzelka, Z.; Chmielowiec, K.; Firlit, A.; Swiatek, B. New challenges for voltage quality studies. Prz. Elektrotechniczny 2013, 89, 17–25. [Google Scholar]
  16. Wiczynski, G. Voltage-Fluctuation-Based Identification of Noxious Loads in Power Network. IEEE Trans. Instrum. Meas. 2009, 58, 2893–2898. [Google Scholar] [CrossRef]
  17. Wiczynski, G. Determining location of voltage fluctuation source in radial power grid. Electr. Power Syst. Res. 2020, 180. [Google Scholar] [CrossRef]
  18. Kuwalek, P. Trace of Flicker Sources by Using Non-Parametric Statistical Analysis of Voltage Changes. In Proceedings of the 2020 19th International Conference on Harmonics and Quality of Power (ICHQP), Dubai, United Arab Emirates, 6–7 July 2020; pp. 1–6. [Google Scholar]
  19. Eghtedarpour, N.; Farjah, E.; Khayatian, A. Intelligent identification of flicker source in distribution systems. IET Gener. Transm. Dis. 2010, 4, 1016–1027. [Google Scholar] [CrossRef]
  20. Dejamkhooy, A.; Dastfan, A.; Ahmadyfard, A. Source detection and propagation of equal frequency voltage flicker in nonradial power system. Turk. J. Electr. Eng. Comput. Sci. 2016, 24, 1351–1370. [Google Scholar] [CrossRef]
  21. Axelberg, P.G.V.; Bollen, M.H.J.; Gu, I.Y. Trace of Flicker Sources by Using the Quantity of Flicker Power. IEEE Trans. Power Deliv. 2008, 23, 465–471. [Google Scholar] [CrossRef]
  22. Senderovich, G.A.; Diachenko, A.V. A method for determining location of voltage fluctuations source in electric grid. Electr. Eng. Electromechan. 2016, 58–61. [Google Scholar] [CrossRef]
  23. Feola, L.; Langella, R.; Papic, I.; Testa, A. Selective Interharmonic Compensation to Improve Statcom Performance for Light Flicker Mitigation. IEEE Trans. Power Deliv. 2018, 33, 2442–2451. [Google Scholar] [CrossRef]
  24. Hanzelka, Z. Single Point Methods for Location of Electromagnetic Disturbances in Power System. Prz. Elektrotechniczny 2015, 91, 1–5. [Google Scholar] [CrossRef] [Green Version]
  25. Hanzelka, Z.; Slupski, P.; Piatek, K.; Warecki, J.; Zielinski, M. Single Point Methods for Location of Distortion, Unbalance, Voltage Fluctuation and Dips Sources in a Power System. In Power Quality; Zobaa, A., Canteli, M., Bansal, R., Eds.; IntechOpen: Rijeka, Croatia, 2011. [Google Scholar] [CrossRef] [Green Version]
  26. Wilkosz, K. Single point measurement localization of prevailing harmonic sources in a power system. In Proceedings of the 2012 11th International Conference on Environment and Electrical Engineering, Venice, Italy, 18–25 May2012; pp. 1–6. [Google Scholar]
  27. Inamdar, J.J.; Annapoorani, K.I. A Review of Methods Employed to Identify Flicker Producing Sources. Telkomnika Telecommun. Comput. Electron. Control 2018, 16, 465–480. [Google Scholar]
  28. Górecki, K.; Szmajda, M.; Mroczka, J. The methodology of source disturbances detection on an electroprecipitator example. In Proceedings of the 11th International Conference on Electrical Power Quality and Utilisation, Lisbon, Portugal, 17–19 October 2011; pp. 1–6. [Google Scholar]
  29. Wiczynski, G. Sectional Approximation of the Flickermeter Transformation Characteristic for a Sinusoidal Modulating Signal. IEEE Trans. Instrum. Meas. 2008, 57, 2355–2363. [Google Scholar] [CrossRef]
  30. Wiczynski, G. Simple Model of Flickermeter Signal Chain for Deformed Modulating Signals. IEEE Trans. Power Deliv. 2008, 23, 1743–1748. [Google Scholar] [CrossRef]
  31. Karawia, H.; Mahmoud, M.; Sami, M. Flicker in distribution networks due to photovoltaic systems. CIRED—Open Access Proc. J. 2017, 2017, 647–649. [Google Scholar] [CrossRef]
  32. Alizade, A.; Noshahr, J. Evaluating noise and DC offset due to inter-harmonics and supra-harmonics caused by back-to-back converter of (DFIG) in AC distribution network. CIRED—Open Access Proc. J. 2017, 2017, 629–632. [Google Scholar] [CrossRef]
  33. Shi, X.; Key, T.; Huque, A. Can Photovoltaic Plants Cause Voltage Flicker?—Field Measurement and Screening. In Proceedings of the 2019 IEEE 46th Photovoltaic Specialists Conference (PVSC), Chicago, IL, USA, 16–21 June 2019; pp. 1549–1555. [Google Scholar] [CrossRef]
  34. Faranadia, A.H.; Omar, A.M.; Noor, S.Z. Voltage flicker assessment of 15.3kWp grid connected photovoltaic systems. In Proceedings of the 2017 IEEE 8th Control and System Graduate Research Colloquium (ICSGRC), Shah Alam, Malaysia, 4–5 August 2017; pp. 110–115. [Google Scholar] [CrossRef]
  35. Kus, V.; Peroutka, Z.; Drabek, P. Non-characteristic harmonics and interharmonics of power electronic converters. In Proceedings of the CIRED 2005—18th International Conference and Exhibition on Electricity Distribution, Turin, Italy, 6–9 June 2005; pp. 1–5. [Google Scholar] [CrossRef] [Green Version]
  36. Kuwalek, P. AM Modulation Signal Estimation Allowing Further Research on Sources of Voltage Fluctuations. IEEE Trans. Ind. Electron. 2020, 67, 6937–6945. [Google Scholar] [CrossRef]
  37. Kuwalek, P. Estimation of Parameters Associated with Individual Sources of Voltage Fluctuations. IEEE Trans. Power Deliv. 2021, 36, 351–361. [Google Scholar] [CrossRef]
  38. Kuwalek, P. The Application of Kernel Density Estimation for Aided the Process of Locating Sources of Voltage Fluctuations. Prz. Elektrotechniczny 2019, 95, 70–74. [Google Scholar] [CrossRef]
  39. Duda, K.; Bien, A.; Szyper, M.; Zielinski, T. Analysis of voltage disturbances caused by simultaneous amplitude and phase modulation in electric power network. In Proceedings of the 2004 11th International Conference on Harmonics and Quality of Power (IEEE Cat. No. 04EX951), Lake Placid, NY, USA, 12–15 September 2004; pp. 199–204. [Google Scholar] [CrossRef]
  40. Polish Power System PSE. Distribution of Hourly Frequency Deviations—Report for 2017. Available online: https://www.pse.pl/ (accessed on 1 September 2021).
  41. Flickermeter—Functional and Design Specifications; International Electrotechnical Commission Standard IEC 61000-4-15:2010; International Electrotechnical Commission: Geneva, Switzerland, 2010.
  42. Wiczynski, G. Estimation of Pst indicator value for a simultaneous influence of two disturbing loads. Elect. Power Syst. Res. 2017, 147, 97–104. [Google Scholar] [CrossRef]
  43. Kuwalek, P. Increase of Diagnostic Capabilities of Voltage Fluctuation Indicies. In Proceedings of the 2020 19th International Conference on Harmonics and Quality of Power (ICHQP), Dubai, United Arab Emirates, 6–7 July 2020; pp. 1–6. [Google Scholar]
  44. Kuwalek, P.; Jesko, W. Recreation of Voltage Fluctuation Using Basic Parameters Measured in the Power Grid. J. Electr. Eng. Technol. 2020, 15, 601–609. [Google Scholar] [CrossRef] [Green Version]
  45. Wiczynski, G. Analysis of Voltage Fluctuations in Power Networks. IEEE Trans. Instrum. Meas. 2008, 57, 2655–2664. [Google Scholar] [CrossRef]
  46. Chmielowiec, K.; Wiczynski, G.; Rodziewicz, T.; Firlit, A.; Dutka, M.; Piatek, K. Location of power quality disturbances sources using aggregated data from energy meters. In Proceedings of the 2020 12th International Conference and Exhibition on Electrical Power Quality and Utilisation- (EPQU), Cracow, Poland, 14–15 September 2020; pp. 1–5. [Google Scholar] [CrossRef]
Figure 1. Proposed algorithm for selective identification and localization of individual disturbing load.
Energies 14 06585 g001
Figure 2. Algorithm for approximating the modulating signal using the estimated carrier signal [36].
Energies 14 06585 g002
Figure 3. Diagram of a simplified single-phase power supply system for a disturbing load [18].
Energies 14 06585 g003
Figure 4. Linear approximation of the dependence δ V m a x = f l [18].
Energies 14 06585 g004
Figure 5. Graphic representation of the process of selective identification of supply point of voltage fluctuation source.
Energies 14 06585 g005
Figure 6. Low-voltage power grid configurations selected for testing: (a) radial topology, (b) branching radial topology.
Energies 14 06585 g006
Figure 7. Graphical representation of the proposed approach for Case I and for Line 1.
Energies 14 06585 g007
Figure 8. Comparison of the proposed approach (marked as (a)) with other methods (the method using the statistical analysis of the rms value changes δ V marked as (b) and the method using the statistical analysis of the P s t value marked as (c)) for case I of Line 4 (simulation and experimental variant).
Energies 14 06585 g008
Table 1. Parameters of selected low-voltage power grid configurations with radial topology—Line 1.
ParameterSCPType l i
(m)
S
( mm 2 )
R
(m Ω )
X
(m Ω )
Z
(m Ω )
Power System80 MVA---0.02.22.2
Transformer315 kVA---9.221.523.3
Section I-Cable line—Al20012051.013.452.7
Section II-Overhead line—Al2007087.466.0109.5
Section III-Overhead line—Al20050122.766.0139.4
Section IV-Cable line—Cu251045.82.045.8
Table 2. Parameters of selected low-voltage power grid configurations with radial topology—Line 2.
ParameterSCPType l i
(m)
S
( mm 2 )
R
(m Ω )
X
(m Ω )
Z
(m Ω )
Power System200 MVA---0.00.90.9
Transformer630 kVA---3.810.811.4
Section I-Cable line—Al20024025.613.228.8
Section II-Cable line—Al20012051.013.452.7
Section III-Cable line—Al20012051.013.452.7
Section IV-Cable line—Cu252528.81.928.8
Table 3. Parameters of selected low-voltage power grid configurations with radial topology—Line 3.
ParameterSCPType l i
(m)
S
( mm 2 )
R
(m Ω )
X
(m Ω )
Z
(m Ω )
Power System60 MVA---0.02.92.9
Transformer100 kVA---35.262.771.9
Section I-Overhead line—Al2007087.466.0109.5
Section II-Overhead line—Al20050122.766.0139.4
Section III-Overhead line—Al20035175.366.0187.3
Section IV-Cable line—Al251647.01.947.0
Table 4. Parameters of selected low-voltage power grid configurations with branching radial topology—Line 4.
ParameterSCPType l i
(m)
S
( mm 2 )
R
(m Ω )
X
(m Ω )
Z
(m Ω )
Power System200 MVA---0.00.90.9
Transformer630 kVA---3.810.811.4
Section I-Overhead line—Al30070150.031.4153.3
Section II-Overhead line—Al25050150.031.4153.3
Section III-Overhead line—Al10035100.069.1121.6
Section IV-Cable line—Al501650.02.150.0
Section V-Overhead line— Al10035100.069.1121.6
Section VI-Cable line—Al501650.02.150.0
Table 5. Selected cases for verification of the proposed algorithm for selective identification and localization of voltage fluctuation sources.
Case
No.
Disturbing Load
3 kW Convection Heating
System with SSR TRIAC
Control System
2 kW Convection-Radiation Heating
System with SSR MOSFET
Control System
Rate of
Change in
Operating
State
f i (Hz)
Point of
Disturbance
Sources Supply
on Line 1–4
P i
Rate of
Change in
Operating
State
f i (Hz)
Point of
Disturbance
Sources Supply
on Line 1–3 (Line 4)
P i
I0.5 P 4 100.5 P 3 ( P 6 )
II0.5 P 4 91.2 P 3 ( P 6 )
III0.5 P 4 8.8 P 3 ( P 6 )
IV0.5 P 4 91.2 P 4 ( P 4 )
V0.5 P 4 8.8 P 4 ( P 4 )
Table 6. The numerical simulation research results for Line 1.
Case No.Distancefrom the Power
Station l (m)
Modulating Signal Components Associated
with Individual Disturbing Load
P st (–) δ V max (V)
u mod 1 (t) u mod 2 (t)
f 1 (Hz) A 1 (–) f 2 (Hz) A 2 (–)
I00.50.00099.50.0000.120.3
3000.50.003100.50.0020.731.6
5500.50.008100.50.0051.954.3
6500.50.014100.50.0053.627.3
7000.50.014100.50.0053.627.3
II00.50.00091.20.0000.230.4
3000.50.00391.20.0021.182.2
5500.50.00891.20.0053.266.0
6500.50.01491.20.0054.589.6
7000.50.01491.20.0054.589.6
III00.50.0008.8 *0.0000.160.2
3000.50.0038.80.0021.752.3
5500.50.0078.80.0054.566.0
6500.50.0148.80.0055.569.0
7000.50.0148.80.0055.569.0
IV00.50.00091.20.0000.180.3
3000.50.00391.20.0021.142.1
5500.50.00791.20.0053.165.9
6500.50.01491.20.0095.9711.2 2 ̲
7000.50.01491.20.0095.9711.2
V00.50.0008.8 *0.0000.160.2
3000.50.0038.80.0021.732.3
5500.50.0078.80.0054.505.9
6500.50.0148.80.0108.4310.9 2
7000.50.0148.80.0108.4310.9
*—The problem during decomposition. The resulting component has a significantly different frequency than 8.8 Hz, but has a negligibly small amplitude. 2 ̲ / 2 —The method of statistically assessing the propagation of voltage changes δ V using histograms allows for the correct indication of supply points of disturbing loads without/with a correct estimation of the rate of changes in their operating state.
Table 7. The numerical simulation research results for Line 2.
Case No.Distancefrom the Power
Station l (m)
Modulating Signal Components Associated
with Individual Disturbing Load
P st (–) δ V max (V)
u mod 1 (t) u mod 2 (t)
f 1 (Hz) A 1 (–) f 2 (Hz) A 2 (–)
00.50.000100.50.0000.100.2
2000.50.002100.50.0010.421.0
I4000.50.004100.50.0021.072.5
6000.50.007100.50.0021.743.8
6250.50.007100.50.0021.743.8
00.50.00091.20.0000.180.3
2000.50.00191.20.0010.771.5
II4000.50.00491.20.0021.803.4
6000.50.00791.20.0022.324.8
6250.50.00791.20.0022.324.8
00.50.0008.8 *0.0000.070.1
2000.50.0018.80.0010.881.2
III4000.50.0048.80.0032.503.3
6000.50.0078.80.0032.904.6
6250.50.0078.80.0032.904.6
00.50.00091.20.0000.160.2
2000.50.00191.20.0010.731.4
IV4000.50.00491.20.0021.763.3
6000.50.00791.20.0042.835.4 2 ̲
6250.50.00791.20.0042.835.4
00.50.0008.8 *0.0000.070.1
2000.50.0018.80.0010.881.2
V4000.50.0048.80.0032.503.3
6000.50.0078.80.0032.904.6 2
6250.50.0078.80.0032.904.6
*—The problem during decomposition. The resulting component has a significantly different frequency than 8.8 Hz, but has a negligibly small amplitude. 2 ̲ / 2 —The method of statistically assessing the propagation of voltage changes δ V using histograms allows for the correct indication of supply points of disturbing loads without/with a correct estimation of the rate of changes in their operating state.
Table 8. The numerical simulation research results for Line 3.
Case No.Distancefrom the Power
Station l (m)
Modulating Signal Components Associated
with Individual Disturbing Load
P st (–) δ V max (V)
u mod 1 (t) u mod 2 (t)
f 1 (Hz) A 1 (–) f 2 (Hz) A 2 (–)
I00.50.001100.50.0010.280.7
2000.50.006100.50.0041.463.2
4000.50.012100.50.0083.156.9
6000.50.021100.50.0085.6311.1
6250.50.021100.50.0085.6311.1
II00.50.00191.20.0010.581.1
2000.50.00591.20.0042.564.7
4000.50.01291.20.0085.299.7
6000.50.02191.20.0087.2114.4
6250.50.02191.20.0087.2114.4
III00.50.0018.80.0010.590.8
2000.50.0058.80.0043.364.4
4000.50.0118.80.0087.279.4 2 ̲
6000.50.0218.80.0088.6713.6 2 ̲
6250.50.0218.80.0088.6713.6
IV00.50.00191.20.0010.541.0
2000.50.00591.20.0042.494.7
4000.50.01291.20.0085.219.6
6000.50.02191.20.0149.0916.5 2 ̲
6250.50.02191.20.0149.0916.5
V00.50.0018.80.0010.590.8
2000.50.0058.80.0043.294.3
4000.50.0018.80.0087.129.2
6000.50.0218.80.01412.7016.2 2
6250.50.0218.80.01412.7016.2
2 ̲ / 2 —The method of statistically assessing the propagation of voltage changes δ V using histograms allows for the correct indication of supply points of disturbing loads without/with a correct estimation of the rate of changes in their operating state.
Table 9. The simulation and experimental (in brackets) research results in the real power grid—Line 4.
Case No.Distancefrom the Power
Station l (m)
Modulating Signal Components Associated
with Individual Disturbing Load
P st (–) δ V max (V)
u mod 1 (t) u mod 2 (t)
f 1 (Hz) A 1 (–) f 2 (Hz) A 2 (–)
I00.50.000
(0.000)
100.50.000
(0.001)
0.03
(0.28)
0.1
(0.6)
3000.50.008
(0.009)
100.50.004
(0.004)
2.23
(2.36)
5.4
(5.1)
5500.50.018
(0.017)
100.50.009
(0.008)
4.52
(4.55)
10.8
(10.0)
6500.50.018
(0.017)
100.50.012
(0.013)
4.74
(4.77)
11.6  2 ̲
(11.5)
7000.50.018
(0.017)
100.50.012
(0.013)
4.74
(4.74)
11.6
(12.1) 
6500.50.022
(0.023)
100.50.009
(0.008)
5.95
(6.30)
13.9 2 ̲
(14.8)
7000.50.022
(0.023)
100.50.009
(0.008)
5.95
(6.32) 
13.9
(13.6)
II00.50.000
(0.001)
91.20.000
(0.001)
0.09
(0.38)
0.1
(0.8)
3000.50.007
(0.009)
91.20.004
(0.005)
3.34
(3.35)
7.0
(6.9)
5500.50.015
(0.017)
91.20.009
(0.009)
6.76
(6.47)
13.9
(14.3)
6500.50.015
(0.017)
91.20.012
(0.013)
8.31
(8.13)
16.0 2 ̲
(17.1)
7000.50.015
(0.017)
91.20.012
(0.013)
8.31
(8.08)
16.0
(16.0)
6500.50.022
(0.024)
91.20.009
(0.009)
7.91
(7.83)
16.8  2 ̲
(17.3)
7000.50.022
(0.024)
91.20.009
(0.009)
7.91
(7.85) 
16.8
(18.1) 
III00.50.000
(0.001)
8.80.000
(0.000)
0.07
(0.59)
0.1
(0.9)
3000.50.007
(0.009)
8.80.005
(0.006)
4.89
(5.53)
7.9
(7.4)
5500.50.015
(0.017)
8.80.011
(0.012)
9.90
(10.57)
15.7
(14.1)
6500.50.015
(0.017)
8.80.013
(0.017)
12.59
(14.0)
18.0 2 ̲
(16.4) 2 ̲
7000.50.015
(0.017)
8.80.013
(0.017)
12.59
(14.0)
18.0
(16.0)
6500.50.022
(0.023)
8.80.011
(0.012)
10.76
(11.51)
18.7 2 ̲
(11.5) 2 ̲
7000.50.022
(0.023)
8.80.011
(0.012)
10.76
(11.51)
18.7
(11.5)
IV00.50.000
(0.000)
91.20.000
(0.001)
0.08
(0.38)
0.1
(0.9)
3000.50.007
(0.009)
91.20.004
(0.004)
3.32
(3.33)
7.0
(7.1)
5500.50.015
(0.017)
91.20.009
(0.009)
6.72
(6.43)
13.8
(12.8)
6500.50.020
(0.023)
91.20.012
(0.013)
8.98
(9.09)
18.1  2 ̲
(18.7)
7000.50.020
(0.022)
91.20.012
(0.013)
8.97
(9.07)
18.1
(19.5) 
6500.50.015
(0.016)
91.20.009
(0.009)
7.01 
(6.49)
14.4
(13.8)
7000.50.015
(0.016)
91.20.009
(0.009)
7.01
(6.51) 
14.4
(13.8)
V00.50.000
(0.001)
8.80.000
(0.001)
0.07
(0.59)
0.1
(0.9)
3000.50.007
(0.009)
8.80.005
(0.006)
4.86
(5.47)
7.9
(7.5)
5500.50.015
(0.017)
8.80.010
(0.012)
9.83
(10.46)
15.6
(14.2)
6500.50.020
(0.023)
8.80.014
(0.017)
13.10
(14.67)
20.3  2 ̲
(19.0)
7000.50.020
(0.023)
8.80.014
(0.017)
13.10
(14.61)
20.3
(20.0) 
6500.50.015
(0.017)
8.80.010
(0.012)
10.04 
(10.47)
16.2
(14.9)
7000.50.015
(0.017)
8.80.010
(0.012)
10.04
(10.48) 
16.2
(14.5)
2 ̲ / 2 —The method of statistically assessing the propagation of voltage changes δ V using histograms allows for the correct indication of supply points of disturbing loads without/with a correct estimation of the rate of changes in their operating state. —Incorrect indication of the point of disturbance source supply.
Publisher’s Note: MDPI stays neutral with regard to jurisdictional claims in published maps and institutional affiliations.

