Article

Heating Performance and Ammonia Removal of a Single-Stage Bioscrubber Pilot Plant with Integrated Heat Exchanger under Field Conditions

1
Institute of Agricultural Engineering, University of Bonn, Nußallee 5, 53115 Bonn, Germany
2
Institute of Animal Science, University of Bonn, Endenicher Allee 15, 53115 Bonn, Germany
*
Author to whom correspondence should be addressed.
Energies 2021, 14(20), 6484; https://doi.org/10.3390/en14206484
Submission received: 24 August 2021 / Revised: 5 October 2021 / Accepted: 7 October 2021 / Published: 10 October 2021

Abstract

:
In this study, biological exhaust air treatment was combined with a recuperative heat exchanger in one process stage. The aim of this plant development and testing is not only to reduce ammonia from the exhaust air of pig houses but also to recover thermal energy at the same time. This is intended to offset the high operating costs of exhaust air treatment with savings of heating costs in cold seasons and to use the plant more efficiently. This system was tested for the first time under practical conditions in a pig fattening house in southern Germany. Three different assembly situations of the heat exchanger were examined for 13 days each and then compared with each other. The heating performance of the plant is primarily dependent on the outside air temperature and secondarily on the scrubbing water temperature. Depending on the assembly situation of the heat exchanger, an average heating performance of between 6.0 and 10.0 kW was observed; the amount of recovered thermal energy was between 1860 and 3132 kWh. The coefficient of performance (COP) ranked between 7.1 and 11.5. Furthermore, ammonia removal up to 64% was demonstrated. A long-term investigation of the system under practical conditions is recommended to validate the data collected in this study.

1. Introduction

In order to reduce emissions from animal husbandry, such as particulate matter, ammonia (NH3) and odor, various exhaust air treatment systems (EATS) are used in mechanically ventilated livestock buildings for pigs and poultry in practice [1,2]. The current version of the “Best Available Techniques (BAT) Reference Document for the Intensive Rearing of Poultry or Pigs” lists EATS as BAT; however, at various points, it is noted that “This technique may not be generally applicable due to the high implementation cost” [3]. Figures in the literature range from EUR 6.6 to EUR 55.9 per animal place and year in pig housing, depending on the type of EATS [1,4]. Nevertheless, construction and usage of EATS are essential in many cases in Germany, the Netherlands, and Denmark, especially in regions with a high density of livestock. In addition, EATS in Germany must be designed to treat the total required maximum exhaust air flow according to DIN 18910 [5] (cf. [3]). In this context, these systems’ high investment and operating costs lead to the requirement to reduce the total costs.
Welfare-oriented animal husbandry in mechanically ventilated barns needs a high amount of thermal energy to meet the animals’ heat requirements. To operate a livestock building with EATS more efficiently, one research approach is integrating a heat recovery unit to save thermal energy. Therefore, a new plant technology for mechanically ventilated livestock buildings is developed, which can clean exhaust air and recover heat simultaneously: the exchange scrubber. First investigations on this plant technology have already been carried out by [6]. The name exchange scrubber is a combination of the terms heat exchanger and bioscrubber. The classic bioscrubber and recuperative heat exchanger are combined in one process stage. The aim is to utilize synergy effects. On the one hand, the cleaning of the exhaust air, on the other hand, the simultaneous recovery of thermal energy for heating the supply air. As a result, heating costs and carbon dioxide emissions are to be reduced because less fossil fuels are required to heat the barn due to the heat recovery.
In previous investigations, the exchange scrubber has been tested on a small-scale pilot plant under laboratory conditions [6]. However, only the heating performance of the exchange scrubber could be evaluated, which depends primarily on the outside air and, indirectly, on scrubbing water temperature. Furthermore, this research has shown that the assembly situation of the heat exchanger unit into the bioscrubber influences the heating performance: the most effective assembly situation of the heat exchanger into the plant on laboratory scale was the position below the packing material (assembly situation C). At this assembly situation, the highest heating performance was achieved [6].
This manuscript describes the first measurements of an exchanger scrubber pilot plant under practical conditions. The objectives of this study were to examine (i) the exchange scrubber pilot plant for the first time under field conditions also considering aspects of heat recovery and exhaust air treatment additionally, (ii) which assembly situation of the heat exchanger into the bioscrubber is the best under field conditions, and (iii) the extent to which the results of the laboratory measurements [6] can be transferred to practice.

2. Materials and Methods

The experiments at the exchange scrubber pilot plant described in this manuscript were carried out from January to March 2015 on a farm in Bavaria (South Germany). The livestock building was a thermally insulated and mechanically ventilated pigsty for 960 fattening pigs. The fresh air supply of the six barn compartments, each housing 160 pigs, took place via the attic and the central corridor; the exhaust air was removed through central underfloor suction. On the gable end of the house, a recuperative air-to-air heat exchanger with a bypass for summer ventilation (as described by [7,8]) was installed to transfer thermal energy of the exhaust air to the colder incoming outside air, especially during wintertime (Figure 1). The exchange scrubber pilot plant with equipment containers was erected next to the existing heat exchanger in order to be able to carry out experiments (partial flow treatment) during the ongoing operation of the barn.

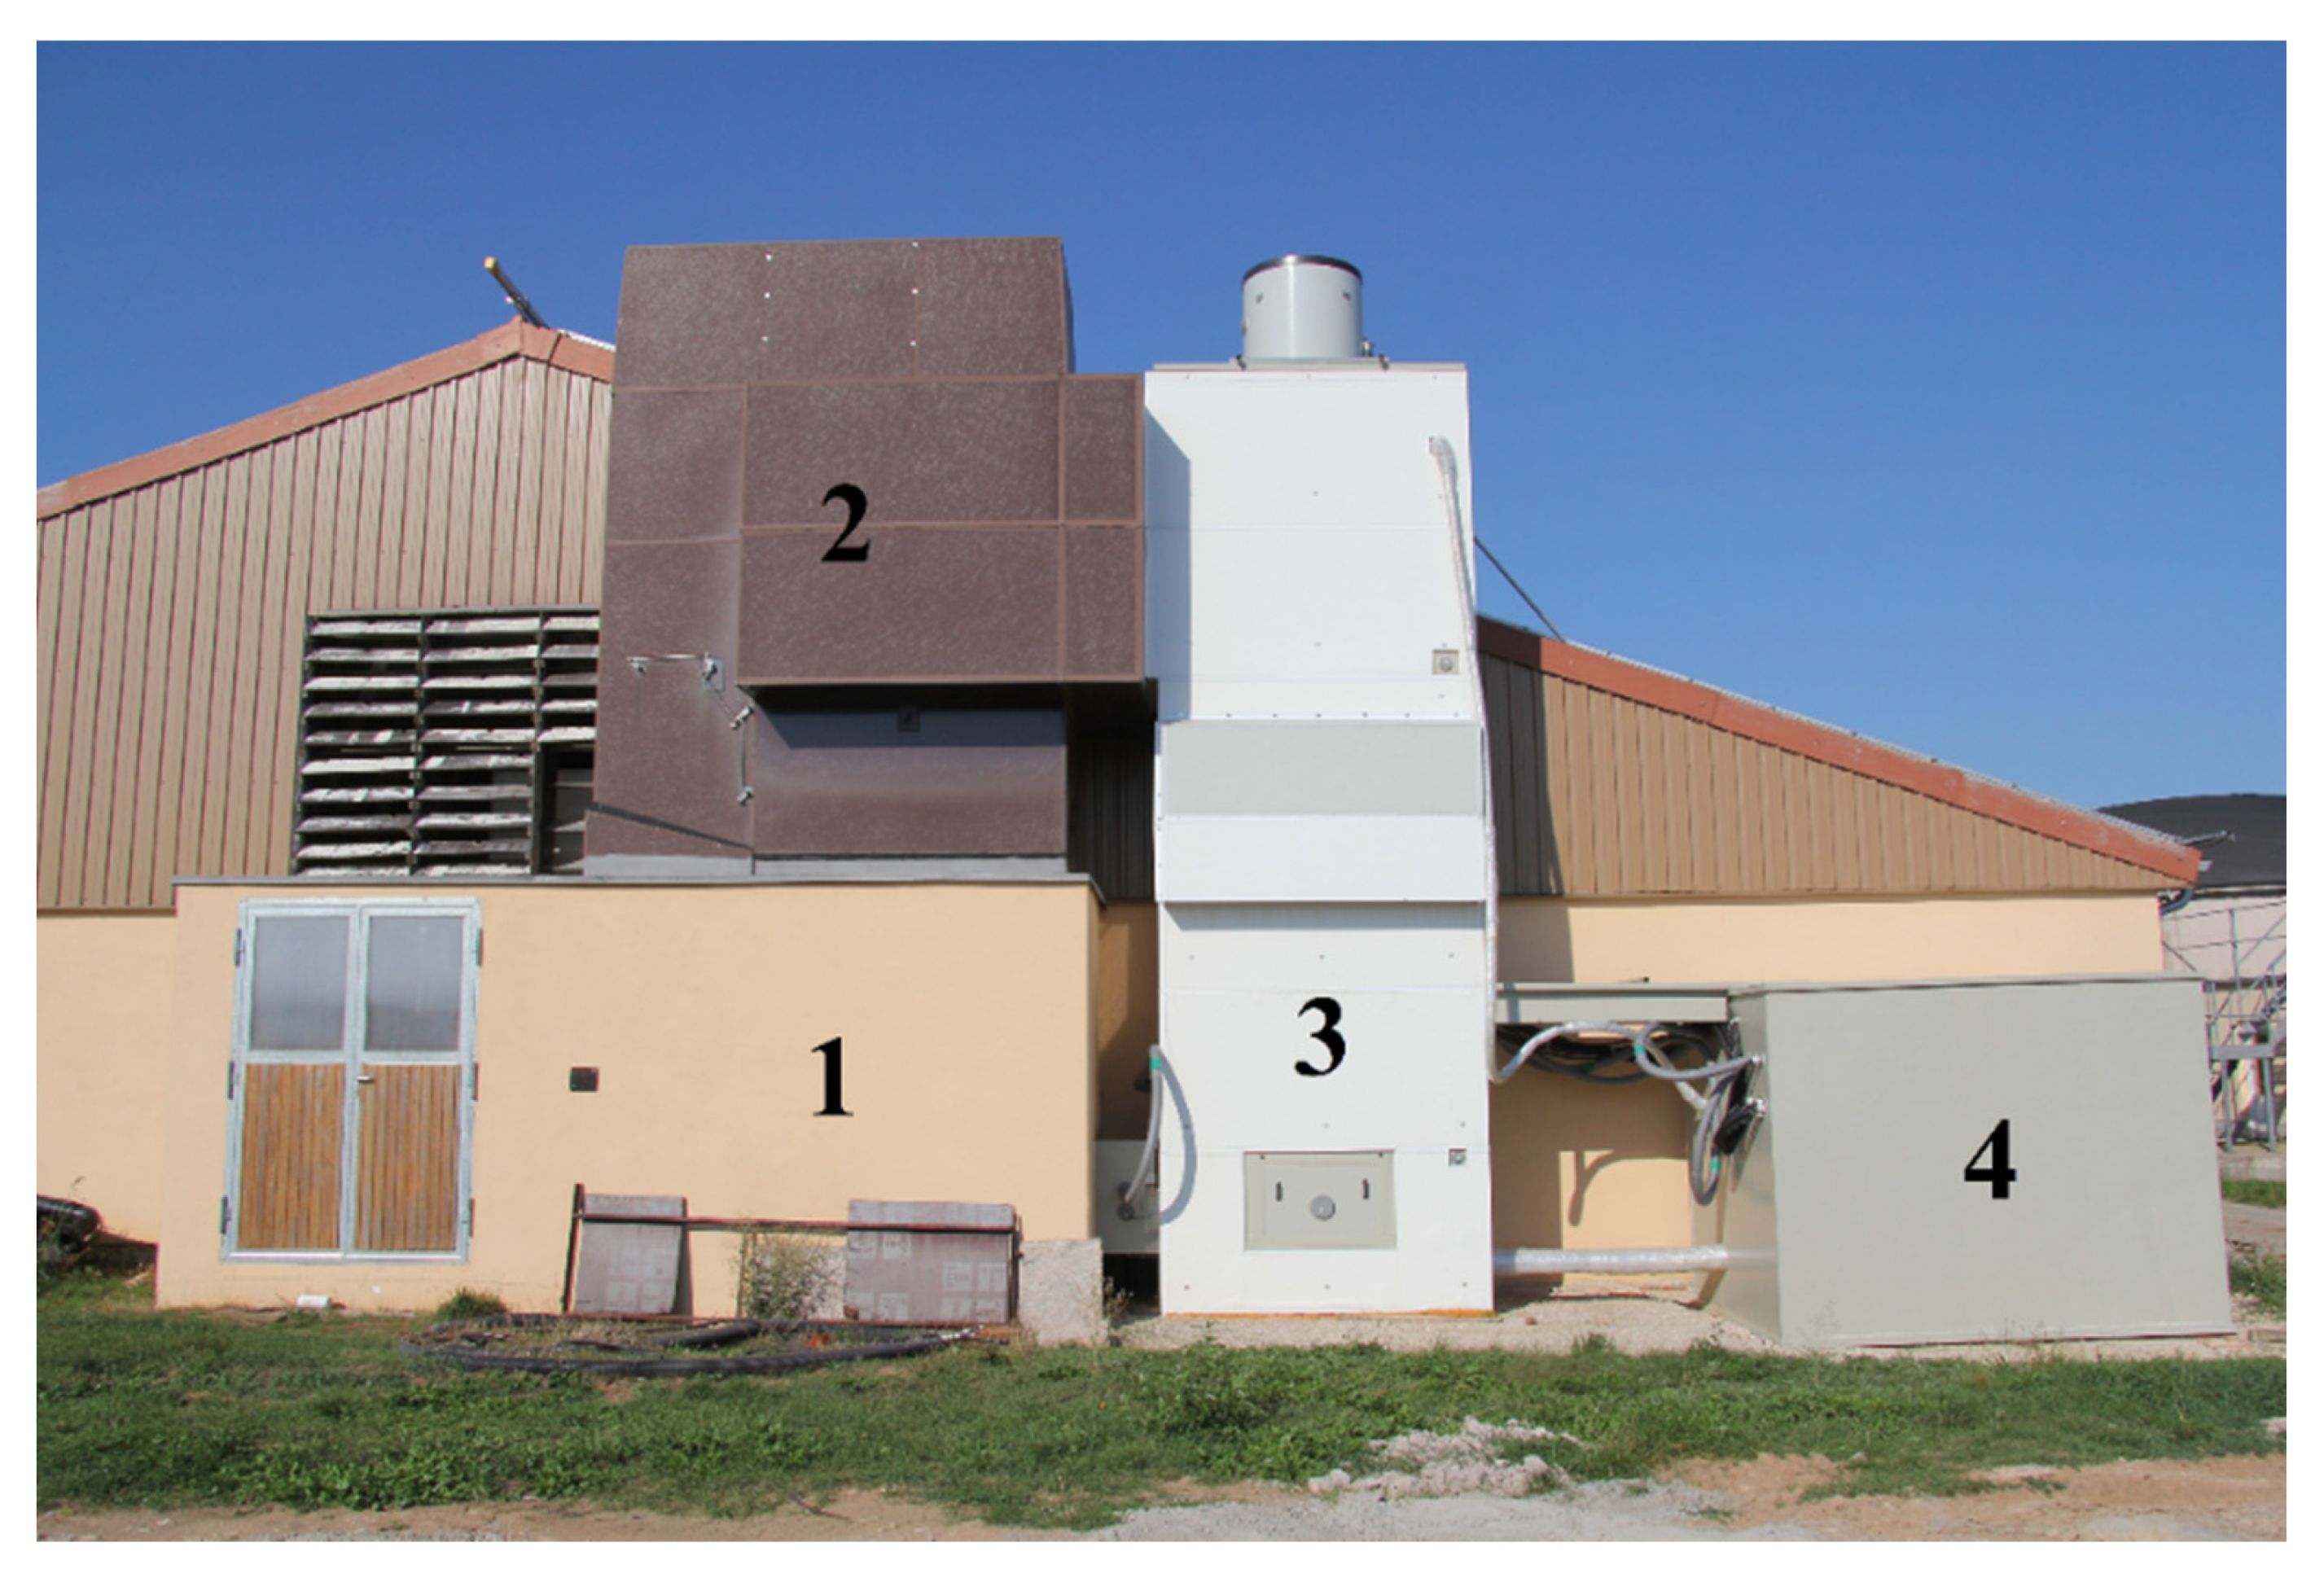
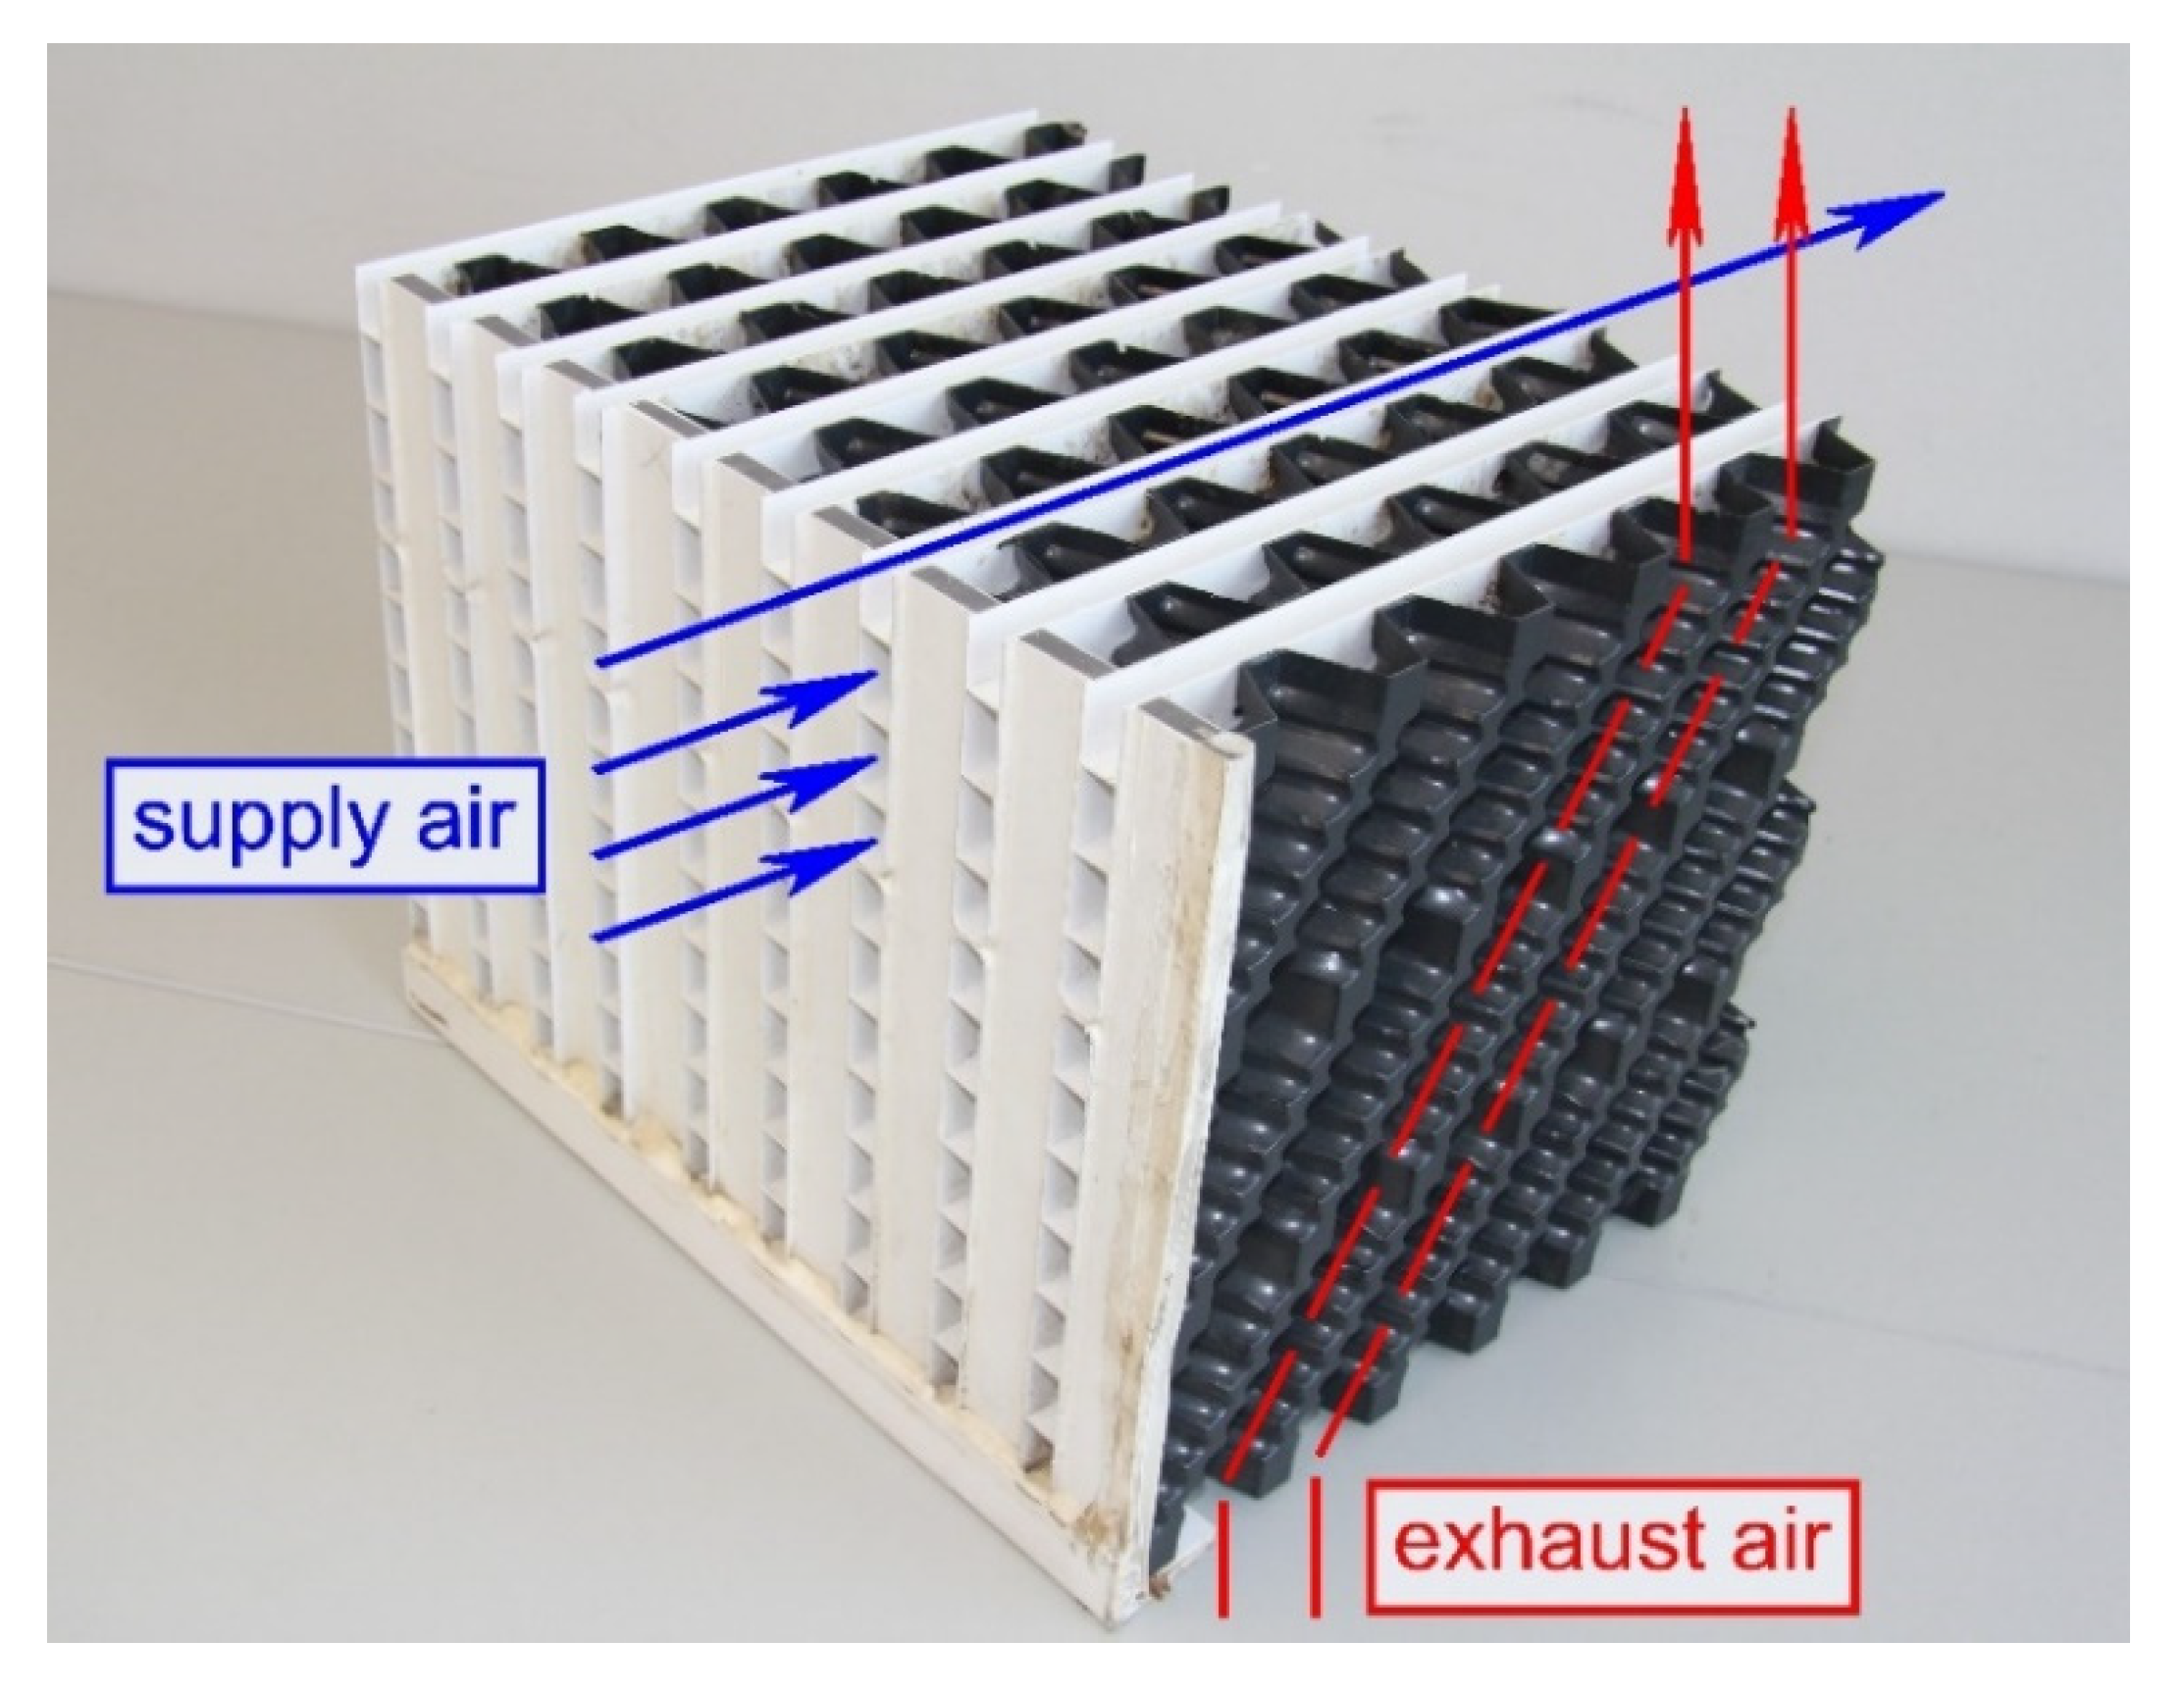
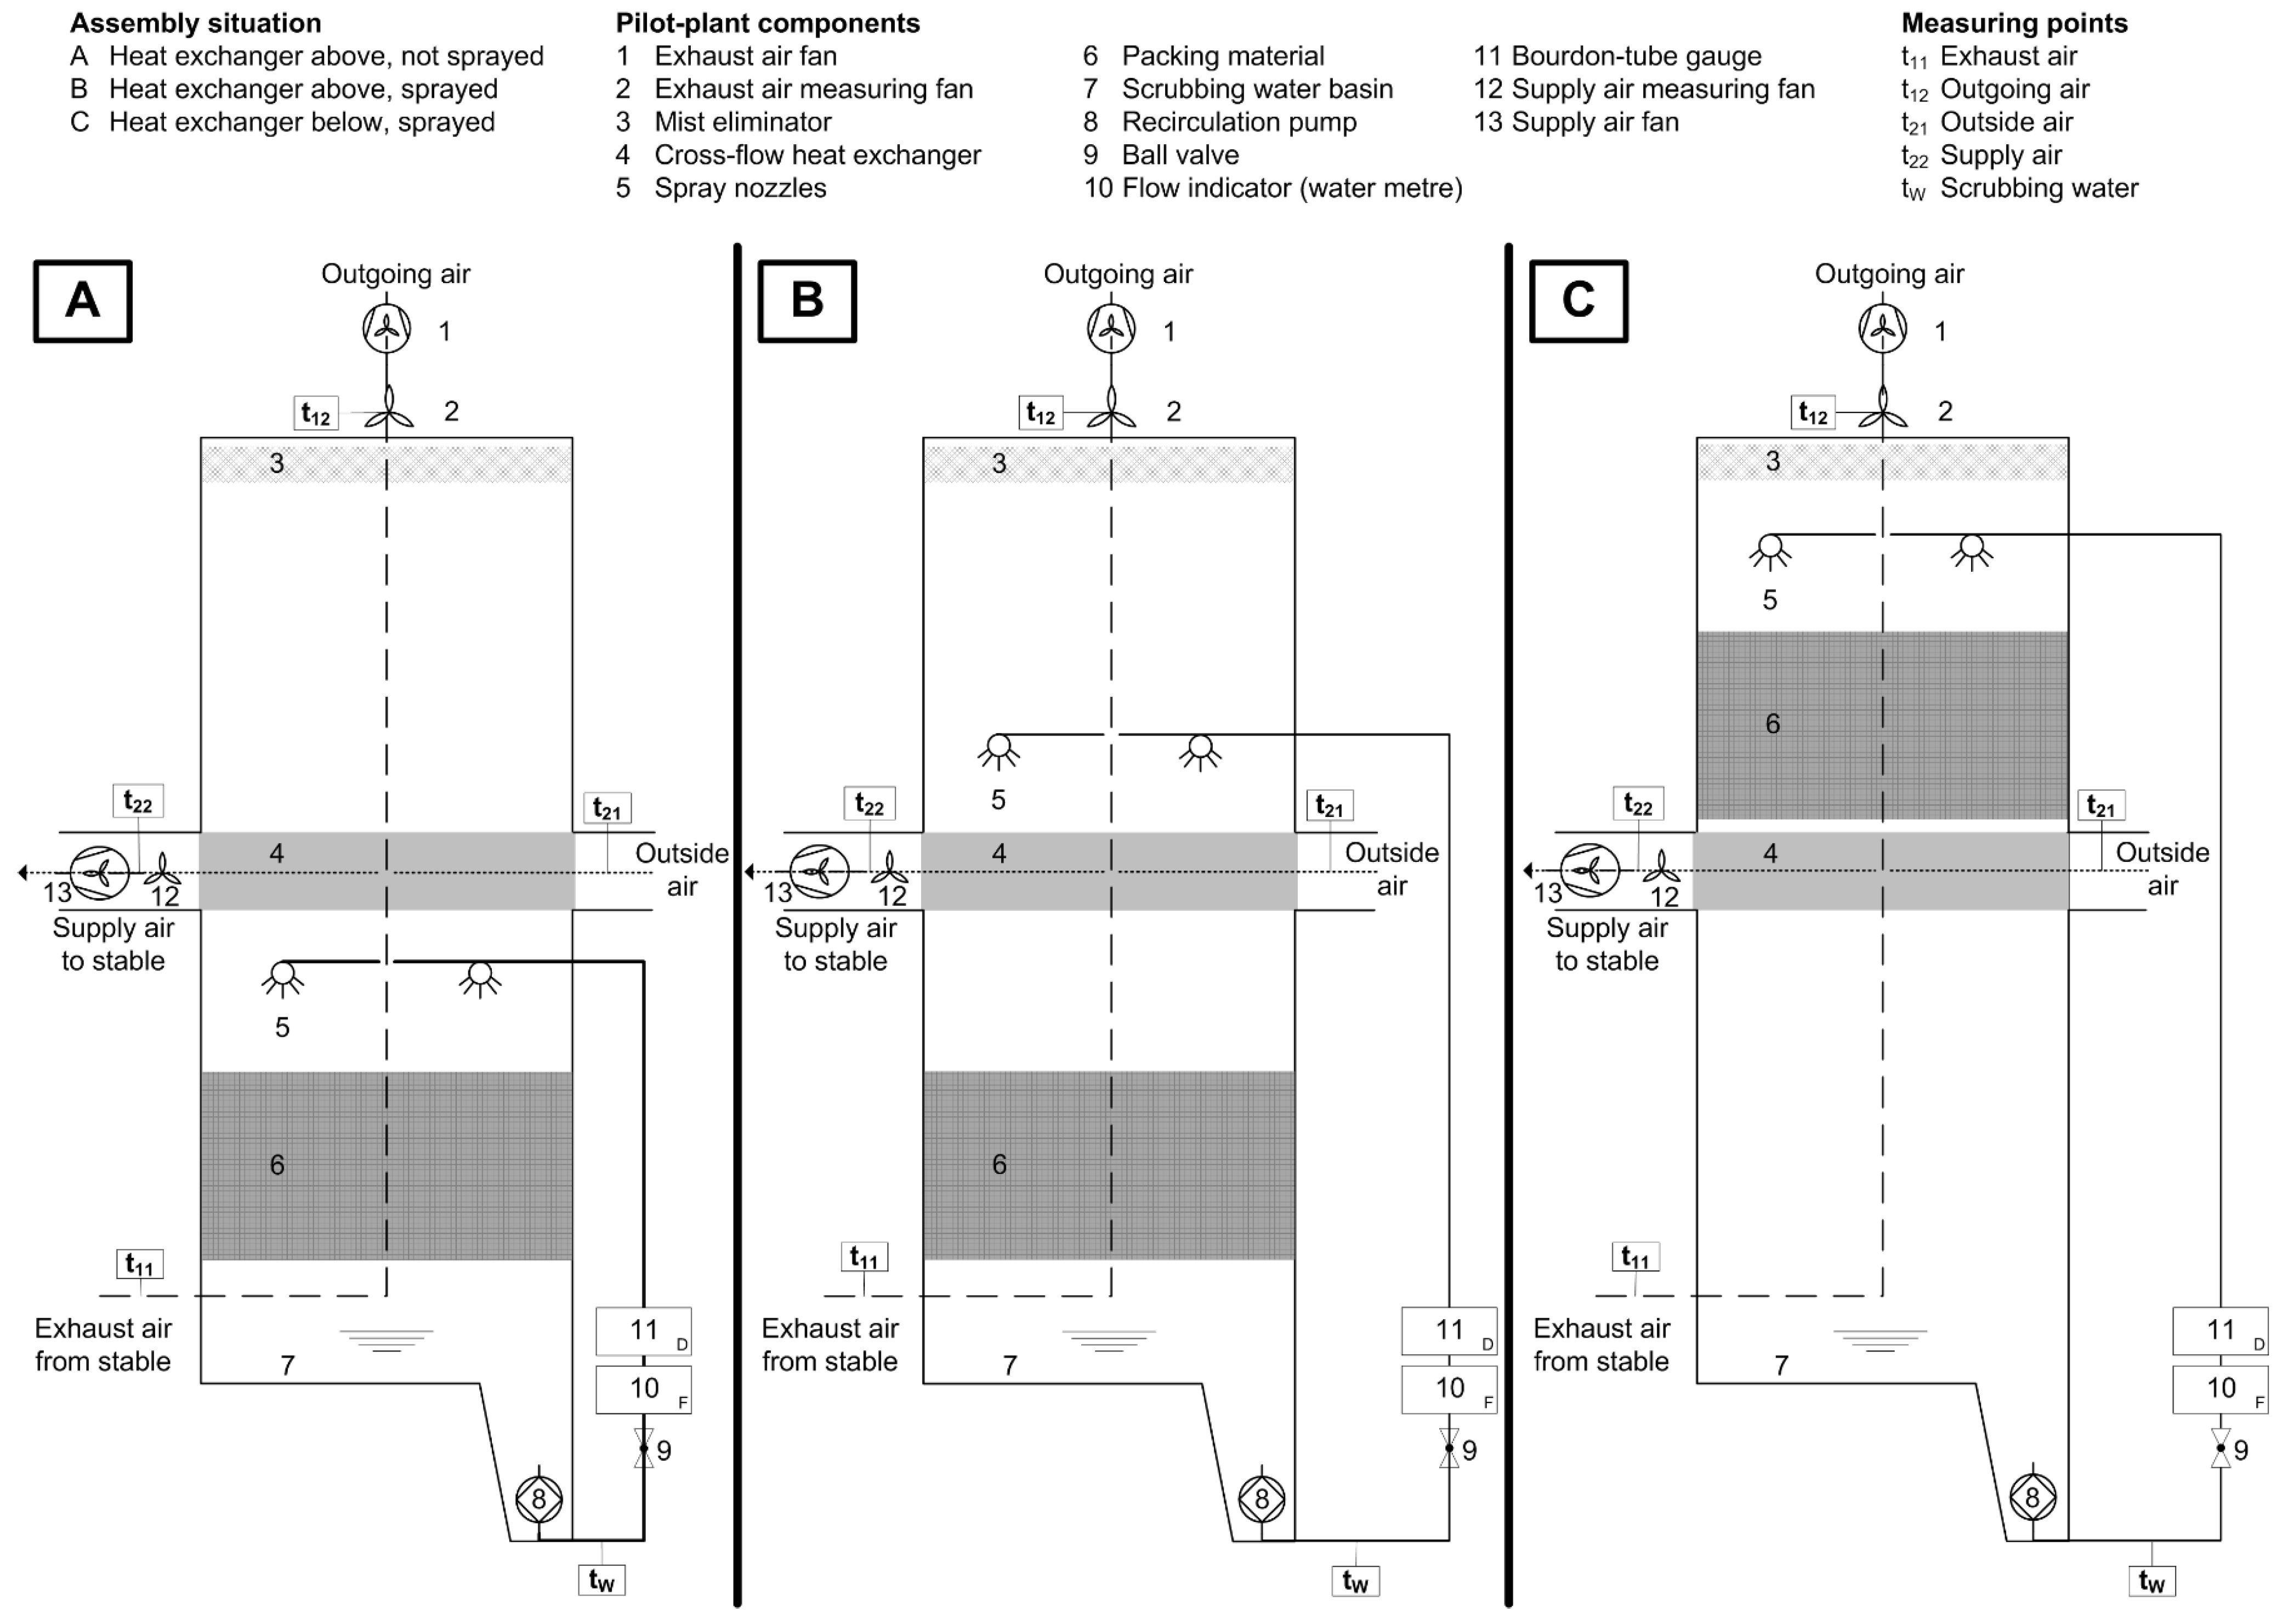
2.1. Description of the Small-Scale Exchange Scrubber Pilot Plant

The building shell of the exchange scrubber pilot plant and the equipment container shown in Figure 1 were made by double-walled polypropylene (PP) profiles (50 mm thick). The exchange scrubber itself was additionally thermally insulated with 30 mm thick glass fiber reinforced plastic-coated polystyrene. The internal floor area of the exchange scrubber was 2.3 m × 1.1 m, which results in a filter surface area of 2.53 m2. The height of the pilot plant totaled 8.3 m. The scrubbing water was collected in the floor area; the sump capacity was 0.8 m3. Exhaust and supply air fans were axial fans with a diameter of 920 mm and 650 mm, respectively (Ziehl-Abegg, Künzelsau, Germany).
Within the equipment container next to the plant (Figure 1) was the entire technology of the exhaust air treatment system (scrubbing water tank with a capacity of 0.7 m3, recirculation pump, drain pump, pH probe, probe for measuring the electric conductivity of scrubbing water, acid and alkali storage tank with dosage pump, computer with software to control the exhaust air treatment system, etc.; [9]) and the measuring equipment (computer, gas analyzer and multiplexer, vacuum pumps, etc.; cf. Section 2.8).
The bioscrubber (trickle-bed reactor) technology used has been certified for livestock buildings according to the requirements stated by [10], and was recertified in autumn 2015 by the German Agricultural Society (DLG, Deutsche Landwirtschaftsgesellschaft e.V.) for livestock buildings with central above-floor suction. According to this test report [9], this is a single-stage biological exhaust air scrubber in tower design. Three types of packing material with different specific surface areas were used; all three were made of PP: Layer 1 (0.225 m high): grid structure; layer 2 (0.3 m high): packing material with a specific surface area of 120 m2 m−3, layer 3–5 (0.9 m): packing material with a specific surface area of 240 m2 m−3. The residence time of the exhaust air in the packing material was 1.93 s at the maximum summer ventilation rate. The maximum filter surface load is 2800 m3 m−2 h−1. The packing material must be continuously sprayed with scrubbing water, whereby 0.7 nozzles per square meters of filter surface area are prescribed. The spraying density must be at least 0.9 m3 m−2 h−1. The pH of the scrubbing water shall be kept between 6.5 and 7.2. A detailed description can be found in the DLG test report No. 6284 [9].
The heat exchanger was specially designed and built for this experiment by the Schönhammer Wärmetauscher und Lüftungstechnik GmbH company (Mengkofen, Germany) and is not commercially available. The applied heat exchanger unit (2300 mm × 1100 mm × 600 mm) consists of hollow chamber profiles made of PP (external dimension of a single PP profile: 1100 mm × 600 mm × 15 mm; material thickness: 1 mm), which were arranged at a distance of 27 mm parallel to each other (Figure 2). Between the hollow chamber profiles, a crossways waveform structured sheet made of polyvinyl chloride (PVC) was used in each case. The exchange surface was 70.0 m2 in total, corresponding to a specific heat exchanger surface of 46.1 m2 m−3. The heat exchanger was a recuperative cross-flow model, i.e., outside air was sucked in horizontally through the hollow chamber profiles (laminar airflow), and exhaust air was led vertically in between the hollow chamber profiles (turbulent airflow). The heat transfer that ensued was convective over the PP hollow chamber profiles exclusively. There was no mixing of exhaust and outside air and, therefore, no moisture transfer.

2.2. Experimental Procedure

To examine which assembly situation of the heat exchanger into the bioscrubber is the best under field conditions, the exchange scrubber pilot plant has been designed so that all three assembly situations of the heat exchanger (A, B, and C; Figure 3; cf. [6]) could be investigated under field conditions. The heat exchanger module was firmly installed in the middle so that the packing material could be positioned above or below (cf. Figure 3). The scrubbing water spray nozzles could be flexibly positioned.
The basic procedure about the assembly situation of the heat exchanger into the bioscrubber is the same, as described by [6]. In assembly situation A (Figure 3), the heat exchanger was installed downstream of the exhaust air treatment; the heat exchanger module was not sprayed with scrubbing water. In assembly situation B, the heat exchanger was also installed downstream of the packing material, but was also sprayed with scrubbing water. In installation situation C, the heat exchanger was placed upstream of the packing material so that the stable exhaust air was first led through the heat exchanger and only then through the packing material; both the heat exchanger and the packing material were continuously sprayed with scrubbing water. Each assembly situation was tested subsequently for 13 consecutive days.

2.3. Measurement of Air Temperature and Humidity

Temperatures of exhaust (t11), outgoing (t12), outside (t21), and supply (t22) air, as well as scrubbing water (tW), were measured at the corresponding measuring points (Figure 3; Table A1) and recorded by a data logger at intervals of five minutes. The used temperature sensors had a positive temperature coefficient of resistance (sensor KTY81/210; measuring range −30–150 °C; NXP Semiconductors Netherlands B.V., Eindhoven, The Netherlands). Temperature sensors were calibrated before the beginning of each experimental period.
The relative humidity (RH) of exhaust (t11), outgoing (t12), outside (t21), and supply (t22) air were measured using a high-precision sensor (DOL 114; dol-sensors a/s, Roslev, Denmark). These sensors had a measuring range of 0–100% RH, with an accuracy of ±2% (40–85% RH) and ±3% (10–95% RH), respectively (Table A1). The data were recorded at intervals of five minutes.

2.4. Measurement and Calculation of Air Volume Flow

The air volume flow ( V ) ˙ of supply and exhaust air was determined by calibrated measuring fans (REVENTA® GmbH & Co. KG, Horstmar, Germany), which has been shown to be the most accurate measurement method [11] (Table A1). The diameter of the supply air measuring fan was 650 mm with a measuring range of 560–13,300 m3 h−1, as specified by the manufacturer. The measuring fan of the exhaust air had a diameter of 920 mm and a measuring range of 1220–25,190 m3 h−1, as specified by the manufacturer. Both measuring fans were installed before the fans (suction side) because this position allows the highest measurement accuracy, according to [12,13]. A data logger recorded the air volume flow in cubic meter air per hour (m3 h−1) of each measuring fan at intervals of 5 min.

2.5. Calculation of the Heating Performance

The heating performance Q ˙ H R of the exchange scrubber was calculated using the following equation (based on DIN EN 13053 [14]):
Q ˙ H R = m ˙   c p l ( t 22 t 21 ) 1000
where:
  • Q ˙ H R = heating performance of the exchange scrubber in kW
  • m ˙ = air mass flow in kg h−1
  • c p l = specific heat capacity of dry air in Wh kg−1 K−1 ( c p l = 1.005 kJ kg−1 K−1 = 0.28 Wh kg−1 K−1)
  • t21 = outside air temperature in °C
  • t22 = supply air temperature in °C

2.6. Measurement of Electricity Consumption

Electricity consumption of electric consumers (exhaust air fan, supply air fan, recirculation pump, sludge removal pump) was recorded by electronic electricity meters over each test period.

2.7. Calculation of the Coefficient of Performance

The coefficient of performance (COP) is calculated to evaluate the performance of the heat exchanger in the different assembly situations (cf. [14,15]):
C O P = Q ˙ H R P e l
where:
  • COP = coefficient of performance
  • Q ˙ H R = heating performance of the exchange scrubber in kW
  • P e l = electrical power consumption of the exchange scrubber in kW
By applying Formula (2), the amount of thermal energy transferred by the exchange scrubber (kWhth) is related to the electrical energy required by the exchange scrubber (kWhel). kWhel was measured separately for each test (Section 2.6). kWhth was calculated by multiplying the mean value of the heating performance over the entire test period of the respective assembly situation by the operating hours.

2.8. Measurement of the Ammonia Concentration of the Exhaust and Outgoing Air

The ammonia concentration of the exhaust air (raw gas) and outgoing air (clean gas) were measured to evaluate the exchange scrubber pilot plant’s cleaning performance. The measuring points correspond to the measuring points of the temperature sensors, i.e., exhaust air (t11) and outgoing air (t12) (cf. Figure 3). The gas analysis was carried out by the infrared photoacoustic measuring method [16,17] by using a photoacoustic gas monitor Innova 1412 with a multipoint sampler 1309 (LumaSense Technologies A/S, Ballerup, Denmark). The gas monitor was calibrated by the manufacturer. The detection limit for NH3 was 0.2 ppm (Table A1). The measurement setup was carried out similarly as described in detail by [18,19]: The sample air of raw gas and clean gas was sucked in continuously by two vacuum pumps (type N 816.1.2 KT.18; KNF Neuberger GmbH, Freiburg, Germany; conveying capacity at atmospheric pressure: 30 L min−1) through an insulated and heated polytetrafluoroethylene tube (8 mm external diameter, 6 mm inside diameter) and conveyed through a separate sample bottle with a volume of 0.6 L in each case. From this bottle, the sample air is sucked in by the gas monitor.
Within the 13-day measuring periods with varying assembly situations (cf. Section 2.2, Figure 3), one measuring session was carried out in each period to determine the ammonia reduction. For assembly situation A, B, and C, ammonia measurements were made for 14, 14, and 22 h, respectively (Section 3.5). The ammonia sampling frequency was a total of 60 per hour, i.e., 30 values per hour each were available for exhaust air (t12) and outgoing air (t12).
The stabilization of the scrubbing water pH was carried out by desludging of contaminated scrubbing water and refilling fresh water. During the experiments, no sulfuric acid or alkaline components were added.

2.9. Measurement of Scrubbing Water

During each of the three test periods (A, B, and C), a scrubbing water sample was taken of the buffer tank during the ammonia measurements, which has been analyzed in the laboratory for pH-value and electric conductivity as well as the contents of nitrite nitrogen (NO2-N), nitrate nitrogen (NO3-N), and ammonium nitrogen (NH4+-N).

2.10. Measurement Data Analysis

The data analysis and result presentation were done using Microsoft Office Professional 2013 (Microsoft Corporation, Redmond, Washington, DC, USA) and Microsoft Office Professional Plus 2019 (Microsoft Corporation, Redmond, Washington, DC, USA), as well as IBM SPSS Statistics 24 (International Business Machines Corporation Armonk, New York, NY, USA). Figure 3 was created with Microsoft Office Visio 2007 (Microsoft Corporation, Redmond, Washington, DC, USA).
Outside air temperature and air mass flow both have a major influence on the heating performance of the heat exchanger (cf. Equation (1)). Depending on the assembly situation of the heat exchanger, the temperature of the scrubbing water is also essential [6]. Therefore, for the direct comparison of the three assembly situations described in Section 3.3, only datasets that meet the following criteria have been used:
  • Outside air temperature (t21):     −3 °C ≤ t21 ≤ +3 °C.
  • Air mass flow ( m ˙ ):         3500 kg h−1 m ˙ ≤ 4500 kg h−1.
  • Scrubbing water temperature (tW):  12.5 °C ≤ tW ≤ 16.5 °C.
The data were checked for standard distribution (Kolmogorov–Smirnov test) and variance homogeneity (Levene test). The tests showed that the data were not normally distributed, and the homogeneity of the variance was not given. Therefore, the Kruskal–Wallis test was performed to determine statistically significant differences in the heating performance of the heat exchanger between the three different assembly situations of the heat exchanger. Subsequently, the post hoc tests (Dunn–Bonferroni test) were used to determine which of the three assembly situations differed significantly, whereby differences with p ≤ 0.05 were considered statistically significant.

3. Results and Discussion

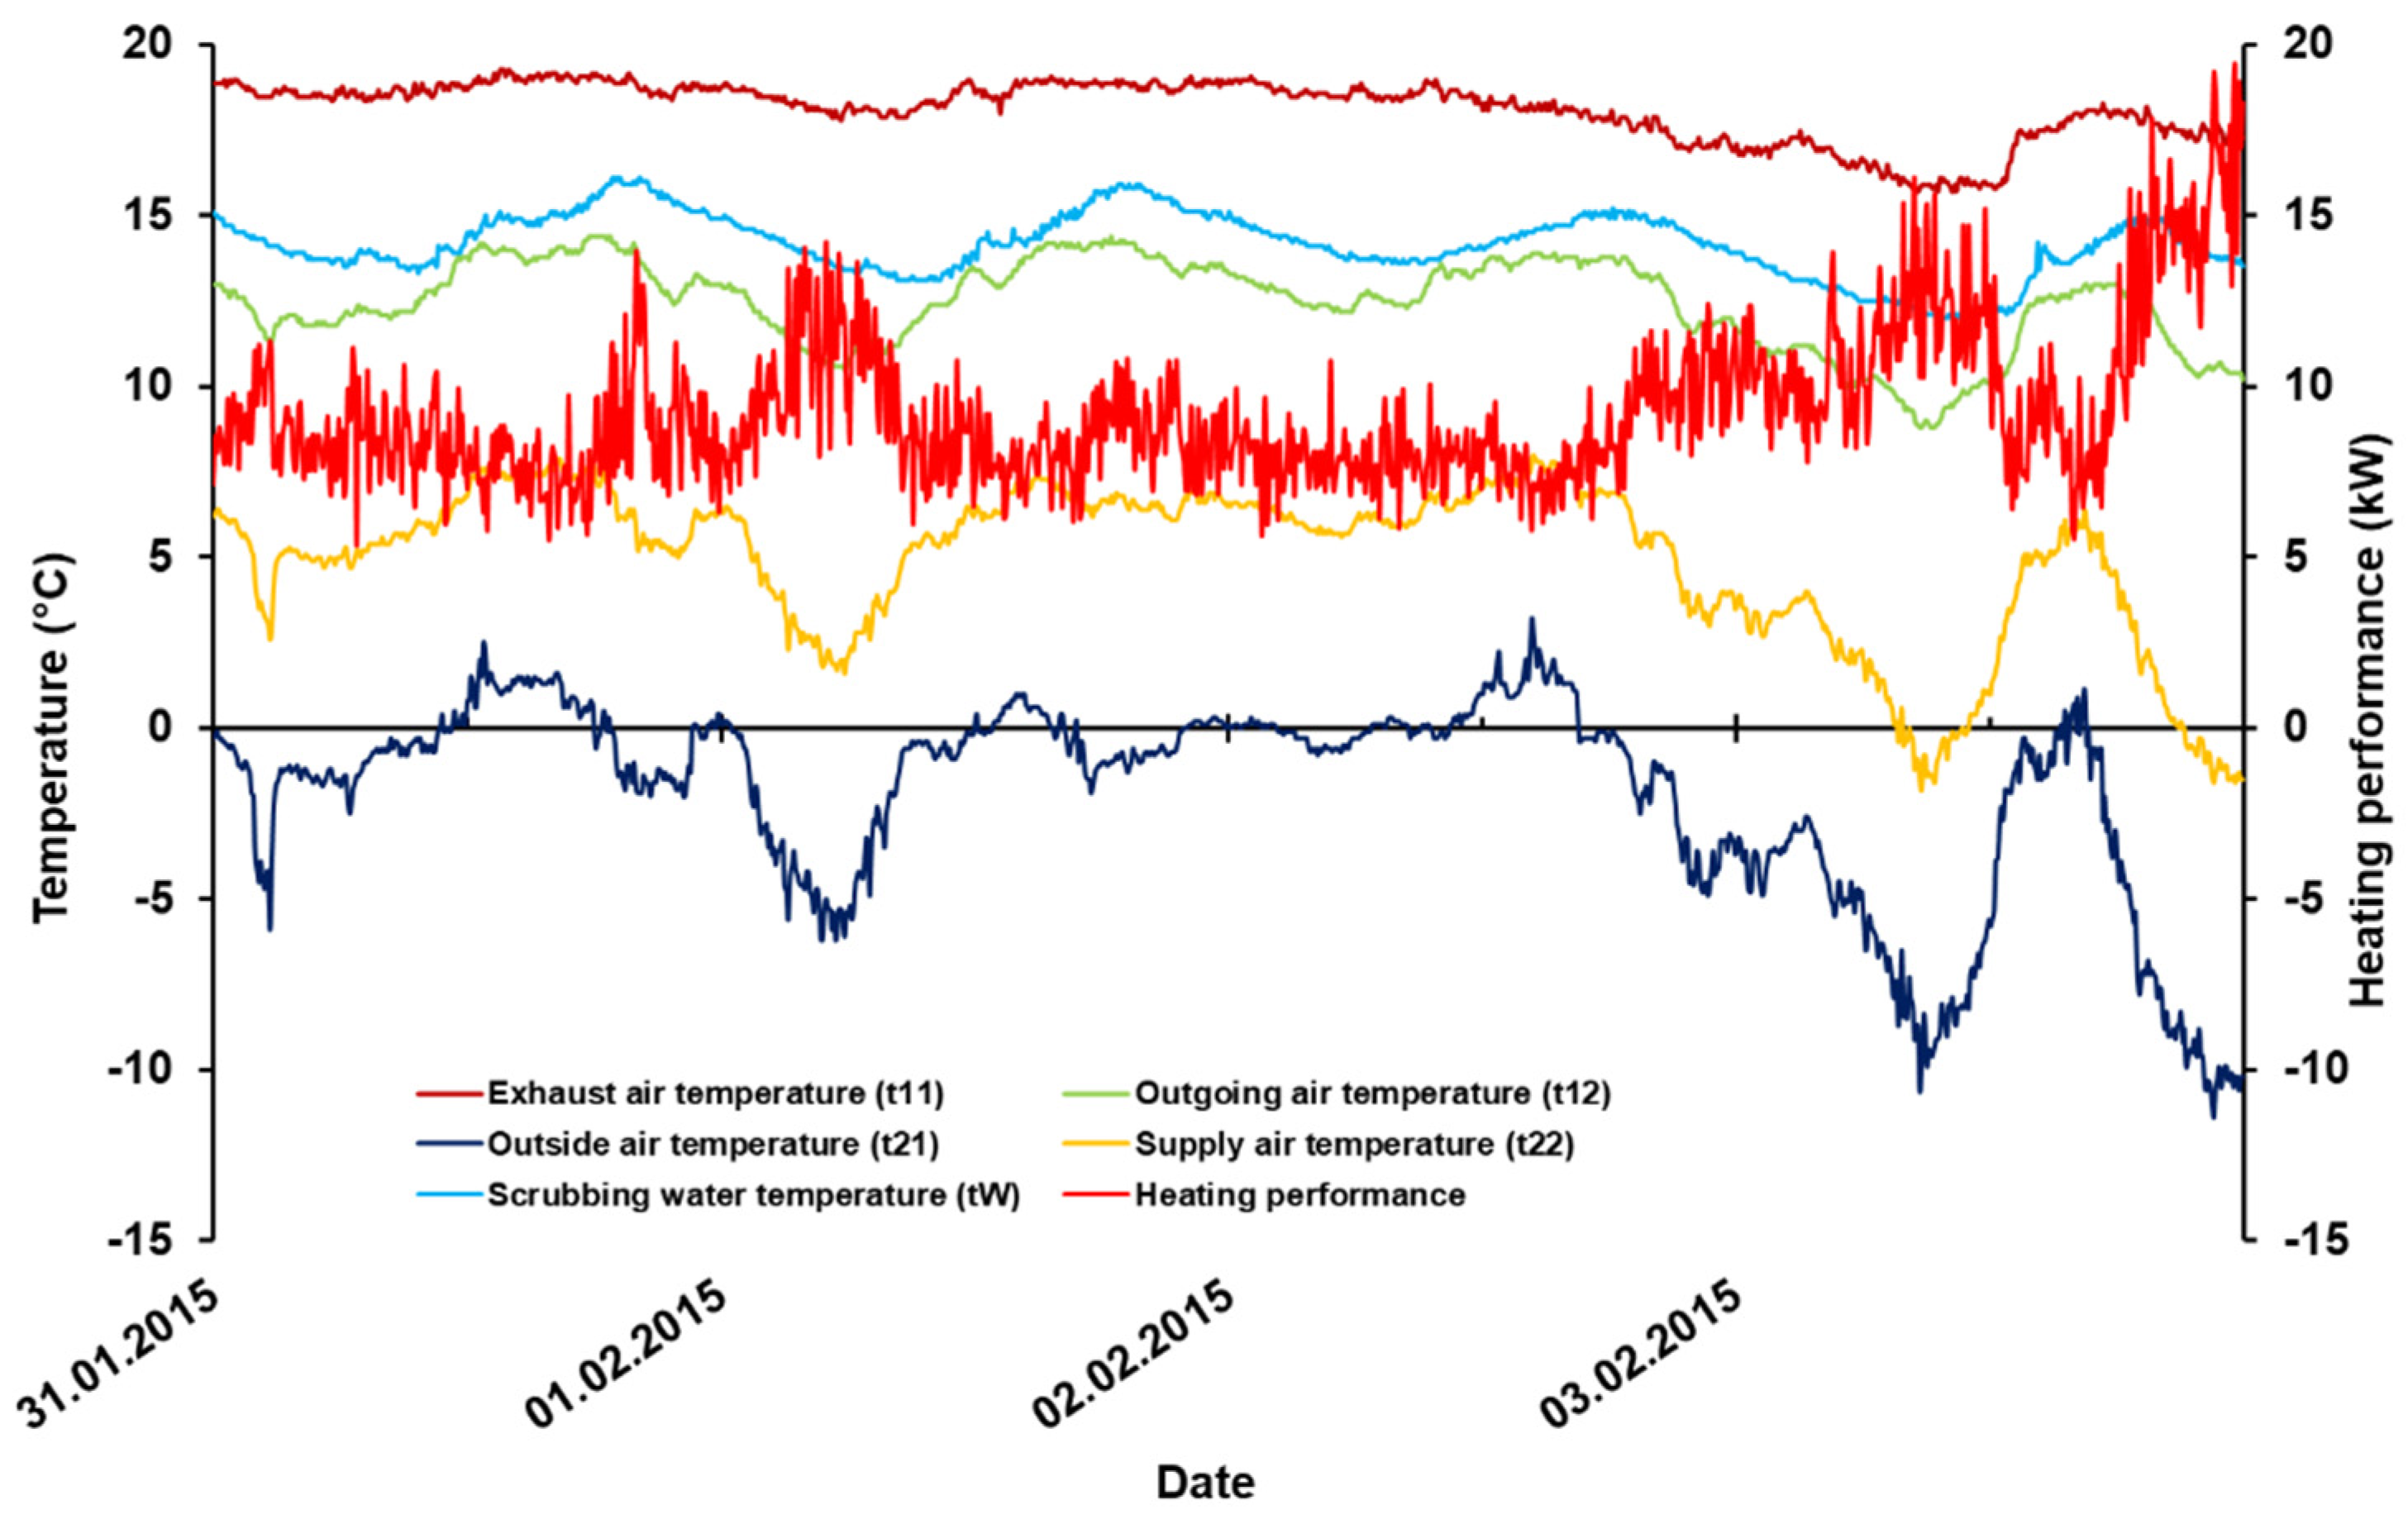
3.1. Temperature Profiles and Heating Performance

The temperature profiles of exhaust air, outgoing air, outside air, supply air and scrubbing water, and heating performance of the exchange scrubber pilot plant are shown as an example for four days with heat exchanger assembly situation A in Figure 4. In this period shown, exhaust air entered the pilot plant at an average of 18.1 °C and 72.3% RH and left it with an average of 12.4 °C and 100% RH. As a result, exhaust air was cooled by 5.7 °C. The high air humidity of the outgoing air is explained by the scrubbing water and has been described by other authors [6,9,20,21]. The average temperatures of outgoing air (12.4 °C) and scrubbing water (14.1 °C) were close together. This fact was also observed in own preliminary tests on the exchange scrubber pilot plant under laboratory conditions [6]. The average outside (t21) and supply (t22) air temperatures and its relative humidity in Figure 4 were −1.9°C and RH 84.7% as well as 4.9 °C and RH 62.0%. Thus, incoming outside air was warmed up by an average of 6.8 °C by passage through the heat exchanger unit. Additionally, the relative humidity of incoming air decreased by heating because no moisture transfer by the heat exchanger is possible (cf. Section 2.1). The maximum preheating effect shown in Figure 4 was 9.8 °C at an outside air temperature of 11.4 °C. At this time, the heating performance was 19.1 kW. The average heating performance of the exchange scrubber pilot plant was 9.3 kW; the supply air mass flow averaged 4809 kg h−1.

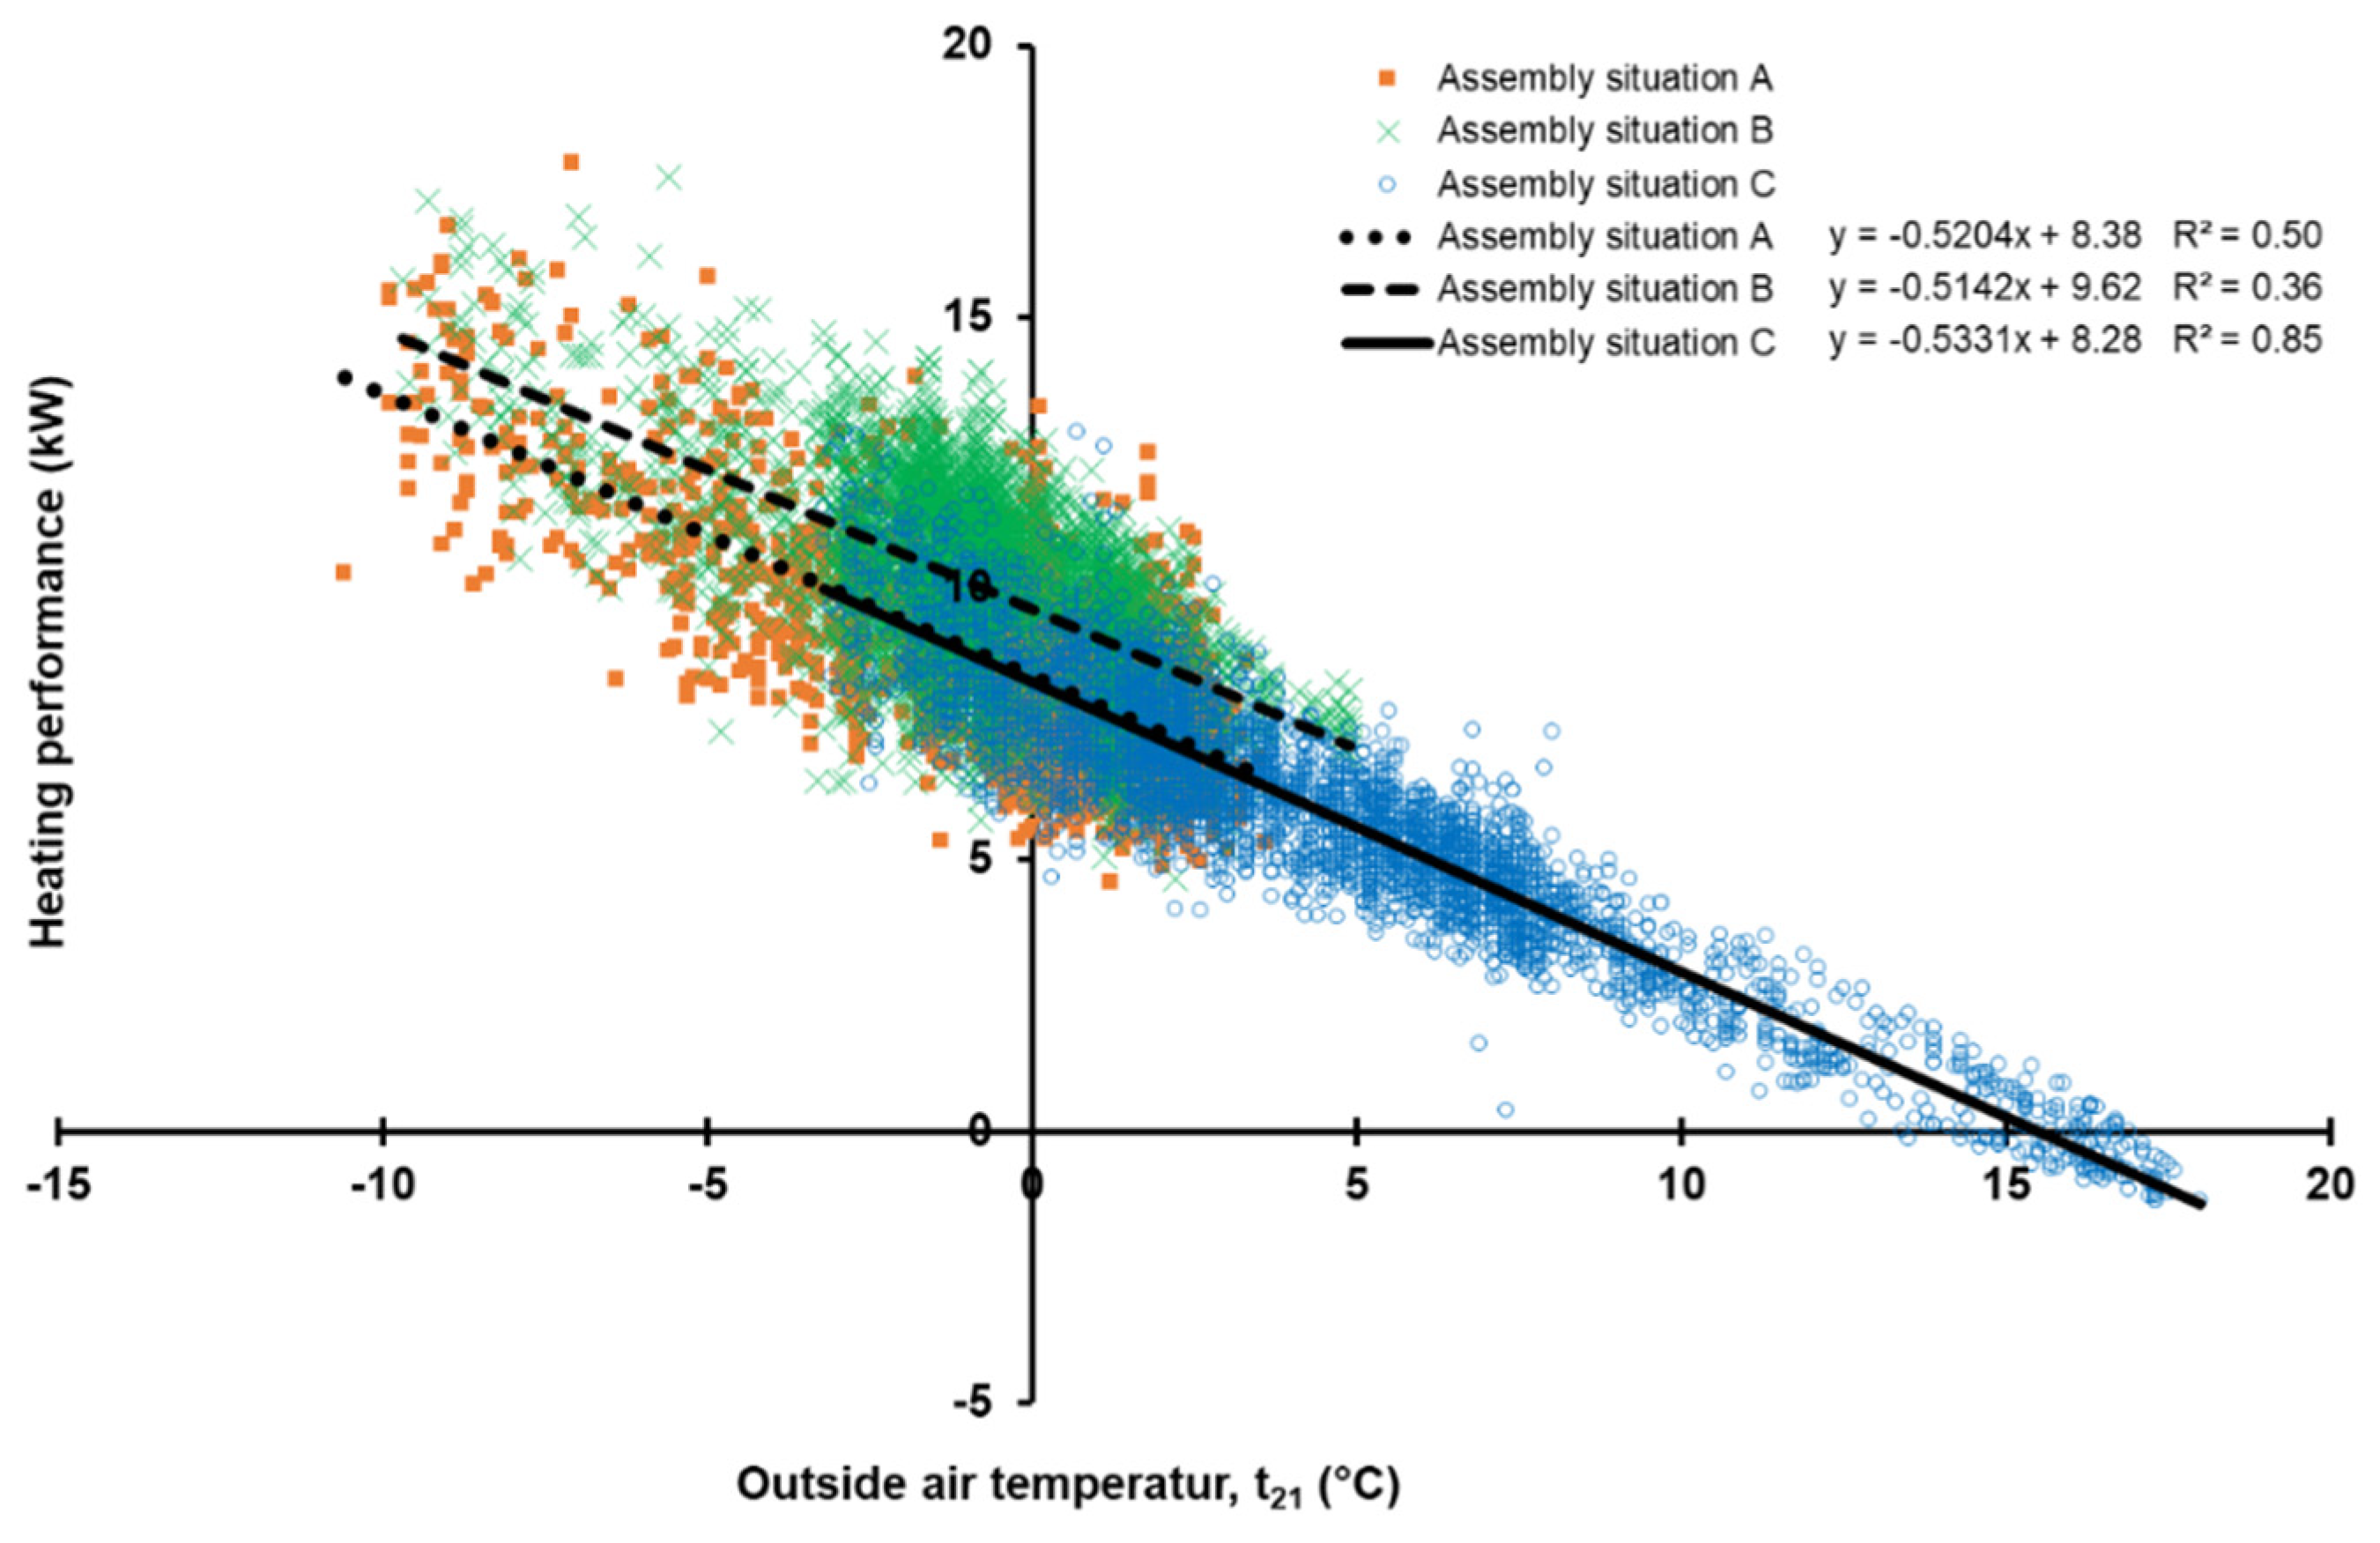
3.2. Influence of Outside Air and Scrubbing Water Temperature on Heating Performance

The laboratory tests of the exchange scrubber pilot plant have shown a close correlation between the heating performance of the exchange scrubber and the temperatures of outside air and scrubbing water—independent of the assembly situation of the heat exchanger [6]. This correlation is confirmed by the experiments under field conditions described in this manuscript: as the outside air temperature decreases, the heating performance increases, and vice versa (cf. Figure 4). This relationship is visible in Figure 5 for all three tested assembly situations of the heat exchanger. However, the coefficient of determination R2 for the assembly situations A, B, and C at 0.50, 0.36, and 0.85 is not as uniformly high as for the measurements on the laboratory scale, where R2 was greater than 0.90 in all tested assembly situations [6].
Figure 5 also shows an interesting fact: at an outside air temperature of 15.5 °C and higher, heating performance falls within the range of negative values. Usually, a performance in the physical sense cannot be negative (cf. [22]). The explanation for this lies in the calculation of the heating performance Q ˙ H R using Equation (1). If t22 > t21, then Q ˙ H R takes on a value > 0 and is thus a heating performance of the exchange scrubber. All values above the abscissa in Figure 5 indicate a heating performance. If t22 < t21, then Q ˙ H R takes on a value < 0, and is therefore to be understood as a cooling performance. These are the values below the abscissa in Figure 5. In this case, warm incoming outside air is cooled by the heat exchanger module. If t22 = t21, there is no heating or cooling performance. This area is called neutral temperature [22]. In Figure 5, the neutral temperature of the exchange scrubber (assembly situation C) is indicated by the intersection of the regression line with the abscissa, i.e., at 15.5 °C. This temperature range corresponds to the average temperature range of the scrubbing water of the exchange scrubber. Thus, it is confirmed the relationship stated by [6] that the performance of the exchange scrubber depends not only on the outside air temperature but also on the scrubbing water temperature. Even in the experiments under practical conditions, the performance of the exchange scrubber pilot plant can be displayed as a function of the temperature difference between scrubbing water and outside air (ΔtW–t21) (Figure 6).
Since the performance of the exchange scrubber depends not only on the outside air but also on the scrubbing water, possible heat losses from the exchange scrubber system should be avoided. The scrubbing water temperature depends on the amount and temperature of fresh water supplied to the system, the wastewater removed from the system by the sludge removal pump, the air volume flows and the associated energy supply and extraction, and the heat losses via the components. Therefore, the authors recommend thermal insulation of the water-enclosing components to reduce heat losses, especially in the winter months, and thus improve the heating performance.
The measurements of the exchange scrubber pilot plant under practical conditions showed that the supply air heating and heating performance due to the heat exchanger are significantly dependent on the outside air and scrubbing water temperature. The cool outside air is heated by the passage of the heat exchanger to the temperature level of scrubbing water. For outside air temperatures below the scrubbing water temperature (t21 < tW), it is valid that the lower the outside air temperature, the greater the supply air heating and the higher the heating performance. At outside temperatures above the scrubbing water temperature (t21 > tW), cooling effects were detected.

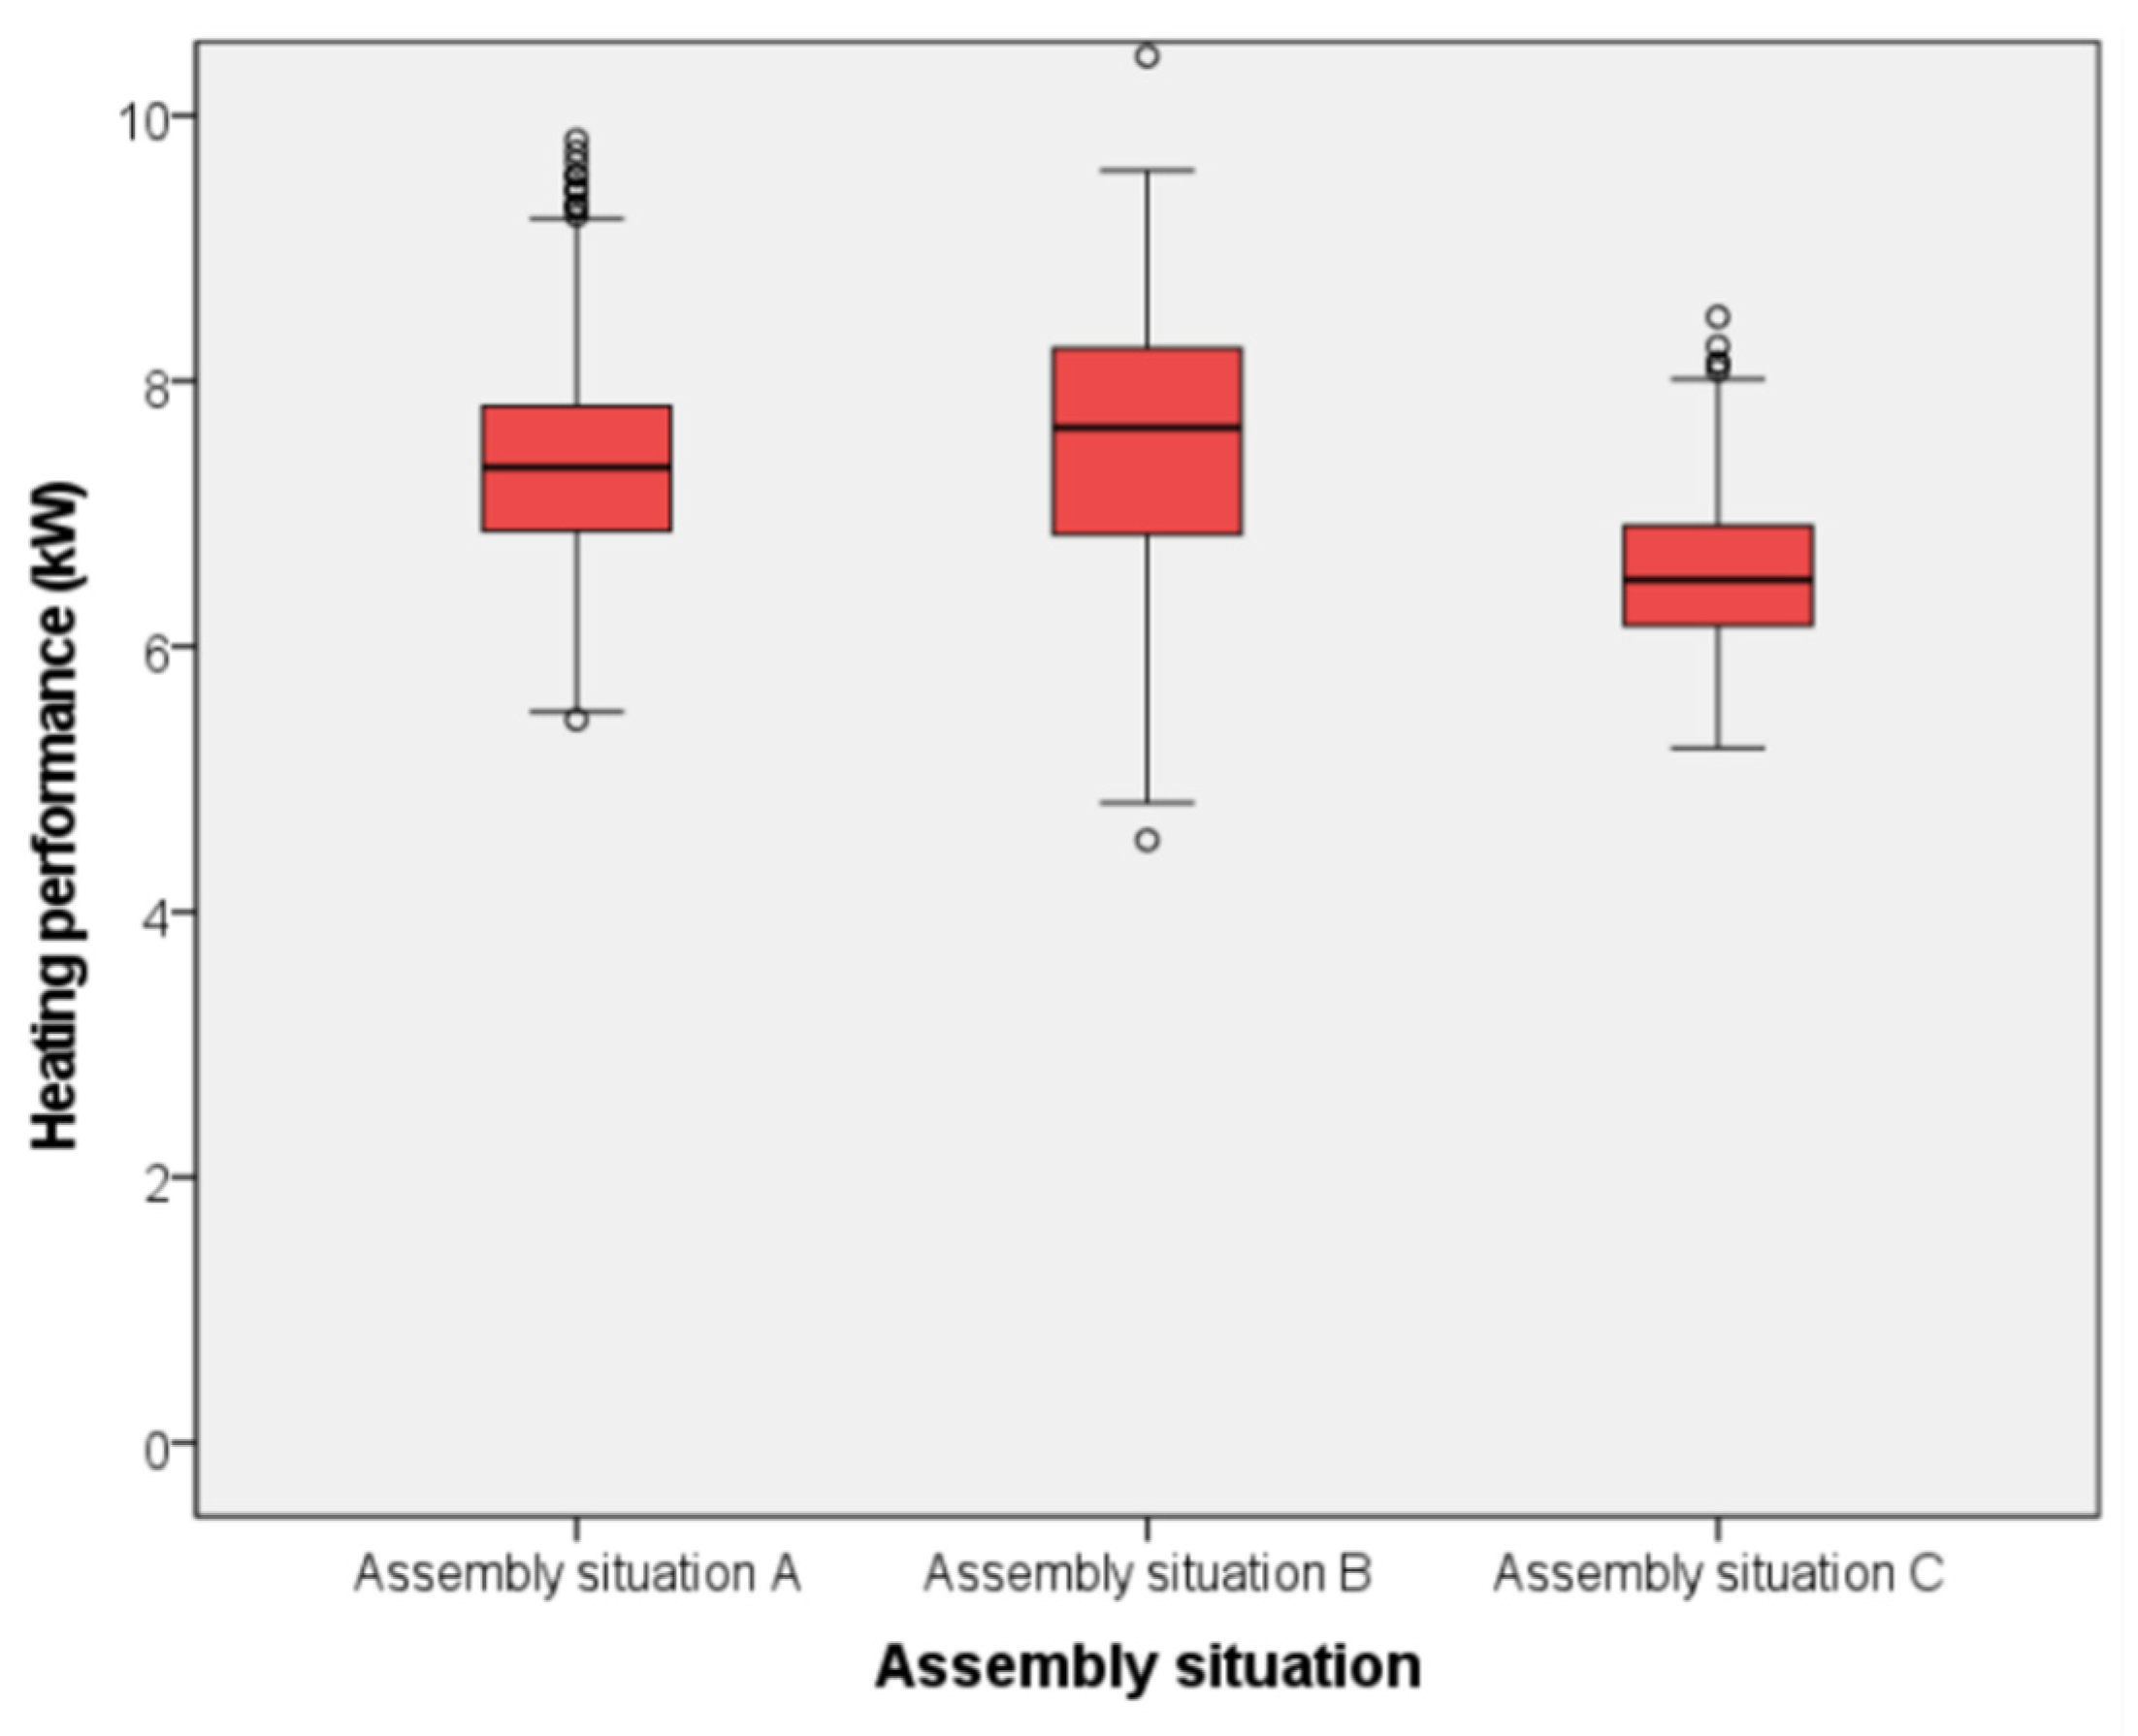
3.3. Most Effective Assembly Situation of Heat Exchanger

In order to be able to evaluate the assembly situations A, B, and C of the heat exchanger, only the data sets of the outdoor air temperature range from −3 to 3 °C were used, because only here were data from all three assembly situations available (cf. Figure 5). Further criteria were the air mass flow and the temperature of scrubbing water (Section 2.10).
Figure 7 shows the comparison of the heating performance of the heat exchanger for all three tested assembly situations. Assembly situation B achieved the highest heating performance with an average of 7.5 kW, closely followed by assembly situation A (7.3 kW). With an average of 6.5 kW, assembly situation C was 13% below the performance level of assembly situation B. The Kruskal–Wallis test confirms that the heating performance of the heat exchanger depends on the assembly situation of the heat exchanger in the pilot plant (p < 0.001). Subsequent post hoc tests (Dunn–Bonferroni test) showed that all three assembly situations differ significantly from each other: assembly situation B and assembly situation A (z = −4.640; p < 0.001), assembly situation C and assembly situation A (z = 17.908; p < 0.001), and assembly situation C and assembly situation B (z = 20.309; p < 0.001). However, according to Cohen [23], the calculation of the effect size showed that the effect of B to A (r = −0.099) is only an extremely weak effect. This contrasts with a moderately strong effect for the assembly situations C to A (r = 0.424) and a strong effect for the assembly situations C to B (r = 0.558).
Overall, it is concluded that the highest heating performance of the heat exchanger can be expected in assembly situation B. This is where the laboratory and practical measurements differ. In the laboratory study (clean exhaust air, no stable air), the exchange scrubber with assembly situation C achieved the highest heating performance [6]. The advantage of assembly situation B over C in practical conditions is that the exhaust air is already cleaned of dust when it passes through the heat exchanger (cf. Figure 3), and thus no dust deposits are expected on the surface of the heat exchanger [24,25,26]. Such dust deposits could not be detected during the tests for assembly situations A and B. Furthermore, the heat exchanger in assembly situation B is continuously sprinkled with scrubbing water, which does not apply to assembly situation A. On the one hand, this has a permanent cleaning effect on the heat exchanger surface, and, on the other hand, the thermal energy of the scrubbing water is also used for supply air heating. The latter is also the case in assembly situation C, but the uncleaned stable air passes first through the heat exchanger module and only second through the packing for cleaning the exhaust air (Figure 3). As a result, bound dust and biofilm, among other things, are deposited on the surface of the heat exchanger. This, in turn, leads to a reduction in the heat transfer through the heat exchanger foil [25,27], and thus the heating performance decreases while the operating parameters otherwise remain the same. This also explains why the overall heating performance in the practical experiment was below that of assembly situation B (Figure 5 and Figure 7). For these practical reasons, we recommend assembly situation B in the future.

3.4. Energy Efficiency

In order to evaluate the exchange scrubber more independently of the operating conditions, the coefficient of performance (COP) was calculated, which provides information about the energy efficiency (Section 2.7). The data required for the calculation of the COP are presented in Table 1.
The electricity consumption of all electricity consumers is similar in all three cases. This was expected as the tests were carried out under the same operating conditions and the same number of test days. The data shown in Table 1 refers to the entire data set of the trial period of 13 days for each assembly situation. Assembly situation B shows the highest value with a COP of 11.5, followed by 9.9 for assembly situation A and 7.1 for assembly situation C. This clearly shows that the exchange scrubber not only has a better heating performance in the variant comparison (Section 3.3), taking into account a small data set with clearly defined criteria in the assembly situation B of the heat exchanger but also has a better performance in terms of the COP based on the entire data set.
All three COP values of this study (Table 1) are lower than the COP of heat exchangers in other scientific studies. For example, Rösmann [28] demonstrated a COP of 15.8 of an air-to-air heat exchanger in piglet rearing in a one-year trial period. The German Agricultural Society has examined two different models of heat exchangers in piglet rearing and poultry fattening, and a COP of 20 was determined for both heat exchangers [7,29]. However, a comparison of the COP between the studies is only of limited use, as varying environmental factors (e.g., duration of the test period, varying fresh air temperatures) and technical differences (e.g., air volume flow, operating settings and design of the heat exchangers) influence the COP. Nevertheless, it appears to the authors that the possibilities of the exchange scrubber have not yet been exploited. The performance of the heat exchanger can certainly be increased by optimizing the geometry of the heat exchanger. In particular, a significantly higher heat transfer can be expected if the supply air is not guided through hollow chamber profiles (laminar flow) in the future—as in this study—but through cross-wave honeycomb structures (turbulent flow). This not only influences the air flow but also increases the exchange surface. If necessary, the total volume of the heat exchanger can also be increased.
Even though the COP of the exchange scrubber was below that of individual air-to-air heat exchangers described by [7,28,29], the COP in all three assembly situations is nevertheless significantly above that of other sustainable heating technologies used in pig farming. Recent studies of heat pumps in pig barns in Germany and Korea report COPs in the range of 2.5–3.4 for groundwater heat pumps [30] and 4.1–5.4 for a ground source geothermal heat pump [31], respectively.
The COP can also be used to estimate the economic efficiency of a system individually. At current market prices in Germany, one kilowatt-hour of electricity costs about four times more than the kilowatt-hour of thermal energy. This means that the exchange scrubber is imputed worthwhile if the COP is greater than 4.0. This applies to all three assembly situations (Table 1). The use of the exchange scrubber in winter can reduce the energy consumption of an entire barn system because the heat recovery system reduces the need for fossil fuels to heat the livestock building. This has an overall positive effect on the sustainability of pig farming by lowering the carbon footprint. However, further research under operating conditions with higher air volume flows and warmer outside air temperatures is required.

3.5. Ammonia Removal Efficiency of Exchange Scrubber Pilot Plant

The results of the ammonia measurements of raw gas and clean gas are shown in Table 2 for all three tested assembly situations. The ammonia removal efficiency of the exchange scrubber pilot plant was, on average, between 44% and 64%. This was lower than expected; the DLG reported an ammonia removal efficiency of the exhaust air treatment technology used for the exchange scrubber of more than 70% [9]. This is because the exchange scrubber pilot plant, which was put into operation in the middle of December 2014, was still in the run-in period when the measurements were started. This means that the microbiology in the scrubbing water and on the surface of the packing material was still developing, which is reflected in a reduced removal efficiency. This is supported by the fact that ammonia removal efficiency increases over time from 44% in early February to 57% in mid-February, up to 64% at the beginning of March (Table 2). According to Decius et al. [32], a stable biological equilibrium within the exhaust air treatment system is essential, which is only achieved after a certain run-in period of some weeks (cf. [9,33,34]). These authors point out how complex and sensitive microbiology is within exhaust air treatment systems: even small changes in pH, temperature, and nutrient supply can cause considerable effects.
In this study, the pH of scrubbing water was higher than the pH target value (recommendation for this plant of 6.5 ≤ pH ≤ 7.2 (cf. [9])) during the test period (Table A2). In the literature, an optimum working pH range for scrubbing water in a bioscrubber is reported to be from 6.5 to 7.5 [1,2,20]. Furthermore, Table A2 shows that the ammonium and nitrite content of scrubbing water was too high in relation to the nitrate content. This suggests that nitrification was inhibited (cf. [35]), which is also visible in the lower ammonia removal efficiency.
The scrubbing water temperatures during the test period were 14.8 °C ± 0.8 °C (range 12.1 °C–16.7 °C) for assembly situation A, 14.4 °C ± 0.8 °C (range 12.2 °C–16.6 °C) for assembly situation B, and 12.6 °C ± 1.1 °C (range 10.3 °C–16.6 °C) for assembly situation C. A study by Hahne [20], in which 154 bioscrubbers in Germany were investigated, reported an average scrubbing water temperature of 18.6°C and a range of 10.6–25.2 °C. It becomes clear that the range of scrubbing water temperatures corresponds to the data of the study by [20]. However, depending on the assembly situation of the heat exchanger, the scrubbing water temperature in the exchange scrubber was 4.2 to 6.4 °C lower than Hahne’s figures. This is attributed to the heat exchanger in the bioscrubber, which extracts thermal energy from the scrubbing water and transfers it to the fresh air. Nevertheless, the scrubbing water temperatures are still in an acceptable range for the microorganisms (cf. [1]).
To summarize, the microbiology in the bioscrubber was still in the run-in period, the pH was slightly elevated, nitrite concentration was too high, and the scrubbing water temperature was in the (lower) normal range. At this stage, we suspect that the first three factors have a greater influence on ammonia removal than the temperature of the scrubbing water. Additional long-term studies with improved operating parameters could clarify to what extent the influence of the scrubbing water temperature (heat recovery) has a positive or negative influence (e.g., solubility of ammonia, temperature optimum of the microorganisms) on the ammonia removal and the activity of the microorganisms.

4. Conclusions

The main objective of this study was to examine the exchange scrubber pilot plant for the first time under field conditions, also considering aspects of heat recovery and exhaust air treatment, and which assembly situation of the heat exchanger into the bioscrubber is the most efficient under field conditions. Based on this study, we recommend using the exchange scrubber with heat exchanger assembly situation B because this is the best assembly situation in terms of performance and process technology. The cold incoming fresh air is preheated by the exchange scrubber, which, on the one hand, has a positive effect on the climate in the animals’ living area. The heating performance depends on the outside air temperature and scrubbing water temperature. On the other hand, thermal energy is recovered that would otherwise have left the barn unused. This reduces the use of primary energy sources for heating the barn. This is seen as positive for various reasons: reduction in heating costs (economic), conservation of fossil energy sources (sustainability), and avoidance of CO2 emissions (environmental). In order to increase the use of thermal energy, it is recommended to insulate the building shell of the exchange scrubber (including base plate and scrubbing water tank) to reduce heat loss through the building shell. According to the current state of research, the integrated heat exchanger module does not appear to have a negative impact on ammonia removal. For a stronger validation of the results, the exchange scrubber should be examined over a longer period.

5. Patents

This plant technology is patented under the Patent No. EP1815902, 20.09.2007.

Author Contributions

Conceptualization: M.S.K. and W.B.; methodology: M.S.K. and W.B.; software: M.S.K.; validation: M.S.K., H.F.D. and H.L.; formal analysis: M.S.K. and H.L.; investigation: M.S.K.; resources: W.B.; data curation: M.S.K., H.F.D. and H.L.; writing—original draft preparation: M.S.K.; writing—review and editing: M.S.K., H.F.D., H.L. and W.B.; visualization: M.S.K.; supervision: W.B.; project administration: M.S.K. and W.B.; funding acquisition: W.B. All authors have read and agreed to the published version of the manuscript.

Funding

The project was supported by the Federal Ministry of Food and Agriculture (BMEL) based on a decision of the Parliament of the Federal Republic of Germany via the Federal Office for Agriculture and Food (BLE) under the innovation support programme (funding code 28-1-75.011-11). The APC was funded by the Open Access Publication Fund of the University of Bonn.

Institutional Review Board Statement

Not applicable.

Informed Consent Statement

Not applicable.

Data Availability Statement

The datasets used and/or analyzed during the current study are available from the corresponding author on reasonable request.

Acknowledgments

We give thanks to Johann Schönhammer and Martin Schönhammer (Schönhammer Wärmetauscher und Lüftungstechnik GmbH, Mengkofen, Germany) for their technical support and help during the entire project. Furthermore, we wish to thank Sophia Kellner, J. Carolina L. Strohmaier and Alexander J. Schmithausen (then Institute of Agricultural Engineering, University of Bonn, Germany) as well as the farm manager and the staff of the farm on which the research were carried out for supporting the experiments. We would also like to thank Manfred Trimborn (Institute of Crop Science and Resource Conservation and Institute of Agricultural Engineering, University of Bonn, Germany) for analysis of the scrubbing water samples.

Conflicts of Interest

The authors declare no conflict of interest. The funders had no role in the design of the study; in the collection, analyses, or interpretation of data; in the writing of the manuscript; or in the decision to publish the results.

Appendix A

Table A1. Overview of the measurement parameters, sensor types used, measurement ranges, measurement accuracy and the corresponding measurement points. Unless otherwise stated, the measuring ranges and measuring accuracies are according to the manufacturer’s specifications.
ParameterSensor TypeUnitMeasuring RangeMeasuring AccuracyMeasuring Point
TemperatureKTY81/210°C−30–+150±3%t11, t12, t21, t22, tW
Relative humidityDOL 114%0–100±2% (40–85% RH)
±3% (10–95% RH)
t11, t12, t21, t22
Air volume flow (supply air)Measuring fan Reventa 650m3 h−1560–13,300<5% (a)t22
Air volume flow (exhaust air)Measuring fan Reventa 920m3 h−11220–25,190<5% (a)t12
AmmoniaGas monitor
Innova 1412
ppm0.2–20002–3%t11, t12
(a) Specification according to Calvet et al. [11].
Table A2. Nitrite, nitrate and ammonium content as well as electric conductivity and pH of the scrubbing water.
Assembly Situation of Heat ExchangerNO2-NNO3-NNH4+-NElectric
Conductivity
pH-Value
(mg L−1)(mg L−1)(mg L−1)(mS cm−1)(-)
A69612229115.27.7
B139971178313.17.6
C9687611599.17.6

References

  1. Arends, F. Exhaust Air Treatment Systems for Animal Housing Facilities: Techniques—Performance—Costs; Grimm, E., Ed.; KTBL: Darmstadt, Germany, 2008; ISBN 3939371602. [Google Scholar]
  2. Van der Heyden, C.; Demeyer, P.; Volcke, E.I. Mitigating emissions from pig and poultry housing facilities through air scrubbers and biofilters: State-of-the-art and perspectives. Biosyst. Eng. 2015, 134, 74–93. [Google Scholar] [CrossRef]
  3. EC. Best Available Techniques (BAT) Reference Document for the Intensive Rearing of Poultry or Pigs: Industrial Emissions Directive 2010/75/EU (Integrated Pollution Prevention and Control) [Online]. 2017. Available online: http://publications.jrc.ec.europa.eu/repository/bitstream/JRC107189/jrc107189_01_irpp_bref_07_2017.pdf (accessed on 24 September 2021).
  4. Wagner, S.; Angenendt, E.; Beletskaya, O.; Zeddies, J. Costs and benefits of ammonia and particulate matter abatement in German agriculture including interactions with greenhouse gas emissions. Agric. Syst. 2015, 141, 58–68. [Google Scholar] [CrossRef]
  5. DIN 18910. Wärmeschutz Geschlossener Ställe—Wärmedämmung und Lüftung—Planungs- und Berechnungsgrundlagen für Geschlossene Zwangsbelüftete Ställe; Beuth Verlag: Berlin, Germany, 2017; (DIN 18910:2017-08). [Google Scholar]
  6. Krommweh, M.S.; Büscher, W. Heating performance of a laboratory pilot-plant combining heat exchanger and air scrubber for animal houses. Sci. Rep. 2021, 11, 6872. [Google Scholar] [CrossRef] [PubMed]
  7. DLG. Luft-Luft-Wärmetauscher WVTL 480. Wärmerückgewinnungseffizienz unter Praxisbedingungen. Schönhammer GmbH: DLG-Prüfbericht 5971F, 2011. Available online: https://pruefberichte.dlg.org/filestorage/pbdocs/5971F.pdf (accessed on 24 September 2021).
  8. Rösmann, P.; Büscher, W. Rating of an air-to-air heat exchanger in practise. Landtechnik 2010, 65, 418–420. [Google Scholar] [CrossRef]
  9. DLG. 1-stufiger biologischer Abluftwäscher System RIMU für die Schweinehaltung: RIMU—Agrartechnologie GmbH: DLG-Prüfbericht 6284. 2015. Available online: http://www.dlg-test.de/tests/6284.pdf (accessed on 24 September 2021).
  10. Hahne, J.; Schirz, S.; Schumacher, W. Leitfaden des Landkreises Cloppenburg zur Feststellung der Eignung von Abluftreinigungsanlagen in der Tierhaltung zur Anwendung in der Genehmigungspraxis und bei der Überwachung. 2002. Available online: https://lkclp.de/uploads/files/ara_leitfaden_zur_feststellung_der_eignung_mit_anlage.pdf (accessed on 24 September 2021).
  11. Calvet, S.; Gates, R.S.; Zhang, G.; Estellés, F.; Ogink, N.W.; Pedersen, S.; Berckmans, D. Measuring gas emissions from livestock buildings: A review on uncertainty analysis and error sources. Biosyst. Eng. 2013, 116, 221–231. [Google Scholar] [CrossRef] [Green Version]
  12. Maghirang, R.G.; Liu, Y.; Chung, D.S. Evaluation of a freely rotating impeller to measure fan airflow rates in livestock buildings. Trans. ASAE 1998, 41, 819–824. [Google Scholar] [CrossRef]
  13. Büscher, W.; Neser, S.; Gronauer, A. Messmethoden zur Luftvolumenstromermittlung in zwangsbelüfteten Ställen. In Messmethoden für Ammoniak-Emissionen aus der Tierhaltung; KTBL, Ed.; Landwirtschaftsverlag: Münster-Hiltrup, Germany, 2001; pp. 110–121. ISBN 3-7843-2130-5. [Google Scholar]
  14. DIN EN 13053. Ventilation for Buildings—Air Handling Units—Rating and Performance for Units, Components and Sections, German version EN 13053:2019; Beuth Verlag: Berlin, Germany, 2020. [Google Scholar]
  15. VDI 3803-5. Air-Conditioning, System Requirements. Part 5: Heat Recovery Systems (VDI Ventilation Code of Practice); Beuth Verlag: Berlin, Germany, 2013. [Google Scholar]
  16. Hassouna, M.; Robin, P.; Charpiot, A.; Edouard, N.; Méda, B. Infrared photoacoustic spectroscopy in animal houses: Effect of non-compensated interferences on ammonia, nitrous oxide and methane air concentrations. Biosyst. Eng. 2013, 114, 318–326. [Google Scholar] [CrossRef]
  17. Li, H.; Zhang, C.; Xin, H. Performance of an Infrared Photoacoustic Single Gas Analyzer in Measuring Ammonia from Poultry Houses. Appl. Eng. Agric. 2015, 31, 471–477. [Google Scholar] [CrossRef] [Green Version]
  18. Schmithausen, A.J.; Trimborn, M.; Büscher, W. Methodological Comparison between a Novel Automatic Sampling System for Gas Chromatography versus Photoacoustic Spectroscopy for Measuring Greenhouse Gas Emissions under Field Conditions. Sensors 2016, 16, 1638. [Google Scholar] [CrossRef] [PubMed] [Green Version]
  19. Schmithausen, A.J.; Schiefler, I.; Trimborn, M.; Gerlach, K.; Südekum, K.-H.; Pries, M.; Büscher, W. Quantification of Methane and Ammonia Emissions in a Naturally Ventilated Barn by Using Defined Criteria to Calculate Emission Rates. Animals 2018, 8, 75. [Google Scholar] [CrossRef] [PubMed] [Green Version]
  20. Hahne, J. Eigenkontrolle und Überwachung von Abluftreinigungsanlagen in der Schweinehaltung: Self-monitoring and control of exhaust air treatment systems in pig keeping. In 14. Tagung Bau Technik und Umwelt in der Landwirtschaftlichen Nutztierhaltung, Proceedings of the 14th Conference Construction, Engineering and Environment in Livestock Farming, Bonn, Germany, 24–26 September 2019; KTBL, Ed.; Kuratorium für Technik und Bauwesen in der Landwirtschaft: Darmstadt, Germany, 2019; pp. 15–20. ISBN 9783945088692. [Google Scholar]
  21. Ogawa, H.; Dahl, P.; Suzuki, T.; Kai, P.; Takai, H. A microbiological-based air cleaning system using a two-step process for removal of ammonia in discharge air from a pig rearing building. Biosyst. Eng. 2011, 109, 108–119. [Google Scholar] [CrossRef]
  22. Krommweh, M.S.; Rösmann, P.; Büscher, W. Investigation of heating and cooling potential of a modular housing system for fattening pigs with integrated geothermal heat exchanger. Biosyst. Eng. 2014, 121, 118–129. [Google Scholar] [CrossRef]
  23. Cohen, J. Statistical Power Analysis for the Behavioral Sciences, 2nd ed.; Erlbaum: Hillsdale, NJ, USA, 1988; ISBN 0-8058-0283-598 5. [Google Scholar]
  24. Caputo, A.C.; Pelagagge, P.M.; Salini, P. Joint economic optimization of heat exchanger design and maintenance policy. Appl. Therm. Eng. 2011, 31, 1381–1392. [Google Scholar] [CrossRef] [Green Version]
  25. Characklis, W.G. Bioengineering Report. Fouling Biofilm Development: A Process Analysis. Biotechnol. Bioeng. 1981, 23, 1923–1960. [Google Scholar] [CrossRef]
  26. Müller-Steinhagen, H.; Malayeri, M.R.; Watkinson, A.P. Heat Exchanger Fouling: Mitigation and Cleaning Strategies. Heat Transf. Eng. 2011, 32, 189–196. [Google Scholar] [CrossRef]
  27. Kazi, S.N. Fouling and Fouling Mitigation on Heat Exchanger Surfaces. In Heat Exchangers—Basics Design Applications; Mitrovic, J., Ed.; InTech: London, UK, 2012; ISBN 978-953-51-0278-6. [Google Scholar]
  28. Rösmann, P. Einsatz von Regenerativen Energiequellen Zum Heizen und Kühlen von Zwangsbelüfteten Tierställen. Ph.D. Thesis, Rheinische Friedrich-Wilhelms-Universität Bonn, Bonn, Germany, 2012. [Google Scholar]
  29. DLG. Big Dutchman International GmbH—Heat Exchanger Earny Type 40.000—Efficiency of Heat Recovery under Practical Conditions: DLG Test Report 6140F. 2014. Available online: http://www.dlg-test.de/tests/6140F_e.pdf (accessed on 24 September 2021).
  30. Licharz, H.; Rösmann, P.; Krommweh, M.S.; Mostafa, E.; Büscher, W. Energy Efficiency of a Heat Pump System: Case Study in Two Pig Houses. Energies 2020, 13, 662. [Google Scholar] [CrossRef] [Green Version]
  31. Mun, H.S.; Dilawar, M.A.; Jeong, M.G.; Rathnayake, D.; Won, J.S.; Park, K.W.; Lee, S.R.; Ryu, S.B.; Yang, C.J. Effect of a Heating System Using a Ground Source Geothermal Heat Pump on Production Performance, Energy-Saving and Housing Environment of Pigs. Animals 2020, 10, 2075. [Google Scholar] [CrossRef] [PubMed]
  32. Decius, M.; Hartung, J.; Naim, H.Y. Prüfung der Funktionsweise und Effizienz Einer Biologischen Abluftreinigungsanlage Unter Praxisbedingungen im Hinblick auf das Rückhaltevermögen für Bioaerosole; Tierärztliche Hochschule: Hannover, Germany, 2016. [Google Scholar]
  33. Liu, F.; Fiencke, C.; Guo, J.; Lyu, T.; Dong, R.; Pfeiffer, E.-M. Optimisation of bioscrubber systems to simultaneously remove methane and purify wastewater from intensive pig farms. Environ. Sci. Pollut. Res. 2019, 26, 15847–15856. [Google Scholar] [CrossRef] [PubMed]
  34. VDI 3478-2. Biological Waste Gas Purification: Part 2: Biological Trickle Bed-Reactors; Beuth Verlag: Berlin, Germany, 2008. [Google Scholar]
  35. Liu, F.; Fiencke, C.; Guo, J.; Rieth, R.; Cuhls, C.; Dong, R.; Pfeiffer, E.-M. Bioscrubber treatment of exhaust air from intensive pig production: Case study in northern Germany at mild climate condition. Eng. Life Sci. 2017, 17, 458–466. [Google Scholar] [CrossRef] [PubMed]
Figure 1. External view of the exchange scrubber pilot plant. Part of the exhaust air is drawn from the vacuum chamber (1) below the conventional heat exchanger (2) into the pilot plant (3). To the right of the test pilot plant is the equipment container (4), which housed the scrubbing water basin, the exhaust air treatment technology and its controls, as well as all measuring technology.
Energies 14 06484 g001
Figure 2. Cutaway model of the recuperative heat exchanger. The supply air was guided through the white, closed hollow chamber profiles (blue arrows). The exhaust air was guided vertically from bottom to top through the waveform structures sheets (red arrows). Supply air and exhaust air were separated from each other and could not mix.
Energies 14 06484 g002
Figure 3. Schematic sketch of the exchange scrubber pilot plant with the three tested assembly situations of the heat exchanger unit. (AC) indicate the assembly situation of the heat exchanger, numbers 1–13 the components of the pilot plant, and t the measuring points.
Energies 14 06484 g003
Figure 4. Heating performance and temperature profiles at the measuring points of the exchange scrubber pilot plant under field conditions during the measurement period with assembly situation A of the heat exchanger (31 January 2015–3 February 2015).
Energies 14 06484 g004
Figure 5. Data and relationship between heating performance of the exchange scrubber pilot plant (at the three different assembly situations of the heat exchanger) and outside air temperature (t21).
Energies 14 06484 g005
Figure 6. Data and relationship between heating performance of the exchanger scrubber pilot plant (at the three different assembly situations of the heat exchanger) and the temperature difference between scrubbing water and outside air (ΔtW–t21).
Energies 14 06484 g006
Figure 7. Comparison of the heating performance of the heat exchanger for the three assembly situations A, B, and C (cf. Figure 3) in the exchange scrubber that were investigated.
Energies 14 06484 g007
Table 1. Overview of the most important data for calculating the coefficient of performance (COP) for the three heat exchanger assembly situations examined.
UnitAssembly Situation of
Heat Exchanger
ABC
Test daysd131313
Test hoursh312312308
Total electricity consumption (kWhel)kWh265.6272.7261.0
of thatexhaust air fankWh54.456.554.9
supply air fankWh22.224.423.6
recirculation pump and sludge removal pumpkWh189.0191.8182.5
Average heating performance Q ˙ H R kW8.510.06.0
Total transferred thermal energy (kWhth)kWh264131321860
COP-9.911.57.1
Table 2. Ammonia concentrations in raw gas and clean gas of the exchange scrubber pilot plant under field conditions as well as the ammonia removal efficiency for all three tested assembly situations of the heat exchanger (AC), based on hourly averages.
Assembly Situation of Heat Exchanger ABC
Period of ammonia measurement 2015-02-04, 7:00 p.m.
to
2015-02-05, 9:00 a.m.
2015-02-18, 10:30 p.m.
to
2015-02-19, 12:30 p.m.
2015-03-04, 10:15 p.m.
to
2015-03-05, 8:15 p.m.
Test duration
(h)
141422
Ammonia concentration in raw gas
(ppm)
xmin19.917.322.7
mean ± SD25.2 ± 2.918.3 ± 0.725.7 ± 1.7
xmax33.519.828.7
Ammonia concentration in clean gas
(ppm)
xmin12.67.47.6
mean ± SD13.9 ± 0.97.9 ± 0.29.2 ± 1.0
xmax16.28.310.4
Removal efficiencyxmin0.340.550.58
mean ± SD0.44 ± 0.050.57 ± 0.010.64 ± 0.03
xmax0.520.610.69
Publisher’s Note: MDPI stays neutral with regard to jurisdictional claims in published maps and institutional affiliations.

