Abstract
As a signatory to the Paris Agreement, Singapore is committed to achieving net-zero carbon emissions in the second half of the century. In this paper, we propose a decarbonization roadmap for Singapore based on an analysis of Singapore’s energy landscape and a technology mapping exercise. This roadmap consists of four major components. The first component, which also underpins the other three components, is using centralized post-combustion carbon capture technology to capture and compress CO2 emitted from multiple industrial sources in Jurong Island. The captured CO2 is then transported by ship or an existing natural gas pipeline to a neighboring country, where it will be stored permanently in a subsurface reservoir. Important to the success of this first-of-a-kind cross-border carbon capture and storage (CCS) project is the establishment of a regional CCS corridor, which makes use of economies of scale to reduce the cost of CO2 capture, transport, and injection. The second component of the roadmap is the production of hydrogen in a methane steam reforming plant which is integrated with the carbon capture plant. The third component is the modernizing of the refining sector by introducing biorefineries, increasing output to petrochemical plants, and employing post-combustion carbon capture. The fourth component is refueling the transport sector by introducing electric and hydrogen fuel cell vehicles, using biofuels for aviation and hydrogen for marine vessels. The implications of this roadmap on Singapore’s energy policies are also discussed.
1. Introduction
Climate change brought about by global warming is an existential problem facing Singapore. The following are some examples of how climate change is affecting Singapore [1]. Between 1980 and 2020, the annual mean temperature in Singapore has increased from 26.9 °C to 28.0 °C. This temperature rise could lead to more occurrences of warm-weather diseases such as dengue fever, as well as heat stress and discomfort among the elderly and sick. It also puts Singapore’s plants and animals at risk as it alters the natural processes in the ecosystem such as soil formation, nutrient storage, and pollutant absorption. In addition, the mean sea level in the Straits of Singapore increased at a rate of 1.2 to 1.7 mm per year between 1975 and 2009. This sea level rise poses an immediate threat to Singapore, as much of the nation lies only 15 m above sea level, whereas 30% of the country is less than 5 m above sea level. Furthermore, the annual rainfall for Singapore increased at an average rate of 6.7 cm per decade from 1980 to 2019, posing significant challenges to the country’s water resources. An increase in the intensity of weather variability, such as drought and intense rainfall, could overwhelm the nation’s drainage system, leading to flash floods, as well as adversely affecting global food security.
Many scientists believe that the global warming is brought about by an increase in anthropogenic CO2 emissions, which blocks the irradiation of heat to outer space due to the greenhouse effect [2,3]. Since the signing of the Paris Agreement in 2015, most nations have established targets to reduce greenhouse gas emissions. The overall goal is to reduce the global temperature rise to less than 2 °C and preferably less than 1.5 °C compared to pre-industrial times. This will mean achieving net-zero greenhouse gas emission for most nations by 2050 or shortly afterwards. As a signatory to the Paris Agreement, Singapore is committed to achieving net-zero emissions in the second half of the century.
2. Purpose and Methodology of Study
The purpose of this study is to propose, for the first time, a high-level roadmap for Singapore to achieve net-zero emissions before the end of the century. Based on an analysis of Singapore’s energy landscape and the impact and readiness level of various decarbonization technologies in the context of Singapore, this roadmap points out the major levers for decarbonization wherein concerted efforts can make the biggest difference. Concomitantly, we suggest policies relevant for the implementation of this roadmap.
Our methodology is three-fold. First, we analyze the energy landscape of Singapore. Second, we conduct a technology mapping exercise to identify the mature technologies that have the most impact on reducing Singapore’s CO2 emission. Third, we propose a decarbonization plan based on this technology mapping. Finally, we draw energy policy implications resulting from this roadmap.
3. Singapore’s Decarbonization Commitment
In 2017, Singapore emitted 52 million tons of CO2, which was 0.1% of global emissions [1]. Singapore ranks 27th out of 142 nations in terms of per capita CO2 emissions and 126th in terms of CO2 emissions per dollar of GDP. As a signatory to the Paris Agreement, Singapore has pledged to achieve peak CO2 emissions of less than 65 million tons by 2030, halve it by 2050, and reduce it to zero before 2100 [4]. Figure 1 gives the historical CO2 emissions from Singapore. It also shows the projected CO2 emissions required to achieve net-zero by 2080. Between 2030 and 2080, a very sharp declining rate in CO2 emission will be needed to realize the goal of net-zero before the end of the century. Figure 2 shows the primary and secondary CO2 emission from Singapore in 2017. The three sectors emitting most CO2 were power (39%), industry (46%) and transport (13%). Within the industry sector, most of the emission came from refineries.
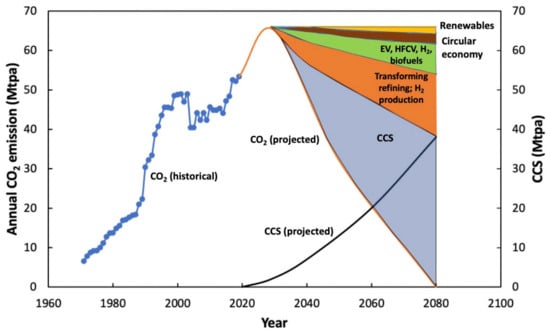
Figure 1.
Singapore’s CO2 emissions and illustrative reductions needed to achieve net-zero emissions by 2080.
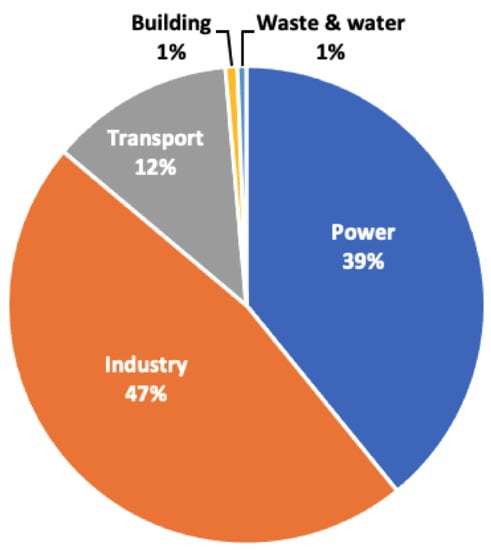
Figure 2.
Singapore’s CO2 emission in 2018.
In this paper, we propose a roadmap to achieve this net-zero timetable. This roadmap consists of four parts: (1) CCS, (2) hydrogen production, (3) modernizing the refining sector, and (4) using low-carbon fuels for the transport sector. Figure 1 illustrates a future scenario in which CCS will contribute to 59% of the reduction in CO2 emissions, hydrogen and modernization of the refining sector will contribute to 24%, and the use of low-carbon fuels in transport will contribute to 12%. Although other scenarios are possible, we expect CCS will play a major role in the overall decarbonization effort.
4. Singapore’s Energy Landscape
There are four unique features of Singapore’s energy landscape, which must be considered in the design of an energy transition roadmap.
First, being a nation state with only an area 728 km2, Singapore lacks its own fossil fuel or renewable energy resources. Consequently, 98% of Singapore’s demand comes from imported fossil fuels, mainly oil and natural gas. In 2019, 86% of Singapore’s primary energy consumption came from imported oil, 13% from imported natural gas, and only 0.24% from domestic solar PVs and other renewables [5].
Second, by design, Singapore’s CO2 emissions are highly concentrated on two small islands: Jurong and Bukom (Figure 3a). Jurong Island, 32 km2 in area, is home to most of Singapore’s refining, petrochemical, and power plants. Bukom Island, 1.45 km2 in area and located just 4 km east of Jurong Island, is home to Shell’s biggest refinery. Jurong Island is responsible for over 50% of Singapore’s CO2 emissions, thus making it a prime target for carbon capture (Figure 3b).
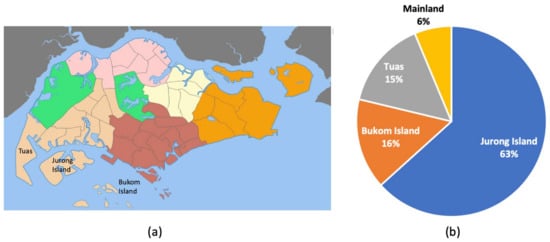
Figure 3.
(a) Map of Singapore, (b) CO2 emissions from industry and power by location.
Third, Singapore’s industry sector is heavily concentrated in refining and petrochemicals, which are highly integrated to improve their efficiency. Together, they account for most Singapore’s industrial CO2 emissions [6], with the refining sector being the biggest CO2 emitter. Singapore has the world’s fifth largest oil refining capacity of 1.5 million bbl/d in 2018 [7].
Fourth, being at the center of southeast Asia, Singapore is close to many CO2 subsurface storage sites, such as saline aquifers, as well as oil and gas reservoirs. Although Singapore lacks subsurface storage sites for CO2, there are plenty of them within a 1000 km radius of Singapore. This fact creates unique opportunities for the implementation of a cross-border CCS project.
Singapore’s Emission Profile
Out of Singapore’s total CO2 emissions, 47% comes from industry, 39% from power generation, 12% from transport, and 2% from buildings and other sectors (Figure 2) [4]. However, practically all the emissions from industry sector come from the refining and petrochemical sectors.
One unique feature of Singapore’s stationary CO2 emissions is that 62% of them come from Jurong Island, which is a small island with an area of 32 km2 located in the southwest of Singapore (Figure 3a). About 71% of Singapore’s power plants, 69% of refineries, and practically all petrochemical and chemical plants are in Jurong Island. It is home to some of the largest refineries and petrochemical complexes in Southeast Asia. Refineries in Jurong Island and Bukom Island process 1.5 million bbl/d, turning crude oil into gasoline, kerosene, diesel, and jet fuel that is sold domestically and abroad. Jurong Island’s petrochemical plants rank among the top 10 in the world and produce lubricants, resins, polymers, plastics, and fuel additives. In 2015, Jurong Island contributed to SGD 81 billion or one-third of Singapore’s total manufacturing output [8]. Due to this concentration of industries, 54% of Singapore’s total CO2 emissions, or 27 million tons per year, comes from Jurong Island. This creates a unique opportunity for centralized post-combustion carbon capture and processing.
5. Technology Mapping
Figure 4 and Table 1 present the results of a technology mapping exercise based on two criteria: technology impact and technology readiness in Singapore. In this exercise, renewable energies such as wind, hydroelectricity, geothermal, and solar thermal energy are ranked low because of their unavailability. Carbon capture and utilization (CCU) has a medium level of technology readiness and impact. Most CCU technologies are in the pilot stage and their potential to mitigate large quantities of industrial CO2 is low to medium. Both hydrogen fuel cell vehicles (HFCV) and green hydrogen have very high impact on reducing Singapore’s CO2 emissions. However, their technology readiness level is low to medium. Importing electricity through the regional grid and constructing zero-emissions buildings both have high technology readiness levels. However, their impact on CO2 mitigation is medium to low. There are six technologies ranked as having a high impact and high readiness level. They are CCS, biofuels, solar PVs, blue hydrogen, electric vehicles (EVs) and the adoption of a circular economy. Out of these, biofuels, solar PVs, EVs and a circular economy are already present in Singapore. CCS and blue hydrogen have yet to be implemented in Singapore.
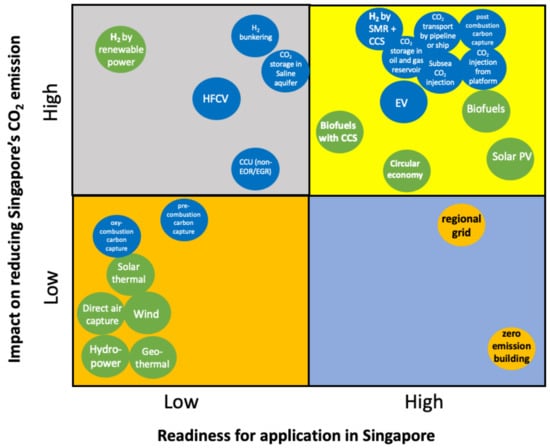
Figure 4.
Technology mapping for decarbonizing Singapore.

Table 1.
Ranking of the impact and readiness of various technologies on the decarbonization of Singapore.
6. Decarbonization Roadmap
Based on the aforementioned technology-mapping exercise, we propose a decarbonization roadmap for Singapore. It consists of four key components: (1) CCS, (2) hydrogen production, (3) transforming refining, and (4) refueling transport (Figure 5).
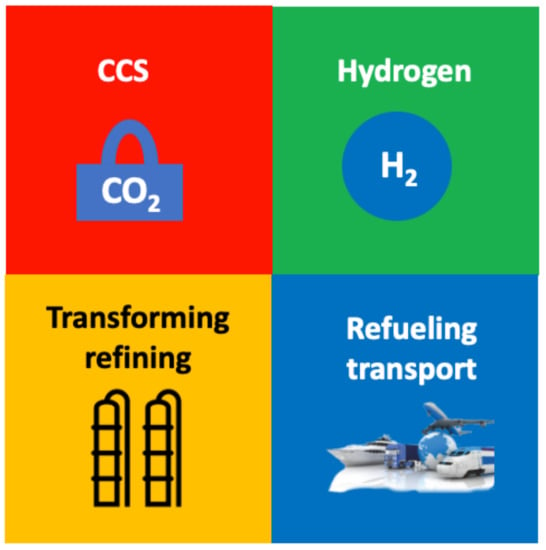
Figure 5.
Four components of the decarbonization roadmap.
Of the four components, CCS is fundamental because it underpins the other three. We propose using centralized post-combustion carbon capture to capture the CO2 emitted from the power, refining, and petrochemical industries located in Jurong Island. The second component is hydrogen manufacturing using a steam methane reforming (SMR) plant and integrating it with the carbon capture plant in Jurong Island. The third component is transforming the refining industry in Singapore by a readjustment of output, the incorporation of biorefineries, and the use of post combustion CCS. The fourth component consists of replacing existing internal combustion engine cars with electric vehicles and hydrogen fuel cell vehicles, using biofuels for aviation and hydrogen for marine vessels. Key elements of this roadmap are shown in Figure 6.
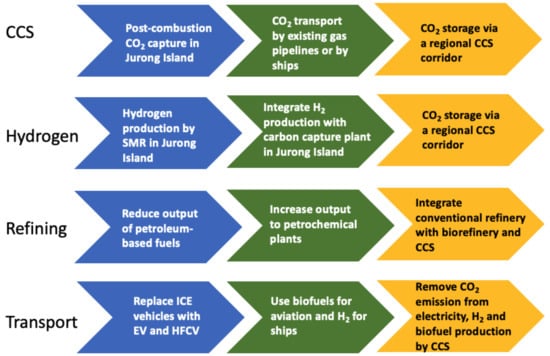
Figure 6.
Key elements of the decarbonization roadmap.
According to our roadmap, post-combustion carbon capture will be the main method used to mitigate CO2 emission. One possible scenario in our roadmap is given in Figure 1, wherein 59% of the reductions will be achieved by CCS; 24% by reducing refinery output and industry restructuring; and 12% by fueling transport using electricity, hydrogen, and biofuels. Achieving this will require ramping up CCS from zero to 38 Mtpa between now and 2080. This is feasible if an ASEAN open-access CCS corridor is established in the next decade. Other scenarios, for example using CO2 to produce building materials and chemicals, are possible. However, regardless of which scenario is chosen, CCS will be the major contributor to Singapore’s decarbonization. Table 2 summarizes the main CO2 mitigation methods by sector resulting from our technology mapping exercise.

Table 2.
CO2 mitigation method by sector.
6.1. Carbon Capture and Storage (CCS)
Carbon capture and storage is the foundation stone of the proposed roadmap as it is the only mature technology that allows Singapore to remove the millions of tons of emitted CO2 per year needed to achieve net-zero before the end of the century.
6.1.1. Centralized Post-Combustion CO2 Capture
Due to a high concentration of large CO2 emitters in Jurong Island (Figure 7), it is possible to direct flue gas from multiple industrial plants to a central location for carbon capture and compression. Post-combustion carbon capture technology may be used to capture CO2 from several flue gas streams with varying CO2 concentrations. Our analysis shows that in Jurong Island, the CO2 concentration in the flue gas is 15–25% from power plants, 30–45% from refineries, and 40–80% from petrochemical plants. The pressure of these flue gas streams may be boosted by a vapor recovery compressor, allowing them to be pumped to a centralized plant for CO2 capture. In this plant, CO2 may be absorbed by liquid solvents such as MDEA, MEA, DEA, and NaOH. The solvent can be regenerated by stripping the CO2 out of the liquid by steam. The regenerated solvent can be returned to the absorber column while a concentrated CO2 stream is produced. In addition to chemical solvents, solid absorbents, membranes, or a combination of them may also be used for post-combustion CO2 capture. After being captured, CO2 can be compressed and cooled to liquid or supercritical form. Although post-combustion carbon capture can be retrofitted into existing industrial plants, it is cheaper to build a single centralized plant to capture CO2 from multiple sources. Our roadmap calls for the building of a plant that has the capacity to capture 5 Mtpa of CO2, which is on par with the largest post-combustion carbon capture plants in the world [48]. By integrating CO2 capture, liquefaction, and temporary storage into a single centralized plant, a greater reduction in capital investment can be achieved. Centralized post-combustion carbon capture is only possible due to Singapore’s unique CO2 emissions profile. A centralized post-combustion CO2 capture plant in Jurong Island capable of processing several million tons of CO2 per year will be a first-of-a-kind project in the world.
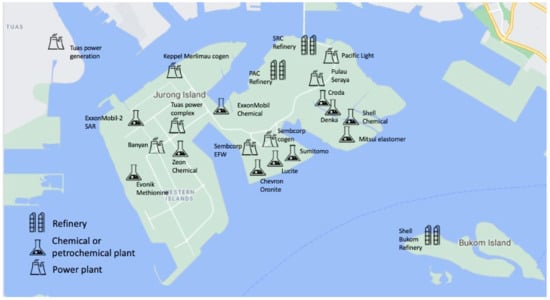
Figure 7.
Major power plants, refineries, and chemical/petrochemical plants in Jurong and Bukom Islands.
6.1.2. CO2 Transportation from Singapore
CO2 is usually transported in a supercritical form by pipelines or in liquid form by marine vessels [14]. In pipeline transport, the pipeline is usually pressurized to above 10.3 MPa to ensure that CO2 is in a supercritical form with a density close to 800 kg/m3 and a viscosity close to 0.8 cp. Therefore, the pressure drop in a pipeline can be readily estimated. Over long distances, booster stations may be needed to keep the CO2 in the supercritical phase. There are two existing pipelines supplying natural gas to Singapore from Indonesia. One of them is the 654-km-long West Natuna–Singapore pipeline that supplies natural gas from Indonesia’s West Natuna gas field to Jurong Island (Figure 8). The gas delivery contract for this pipeline will end in 2022 and it is not certain whether it will be renewed. The second is the 470-km-long South Sumatra–Singapore pipeline that supplies natural gas from Indonesia’s Suban gas field in South Sumatra to Singapore (Figure 8). This pipeline will cease to operate by 2023, when the existing gas contract ends. Indonesia plans to use the gas for domestic consumption. If one or both of these pipelines cease to be used for natural gas delivery, they may be used instead for shipping CO2 from Singapore to subsurface reservoirs in either South Sumatra or the West Natuna Basin for permanent storage. In addition, Singapore’s gas transmission network is connected to Petronas’ Peninsula Gas Utilization Pipeline. This network was used to supply natural gas from Malaysia to Singapore. These existing natural gas pipelines may be used to transport industrial CO2 from Singapore to Indonesian or Malaysian subsurface reservoirs for permanent storage. In such a scenario, the shipment of CO2 from Singapore will be relatively inexpensive as no or limited new pipelines need to be constructed. If existing natural gas pipelines cannot be used, the building of a new CO2 pipeline to the nearest sink may also be considered. It should be noted that there are over 3000 km of CO2 pipelines in the world, moving many tens of million tons of CO2 annually. For the transportation of CO2 over long distances, where existing pipelines are unavailable, marine shipments can be used. Currently, small quantities (a capacity of 1000 m3) of liquefied CO2 is being transported by ships by the food and beverage and chemical industries. Marine shipments of large quantities of CO2 can be undertaken by LPG tankers with a capacity of 100,000 m3 (80,000 tons) of liquid CO2. The existing LNG terminal in Jurong Island may be modified to handle the offloading of liquid CO2. As Singapore is a hub for ship building, modifying LPG tankers or building new tankers for liquid CO2 shipments in Singapore’s shipyards is feasible. The cross-border movement and storage of CO2 will require risk assessments and government-to-government negotiations (See Section 7.1.6).
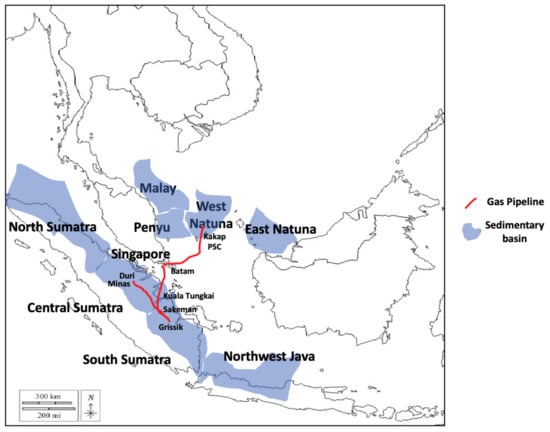
Figure 8.
Natural gas pipelines supplying gas to Singapore from West Natuna field and Grissik field.
6.1.3. CO2 Storage Using a Regional CCS Corridor
An important part of the roadmap is a detailed CO2 source-sink mapping exercise to identify large industrial CO2 sources and subsurface reservoirs for permanent CO2 storage [49]. Initially, such a source-sink mapping exercise should identify CO2 sources and sinks within a 1000 km radius from Singapore (Figure 9). Besides Jurong Island in Singapore, large stationary CO2 sources within this area include power plants, refineries, and factories in Sumatra, Northwest Java, and Peninsula Malaysia. It is interesting to note that four (North Sumatra, Riau, Lampung, South Sumatra) of the top provinces for CO2 emissions in Indonesia are located in the Sumatra Island. There have been previous studies on the potential of CCS potential in the region [50,51,52].
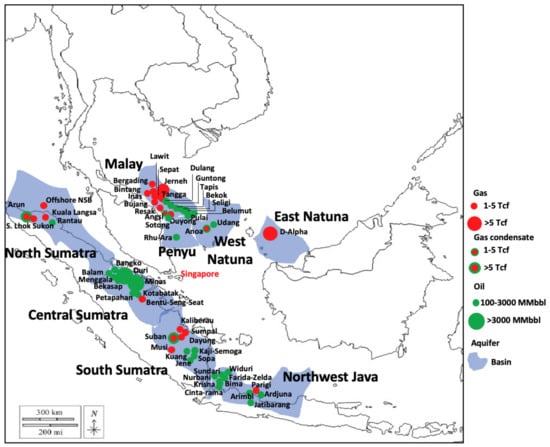
Figure 9.
Sedimentary basins and oil and gas fields within 1000 km from Singapore.
Major CO2 sinks are subsurface layers of porous media (reservoirs), which include saline aquifers as well as depleted or partially depleted oil and gas reservoirs [53].
There are eight major sedimentary basins within a 1000 km radius from Singapore (Figure 1). They are the North Sumatra, Central Sumatra, South Sumatra, Northwest Java, East Natuna, West Natuna, Penyu, and Malay basins. The first six basins are in Indonesia, whereas the last two are in Malaysia. There are many oil and gas reservoirs of varying degrees of depletion in these eight sedimentary basins (Table 3 and Table 4). Our preliminary estimates show that the total CO2 storage capacity in these seven basins exceeds 100 Gt, of which 90% resides in saline aquifers and the remaining in oil and gas reservoirs [22,51]. It should be noted that the injection of CO2 into an oil or gas reservoir may lead to the production of incremental oil or gas by processes known as enhanced oil recovery (EOR) or enhanced gas recovery (EGR) due to the total or partial miscibility of the CO2 with the oil or gas condensate in the reservoir [49]. This makes the economics of CO2-EOR or EGR more attractive than the pure geological storage of CO2 in a saline aquifer.

Table 3.
Major Indonesian reservoirs within 1000 km from Singapore.

Table 4.
Major Malaysian fields within 1000 km from Singapore.
Detailed regional source-sink mapping will involve ranking CO2 emission sources by amount and CO2 concentration. Likewise, CO2 sinks are ranked by their storage capacity, reservoir type, and readiness for CO2 storage. The mapping of potential sources to potential sinks is carried out based on factors such as distance, capacity, and readiness [49].
6.1.4. CO2 Storage in Subsurface Reservoirs
CO2 can be sequestered in subsurface reservoirs such as saline aquifers, oil reservoirs, gas reservoirs, coalbed methane, geothermal reservoirs, organic-rich shale, gas hydrate reservoirs, and basalt formations [53]. However, the majority of CO2 storage capacity resides in saline aquifers (over 95%) and oil and gas reservoirs (1%–2%). In Southeast Asia, oil and gas reservoirs have been well studied and characterized by oil companies. CO2 can be injected into a partially depleted light oil reservoir for enhanced oil recovery, wherein the injected CO2 is miscible or partially miscible with the oil, thus allowing incremental oil to be produced. This type of CO2 enhanced oil recovery (EOR) is well understood and has been conducted in the Permian Basin of Texas for over four decades using naturally sourced CO2 [54]. The chief factor determining CO2 miscibility is the density of the crude and the reservoir pressure. The reservoir pressure must be above the minimum miscibility pressure (MMP) for CO2 to be miscible with the crude. Hitherto, CO2-EOR has not been applied on a commercial scale in Southeast Asia partly because of a lack of stable supply of CO2. This can change if a constant supply of CO2 from a large-scale CCS project is implemented in the region. Currently, several CCS pilots are being planned in the region.
In gas condensate reservoirs, a significant amount of condensate or light oil may remain in the reservoir after gas depletion. In such cases, the injection of CO2 which becomes miscible with the condensate may allow a significant portion of the condensate to be produced [53]. This type of enhanced gas recovery (EGR) can be used for both gas recovery and CO2 storage.
Both CO2-EOR and CO2-EGR are profitable at a medium-to-high oil price, i.e., above $50/bbl [55]. However, the fluctuation of the oil price makes it difficult to plan for a long-term CO2-EOR or CO2-EGR process. Consequently, government policies that incentivize companies to sequester CO2 will be highly helpful. A good example is the 45Q tax credit in the US, which gives a tax credit of $35/ton CO2 sequestered in an oil or gas reservoir and $50/ton CO2 sequestered in a saline aquifer.
A depleted gas reservoir is also a very good candidate for CO2 storage. Pore space made available by the produced gas can be used for CO2 storage. CO2 can be continuously injected into a depleted gas reservoir until the reservoir pressure reaches the fracture pressure of the reservoir. Depending on the size of the OGIP, the amount of CO2 stored can be substantial if the CO2 density under the original conditions is high.
Saline aquifers provide the biggest storage capacity for CO2 and they are present in practically all sedimentary basins. However, the detailed characterization of saline aquifers is lacking as they are not targets for oil and gas exploration and production. In addition, the geological storage of CO2 in saline aquifers will not be economically attractive unless there is a substantial carbon tax or credit, which is lacking in Southeast Asia.
Due to their abundance in some Southeast Asia countries, geothermal reservoirs should also be investigated for CO2 storage. Both Indonesia and the Philippines reside within the Ring of Fire region, known for its geothermal activity. Both countries have substantial hydrothermal reservoirs, as well as hot oil and gas reservoirs. Large amounts of CO2 may be used as heat transfer fluids for mining the geothermal heat for geothermal power production [53].
The risk of CO2 leakage during storage in subsurface reservoirs has been well studied in the literature [53]. Leakage is usually due to poorly cemented wellbore, incompetent reservoir seals, or activated faults. Consequently, continuous monitoring of CO2 plumes by observation wells, seismic methods, and other methods is needed. In general, CO2 leakage is not a problem if the aforementioned issues are addressed, as demonstrated by many years of field experience in CO2-EOR in US and CO2 sequestration projects and Norway [53].
6.1.5. Development Concepts for CO2 Injection
The development concepts for CO2 injection are shown in Figure 10. CO2 may be stored in a reservoir located either onshore or offshore. Most likely, CO2 transported from industrial sources in multiple countries will be temporarily stored in a coastal facility in the host country for permanent storage (Figure 11). If the CO2 injection site is onshore, then CO2 will be transported to that site by pipelines. This is the “beach-to-field” development concept. If the CO2 injection site is offshore, then CO2 may be injected into a well in an existing oil or gas platform or into a subsea well. If CO2 is transported from a beach to an offshore platform by a pipeline, the concept is called “beach-to-platform.” If CO2 is transported to the platform by a marine vessel, this concept is called “ship-to-platform”. If CO2 injection is performed via a subsea well, and CO2 is transported from the shore to the subsea wellhead by a subsea pipeline, this is known as the “beach-to-subsea” concept. If CO2 is transported by a marine vessel to a floating buoy through which it is injected into a subsea well, the concept is called “ship-to-subsea.” Hitherto, onshore CO2 injection has been carried out in west Texas [54], and the beach-to-subsea concept has been employed in the Norwegian Snøhvit project [56] and will be used in the Northern Lights project, which will come onstream in 2024 [57]. The more expensive “ship-to-platform” and “ship-to-subsea” concepts have not been attempted, and probably will only be used in special cases where transport using a subsea CO2 pipeline is not feasible.
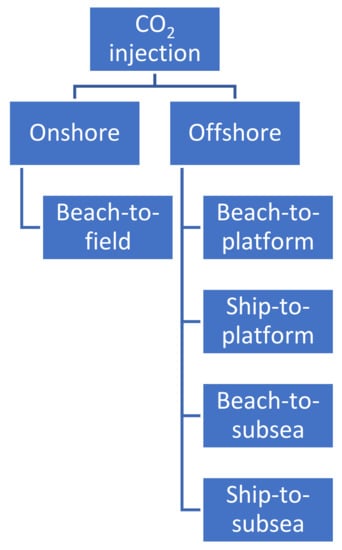
Figure 10.
Development concepts for CO2-injection.
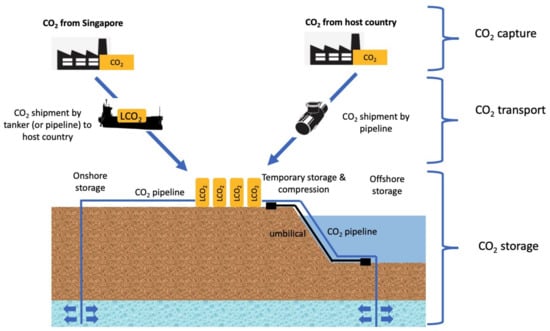
Figure 11.
Southern Lights: a cross-border CCS project in the ASEAN region.
6.1.6. Southern Lights: A Cross-Border CCS Project in ASEAN
In this roadmap, we propose a first-of-a-kind cross-broader CCS project in the ASEAN region called “Southern Lights.” The naming of this project was inspired by the Northern Lights CCS project currently underway in Norway [58]. The Southern Lights project will capture CO2 from Jurong Island in Singapore and transport it to a storage site in a nearby country, where it will be injected into a reservoir for permanent storage. In addition, this project can also accept CO2 from the host country for storage (Figure 11). In future, CO2 from other ASEAN countries can also be accepted. Phase 1 of the project will involve capturing, transporting, and storing 1 to 5 Mtpa CO2 from Singapore and the host country. Phase 2 will involve ramping up storage to 10 Mtpa or higher [9,59].
6.2. Hydrogen Production
The second initiative of the decarbonization roadmap is to build a steam methane reforming (SMR) plant in Jurong Island to produce hydrogen from natural gas and use CCS to remove the emitted CO2 [59]. SMR is performed by mixing steam with natural gas to a high temperature in the presence of a catalyst. This process converts natural gas into hydrogen and CO2. The hydrogen may be sold as a clean energy carrier for use in hydrogen fuel cell vehicles, as well as heating and as feedstock for industrial use. This process will allow Singapore to be a producer of hydrogen for domestic consumption and export. Already, countries such as Japan and South Korea are planning to import hydrogen from overseas and include it in the future energy mix [34,36]. In addition, Australia, New Zealand, Saudi Arabia, and the UAE have announced their desire to export hydrogen to Asia [37,60,61,62]. It is estimated that the global demand for industrial hydrogen will increase from 87 million tons in 2020 to 212 million tons in 2030 and 528 million tons in 2050 [63]. There is much for Singapore to benefit from if it can become a regional hub for exporting hydrogen. CCS will be a key technology enabling this to happen. New industries such as CCS and hydrogen may well become one of the new growth engines for the Singapore economy.
6.3. Transforming Refining
The refining sector is the biggest CO2 emitter in Singapore, amounting to 43% of total emissions. Consequently, reducing Singapore’s refining output and replacing it with low-carbon industries can make a difference in reducing Singapore’s CO2 emissions. Transforming Singapore’s refining industry is therefore a key component of our roadmap to reduce overall CO2 emissions.
Worldwide, many oil companies are reducing their refining capacity or shutting down refineries to reduce CO2 emissions during the refining process. Shell has recently announced it is cutting the capacity of its Bukom refinery from 500,000 bbl/d to 300,000 bbl/d by July 2021 [64,65]. On the other hand, ExxonMobil has plans to expand the capacity of its largest refinery in Jurong Island from 592,000 bbl/d by another 48,000 bbl/d [66,67]. The overall reduction in refinery capacity in Singapore will reduce CO2 emissions in this sector.
In addition, demand for conventional transportation fuels is forecasted to drop due to the desire to reduce CO2 emissions in this sector [68]. At the same time, the demand for low-carbon fuels such as biodiesel, bioethanol, and renewable aviation fuels will increase at the expense of conventional fuels. This trend will accelerate in the future. A concomitant trend is the increase in demand in Asia for petrochemicals. As the population in Asia increases and countries become more prosperous, the demand for petrochemical products such as plastics, fertilizers, packaging, clothing, digital devices, medical equipment, detergents, and tires will increase. Plastics are also found in solar panels, wind turbine blades, batteries, thermal insulation for buildings, and electric vehicle parts. Petrochemicals will become the biggest driver of global oil demand, surpassing transportation fuels [69].
To survive the energy transition, the refining sector needs to become less carbon-intensive. Figure 12 shows the connection between the refining and petrochemical industries in Singapore. There are several ways to transform the refining industry (Figure 6). One is for refineries to reduce the output of conventional fuels. The second is to increase the output of feedstock to the petrochemical industry as demand for petrochemicals is expected to increase. A third way is to convert some crude refining capacity into biorefineries. Instead of refining crude oil, refineries may be converted to refine biomass to produce biofuels and bio-naphtha to be used by the petrochemical industry. A fourth way is to use post-combustion carbon capture to reduce CO2 emissions from refineries. Figure 13 shows the connection between the refining industry and other industries after the transformation.
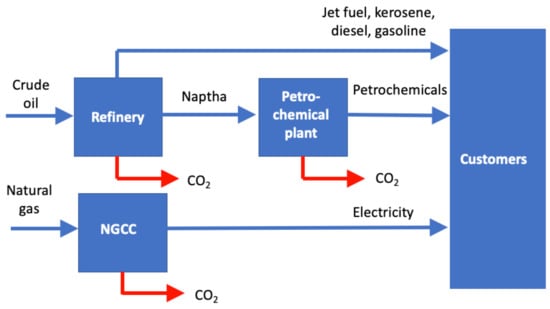
Figure 12.
Current nexus between the power, refining, and petrochemical industries in Singapore.
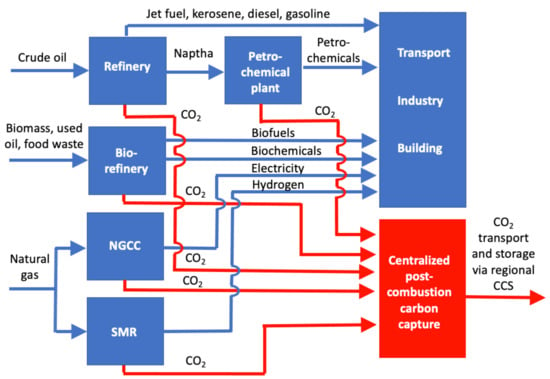
Figure 13.
Future nexus between the power, refining, hydrogen, and petrochemical industries after transformation.
6.4. Refueling Transport
In the road transport sector, the chief CO2 mitigation method is to replace internal combustion engine (ICE) passenger cars by electric vehicles (EVs) and long-haul ICE vehicles by hydrogen fuel cell vehicles (HFCVs). Already, Singapore has announced plans to phase out all internal combustion vehicles by 2040 [70]. For the marine transport sector, fossil-fuel based fuels are expected to be replaced by hydrogen. For the aviation transport sector, current jet fuels are expected to be replaced by biofuels. Singapore already has one of the biggest biofuel refineries in the world, with a capacity of 1.3 Mtpa [71]. However, jet fuel produced from the biorefinery is sold to North America and Europe, instead of being used in Singapore. The complete replacement of ICE vehicles by EVs and HFCVs will eliminate almost 7 Mtpa of mobile CO2 emissions, which will be replaced by stationary CO2 emissions during the processes of power and hydrogen generation. Again, CCS may be needed to remove CO2 emitted from these stationary sources.
7. Energy Policy Implications
There are many important implications on Singapore’s energy policies that can be derived from the roadmap. In this section, we will discuss only the major implications.
7.1. Energy Policy
A consistent long-term energy policy will provide incentives for individuals and companies to reduce CO2 emissions, such as the adoption of a circular economy, tax credits for electric vehicles, and the installation of solar panels. Without this, individuals and companies may be hesitant to implement low-carbon-intensity technologies which will increase the overall cost of living or doing business. National targets may include the deployment of renewable energies and the imposition of a carbon tax or credits, among other strategies. Within ASEAN, countries that have set targets for renewable energies include Malaysia (35% by 2050), Indonesia (15% by 2025), Thailand (20% by 2022), and Vietnam (5% by 2020). Although Singapore has set targets to reduce CO2 emissions over time, it has yet to set targets on how to achieve it, e.g., by increasing the percentage of renewable energies such as solar PV and biofuels, CCS goals, raising carbon taxes, or levels of hydrogen usage. Such national goals will be useful for incentivizing and guiding the overall energy transition pathway. The following are some components of such a national energy policy.
7.1.1. Carbon Tax
Since 2019, the Singapore government has imposed an SGD 5/tCO2e tax on any company that emits more than 2000 tCO2e per year of GHG. Singapore is the first ASEAN country that has imposed a carbon tax and there are plans to review this tax in 2023 and increase it to SDG 10–15/tCO2e by 2030. Even at SGD 15/tCO2e ($11/tCO2e), Singapore’s carbon tax is a far cry from the $50–120/tCO2e carbon tax in some European nations or the $35–50/tCO2e 45Q carbon tax credit in the US. To fund its decarbonization efforts, the Singaporean government may consider raising the carbon tax to a level on par with the US. There is a counterargument that a higher carbon tax may drive the refining and petrochemical companies away from Singapore. However, as mentioned earlier, an overall reduction in the refining capacity in Singapore is already happening, regardless of any change in carbon tax.
7.1.2. Target for Renewable Fuels
Besides setting targets for solar PVs and importing electricity from the regional grid, the Singaporean government can set targets on the use of renewable fuels in land, marine, and aviation transport. This will incentivize the modernization of Singapore’s refining industry to produce low-carbon transportation fuels such as biodiesel, bioethanol, and aviation biofuels. Biofuels can be blended with fossil fuels for use in transport. Singapore’s Changi Airport is one of the world’s major aviation hubs. Making aviation biofuels available in Changi Airport will be a major step toward reducing CO2 emissions in the aviation industry.
7.1.3. A Hydrogen Roadmap
Establishing a national roadmap for hydrogen will be useful and important for determining the direction of Singapore’s energy transition. It will also accelerate private sector investment in hydrogen infrastructure, production, and transport. Singapore stands to gain if it becomes the center for hydrogen production in Southeast Asia [9,59]. This is especially true if cheaper natural gas imported by pipelines from nearby countries, rather than expensive LNG imported from distant countries, can be used for hydrogen production in SMR. In addition, with Singapore’s experience in petrochemicals, a SMR plant with higher capacity may be possible in Singapore compared to other countries. Already within Asia, countries including Japan, South Korea, New Zealand, and Australia have published their national hydrogen roadmaps which outline the direction of their hydrogen industries [34,36,37,60]. Singapore is the top bunkering port for the global marine industry, attracting 130,000 vessel calls annually [72]. Making hydrogen available as a bunkering fuel in Singapore will be a major step toward decarbonizing the marine and shipping industry.
7.1.4. Public Engagement on CCS
At present, public awareness and acceptance of CCS is low within ASEAN countries. There are those who oppose CCS because they think it is a way to prolong the use of fossil fuels. Public engagement on the sustainability and benefits of CCS by trusted experts will be needed to raise the level of awareness and increase public acceptance. Trusted experts should include those from government, technology providers, and institutes of higher learning [53]. It is important that the economic benefits of CCS in providing new CCS supply chains and employment opportunities be articulated during public engagements.
7.1.5. ASEAN Engagement on a Regional CCS Corridor
As Singapore does not have subsurface reservoirs for permanent CO2 storage, the establishment of a regional CCS corridor will be important for the success of Singapore’s decarbonization effort. Intergovernmental engagement between Singapore and its neighbors will be needed. The terms of a long-term CO2 injection contract between countries may have many similarities with those of production sharing contracts (PSC) commonly used between host governments and oil and gas companies. It is not uncommon for PSCs to last for two decades or longer, specifying terms for both the host government and the oil company. Establishing one or more open-access ASEAN CCS corridors will be a major step toward decarbonization of the region. Since it is ASEAN’s purpose to facilitate economic cooperation between member states, government-to-government engagement to implement an open access cross-border CCS project may be carried outs under the sponsorship of ASEAN.
7.1.6. CCS Regulations
The movement of CO2 across borders is regulated by the London Protocol and the Basel Convention [73,74]. However, apart from the Philippines, ASEAN countries are not signatories to the London Protocol. Consequently, new international laws need to be promulgated within ASEAN to govern the movement of CO2 across borders. In addition, national regulations on CO2 injection and monitoring will be needed. Furthermore, the transfer of long-term liability from the operator to the government will be needed to de-risk a CCS project and obtain financing. Indeed, political leadership is needed if a cross-border CCS project is to be implemented.
7.1.7. Public-Private Partnership
The implementation of a CCS project requires an organization to plan, execute, and operate the project. Furthermore, this project will likely involve companies from multiple countries. The formation of a public–private partnership (PPP) partially supported by the Singaporean government will be beneficial for implementing the project. Professionals with relevant expertise and experience may be seconded from various organizations to the PPP.
7.1.8. Funding CCS Research and Development
The lack of CCS expertise in ASEAN countries needs to be addressed. At present, CCS expertise lies mostly in Europe and the US. International cooperation in research and development, as well as project execution in CCS should be encouraged to facilitate the transfer of expertise from Europe and the US to local entities. In addition, research and development on technologies relevant for the CCS project should be encouraged by ASEAN governments through research and technology funding.
8. Conclusions and Policy Implications
Based on an analysis of Singapore’s energy landscape and the results of a technology mapping exercise, we propose a roadmap for the country to achieve net-zero emissions before 2100. This roadmap consists of four components. The first and most important component is capturing CO2 from multiple sources in a centralized post-combustion carbon capture plant in Jurong Island. The captured CO2 is then transported by ship or a pipeline to a neighboring country to be stored permanently in a subsurface reservoir. Essential to the success of this first-of-a-kind cross-border CCS project is the establishment of a regional CCS corridor which makes use of economies of scale to reduce the cost of CO2 capture, transport, and storage. The second component is the production of hydrogen from natural gas using an SMR plant and integrating this plant with the centralized carbon capture plant. The third component is modernizing the refining sector to include, among other factors, biorefineries to produce renewable biofuels and biochemicals. The fourth component is refueling the transport sector by replacing ICE vehicles by electric and hydrogen fuel cell vehicles, while using biofuels for aviation and hydrogen for ships. The policy implications of this roadmap include imposing an adequate carbon tax, setting targets for renewable fuels, setting a roadmap of energy transition which includes the use of hydrogen, engaging the public to raise the awareness and acceptance of CCS, inter-governmental engagement to establish an ASEAN CCS corridor, the promulgation of CCS regulations, the setting up of a PPP for CCS project implementation, and providing funding for regional CCS research.
Author Contributions
Conceptualization, H.C.L. and S.R.; investigation, K.Z. and M.Z.S.H. All authors have read and agreed to the published version of the manuscript.
Funding
This research was funded by the Petroleum Engineering Professorships Programme Grant (S13-1392-RF-Petroleum) awarded by the Economic Development Board of Singapore.
Institutional Review Board Statement
Not applicable.
Informed Consent Statement
Not applicable.
Data Availability Statement
Not applicable.
Conflicts of Interest
The authors declare no conflict of interest.
Nomenclature
| ASEAN | Association of Southeast Asian Nations. They include Indonesia, Malaysia, Thailand, Philippines, Vietnam, Laos, Myanmar, Cambodia, Singapore, and Brunei Darussalam. |
| bbl/d | Barrels per day |
| CCS | Carbon capture and storage |
| CCU | Carbon capture and utilization |
| CO2 | Carbon dioxide |
| CO2e | Carbon dioxide equivalent |
| DEA | Diethanolamine |
| EV | Electric vehicle |
| GHG | Greenhouse gas |
| Gt | Giga ton, 109 tons |
| HFCV | Hydrogen fuel cell vehicle |
| H2 | Hydrogen |
| ICE | Internal combustion engine |
| MDEA | Methyl diethanolamine |
| MEA | Monoethanolamine |
| MMbbl | Million barrels |
| MMP | Minimum miscibility pressure of CO2 with oil |
| Mtpa | Million tons per year |
| NaOH | Sodium hydroxide |
| NGCC | Natural gas combined cycle |
| OGIP | Original-gas-in-place |
| OOIP | Original-oil-in-place |
| PPP | Public private partnership |
| PSC | Production sharing contract |
| SMR | Steam methane reforming |
| Solar PV | Solar photovoltaic |
| $ | US dollar |
| SGD | Singaporean dollar |
| Tcf | Trillion standard cubic feet, 1012 ft3 |
References
- National Climate Change Secretariat (NCCS). Impact of Climate Change in Singapore. 2021. Available online: https://www.nccs.gov.sg/singapores-climate-action/impact-of-climate-change-in-singapore/ (accessed on 19 June 2021).
- Houghton, J. Global Warming: The Complete Briefing, 4th ed.; Cambridge University Press: Cambridge, UK, 2015. [Google Scholar]
- Archer, D.; Rahmstorf, S. The Climate Crisis: An Introductory Guide to Climate Change, 4th ed.; Cambridge University Press: Cambridge, UK, 2012. [Google Scholar]
- National Climate Change Secretariat (NCCS). Singapore’s Emissions Profile. 2021. Available online: https://www.nccs.gov.sg/singapores-climate-action/singapore-emissions-profile/ (accessed on 12 June 2021).
- Our World in Data. Singapore: Energy Country Profile. 2021. Available online: https://ourworldindata.org/energy/country/singapore?country=~SGP (accessed on 20 June 2021).
- Straits Times, Parliament: About 75% of Industrial Emissions are from Refining and Petrochemical Sector. 7 October 2019b. Available online: https://www.straitstimes.com/politics/parliament-about-75-of-industrial-emissions-are-from-refining-and-petrochemicals-sectorsia-pacific/ (accessed on 18 June 2021).
- NS Energy. Top Five Countries in Asia-Pacific Region for Oil Refining Capacities. 2020. Available online: https://www.nsenergybusiness.com/features/countries-oil-refining-asia-pacific/ (accessed on 15 June 2021).
- Economic Development Board (EDB). 2021. Available online: https://www.edb.gov.sg/en/our-industries/energy-and-chemicals.html (accessed on 1 October 2021).
- Lau, H.C.; Ramakrishna, S. Why Carbon Capture Should be Included in Singapore’s Green Toolkit. The Straits Times, 3 June 2021. Available online: https://www.straitstimes.com/opinion/why-carbon-capture-should-be-in-singapores-green-toolkit (accessed on 18 June 2021).
- Leung, D.Y.C.; Caramanna, G.; Maroto-Valer, M.M. An Overview of Current Status of Carbon Dioxide Capture and Storage Technologies. Renew. Sustain. Energy Rev. 2014, 39, 426–443. [Google Scholar] [CrossRef] [Green Version]
- Jansen, D.; Gazzani, M.; Manzolini, G.; van Dijk, E.; Carbo, M. Pre-combustion CO2 Capture. Int. J. Greenhouse Gas. Control. 2015, 40, 167–187. [Google Scholar] [CrossRef] [Green Version]
- Symonds, R.T.; Hughes, R.W.; Loscertales, M.D.L.O. Oxy-pressured Fluidized Bed Combustion: Configuration and Options Analysis. Appl. Energy 2020, 262, 114531. [Google Scholar] [CrossRef]
- Onyebuchi, V.E.; Kolios, A.; Hanak, D.P.; Biliyok, C.; Manovic, V. A systematic Review of Key Challenges of CO2 Transport Via Pipelines. Renew. Sustain. Energy Rev. 2018, 81, 2561–2583. [Google Scholar] [CrossRef] [Green Version]
- Al Baroudi, H.; Awoyomi, A.; Patchigolla, K.; Jonnalagadda, K.; Anthony, E.J. A Review of Large-Scale CO2 Shipping and Marine Emissions Management for Carbon Capture, Utilisation and Storage. Appl. Energy 2021, 287, 116510. [Google Scholar] [CrossRef]
- Neele, F.; de Kler, R.; Nienoord, M.; Brownsort, P.; Koornneef, J.; Belfroid, S.; Peters, L.; van Wijhe, A.; Loeve, D. CO2 Transport by Ship: The Way Forward in Europe. Energy Procedia 2016, 114, 6824–6834. [Google Scholar] [CrossRef]
- Aspelund, A.; Molnvik, M.J.; de Koeijer, G. Ship Transport of CO2 Technical Solutions and Analysis of Costs, Energy Utilization, Energy Efficiency and CO2 Emissions. Chem. Eng. Res. Design 2006, 84, 847–855. [Google Scholar] [CrossRef]
- Ha, G.T.; Tran, N.D.; Vu, H.H.; Takagi, S.; Mitsuishi, H.; Hatakeyama, A.; Uchiyama, T.; Ueda, Y.; Nguyen, T.V.; Phan, T.N.P.; et al. Design and Implementation of CO2- Huff-n-Puff Operation in a Vietnam Offshore Field. In Proceedings of the Abu Dhabi International Petroleum Exhibition and Conference, Abu Dhabi, United Arab Emirates, 11–14 November 2012. SPE-161835. [Google Scholar]
- Seaver, J. Malampaya Deep Water Gas-to-Power Project: Malampaya Subsea Development. In Proceedings of the Offshore Technology Conference, Houston, TX, USA, 6–9 May 2002. OTC 14041. [Google Scholar]
- Dash, B.K. Deepwater Growth in Asia Pacific and Growing Regional Installation and Pipelay Vessels Capability to Meet the Challenges. In Proceedings of the Offshore Technology Conference, Houston, TX, USA, 15–28 March 2014. OTC-25002-MS. [Google Scholar]
- Kumar, A.; Ozah, R.; Noh, M.; Pope, G.A.; Bryant, S.; Sepehmoori, K.; Lake, L.W. Reservoir Simulation of CO2 Storage in Deep Saline Aquifers. SPE J. 2005. [Google Scholar] [CrossRef]
- Usman; Iskandar, U.P.; Sugihardjo, S.; Lastiadi, S.H. A Systematic Approach to Source-Sink Matching for CO2-EOR and Sequestration in South Sumatera. Energy Procedia 2014, 63, 7750–7760. [Google Scholar] [CrossRef] [Green Version]
- Hedriana, O.; Sugihardjo; Usman. Assessment of CO2-EOR and Storage Capacity in South Sumatera and West Java Basins. Energy Procedia 2017, 114, 4666–4678. [Google Scholar] [CrossRef]
- Energy Voice. Repsol Eyes Giant Carbon Storage Scheme in Indonesia. 17 March 2021. Available online: https://www.energyvoice.com/oilandgas/asia/307399/repsol-eyes-giant-carbon-storage-scheme-in-indonesia/ (accessed on 18 June 2021).
- Khan, M.H.A.; Daiyan, R.; Neal, P.; Haque, N.; MacGill, I.; Amal, R. A Framework for Assessing Economics of Blue Hydrogen Production from Steam Methane Reforming Using Carbon Capture Storage & Utilisation. Int. J. Hydrogen Energy 2021, 46, 22685–22706. [Google Scholar]
- Navas-Anguita, Z.; Garcia-Gusano, D.; Dufour, J.; Iribarren, D. Revisiting the Role of Steam Methane Reforming with CO2 Capture and Storage for Long-term Hydrogen Production. Sci. Total Environ. 2021, 771, 145432. [Google Scholar] [CrossRef] [PubMed]
- Channel News Asia (CNA). 28,000 Charging Stations for Electric Cars is Possible—But Where? Industry Players Weigh in. 11 March 2020. Available online: https://www.channelnewsasia.com/news/singapore/electric-vehicles-budget-2020-charging-points-energy-12512194 (accessed on 18 June 2021).
- Channel News Asia (CNA). Finland’s Neste Expands Singapore Refinery as It Taps Renewable Growth. 31 July 2019. Available online: https://www.channelnewsasia.com/news/business/finland-s-neste-expands-singapore-refinery-as-it-taps-renewable-11770298 (accessed on 18 June 2021).
- Straits Times, Singapore to Ramp Up Solar Energy Production to 350,000 Homes by 2030. 16 June 2021. Available online: https://www.straitstimes.com/singapore/environment/solar-energy-to-meet-4-of-singapores-energy-demand-by-2030-up-from-less-than-1 (accessed on 18 June 2021).
- Straits Times. EMA Seeks Approval for Trial to Import Electricity from Malaysia. 5 March 2021. Available online: https://www.straitstimes.com/business/economy/ema-seeks-proposals-for-trial-to-import-electricity-from-malaysia (accessed on 12 June 2021).
- Channel News Asia (CNA). SP Group Launches First Zero-Emission Building in Southeast Asia Powered by Green Hydrogen. 30 October 2019. Available online: https://www.channelnewsasia.com/news/singapore/sp-group-first-zero-emission-building-green-hydrogen-12046124 (accessed on 18 June 2021).
- Straits Times, NUS Launches Singapore’s First Net-zero Energy Building to be Built from Scratch. 30 Jan 2019. Available online: https://www.straitstimes.com/singapore/environment/nus-launches-singapores-first-net-zero-energy-building-to-be-built-from (accessed on 18 June 2021).
- Eco-Business. Singapore’s Recycling Rate Falls to 10-year Low. 23 April 2021. Available online: https://www.eco-business.com/news/singapores-recycling-rate-falls-to-10-year-low/ (accessed on 16 June 2021).
- Ministry of Environment and Water Resources of Singapore (MEWR). Zero Waste Masterplan Singapore. 2019. Available online: https://www.towardszerowaste.gov.sg/images/zero-waste-masterplan.pdf (accessed on 1 October 2021).
- Ministry of Economy, Trade and Industry of Japan (METI). Basic Hydrogen Strategy. 2017. Available online: https://www.meti.go.jp/english/press/2017/pdf/1226_003b.pdf (accessed on 1 October 2021).
- Australian Renewable Energy Agency (ARENA). Opportunities for Australia from Hydrogen Exports. 2018. Available online: https://arena.gov.au/assets/2018/08/opportunities-for-australia-from-hydrogen-exports.pdf (accessed on 1 October 2021).
- Intralink. The Hydrogen Economy South Korea. 2021. Available online: https://www.intralinkgroup.com/Syndication/media/Syndication/Reports/Korean-hydrogen-economy-market-intelligence-report-January-2021.pdf (accessed on 1 October 2021).
- Ministry of Business, Innovation & Employment (MBIE). A Vision for Hydrogen in New Zealand. New Zealand Government. 2019. Available online: https://www.mbie.govt.nz/dmsdocument/6798-a-vision-for-hydrogen-in-new-zealand-green-paper (accessed on 1 October 2021).
- Straits Times. Singapore Firm to Make Hydrogen Fuel Cell Vehicles. 6 December 2020. Available online: https://www.straitstimes.com/singapore/transport/singapore-firm-to-make-hydrogen-fuel-cell-vehicles (accessed on 18 June 2021).
- Argus. Australia, Singapore Partner on Maritime Hydrogen. 17 June 2021. Available online: https://www.argusmedia.com/en/news/2225624-australia-singapore-partner-on-maritime-hydrogen (accessed on 18 June 2021).
- Channel News Asia (CNA). Shell to Trail First Hydrogen Cells for Ships in Singapore. 21 April 2021b. Available online: https://www.channelnewsasia.com/news/business/shell-to-trial-first-hydrogen-fuel-cells-for-ships-in-singapore-14664100 (accessed on 18 June 2021).
- Bui, M.; Adjiman, C.; Bardow, A.; Anthony, E.J.; Boston, A.; Brown, S.; Fennell, P.S.; Fuss, S.; Galindo, A.; Hackett, L.A.; et al. Carbon Capture and Storage (CCS): The Way Forward. Energy Environ. Sci. 2018, 11, 1062. [Google Scholar]
- Kumar, L.; Hasanuzzaman, M.; Rahim, N.A. Global Advancement of Solar Thermal Energy Technologies Process Heat and Its Future Prospects: A Review. Energy Convers. Manag. 2019, 195, 885–908. [Google Scholar] [CrossRef]
- Lau, H.C. Offshore Wind Energy in Asia: Technical Challenges and Opportunities. In Proceedings of the Paper presented at the Offshore Technology Conference, Kuala Lumpur, Malaysia, 2–6 November 2020. OTC-30244-MS. [Google Scholar]
- Renewable Energy World. Singapore Wants to Trade Renewable Energy with Its Neighbors. 11 April 2019. Available online: https://www.renewableenergyworld.com/solar/singapore-wants-to-trade-renewable-energy-with-its-neighbors/#gref (accessed on 18 June 2019).
- Bina, S.M.; Jalilinasrabady, S.; Fujii, H.; Pambudi, N.A. Classification of Geothermal Resources in Indonesia by Applying Exergy Concept. Renew. Sustain. Energy Rev. 2018, 93, 499–506. [Google Scholar] [CrossRef]
- Sanz-Perez, E.S.; Murdock, C.R.; Didas, S.A.; Jones, C.W. Direct Capture of CO2 from Ambient Air. Chem. Rev. 2016, 116, 11840–11876. [Google Scholar] [CrossRef] [PubMed]
- International Energy Agency (IEA). Direct Air Capture Tracking Report—June 2020. Available online: https://www.iea.org/reports/direct-air-capture (accessed on 22 June 2021).
- Global CCS Institute. Global Status of CCS 2020. Melbourne, Australia. Available online: https://www.globalccsinstitute.com/wp-content/uploads/2020/11/Global-Status-of-CCS-Report-2020_FINAL.pdf (accessed on 1 October 2021).
- Li, H.; Lau, H.C.; Wei, X.; Liu, S. CO2 Storage Potential in Major Oil and Gas Reservoirs in the Northern South China Sea. Int. J. Greenhouse Gas Control 2021, 108, 103328. [Google Scholar] [CrossRef]
- Global CCS Institute. ASEAN CCS Strategic Considerations. Melbourne, Australia. 2014. Available online: https://aseanenergy.org/asean-ccs-strategic-considerations/ (accessed on 1 October 2021).
- Asian Development Bank (ADB). Prospects for Carbon Capture and Storage in Southeast Asia. Manila, Philippines 2013. Available online: https://www.adb.org/sites/default/files/publication/31122/carbon-capture-storage-southeast-asia.pdf (accessed on 1 October 2021).
- Indonesia CCS Study Working Group. Understanding Carbon Capture and Storage Potential in Indonesia. 2009. Available online: https://ukccsrc.ac.uk/sites/default/files/publications/ccs-reports/DECC_CCS_117.pdf (accessed on 1 October 2021).
- Lau, H.C.; Ramakrishna, S.; Zhang, K.; Radhamani, A.V. The Role of Carbon Capture and Storage in the Energy Transition. Energy Fuels 2021, 35, 7364–7386. [Google Scholar] [CrossRef]
- Tanner, C.S.; Baxley, P.T.; Crump, J.G.; Miller, W.C. Production Performance of the Wasson Denver Unit CO2 Flood. In Proceedings of the SPE/DOE Enhanced Oil Recovery Symposium, Tulsa, OK, USA, 22–24 April 1992. Paper SPE-24156-MS. [Google Scholar]
- Heidug, W.; Lipponen, J.; McCoy, S.; Bonoit, P. Storing CO2 Through Enhanced Oil Recovery: Combining EOR with CO2 Storage (EOR+) for Profit; International Energy Publications: Paris, France, 2015. [Google Scholar]
- Hansen, O.; Eiken, O.; Ostmo, S.; Johansen, R.L.; Smith, A. Monitoring CO2 Injection into a Fluvial Brine-filled Sandstone Formation at the Snohvit Field. In Proceedings of the SEG Annual Meeting, San Antonio, TX, USA, 18–23 September 2011. [Google Scholar]
- Equinor. Northern Lights Project Concept Report RE-PM673-00001; Equinor: Stavanger, Norway, 2019. [Google Scholar]
- Equinor. Northern Lights CCS. 2021. Available online: https://www.equinor.com/en/what-we-do/northern-lights.html (accessed on 19 June 2021).
- Lau, H.C.; Ramakrishna, S.A. Roadmap for Decarbonization of Singapore and Its Implications for ASEAN—Opportunities for 4IR Technologies and Sustainable Development. In Asia Pacific Tech Monitor; April–June; Asian and Pacific Centre for Transfer of Technology: New Delhi, India; United Nations Economic and Social Commission for Asia and the Pacific: Bangkok, Thailand, 2021. [Google Scholar]
- Commonwealth Scientific and Industrial Research Organization (CSIRO). National Hydrogen Roadmap: Pathways to an Economically Sustainable Hydrogen Industry in Australia. 2018. Available online: https://www.csiro.au/en/work-with-us/services/consultancy-strategic-advice-services/csiro-futures/futures-reports/hydrogen-roadmap (accessed on 1 October 2021).
- Reuters. Saudi NEOM JV Working with Lazard on $5 billion Hydrogen Project-Sources. 13 January 2021. Available online: https://www.reuters.com/article/saudi-neom-hydrogen-lazard-int-idUSKBN29I1IE (accessed on 22 June 2021).
- World Oil. Abu Dhabi Targets Hydrogen as a Future Export Fuel. 17 January 2021. Available online: https://www.worldoil.com/news/2021/1/15/abu-dhabi-targets-hydrogen-as-a-future-export-fuel (accessed on 22 June 2021).
- Power Engineering International (PEI). Hydrogen Use Needs to Hit 212 million Mt by 2030 for Net-Zero: IEA. 18 May 2021. Available online: https://www.spglobal.com/platts/en/market-insights/latest-news/electric-power/051821-hydrogen-use-needs-to-hit-212-million-mt-by-2030-for-net-zero-iea (accessed on 22 June 2021).
- Augusmedia. Shell to Cut Singapore Bukom Refinery Capacity in July. 5 May 2021. Available online: https://www.argusmedia.com/en/news/2211860-shell-to-cut-singapore-bukom-refinery-capacity-in-july#:~:text=Shell%20will%20reduce%20capacity%20at,to%20cut%20its%20carbon%20emissions (accessed on 1 October 2021).
- Reuters. Shell to Cut Jobs and Capacity at Major Singapore Refinery. 10 November 2020. Available online: https://www.reuters.com/article/us-shell-singapore-idUSKBN27Q1N5 (accessed on 20 July 2021).
- Straits Times. Exxon Says It Remains Committed to Singapore Refinery Expansion. 12 November 2020. Available online: https://www.straitstimes.com/business/companies-markets/exxon-says-it-remains-committed-to-singapore-refinery-expansion (accessed on 1 October 2021).
- Channel News Asia (CNA). ExxonMobil Commits to Multi-billion Dollar Expansion of Singapore Manufacturing Complex. 02 April 2019c. Available online: https://www.exxonmobil.com/en/basestocks/news-insights-and-resources/press-coverage/singapore-refinery-expansion (accessed on 20 July 2021).
- Schonsteiner, K.; Massier, T.; Hamacher, T. Sustainable Transport by Use of Alternative Marine and Aviation Fuels—A Well-to-tank Analysis to Assess Interactions with Singapore’ Energy System. Renew. Sustain. Energy Rev. 2016, 65, 853–871. [Google Scholar] [CrossRef]
- International Energy Agency (IEA). The Future of Petrochemicals: Towards More Sustainable Plastics and Fertilisers; IEA Publications: Paris, France, 2018. [Google Scholar]
- Channel News Asia (CNA). Commentary: Electric Vehicles Will Take Over Singapore. But Here’s What Must Happen First. 23 February 2021a. Available online: https://www.channelnewsasia.com/news/commentary/singapore-budget-2020-electric-vehicles-ice-ves-hybrid-car-2040-12457240#:~:text=Singapore%20has%20announced%20ambitious%20targets,EVs)%20in%20the%20intervening%20years (accessed on 22 June 2021).
- Chemical Engineer. Neste Expands Singapore Biofuels Refinery. 9 August 2019. Available online: https://www.thechemicalengineer.com/news/neste-expands-singapore-biofuels-refinery (accessed on 1 October 2021).
- Marine and Port Authority of Singapore (MPA). Facts and Trivia. Available online: https://www.mpa.gov.sg/web/portal/home/maritime-singapore/introduction-to-maritime-singapore/facts-and-trivia (accessed on 20 July 2021).
- International Energy Agency (IEA). Carbon Capture and Storage and the London Protocol: Options for Enabling Transboundary CO2 Transfer; IEA Publications: Paris, France, 2011. [Google Scholar]
- United Nations Environmental Program (UNEP). Basel Convention on the Control of Transboundary Movements of Hazardous Wastes and Their Disposal. 1989. Available online: https://www.basel.int/Portals/4/Basel%20Convention/docs/text/BaselConventionText-e.pdf (accessed on 1 October 2021).
Publisher’s Note: MDPI stays neutral with regard to jurisdictional claims in published maps and institutional affiliations All authors have read and agreed to the published version of the manuscript.. |
© 2021 by the authors. Licensee MDPI, Basel, Switzerland. This article is an open access article distributed under the terms and conditions of the Creative Commons Attribution (CC BY) license (https://creativecommons.org/licenses/by/4.0/).