Abstract
The global demand for air conditioners (ACs) has more than tripled since 1990, with 1.6 billion units currently in use. With the rapid economic and population growth of countries located in the hottest parts in the world, this trend is likely to continue in the future. The aim of this study was to show the benefits of introducing air conditioners with different materials or different technologies such as inverters with high energy-saving performance on the environment and human health in Indonesia. To evaluate the environmental impacts of the different technologies, a cradle-to-grave life cycle assessment (LCA) of air conditioners was conducted using the life-cycle impact assessment method based on endpoint modeling (LIME3). As expected, the use stage has the largest global warming potential (GWP), representing more than 90% of the impact, whereas copper and nickel have the most important impact in terms of resource consumption (about 50%). We found that the impacts are heavily dependent on the country’s energy mix, but reduction can be achieved by introducing better technologies. The integration factors from LIME3 were then applied to estimate the external cost of each model; the results showed that the use stage also has the most influence. Even though the impact of climate change is important, air pollution impact must be seriously considered as its impact was found to be the highest (about 60% of the total impact). The external cost was finally compared to the possible benefits produced by the introduction of air conditioning technologies during their 10-year life cycle. We found that the impacts are twice that of the benefit for the best model (USD 2003 vs. 1064); however, the novelty of this study is that the benefit was also considered. In the future, developing countries should promote AC models with inverters, refrigerants with low global warming impact such as natural refrigerants, and encourage the recycling of units as soon as possible. The energy mix for electricity production is also a key parameter to consider.
1. Introduction
The World Health Organization (WHO) estimated that, between 2030 and 2050, climate change could result in 250,000 additional deaths per year due to malnutrition, malaria, diarrhea, and heat stress [1]. The latter would account for 38,000 deaths, especially the heat exposure of elderly people. For example, during the heat waves in the summer of 2003 in Europe, more than 70,000 deaths were recorded [2]. Air conditioning would be one of the options to tackle this problem; the use of air conditioners is already growing around the world due to the increase in temperature and the steady growth of the economy of countries located in the hottest parts of the world. According to a report published by the International Energy Agency (IEA) [3], the stock of air conditioners (ACs) increased by nearly three times between 1990 and 2016. This increase has impacted the total energy consumed for space cooling (2020 TWh in 2016) and therefore the rise in CO2 emissions from the building sector. Space cooling emits about 1000 Mt of CO2 every year globally, which accounts for more than 10% of the building sector’s emissions.
The global stock of residential air conditioners was around 1093 million in 2016 [3], with the highest shares in China (40%), the USA (22%), and Japan (11%). Some newly industrialized countries have shown a growing market stock in recent years; for example, India, with an annual growth rate of 10% on average. In the newly industrialized countries, the impact of air conditioning could be potentially high in the future as, firstly, they are mostly located in the warmest part of the globe and, secondly, the population and economic growth are also important. As such, it is necessary to assess and predict the possible impacts of cooling technology in those regions before their full implementation.
The energy mix differs between countries; therefore, the environmental impacts due to the electricity consumption induced by air conditioning can differ by region. For example, the energy mix has huge impacts, especially in Indonesia due to the high reliance on fossil fuels such as coal (as fossil-based energies produce large amounts of greenhouses gas (GHG) emissions and air pollutants emissions such as PM2.5, NOx, or SO2 [4]), which accounts for 54% of the national energy mix [5]. Therefore, we chose to focus on a newly industrialized country in this study: Indonesia. In addition to the information above, Indonesia was chosen because the country has a dynamic air conditioning market; in addition, the number of cooling degree days (CDDs), for example, which quantifies the demand for energy needed to cool buildings, is among the highest in the world, with more than 3000 CDDs in 2016 [3]. It was also predicted that the economic growth in Indonesia will remain high in the future: between 3% and 6% annually until 2050 [6].
In Indonesia, several key points concerning the electricity consumption can be highlighted: The residential sector shows a high share in the country electricity consumption with a share of 42% (Figure 1) even though the influence of air conditioning is still low as the total ownership in the country is below 5%.
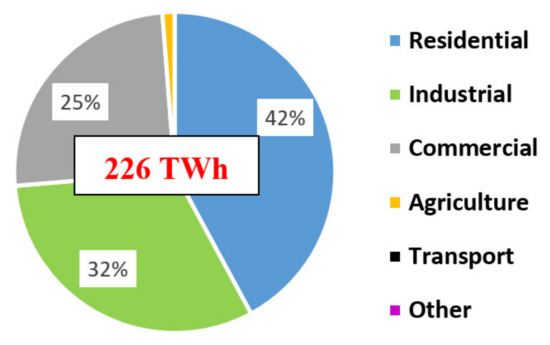
Figure 1.
Electricity consumption by sector in Indonesia (2016 figures).
Concerning the application of life cycle assessment (LCA), surprisingly, few studies tried to evaluate the different impacts of residential air conditioners; however, the interest in this has been growing in recent years. Zhang et al. [7] focused on a Chinese megacity and reported that the carbon dioxide emissions related to residential air conditioning in Shenzhen, China, increased from 2.2 million to 5.1 million tonnes (Mt) CO2 eq. between 2005 and 2017. This corresponds to the total CO2 emissions of a country such as New Zealand; if the same trend is maintained, the authors predicted that emissions could reach almost 10 Mt by 2030. Beshr et al. [8] showed that, by shifting from R-410A to low global warming potential (GWP) refrigerant in residential air conditioners, the total CO2 emissions could be reduced by 30%. Gheewela et al. [9] focused on the advantage of central air-conditioning systems compared with individual (split) systems: the central system emitted 40% less CO2. Almutairi et al. [10] showed that steel and copper have the greatest influence on resource consumption impact in AC manufacturing. Liu et al. [11] confirmed that transport-related impacts are negligible when considering the total life cycle of air conditioner systems. Shah et al. [12] and Li et al. [13] reported the influence of the electricity mix by comparing the environmental impacts (indirect emissions) of air-conditioning in different American states. They highlighted the role of energy efficiency enhancement. Irshad et al. [14] further demonstrated the importance of energy consumption for split conditioners (conventional system) compared with photovoltaic (PV)-connected thermoelectric air-cooling duct systems. As a result, the conventional system CO2 emissions per life cycle were found to be 60 tonnes higher.
To the best of our knowledge, from the LCA perspective, few studies have focused on newly industrialized countries. Although Almutairi et al. [10] considered the life cycle cost (LCC) of ACs, the research papers found in the literature did not consider the possible health benefits induced by the introduction of air conditioning using a cost–benefit analysis. Generally, LCA only considers mitigation for addressing climate change; therefore, adaption consideration has not been clearly identified.
We aimed to fill these gaps by providing a deep life cycle assessment from materials/parts manufacturing to disposal/recycling in a newly industrialized country: Indonesia. In addition to LCA, we applied a cost–benefit approach considering the possible health damages avoided by introducing different ACs technologies.
We mainly focused on climate change, resource depletion, air pollution, and water impacts as the main environmental impacts related to air-conditioner use. We also evaluated the environmental cost using integration. SimaPro 9 [15], which includes the Ecoinvent v3 database [16], was used for this study as it contains specific processes related to the Indonesian situation such as electricity generation. The life-cycle impact assessment method based on endpoint modeling (LIME3) [17,18,19] was used as the life cycle impact assessment (LCIA) method. Several LCIA methods exist that are capable of evaluating a specific impact on the regional scale: Recipe2016 [20], ImpactWorld+ [21], and LIME3. The latter can cover an extensive range of impact categories such as: climate change [22,23], air pollution [24,25], and water consumption [26], and their impacts on four areas of protection (human health, social asset, biodiversity, and primary production). It can provide weighting of factors specific to G20 countries, which helps to convert all the different impacts at the endpoint into a single indicator, which is expressed in a monetary value (USD). For the health benefits, a study was conducted in Indonesia to estimate the possible heat stress reduction from fatigue and sleeping difficulty when introducing air conditioning technology [27].
2. Materials and Methods
An LCA study was used to evaluate the environmental impacts of air conditioners in Indonesia. The advantage of LCA is that all impacts can be tracked from material production to product recycling.
2.1. Air-Conditioner
The following stages were considered: materials extraction and manufacturing, product manufacturing, distribution, use and disposal/recycling as described in Figure 2.
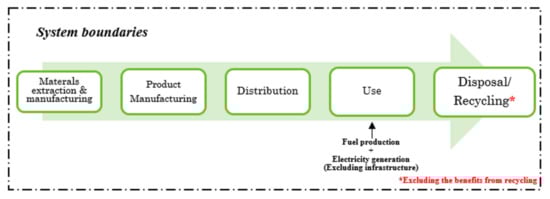
Figure 2.
System boundaries of this study.
An air conditioning system is mainly composed of two units: one indoor and one outdoor (Figure A1). The following major components are found inside these units: heat exchanger, motor, and compressor. Stainless steel, aluminum, copper, and plastic are the main materials used for the units (Figure A2). Three models from the same manufacturer were considered in our analysis, as shown in Table 1. All the data presented in the table were provided by the manufacturer. IDN26YES is the highest-performing model, including an inverter and high-performance refrigerant R32 (GWP: 675). The models IDN26NOH and IDN26NOL do not have an inverter and the difference between them is the refrigerant, R410A (GWP: 2090) being a low-performance refrigerant. The cooling capacity of all the models is 2.6 kW and the total weight of the residential ACs is around 40 kg. The lifetime of all the models is 10 years, and the functional unit (FU) was chosen to be similar to that adopted in previous studies: for the climate control of 1 m2 of living area maintained for one year. Refrigerant leaks were also considered for each model. The models are produced in Thailand and later exported by ships to Indonesia to be sold and installed.

Table 1.
Summary of the ACs models evaluated in this study.
2.2. Electricity Mix
Data from the IEA [5] were used as shown in Figure A3. Of the electricity, 54% is generated from coal, 10% from oil, and 23% from natural gas. All this information is contained in the Ecoinvent database included in Simapro 9.
2.3. LIME3
We used LIME3 to evaluate the environmental impacts related to the AC life cycle. This LCIA method includes nine impact categories and four endpoints (human health expressed in DALY, social assets expressed in USD, biodiversity expressed in EINES, and primary production expressed in NPP), as illustrated in Figure 3. Four impact categories were selected for this study: climate change, air pollution, resource consumption (fossil fuels and mineral resources consumption), and water use. As explained in the Introduction, this method was chosen as it can analyze several impact categories and weight the different impacts, and provides the results using a single indicator. LIME3 provides the integration factors for most of the countries in the world, so it was well-adapted to our need to evaluate the impact of air conditioners in Indonesia. LIME3 can also consider the trade structure between countries, which enables adequately estimating the damage caused in the country where the resource is extracted when the unit of resource is consumed in another country. A discount rate is also included (3%, 5%, or 7%) to integrate the future cash flows, representing how much importance is assigned to today’s decision concerning the future scarcity of resources: a lower rate indicates higher stress placed on the necessity for resource savings. We chose 3% in this study based on the knowledge that existing oil resources in Indonesia are very limited and have continually decreased in recent years [28].
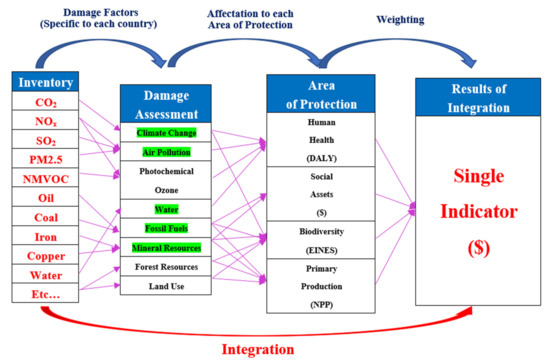
Figure 3.
The life-cycle impact assessment method based on endpoint modeling (LIME3) framework. Impact categories assessed in this study are highlighted in green; fossil- and mineral-resources-related impacts are aggregated and described further in this study as resource consumption.
The external cost (EC) in LIME3 can be simply viewed as the product of two items: the inventory result and the integration factor (IF), which is the product of the damage factor (or endpoint characterization factor) and the economic value conversion factor:
where Inv(X) is the quantity of the inventory item X, IFimpact is the integration factor related to the Impact caused by the inventory item X extended to the area of protection (Safe), DFimpact is the damage factor related to the Impact caused by the inventory item X extended to the Safe area of protection, and EV(Safe) is the economic value conversion factor based on weighting for the damage of one unit of the Safe area of protection. For example, X is the total emissions of CO2, Impact is climate change, and Safe is human health. The CO2 emissions are then expressed in kg, the damage factor in disability-adjusted life year (DALY)/kgCO2, and the economic value conversion factor in USD/DALY, so the integration factor is expressed directly in USD/kgCO2.
The EVs for each area of protection were obtained based on the G20 countries’ average weighting factor [19].
2.4. Cost–Benefit
The definitions of cost and benefit in this research are:
- -
- Cost = External cost associated to air conditioner installation.
- -
- Benefit = Health effects reduction by introducing air conditioners (sleeping difficulty)
- -
- Cost-benefit ratio = Benefit/Cost (B/C).
Regarding the cost–benefit ratio, an adaptation effect exists if B/C ≥ 1, and no adaptation effect exists if B/C < 1.
2.4.1. Cost
The cost in this paper is defined as the external cost due to the introduction of the air conditioner, as described in Section 2.3.
2.4.2. Benefit
As mentioned earlier, the benefit in this paper is defined as health effects’ reduction by introducing air conditioners. Both housing and apartments were considered in the calculation. The health effect considered was sleeping difficulty, as one of the main health effects directly associated with heat. For heatstroke, there is no damage function linking health effects to air conditioning usage rate; it is difficult, at present, to quantify the heat reduction effects and, therefore, the DALY reduction by air conditioning introduction [25]. An indicator expressed in DALY is very useful to consider both mortality and morbidity; it represents the sum of the years of life lost (YLL) due to a disease (early death) plus the number of years lived with a disability (YLD). The DALY calculation procedure for sleeping difficulty is described in Figure 4 and below:
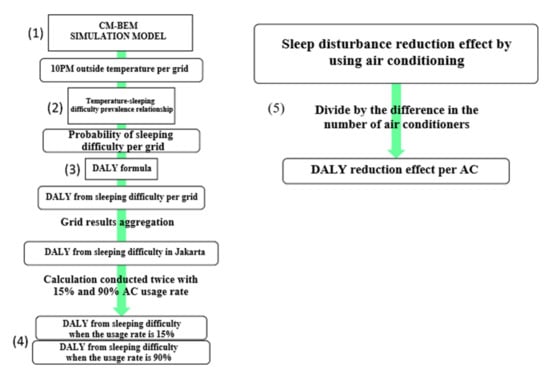
Figure 4.
Procedure for calculation of sleeping difficulty reduction.
- (1)
- A coupled urban canopy meteorological-building energy model (CM-BEM) [29] was used to estimate the temperature and AC electricity consumption. The CM-BEM is composed of two entities: a canopy model (CM) that can simulate weather conditions in a city block (grid) consisting of several buildings, and a building energy model (BEM) that simulates heat loads and energy consumption based on heat transfers in buildings. The model’s output is provided at the grid-scale level (each grid is about 1.2 km2) for the Jakarta metropolitan area (total of 15,525 grids). The model was used to estimate the change in temperature at 10 p.m. for each grid when air conditioner usage increases, as shown in Figure 5.
- (2)
- The CM-BEM model’s output was linked to two damage functions of sleep difficulty, under AC usage and under no AC usage, and by taking the weighted mean of sleeping difficulty prevalence rates based on different AC usage rates (15% and 90%), the daily sleep disturbance prevalence for each grid was calculated.
- (3)
- As a unit to quantify damages, we used disability-adjusted life year (DALY); DALY is calculated as the sum of years of life lost (YLL) and years lost due to disability (YLD). Sleep disturbance is not a direct cause of death; therefore, only YLD was considered. The number of incidence cases in Jakarta obtained in step 2 was used to estimate the YLD. For the disability weight for sleep disturbance, we referred to Fukuda et al. [30].
- (4)
- The DALY from sleeping difficulty when the AC usage rate is 15% and 90% was calculated (33,728 and 21,552 DALYs, respectively).
- (5)
- Monthly sleeping difficulty reduction effect per one AC unit was calculated by dividing the difference in the DALY from sleeping difficulty (the results per grid are shown in Figure 6) by the difference in the number of ACs in both usage scenarios (6,315,519 and 37,893,113 units for 15% and 90% usage rates, respectively).

Figure 5.
Variation of average temperature at 10 PM in August when air conditioner usage increases.
Figure 5.
Variation of average temperature at 10 PM in August when air conditioner usage increases.


Figure 6.
DALY reduction per grid following the introduction of air-conditioning.
Figure 6.
DALY reduction per grid following the introduction of air-conditioning.

3. Results
3.1. Midpoint Characterization
The results for the midpoint characterization are described in Figure 7. As LIME3 does not include a midpoint assessment, LIME2 [31] was used in this part. Two main categories likely to be the most important at midpoint were chosen: global warming and resource consumption. The method was used to evaluate the ACs in our study. For the global warming impact, the method is similar to the characterization adopted by the Intergovernmental Panel on Climate Change (IPCC) in 2013 [32], assessing the emissions of greenhouse gases generated, in kilograms of CO2 equivalent (kg-CO2eq), over a time horizon of 100 years. For resource consumption, the method is based on the extraction rate and the reserve base of the resource considered (e.g., aluminum or hard coal) relative to the depletion of the reference substance antimony; it is expressed in kilograms of Sb equivalent (kg-Sb eq).
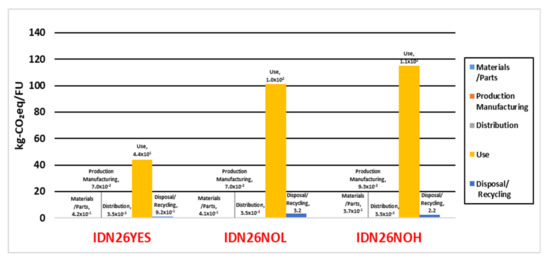
Figure 7.
Global warming potential (GWP) by stage.
Concerning global warming, most of the impact occurs as expected during the use phase. The electricity generation, which is mainly from coal in Indonesia, is one of the reasons for this finding. The presence of an inverter along with the higher-performing refrigerant justifies the difference of results between each model. Notably, the impact of the refrigerant is relatively low. Distribution has a low impact despite the models being produced in Thailand.
The impact of resource consumption is mainly caused by nickel and copper. The magnitude of the impact of copper agrees with the findings of previous existing studies; however, the impact of nickel was not expected. One of the reasons for this finding might be that the amount of nickel required to produce 1 kg of copper (0.03 kg) and 1 kg of iron (0.03 kg) in the Ecoinvent database being relatively high due to the mining stage. Additionally, the impact in LIME2 of 1 kg of iron is around 100 and 1000 times lower that the two previously cited materials for the same weight, respectively. Concerning the resource consumption breakdown by stage, the impact is important in both the material/parts and the use stages, as shown in Figure 8; however, the materials/parts manufacturing also has an influence due to the use of copper and iron in both indoor and outdoor units (60% to 90% of the impact during this stage occurred due to these parts). Due to the lack of information, the benefit induced by the recycling of materials could not be confirmed.
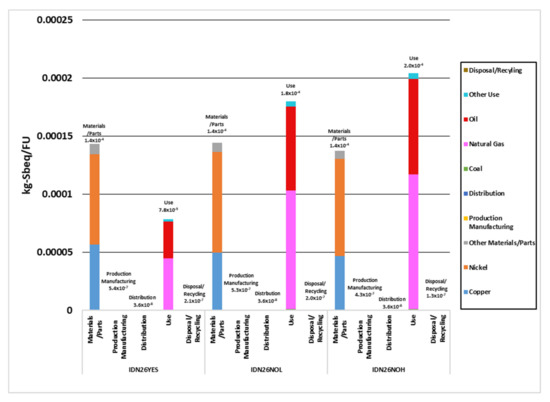
Figure 8.
Resource consumption by stage.
If focusing on the resources consumed by AC parts, as shown in the example in Figure 9, more than 50% of the resource consumption is due to the compressor and the heat exchangers, which are mainly composed of iron and copper. The remaining consumption is partly due to the indoor and outdoor unit bodies as well as piping. No significative difference was observed between the models with and without inverters.
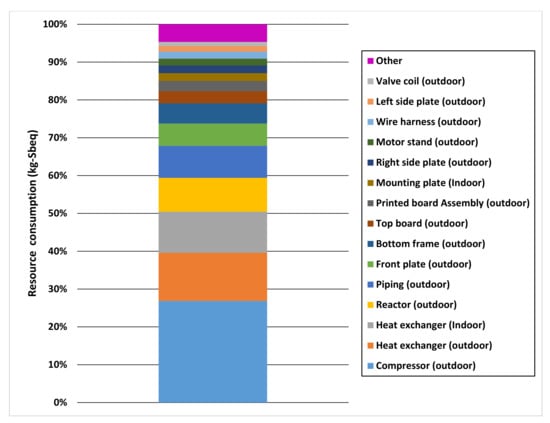
Figure 9.
Example of resource consumption by parts.
3.2. Integration
The integration introduced in the LIME3 method allows the estimation of the monetary valuation of the environmental impacts in USD on the global scale. Again, the total impact is mainly influenced by the use stage and electricity generation, as shown in Figure 10. Considering the contribution of each impact category (Figure 11), we found that climate impacts are mainly produced by the electricity generation. As a result, the models without inverters have a more than two-fold higher climate change impact. The impact on air pollution is greater than on climate change. Research concerning cooling, in general, have only focused on climate change. As such, it is important to compare both impacts, especially when evaluating electronic appliances in developing countries or newly industrialized countries, as these countries often rely on fossil fuels to produce electricity. The emissions of PM2.5 per kWh produced in Indonesia is high (2.53 × 10⁻² kg/kWh) due to the use of lignite. Because Indonesia has limited oil resources and imports most of its oil from countries where the oil depletion is high, its integration factor is one of the highest globally in the LIME3 assessment method. As lignite is missing in the LIME3 method, we did not evaluate the depletion of this resource.
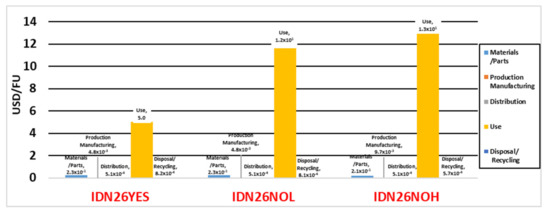
Figure 10.
Integration results by stage.
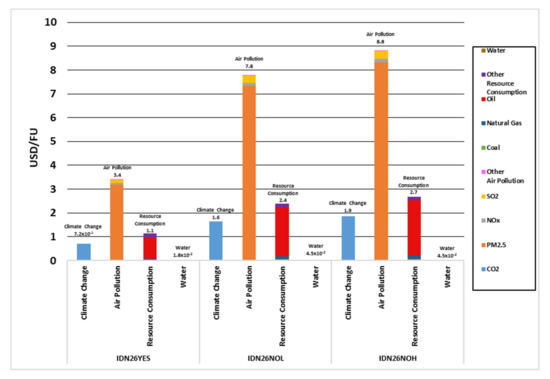
Figure 11.
Integration results by impact categories.
3.3. Cost-Benefit Analysis
As explained in Section 2.4.2, a cost–benefit analysis was conducted in Indonesia based on the previous results. This a novelty compared with previous studies. For this calculation, a 10-year life cycle per unit was considered. The reduction in the burden due to sleeping difficulties for 10 years per unit was estimated at 0.046 DALY (based on the procedure detailed in Figure 4). The health effect reduction, expressed in DALY, was converted into USD using the economic value conversion included in the LIME3 method: 1 DALY = USD 23,000.
To obtain the cost, the previous section’s results were utilized to obtain the impact of one unit during a full-life cycle (10 years). The total integration results (cost) were found to range from USD 2003–5088. The results for climate change were found to range from USD 273–709. The results for air pollution ranged from USD 1292–3343, and the results for resource consumption ranged from USD 432–1019. The results for water ranged from USD 7–17.
To obtain the benefit, the procedure described in Section 2.4.2 was used. By aggregating all the grid cells inside Jakarta City, it was found that period of 10 years, the total DALY from sleeping difficulty when the AC usage rate is 15% was: 4,047,386 DALY; when the usage rate is 90%: 2,586,252 DALY. Divided by the difference in the number of air conditioners in the two usage scenarios, we obtained a benefit of (4,047,386-2,586,252)/(37,893,113-6,315,519) = 4.63x10⁻² DALY/Unit or 1064USD/Unit (using the economic value conversion).
Figure 12 shows the results of the cost–benefit analysis. In all cases, the cost–benefit ratio (B/C) was below one (ranging from 0.21 to 0.53) due to the impact of the Indonesian electricity mix. However, we found that high-performance machines are effective in reducing environmental impacts due to the use of low GWP refrigerants and especially the energy-saving inverters.
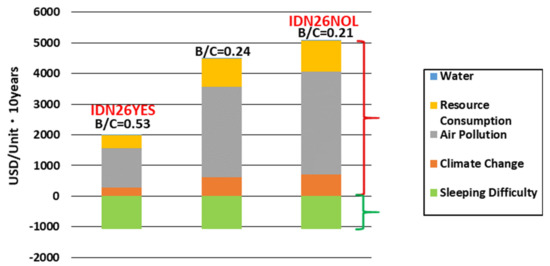
Figure 12.
Cost–benefit analysis for one AC life cycle.
4. Discussion
4.1. Climate Change and Air Pollution
The aim of this work was to understand the different impacts due to the use of air conditioning by consider the whole life cycle of room air conditioners, including materials/parts production, product manufacturing, distribution, use, and disposal/recycling. Our process was similar to that followed by Almutairi et al. [10]. A similar trend was found regarding the major impacts produced by the use stage due to electricity consumption from fossil fuels (more than 80% of the GWP in both studies); however, the impact of the refrigerant in our study is lower for several potential reasons: the R32 refrigerant has a lower GWP than R-134A (677 kg-CO2 vs. 1300 kg-CO2) and the mass of refrigerant, on average, used for the units in our study was half that of the model considering in Saudi Arabia (0.8 vs. 1.6 kg).
Our integration results showed that even if climate change is commonly thought of as the main impact of air conditioning, air pollution must also be seriously considered, especially in Asia where the population density is often high and where the electricity produced is mainly from fossil fuels. The WHO estimated that nearly 2,000,000 deaths occur every year due to air pollution in the region [33], and the emissions from electricity production, especially for cooling, are projected to become increasingly important by 2050 and 2100 [34].
As such, policymakers in newly-industrialized/developing countries should encourage investments in designated coal-fired power plant technologies to reduce the emissions of PM2.5, SO2 and NOx, such as electrostatic precipitator (ESP), flue gas desulfurization (FGD), or selective catalytic reduction (SCR).
To demonstrate the influence of the electricity mix, we considered the future projections from the Indonesian energy council (DEN) [35]. We compared our cost–benefit analysis results for the best machine considering a shift in the energy source using the two DEN scenarios for 2050: the sustainable development (SD) and low-carbon (LC) scenarios. The possible improvements in technologies for electricity production were omitted in this calculation. In the SD scenario, the mix is as follows: coal (39%), gas (33%), solar (19%), hydro (5%), geothermal (3%), and biomass (0.4%). In the LC scenario, the mix is: coal (32%), solar (29%), hydro (9%), wood (9%), biomass (8%), geothermal (6%), gas (5%), wind (1%), and waste (1%). As shown in Figure 13, the adaptative effect was confirmed in the low-carbon scenario (B/C = 1.10), highlighting the importance of the country’s energy mix. Indonesia has, according to previous studies, the second highest external cost for electricity generation among the G20 countries [36].
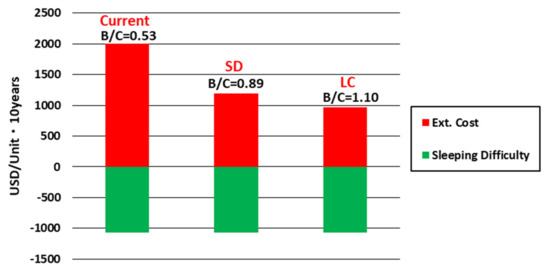
Figure 13.
Sensitivity analysis for cost-benefit analysis (IDN26YES).
4.2. Resource Consumption
For the resource consumption, compared to previous studies [10,13], we observed a high contribution at midpoint by nickel due to the relatively high amount required to produce 1 kg of copper and 1 kg of iron per the Ecoinvent database. As a comparison, a trial calculation was performed for the IDN26YES model using the Japanese LCI inventory database (IDEAv2 [37]): the impact of copper was estimated at the same level; however, the impact from nickel was estimated to be about five times lower. The impact at midpoint of iron is relative low due to the limited importance assigned to this resource by the LIME2 method. From the inventory provided by the air conditioning manufacturer, we could not confirm whether rare metals were involved in the production of the AC units. Recently, the criticality of rare metals has been a focus [38]; this could be a future topic of research.
Additionally, even if a questioner was sent to one of the main Japanese AC recycling plants, the exact recycling rate for the different units could not be confirmed as only the output of recycled materials is provided, without its corresponding input. For information purposes only, based on the amount of materials used for the Indonesian products in this study, the calculation led to a recycling rate of 76% for steel/iron, 58% for aluminum, and 43% for copper; it is difficult to judge whether these results are correct as the recycled products in the factory are provided by various manufacturers and the products were manufactured in the previous decade.
4.3. Importance of Inverter vs. Choice of Refrigerant
From the cost–benefit analysis presented in Section 3.3, we found that indirect emissions (due to electricity consumption) are more important than direct emissions (leaks from refrigerant). This is valuable information, as regulation tends to prioritize strict regulations concerning the GWP of refrigerants; however, the presence of an inverter has much more influence on the total impact through the indirect reduction of electricity consumption. Therefore, instead of accentuating the proliferation of several types of refrigerants, policymakers should focus more on regulations concerning the labelling to promote highly efficient AC units, as highlighted by Zhao et al. [39].
4.4. Future Tasks
This study shows that the impact of air conditioning in developing/newly industrialized countries could be important in the near future. Several studies have estimated future needs for cooling based on CDDs estimation [34,40,41]; this need is often expressed as total electricity consumption required for cooling or as the change in ownership rate. It was shown that two continents could experience a drastic rise in AC usage: Asia and Africa. However, no study has estimated the damage to human health from this rising number of units; based on the results provided in this research, the damage might be considerable. As the ownership rate is still assumed to be low but also relatively unknown in both regions, it is necessary to provide some estimation as soon as possible to enable joint discussion with policymakers and air conditioner makers to limit the impacts before the massive introduction of the technology to the market.
One of the other future tasks is to estimate the impacts of the future increase in the consumption of the current type of refrigerant and from future refrigerants. At the moment, R32, with a GWP of 675, appears to be the best solution in both developed and newly industrialized countries with its low flammability and lower GWP. However, to attain zero-carbon emissions from the sector, it is necessary to continue research on carbon-neutral refrigerants; most of the current options either perform poorly, resulting in lower efficiency of the unit, or are highly flammable [42]. Blending (mixture) refrigerants [43] or new types of natural refrigerants, such as CO2 or ammonia, could be options but further unit design adjustments are needed as the former requires high pressure, while the latter is not compatible with copper [44].
5. Conclusions
In this study, LCA was applied to three residential air conditioners in Indonesia. Two aspects of climate change impact reduction were considered: mitigation and adaptation. The aim was to understand the reduction of impacts by comparing different technology improvements such as the addition of an inverter or a refrigerant with a lower global warming potential (GWP). All the stages, from materials extraction to disposal/recycling, were included even though the benefits from recycling could not be confirmed. A weighting between four environmental impact categories (climate change, air pollution, resource consumption, and water) related to air-conditioner use was also considered. We confirmed that the GWP impact is mostly caused by the use stage (more than 90%), which is highly influenced by electricity generation. When examining the integration results, we found that the impacts from air pollution (more than 60% of the impact) are more important than climate change (about 15%) due to electricity generation from lignite, which has high potential for particulate matter emission. The remaining impact (about 15%) is due to resource consumption, as more than 10% of the Indonesian electricity is produced from oil. Finally, the impact due to water consumption was not important (less than 1%). The integration results also showed that the use stage is the most important to consider. A cost benefit–analysis was completed, and the benefit/cost ratio was calculated. When analyzing the total impacts for one 10-year life cycle, the total integration results (cost) were found to range from USD 2003–5088, whereas the benefit was calculated as USD 1064. The results for climate change were found to range from USD 273–709. The results for air pollution ranged from USD 1292–3343, and the results for resource consumption ranged from USD 432–1019. The results for water ranged from USD 7–17. This means that, using the best configuration, air conditioners’ benefits can cover half of the impacts due their use (B/C = 0.53). As shown in the sensitivity analysis, the benefit could become higher than the costs if Indonesia switches to a low-carbon mix (B/C = 1.10); therefore, an adaptive effect could be achieved. From the perspective of the air-conditioner market, in the future, it is necessary to continue the introduction of inverters as well as promote natural refrigerants such as CO2 or ammonia. From the energy sector perspective, based on the cost–benefit sensitivity analysis, it is necessary to switch to renewables (hydro, wind, and solar) and implement pollutant-reduction technologies for fossil-based electricity such electrostatic precipitator (ESP), flue gas desulfurization (FGD), or selective catalytic reduction (SCR). As stated by the IEA, if no actions are taken, the environmental impacts related to the use of air conditioners in South and Southeast Asia could become very important by 2050; space cooling could account, for example, for more than 10% of the total CO2 emissions from the energy sector. Therefore, it would be particularly interesting to estimate the future environmental impacts of air conditioning in each global region, especially in the developing countries which are currently mainly relying on fossil fuels for electricity generation.
Author Contributions
Conceptualization, S.K., T.I. and N.I.; methodology, S.K., T.I. and N.I.; software, S.K.; formal analysis, S.K.; investigation, S.K., T.I., T.K., and K.Y.; writing—original draft preparation, S.K.; supervision, N.I. All authors have read and agreed to the published version of the manuscript.
Funding
This research received no external funding.
Institutional Review Board Statement
Not applicable.
Informed Consent Statement
Not applicable.
Data Availability Statement
Most of the data used in this study are described in this manuscript. The remaining data (e.g., air conditioner materials/parts) used in this study are available on request from the corresponding author. The data are not publicly available due to a confidentiality agreement.
Acknowledgments
We would like to express our sincere gratitude to Fujimoto, S., Mikoshi, T. and Yoshizawa, M. of Daikin Industries, Ltd. for providing the primary data necessary for this study.
Conflicts of Interest
The authors declare no conflict of interest.
Appendix A

Figure A1.
Residential air conditioner assembly processes.
Figure A1.
Residential air conditioner assembly processes.


Figure A2.
Percentage of resources used for room air conditioners.
Figure A2.
Percentage of resources used for room air conditioners.


Figure A3.
Electricity generation mix for Indonesia.
Figure A3.
Electricity generation mix for Indonesia.

References
- World Health Organization. Available online: https://www.who.int/news-room/fact-sheets/detail/climate-change-and-health (accessed on 28 August 2019).
- Robine, J.-M.; Cheung, S.L.K.; Le Roy, S.; Van Oyen, H.; Griffiths, C.; Michel, J.-P.; Herrmann, F.R. Death toll exceeded 70,000 in Europe during the summer of 2003. Comptes Rendus Biol. 2008, 331, 171–178. [Google Scholar] [CrossRef] [PubMed]
- International Energy Agency (IEA). The Future of Cooling; IEA Publications: Paris, France, 2018. [Google Scholar]
- Turconi, R.; Boldrin, A.; Astrup, T.F. Life cycle assessment (LCA) of electricity generation technologies: Overview, comparability and limitations. Renew. Sustain. Energy Rev. 2013, 28, 555–565. [Google Scholar] [CrossRef]
- International Energy Agency (IEA). World Energy Balance 2018; IEA Publications: Paris, France, 2018. [Google Scholar]
- IMF. Available online: https://www.imf.org/external/pubs/ft/weo/2017/01/weodata/index.aspx (accessed on 28 August 2019).
- Zhang, N.; Wang, H.; Gallagher, J.; Song, Q.; Tam, V.W.; Duan, H. A dynamic analysis of the global warming potential as-sociated with air conditioning at a city scale: An empirical study in Shenzhen, China. Environ. Impact Assess. Rev. 2020, 81, 106354. [Google Scholar] [CrossRef]
- Beshr, M.; Aute, V.; Abdelaziz, O.; Fricke, B.; Radermacher, R. Potential emission savings from refrigeration and air condi-tioning systems by using low GWP refrigerants. Int. J. Life Cycle Assess. 2017, 22, 675–682. [Google Scholar] [CrossRef]
- Gheewala, S.H.; Nielsen, P.H. Central and individual air-conditioning systems—A comparison of environmental impacts and resource consumption in a life cycle perspective. Int. J. Sustain. Dev. World Ecol. 2003, 10, 149–155. [Google Scholar] [CrossRef]
- Almutairi, K.; Thoma, G.; Burek, J.; Algarni, S.; Nutter, D. Life cycle assessment and economic analysis of residential air conditioning in Saudi Arabia. Energy Build. 2015, 102, 370–379. [Google Scholar] [CrossRef]
- Liu, S.; Schulz, U.W.; Sapar, M.H.; Qian, S. Evaluation of the environmental performance of the chilled ceiling system using life cycle assessment (LCA): A case study in Singapore. Build. Environ. 2016, 102, 207–216. [Google Scholar] [CrossRef]
- Shah, V.P.; DeBella, D.C.; Ries, R.J. Life cycle assessment of residential heating and cooling systems in four regions in the United States. Energy Build. 2008, 40, 503–513. [Google Scholar] [CrossRef]
- Li, G. Investigations of life cycle climate performance and material life cycle assessment of packaged air conditioners for residential application. Sustain. Energy Technol. Assess. 2015, 11, 114–125. [Google Scholar] [CrossRef]
- Irshad, K.; Habib, K.; Algarni, S.; Saha, B.B.; Jamil, B. Sizing and life-cycle assessment of building integrated thermoelectric air cooling and photovoltaic wall system. Appl. Therm. Eng. 2019, 154, 302–314. [Google Scholar] [CrossRef]
- PRé Sustainability B.V., The Netherlands. Simapro. Available online: https://simapro.com/ (accessed on 15 January 2020).
- Ecoinvent v3 Database, Switzerland. Available online: https://www.ecoinvent.org/ (accessed on 15 January 2020).
- Inaba, A.; Itsubo, N. Preface. Int. J. Life Cycle Assess. 2018, 23, 2271–2275. [Google Scholar] [CrossRef]
- Itsubo, N.; Murakami, K.; Kuriyama, K.; Yoshida, K.; Tokimatsu, K.; Inaba, A. Development of weighting factors for G20 countries—Explore the difference in environmental awareness between developed and emerging countries. Int. J. Life Cycle Assess. 2015, 23, 2311–2326. [Google Scholar] [CrossRef]
- Murakami, K.; Itsubo, N.; Kuriyama, K.; Yoshida, K.; Tokimatsu, K. Development of weighting factors for G20 countries. Part 2: Estimation of willingness to pay and annual global damage cost. Int. J. Life Cycle Assess. 2017, 23, 2349–2364. [Google Scholar] [CrossRef]
- Huijbregts, M.A.J.; Steinmann, Z.J.N.; Elshout, P.M.F.; Stam, G.; Verones, F.; Vieira, M.; Zijp, M.; Hollander, A.; Van Zelm, R. ReCiPe2016: A harmonised life cycle impact assessment method at midpoint and endpoint level. Int. J. Life Cycle Assess. 2017, 22, 138–147. [Google Scholar] [CrossRef]
- Bulle, C.; Margni, M.; Patouillard, L.; Boulay, A.-M.; Bourgault, G.; De Bruille, V.; Cao, V.; Hauschild, M.; Henderson, A.; Humbert, S.; et al. IMPACT World+: A globally regionalized life cycle impact assessment method. Int. J. Life Cycle Assess. 2019, 24, 1653–1674. [Google Scholar] [CrossRef]
- Tang, L.; Ii, R.; Tokimatsu, K.; Itsubo, N. Development of human health damage factors related to CO2 emissions by con-sidering future socioeconomic scenarios. Int. J. Life Cycle Assess 2018, 23, 2288–2299. [Google Scholar] [CrossRef]
- Tang, L.; Higa, M.; Tanaka, N.; Itsubo, N. Assessment of global warming impact on biodiversity using the extinction risk index in LCIA: A case study of Japanese plant species. Int. J. Life Cycle Assess. 2017, 23, 314–323. [Google Scholar] [CrossRef]
- Tang, L.; Nagashima, T.; Hasegawa, K.; Ohara, T.; Sudo, K.; Itsubo, N. Development of human health damage factors for PM2.5 based on a global chemical transport model. Int. J. Life Cycle Assess. 2018, 23, 2300–2310. [Google Scholar] [CrossRef]
- Tang, L.; Nagashima, T.; Hasegawa, K.; Ohara, T.; Sudo, K.; Itsubo, N. Development of human health damage factors for tropospheric ozone considering transboundary transport on a global scale. Int. J. Life Cycle Assess. 2015, 23, 2339–2348. [Google Scholar] [CrossRef]
- Motoshita, M.; Ono, Y.; Pfister, S.; Boulay, A.; Berger, M.; Nansai, K.; Tahara, K.; Itsubo, N.; Inaba, A. Consistent charac-terisation factors at midpoint and endpoint relevant to agricultural water scarcity arising from freshwater consumption. Int. J. Life Cycle Assess. 2014, 23, 2276–2287. [Google Scholar] [CrossRef]
- Kuwayama, T.; Yamaguchi, K.; Okada, K.; Kikegawa, Y.; Kanda, M.; Varquez, A.C.G.; Darmanto, N.S.; Darmanto, P.S.; Ihara, T. Reduction Effect of DALY of Sleep Disturbance and Fatigue by Air Conditioner Evaluation in Jakarta, Indonesia. J. Life Cycle Assess. Jpn. 2019, 15, 2–9. [Google Scholar] [CrossRef]
- EIA. Petroleum and Other Liquids Reserves. Available online: https://www.eia.gov/international/data/world/petroleum-and-other-liquids/annual-crude-and-lease-condensate-reserves?pd=5&p=0000000000000000000008&u=0&f=A&v=mapbubble&a=-&i=none&vo=value&t=C&g=00000000000000000000000000000000000000000000000001&l=249-ruvvvvvfvtvnvv1vrvvvvfvvvvvvfvvvou20evvvvvvvvvvnvvvs0008&s=315532800000&e=1577836800000& (accessed on 30 December 2020).
- Ihara, T.; Kikegawa, Y.; Asahi, K.; Genchi, Y.; Kondo, H. Changes in year-round air temperature and annual energy consumption in office building areas by urban heat-island countermeasures and energy-saving measures. Appl. Energy 2008, 85, 12–25. [Google Scholar] [CrossRef]
- Fukuda, S.; Ihara, T.; Genchi, Y.; Narumi, D. Japanese sleep disturbance and fatigue disability weights in evaluating the effects of increasing temperatures on health by a life cycle approach. Int. J. Life Cycle Assess. 2013, 18, 1089–1097. [Google Scholar] [CrossRef]
- LCA-Forum. Available online: https://lca-forum.org/english/pdf/No12_Summary.pdf (accessed on 28 August 2019).
- Intergovernmental Panel on Climate Change (IPCC). Available online: https://www.ipcc-nggip.iges.or.jp/public/kpsg/ (accessed on 28 August 2019).
- World Health Organization (WHO). Available online: https://www.who.int/phe/health_topics/outdoorair/databases/en/ (accessed on 28 August 2019).
- Santamouris, M. Cooling the buildings—past, present and future. Energy Build. 2016, 128, 617–638. [Google Scholar] [CrossRef]
- Indonesia Energy Council (DEN). Available online: https://www.esdm.go.id/assets/media/content/content-indonesia-energy-outlook-2019-english-version.pdf (accessed on 10 December 2020).
- Karkour, S.; Ichisugi, Y.; Abeynayaka, A.; Itsubo, N. External-Cost Estimation of Electricity Generation in G20 Countries: Case Study Using a Global Life-Cycle Impact-Assessment Method. Sustainability 2020, 12, 2002. [Google Scholar] [CrossRef]
- IDEAv2. Available online: http://idea-lca.com/?lang=en (accessed on 28 August 2019).
- Graedel, T.; Harper, E.M.; Nassar, N.T.; Nuss, P.; Reck, B.K. Criticality of metals and metalloids. Proc. Natl. Acad. Sci. USA 2015, 112, 4257–4262. [Google Scholar] [CrossRef]
- Zhao, L.; Zeng, W.; Yuan, Z. Reduction of potential greenhouse gas emissions of room air-conditioner refrigerants: A life cycle carbon footprint analysis. J. Clean. Prod. 2015, 100, 262–268. [Google Scholar] [CrossRef]
- Hasegawa, T.; Park, C.; Fujimori, S.; Takahashi, K.; Hijioka, Y.; Masui, T. Quantifying the economic impact of changes in energy demand for space heating and cooling systems under varying climatic scenarios. Palgrave Commun. 2016, 2, 16013. [Google Scholar] [CrossRef]
- De Cian, E.; Pavanello, F.; Randazzo, T.; Mistry, M.N.; Davide, M. Households’ adaptation in a warming climate. Air con-ditioning and thermal insulation choices. Environ. Sci. Policy 2019, 100, 136–157. [Google Scholar] [CrossRef]
- McLinden, M.O.; Brown, J.S.; Brignoli, R.; Kazakov, A.F.; Domanski, P.A. Limited options for low-global-warming-potential refrigerants. Nat. Commun. 2017, 8, 14476. [Google Scholar] [CrossRef]
- Hashimoto, M.; Otsuka, T.; Fukushima, M.; Okamoto, H.; Hayamizu, H.; Ueno, K.; Akasaka, R. Development of New Low-GWP Refrigerants–Refrigerant Mixtures Including HFO-1123. Sci. Technol. Built Environ. 2019, 25, 776–783. [Google Scholar] [CrossRef]
- Ciconkov, R. Refrigerants: There is still no vision for sustainable solutions. Int. J. Refrig. 2018, 86, 441–448. [Google Scholar] [CrossRef]


Publisher’s Note: MDPI stays neutral with regard to jurisdictional claims in published maps and institutional affiliations. |
© 2021 by the authors. Licensee MDPI, Basel, Switzerland. This article is an open access article distributed under the terms and conditions of the Creative Commons Attribution (CC BY) license (http://creativecommons.org/licenses/by/4.0/).