
An Extensive Study on Desorption Models Generated Based on Langmuir and Knudsen Diffusion


Abstract
1. Introduction
1.1. Governing Forces
1.2. Conventional Fluid Flow Models
1.2.1. Darcy’s Law
1.2.2. Forchheimer’s Equation
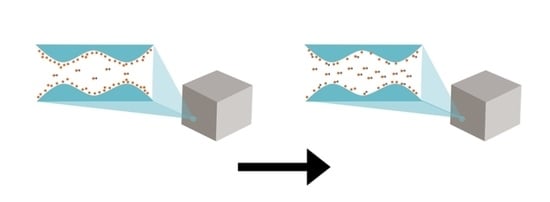
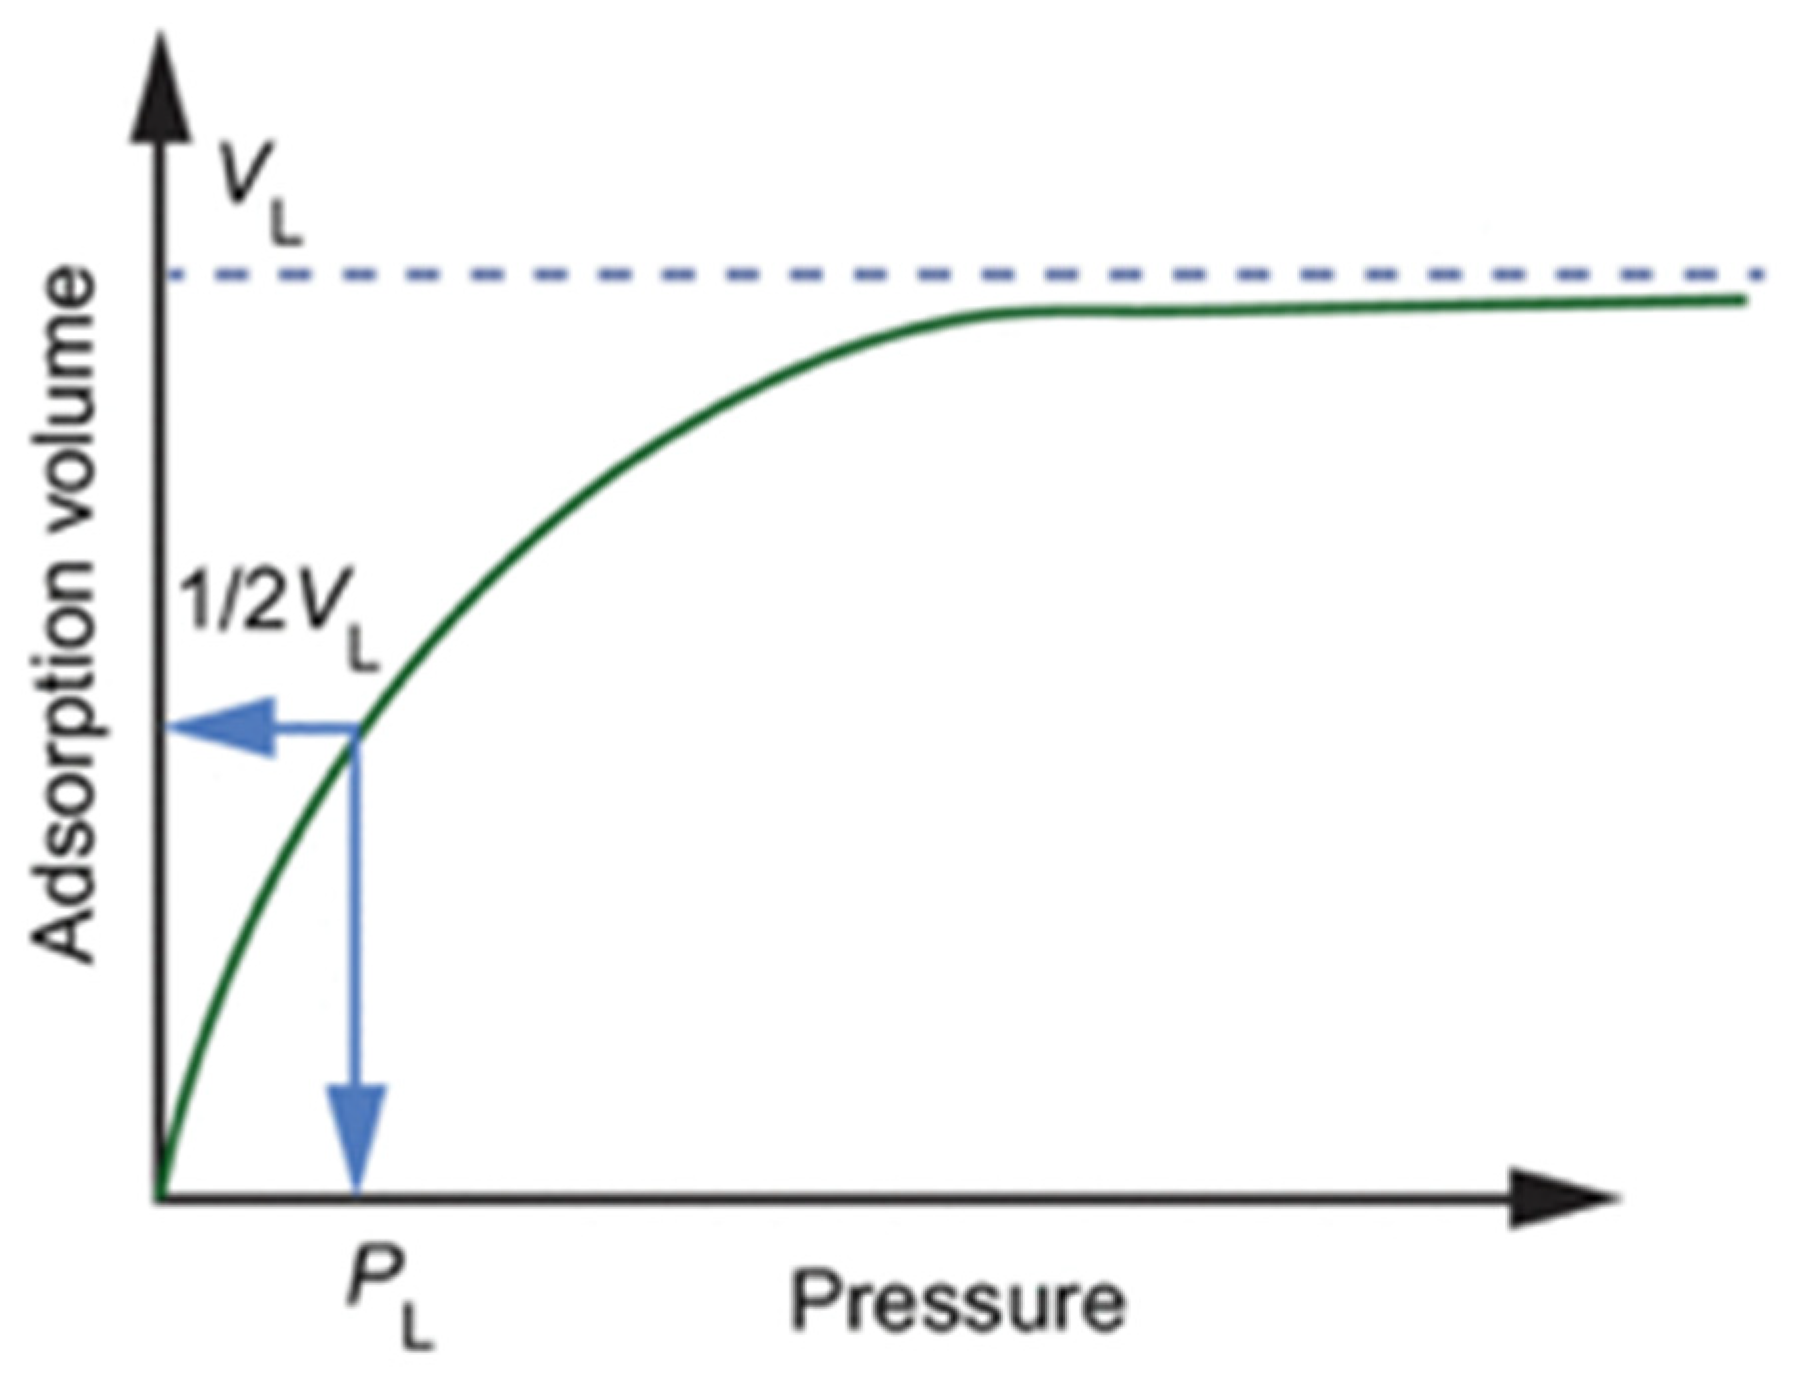
1.3. Langmuir Adsorption Isotherm
- One molecule is adsorbed in each adsorption location.
- No interaction between adsorbed gas molecules within the pores.
- The energy at sorption/desorption location is equal.
1.4. Knudsen Diffusion
2. Materials and Methods
2.1. Model Creation
2.1.1. First Model
2.1.2. Second Model
2.1.3. Third Model
2.2. Mathematical Formulation
2.3. Numerical Modeling
- Homogenous one-dimensional medium
- Finite boundaries
- Single gaseous phase
- Constant temperature throughout the tested area
- Gravity and capillary effects neglected
3. Results and Discussion
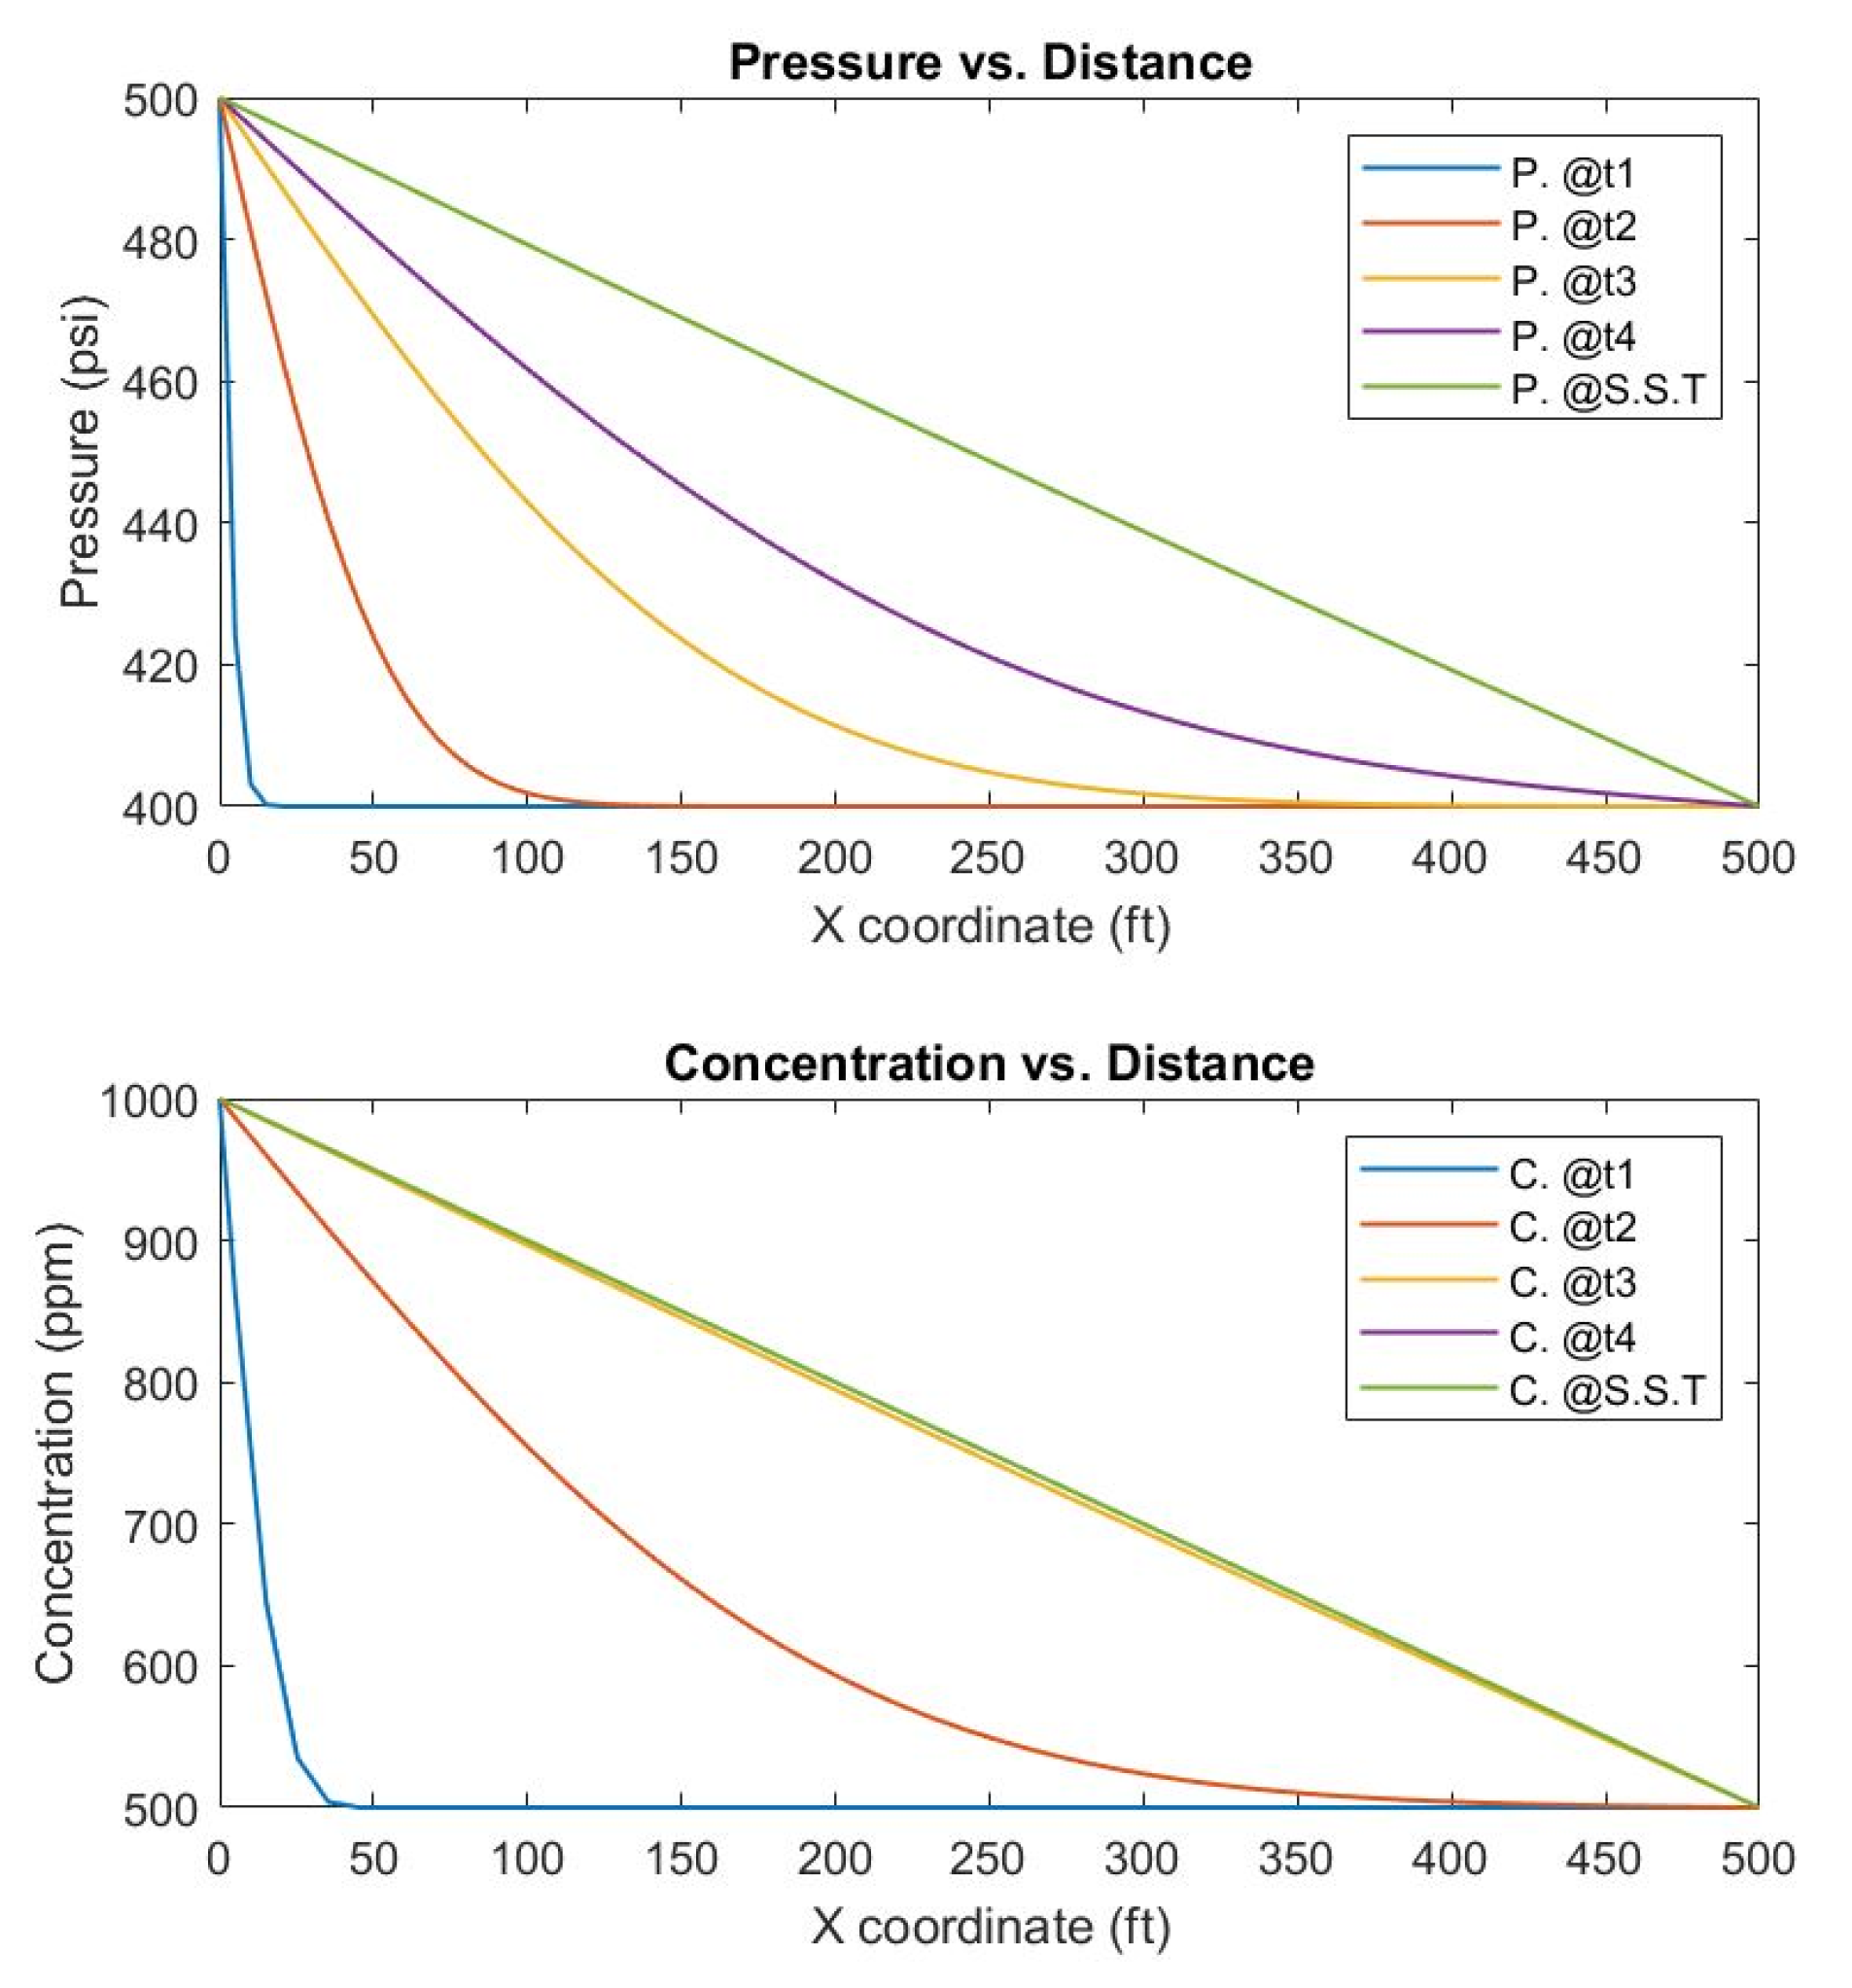
3.1. Synthetic Case Study Validation
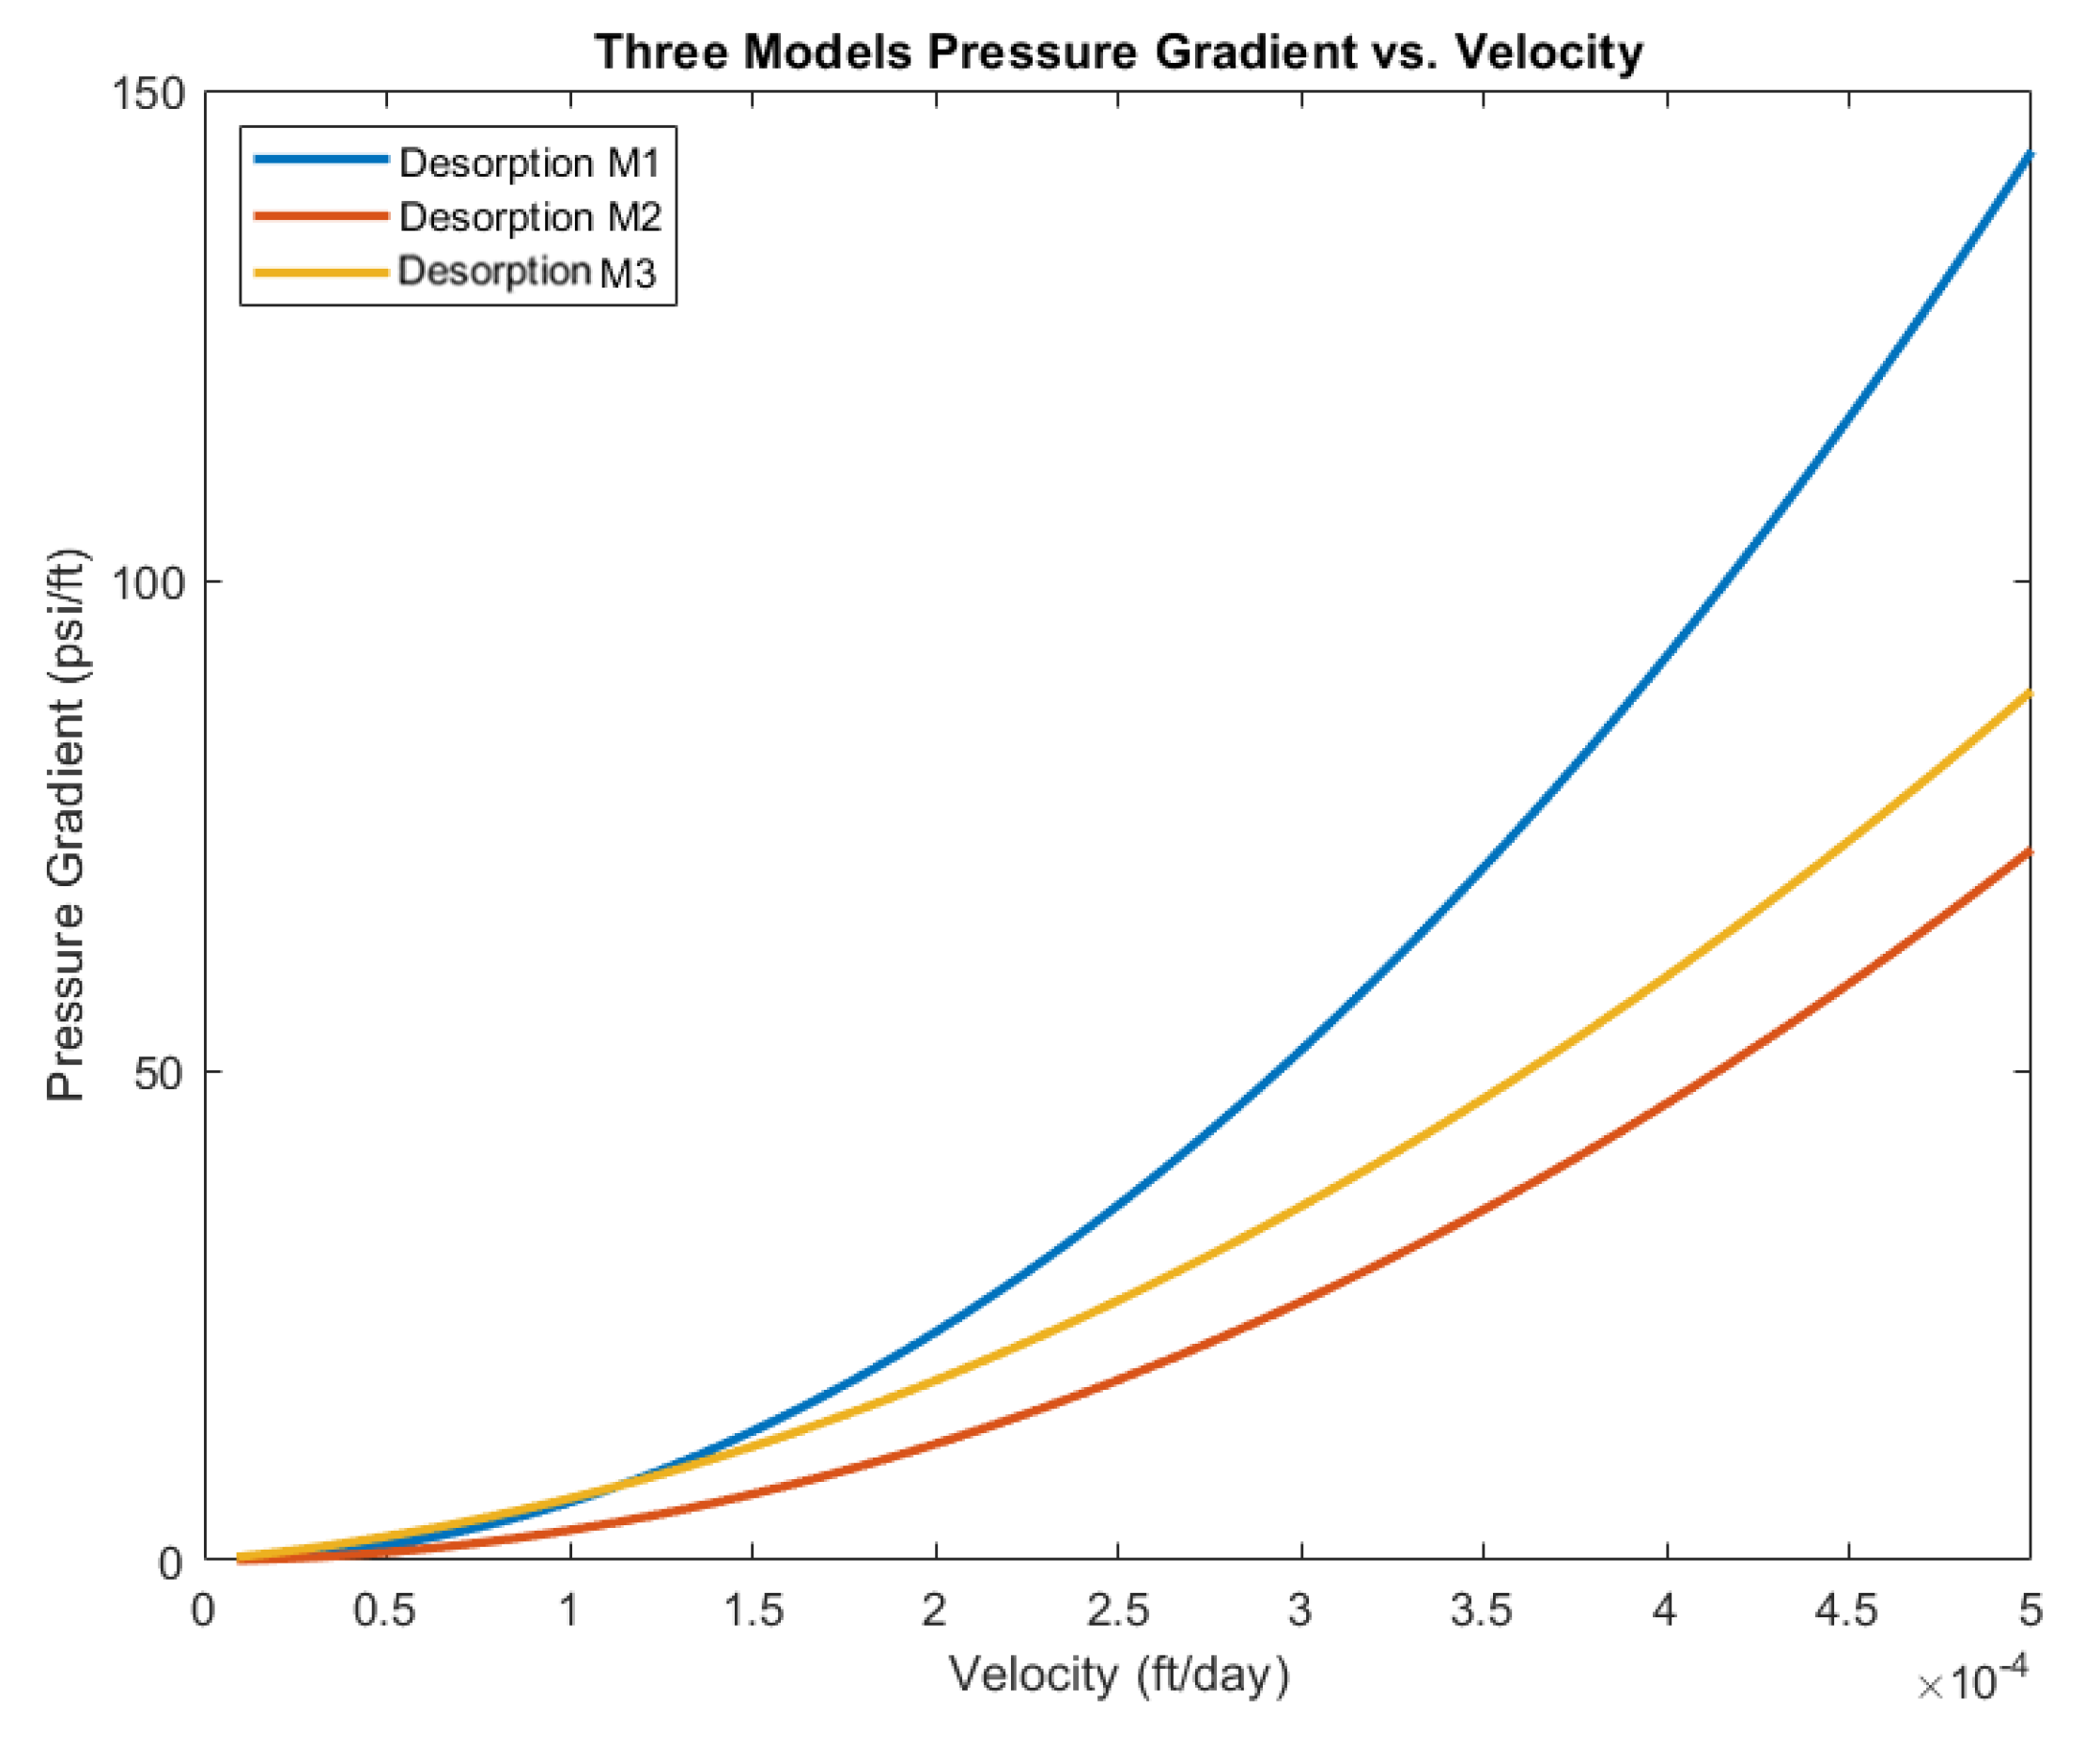
3.2. Comparison of the Newly Developed Models Pressure Gradients
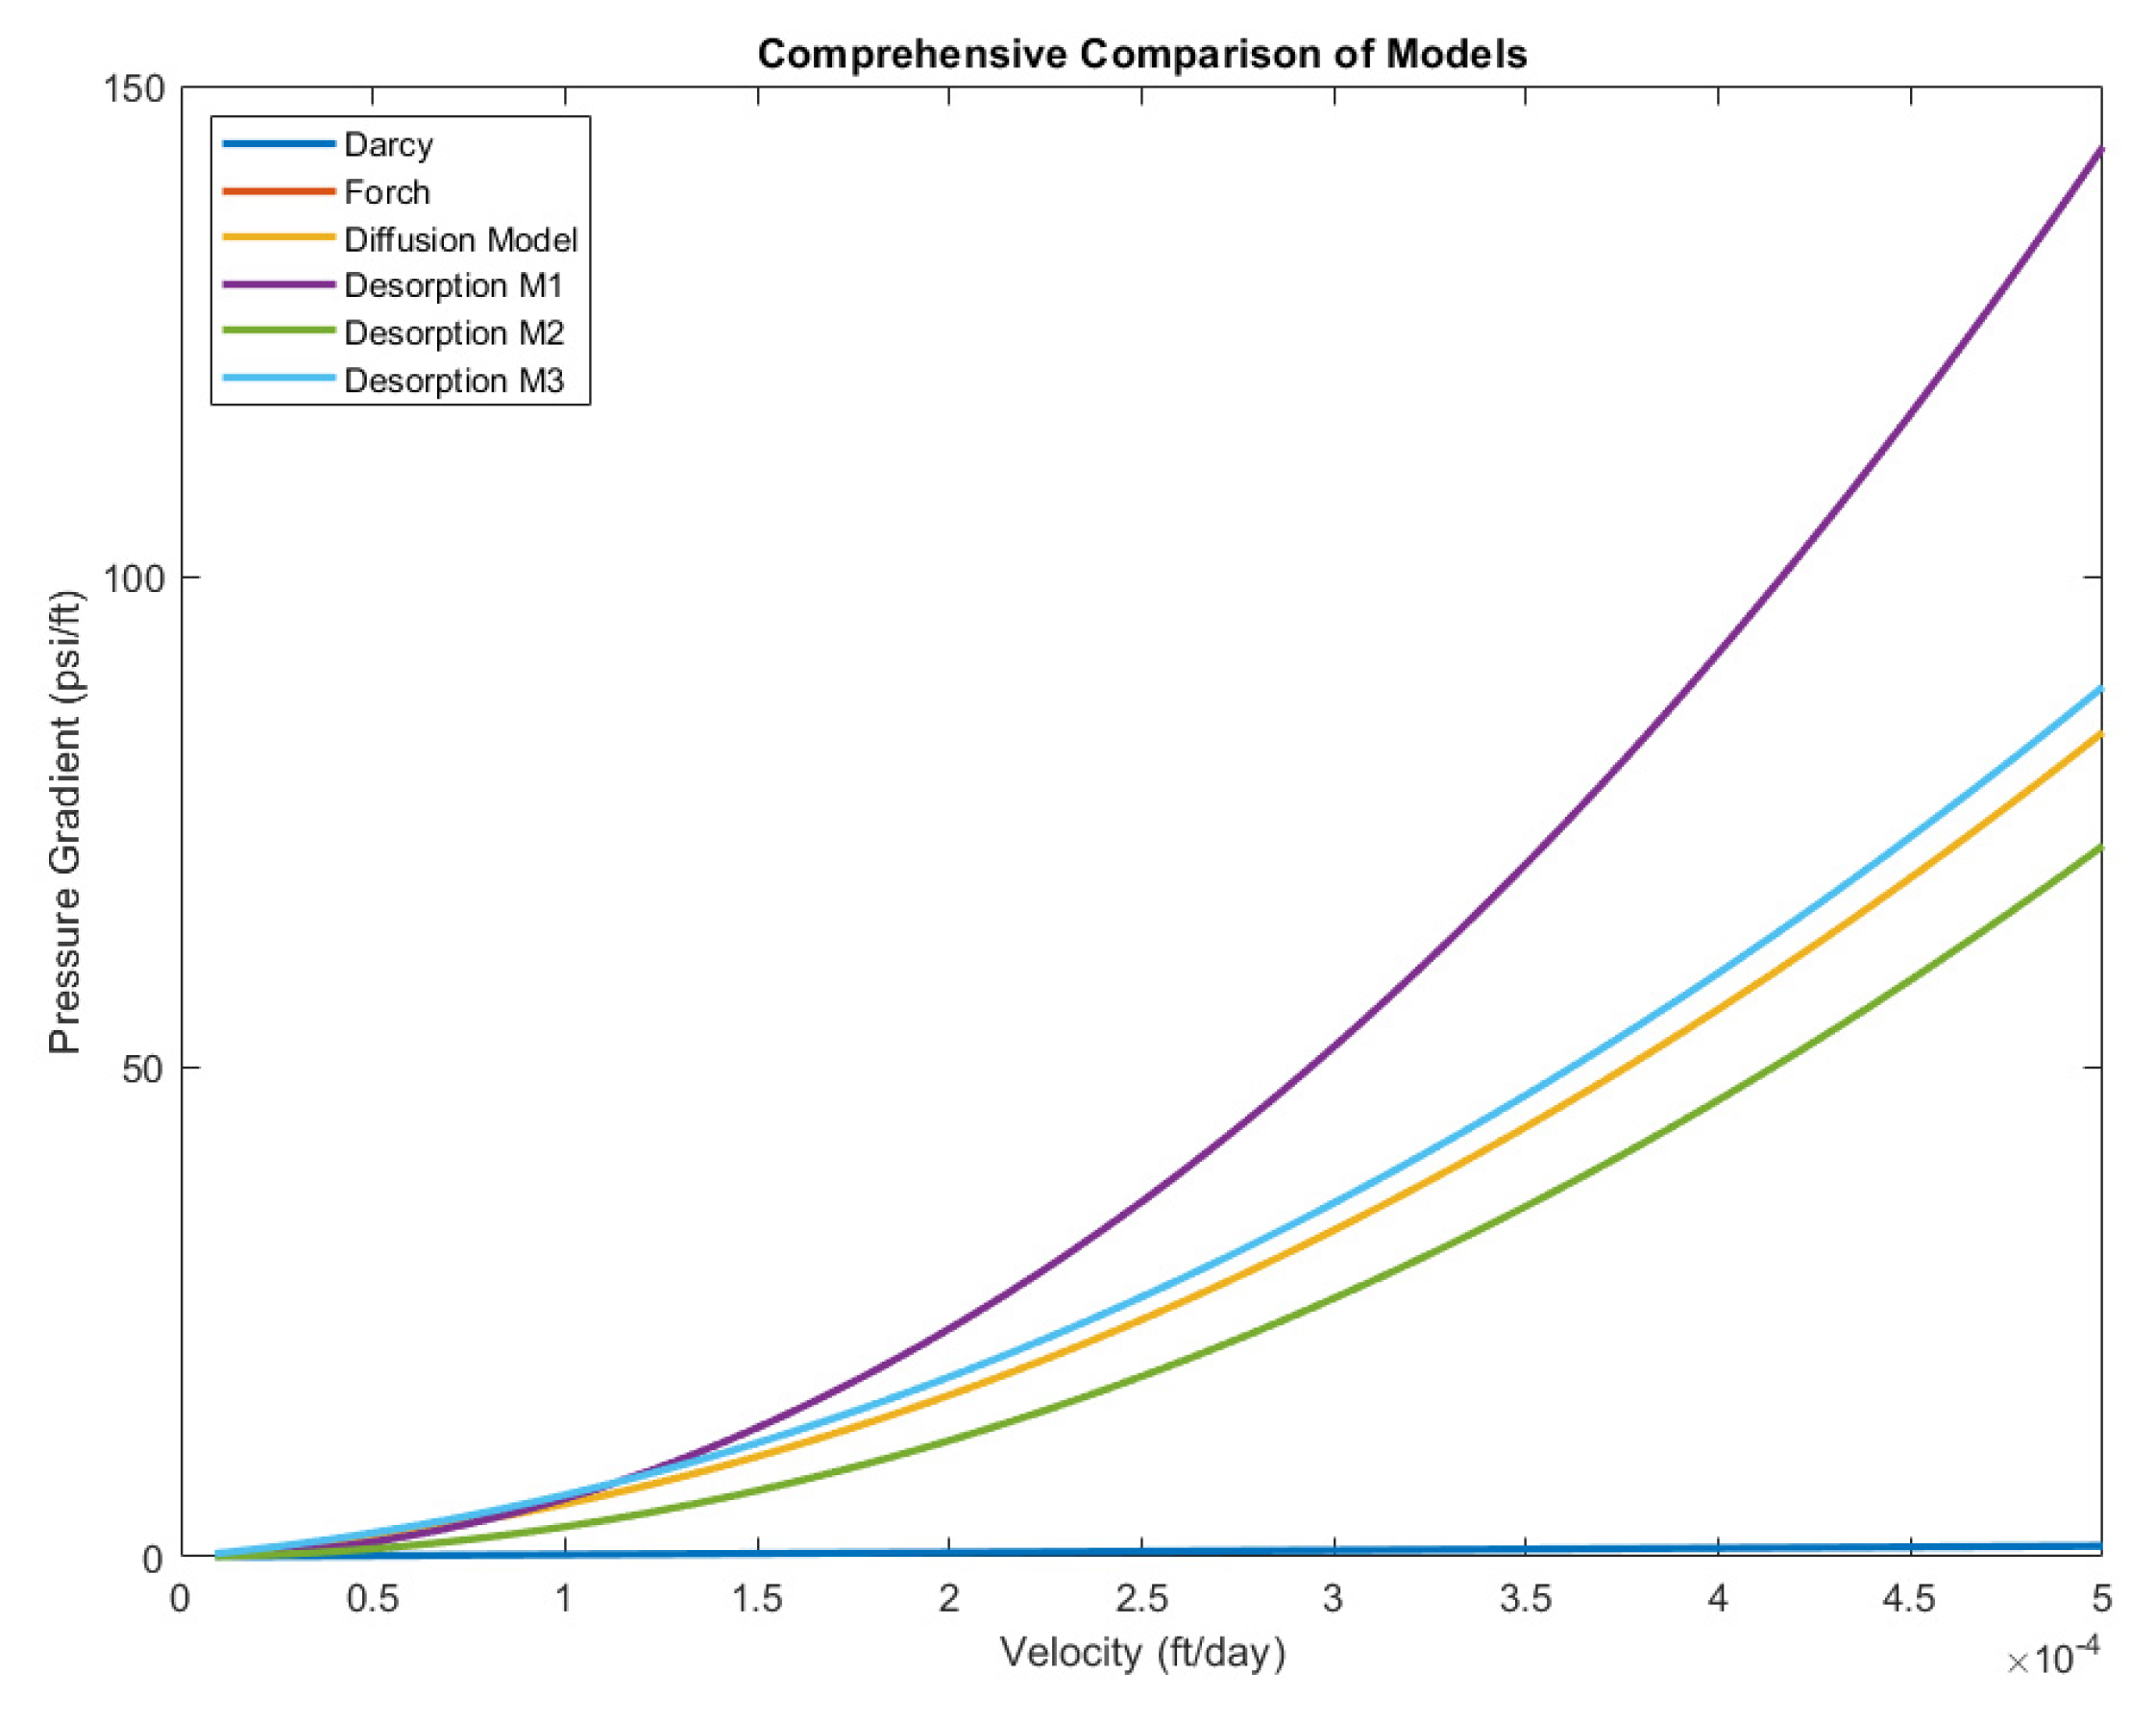
3.3. Comparison of Different Flow Models with the Newly Developed Models
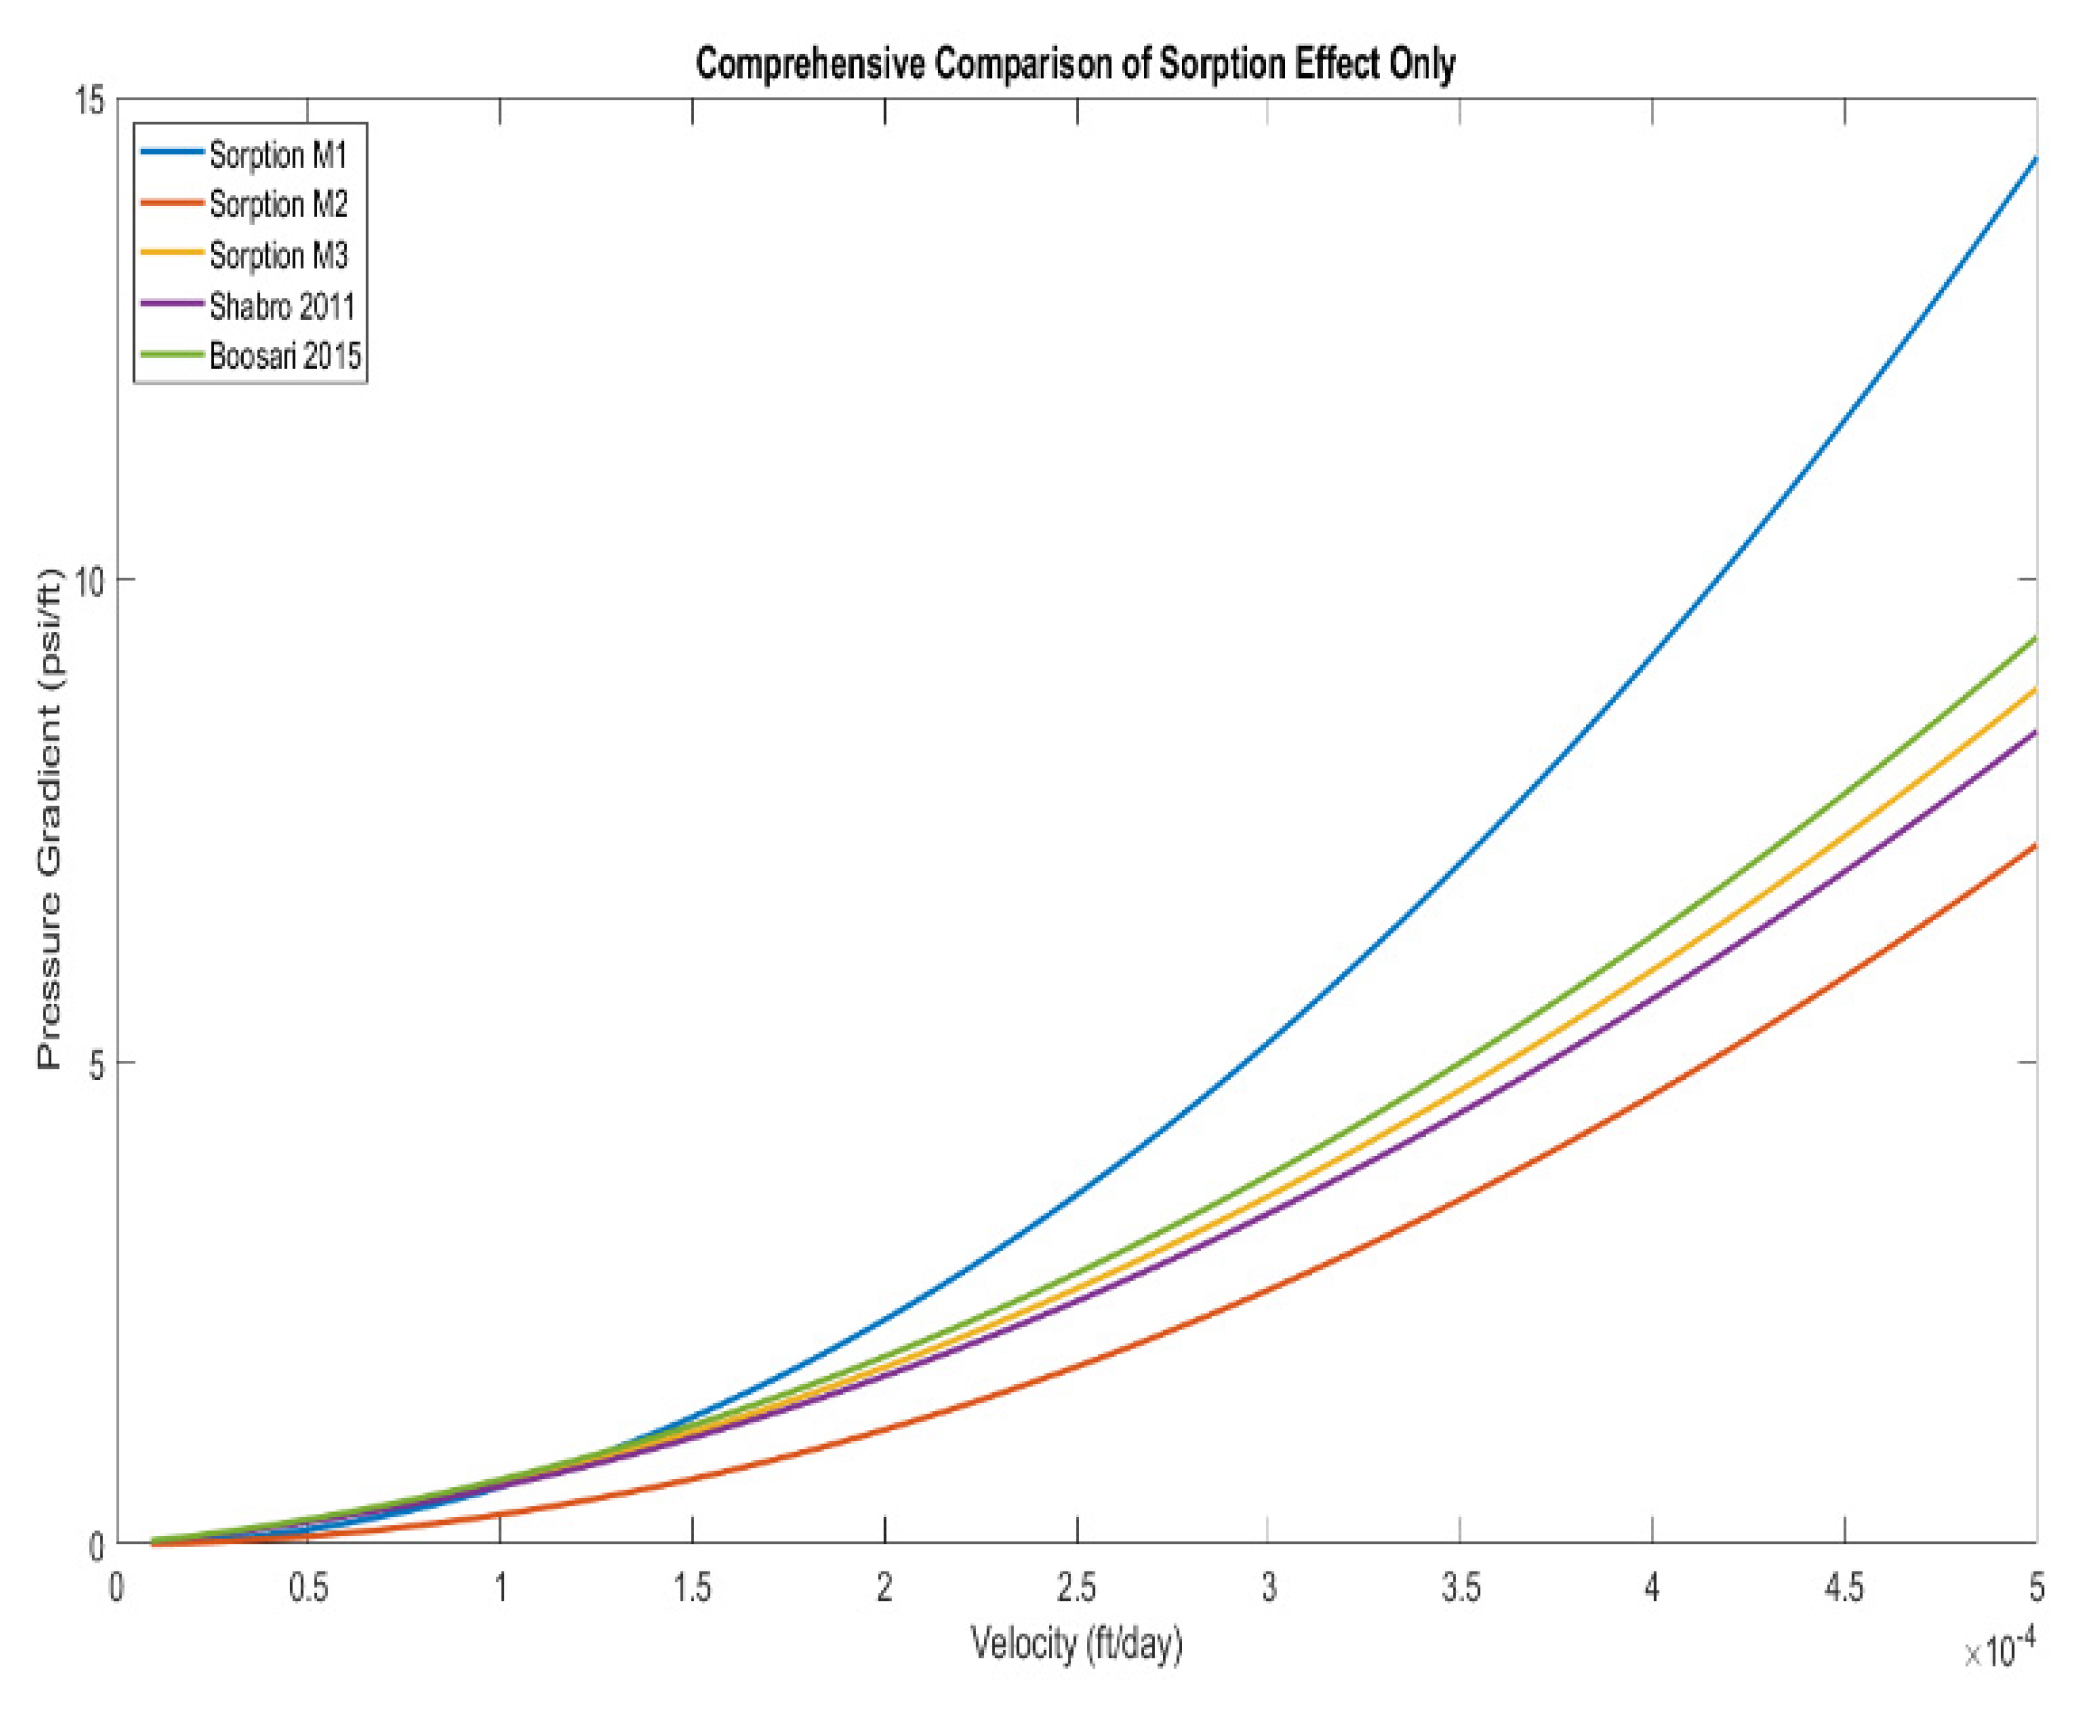
3.4. Comparison of Newly Developed Models with Well-Known Published Models
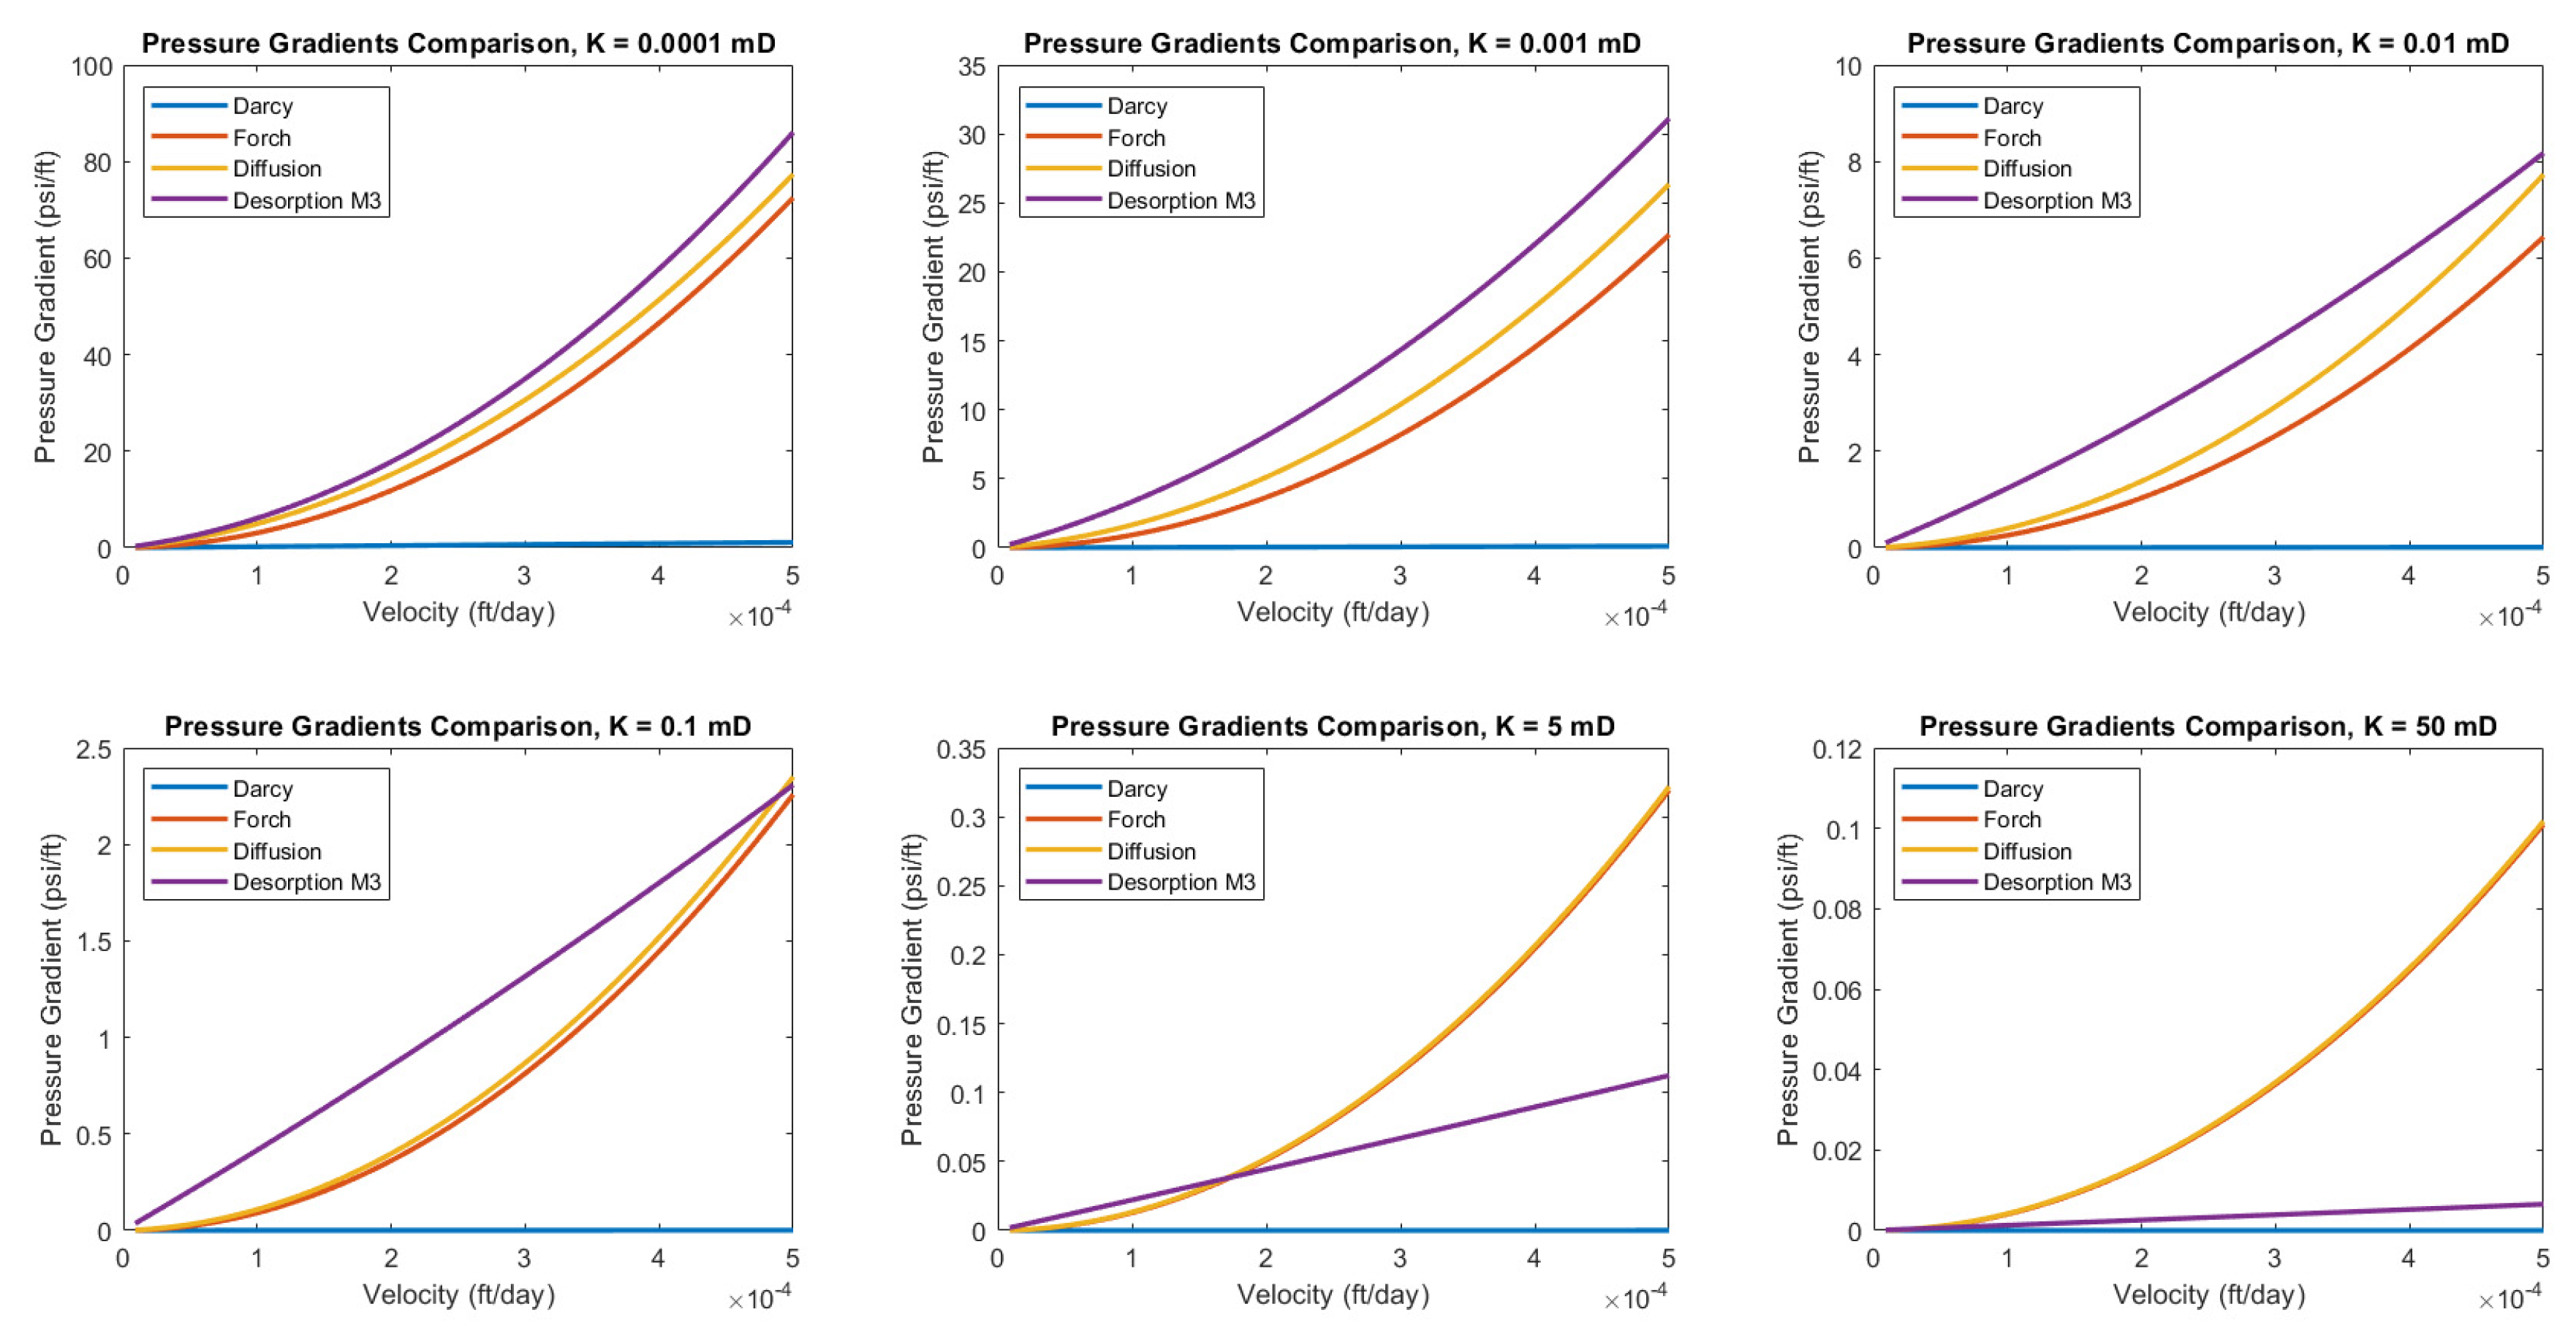
3.5. Comparison of Newly Developed Models Using Different Permeabilities
4. Conclusions
- A new 1-D linear and radial mathematical models were derived, tested, and numerically simulated to investigate and address the effect of diffusion/desorption forces in tight unconventional reservoirs.
- The newly developed model proved the importance of the contribution of diffusion/desorption forces to fluid flow in the porous media, as initially hypothesized. The significant effect of both forces is noted as the reservoir deviated towards unconventionality.
- Like the establishment of steady-state time for pressure gradient, the concept of steady-state time for concentration gradient is introduced for the first time. This newly introduced concentration gradient steady-state time means that the medium reached a constant concentration gradient throughout the pores system (constant slope).
5. Patents
Author Contributions
Funding
Institutional Review Board Statement
Informed Consent Statement
Data Availability Statement
Acknowledgments
Conflicts of Interest
References
- U.S. Energy Information Administration—EIA—Independent Statistics and Analysis. Short-Term Energy Outlook—U.S. Energy Information Administration (EIA). (n.d.). Available online: https://www.eia.gov/outlooks/steo/ (accessed on 7 June 2021).
- Harris, C. What Is Unconventional Resources? AAPG Annual Convention and Exhibition: Long Beach, CA, USA, 2012. [Google Scholar]
- Chengzao, J.; Zheng, M.; Zhang, Y. Unconventional hydrocarbon resources in China and the prospect of exploration and development. Pet. Dev. 2012, 39, 139–146. [Google Scholar]
- Hassanpouryouzband, A.; Joonaki, E.; Farahani, M.V.; Takeya, S.; Ruppel, C.; Yang, J.; English, N.J.; Schicks, J.M.; Edlmann, K.; Mehrabian, H.; et al. Gas hydrates in sustainable chemistry. Chem. Soc. Rev. 2020, 49, 5225–5309. [Google Scholar] [CrossRef] [PubMed]
- Sloan, E.D., Jr.; Koh, C.A. Clathrate Hydrates of Natural Gases; CRC Press: Boca Raton, FL, USA, 2007. [Google Scholar]
- Rutqvist, J.; Moridis, G.J.; Grover, T.; Collett, T. Geomechanical response of permafrost-associated hydrate deposits to depressurization-induced gas production. J. Pet. Sci. Eng. 2009, 67, 1–12. [Google Scholar] [CrossRef]
- Zou, C.; Zhang, G.; Yang, Z.; Tao, S.; Hou, L.; Zhu, R.; Yuan, X.; Ran, Q.; Li, D.; Wang, Z. Concepts, characteristics, potential and technology of unconventional hydrocarbons: On unconventional petroleum geology. Pet. Explor. Dev. 2013, 40, 413–428. [Google Scholar] [CrossRef]
- Foroozesh, J.; Abdalla, A.I.M.; Zhang, Z. Pore Network Modeling of Shale Gas Reservoirs: Gas Desorption and Slip Flow Effects. Transp. Porous Media 2018, 126, 633–653. [Google Scholar] [CrossRef]
- Moridis, G.J.; Blasingame, T.A.; Freeman, C.M. Analysis of mechanisms of flow in fractured tight-gas and shale-gas reservoirs. In Proceedings of the SPE Latin American and Caribbean Petroleum Engineering Conference. Society of Petroleum Engineers, Lima, Peru, 1–3 December 2010. [Google Scholar]
- Zou, C.N.; Yang, Z.; Tao, S.Z.; Yuan, X.J.; Zhu, R.K.; Hou, L.H.; Wu, S.T.; Sun, L.; Zhang, G.S.; Bai, B.; et al. Continuous hydrocarbon accumulation over a large area as a distinguishing characteristic of unconventional petroleum: The Ordos Basin, North-Central China. Earth-Sci. Rev. 2013, 126, 358–369. [Google Scholar] [CrossRef]
- Hadi, B.; Rabab, Q.; Bisweswar, G.; Saqer, R. Modeling Fluid Flow in Tight Unconventional Reservoirs: Nano Scale Mobility/Trapability Mechanistic Approach! In Proceedings of the SPE Gas & Oil Technology Showcase and Conference, Dubai, United Arab Emirates, 21–23 October 2019. [Google Scholar] [CrossRef]
- Hassanpouryouzband, A.; Joonaki, E.; Edlmann, K.; Haszeldine, R.S. Offshore Geological Storage of Hydrogen: Is This Our Best Option to Achieve Net-Zero? ACS Energy Lett. 2021, 6, 2181–2186. [Google Scholar] [CrossRef]
- Wang, J.; Feng, L.; Zhao, L.; Snowden, S. China’s natural gas: Resources, production and its impacts. Energy Policy 2013, 55, 690–698. [Google Scholar] [CrossRef]
- Christensen, R.M. Theory of Viscoelasticity, 2nd ed.; Dover Publications: New York, NY, USA, 2003; Available online: https://search-ebscohost-com.libconnect.ku.ac.ae/login.aspx?direct=true&db=cat06281a&AN=kul.35983&site=eds-live&scope=site (accessed on 29 September 2021).
- De, A.; Kuipers, J.A.M.; Peters, E.A.J.F.; Padding, J.T. Viscoelastic flow simulations in random porous media. J. Non-Newton. Fluid Mech. 2017, 248, 50–61. [Google Scholar] [CrossRef]
- Shapiro, A.A.; Stenby, E.H. Effects of Capillary forces and Adsorption on Reserves Distribution. In Proceedings of the SPE European Petroleum Conference, Milan, Italy, 22–24 October 1996. Paper SPE-36922. [Google Scholar]
- Legait, B.; Sourieau, P.; Combarnous, M. Inertia, viscosity, and capillary forces during two-phase flow in a constricted capillary tube. J. Colloid Interface Sci. 1983, 91, 400–411. [Google Scholar] [CrossRef]
- Belhaj, H.A.; Agha, K.R.; Butt, S.D.; Islam, M.R. Simulation of Non-Darcy Flow in Porous Media Including Viscous, Inertial and Frictional Effects. In Proceedings of the 2003 SPE International Improved Oil Recovery Conference in Asia Pacific, Kuala Lumpur, Malaysia, 21 October 2003. Paper SPE 84879. [Google Scholar]
- Guo, L.; Peng, X.; Wu, Z. Dynamical characteristics of methane adsorption on monolith nanometer activated carbon. J. Chem. Ind. Eng. 2008, 11, 2726–2731. [Google Scholar]
- Zhang, C. Soil and Groundwater Remediation—Fundamentals, Practices, and Sustainability; John Wiley & Sons: Hoboken, NJ, USA, 2020; Available online: https://app.knovel.com/hotlink/toc/id:kpSGRFPS01/soil-groundwater-remediation/soil-groundwater-remediation (accessed on 18 July 2021).
- Rolando, M.A. Roque-Malherbe (2007) Adsorption and Diffusion in Nanoporous Materials, 6000 Broken Sound Parkway NW, Suite 300; CRC Press Taylor & Francis Group: Boca Raton, FL, USA, 2007. [Google Scholar]
- Em, K.G.; Ali, B.; Narayan, A. Microflows and Nanoflows Fundamentals and Simulation; Springer: New York, NY, USA, 2005. [Google Scholar]
- Mahmoud, M. Effect of Gas Adsorption on the Estimation of Gas in Place (GIP) in Conventional and Unconventional Reservoirs. Arab. J. Sci. Eng. 2019, 44, 6205–6214. [Google Scholar] [CrossRef]
- Neuman, S.P. Theoretical derivation of Darcy’s law. Acta Mech. 1977, 25, 153–170. [Google Scholar] [CrossRef]
- Whitaker, S. Flow in porous media I: A theoretical derivation of Darcy’s law. Transp. Porous Media 1986, 1, 3–25. [Google Scholar] [CrossRef]
- Papathanasiou, T.D.; Markicevic, B.; Dendy, E.D. A computational evaluation of the Ergun and Forchheimer equations for fibrous porous media. Phys. Fluids 2001, 13, 2795–2804. [Google Scholar] [CrossRef]
- Freij-Ayoub, R.; Mühlhaus, H.B.; Walshe, J.L. 2-Phase Convective Multicomponent Reactive Transport Model. In Computational Mechanics–New Frontiers for the New Millennium; Elsevier: Amsterdam, The Netherlands, 2001; pp. 803–808. [Google Scholar]
- Evans, R.; Faruk, C. Characterization of Non-Darcy Multiphase Flow in Petroleum Bearing Formations. Annual Status Report, 14 May 1991–13 May 1992; Association of Information and Image Management: Maryland, LA, USA, 14 May 2021. [Google Scholar] [CrossRef]
- Katz, D.L.V.; Lee, R.L. Natural Gas Engineering: Production and Storage; McGraw-Hill Economics Department: New York, NY, USA, 1990. [Google Scholar]
- Zeng, Z.; Grigg, R. A Criterion for Non-Darcy Flow in Porous Media. Transp. Porous Media 2006, 63, 57–69. [Google Scholar] [CrossRef]
- Camacho-Velazquez, R.; Padilla-Sixto, R.; Vasquez-Cruz, M. Inflow Performance Relationships with Inertial Effects in the Reservoir. In Proceedings of the Production Operations Symposium, Oklahoma City, OK, USA, 21–23 March 1993. Paper SPE-25481. [Google Scholar]
- Yu, P.; Dian, F.; Chen, S. A Novel Approach to Determine Gas Velocity Profile in Entire Knudsen Number Regime for Nanoporous Shale with Various Pore Geometries. In Proceedings of the SPE/AAPG/SEG Unconventional Resources Technology Conference, Virtual, 22 July 2020; 1553. [Google Scholar] [CrossRef]
- Aldhuhoori, M.A.; Belhaj, H.; Alkuwaiti, H.K.; Ghosh, B.; Fernandes, R.; Qaddoura, R. Role of viscous, diffusion and inertial mechanisms in modeling fluid flow through unconventional reservoir. J. Pet. Sci. Eng. 2021, 205, 108772. [Google Scholar] [CrossRef]
- Mydland, S.; Yusra, I.; Whitson, C.H.; Dahouk, M.M.; Carlsen, M.L. Gas EOR Processes in Tight Unconventionals. In Proceedings of the SPE Improved Oil Recovery Conference. Society of Petroleum Engineers, Virtual, 31 August–4 September 2020. [Google Scholar]
- Javadpour, F. Nanopores and Apparent Permeability of Gas Flow in Mudrocks (Shales and Siltstone). J. Can. Pet. Technol. 2009, 48, 16–21. [Google Scholar] [CrossRef]
- Shabro, V.; Torres-Verdín, C.; Sepehrnoori, K. Forecasting Gas Production in Organic Shale with the Combined Numerical Simulation of Gas Diffusion in Kerogen, Langmuir Desorption from Kerogen Surfaces, and Advection in Nanopores. In Proceedings of the SPE Annual Technical Conference and Exhibition, San Antonio, TX, USA, 8–10 October 2012. [Google Scholar] [CrossRef]
- Boosari, H.; Sina, S.; Aybar, U.; Eshkalak, M.O. The Effect of Desorption-induced Porosity-Permeability Changes and Geomechanics on Production from U.S. Shale Gas Formations. In Proceedings of the 49th U.S. Rock Mechanics/Geomechanics Symposium, San Francisco, CA, USA, 28 June–1 July 2015. [Google Scholar]
- Bahadori, A. Fundamentals of Enhanced Oil and Gas Recovery from Conventional and Unconventional Reservoirs; Elsevier: Amsterdam, The Netherlands, 2018. [Google Scholar]
- Hoss, B.; Ebrahim, F.; Fatemeh, B. Hydraulic Fracturing in Unconventional Reservoirs—Theories, Operations, and Economic Analysis, 2nd ed.; Elsevier: Amsterdam, The Netherlands, 2019. [Google Scholar]
- Belhaj, H.A.; Agha, K.R.; Nouri, A.M.; Butt, S.D.; Islam, M.R. Numerical and Experimental Modeling of Non-Darcy Flow in Porous Media. In Proceedings of the SPE Latin American and Caribbean Petroleum Engineering Conference, Port-of-Spain, Trinidad and Tobago, 27–30 April 2003. [Google Scholar] [CrossRef]


| Parameter | Value | Unit |
|---|---|---|
| Viscosity | 0.01402 | |
| Permeability | 0.001 | |
| Porosity | 0.07 | |
| Compressibility | 4.40 × 10⁻¹⁰ | |
| Beta | 2.3767 × 10⁶ | |
| Density | 0.0417 | |
| Length | 500 | |
| 8.26706 × 10⁷ | ||
| Velocity | 0.005 − 0.00005 | |
| Pressure at boundary in | 500 | |
| Pressure at boundary out | 400 | |
| Concentration at boundary in | 1000 | |
| Concentration at boundary out | 500 |
| Darcy | ForchheiMer’s | Diffusion | Desorption 1 | Desorption 2 | Desorption 3 | |
|---|---|---|---|---|---|---|
| Desorption 1 | 142.650 | 71.250 | 66.402 | 71.250 | 57.707 | |
| Desorption 2 | 71.400 | 0.000 | −4.848 | −71.250 | −13.543 | |
| Desorption 3 | 84.943 | 13.543 | 8.695 | −57.707 | 13.543 |
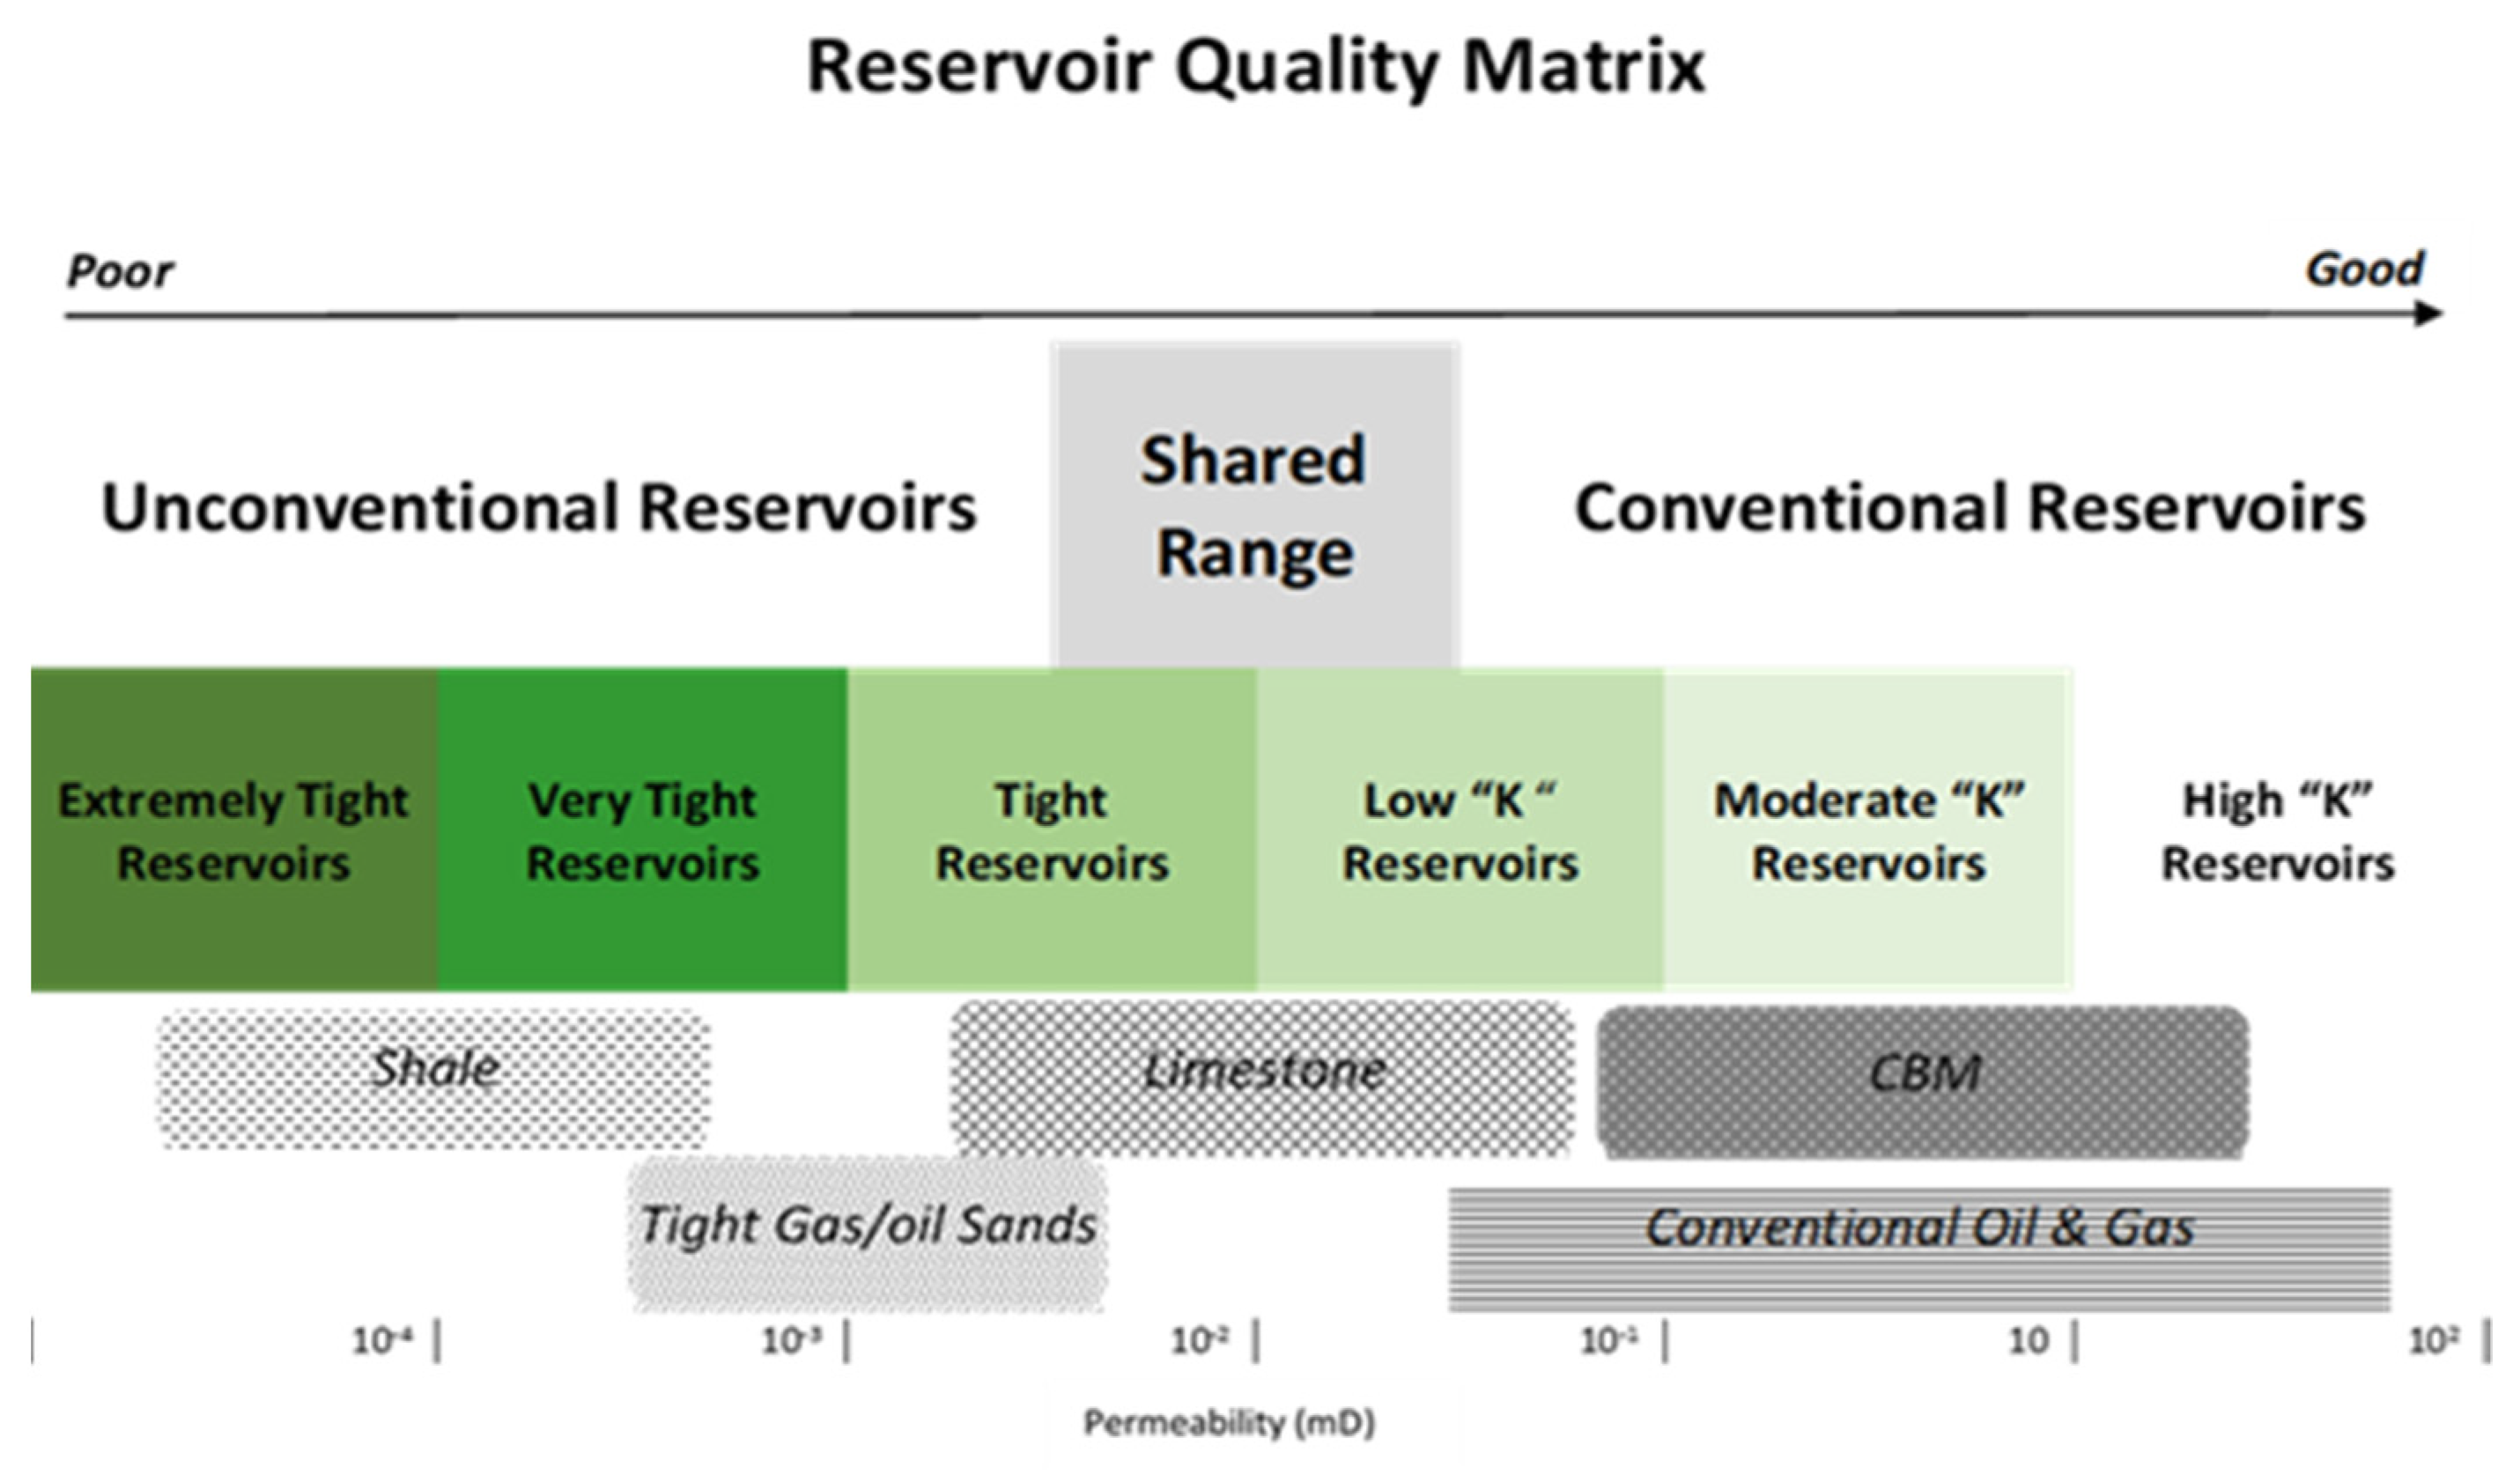
| Permeability, mD | Reservoir Type |
|---|---|
| 0.0001 | Ultra Tight |
| 0.001 | Very Tight |
| 0.01 | Tight |
| 0.1 | Low Permeability |
| 5 | Moderate Permeability |
| 50 | High Permeability |
Publisher’s Note: MDPI stays neutral with regard to jurisdictional claims in published maps and institutional affiliations. |
© 2021 by the authors. Licensee MDPI, Basel, Switzerland. This article is an open access article distributed under the terms and conditions of the Creative Commons Attribution (CC BY) license (https://creativecommons.org/licenses/by/4.0/).
Share and Cite
Alkuwaiti, H.; Belhaj, H.; Aldhuhoori, M.; Ghosh, B.; Fernandes, R. An Extensive Study on Desorption Models Generated Based on Langmuir and Knudsen Diffusion. Energies 2021, 14, 6435. https://doi.org/10.3390/en14196435
Alkuwaiti H, Belhaj H, Aldhuhoori M, Ghosh B, Fernandes R. An Extensive Study on Desorption Models Generated Based on Langmuir and Knudsen Diffusion. Energies. 2021; 14(19):6435. https://doi.org/10.3390/en14196435
Chicago/Turabian StyleAlkuwaiti, Hamda, Hadi Belhaj, Mohammed Aldhuhoori, Bisweswar Ghosh, and Ryan Fernandes. 2021. "An Extensive Study on Desorption Models Generated Based on Langmuir and Knudsen Diffusion" Energies 14, no. 19: 6435. https://doi.org/10.3390/en14196435
APA StyleAlkuwaiti, H., Belhaj, H., Aldhuhoori, M., Ghosh, B., & Fernandes, R. (2021). An Extensive Study on Desorption Models Generated Based on Langmuir and Knudsen Diffusion. Energies, 14(19), 6435. https://doi.org/10.3390/en14196435