Article

Treatment of Light-Induced Degradation for Solar Cells in a p-PERC Solar Module via Induction Heating

1
Department of Materials Science and Engineering, Pusan National University, Busan 46241, Korea
2
Sunjin Environment Co., Ltd., 23, Saenggoksandan-ro, Gangseo-gu, Busan 46729, Korea
3
Convergence Material Research Center, Innovative Technology Research Division, Gumi Electronics & Information Technology Research Institute (GERI), Gumi 39171, Korea
*
Authors to whom correspondence should be addressed.
These authors contributed equally to this work.
Energies 2021, 14(19), 6352; https://doi.org/10.3390/en14196352
Submission received: 23 July 2021 / Revised: 13 September 2021 / Accepted: 24 September 2021 / Published: 5 October 2021
(This article belongs to the Section A2: Solar Energy and Photovoltaic Systems)

Abstract

:
In the photovoltaic industry, there is great interest in increasing the power output of solar cells to achieve grid parity and to promote the widespread use of solar cells. However, despite many developments, a phenomenon called light-induced degradation causes the efficiency of solar cells to deteriorate over time. This study proposes a treatment that can be applied to cells within solar modules. It uses a half-bridge resonance circuit to induce a magnetic field and selectively heat Al electrodes in the solar cells. The electrical state of a solar module was measured in real time as it was being heated, and the results were combined with a kinetics simulation using a cyclic reaction. As the temperature of the solar module increased, the time taken to reach the saturation point and the recovery time decreased. Moreover, the value of the saturation point increased. The light-induced degradation activation energy was similar to results in the existing literature, suggesting that the kinetic model was valid and applicable even when 72 cells were connected in series. This demonstrates that an entire solar module can be treated when the cells are connected in series, and in future multiple modules, could be connected in series during treatment.

1. Introduction

A major aim of the photovoltaic industry is to increase the power output of solar cells in order to attain grid parity and promote their widespread use. In the last quarter of 2020, the market price of solar modules was 0.21 USD/Wp, and the price has been decreasing more rapidly than predicted using the PV learning curve [1,2]. At present, passivated emitter and rear contact (PERC) solar cells that use p-type wafers account for 82% of the global photovoltaic power market, and they expected to account for at least 50% of the market until 2031 [1]. These p-type PERC (p-PERC) solar cells generate a back surface field (BSF) using an aluminum (Al) electrode, and it is easy to control the area of the BSF via the electrode printing process. Moreover, these cells are very economical because it is easy to produce a junction by changing the heat treatment condition, which allows the BSF and an electrode to be formed simultaneously. Thus, p-PERC crystalline silicon solar cells are widely used, and they can achieve a power conversion efficiency of 24.0% [3].
Despite improvements in the power conversion efficiency of solar cells, the generation power of solar modules decreases over time. There are several causes of this long-term degradation, but a phenomenon called light-induced degradation (LID) is among the most notable. LID is caused by a boron oxide complex (B s O 2 i ), which is generated by the combination of substitutional boron (B s ) and interstitial oxygen dimers (O 2 i ) diffused in the matrix of p-type silicon wafer. This switching process consumes electrons and holes, which degrades the minority carrier lifetime [4]. B s O 2 i exists in a bistable state (square or staggered), and it switches between states in response to light irradiation. This switching process consumes electrons and holes, which degrades the minority carrier lifetime in p-type solar cells [4]. It has been reported that B s O 2 i will recover its initial efficiency if it is heated at 200 C, in the dark, for 10 min; this is called the recovery process [5]. When a solar module is installed outside the field, it will show degradation of 2.5% in the first year with the LID phenomenon, and 0.6%/y thereafter, due to various causes [1]. LID can reduce the power output of solar cells by 10%, and various studies have attempted to mitigate this effect [6,7,8].
When the photovoltaic industry was first developed, there was much focus on the development of devices with high power conversion efficiency to increase the energy generation per unit area. Thus, the energy density increased rapidly with the efficiency of solar cells, but this was accompanied by various adverse effects. In particular, there were problems with long-term reliability, typically LID, that had a negative effect on performance and caused economic losses during the warranty period. Consequently, the concept of levelized cost of electricity (LCOE) was introduced to evaluate the cost of solar modules and the profit from power generation; this concept is now widely used in the photovoltaic power generation industry. The LCOE increases as the reliability of solar modules decreases with the LID phenomenon. Therefore, preventing or limiting LID will reduce the LCOE, which will be beneficial to the power generation market.
Various attempts have been made to address the LID problem. For example, impurities such as germanium (Ge), phosphorus (P), and gallium (Ga) have been implanted to change the impurities available inside the p-type solar grade wafer. This method prevented some LID effects, but it also increased costs because there were greater deviations in the resistivity according to the ingot length. This was due to differences in the segregation coefficient caused by changes in the impurities when the Czochralski (Cz) method was used to grow the wafers. To overcome the problems of the impurity implantation method, a phase shift-based technique was developed, where a metastable state was produced by continuously irradiating a solar light source at or above 130 C [9,10]. With this method, the efficiency of the solar cell was not recovered perfectly, but it did not decrease further after the slight initial LID. However, these anti-LID properties disappear if the cell is placed at >100 C in the dark, for 10 min, and the LID phenomenon will occur again thereafter. Hence, this is considered a metastable state [11,12]. In particular, the degradation phenomenon occurring in multi-crystalline silicon solar cells was named light- and elevated temperature-induced degradation (LeTID) and many studies were conducted [13,14,15,16,17,18,19,20]. It has been reported that these degradation characteristics have different reactivities in mono-crystalline and multi-crystalline silicon solar cells [16,21,22,23,24,25,26]. As a result of these studies, it was found that the deterioration process can be equally caused by a current injection in the dark state without the irradiation of a light source in the solar module [14,21,27,28,29].
Current methods aim to prevent LID by using a belt-furnace to conduct high-temperature rapid thermal treatment (RTP) of solar cells during the manufacturing process. This process provides a certain level of anti-LID state, but it is lost during the subsequent module lamination process, which involves a vacuum adsorption state at approximately 200 C for >20 min. Therefore, the LID phenomenon occurs again later in the module using the anti-LID solar cell. To prevent this, LID treatments must be applied after the solar module is constructed.
The key point for effective anti-LID technology lies in the development of technology that can keep the solar cells’ temperature >130 C. Currently, a large chamber can be used to heat a 72-cell solar module using hot air. However, this method takes a long time to heat the solar cells inside the module because the encapsulant has high thermal resistance. In addition, the external temperature of the module is higher than that of the solar cell due to the temperature gradient, so the encapsulant may be damaged in the process. Moreover, this method increases the temperature of the environment around the solar cell, which takes a long time for heating/cooling, and thus, there is increased energy use and costs to maintain the large closed environment.
This study aims to develop technology that will minimize damage to the encapsulant by selectively heating the cells inside a solar module, rather than supplying external thermal energy. This will be achieved using an induced magnetic field and the principal of an induction heater, to heat the Al electrode in the rear side of the solar cells using a previous study [30]. Copper coil patterns will be used to apply the induced magnetic field to the module, and a half-bridge resonance circuit will be used to create a high-frequency electromagnetic field. The treatment of the LID process was induced by current injection using an external power source as the solar module is heated. Finally, the treatment of the LID process was monitored in situ, and kinetic simulation analyses were also performed based on the measurements.

2. Materials and Methods

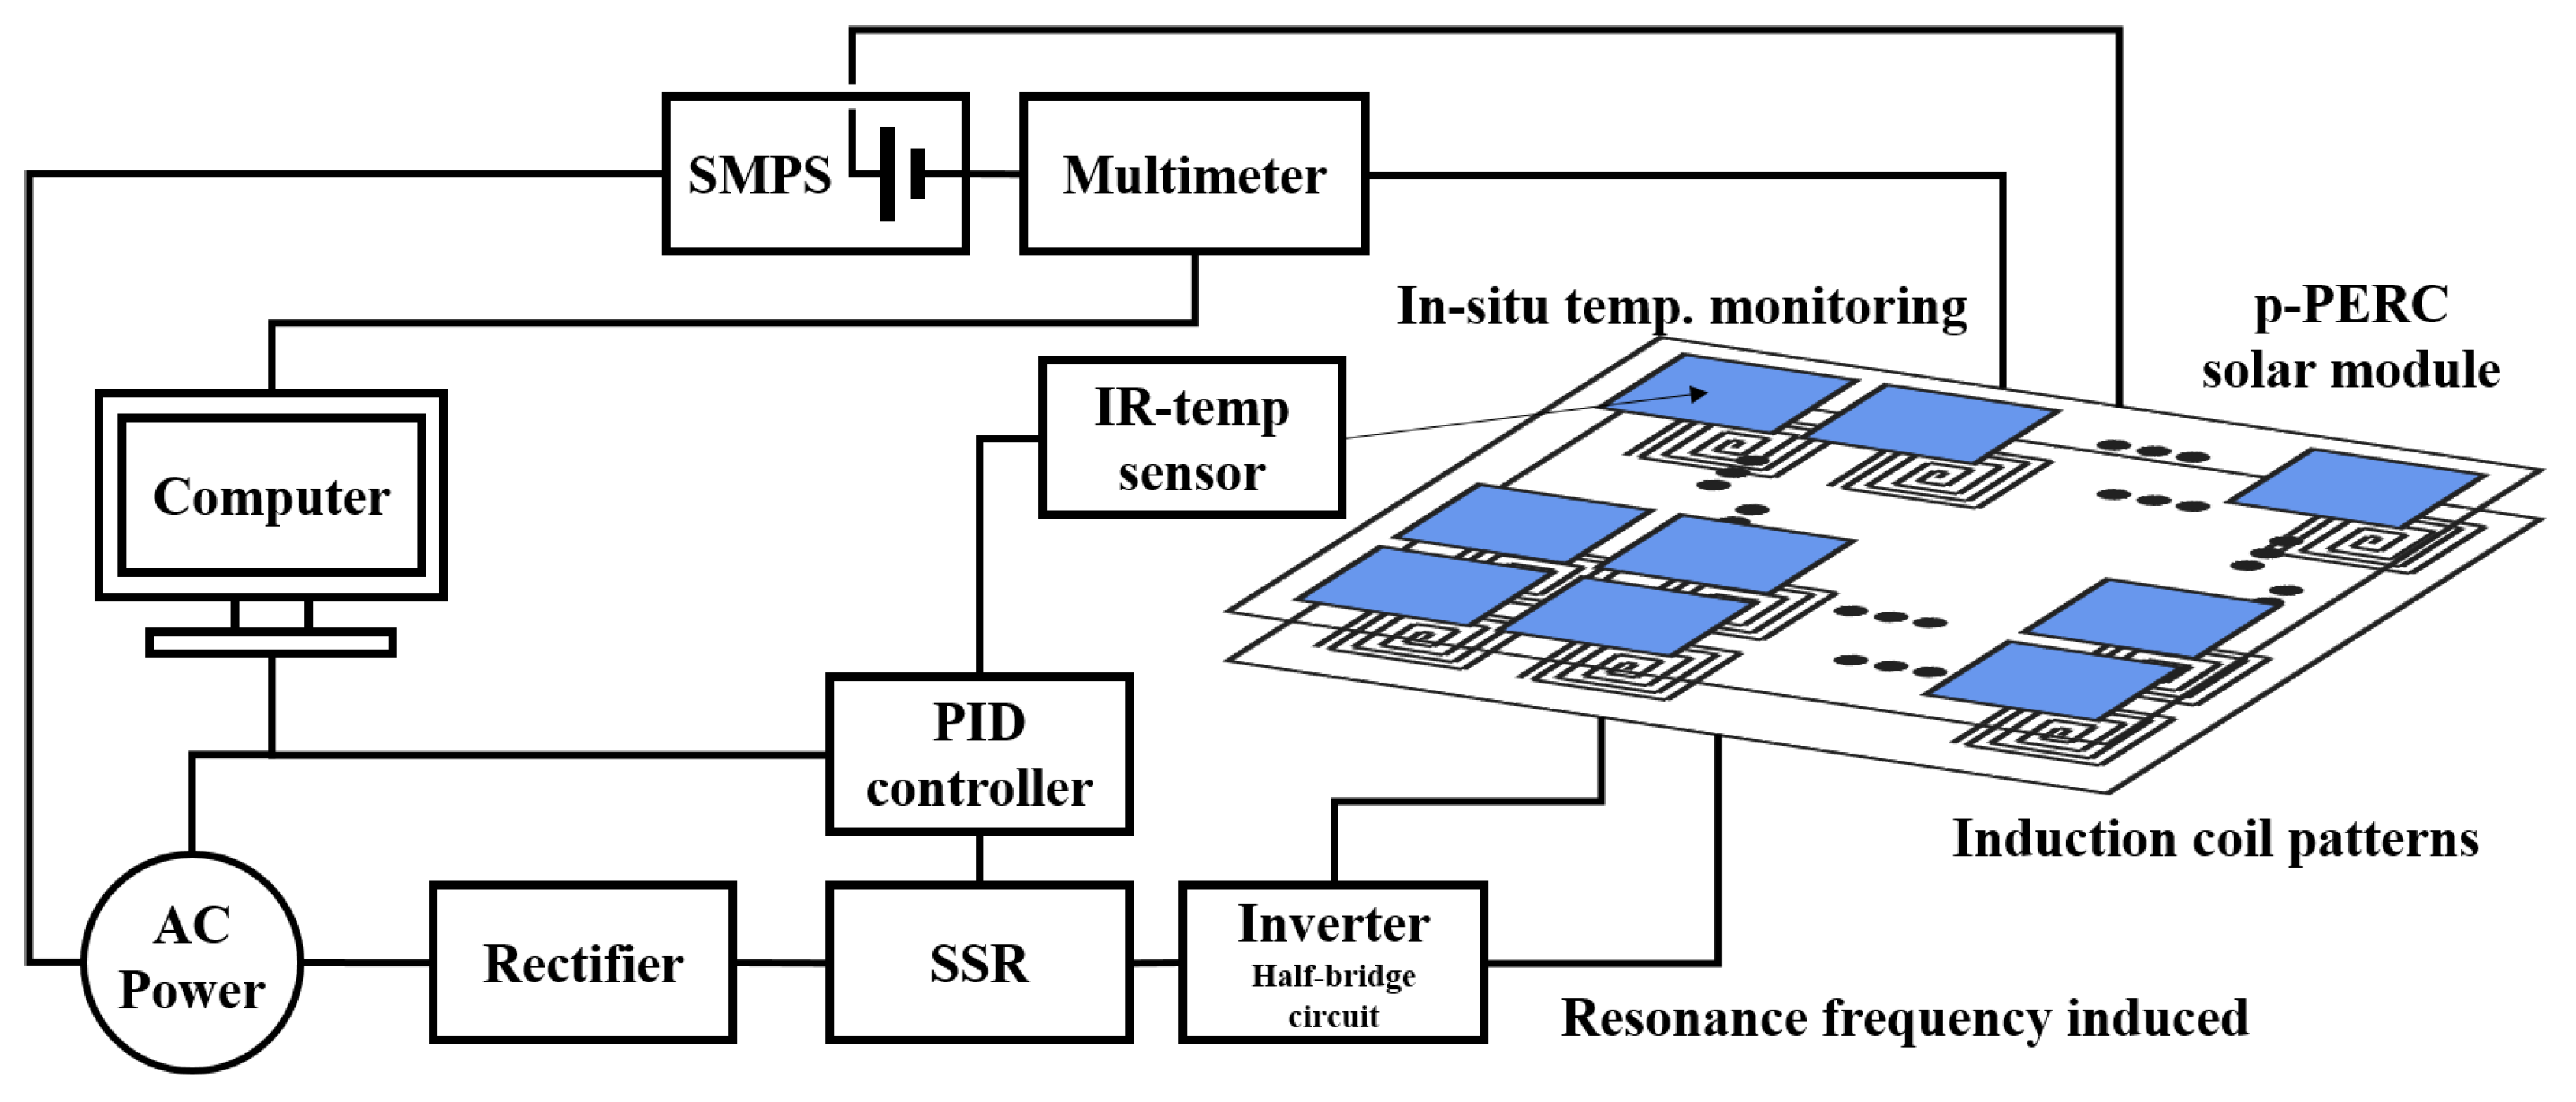
2.1. Treatment of LID Apparatus and Half-Bridge Resonance Circuit

The treatment of the LID apparatus is shown in Figure 1. The induction coil patterns consisted of a pseudo-square shape, approximately the same size as a solar cell. The coils were made from 20 strands of copper wires (diameter = 0.35 mm, and approximate length = 15 m).
A high-frequency electromagnetic field was produced using a half-bridge resonance circuit, which applied an alternating current (AC) to the coil with an oscillation output of 3000 W. The power supplied to the half-bridge resonance circuit was direct current (DC), 48 V, and 62 A; the 3000 W output was obtained using a rectifier. A solar cell placed on the coil was then heated via induction heating.
The relative permeability of Al is 1.00000065, which is similar to that of air and is very small compared to that of Fe, which is 5000–6000; therefore, Al is rarely used in induction heaters [31]. However, the solar cells in this study used Al as the rear anode, with an area of ∼240 cm 2 and a thickness of ∼36 μ m. Even though the hysteresis was small due to weak eddy currents from the induced magnetic field and the low relative permeability, heat was generated effectively because the relative volume of Al in the cells was extremely small.
The temperature of the solar module backsheet was measured without contact using an infrared (IR) thermometer. Once the target temperature was achieved, a solid-state relay (SSR), installed between the rectifier and the half-bridge resonance circuit, was used to prevent further heating via a proportional integral derivative (PID) controller. The temperature was maintained within < ± 0.2 C of the target. Power was supplied to the solar module via a switching mode power supply (SMPS) that could regulate the voltage. Observations of the power supply to the module were made in real time using a multimeter circuit installed in a microcomputer. All of the signals generated by the apparatus were collected by a computer, which also functioned as the PID controller, and stored the SMPS results.
The heating method of the apparatus was in contact with the induction heating coil and the solar module was positioned upside down, as shown in Figure 2. To selectively heat the cell inside the module, it was necessary to minimize the materials that would react with the magnetic field; therefore, the induction coil plate containing the induction heating coil was made from polycarbonate (PC), which does not react to magnetic fields. Moreover, PC is suitable for use in rapid thermal processes as it does not experience permanent deformation at temperatures up to 100 C, and it is highly resistant to temperature changes. As shown in Figure 2, the space between the solar cell and the induction heater was minimized using a frame hole structure, thereby improving the remote heating efficiency. The system was designed so that it could easily be mass produced, as such, no additional procedures were required to make the temperature measurements. Once the solar module was placed in the treatment of LID apparatus, temperature measurements were made without contact using an infrared thermometer located behind the module.

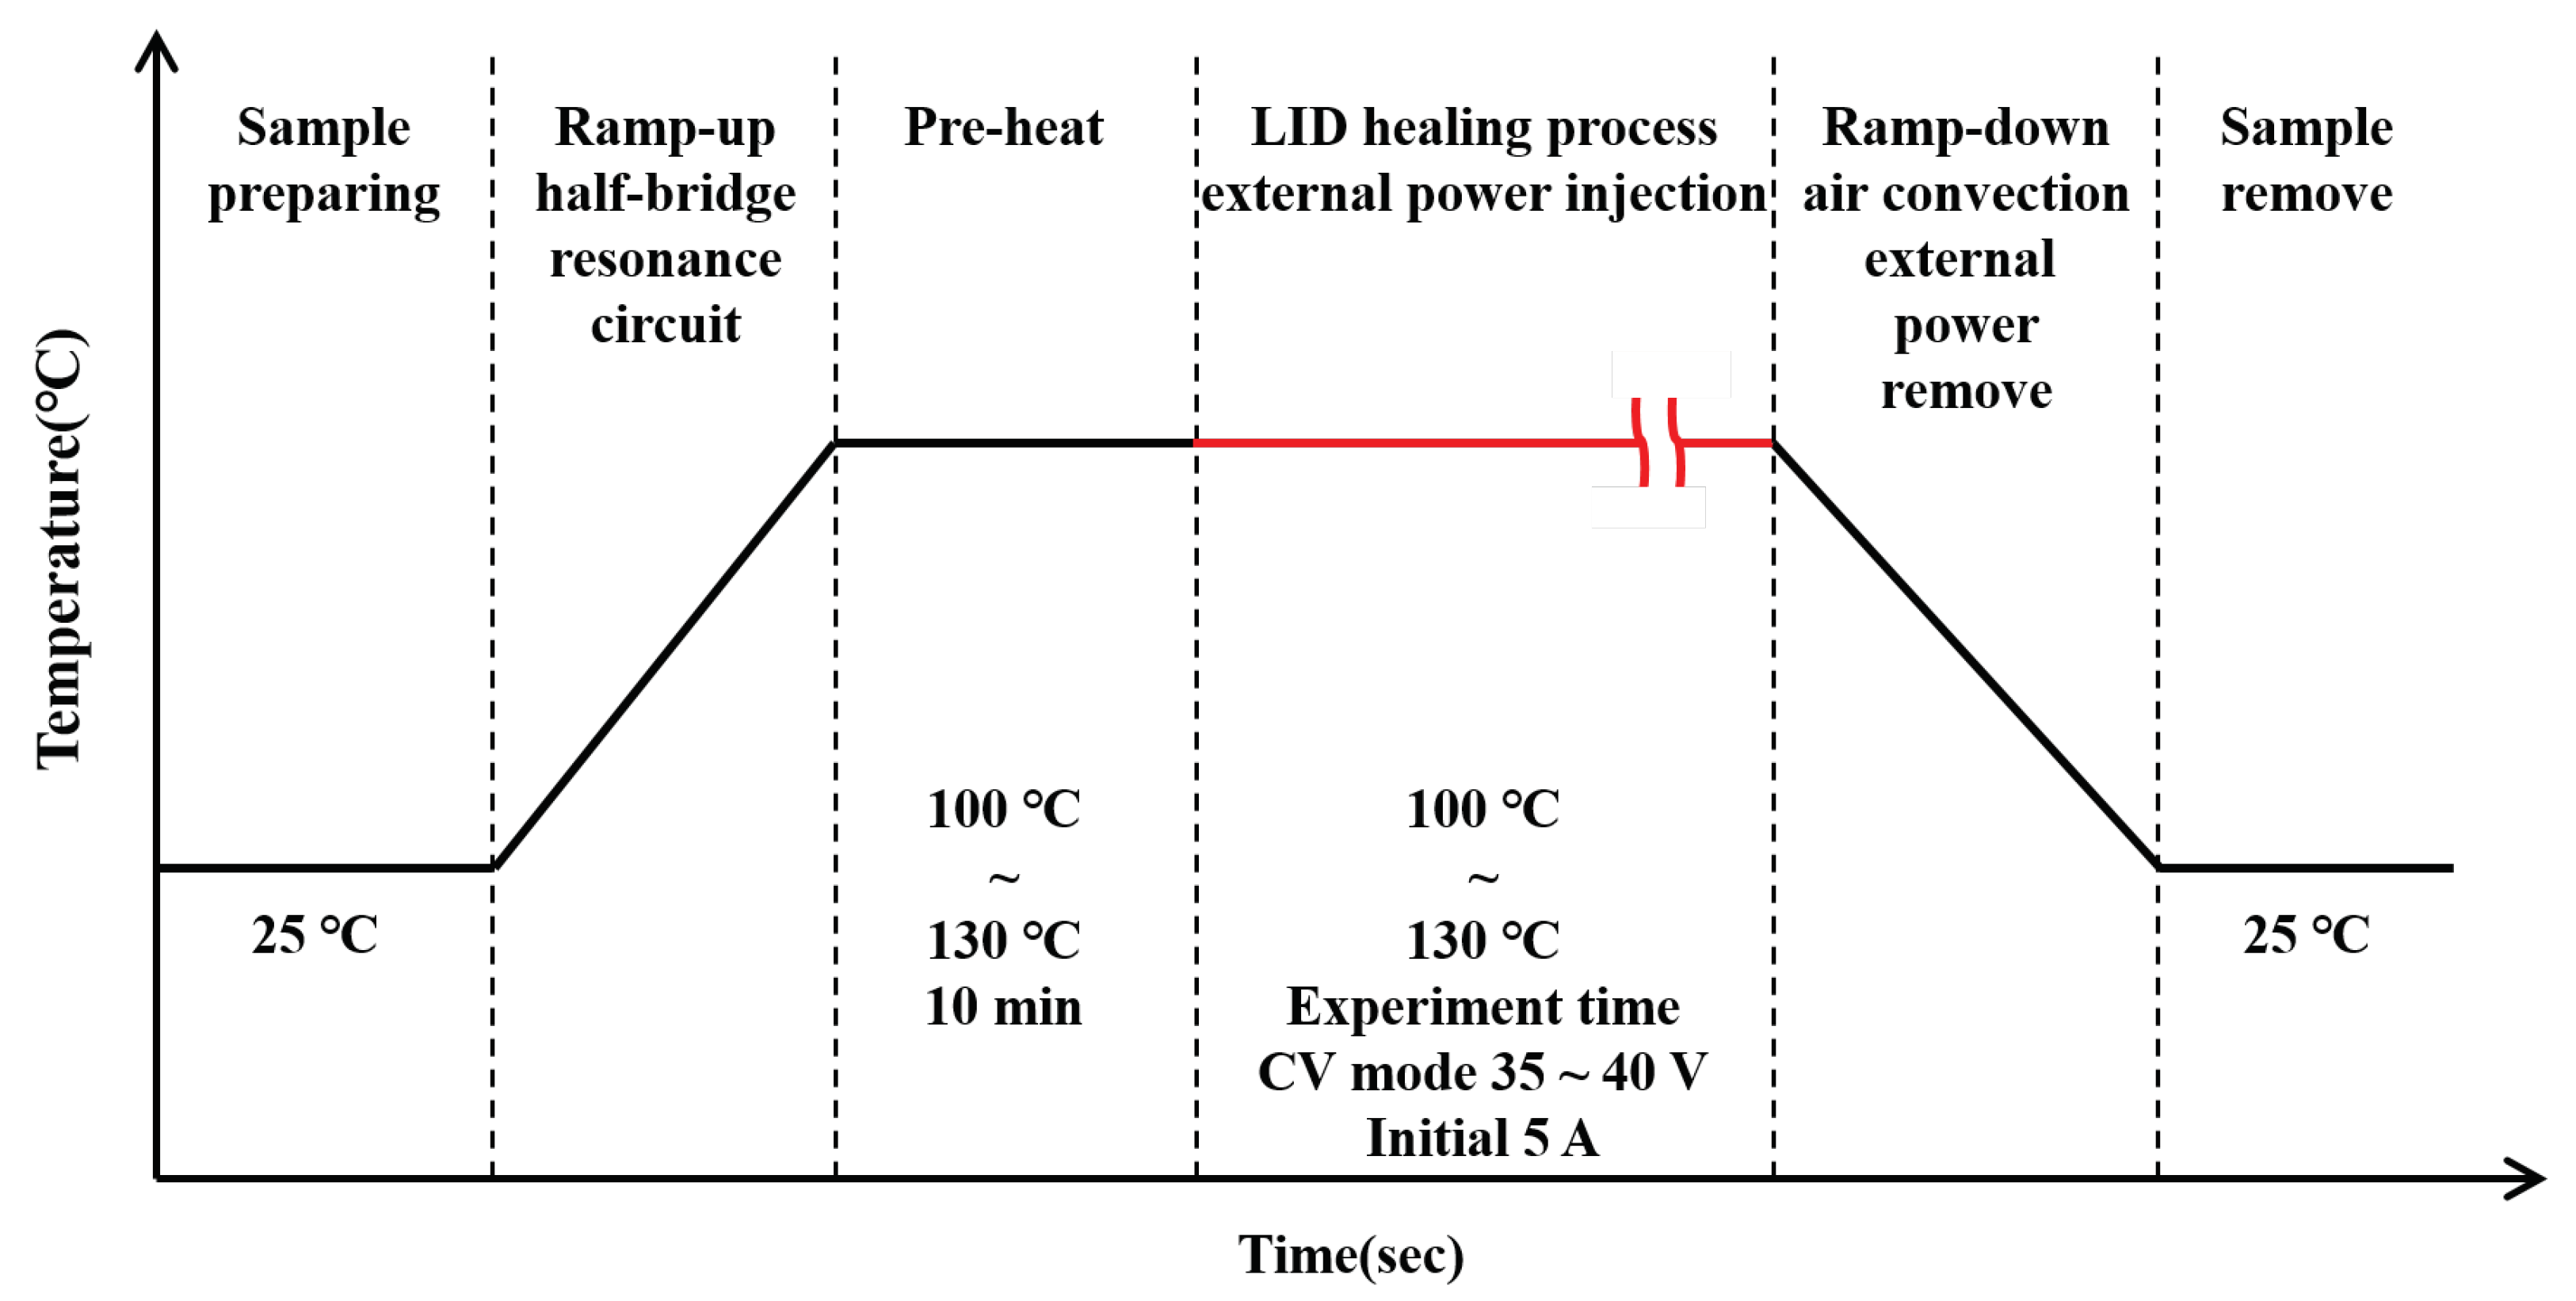
2.2. Solar Cell Module & LID Healing Process

The solar module used in this study was fabricated using solar cells with a monofacial PERC structure made from a p-type M2 size mono-crystalline silicon pseudo-square wafer. The solar module contained 72 solar cells connected in series, and external power injection was supplied through a junction box. The module measured 90 × 180 × 35 cm, and it weighed 32 kg including the external Al frame. As shown in Figure 2, the solar cells were protected by a 3 mm-thick front layer of glass, the ethylene-vinyl acetate (EVA), and a back sheet. We designed a customized apparatus to enhance the treatment of LID process and it can also monitor whole process properties. To operate the remote heater, the module was positioned so that the front glass was in contact with the surface of the induction heating coil, as shown in Figure 2. The module was fixed to the groove at the bottom of the coil plate by its dead weight, without additional fasteners.
The treatment of LID process on the solar module was different from that for a solar cell due to the temperature limitation of encapsulated materials in our experiment. In a solar cell, LID is recovered by thermal treatment at 200 C for 10 min, but the same conditions could damage the encapsulant on solar modules. Instead, the solar module was mounted on the treatment of LID apparatus at room temperature, then the heat was ramped up using the induction heating mechanism. Because the solar cells were heated directly by induction, the heating rate was much higher than it was with the thermal conduction method. In this study, the experiment was performed with three target temperatures: 100, 120, and 130 C as shown in Figure 3. Once the target temperature was achieved, a 10 min stabilization process was used to stabilize the temperature of the cell. When the solar module reached its steady state, power was supplied by an external power source, and changes in the supplied power were measured and recorded in real time. The external power was applied under a constant voltage (CV). To maintain a constant current injection condition, the power was adjusted from 35 to 40 V according to the temperature, as the open-circuit voltage varied with the temperature of the solar module. The current applied under the CV condition was set to 5 A immediately after the external power was supplied. When LID proceeded due to the CV condition, the open-circuit voltage of the solar cell decreased, so the current of the external power source had to be increased to maintain the constant voltage. When the treatment of LID process occurred, the current changed in the opposite way. Because 72 solar cells were connected in series, it was hard to measure fine changes in the voltage for each solar cell. This was achieved by obtaining sensitive measurements of the changes in the current caused by applying external power in CV mode, which could then be used to find the changes in the open-circuit voltage. Finally, after completing the solar cell treatment of LID process, the external power was turned off and the operation of the half-bridge resonance circuit was stopped to prevent remote heating of the solar module. After the heating stopped, the module quickly reached room temperature via air cooling. Once the temperature reached equilibrium, the module was removed from the induction heating device.

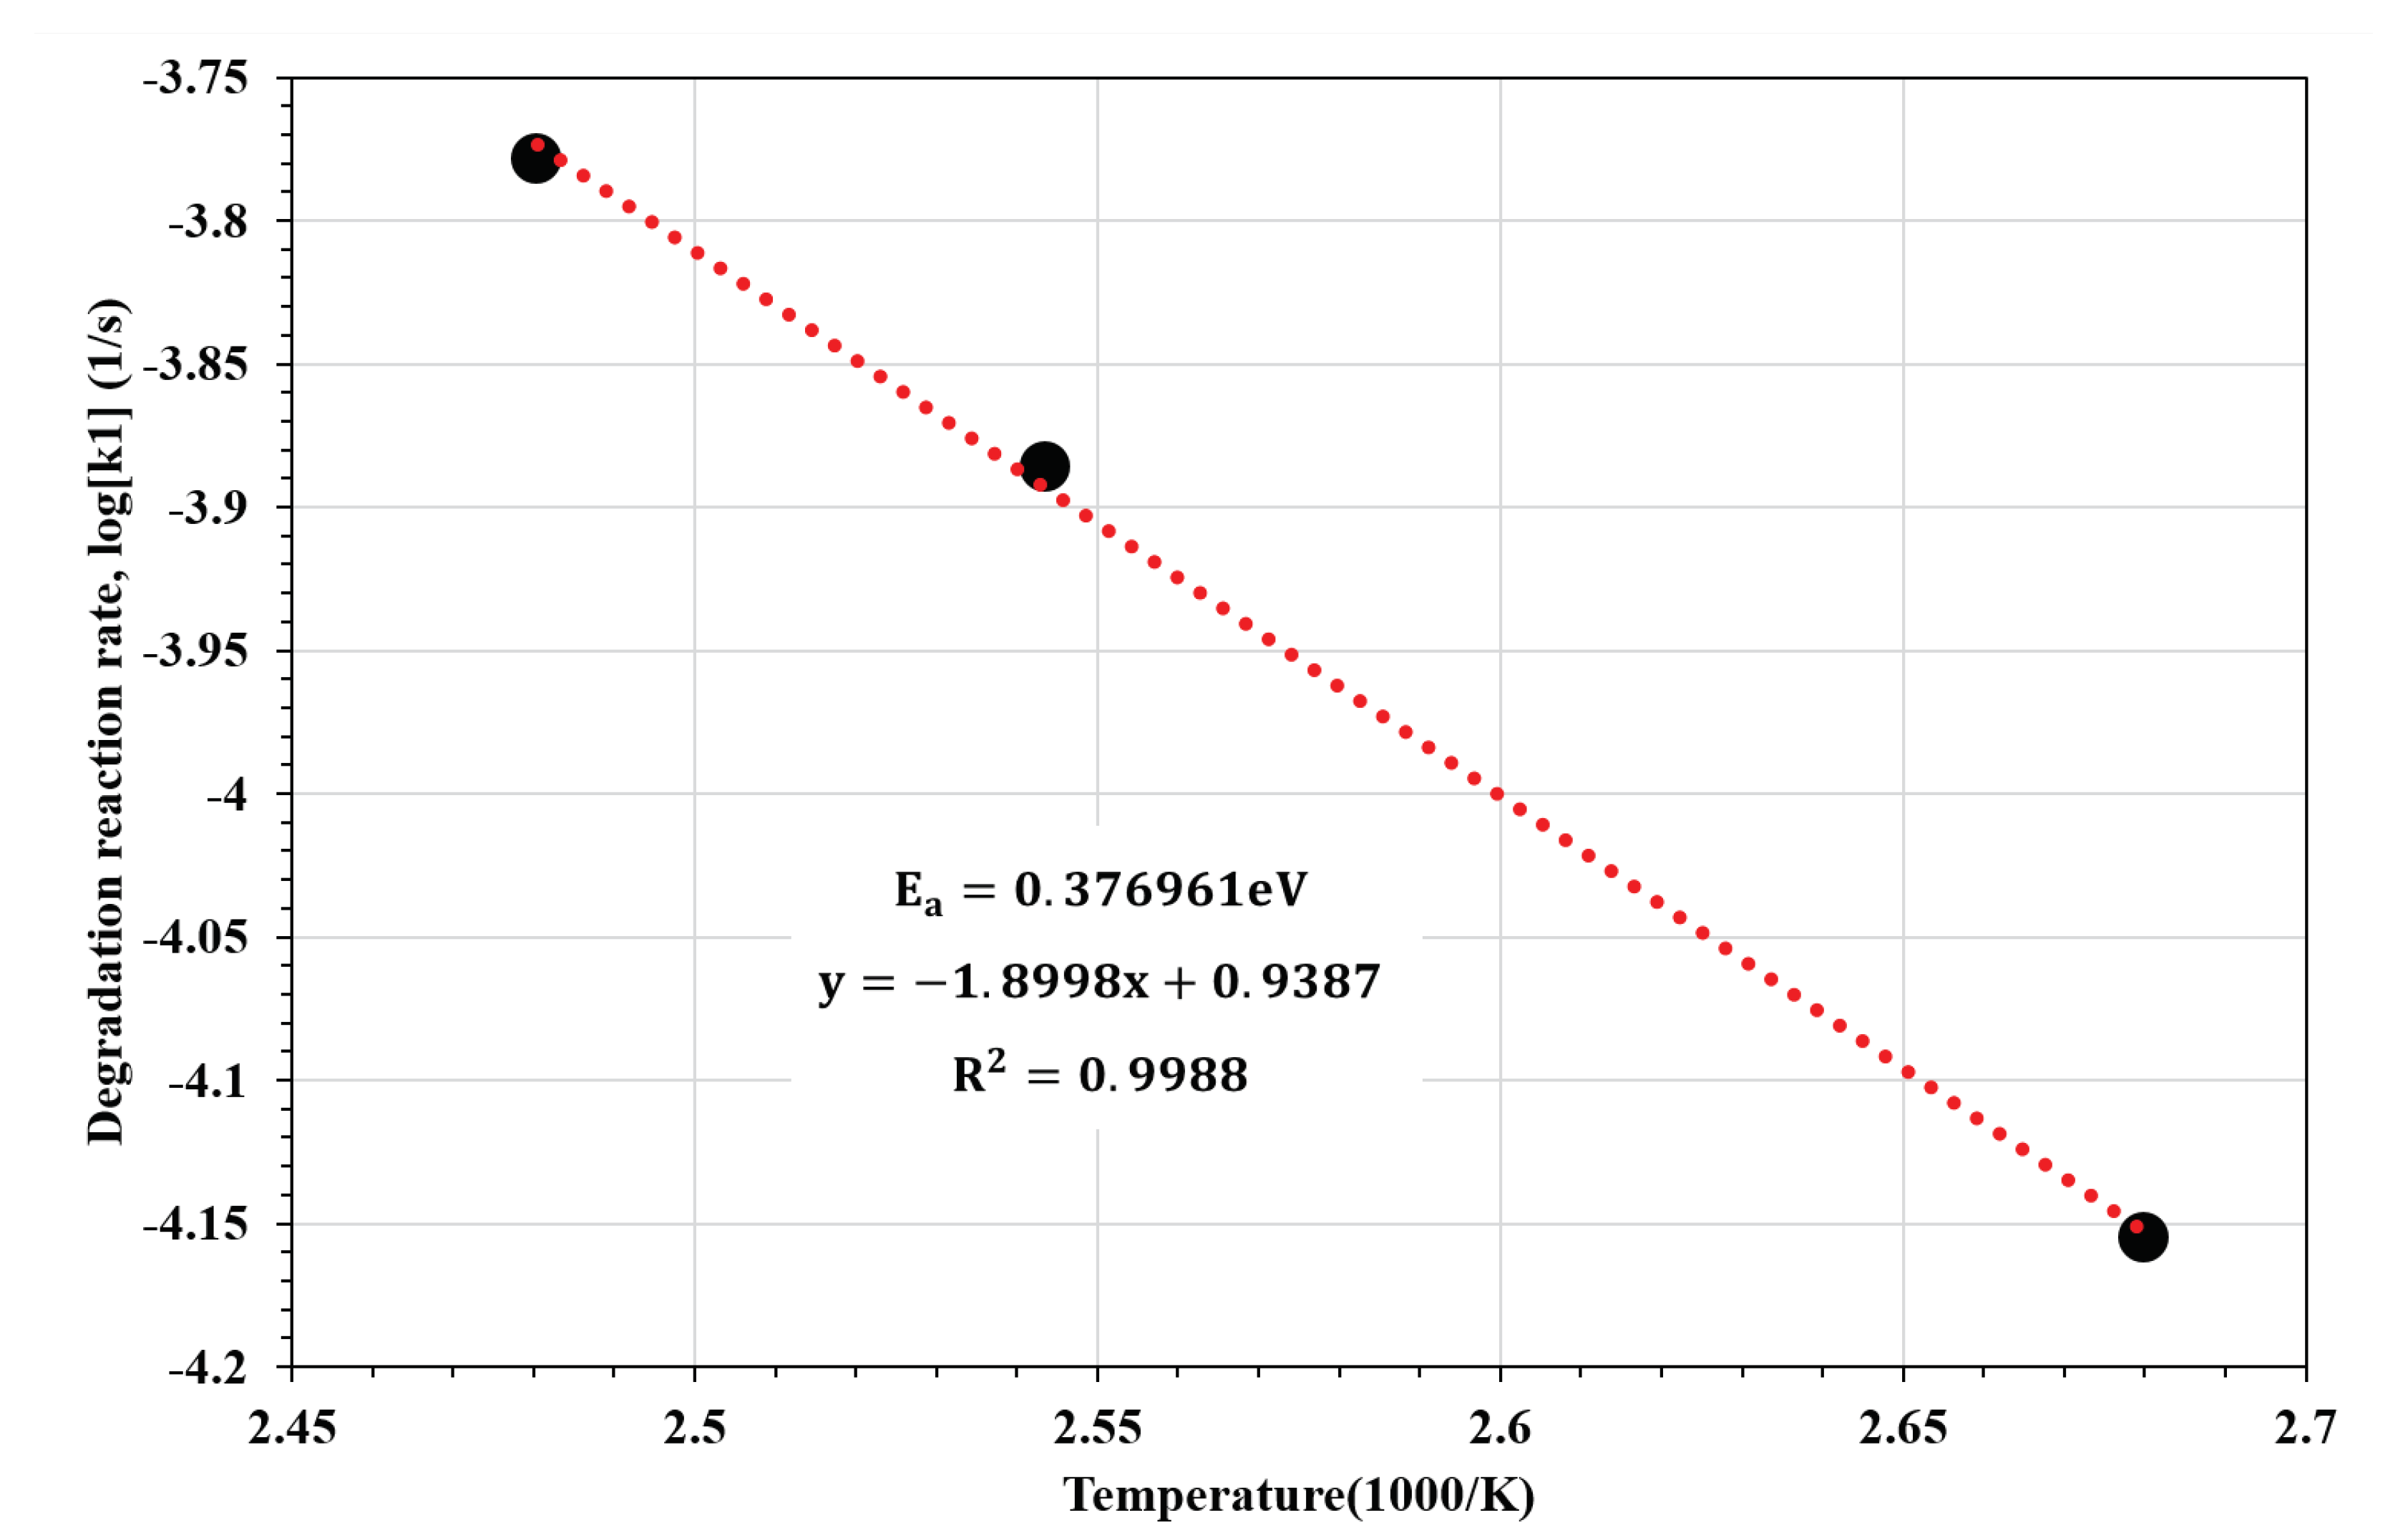
2.3. Kinetic Simulation Analysis

Chemical reaction kinetics theory was used to analyze the degradation and the treatment of LID process, as measured in real time by the recovery apparatus [32,33]. The state in which there was no LID of the solar module was defined as the initial state, A; the state in which LID had progressed was defined as B; and the metastable state in which the solar cell treated from LID with no additional degradation was defined as C. The measurement results were analyzed under the reversible reaction condition assuming that there was a cyclic reaction path in which these three states interacted. The governing equations for the cyclic reaction can be expressed by:
C a t = k 3 C c k i 3 C a k 1 C a + k i 1 C b
C b t = k 1 C a k i 1 C b k 2 C b + k i 2 C c
C c t = k 2 C b k i 2 C c k 3 C c + k i 3 C a ,
where C a denotes the concentration in state A, which has a value between 0% and 100%; C b and C c denote the concentrations in states B and C, respectively; and it is assumed that the sum of the concentrations of all states has to be 100%. In addition, k 1 denotes the reaction rate constant in the LID process (state A → B, degradation), k 2 denotes the reaction rate constant in the process switching from the LID state to the metastable state (state B → C, treatment of LID), and k 3 denotes the reaction rate constant in the process of switching from the metastable state to the initial state (state C → A, destabilization). Then, k i 1 denotes the reaction rate constant in the process of recovery (state B → A, recovery), and k i 2 and k i 3 are the reaction rate constants in the re-degradation process (state C → B, redegradation), and the process of switching to the metastable state from the initial state (state A → C, stabilization), respectively.
These nonlinear equations could not be analyzed by a general algebraic method, so they were converted into a matrix form using the eigenvalue method for modeling [30,34,35]. The transformed matrix was simplified using the general solution, and rearranged using the inverse Laplace transform, then the concentration of each state was observed over time. The signals obtained from the treatment of LID process apparatus were fitted prior to the analysis of the cyclic reaction model for kinetics rate constants. The mathematical optimization algorithm was used to obtain a numerical solution as the interpretation of an equation of higher degree, with three initial state concentrations and six reaction rate constants as variables, was required. The least-squares curve fitting method for the nonlinear equation and the Matlab program were used to solve complicate numerical problems.

3. Results

As shown in Figure 4a, the changes in the concentrations of the three states A, B, and C, over time were simulated using the cyclic reaction theory. The simulation revealed that the concentration of state A decreased sharply over time, state B increased then decreased, and state C increased sharply. At 25 C, the concentration of state B, the state where LID had occurred, increased continuously until it reached a saturation point. However, with the treatment of LID process, it increased initially and then decreased in this study. As shown in Figure 4b, the signal changes in the treatment of LID process apparatus exhibited the same trend as the sum of states A and C. However, the state after the treatment of LID process was different from the initial state, as with the existing solar cell unit. The result was ∼2% lower, indicating that there was a kinetic path from state C to state A through the destabilization process.
Figure 5 shows a solar module being remotely heated by the treatment of LID process apparatus. Although the heat was concentrated around the pseudo-square coil, sufficient heat was transferred to the surrounding area in p-PERC solar cell. All areas of the 72-cell solar module were heated to at least 100 C, and the heat was uniformly distributed around the centers of the cells. Although the solar module frame was also made of aluminum, the heating effect was relatively insignificant as the volume was very large compared to the rear electrodes of the solar cells.
The changes measured after external power was applied while heating the solar module showed different patterns according to the change in temperature, as shown in Figure 6. When external power with the same conditions was applied, the time taken to reach the saturation point and the degree of saturation depended on the temperature change in the solar module. When external power with the same conditions was applied, the process time taken to reach the saturation point and the degree of saturation depended on the temperature change in the solar module. It took the longest, 69.61 h, to reach the saturation point when the solar module was at 100 °C, and the saturation point was 83.67%. When the temperature of the solar module was increased to 120 C, it took 35.77 h to reach the saturation point, which was 88.26%. Finally, when the temperature of the solar module was 130 C, it took just 11.11 h to reach the saturation point, which was 97.43%. As the temperature of the solar module increased, the time required to reach the saturation point decreased, and the saturation point values increased.
Figure 6 shows the kinetic simulation result according to the temperature change of the solar module. As shown in Figure 6a, the experimental and simulated results were well matched. The initial reaction to the treatment of LID process varied in reactivity according to the temperature for each solar cells in module. In terms of the initial range, relative differences were observed, as shown in Figure 6b. Similar trends were observed in the early stages, up to 1000 s, in terms of the reactivity. After 1000 s, LID and treatment state occurred in combination, and different trends were observed depending on the temperature. As the temperature of the solar module increased, the similarity between the experimental and simulated results after 1000 s increased. As shown in Figure 6b, the experimental results completely coincided with the simulated results under the 130 C condition.
The kinetic constant can be obtained from the cyclic reaction model at each temperature by matching the results for the LID and the treatment state of the solar module with the results calculated using the kinetics model. Figure 7 shows the kinetic constant for each temperature condition in the treatment of LID process. The change in the kinetic constant according to temperature can be defined based on the Arrhenius equation as:
L o g k = L o g A E a 2.30259 × k b × T × 1000
E a = S l o p e × 2.30259 × k b × 1000 ,
where k denotes the reaction rate constant of the kinetic model, A denotes the frequency factor that uses the same unit as the reaction rate constant, E a denotes the activation energy for each reaction path, and k b denotes the Boltzmann constant.
From the data in Figure 7 and Equation (2a), the slope of the simple linear regression curve was found to be 1000 × E a / ( 2.30259 × k b ) . Equation (2b) was obtained by expressing Equation (2a) in terms of the activation energy. As shown in Figure 7, the activation energy, calculated using a simple linear regression analysis for the simulation, was 0.376961 eV. The coefficient of determination (R-squared) of the simple linear regression curve was 0.9988, indicating acceptable reliability.

4. Discussion

As shown in Figure 6a, the pattern in which the saturation point was reached changed as the temperature of the solar cell increased from 100 to 130 C. When the temperature of the solar module increased from 100 to 120 C, the time taken to reach the saturation point decreased by 48.55%, and the saturation point rose by 5.49%. When the temperature of the solar module increased to 130 C, the time taken to reach the saturation point decreased by 84.01%, and the saturation point rose by 16.45%. This suggests that increasing the temperature of the solar module has a significant effect on the time taken to reach the saturation point during the treatment of LID process. When the temperature was 130 C, the final saturation point was 97.43%, indicating that the increase in temperature not only shortened the time, but also increased the stabilization process from state A to C, compared to the destabilization process from state C to A. The time required to reach the saturation point decreased as the treatment of LID process converted state B to state A more rapidly. The increase in the saturation point was due to the increase in the speed of the stabilization process.
As shown in Figure 6b, the concordance between the simulation and experimental results increased as the temperature of the solar module increased. The cause of this phenomenon could be analyzed in several ways, but a particular consideration of this study was the fact that the measurement results were the results of 72 solar cells overlapping. Although the same current flowed through the solar cells, which were connected in series, the speed of LID and treatment processes varied slightly between individual solar cells due to slight differences in the characteristics of each cell. When the temperature of the solar module was 100 C, treatment of LID process occurred slowly, as the activation energy was insufficient to remove the LID defects. When the treatment of LID process speed was slow, there were large deviations between the solar cells, unlike the kinetic model, which assumed that the cells were identical; therefore, the difference between the experimental and theoretical results increased. As the temperature of the solar module increased to 130 C, the kinetic constant increased to 137% of that at 100 C, demonstrating an exponential increase in addition to the large increase in the reaction speed. At 130 C, the difference between the treatment of LID process speed of the solar cells inside the module decreased as the overall treatment of LID process speed increased. Thus, the experimental and simulated results appeared to be consistent, as there was very little deviation between the 72 solar cells from the very beginning of the treatment of LID process to the subsequent processes. Therefore, the experimental and simulated results were similar.
Although the similarity between the simulated and experimental results increased with the temperature of the solar module, as shown in Figure 6, the treatment of LID process occurred in small step curve shape over time. As shown in Figure 6a, a more distinct and regular shape was observed as the temperature increased. The external power source applied to the solar module maintained a uniform voltage supply to the solar module using the CV mode, which could be interpreted as applying the same voltage to the cells inside the solar module. The same current flowed through the solar cells, which were connected in series, and the treatment of LID process speed differed between individual p-PERC solar cells. Therefore, we think the external power was concentrated on the cells with a slow treatment of LID process speed, it made locally small step curve in measurement data. This process was more prominent at higher temperatures, and was not readily apparent at 100 C because the treatment of LID process speed was generally slow.
As shown in Figure 7, the activation energy of the LID process was 0.376961 eV with the kinetic constants varying the temperature. Previous studies have reported various values in the range of 0.3–0.475 ± 0.035 eV [4,9,30,34,35,36,37,38,39,40]. The activation energy value obtained from the kinetic simulation in this study was not significantly different from the values reported in the literature, suggesting that the kinetic model was applicable to the module of 72 solar cells connected in series. Based on these findings, the treatment of LID process could be extended to a module with 72 cells connected in series, overcoming the limitations of the treatment of LID processes for solar cells. Moreover, this study has shown experimentally that an entire connected solar cell can be treated for LID when multiple cells are connected in series. Therefore, in future, multiple solar modules can be connected in series during treatment.

5. Conclusions

In this study, the treatment of LID process was observed in a p-type PERC solar module, which is the most commonly used solar module in the photovoltaic industry. In general, the treatment of LID is performed by rapid thermal processing in the solar cell manufacturing stage, but the subsequent lamination process in the module manufacturing stage counteracts the treatment of LID process and returns the cells to their original initial state. This study aimed to prevent this by conducting the treatment of LID after the fabrication of the solar module. However, the solar module was encapsulated in a polymer, so external heating was likely to cause damage. To address this, the Al electrode at the rear side of the solar cell was heated using an induced magnetic field provided by a half-bridge resonance circuit. We developed the technology to directly heat the cells inside the solar module by remote heating, and damage to the encapsulant was minimized as no heat was generated outside the solar cells and module frame. The pattern in which the saturation point was reached varied as the temperature of the solar module increased from 100 to 130 C. The time taken to reach the saturation point decreased as the treatment of LID process speed, where state B was converted to state C, progressed more rapidly. In addition, there was an increase in the saturation point values due to the increased speed of the stabilization process. As the temperature of the solar module increased, the differences between the treatment of LID process speeds of the p-PERC solar cells inside the module decreased as the overall recovery speed increased. This increased the concordance of the experimental and kinetics simulated results. The LID activation energy measured in this study was similar to values reported in the existing literature, so the kinetic model used in this study is likely to be valid; it was also applicable even when 72 cells were connected in series. Through the results of this study, we confirmed that, when multiple solar cells are connected in series, the entire connected solar cell can be simultaneously treated for LID. Therefore, in future, multiple solar modules could be connected in series while they are treated for LID.

Author Contributions

Conceptualization, M.-g.S. and S.M.K.; methodology, M.-g.S., J.K. and S.M.K.; software, S.M.K. and J.K.; validation, M.-g.S., S.M.K. and Y.L.; formal analysis, J.K., Y.K. (Yoonkap Kim); investigation, J.K., S.M.K.; data curation, M-g.S. and S.M.K.; writing—original draft preparation, M.-g.S., J.K. and S.M.K.; writing—review and editing, Y.L., Y.K. (Yoonkap Kim) and Y.K. (Yangdo Kim); visualization, S.M.K.; supervision, Y.K. (Yangdo Kim) and S.M.K. All authors have read and agreed to the published version of the manuscript.

Funding

This work was supported by the Korea Institute of Energy Technology Evaluation and Planning(KETEP) and the Ministry of Trade, Industry and Energy(MOTIE) of the Republic of Korea (No. 20183010014320), National R&D Program through the National Research Foundation of Korea(NRF) funded by Ministry of Science and ICT(NRF-2017M1A2A2087325), conducted under the framework of the Research and Development Program of the Korea Institute of Energy Research (B7-2426) and a grant(The core project-564) from Gumi Core Components and Materials Technology Development Program of the Gumi Regional Government, 2021.

Acknowledgments

This work was supported by the Korea Institute of Energy Technology Evaluation and Planning (KETEP) and the Ministry of Trade, Industry and Energy (MOTIE) of the Republic of Korea (No. 20183010014320), National R&D Program through the National Research Foundation of Korea (NRF) funded by Ministry of Science and ICT (NRF-2017M1A2A2087325), conducted under the framework of the Research and Development Program of the Korea Institute of Energy Research (B7-2426) and a grant (The core project-564) from Gumi Core Components and Materials Technology Development Program of the Gumi Regional Government, 2021.

Conflicts of Interest

The authors declare no conflict of interest.

Abbreviations

The following abbreviations are used in this manuscript:
PERCPassivated Emitter and Rear Contact
BSFBack Surface Field
LIDLight-induced degradation
LCOELevelized Cost of Electricity
CzCzochralski
SSRSolid-State Relay
PIDProportional Integral Derivative
SMPSSwitching Mode Power Supply
EVAEthylene-Vinyl Acetate

References

  1. Equipment, V.P. International Technology Roadmap for Photovoltaic (ITRPV). 2021. Available online: https://itrpv.vdma.org/en/ueber-uns (accessed on 21 July 2021).
  2. Kersten, F.; Doll, R.; Kux, A.; Huljic, D.M.; Gorig, M.A.; Breyer, C.; Müller, J.W.; Wawer, P. PV Learning Curves: Past and Future Drivers of Cost Reduction. 2011. Available online: https://www.eupvsec-proceedings.com/proceedings?paper=12834 (accessed on 21 July 2021).
  3. Green, M.; Dunlop, E.; Hohl-Ebinger, J.; Yoshita, M.; Kopidakis, N.; Hao, X. Solar cell efficiency tables (version 57). Prog. Photovolt. Res. Appl. 2021, 29, 3–15. [Google Scholar] [CrossRef]
  4. Du, M.H.; Branz, H.M.; Crandall, R.S.; Zhang, S.B. A New Mechanism for Non-Radiative Recombination at Light-Induced Boron-Oxygen Complexes in Silicon. In Proceedings of the 2005 DOE Solar Energy Technologies, Denver, CO, USA, 7–10 November 2005. [Google Scholar]
  5. Fischer, H. Investigation of photon and thermal changes in silicon solar cells. In Proceedings of the Conference Record of the 10th IEEE Photovoltaic Specialists Conference, Palo Alto, CA, USA, 13–15 November 1973. [Google Scholar]
  6. Knobloch, J.; Glunz, S.; Henninger, V.; Warta, W.; Wettling, W.; Schomann, F.; Schmidt, W.; Endrös, A.; Münzer, K. 21% efficient solar cells processed from Czochralski grown silicon. In Proceedings of the 13th European Photovoltaic Solar Energy Conference, WIP Renewable Energies, Nice, France, 23–27 October 1995; pp. 9–12. [Google Scholar]
  7. Sterk, S.; Münzer, K.; Glunz, S. Investigation of the degradation of crystalline silicon solar cells. In Proceedings of the 14th European Photovoltaic Solar Energy Conference, Barcelona, Spain, 30 June–4 July 1997; Volume 85. [Google Scholar]
  8. Zhao, J.; Wang, A.; Green, M.A.; Ferrazza, F. 19.8% efficient “honeycomb” textured multicrystalline and 24.4% monocrystalline silicon solar cells. Appl. Phys. Lett. 1998, 73, 1991–1993. [Google Scholar] [CrossRef]
  9. Herguth, A.; Schubert, G.; Kaes, M.; Hahn, G. A new approach to prevent the negative impact of the metastable defect in boron doped Cz silicon solar cells. In Proceedings of the 2006 IEEE 4th World Conference on Photovoltaic Energy Conference, Waikoloa, HI, USA, 7–12 May 2006; Volume 1, pp. 940–943. [Google Scholar]
  10. Herguth, A.; Schubert, G.; Kaes, M.; Hahn, G. Avoiding boron-oxygen related degradation in highly boron doped Cz silicon. In Proceedings of the 21st European Photovoltaic Solar Energy Conference: 21th EC PVSEC, Dresden, Germany, 4–8 September 2006; pp. 530–537. [Google Scholar]
  11. Fertig, F.; Greulich, J.; Broisch, J.; Biro, D.; Rein, S. Stability of the regeneration of the boron–oxygen complex in silicon solar cells during module integration. Sol. Energy Mater. Sol. Cells 2013, 115, 189–198. [Google Scholar] [CrossRef]
  12. Fertig, F.; Broisch, J.; Biro, D.; Rein, S. Stability of the regeneration of the boron–oxygen complex in silicon solar cells during module certification. Sol. Energy Mater. Sol. Cells 2014, 121, 157–162. [Google Scholar] [CrossRef]
  13. Ramspeck, K.; Zimmermann, S.; Nagel, H.; Metz, A.; Gassenbauer, Y.; Birkmann, B.; Seidl, A. Light Induced Degradation of Rear Passivated mc-Si Solar Cells. 2012. Available online: https://www.eupvsec-proceedings.com/proceedings?paper=18798 (accessed on 21 July 2021).
  14. Kersten, F.; Engelhart, P.; Ploigt, H.C.; Stekolnikov, A.; Lindner, T.; Stenzel, F.; Bartzsch, M.; Szpeth, A.; Petter, K.; Heitmann, J.; et al. A new mc-Si degradation effect called LeTID. In Proceedings of the 2015 IEEE 42nd Photovoltaic Specialist Conference (PVSC), New Orleans, LA, USA, 14–19 June 2015; pp. 1–5. [Google Scholar]
  15. Chen, D.; Hamer, P.G.; Kim, M.; Fung, T.H.; Bourret-Sicotte, G.; Liu, S.; Chan, C.E.; Ciesla, A.; Chen, R.; Abbott, M.D.; et al. Hydrogen induced degradation: A possible mechanism for light-and elevated temperature-induced degradation in n-type silicon. Sol. Energy Mater. Sol. Cells 2018, 185, 174–182. [Google Scholar] [CrossRef]
  16. Petter, K.; Hubener, K.; Kersten, F.; Bartzsch, M.; Fertig, F.; Kloter, B.; Muller, J. Dependence of LeTID on brick height for different wafer suppliers with several resistivities and dopants. Int. Work. Cryst. Silicon Sol. Cells 2016, 6, 1–17. [Google Scholar]
  17. Bredemeier, D.; Walter, D.C.; Heller, R.; Schmidt, J. Impact of hydrogen-rich silicon nitride material properties on light-induced lifetime degradation in multicrystalline silicon. Phys. Status Solidi (RRL)–Rapid Res. Lett. 2019, 13, 1900201. [Google Scholar] [CrossRef]
  18. Kersten, F.; Engelhart, P.; Ploigt, H.C.; Stekolnikov, A.; Lindner, T.; Stenzel, F.; Bartzsch, M.; Szpeth, A.; Petter, K.; Heitmann, J.; et al. Degradation of multicrystalline silicon solar cells and modules after illumination at elevated temperature. Sol. Energy Mater. Sol. Cells 2015, 142, 83–86. [Google Scholar] [CrossRef]
  19. Chan, C.E.; Payne, D.N.; Hallam, B.J.; Abbott, M.D.; Fung, T.H.; Wenham, A.M.; Tjahjono, B.S.; Wenham, S.R. Rapid stabilization of high-performance multicrystalline p-type silicon PERC cells. IEEE J. Photovolt. 2016, 6, 1473–1479. [Google Scholar] [CrossRef]
  20. Chen, D.; Vaqueiro Contreras, M.; Ciesla, A.; Hamer, P.; Hallam, B.; Abbott, M.; Chan, C. Progress in the understanding of light-and elevated temperature-induced degradation in silicon solar cells: A review. Prog. Photovolt. Res. Appl. 2020. [Google Scholar] [CrossRef]
  21. Ciesla, A.; Kim, M.; Wright, M.; Zafirovska, I.; Chen, D.; Hallam, B.; Chan, C. A case study on accelerated light-and elevated temperature-induced degradation testing of commercial multi-crystalline silicon passivated emitter and rear cell modules. Prog. Photovolt. Res. Appl. 2021. [Google Scholar] [CrossRef]
  22. Kersten, F.; Fertig, F.; Petter, K.; Klöter, B.; Herzog, E.; Strobel, M.B.; Heitmann, J.; Müller, J.W. System performance loss due to LeTID. Energy Procedia 2017, 124, 540–546. [Google Scholar] [CrossRef]
  23. Grant, N.E.; Scowcroft, J.R.; Pointon, A.I.; Al-Amin, M.; Altermatt, P.P.; Murphy, J.D. Lifetime instabilities in gallium doped monocrystalline PERC silicon solar cells. Sol. Energy Mater. Sol. Cells 2020, 206, 110299. [Google Scholar] [CrossRef]
  24. Grant, N.; Rougieux, F.; Macdonald, D.; Bullock, J.; Wan, Y. Grown-in defects limiting the bulk lifetime of p-type float-zone silicon wafers. J. Appl. Phys. 2015, 117, 055711. [Google Scholar] [CrossRef]
  25. Sperber, D.; Herguth, A.; Hahn, G. A 3-state defect model for light-induced degradation in boron-doped float-zone silicon. Phys. Status Solidi (RRL)–Rapid Res. Lett. 2017, 11, 1600408. [Google Scholar] [CrossRef] [Green Version]
  26. Niewelt, T.; Selinger, M.; Grant, N.; Kwapil, W.; Murphy, J.; Schubert, M. Light-induced activation and deactivation of bulk defects in boron-doped float-zone silicon. J. Appl. Phys. 2017, 121, 185702. [Google Scholar] [CrossRef]
  27. Payne, D.; Chan, C.; Hallam, B.; Hoex, B.; Abbott, M.; Wenham, S.; Bagnall, D. Acceleration and mitigation of carrier-induced degradation in p-type multi-crystalline silicon. Phys. Status Solidi (RRL)–Rapid Res. Lett. 2016, 10, 237–241. [Google Scholar] [CrossRef]
  28. Chen, D.; Kim, M.; Stefani, B.V.; Hallam, B.J.; Abbott, M.D.; Chan, C.E.; Chen, R.; Payne, D.N.; Nampalli, N.; Ciesla, A.; et al. Evidence of an identical firing-activated carrier-induced defect in monocrystalline and multicrystalline silicon. Sol. Energy Mater. Sol. Cells 2017, 172, 293–300. [Google Scholar] [CrossRef]
  29. Chan, C.; Fung, T.H.; Abbott, M.; Payne, D.; Wenham, A.; Hallam, B.; Chen, R.; Wenham, S. Modulation of carrier-induced defect kinetics in multi-crystalline silicon PERC cells through dark annealing. Sol. Rrl 2017, 1, 1600028. [Google Scholar] [CrossRef]
  30. Kim, S.M.; Jung, S.; Kim, Y.; Kim, J. Anti-LID Process with a Remote Direct Heating Method Using a Half-Bridge Resonance Circuit for a PERC Solar Cell Module. Energies 2020, 13, 110. [Google Scholar] [CrossRef] [Green Version]
  31. Edwards, T.C.; Steer, M.B. Foundations for Microstrip Circuit Design; John Wiley & Sons: Hoboken, NJ, USA, 2016. [Google Scholar]
  32. Connors, K.A. Chemical Kinetics; VCH Publishers, Inc.: New York, NJ, USA, 2014. [Google Scholar]
  33. Espenson, J.H. Chemical Kinetics and Reaction Mechanisms, 2nd ed.; McGraw-Hill, Inc.: New York, NY, USA, 2014. [Google Scholar]
  34. Kim, S.M.; Chun, S.; Bae, S.; Park, S.; Kang, M.G.; Song, H.E.; Kang, Y.; Lee, H.S.; Kim, D. Light-induced degradation and metastable-state recovery with reaction kinetics modeling in boron-doped Czochralski silicon solar cells. Appl. Phys. Lett. 2014, 105, 083509. [Google Scholar] [CrossRef]
  35. Bothe, K.; Hezel, R.; Schmidt, J. Understanding and reducing the boron-oxygen-related performance degradation in Czochralski silicon solar cells. In Solid State Phenomena; Trans Tech Publications: Stafa-Zurich, Switzerland, 2004; Volume 95, pp. 223–228. [Google Scholar]
  36. Dubois, S.; Enjalbert, N.; Garandet, J. Slow down of the light-induced-degradation in compensated solar-grade multicrystalline silicon. Appl. Phys. Lett. 2008, 93, 103510. [Google Scholar] [CrossRef]
  37. Schmidt, J.; Bothe, K.; Hezel, R. Formation and annihilation of the metastable defect in boron-doped Czochralski silicon. In Proceedings of the Conference Record of the Twenty-Ninth IEEE Photovoltaic Specialists Conference, New Orleans, LA, USA, 19–24 May 2002; pp. 178–181. [Google Scholar]
  38. Glunz, S.; Schaffer, E.; Rein, S.; Bothe, K.; Schmidt, J. Analysis of the defect activation in Cz-silicon by temperature-dependent bias-induced degradation of solar cells. In Proceedings of the 3rd World Conference onPhotovoltaic Energy Conversion, Osaka, Japan, 11–18 May 2003; Volume 1, pp. 919–922. [Google Scholar]
  39. Palmer, D.W.; Bothe, K.; Schmidt, J. Kinetics of the electronically stimulated formation of a boron-oxygen complex in crystalline silicon. Phys. Rev. B 2007, 76, 035210. [Google Scholar] [CrossRef] [Green Version]
  40. Bothe, K.; Schmidt, J. Electronically activated boron-oxygen-related recombination centers in crystalline silicon. J. Appl. Phys. 2006, 99, 013701. [Google Scholar] [CrossRef]
Figure 1. Schematic diagram of remote heating apparatus for a p-PERC solar module for the treatment of LID.
Energies 14 06352 g001
Figure 2. Schematic illustration of a cross section of the p-PERC solar module remote heating apparatus.
Energies 14 06352 g002
Figure 3. Experimental procedure used to treat LID in a p-PERC solar module. CV: constant voltage.
Energies 14 06352 g003
Figure 4. Numerical calculation results with kinetics model on cyclic reaction: (a) total reaction on full state with log timescale, and (b) combination reaction on double state (A + C) with log timescale.
Energies 14 06352 g004
Figure 5. Thermal image of p-PERC solar module applied with remote heating technology using half-bridge resonance circuit.
Energies 14 06352 g005
Figure 6. Comparison between the real-time observation results of the LID process of the solar module and the kinetics simulation results of the cyclic reaction model: (a) linear scale time result and (b) log scale time result.
Energies 14 06352 g006
Figure 7. Kinetic constants in the LID process obtained from a kinetic simulation using a cyclic reaction model, and the activation energy calculated by linear regression.
Energies 14 06352 g007
Publisher’s Note: MDPI stays neutral with regard to jurisdictional claims in published maps and institutional affiliations.

