Abstract
The aim of this study is to highlight the need for sustainable urban development by reviewing the different Indicator Systems (SI) and contrasting them with those factors that have had a correlation in the spread of the virus in order to detect its deficiencies. This research carries out an urban diagnosis and analyzes the influence of these factors in order to detect deficiencies and propose a new IS adapted to current needs. Lastly, the new SI is validated through its practical application in one of the Autonomous Communities most affected by the pandemic in Spain. It is concluded that most of the factors causing a worse incidence of the virus are hardly evaluated by the existing IS. The practical analysis shows that there are deficiencies in urban design, resulting in poor environmental quality and urban morphology.
1. Introduction
The world is becoming increasingly urban and aging [1], and 68% of the world’s population is expected to live in cities by 2050 [2]. Sustainability focuses on meeting the needs of the present without compromising the ability of future generations to meet their needs [3]. These cities consume a large part of the world’s energy supply and are responsible for 70% of greenhouse gas emissions [4], but we know that promoting an alternative urban model aimed at reducing the use of resources could improve up to 50% efficiency globally [5]. Furthermore, this massive global urban grid’s expansion has increased exposure to infectious diseases such as COVID-19 and sets out new challenges to outbreak control [6].
This critical need to enhance urban sustainability is reflected in an increasing number of global, national, and local initiatives [7], such as the Sustainable Development Goals and their fulfillment by the year 2030 to which 193 countries were committed [8] or the Charter of European Cities toward Sustainability, known as the Aalborg Charter, in which the signatory cities would participate in the United Nations’ local Agenda 21 initiatives [9]. In Spain, this is the case of the Spanish Strategy for Urban and Local Sustainability (EESUL) [10], the Urban Ecology Agency of Barcelona [11], or the Spanish Network of Cities for Climate [12].
Furthermore, since the appearance of the Sustainable Development term [13], many efforts have been made to measure the level of sustainability of urban systems through indicators: systems that help achieve sustainability objectives and report on the current state of the environment, its weaknesses and strengths, as well as highlighting priority areas [14]. It was in Agenda 21 [15] when the creation of indicators that assess the level of sustainability in the world became a need [16]. This research of the urban context has focused on municipal strategies and policies, predominantly in North America and Europe, and local authorities that have faced many challenges in policy implementation [17]. However, despite all the efforts of many national and international organizations and governments, there has been no theoretical consensus on how to measure current well-being and sustainability in urban settings [18].
In addition, the health crisis that is being experienced today brings questions toward a new change [19]. Previous global pandemics have already transformed cities through architecture and urban planning [20,21]. Air pollutants, such as particulates, nitrogen dioxide, and carbon monoxide, have been shown to likely facilitate the longevity of virus particles under favorable climatic conditions [22]. The European Space Agency (ESA), thanks to the European Sentinel-5P satellite of the Copernicus program, published a series of images in which a reduction in the levels of dioxide is observed during the confinement period, which is one of the main pollutants emitted by vehicles and industry [23]. Focusing on Spain, it can be seen how the city of Granada, where World Heritage monuments such as La Alhambra are located, is the city with the highest emissions of Nitrogen Dioxide in Andalusia and one of the first in Spain behind Madrid, Barcelona, and Valencia. According to this and due to the relevance that the influence of history Granada has in the urban layout of our cities, Granada is the city chosen for the practical application of this study [24].
It is also worth highlighting the latest report presented by the Spanish Network for Sustainable Development (REDS) where all the indicators related to SDG11 “Sustainable cities and communities” in Andalusia were marked as negative [25]. In addition, in the midst of the health crisis, the Law to Promote the Sustainability of the Territory of Andalusia was approved on 20 April 2021, whose purpose is to regulate the planning of the territory and urban planning from the environmental framework in the Autonomous Community of Andalusia, assuming the 2015 Paris Agreement on Climate Change objectives [26].
Thus, given that COVID-19 has shown that many countries and cities have not been prepared for this great challenge [27,28], this research analyzes the main urban repercussions derived from this health crisis, as well as its relation, affection, and quantification in the current indicators of urban sustainability, identifying their deficiencies. The aim is to propose an optimal list of indicators appropriate to current urban needs, based on the evaluation of the main factors related to the spread of COVID-19 and the corresponding deficiencies detected in the different SIs, whose results leave a record of the lack of indicators that quantify the factors analyzed. Finally, the new system of indicators proposed will be validated through its application in a case study in Spain, in the city of Granada, as it was the most affected during the pandemic within the Autonomous Community of Andalusia [29], which has ranked third in affected and deceased by COVID-19 within the country [30]. The results show the need to create an evaluation tool for sustainable urban development through indicators in a standardized way.
2. Materials and Methods
To this end, the methodology is structured in 5 main sections represented in Figure 1.
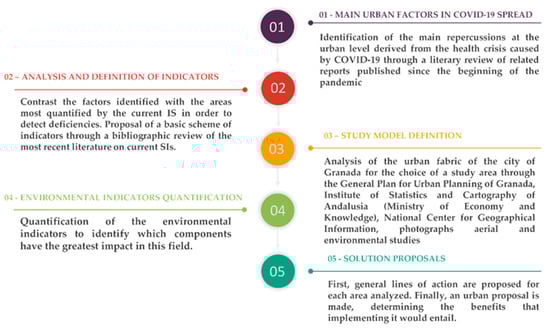
Figure 1.
Outline of research development.
In stage 1, an urban diagnosis is carried out by identifying the main factors that have been correlated with the spread of COVID-19 at the urban level. The aim will be to detect which aspects of each urban area analyzed (environmental, economic, social, political, urban, and demographic) have led to a greater spread of the virus, in order to detect the vulnerabilities of the cities when facing this and future pandemics and to be able to contrast the results with the sustainability indicators. The literature on the consequences of COVID-19 is also quite extensive: one study concludes that a good action strategy is needed to face the challenge posed by the pandemic [31]; Alfonso Viguria et al. reinforce the need to consider vulnerable sectors of the population when designing strategies to minimise the social impact of the pandemic [32]; another study reveals that high population density is an important factor in the spread of the virus [33]; the energy sector and investment activities have also been affected by the pandemic [34], as well as the economy and tourism [35]. Nevertheless, as explained above, in this study, we will focus on causal factors.
In stage 2, the factors identified are contrasted with the areas most quantified by the current IS in order to detect deficiencies; to this end, we will use the data obtained from the study carried out by Merino-Saum et al. [36], in which they carried out an analysis of the most frequent indicators in a sample of 67 IS: 2847 indicators in total. Once we detected the main deficiencies in current IS, we made a new basic scheme proposal that any IS should consider in order to respond to current urban needs, based on the most recent literature on current IS.
Finally, the proposed model is validated through its practical application in an urban area situated in the city of Granada, which is one of the hardest hit by the pandemic, as it has registered more than 1200 cases per day, which implies a fairly high incidence. In relation to the ISs, we have chosen to quantify the area most affected by this city: the environment, whose value in the report presented by the REDS, which evaluates the state of the different SDGs in 100 Spanish cities, is the worst score. For example, in O3 concentration, Granada has a value of 136, when the score in other cities is 76 in Girona, 9 in Oviedo, or 41 in Almeria as stated in the report. Granada, according to the ESA publication, is the city with the highest nitrogen dioxide emissions in Andalusia and one of the highest in Spain after Madrid, Barcelona, and Valencia, the main cause being road traffic [37,38].
In stage 3, an urban region of the city of Granada is defined through the study of the urban grid of the city for its analysis and application of the proposed indicators. The data will be obtained mainly from information obtained from the General Urban Development Plan of Granada, the Institute of Statistics and Cartography of Andalusia (Ministry of Economy and Knowledge), the National Centre for Geographic Information, aerial photographs, and environmental studies. The criterion for defining an urban region is that it should cover as many areas as possible that are considered or can be considered, with some intervention, as a sustainable urban region. For this purpose, the values of the indicators for which an urban region is considered sustainable will be taken into account. The choice will be justified on the basis of the data extracted on location, building uses, construction typologies, number of floors, construction period, and road analysis. Once the study sample has been chosen, it will be defined by means of its physical–spatial components.
In stage 4, once the urban body has been defined, environmental indicators are applied to identify which components have the greatest impact on this sphere.
Once the vulnerabilities of the defined urban region have been detected, in stage 5, eco-efficient proposals are made to mitigate the negative results obtained in the previous stage, by means of general action proposals for each area analyzed, which are obtained from the prior reflection and analysis of the different indicator systems, determining the benefits that their implementation will provide.
The development of the proposed methodology is as follows:
2.1. Stage 1. Main Urban Factors in the Spread of COVID-19
It has been shown through analysis of multifactorial interrelationships in COVID-19 spreading that housing quality, living conditions, race, and occupation were strongly correlated with COVID-19 death counts [39], as well as other factors such as temperature, air quality, and GDP per capita. Another research study highlights the major lessons that can be learned for post-COVID urban planning and design: (1) environmental quality, (2) socio-economic impacts, (3) management and governance, and (4) transportation and urban design [40].
In this stage, environmental, economic, social, political, urban, and demographic factors are analyzed, and their relationship with the spread of COVID-19 is determined in order to detect deficiencies in cities and propose a new IS adapted to current needs.
Figure 2 shows, in a cluster network, the urban factors that have contributed the most to the spread of the virus based on the literature review that will be explained in Section 2.1.1, Section 2.1.2, Section 2.1.3, Section 2.1.4, Section 2.1.5 and Section 2.1.6.

Figure 2.
Cluster network of COVID-19 spread factors.
2.1.1. Environmental Factors
Poor air quality has been associated with a higher death rate from COVID-19, with fine particulate matter being associated with an increase of 8% in the United States and up to 21.4% in the Netherlands [41]. A study in Bangkok has concluded that particulate pollutants have a negative association with daily confirmed cases of COVID-19 [42]. In addition, low wind speed means higher numbers of cases and deaths [43]. Another study with sampling data from 160 countries also confirms that the level of contaminants, as well as the loss of biodiversity, significantly affects the number of infections [44]. In addition, contaminants tend to concentrate in greater proportion in the courtyards of homes and buildings, reaching up to 80% in static air conditions, increasing the chances of contagion [45].
2.1.2. Economic Factors
In today’s society, economic factors should not be underestimated. In the study carried out by Ahmed, J. et al. it has been shown that higher levels of development favor the spread of the virus, as people living in countries with a higher GDP tend to travel and attend more social events, paving the way for a quicker spread of the virus [46].
Approximately 80% of global GDP is represented by urban economies [47], which, due to containment measures to curb the expansion of COVID-19, have had drastic economic repercussions, with an estimated 14% drop in hours worked in all countries compared to the same period in 2019, corresponding to a loss of 400 million full-time jobs [48]. On the other hand, countries whose economies are heavily dependent on tourism have been more affected economically, such as Mexico, Spain, and Italy [49].
2.1.3. Social Factors
On the other hand, the social characteristics of the population are another factor to take into account since the most vulnerable groups have been particularly affected due to circumstances such as the area of the city where they live, where they work, or gender and age factors [50]. Urban areas with a high rate of crime or violence could make it difficult to control COVID-19 [51] as well as a deficiency of infrastructure and housing [52] because of insufficient resources. In addition, where access to health care as well as basic services is limited, it makes response measures even more difficult [53].
It has also been shown that there is a strong association between income and total population and COVID-19 cases/deaths [54,55].
However, 24% of the world’s urban population lives in slum areas and informal settlements, worsening the effects of the pandemic [56].
In some cases, access to new technologies has been the ideal ally for achieving employment and academic occupations [57], but it has also revealed the digital divide and inequality between countries. It is estimated that around 75% of the world’s population does not have access to the Internet [58].
2.1.4. Political Factors
COVID-19 has shown the relevance of the management carried out by the political authorities in response to the economic, social, and health crisis that has arisen. In the not too distant future, it is rational to envisage a structuring hypothesis of a new post-pandemic world order gaining momentum [59].
A study conducted in 3100 U.S. counties concludes that political preferences influenced the association between governors’ COVID-19 communications and citizens’ mobility patterns [60]. Two other studies also conducted in the USA, through an analysis of incidence, deaths, testing, and positivity where rates are compared with governing party affiliation, also conclude that governing party affiliation may drive policy decisions affecting COVID-19 infections and deaths [61,62]. In addition, weak local policy exacerbates the effects of the pandemic at all levels [63].
2.1.5. Urban Factors
A study carried out in Hong Kong has concluded that urban geometry has a direct impact on the effect of COVID-19, with building height and density, low sky view index, and smaller roads being the main aspects related to the worst impact. [64]. Another study conducted in Brazil, which analyzed the correlation between the incidence of COVID-19 and several urban indices, found that those municipalities with a higher density of green areas had a lower incidence of the virus [65]. Another study conducted in China reveals that distance to the epicenter is a strong influencing factor and is negatively linked to the spread of COVID-19, in addition to subways, sewage, and residential garbage [66]. It has also been shown how urban areas with low-quality housing are associated with a higher COVID-19 death count, even after adjusting for individual risk factors [67]. Urban organization favors a typology of multifunctional neighborhoods that function as small independent units, thus reducing medium- and long-distance commuting [68].
On the other hand, digitization, teleworking, and the provision of essential services by virtual means is being accelerated by the pandemic, so the future of infrastructure and buildings in cities could be altered, as the demand for office space could decrease or vary in typology [69].
2.1.6. Demographic Factors
Over the last 40 years, there has been a demographic change which consequences would have been much less devastating if birth rates had not fallen so sharply [70]. Figure 3 shows the evolution of the population in Spain for the years 1976, 2020, and 2065, showing the change from a progressive to a regressive situation.
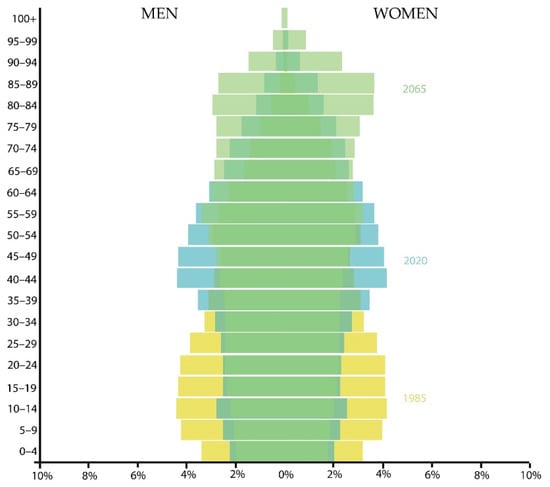
Figure 3.
Evolution of the Spanish population pyramid. Source: Own elaboration based on data obtained from populationpyramid.net.
If the 1976 rates had been maintained in Spain, today, the number of people under 43 years of age would be 20 million more, the country would be more powerful in the international framework and with a much higher GDP. Thus, according to the study carried out by Macarrón LarumBe, A. et al., the COVID-19 pandemic would have caused considerably less damage.
On the one hand, in recent decades, the increase in life expectancy has raised the demand for the residential market for the elderly [71]; however, and despite the number of deaths, studies show that the number of deaths will be ‘‘almost imperceptible’’ in the demographic pyramid, as an isolated year is very rarely significant [72]. In relation to the birth rate, with uncertainty and fear of the future predominating, the birth rate is expected to plummet.
This shows that the current residential stock does not meet the current needs of the population, as shown in Figure 4.
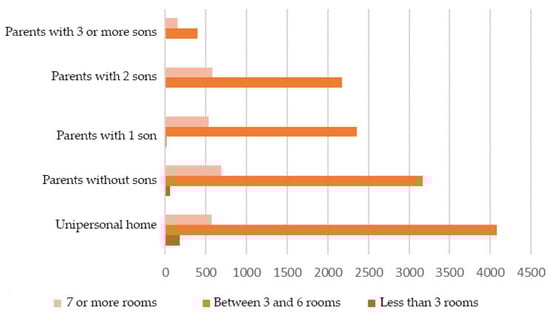
Figure 4.
Number of households in Spain by type of household and number of rooms in the dwelling (2020). Source: Own elaboration based on data obtained from the National Statistics Institute (INE) [73].
Figure 3 shows the relationship between the number of people in the family unit and the dwellings according to the number of rooms. It can be seen that the residential stock does not correspond to demand, as there is a predominance of dwellings with a large number of rooms compared to those with fewer. Moreover, it has been shown that there is a relationship between the dynamics of demographic change and the demand for housing and offer of residential land [74]. In addition, Figure 2 shows how the population pyramid tends to become increasingly regressive, so that these problems will become more acute.
2.2. Stage 2. Analysis and Definition of Indicators
Once the urban factors that have contributed negatively to the impact of COVID-19 have been analyzed and identified in the previous stage, these are contrasted with the most common indicators of the different current IS in order to detect their deficiencies. To this end, we have based our figures on the study conducted by Merino-Saum et al., as it is considered to be a reliable and contrasted source, as well as the most recent and complete study in which an analysis of the most frequent indicators in a sample of 67 IS, 2847 indicators, was carried out.
As result, Figure 5 represents what percentage of relevant factors in the expansion of COVID-19 identified in stage 1 are taken into account by the current indicator systems. The factors that appear in more than 10 sets are the ones represented as shown in the study by Merino-Saum et al.
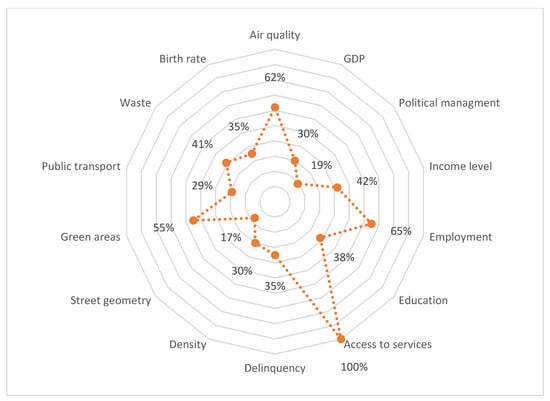
Figure 5.
Level of quantification of the different indicator systems on the areas most affected by COVID-19 at the global level. Source: Own elaboration.
Most urban factors that have been correlated with the impact of COVID-19 are less than 50% assessed by IS. Access to services, employment, air quality, and green areas are the most quantified factors, while air speed, temperature, level of development, housing quality, and population pyramid are the least quantified factors.
These results show the need to develop a tool for the evaluation of sustainable urban development through a standardized system of indicators. It has been proven that without an instrument that monitors and quantifies the different areas that make up an urban organization, most of these areas are neglected, resulting in a poorer environmental and quality of life, which is a fact that has been manifested in a worse incidence of COVID-19.
Therefore, a list of basic indicators for assessing the sustainability of an urban organization is proposed. To this end, an analysis of diverse IS studies has been carried out, in addition to the analysis already done, starting in 2015, as many of the precedents have been included in the latter. Table 1 shows the references on IS analyzed and details the objective, methodology, and conclusions/results of each of them.

Table 1.
References on IS.
Mercader-Moyano et al. develop a new methodology of indices that allow us to see through different indices the main deficiencies and weaknesses on which to act both in buildings and urban areas, for a more sustainable and efficient management [75]. Merino-Saum et al. carried out a study in which they analyzed 69 IS (2847 indicators) to determine which areas are the most quantified. Fautorehchi et al. proposed a sustainable evaluation framework for residential buildings from a social point of view [76]. López Chao et al. analyzed 32 systems of indicators and developed a structure applicable to any urban organism to measure its sustainability [77]. López-Mesa et al. developed a set of indicators for the assessment of residential buildings in need of retrofitting for sustainability and energy efficiency improvement [78]. Verma et al. concluded that data availability, target, and a conceptual framework are necessary as preliminary considerations for indicator-based urban sustainability assessment [79]. Cohen et al. conducted a study that concludes that a more integrative approach should be employed in which basic sustainability principles guide a target-based framework [80]. Huang et al. concluded that while there appears to be no lack of IS, their applications have suffered from both technical and conceptual inconsistencies. To move forward with the assessment of urban sustainability using IS, they suggest using a theme-based framework, being clear about the type of sustainability to be measured, including leading and lagging indicators and following rigorous standardization procedures, as well as adopting a multi-scale strategy to consider the hierarchical links between local cities and urban regions. Dizdaroglu as well as Braulio-Gonzalo et al. also proposed a system of indicators for the sustainability of micro-urbanism and for the Spanish context, respectively [81,82].
This analysis, along with the one carried out for this research, has led us to elaborate a new system of indicators. This new list of indicators is shown in Figure 6. They are divided into different areas: politics; economy; society; urban planning; and environment. In blue, the new indicators that were hardly evaluated by the current IS and which are considered relevant from the analysis are shown. The quantification of each of these indicators will have to be adapted to the urban scale on which they are applied as well as the data and means available for their application due to the need for individualization of each case, whether due to changes in geographical, meteorological, social, etc. conditions. This has been observed in the analysis of the different indicator systems, as there are no rigid or immovable criteria, but they are, after all, part of a process to reach the same goal: to promote a sustainable urban environment.

Figure 6.
Proposed indicators. Own elaboration.
2.3. Stage 3. Definition of the Study Model: Urban Organism
To validate the new system of indicators and its quantification, an urban area is delimited in which it is to be applied. First, an analysis of the urban fabric of the city of Granada is carried out with the aim of finding out the current reality of the urban layout, identifying which area of the city is most interesting when it comes to drawing up a proposal for eco-efficient regeneration.
The criteria for defining an urban organism are that it encompasses the greatest number of areas that are considered or can be considered, with some intervention, as a sustainable urban organism, such as density, proximity to services, accessibility to green areas, state of the building, or social inclusion, all of which will be taken into account.
Granada has an area of 972.6 km2 and a population of 232,208 inhabitants (INE, 2018); the city is divided into eight districts (Figure 7): Centro, Albayzin, Beiro, Norte, Chana, Ronda, Genil, and Zaidin. Granada’s urban development process has followed an expansive model based on semi-circular concentric strips, with successive changes in the orientation of its growth.

Figure 7.
Districts of the city of Granada. Source: Own elaboration.
The density of dwellings per hectare and the good condition of the buildings have been analyzed based on the data collected by the National Institute of Statistics, as represented in the Atlas de la Edificación (Ministry of Development) [83].
The Sustainable Mobility Plan of Granada has also been taken into account, which has developed a new functional urban planning model, reaffirming the existing urban structure set out in the PGOU and conserving its basic elements, but in pursuit of a city model where general mobility does not depend on the private car and where all public facilities and spaces are accessible to all inhabitants.
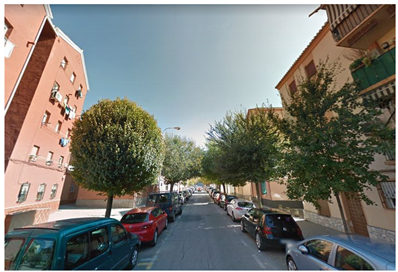
Thus, the urban organism chosen as representative is the Fontiveros neighborhood, which is located in the Zaidín district. It is a pericentric neighborhood, which is fundamental as a link between the center and the south of the city, as well as between the west and the southeast of the city (Figure 8).
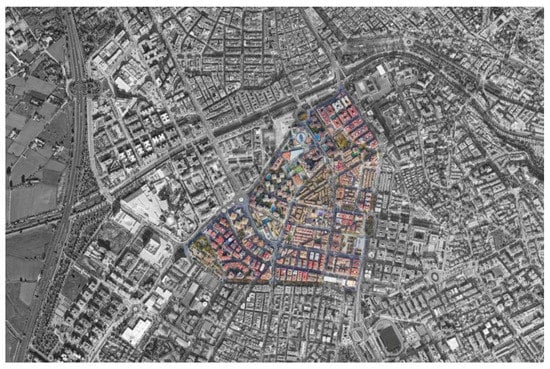
Figure 8.
Location of Fontiveros neighborhood. Own elaboration from orthophoto.
It is worth noting that its urban centrality is combined with a local character and the existence of quieter residential areas with several schools and some squares and corners for the socialization of the neighborhood and children’s play.
The predominant use is residential, although there are also commercial and public service buildings, which is a factor that favors the mix of uses (Figure 9).

Figure 9.
Building uses, Own elaboration based on data obtained from the General Urban Development Plan of Granada (PGOU).
In this neighborhood, we find the group of social housing Comandante Baldés, which corresponds to the oldest buildings: 1950–1969 (Figure 10), originally built on the outskirts of the city and today almost centrally located and surrounded by newer buildings.
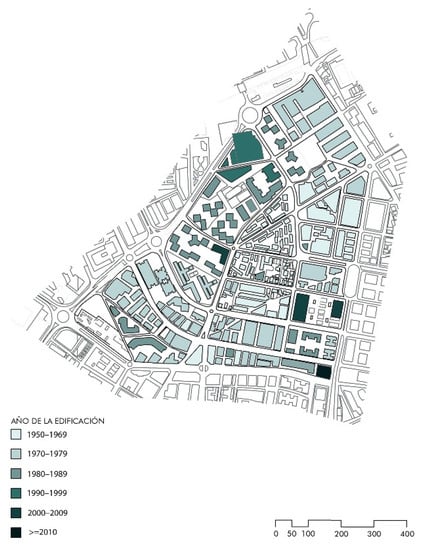
Figure 10.
Year of construction. Own elaboration based on data obtained from the General Urban Development Plan of Granada (PGOU).
The largest number of dwellings is concentrated in newer buildings, as well as those built earlier, with a smaller number of dwellings, as the city expansion into the Vega area had not yet been necessary.
The high density of the neighborhood favors an active life in its streets, as well as having an intense commercial activity, some of them becoming real commercial axes: Avenidas Poeta Manuel de Góngora, Don Bosco, and Andrés Segovia.
The number of stories above ground level is related to the age of the buildings and the number of dwellings in them, so that older buildings have a lower number of stories above ground level and, consequently, a lower number of dwellings.
As it is a pericentric neighborhood that is fundamental as a link between the center and the south of the city, as well as between the west and the southeast of the city, through traffic is one of the main problems that this neighborhood represents due to its location and its accessibility close to the A-4 motorway.
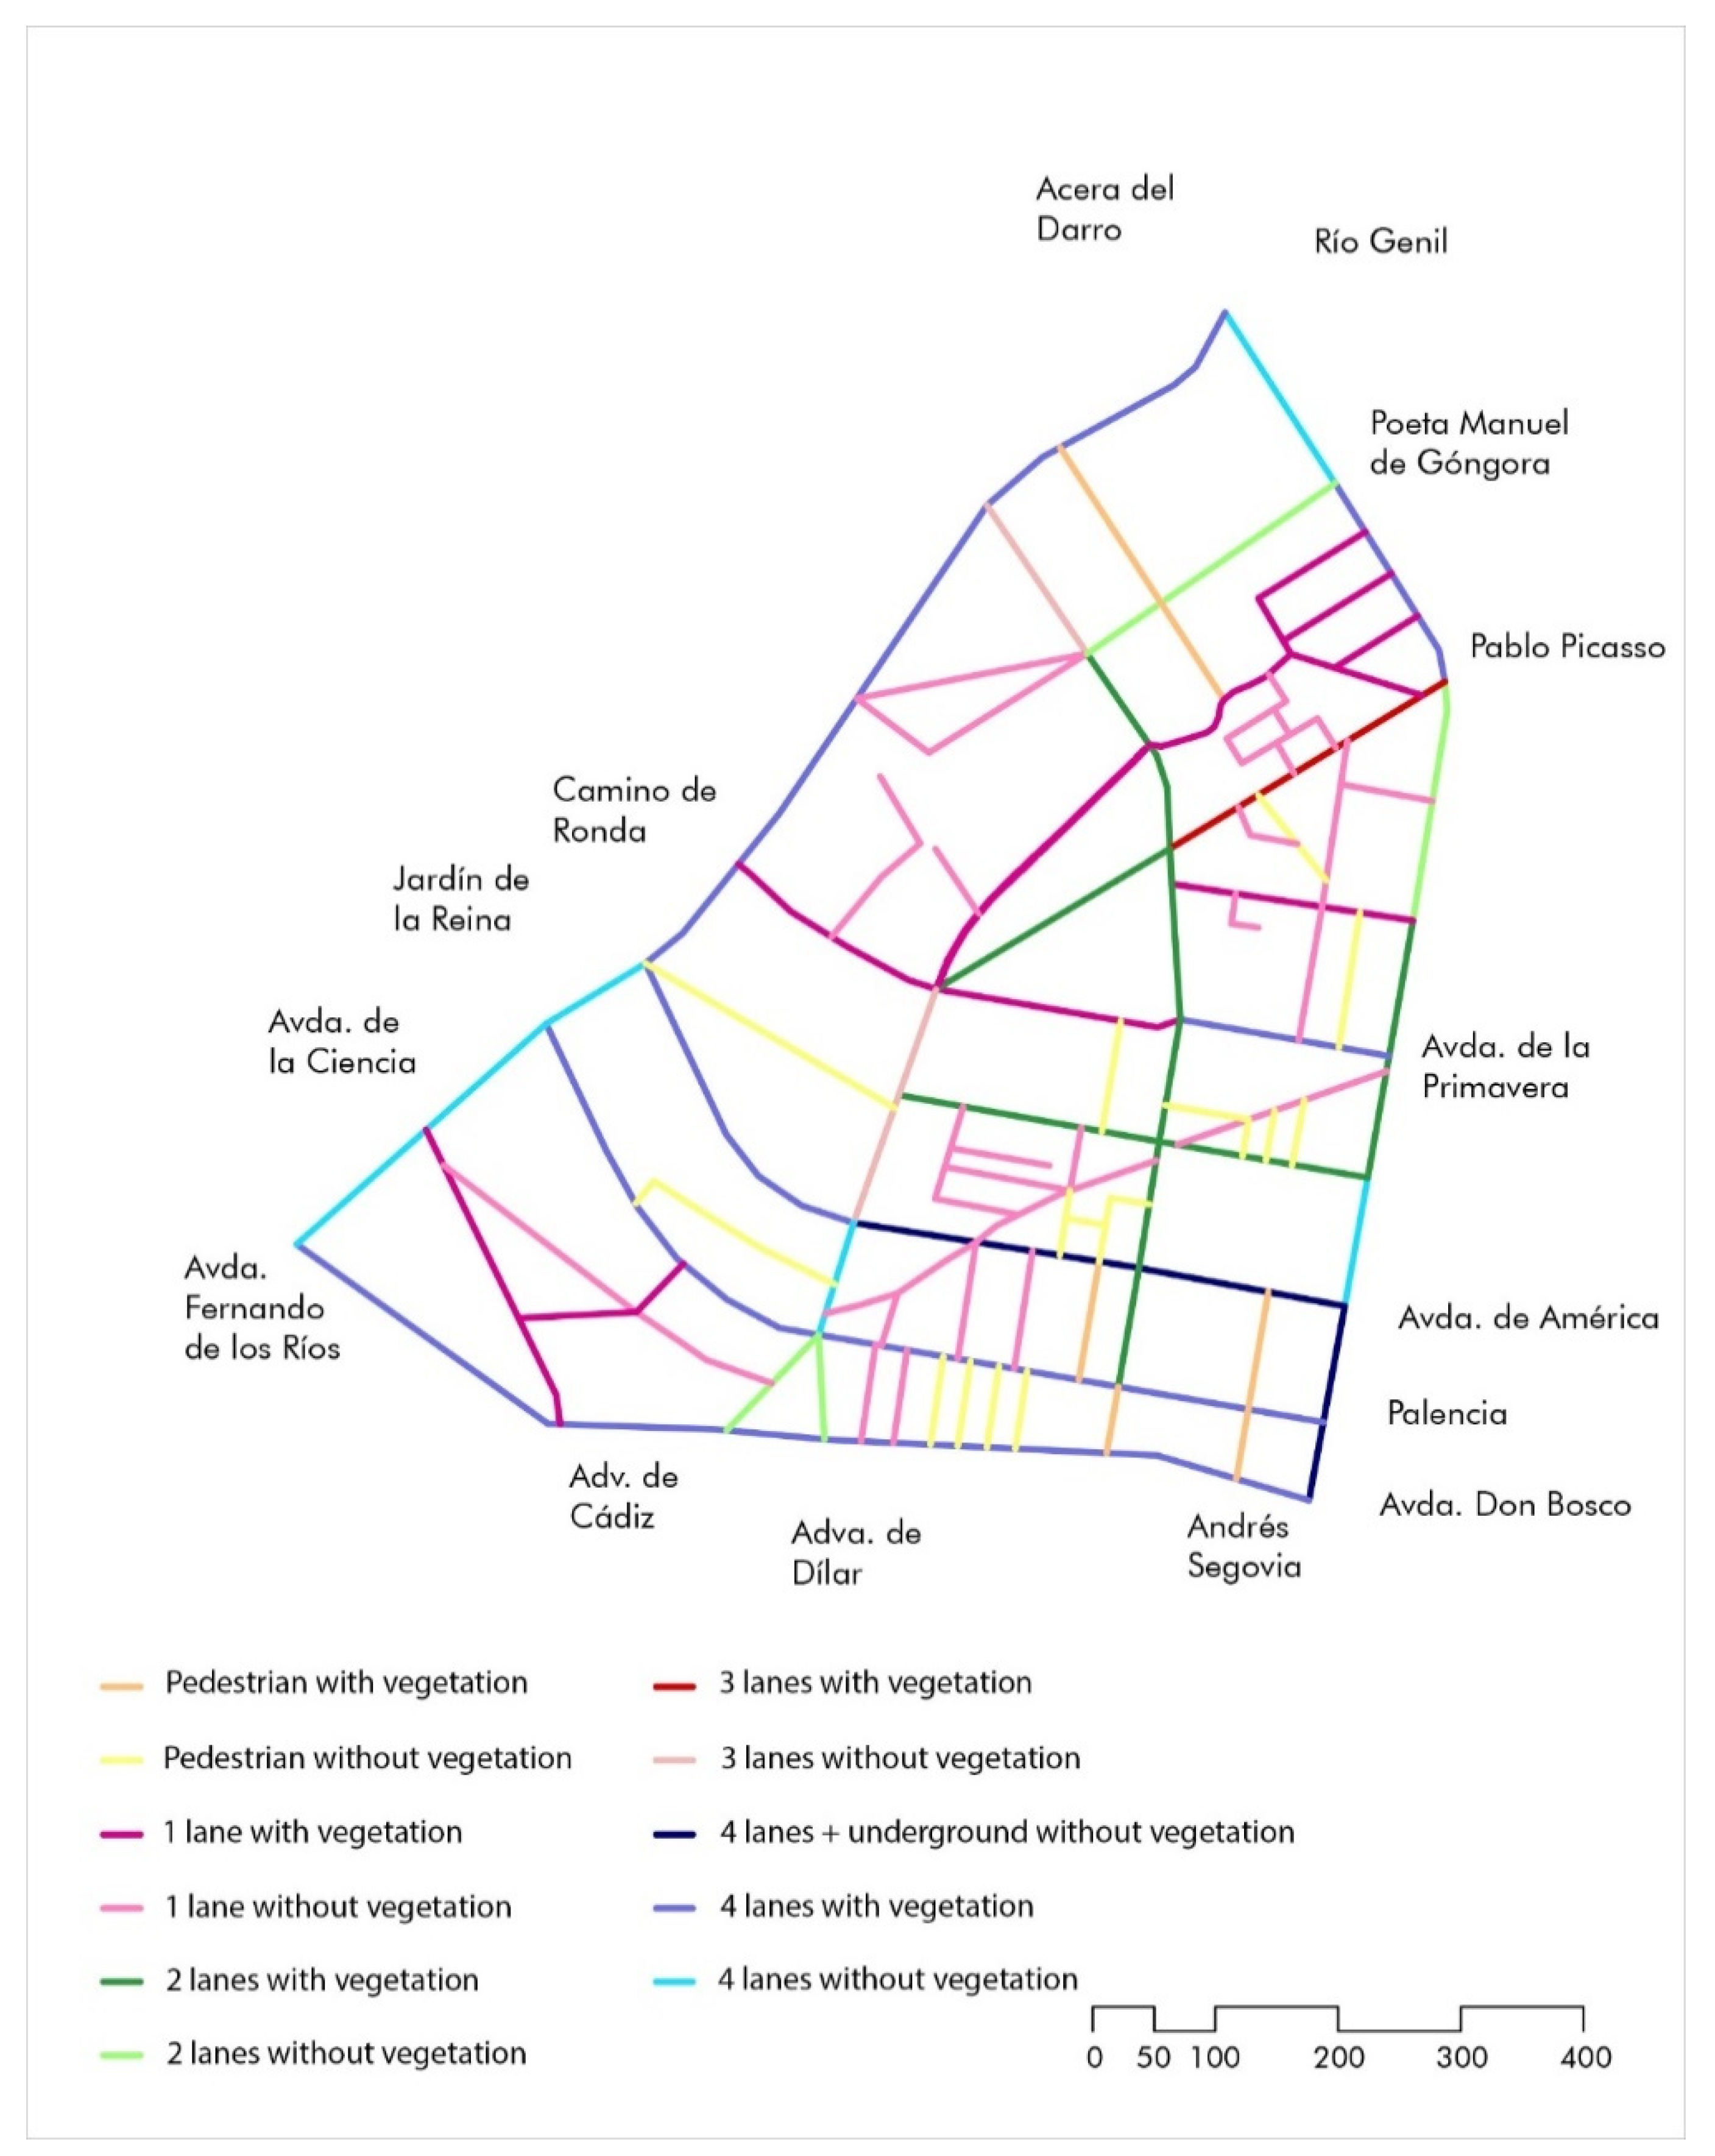
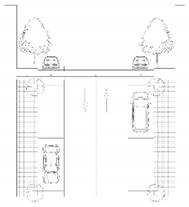
The predominant form of road is two-way lanes with parking on both sides, most of them with little or no vegetation. On the other hand, there are public transport stops on almost all the main roads. Pedestrian streets are scarce and of little interest as they have arisen from the residual space generated between some plots in the same block (Figure 11).
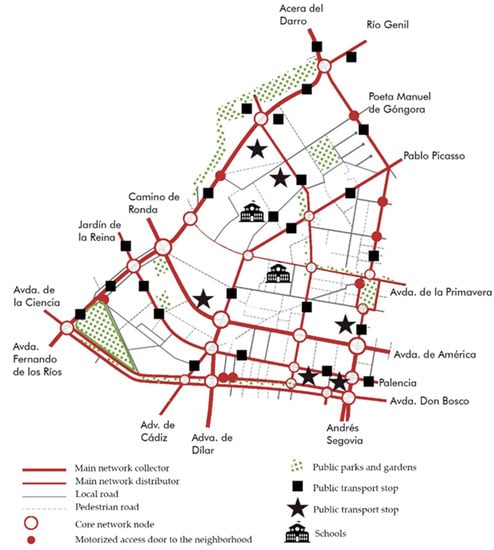
Figure 11.
Circulation, centralities, and public space. Own elaboration based on data obtained from the Granada Sustainable Urban Mobility Plan.
2.4. Stage 4. Quantification of the Environmental Impact
2.4.1. Indicators’ Selection
We determined which is the indicator with the greatest impact in the city of Granada. It is verified that environmental quality is the one that provides the worst data, as shown in the first section of this study, as well as being a visible air pollution due to the haze generated. It was demonstrated in stage 1 that it is one of the factors that negatively affects the incidence of COVID-19, so we will evaluate the environmental impact of the Fontiveros neighborhood by quantifying the indicators that evaluate air quality, thermal comfort, biodiversity, and urban habitability, as these indicators are directly related to poor environmental quality in Granada. With the quantification of these indicators, it will be determined which aspects are deficient in the urban design in order to, later on, elaborate the proposal for its improvement. These indicators are reflected in Table 2 and Table 3.
Table 2.
Indicators for environmental quality assessment. Source: Own elaboration.
Table 3.
Indicators for assessing urban livability and biodiversity. Source: Own elaboration.
An excess of particulate pollutants in the air is a very serious environmental risk today and is directly related to health and biodiversity problems. The origin of these particles can come from a wide variety of sources such as vehicles, industrial activities, residential buildings, but also from phenomena such as abrasion and the erosion of roads. Thus, the indicators that evaluate air quality focus on measuring the different atmospheric pollutants, and they must not exceed the quality standards established by law in order to preserve health.
Thermal comfort in urban areas represents the number of hours of comfort per day with respect to the useful hours of occupation of the public space, which are considered between 8:00 and 22:00 h. The thermal comfort indicator evaluates both the level of comfort and the percentage of useful hours under this comfort to obtain a favorable assessment.
Table 3 shows the indicators selected for the assessment of urban habitability and biodiversity. Mainly, three aspects are evaluated: amount of trees, hybrid road space, and proximity to these two aspects.
Urban tree planting is intended to compensate for the built-up area while respecting the biophysical matrix of the territory, as well as improving the thermal comfort of the road and constituting an attraction value of the public space. This indicator evaluates the suitable tree-covered area based on the conditions of the defined urban fabric. The second indicator will evaluate the proximity of the population to these areas, since it is of no use for a city to have favorable percentages of green areas and various travel options if these are concentrated in only one area of the city and a large part of the inhabitants do not have close access to any of these areas.
Finally, the importance of achieving hybrid public space is vital. Today, most cities are made up of city blocks surrounded on all sides by streets where the private car is the protagonist. Freeing the road from the almost exclusive use of private vehicles will provide a new space for coexistence, leisure, exercise, socializing, and other multiple uses. This indicator will measure the percentage of road space for pedestrians, bicycles, and public transport, establishing optimal parameters.
2.4.2. Quantification
Through the application of the defined indicators, we proceed to quantify the environmental impact in the field of environmental quality, habitability, and biodiversity of the urban organism. To achieve this objective, each indicator is subdivided into two sections: the one that provides data on the calculation parameters and the one on the evaluation to be achieved, according to Table 4, in order to finally interpret the results obtained.
Table 4.
Model table for the specification of the indicator. Own elaboration.
Each table specifies the indicator number and name, the calculation and evaluation parameters, and other specifications such as the area where it applies, the calculation unit, and the periodicity.
Environmental Quality Impact Quantification
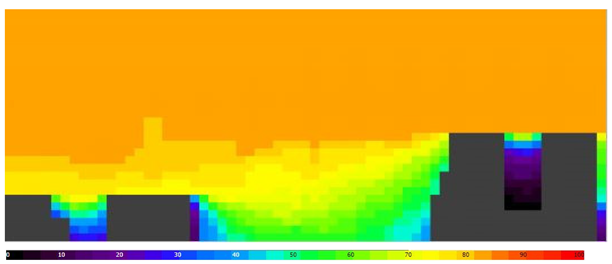
For the quantification of air quality, the data collected by the measurement station located at the Palacio de Congresos, Granada [84] were analyzed. For thermal comfort, the radiation obstruction of trees on public roads has been quantified, as well as an analysis of the average annual solar radiation received with the Huellasolar urban sunshine and radiation web viewer [85]. Firstly, the road typologies have been classified according to the configuration and presence of vegetation; secondly, a representative road has been chosen for each typology of street (roads with no vegetation are evaluated as unfavorable); for each of these roads, a separate sheet has been prepared presenting their characteristics: number of roads, road width, distance between trees, size of trees, and built density. A cross-sectional profile of the average annual solar radiation received is also included in these files. On the other hand, the web tool goolzoom [86] also provides heat maps, being able to determine the areas that contribute the most.
Appendix A of this article shows the quantification tables for each of the indicators analyzed. Regarding air quality, almost 30% is the percentage that represents the days for which in 2019 the values were close to the limit or very close; 20% have been close to the limit or very close so far in 2020. A diagnosis of air quality in the metropolitan area of Granada points to road traffic as the main cause of the city’s poor air quality. In terms of thermal comfort, 80% of the roads were found to be unfavorable, as they did not have the conditions considered optimal in terms of trees, building density, orientation, and sunlight.
Urban Habitability and Biodiversity Quantification
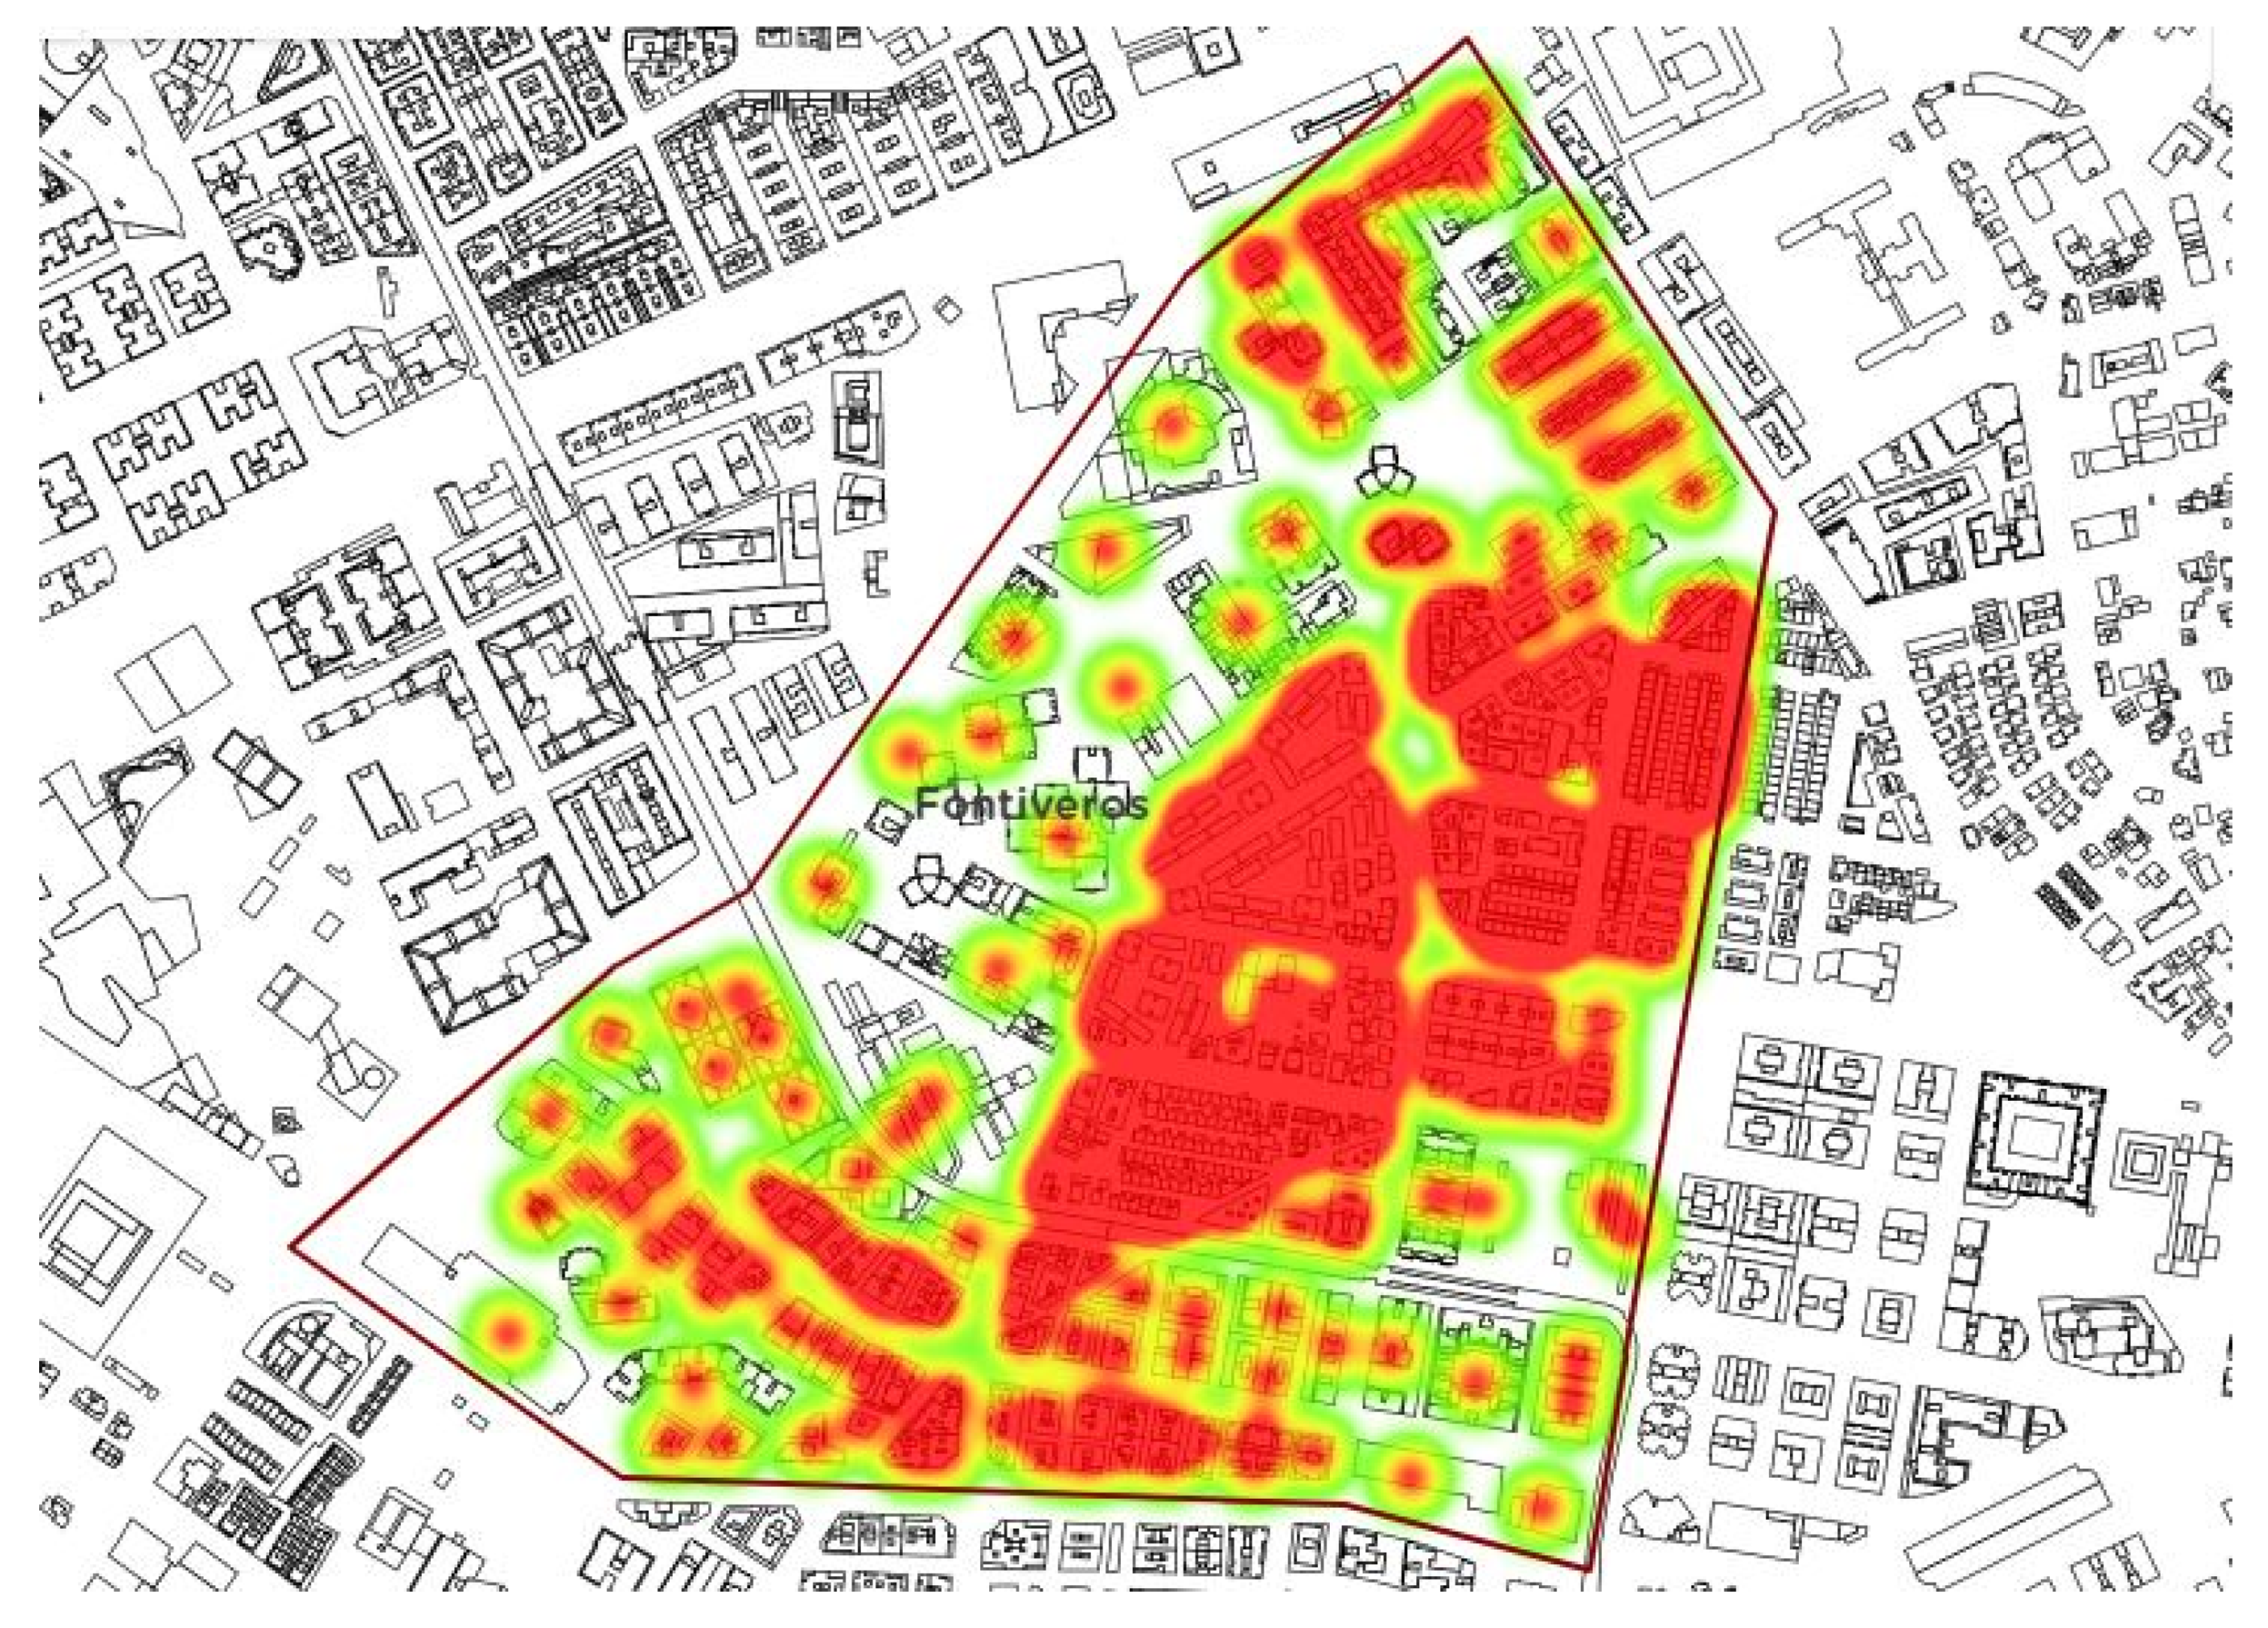
In order to quantify the number of trees in public spaces, the roads and public spaces with trees and their quantity are identified. The total area occupied is determined in order to finally quantify and evaluate the results obtained. The optimum quantity and type of urban trees will depend on the climatic and morphological conditions of the urban environment where they are to be applied. Regarding the proximity of the population to green areas, the different typologies of green spaces are identified in the urban nucleus of Granada, where a circle of the diameter of the optimum distance will be inscribed and the incidence on the study model will be analyzed. In order to determine whether the distribution of public roads is optimal, based on the classification of the different types of roads prepared for the quantification of the thermal comfort indicator, we proceed in this section to calculate the linear meters of each type of road according to the number of lanes it has. For pedestrian roads, the average width of each street will be calculated (it is usually quite similar in most of them), and once these two data have been obtained, the percentage allocated to each type of road will be calculated.
Appendix A of this article shows the quantification tables for each of the indicators analyzed. Regarding the provision of trees in public spaces, there is a notable deficiency of trees in the urban grid, as many of the roads do not have any vegetation, and those that do have insufficient vegetation.
After measuring proximity to green spaces, the indicator shows that there is only one green space in the urban area between 1000 and 5000 m2 that can be accessed on a daily basis, limiting the population benefiting from green spaces of this type and, therefore, having to travel a greater distance to enjoy a green space. On the other hand, there are green spaces that can be accessed either on foot up to 750 m, such as Plaza Concordia, or by bicycle up to 2 km, such as Parque Tico Medina. Finally, with a total area of 486 hectares, we find the peri-urban park of Dehesa del Generafile, although public transport travels more than 4 km, which is the optimum limit.
Finally, with respect to the distribution of public roads, more than half of the public space is devoted to the use of private vehicles, which is far below the requirement that pedestrian roads should represent at least 75% of the total.
2.5. Stage 5. Proposing Eco-Efficient Solutions
Sustainability indicators, in addition to allowing us to quantify the impact on some of the different urban areas, in this case, environmental quality, habitability, and biodiversity, serve to establish changes and new lines of action to improve the results obtained in the case in which these have been negative. The results obtained after applying quantification allow decisions to be taken much more accurately, as real data are available.
In this last stage, a series of guidelines and eco-efficient solutions are proposed at the level of urban rehabilitation based on the components with the greatest environmental impact related to the spread of infectious diseases such as COVID-19 on the analyzed urban organism defined in the previous phase: environmental quality, habitability, and urban biodiversity. In this way, the urban organism being analyzed will be one step closer to being considered a sustainable and healthy neighborhood.
2.5.1. Lines of Action for Implementation in the Urban Organism Analyzed
The lines of action are conceived as strategies for orienting and organizing different areas related to a sphere of action toward an end, in our case, that of achieving sustainable and healthy urban planning in environmental quality, in such a way that integration, articulation, and continuity toward the objective can be guaranteed in an orderly, coherent, and systematic manner.
A sphere of action shall have different lines of action toward the same end. These lines of action must, as a minimum, respond to the results obtained in the quantification when these have been negative, the purpose of which will be to improve these results with the application of the lines of action proposed. These may be extended as much as the depth to be reached through the addition of new detailed lines of action, although always maintaining the minimum explained above.
In this study, we have focused on the quantification of the environmental impact from the atmospheric point of view and on the analysis of habitability and quality of public space taking into account the spread of infectious diseases. The different lines of action proposed in each of these areas are set out in Table 5.
Table 5.
Lines of action for improvement to be applied in the urban organism analyzed. Source: own elaboration.
2.5.2. Intervention Proposal
The intervention proposal will tackle the lines of action defined in the previous section. Following the analysis of the urban grid of the city of Granada and, specifically, of the Fontiveros neighborhood carried out in stage 3, it has been confirmed that the predominant mobility system is the private vehicle, which runs along an inefficient road structure given the complex hierarchy that has been adopted to the present day (Figure 12).
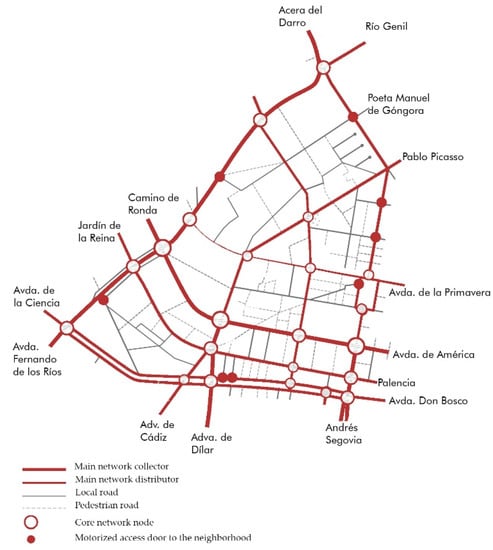
Figure 12.
Current road hierarchy of the urban organism. Own elaboration.
This work has already shown the need to establish a new urban mobility plan that is more efficient and gives priority to pedestrians, freeing the streets of vehicles and increasing the number of urban trees to favor habitability and an environmental improvement of the surroundings.
The proposal for the new road hierarchy is based on the principles of superblocks, as it is a model focused on urban sustainability and has proved successful in the case of Poblenou, Barcelona, with the disadvantage of intervening in an existing urban organism in which the road hierarchy is completely irregular and with important circulation nodes that serve a larger scale.
The new road hierarchy follows the considerations regulated in the Granada Sustainable Mobility Plan, although it should be noted that the roads marked with maximum speeds of 20 km/h and 10 km/h are those corresponding to what would be the inner cell of a superblock, having to establish two different speeds due to the strong previous conditioning factors, but with a pedestrian road material treatment (Figure 13).
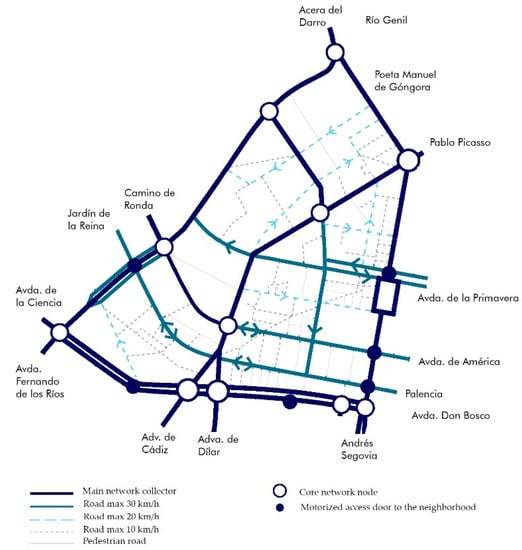
Figure 13.
Proposed road hierarchy of the urban organism. Own elaboration.
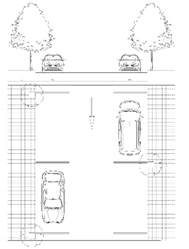
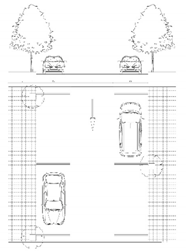
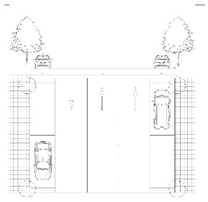
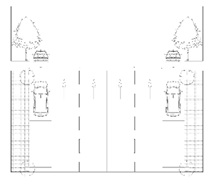
Similarly, those roads destined for road traffic will also be rehabilitated with the incorporation of new trees and cycle lanes according to the needs of each road based on its characteristics and layout (Figure 14).
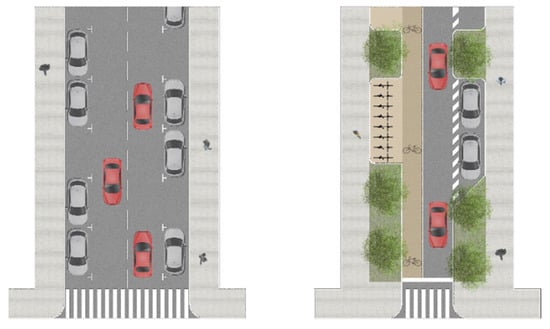
Figure 14.
Example of intervention on a sample road. Own elaboration.
New urban trees will be established on the basis of the criteria addressed in their quantification: the orientation and characteristics of the road and the density of the building they serve.
Thus, the lower density roads, with a wider roadway and N–S orientation, will be those with the highest density of vegetation, with deciduous species of medium or tall growth.
On the other hand, roads with a higher density, a smaller roadway, and an E–W orientation will be those that do not require a high tree height, and the distance between trees can be increased.
Three existing squares will also be rehabilitated for greener spaces, as their permeable surface does not represent the minimum of 50% to be considered green areas and vegetation is scarce.
In addition, two other spaces, currently residual, will be created as green areas next to the current fire station and on the esplanades that are left free at the junction between the streets Camino de la Zubia and Av. de Dilar, directly affecting the workers’ houses, improving their condition (Figure 15).
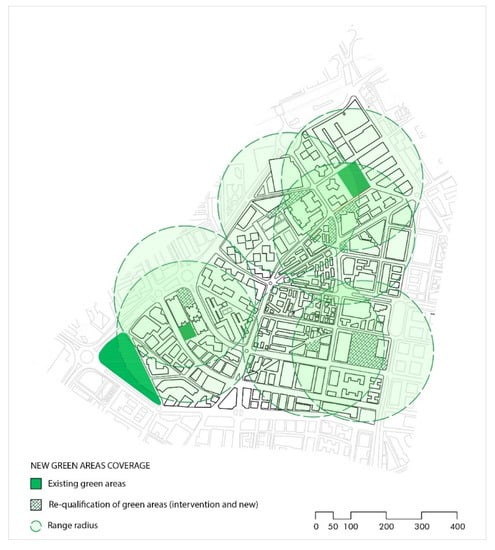
Figure 15.
Provision of new green spaces. Own elaboration.
The bend in the street Plaza de Enrique Iniesta will be corrected to improve the flow of traffic and create a green space by joining the new one between the streets Camino de la Zubia and Av. de Dilar with the existing Plaza Concordia.
3. Results
It is known that in Granada, one of the main causes of poor air quality is road traffic. Moreover, the quantification of the environmental quality of the Fontiveros neighborhood has been negative. With the reorganisation of public transport in 2015, it was already possible to reduce carbon emissions by 37% and PM10 particles by 33% [87], and it has been proven that poor air quality is associated with a higher death rate from COVID-19, so implementing the measures proposed in this study could further reduce the emission of pollutants: the average CO2 emissions produced by diesel and petrol consumption could be reduced by up to 74.18% with the application of the proposed new road hierarchy [88], improving environmental quality and hindering the spread of infectious diseases.
On the other hand, a report concludes that it is more advisable to apply a set of measures to achieve real improvements in air quality [89], which is why this study has covered areas that go beyond road traffic. After quantifying thermal comfort by evaluating the incidence of radiation on the different types of roads, it was found that 88% of the roads in the Fontiveros neighborhood have a higher incidence of radiation than recommended, which is largely due to the shortage of trees on public roads—an aspect that was also verified when quantifying this indicator, resulting in only 6.57% of the existing trees compared to the 100% that would represent the ideal amount. This lack of trees is also reflected in the quantification of the indicator that evaluates the proximity of the population to green areas, as there are only two of a daily nature in Fontiveros, and the radius of influence of 200 m does not cover the whole neighborhood, and it has been proven that municipalities with a higher density of green areas had a lower incidence of the virus. The new proposal foresees the adequacy of five spaces that are currently residual as green areas for public use, providing a service to the entire resident population of the neighborhood. Finally, the quantification of the distribution of public roads has also turned out to be negative, as only 44% of these are destined for pedestrians and other uses, compared to the ideal of 75%, which is something that cannot be overlooked because smaller roads are one of the main aspects related to the worst impact of virus spread. With the new road hierarchy proposal, as shown in Figure 13, 82% of the road network is destined for non-motorized use, as most of the roads not belonging to the main arteries will be for pedestrian use with restricted, low-speed vehicular access.
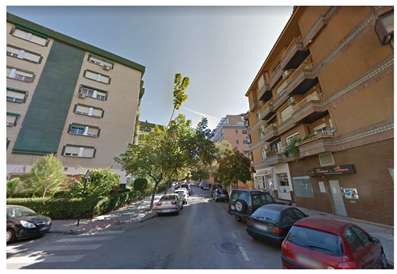
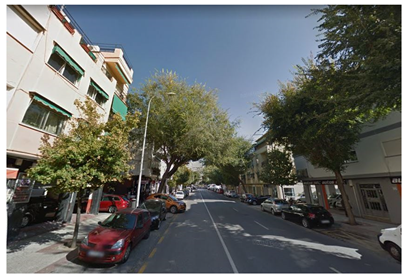
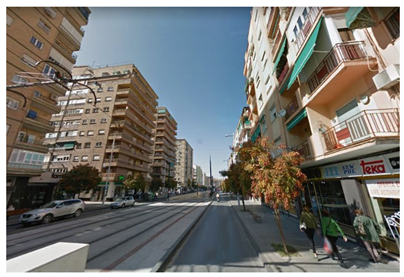
For a visual understanding, it is represented how the intervention in one of the roads of this urban organism could be approached: Torres Molina Street. This is a low-density area from which one can see the high-rise residential buildings that make up the most recent developments in this neighborhood (Figure 16 and Figure 17).
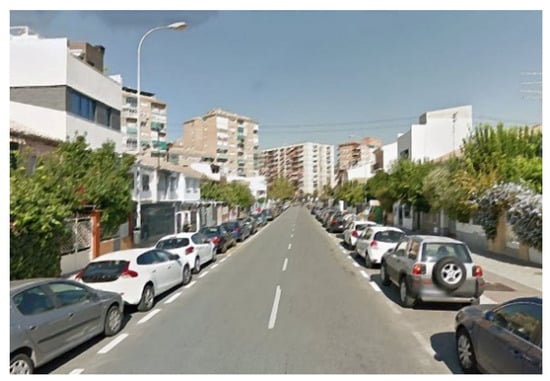
Figure 16.
Torres Molina Street. Previous configuration.
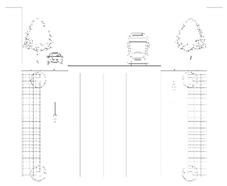
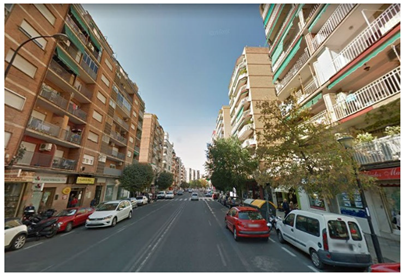
Figure 17.
Torres Molina Street. Intervention.
4. Discussion
Since the emergence of the term Sustainable Development, many efforts have been made to measure the level of sustainability of urban systems through indicators. Several authors have carried out analyses and made new proposals for the evaluation and quantification of sustainability in the urban and building sphere, as is the case of Fatourehchi et al. with a proposal for the sustainable evaluation of residential buildings from a social point of view, or López-Mesa et al., who also developed a series of indicators for the evaluation of residential buildings in need of rehabilitation. Dizdaroglu as well as Braulio-Gonzalo et al. also propose a system of indicators for the sustainability of micro-urbanism and for the Spanish context, respectively. However, these studies pre-date the crisis caused by COVID-19, so they have deficiencies in the current context. This study aims to add to the existing IS literature the added value of analyzing those factors that have been key to the spread of the virus, thus obtaining a more complete IS adapted to current needs, as well as serve as a tool for urban management in case of future pandemics. It also highlights the need to standardize an urban sustainability quantification system that makes it possible to monitor the different areas that compose an urban organism in order to draw up lines of action with the aim of achieving sustainable development, since, as this study has shown, when quantifying many of these areas, the majority have been negative, as no prior monitoring has been carried out on them.
The benefits of this intervention are multiple, both in the short and long term. Increasing the area of public space for pedestrians will increase social relations, improve road traffic safety, favor mobility on foot, and reduce noise pollution and pollutant emissions, as well as hinder the spread of infectious diseases.
On the other hand, the rehabilitation of new green areas, combined with the greening of the roads, will improve the air quality due to the chlorophyll function of vegetation that decomposes carbon dioxide, absorbing carbon and releasing oxygen into the air, having also the ability to accumulate dust and particulate pollutants, thus reducing the surrounding environment [90]. As a consequence, bacteria in the air will not be as contagious. In addition, it provides a much more comfortable living space, attracting more people, encouraging the emergence of new businesses, and increasing the mix of the area and the life of the city.
Furthermore, the moisture released by the plant species will result in lower temperatures in summer, as well as blocking radiation on the surfaces, thus considerably lowering their temperature and allowing radiation in winter as they are deciduous species (Figure 18).

Figure 18.
Effects of the interaction between vegetation and the urban environment. Own elaboration based on data obtained from: Bioclimatic urbanism. Environmental criteria in land use planning. Higueras, E (1998).
Biodiversity will also be favored by this action, and different plant species, as well as aquatic and rocky surfaces, should be incorporated into the green spaces.
These measures are just one step toward a change for a new, more sustainable, healthy and efficient city and are perfectly extrapolated to other neighborhoods of the city, whose combined intervention, with the evaluation of the rest of the indicators, would bring many benefits to the city of Granada.
5. Conclusions
Cities have a high environmental impact and knowing how to act on them is essential to minimize these impacts. Indicator systems are a very useful tool for objectively assessing a complex area in order to simplify and better understand it. However, the COVID-19 crisis has shown that those areas that the different systems of urban indicators contemplated for the quantification of a sustainable organization need to be revised, as the health crisis has left and will leave its mark on aspects that were hardly contemplated, such as political, social, and demographic aspects.
As a result of COVID-19, in Andalusia (Spain), the Law for the Promotion of Territorial Sustainability in Andalusia is being developed; this is why we have decided to carry out the practical application of some of the indicators in this Spanish autonomous community.
The results obtained show how a review of the current IS is necessary, as well as a standardization and implementation of the same as Directive 2014/95/EU does for the business sphere. These results have allowed us to draw up a list of minimum and essential indicators that each local system should contain, as it is understood that each urban nucleus is different from the rest, and when quantifying its sustainability, local factors must be taken into account according to climate, population type, political/economic system, etc. This will not only improve urban management and quality but will help prevent and mitigate future pandemics.
After all, cities are complex, composed by diverse systems (economic, social, infrastructural, etc.) and therefore are comparable to a living organism that consumes resources and generates waste. Therefore, it is necessary to address the issue of sustainability in all those areas that form and constitute the city, as the system of indicators is one of the most useful mechanisms to address interventions of different magnitudes, while also understanding the importance of a change in them for a better adaptation to reality.
The contribution of this research is important in the sense of emphasizing the relevance of considering issues that are generally neglected in urban development, regeneration, or rehabilitation processes or plans, which are basic to habitability or quality of life, since, as has been seen in the most recent case such as a health crisis following a global pandemic, those areas that are worst managed are the ones that suffer the worst repercussions.
It is worth noting the limitation that only some of the sustainability indicators have been analysed in this study. This research leaves open the possibility of future research in this area, completing the rest of the parameters not quantified in Granada in this work in the pursuit of implementing a new way of making a city.
Based on these contributions, it is concluded that this study has the purpose of the most faithful approach possible to reality, which is nourished through scientific sources of information and the population, their daily lives, interests, and individual and collective development, in order to provide the most sustainable perspectives from which urban revitalization proposals should emanate.
Author Contributions
Conceptualization, A.M.E.-R. and P.M.-M.; methodology, A.M.E.-R. and P.M.-M.; validation, A.M.E.-R., P.M.-M. and H.P.; formal analysis, A.M.E.-R. and P.M.-M.; investigation, A.M.E.-R. and P.M.-M.; resources, A.M.E.-R. and P.M.-M.; data curation, A.M.E.-R. and P.M.-M.; writing—original draft preparation, A.M.E.-R. and P.M.-M.; writing—review and editing, P.M.-M.; visualization, A.M.E.-R.; supervision, P.M.-M. and H.P.; project administration, P.M.-M.; funding acquisition, P.M.-M. All authors have read and agreed to the published version of the manuscript.
Funding
This research has been funded by the research project art. 68/83 LOU ref. 4115/0632 thanks to GRUPO PUMA S.L, PROARID GREEN S.L., and ROCKWOOL S.A.U. The results of this work apply the knowledge acquired during the research stay at the Secretary of Posgraduate of the Faculty of Architecture and Urbanism, University of Buenos Aires, Argentina, which are developed by the first author of the article and as a results of the same and for this reason the director of this Secretary is the third co-author. So, it represents the transfer of knowledge acquired in the University of Buenos Aires, Argentina in the field work carried out in situ at the city of Granada, Spain.
Institutional Review Board Statement
Not applicable.
Informed Consent Statement
Not applicable.
Data Availability Statement
Not applicable.
Conflicts of Interest
The authors declare no conflict of interest.
Appendix A. Quantification of Indicators in the Selected Urban Organism
- Environmental quality
- 1.1.
- Air quality
- Goal
To provide, as far as possible, a comfortable public space in terms of air quality.
- Definition
Number of days per year with poor air quality.
Table A1.
Table indicator 01: Air quality. Own elaboration.
- Quantification methodology
The data collected by the measuring station located at the Palacio de Congresos, Granada, are analyzed.
- Quantification
Table 3 shows the results obtained.

Figure A1.
Days per year in which the established limit is exceeded or values close to the limit are reached. Own elaboration based on data obtained from the measurement station in Granada located in the Palacio de Congresos.
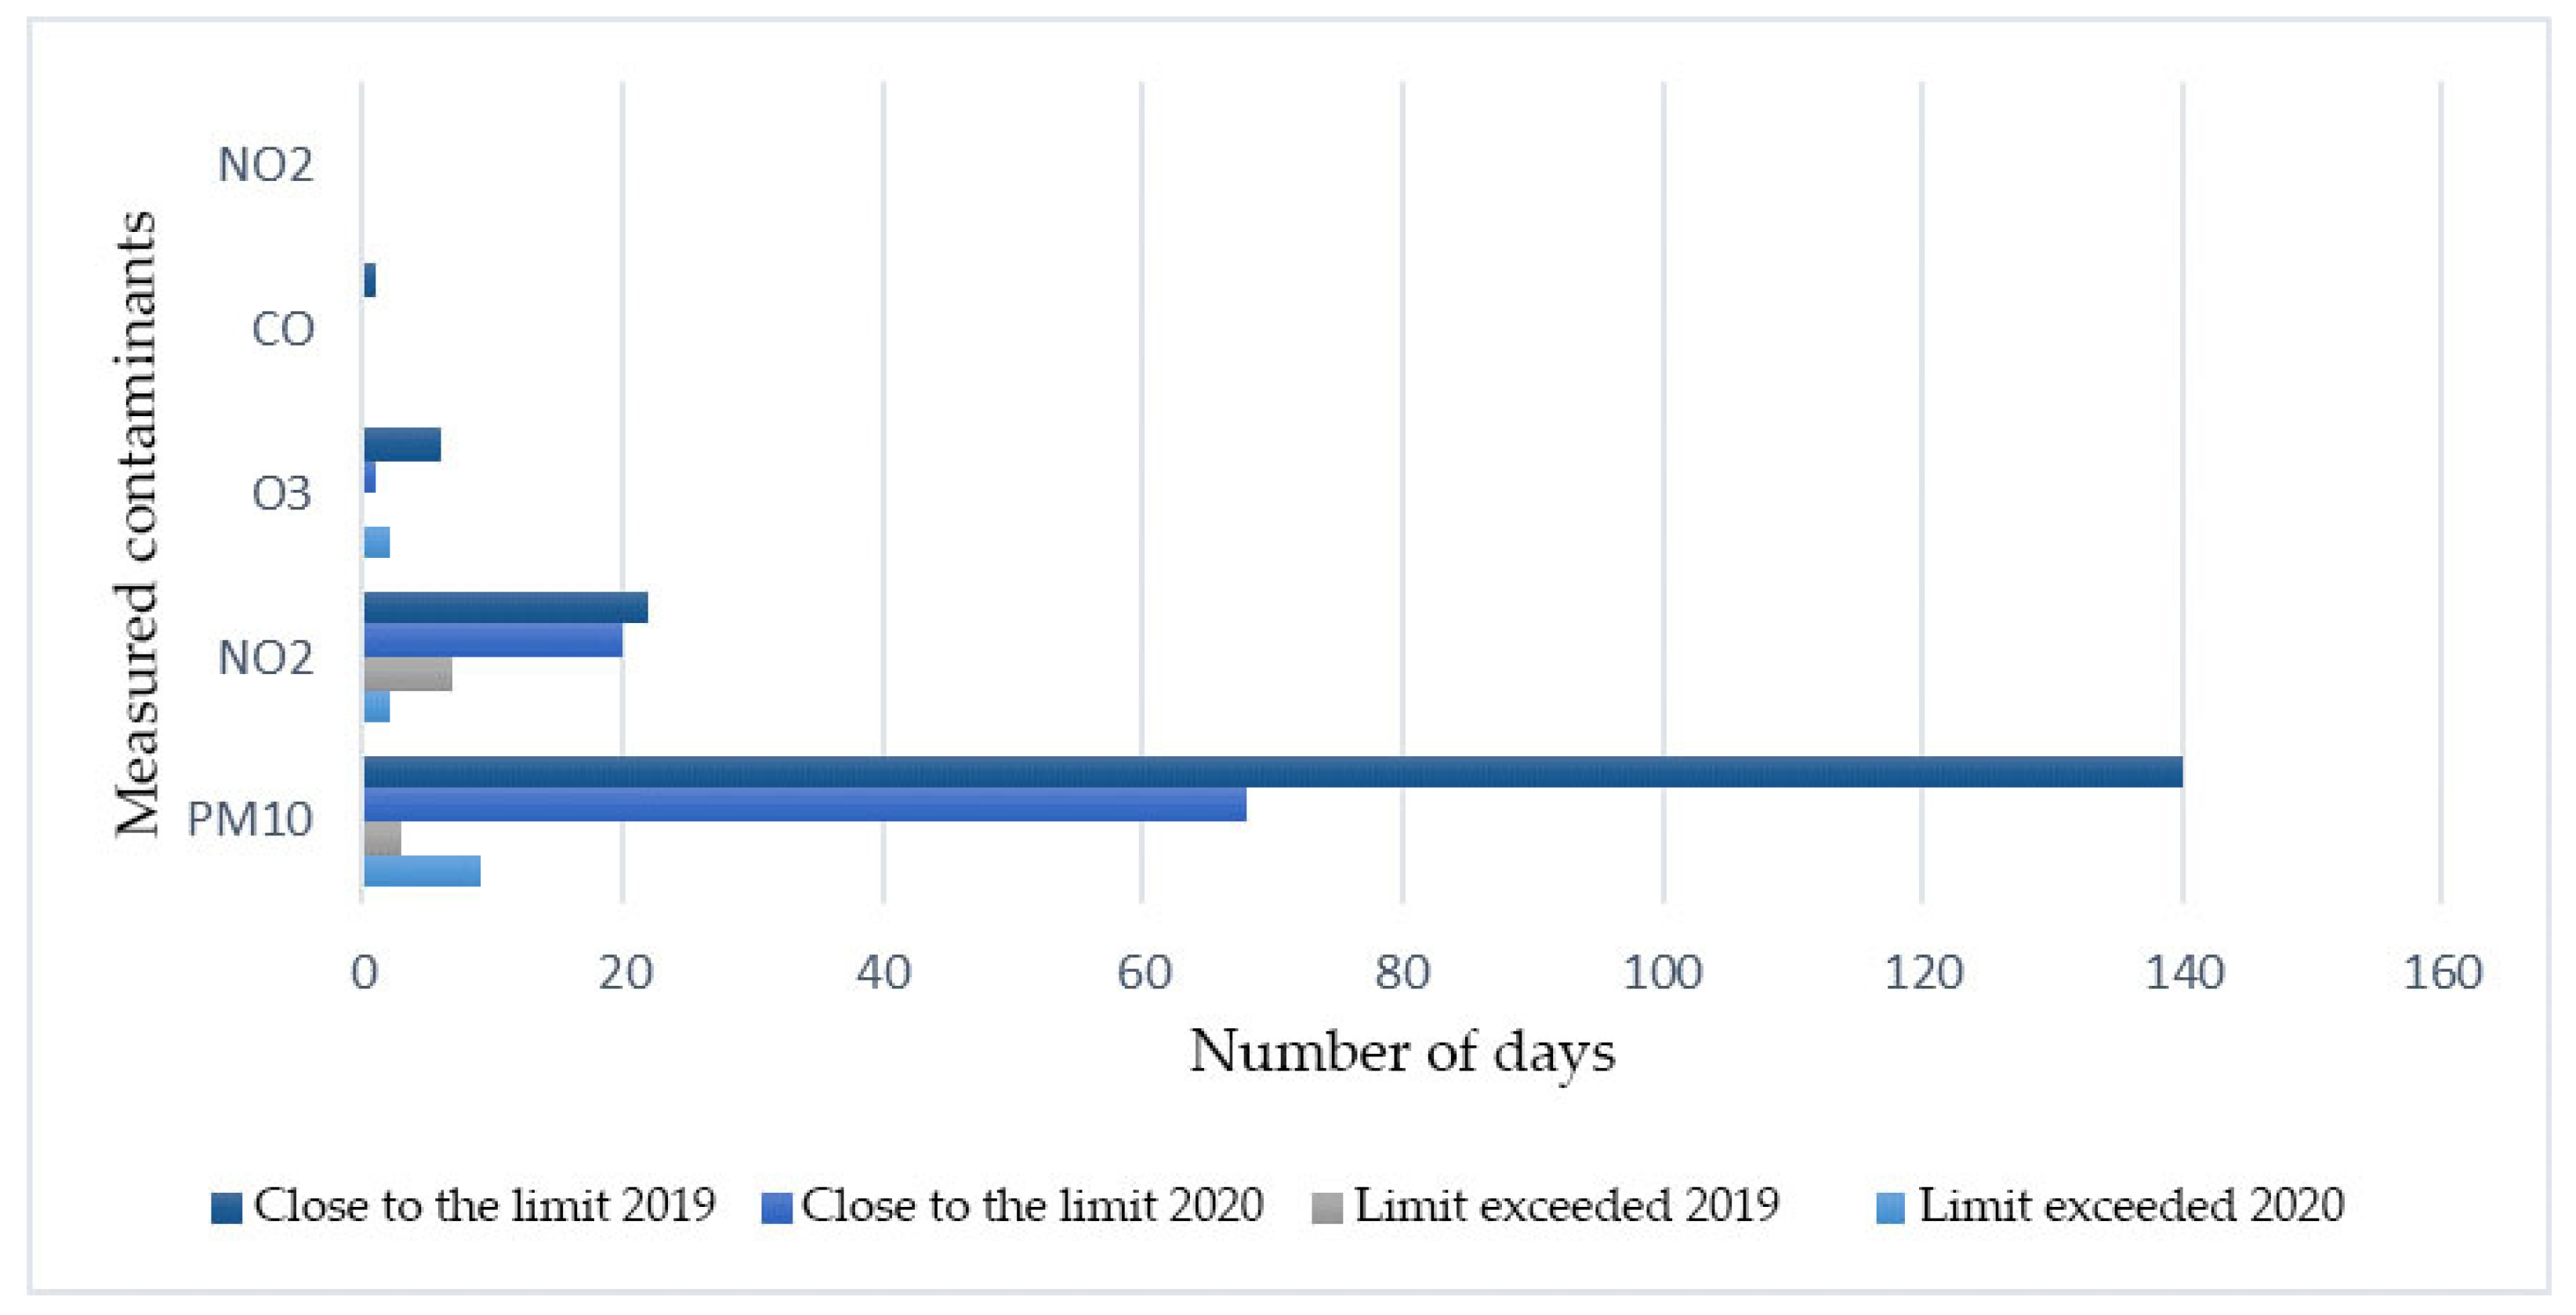
Almost 30% is the percentage that represents the days in 2019 when values were close to the limit or very close to it and 20% in 2020.
In Granada, it is common to see air pollution due to the haze generated. A diagnosis of air quality in the metropolitan area of Granada determined that road traffic is the main cause of the city’s poor air quality (Figure A2).
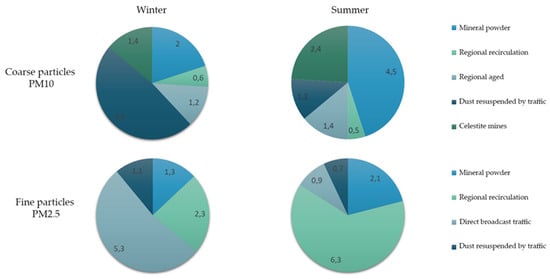
Figure A2.
Origin of PM10 particles in Granada. Own elaboration based on data obtained from: Diagnosis of Air Quality in the Metropolitan Area of Granada. Inter-University Institute for Research on the Earth System in Andalusia. University of Granada (2016).

- 1.2.
- Thermal comfort
- Goal
Decrease or increase the radiant temperature in the public space depending on the season of the year through the obstruction of solar radiation by the provision of trees along the road.
- Definition
Percentage of hours between 8:00 and 22:00 h with adequate thermal comfort conditions for a pedestrian.
Table A2.
Table indicator 02: Thermal comfort. Own elaboration.
- Quantification methodology
First, the road typologies are classified according to the configuration and presence of vegetation (Figure A3).
Secondly, a representative road is chosen for each type of road with vegetation to quantify its percentage of obstruction. Roads with no vegetation at all are assessed as unfavorable.
For each of these roads, a separate sheet is drawn up presenting their characteristics: number of roads, road width, distance between trees, size of trees, and built density. Determining the size of the trees and the distance between them will help us to evaluate the percentage of obstruction (Figure A3), and depending on the built density, the obstruction requirements will vary (Table A3).
Finally, these sheets also show the quantification by determining the section studied and the parameters obtained after the mathematical application.
The sheets also include a cross-sectional profile of the average annual solar radiation received. This profile has been obtained through the Huellasolar urban sunlight and radiation web viewer and allows a more exhaustive evaluation to be provided, since, although the density takes into account that the larger the buildings, the greater the solar obstruction on the road, the proportion of building height and road width is a relevant factor, as we find both situations of high building density and small road width that leads to a high percentage of shade during the days, and situations of high building density and large road width that leads to a lower percentage of shade throughout the days.
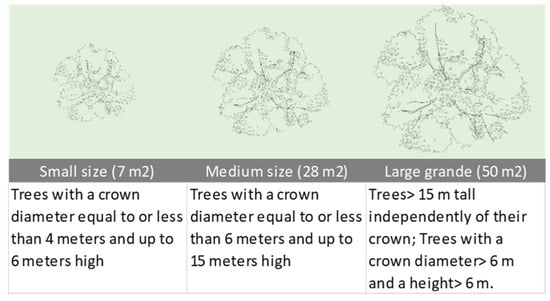
Figure A3.
Classification of trees according to size. Prepared by the authors based on data obtained from the Special Plan for Environmental Sustainability Indicators for urban development in Seville.
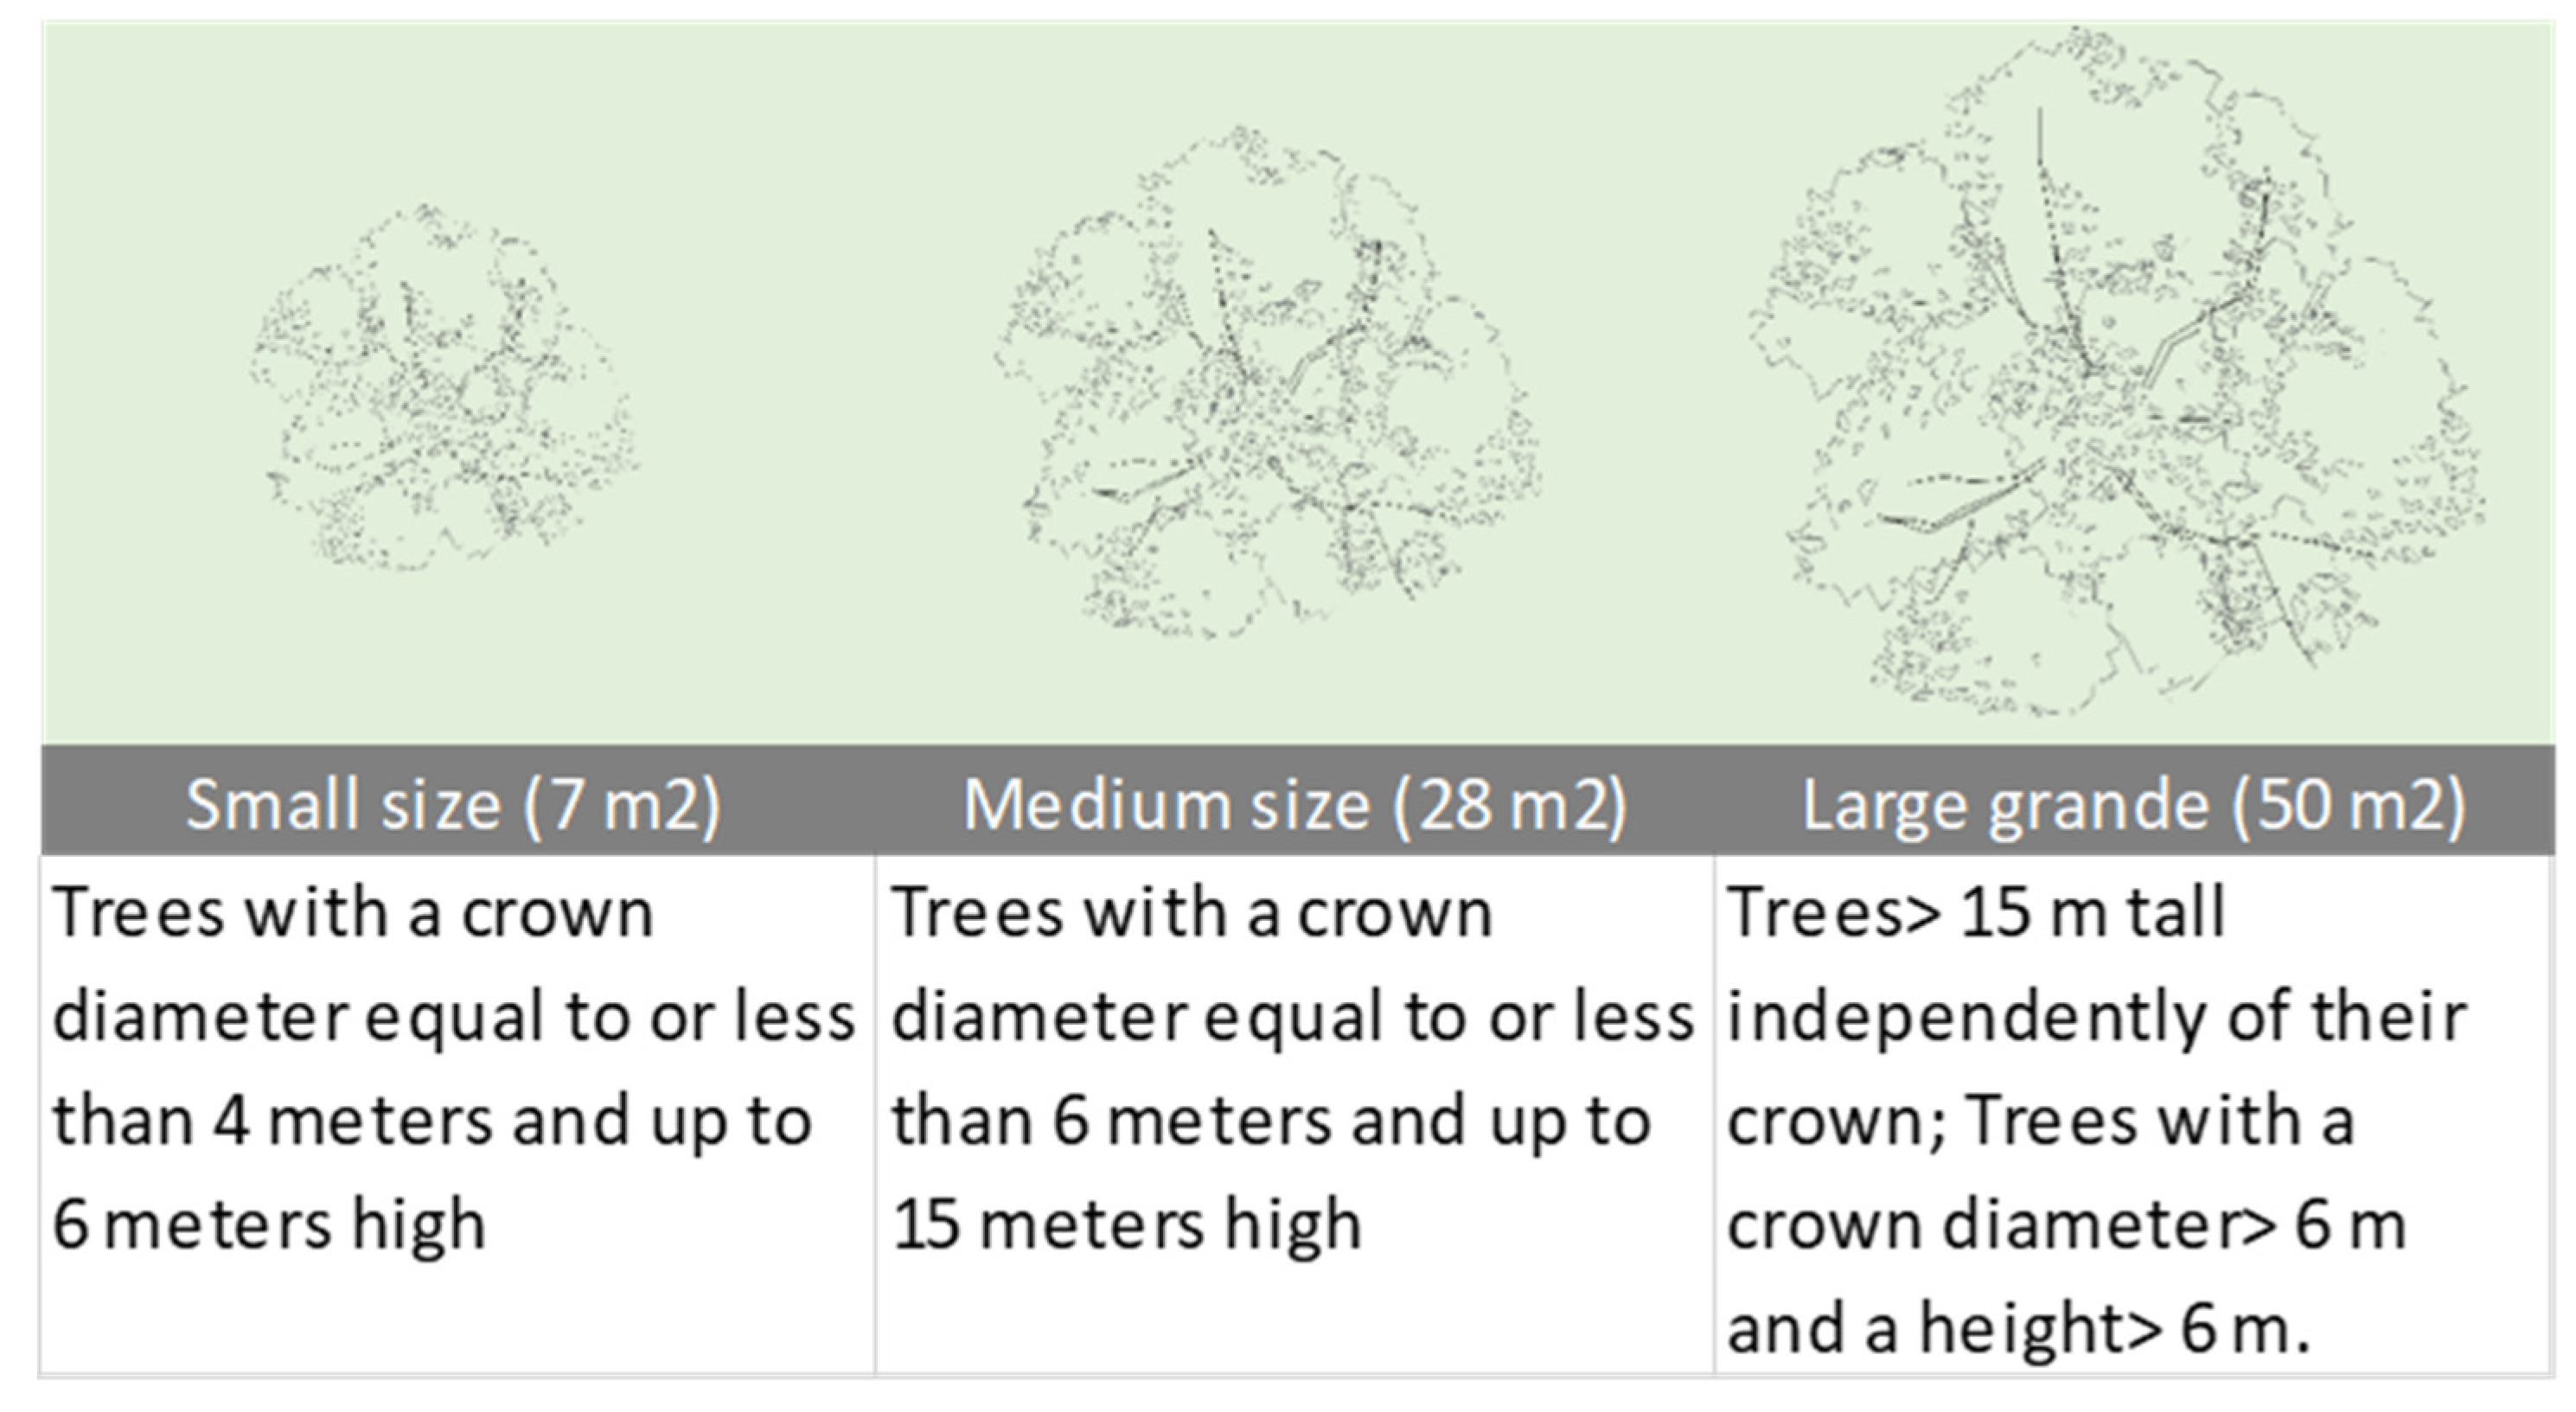
Table A3.
Tree and obstruction requirements according to the characteristics of the road. Prepared by the authors based on data obtained from the Special Plan for Environmental Sustainability Indicators for urban development activity in Seville.
- Quantification
Firstly, road typologies have been identified according to the number of lanes and whether or not they have vegetation on the road (Figure A4), which allows us to group them for quantification.
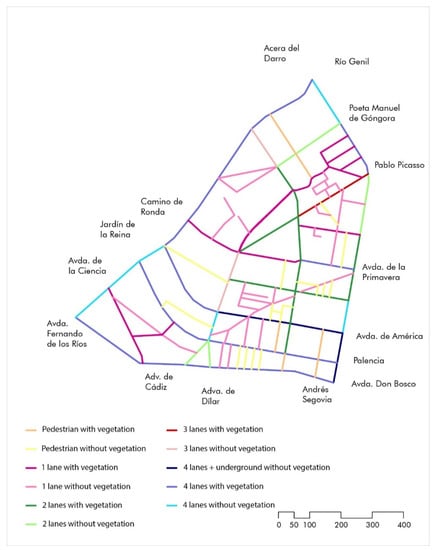
Figure A4.
Road hierarchy. Own elaboration.
For each representative road by type of street with vegetation, a sheet has been prepared to quantify the % of obstruction. Roads with no vegetation at all are assessed as unfavourable.
Table A4.
Representative sheet of one-lane roads and average density for the quantification of thermal comfort. Own elaboration.
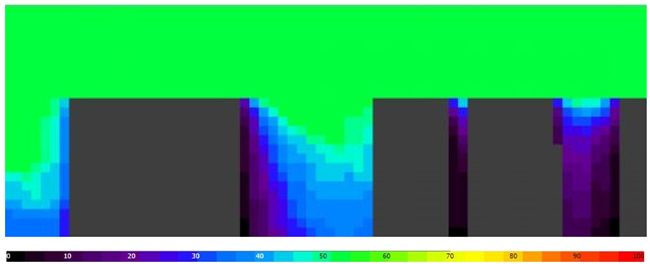
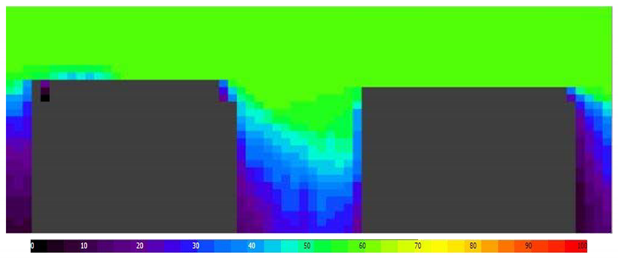
Once the defined parameters have been applied, we obtain an unfavorable evaluation, as the percentage of obstruction obtained is lower than desired according to the characteristics of the road. It should be borne in mind that these factors do not take into account the ratio of building height/track width and orientation, which is why the average solar radiation profile received has also been analyzed. The one-lane roads at medium densities with vegetation have a southwest orientation throughout the sector, because they have a very similar average solar radiation profile, with an average solar radiation percentage during the day of approximately 40%. An increase in the number of trees will still be necessary, but it may not be necessary to achieve 50%.
Table A5.
Representative sheet of one-lane, high-density roads for the quantification of thermal comfort. Own elaboration.
In this case, similar to the previous one, as the density increases, the minimum optimum clogging value decreases. In this road, the parameters are favorably met. As there are small and medium-sized vegetation, an average has been made between the area of obstruction presented by each one.
Table A6.
Representative sheet of two-lane, low-density roads for the quantification of thermal comfort. Own elaboration.
The two-lane roads with vegetation serve low-density areas of the sector and have both south and southeast orientations. In this case, we have analyzed the most unfavorable, i.e., south-facing, which means more hours of direct sunlight, which are also favored by the low density.
This particular road also has a pedestrian pavement with a greater width than the rest, which has increased the surface area studied for the same length of section and, therefore, the obstruction requirement.
Thus, a negative result is obtained not only because of compliance with the established values, but also because of the typology of orientation of this road which, as can be seen in the radiation profile, would require an increase in vegetation, either by an increase in the number of trees, size, or both.
The southeast facing roads will have a lower percentage of hours of direct solar radiation received; however, the configuration of the vegetation has similar characteristics, so its assessment would also be negative.
Table A7.
Representative sheet of three-lane roads and average density for the quantification of thermal comfort. Own elaboration.
It is the only three-lane road with vegetation. It also receives an unfavorable assessment, with the percentage of obstruction well below the desired level.
Table A8.
Representative sheet for the two-lane + underground and high-density road for the quantification of thermal comfort. Own elaboration.
The eastern orientation of this road and its high density favors a high percentage of shade throughout the day; however, the value obtained in this case is well below the desired value.
It should also be taken into account that the sun in summer falls from a higher point, so the road will receive much more sunlight, especially on its right side, which shows a clear need to increase the vegetation on this side to achieve greater thermal comfort.
Table A9.
Representative sheet of four-lane, high-density roads for the quantification of thermal comfort. Own elaboration.
Most four-lane roads have an easterly orientation, and their presence in the highest density areas means that the percentage of sunlight received during the day is much lower than in other cases considered. However, the assessment (regardless of orientation) is unfavorable, although not far below the minimum value. Paseo del Violón (the other four-lane road) has a southern orientation, so the minimum vegetation level should be increased, even above 30%.
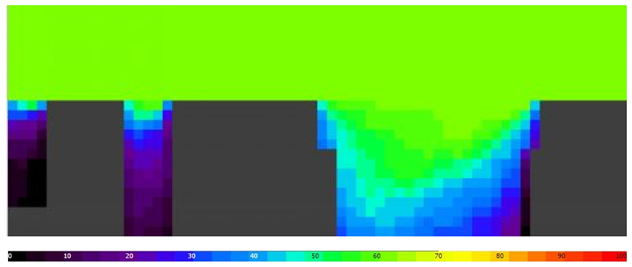
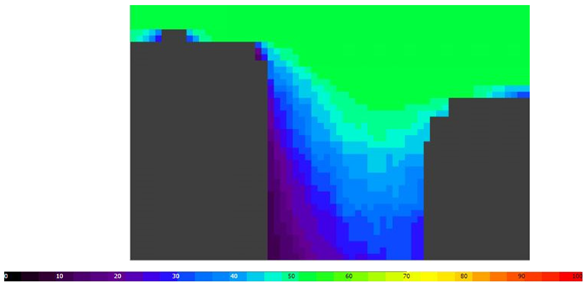
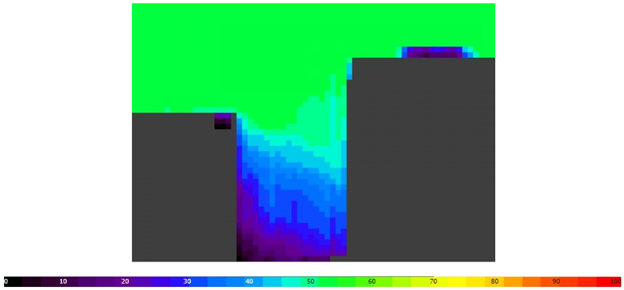
On the other hand, the web tool goolzoom also provides heat maps, and it can determine the areas that contribute the most.
As can be seen in Figure A5, the older, low-density housing areas have the greatest impact in this area compared to open high-rise buildings.
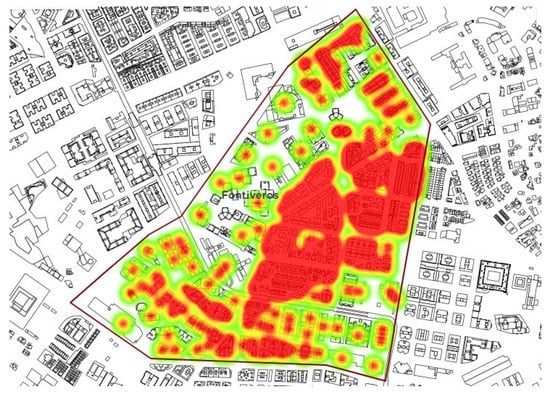
Figure A5.
Heat map of the urban organism. Source: Goolzoom web tool.
- 2.
- Urban habitability and biodiversity
- 2.1.
- Provision of trees in public spaces
- Goal
Detect tree deficiencies in public spaces in order to assign a suitable surface area according to the conditions of the urban fabric, enriching the connectivity of the urban ecosystem and habitability.
- Definition
Allocation of one tree for every 20 m2 of occupied area.
Table A10.
Table Indicator 04: Provision of trees in public spaces. Own elaboration.
- Quantification methodology
Firstly, the roads and public spaces with trees and the number of trees are identified. The total surface area occupied will be determined in order to finally quantify and evaluate the results obtained.
- Quantification
Table A11.
Quantification to determine the number of trees in public spaces. Own elaboration.
As can be seen, there is a notable lack of trees in the urban fabric, as many of the roads have no vegetation at all, and in those that do, it is insufficient.
- 2.2.
- Proximity of the population to green spaces
- Goal
Determine how far the population has to travel to access different sizes and types of green spaces in order to guarantee the enjoyment of nature and minimize impacts on biodiversity.
- Definition
Simultaneous access to green spaces according to surface area and distance.
Table A12.
Table Indicator 05: Proximity of the population to green areas. Own elaboration.
- Quantification methodology
The different typologies of green spaces will be identified in the urban centre of Granada, where a circle of the diameter of the optimum distance will be inscribed and the impact on the study model will be analyzed.
- Quantification
There is only one green space of between 1000 and 5000 m2 accessible on a daily basis in the urban area, limiting the population benefiting from green spaces of this typology and, therefore, having to travel further to enjoy a green space.
On the other hand, there are green spaces that can be accessed either on foot by walking up to 750 m, such as Plaza Concordia, or by bicycle up to 2 km, such as Parque Tico Medina.
Finally, with a surface area of 486 ha, we find the peri-urban park of Dehesa del Generafile, although the journey by public transport is more than 4 km, having to cover 5 km (Figure A6).
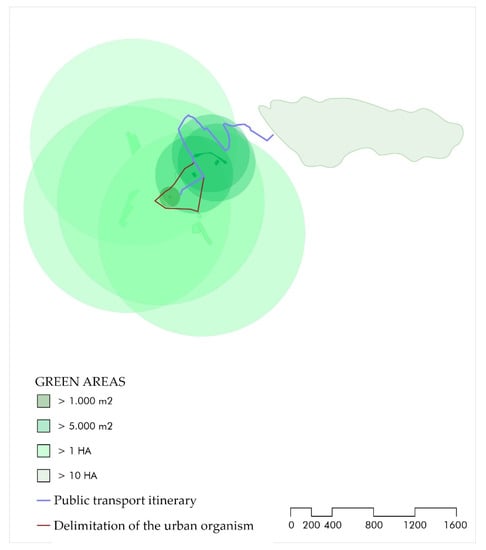
Figure A6.
Map of distances to green areas. Own elaboration.

- 2.3.
- Public road layout
- Goal
To quantify the percentage of pedestrian roads compared to the total public roads in order to evaluate the need to give priority to the private vehicle as the main axis in the urban morphology.
- Definition
Pedestrian road area in front of the total public road area.
Table A13.
Table Indicator 06: Distribution of public roads. Own elaboration.
- Quantification methodology
Through the classification of the different typologies of roads elaborated for the quantification of indicator 02, we proceed in this section to count the linear meters of each typology of road according to the number of lanes it has.
For pedestrian roads, the average width of each street will be calculated (it is usually quite similar in most of them), and once these two data have been obtained, the percentage allocated to each type of road will be calculated.
- Quantification
Table A14 shows the linear meters of each typology of road, the average characteristics of lanes, parking spaces and pavements and, finally, the quantification of the percentage of pedestrian road compared to the total.
Table A14.
Characteristics of the road hierarchy and quantification of the percentage of public roads dedicated to pedestrians compared to the total. Own elaboration.
As can be seen, more than half of the public space is allocated to private vehicle use, which is far below the requirement that pedestrian roads should account for at least 75% of the total.
References
- Huang, L.; Wu, J.; Yan, L. Defining and measuring urban sustainability: A review of indicators. Landsc. Ecol. 2015, 30, 1175–1193. [Google Scholar] [CrossRef]
- United Nations, Department of Economic and Social Affairs, Population Division. World Urbanization Prospects: The 2018 Revision, Highlights; United Nations: New York, NY, USA, 2018. [Google Scholar]
- Purvis, B.; Mao, Y.; Robinson, D. Three pillars of sustainability: In search of conceptual origins. Sustain. Sci. 2019, 14, 681–695. [Google Scholar] [CrossRef] [Green Version]
- UN News; UN-Habitat. Cities: A ‘Cause and Solution to’ Climate Change. Available online: https://news.un.org/en/story/2019/09/1046662 (accessed on 7 May 2021).
- UN Environment Programme; International Resource Panel. The Weight of Cities: Resource Requirements of Future Urbanization. Available online: https://www.resourcepanel.org/reports/weight-cities (accessed on 7 May 2021).
- Connolly, C.; Ali, S.H.; Keil, R. On the relationships between COVID-19 and extended urbanization. Dial. Hum. Geogr. 2020, 10, 213–216. [Google Scholar] [CrossRef]
- Taylor, J.; Haines, A.; Milner, J.; Davies, M.; Wilkinson, P. A Comparative Analysis of Global Datasets and Initiatives for Urban Health and Sustainability. Sustainability 2018, 10, 3636. [Google Scholar] [CrossRef] [Green Version]
- Sustainable Development Goals. SDG Indicators: Global Indicator Framework for the Sustainable Development Goals and Targets of the 2030 Agenda for Sustainable Development. Available online: https://unstats.un.org/sdgs/indicators/indicators-list/ (accessed on 7 May 2021).
- Sustainable Development Goals. The Aalborg Charter. Available online: https://sustainablecities.eu/the-aalborg-charter/ (accessed on 7 May 2021).
- Gobierno de España; Ministerio de Transportes, Movilidad y Agenda Urbana. Estrategia Española de Sostenibilidad Urbana y Local (EESUL). Available online: https://www.mitma.gob.es/areas-de-actividad/arquitectura-vivienda-y-suelo/urbanismo-y-politica-de-suelo/urbanismo-y-sostenibilidad-urbana/estrategia-espan%CC%83ola-de-sostenibilidad-urbana-y-local-eesul (accessed on 7 May 2021).
- Agència d’Ecologia Urbana de Barcelona. Available online: https://www.bcnecologia.net/es (accessed on 7 May 2021).
- Red Española de Ciudades por el Clima. Available online: https://www.redciudadesclima.es/ (accessed on 7 May 2021).
- Report of the World Commission on Environment and Development: Our Common Future. Available online: https://sustainabledevelopment.un.org/content/documents/5987our-common-future.pdf (accessed on 7 May 2021).
- Pupphachai, U.; Zuidema, C. Sustainability indicators: A tool to generate learning and adaptation in sustainable urban development. Ecol. Ind. 2017, 72, 784–793. [Google Scholar] [CrossRef]
- Sustainable Development Goals, Knowledge Platform. Agenda 21. Available online: https://sustainabledevelopment.un.org/outcomedocuments/agenda21 (accessed on 7 May 2021).
- Hák, T.; Janoušková, S.; Moldan, B. Sustainable Development Goals: A need for relevant indicators. Ecol. Ind. 2016, 60, 565–573. [Google Scholar] [CrossRef]
- Bulkeley, H. Cities and the Governing of Climate Change. Ann. Environ. 2010, 35, 223–253. [Google Scholar] [CrossRef] [Green Version]
- Report by the Commission on the Measurement of Economic Performance and Social Progress. Available online: https://citeseerx.ist.psu.edu/viewdoc/download?doi=10.1.1.215.58&rep=rep1&type=pdf (accessed on 7 May 2021).
- Acuto, M. COVID-19: Lessons for an Urban(izing) World. One Earth 2020, 2, 317–319. [Google Scholar] [CrossRef]
- SLATE. The Post-Pandemic Style. Available online: https://slate.com/business/2020/04/coronavirus-architecture-1918-flu-cholera-modernism.html (accessed on 7 May 2021).
- CURBED. Design in the Age of Pandemics. Available online: https://archive.curbed.com/2020/3/17/21178962/design-pandemics-coronavirus-quarantine (accessed on 7 May 2021).
- Salamanca-Fernández, E.; Rodríguez, M.; Sánchez, M.J. Influencia de la temperatura ambiental y la contaminación en la transmisión del SARS-COV-2. Rev. Esp. Salud. Púb. 2021, 95, 1–8. [Google Scholar]
- The European Space Agency. 204 Results for Mission: “Sentinel-5P” in Images. Available online: https://www.esa.int/ESA_Multimedia/Missions/Sentinel-5P/(result_type)/images (accessed on 7 May 2021).
- De Leấo Dornelles, L.; Gandolfi, F.F.; Mercader Moyano, M.P.; Mosquera Adell, E. Between the Lines of Memory and Places: Urban Rehabilitation and Sustainability in the Process of Preservation of the Material-Culture Heritage in the City of la Plata/Argentina (1982–2008). Ponencia en Congreso. In Proceedings of the 3rd International Congress on Sustainable Construction and Eco-Efficient Solutions, Sevilla, Spain, 27–29 March 2017; Escuela Técnica Superior de Arquitectura de Sevilla, Universidad de Sevilla: Sevilla, Spain, 2017. ISBN 978-84-617-8428-8. [Google Scholar]
- Red Española para el Desarrollo Sostenible (REDS). Mirando Hacia el Futuro: Ciudades Sostenibles. Los Objetivos de Desarrollo Sostenible en 100 Ciudades Españolas. Available online: https://www.miteco.gob.es/es/ceneam/recursos/pag-web/desarrollo-sostenible-100ciudades-espanolas.aspx (accessed on 7 May 2021).
- Junta de Andalucía; Consejería de Fomento, Infraestructuras y Ordenación del Territorio. Ley de Impulso para la Sostenibilidad del Territorio de Andalucía. Available online: https://www.juntadeandalucia.es/organismos/fomentoinfraestructurasyordenaciondelterritorio/areas/ordenacion/ley-sostenibilidad.html (accessed on 7 May 2021).
- Bereitschaft, B.; Scheller, D. How Might the COVID-19 Pandemic Affect 21st Century Urban Design, Planning, and Development? Urban Sci. 2020, 4, 56. [Google Scholar] [CrossRef]
- Bhardwaj, G.; Esch, T.; Lall, S.V.; Marconcini, M.; Soppelsa, M.E.; Wahba, S. Cities, Crowding, and the Coronavirus: Predicting Contagion Risk Hotspots; World Bank: Washington, DC, USA, 2020. [Google Scholar]
- COVID-19. Available online: https://cnecovid.isciii.es/covid19/ (accessed on 11 May 2021).
- Statista. Número de casos Confirmados de Coronavirus en España a Fecha de 6 de Mayo de 2021, por Comunidad Autónoma. Available online: https://es.statista.com/estadisticas/1100641/regiones-afectadas-por-el-covid-19-segun-los-casos-confirmados-espana/ (accessed on 11 May 2021).
- Islam, S.; Islam, R.; Mannan, F.; Rahman, S.; Islam, T. COVID-19 pandemic: An analysis of the healthcare, social and economic challenges in Bangladesh. Prog. Dis. Sci. 2020, 8, 100135. [Google Scholar] [CrossRef]
- Alfonso Viguria, U.; Casamitjana, N. Early Interventions and Impact of COVID-19 in Spain. Int. J. Environ. Res. Pub. Health. 2021, 18, 4026. [Google Scholar] [CrossRef]
- Ahmed, J.; Jaman, M.H.; Saha, G.; Ghosh, P. Effect of environmental and socio-economic factors on the spreading of COVID-19 at 70 cities/provinces. Heliyon 2021, 7, e06979. [Google Scholar] [CrossRef]
- Mofijur, M.; Rizwanul Fattah, I.M.; Asraful Alam, M.; Saiful Islam, A.B.M.; Chyuan Ong, H.; Ashrafur Rahman, S.M.; Najafi, G.; Ahmed, S.F.; Alhaz Uddin, M.; Mahlia, T.M.I. Impact of COVID-19 on the social, economic, environmental and energy domains: Lessons learnt from a global pandemic. Sustain. Prod. Consum. 2021, 26, 343–359. [Google Scholar] [CrossRef]
- Qiu, Y.; Chen, X.; Shi, W. Impacts of social and economic factors on the transmission of coronavirus disease 2019 (COVID-19) in China. J. Popul. Econ. 2020, 33, 1127–1172. [Google Scholar] [CrossRef]
- Merino-Saum, A.; Halla, P.; Superti, V.; Boesch, A.; Binder, C.R. Indicators for urban Sustainability: Key lessons from a systematic analysis of 67 measurement iniciatives. Ecol. Ind. 2020, 119, 106879. [Google Scholar] [CrossRef]
- Casquero, J.A.; Titos, G.; Alados, L. Diagnóstico de la Calidad del Aire del Área Metropolitana de Granada; Instituto Interuniversitario de Investigación del Sistema Tierra en Andalucía, Universidad de Granada: Granada, Spain, 2016. [Google Scholar]
- Diputación de Granada, Agenda 21 Provincial. Resúmen DIAM. Available online: https://a21-granada.org/red-gramas/descargas/ResumenDIAM.pdf (accessed on 7 May 2021).
- Hu, M.; Roberts, J.D.; Pryor Azevedo, G.; Milner, D. The role of built and social environmental factors in Covid-19 transmission: A look at America’s capital city. Sustain. Cities Soc. 2021, 65, 102580. [Google Scholar] [CrossRef]
- Sharifi, A.; Khavarian-Garmsir, R. The COVID-19 pandemic: Impacts on cities and major lessons for urban planning, design and management. Sci. Total Environ. 2020, 749, 142391. [Google Scholar] [CrossRef]
- Coles, M.A.; Ozgen, C.; Strol, E. Air Pollution Exposure and COVID-19; IZA Discussion Papers, No. 13367; Institute of Labor Economics (IZA): Bonn, Germany, 2020. [Google Scholar]
- Sangkham, S.; Thongtip, S.; Vongruang, P. Influence of air pollution and meteorological factors on the spread of COVID-19 in the Bangkok Metropolitan Region and air quality during the outbreak. Environ. Res. 2021, 197, 111104. [Google Scholar] [CrossRef]
- Coccia, M. How (Un)sustainable Environments Are Related to the Diffusion of COVID-19: The Relation between Coronavirus Disease 2019, Air Pollution, Wind Resource and Energy. Sustainability 2020, 12, 9709. [Google Scholar] [CrossRef]
- Fernández, D.; Giné-Vázquez, I.; Liu, I.; Yucel, R.; Nai Ruscone, M.; Morena, M.; Gerardo García, V.; Maria Haro, J.; Pan, W.; Tyrovolas, S. Are environmental pollution and biodiversity levels associated to the spread and mortality of COVID-19? A four-month global analysis. Environ. Pollut. 2021, 271, 116326. [Google Scholar] [CrossRef] [PubMed]
- Leng, J.; Wang, Q.; Liu, K. Sustainable design of courtyard environment: From the perspectives of airborne diseases control and human health. Sustain. Cities Soc. 2020, 62, 102405. [Google Scholar] [CrossRef] [PubMed]
- Mo, Q.; Chen, X.; Yu, B.; Ma, Z. Levels of economic growth and cross-province spread of the COVID-19 in China. J. Epidemiol. Commun. Health 2021, 75, 824–828. [Google Scholar] [CrossRef] [PubMed]
- Banco Mundial. Desarrollo Urbano. Available online: https://www.bancomundial.org/es/topic/urbandevelopment/overview (accessed on 7 May 2021).
- Organización Internacional del Trabajo. La COVID-19 y el Mundo del Trabajo. Quinta Edición. Available online: https://www.ilo.org/wcmsp5/groups/public/---dgreports/---dcomm/documents/briefingnote/wcms_749470.pdf (accessed on 7 May 2021).
- Mena Roa, M. La Dependencia del Turismo de los Países más Afectados por el Coronavirus. Available online: https://es.statista.com/grafico/21537/contribucion-de-los-viajes-y-el-turismo-al-pib-en-2019/ (accessed on 24 September 2021).
- Dupre, N.C.; Karimi, S.; Zhang, C.H.; Blair, L.; Gupta, A.; Mousa, A.; Alharbi, L.; Alluhibi, M.; Mitra, R.; McKinney, W.P.; et al. County-level demographic, social, economic, and lifestyle correlates of COVID-19 infection and death trajectories during the first wave of the pandemic in the United States. Sci. Total Environ. 2021, 786, 147495. [Google Scholar] [CrossRef]
- United Nations, Office on Drugs and Crime. The Impact of COVID-19 on Organized Crime. Available online: https://www.unodc.org/documents/data-and-analysis/covid/RB_COVID_organized_crime_july13_web.pdf (accessed on 7 May 2021).
- Díaz de León-Martínez, L.; de la Sierra-de la Vega, L.; Palacios-Ramírez, A.; Rodriguez-Aguilar, M.; Flores-Ramírez, R. Critical review of social, environmental and health risk factors in the Mexican indigenous population and their capacity to respond to the COVID-19. Sci. Total Environ. 2020, 733, 139357. [Google Scholar] [CrossRef]
- Durizzo, K.; Asideu, E.; Van der Merwe, A.; Van Nieker, A.; Günther, I. Managing the COVID-19 pandemic in poor urban neighborhoods: The case of Accra and Johannesburg. World Dev. 2021, 137, 105175. [Google Scholar] [CrossRef]
- Sannigrahi, S.; Pilla, F.; Basu, B.; Sarkar Basu, A.; Molter, A. Examining the association between socio-demographic composition and COVID-19 fatalities in the European region using spatial regression approach. Sustain. Cities Soc. 2020, 62, 102418. [Google Scholar] [CrossRef]
- Borgonovi, F.; Andrieu, E.; Subramanian, S.V. The evolution of the association between community level social capital and COVID-19 deaths and hospitalizations in the United States. Soc. Sci. Med. 2021, 278, 113948. [Google Scholar] [CrossRef]
- Naciones Unidas. Documento de Políticas: La COVID-19 en un Mundo Urbano. Available online: https://www.un.org/sites/un2.un.org/files/covid-19_in_an_urban_world_spanish.pdf (accessed on 7 May 2021).
- Beltrán, J.; Venegas, M. Educar en época de confinamiento: La tarea de renovar un mundo común. Rase 2020, 13, 92–104. [Google Scholar] [CrossRef]
- International Telecommunication Union. Measuring Digital Development: Facts and Figures. Available online: https://www.itu.int/en/ITU-D/Statistics/Pages/facts/default.aspx (accessed on 7 May 2021).
- Arbeláez-Campillo, D.F.; Villasmil Espinoza, J.J. Escenarios prospectivos de un nuevo orden internacional que se vislumbra luego de la pandemia COVID-19. Telos 2020, 22, 494–508. [Google Scholar] [CrossRef]
- Crossmna, G.; Kim, S.; Rexer, J.M.; Thirumurthy, H. Political partisanship influences behavioral responses to governors’ recommendations for COVID-19 prevention in the United States. Proc. Natl. Acad. Sci. USA 2020, 117, 24144–24153. [Google Scholar]
- Neelon, B.; Mutiso, F.; Mueller, N.T.; Pearce, J.L.; Benjamin-Neelon, S.E. Associations Between Governor Political Affiliation and COVID-19 Cases, Deaths, and Testing in the U.S. Am. J. Prev. Med. 2021, 61, 115–119. [Google Scholar] [CrossRef]
- Van Esch, P.; Gui, Y.; Pratap Jain, S. The effect of political ideology and message frame on donation intent during the COVID-19 pandemic. J. Bus. Res. 2021, 125, 201–213. [Google Scholar] [CrossRef]
- OECD. City Polity Responses. Available online: https://www.oecd.org/coronavirus/policy-responses/cities-policy-responses-fd1053ff/ (accessed on 7 May 2021).
- Yin Tung Kwok, C.; Sing Wong, M.; Long Chan, K.; Kwan, M.; Nichol, J.E.; Ho Liu, C.; Yuen Ha Wong, J.; Ka Chung Wai, A.; Wing Chi Chan, L.; Xu, Y.; et al. Spatial analysis of the impact of urban geometry and socio-demographic characteristics on COVID-19, a study in Hong Kong. Sci. Total. Environ. 2021, 764, 1444555. [Google Scholar]
- Viezzer, J.; Biondi, D. The influence of urban, socio-economic, and eco-environmental aspects on COVID-19 cases, deaths and mortality: A multi-city case in the Atlantic Forest, Brazil. Sustain. Cities Soc. 2021, 69, 102859. [Google Scholar] [CrossRef]
- Liu, L. Emerging study on the transmission of the Novel Coronavirus (COVID-19) from urban perspective: Evidence from China. Cities 2020, 103, 102759. [Google Scholar] [CrossRef] [PubMed]
- Ahmad, K.; Erqou, S.; Shah, N.; Nazir, U.; Morrison, A.R.; Choudhary, G.; Wu, W. Association of poor housing conditions with COVID-19 incidence and mortality across US counties. PLoS ONE. 2020, 15, e0241327. [Google Scholar] [CrossRef] [PubMed]
- Lai, S.; Leone, F.; Zoppi, C. Covid-19 and Spatial Planning. TEMA 2020, 231–246. Available online: https://iris.unica.it/handle/11584/291949#.YUxNWBYRWUk (accessed on 24 September 2021).
- Megahed, N.A.; Ghoneim, E.M. Antivirus-built environment: Lessons learned from Covid-19 pandemic. Sustain. Cities Soc. 2020, 61, 102350. [Google Scholar] [CrossRef] [PubMed]
- Macarrón Larumbe, A.; Leguina Herrán, J. Demografía y COVID-19; Observatorio Demográfico CEU; Universidad de San Pablo: Madrid, Spain, 2020; Available online: https://www.uspceu.com/portals/0/docs/prensa/noticias/original/9036.pdf (accessed on 27 September 2021).
- Mercader-Moyano, P.; Flores-García, M.; Serrano-Jiménez, A. Housing and neighbourhood diagnosis for ageing in place: Multidimensional Assessment System of the Built Environment (MASBE). Sustain. Cities Soc. 2020, 62, 102422. [Google Scholar] [CrossRef] [PubMed]
- Instituto Nacional de Estadística (INE). Número de Hogares por Provincias Según Tipo de Hogar Y Número de Habitaciones de la Vivienda. Available online: https://www.ine.es/jaxi/Tabla.htm?path=/t20/p274/serie/def/p03/l0/&file=03003.px&L=0 (accessed on 20 June 2021).
- Instituto Nacional de Estadística (INE). Número de Hogares Según el Tipo de Hogar y el Tipo de Edificio Donde se Encuentra la Vivienda. Available online: https://www.ine.es/jaxi/Tabla.htm?path=/t20/p274/serie/prov/p01/l0/&file=01013.px&L=0 (accessed on 21 June 2021).
- Lauf, S.; Haase, D.; Seppelt, R.; Scwarz, N. Simulating Demography and Housing Demand in an Urban Region under Scenarios of Growth and Shrinkage. Environ. Plan. B Plan. Des. 2012, 39, 229–246. [Google Scholar] [CrossRef]
- Mercader-Moyano, P.; Morat, O.; Serrano-Jiménez, A. Urban and social vulnerability assessment in the built environment: An interdisciplinary index-methodology towards feasible planning and policy-making under a crisis context. Sustain. Cities Soc. 2021, 73, 103082. [Google Scholar] [CrossRef]
- Fatourehchi, D.; Zarghami, E. Social sustainability assessment framework for managing sustainable construction in residential buildings. J. Build. Eng. 2020, 32, 101761. [Google Scholar] [CrossRef]
- López Chao, A.; Caseres Gallego, A.; López-Chao, V. Indicators Framework for Sustainable Urban Design. Atmosphere 2020, 11, 1143. [Google Scholar] [CrossRef]
- Monzón, M.; López-Mesa, B. Buildings performance indicators to prioritise multi-family housing renovations. Sustain. Cities Soc. 2018, 38, 109–122. [Google Scholar] [CrossRef]
- Verma, P.; Raghubanshi, A.S. Urban sustainability indicators: Challenges and opportunities. Ecol. Ind. 2018, 93, 282–291. [Google Scholar] [CrossRef]
- Cohen, M. A Systematic Review of Urban Sustainability Assessment Literature. Sustainability 2017, 9, 2048. [Google Scholar] [CrossRef] [Green Version]
- Dizdaroglu, D. Developing micro-level urban ecosystem indicators for sustainability assessment. Environ. Impact Assess. Rev. 2015, 54, 119–124. [Google Scholar] [CrossRef]
- Braulio-Gonzalo, M.; Dolores Bovea, M.; Ruá, M.J. Sustainability on the urban scale: Proposal of a structure of indicators for the Spanish context. Environ. Impact Assess. Rev. 2015, 53, 16–30. [Google Scholar] [CrossRef] [Green Version]
- Atlas de la Edificación Residencial en España. Available online: https://www.mitma.gob.es/areas-de-actividad/arquitectura-vivienda-y-suelo/urbanismo-y-politica-de-suelo/observatorio-de-la-vulnerabilidad-urbana/atlas-de-la-edificacion-residencial-en-espan%CC%83a/atlas-de-la-edificacion-residencial#:~:text=El%20%E2%80%9CAtlas%20de%20la%20Edificaci%C3%B3n,los%20edificios%20destinados%20predominantemente%20a (accessed on 20 June 2021).
- Contaminación del aire de Palacio De Congresos, Granada. Available online: https://aqicn.org/map/spain/andalucia/granada/palacio-de-congresos/es/ (accessed on 14 May 2021).
- Huella Solar. Available online: https://www.huellasolar.com/ (accessed on 7 May 2021).
- Goolzoom. Available online: https://www.goolzoom.com/ (accessed on 7 May 2021).
- Titos, G.; Lyamani, H.; Drinovec, L.; Olmo, F.J.; Mocnik, G.; Alados-Arboledas, L. Evaluation of the impact of transportation changes on air quality. Atmos. Environ. 2015, 114, 19–31. [Google Scholar] [CrossRef]
- Ayuntamiento de Granada. Plan de Movilidad Urbana Sostenible. Available online: https://www.movilidadgranada.com/pmus_index.php (accessed on 22 June 2021).
- Hitchcock, G.; COnlan, B.; Kay, D.; Brannigan, C.; Newman, D. Air quality and road transport: Impacts and solutions. TRID 2016, 01530485. Available online: https://trid.trb.org/view/1316104 (accessed on 24 September 2021).
- Higueras, E. Urbanismo Bioclimático, 11th ed.; Gustavo Gili: Barcelona, Spain, 2010; pp. 123–186. [Google Scholar]

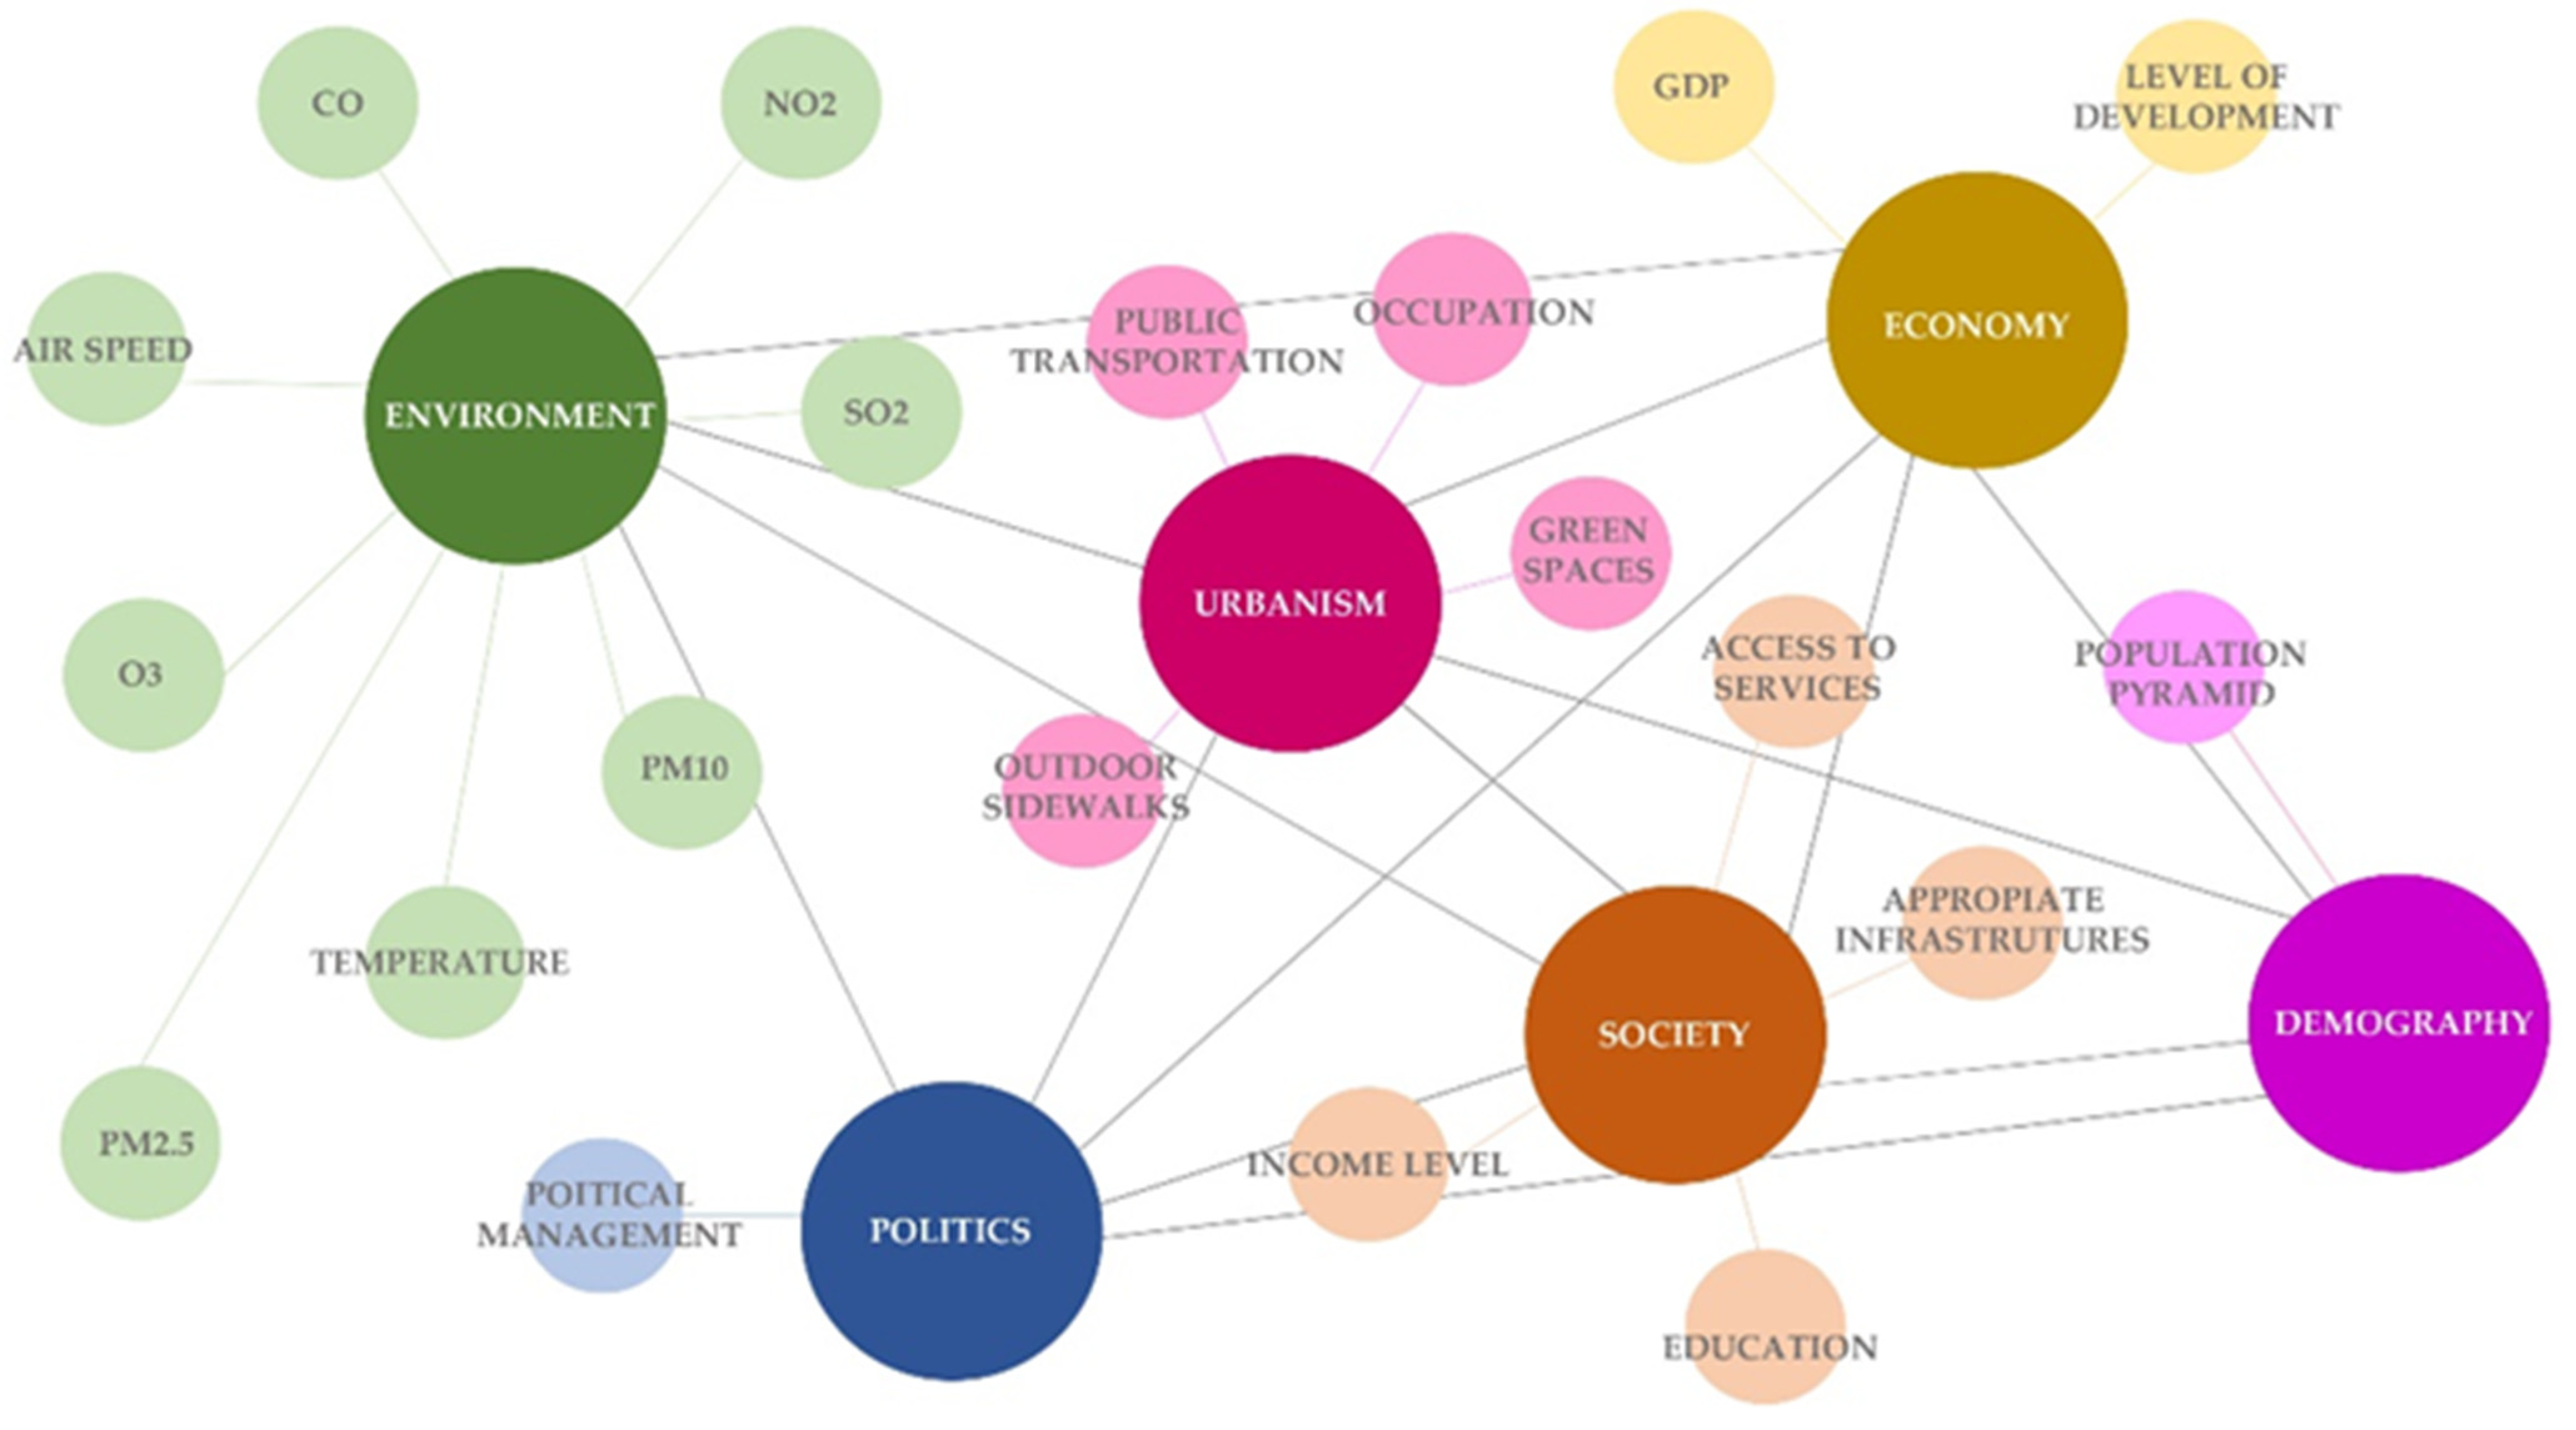
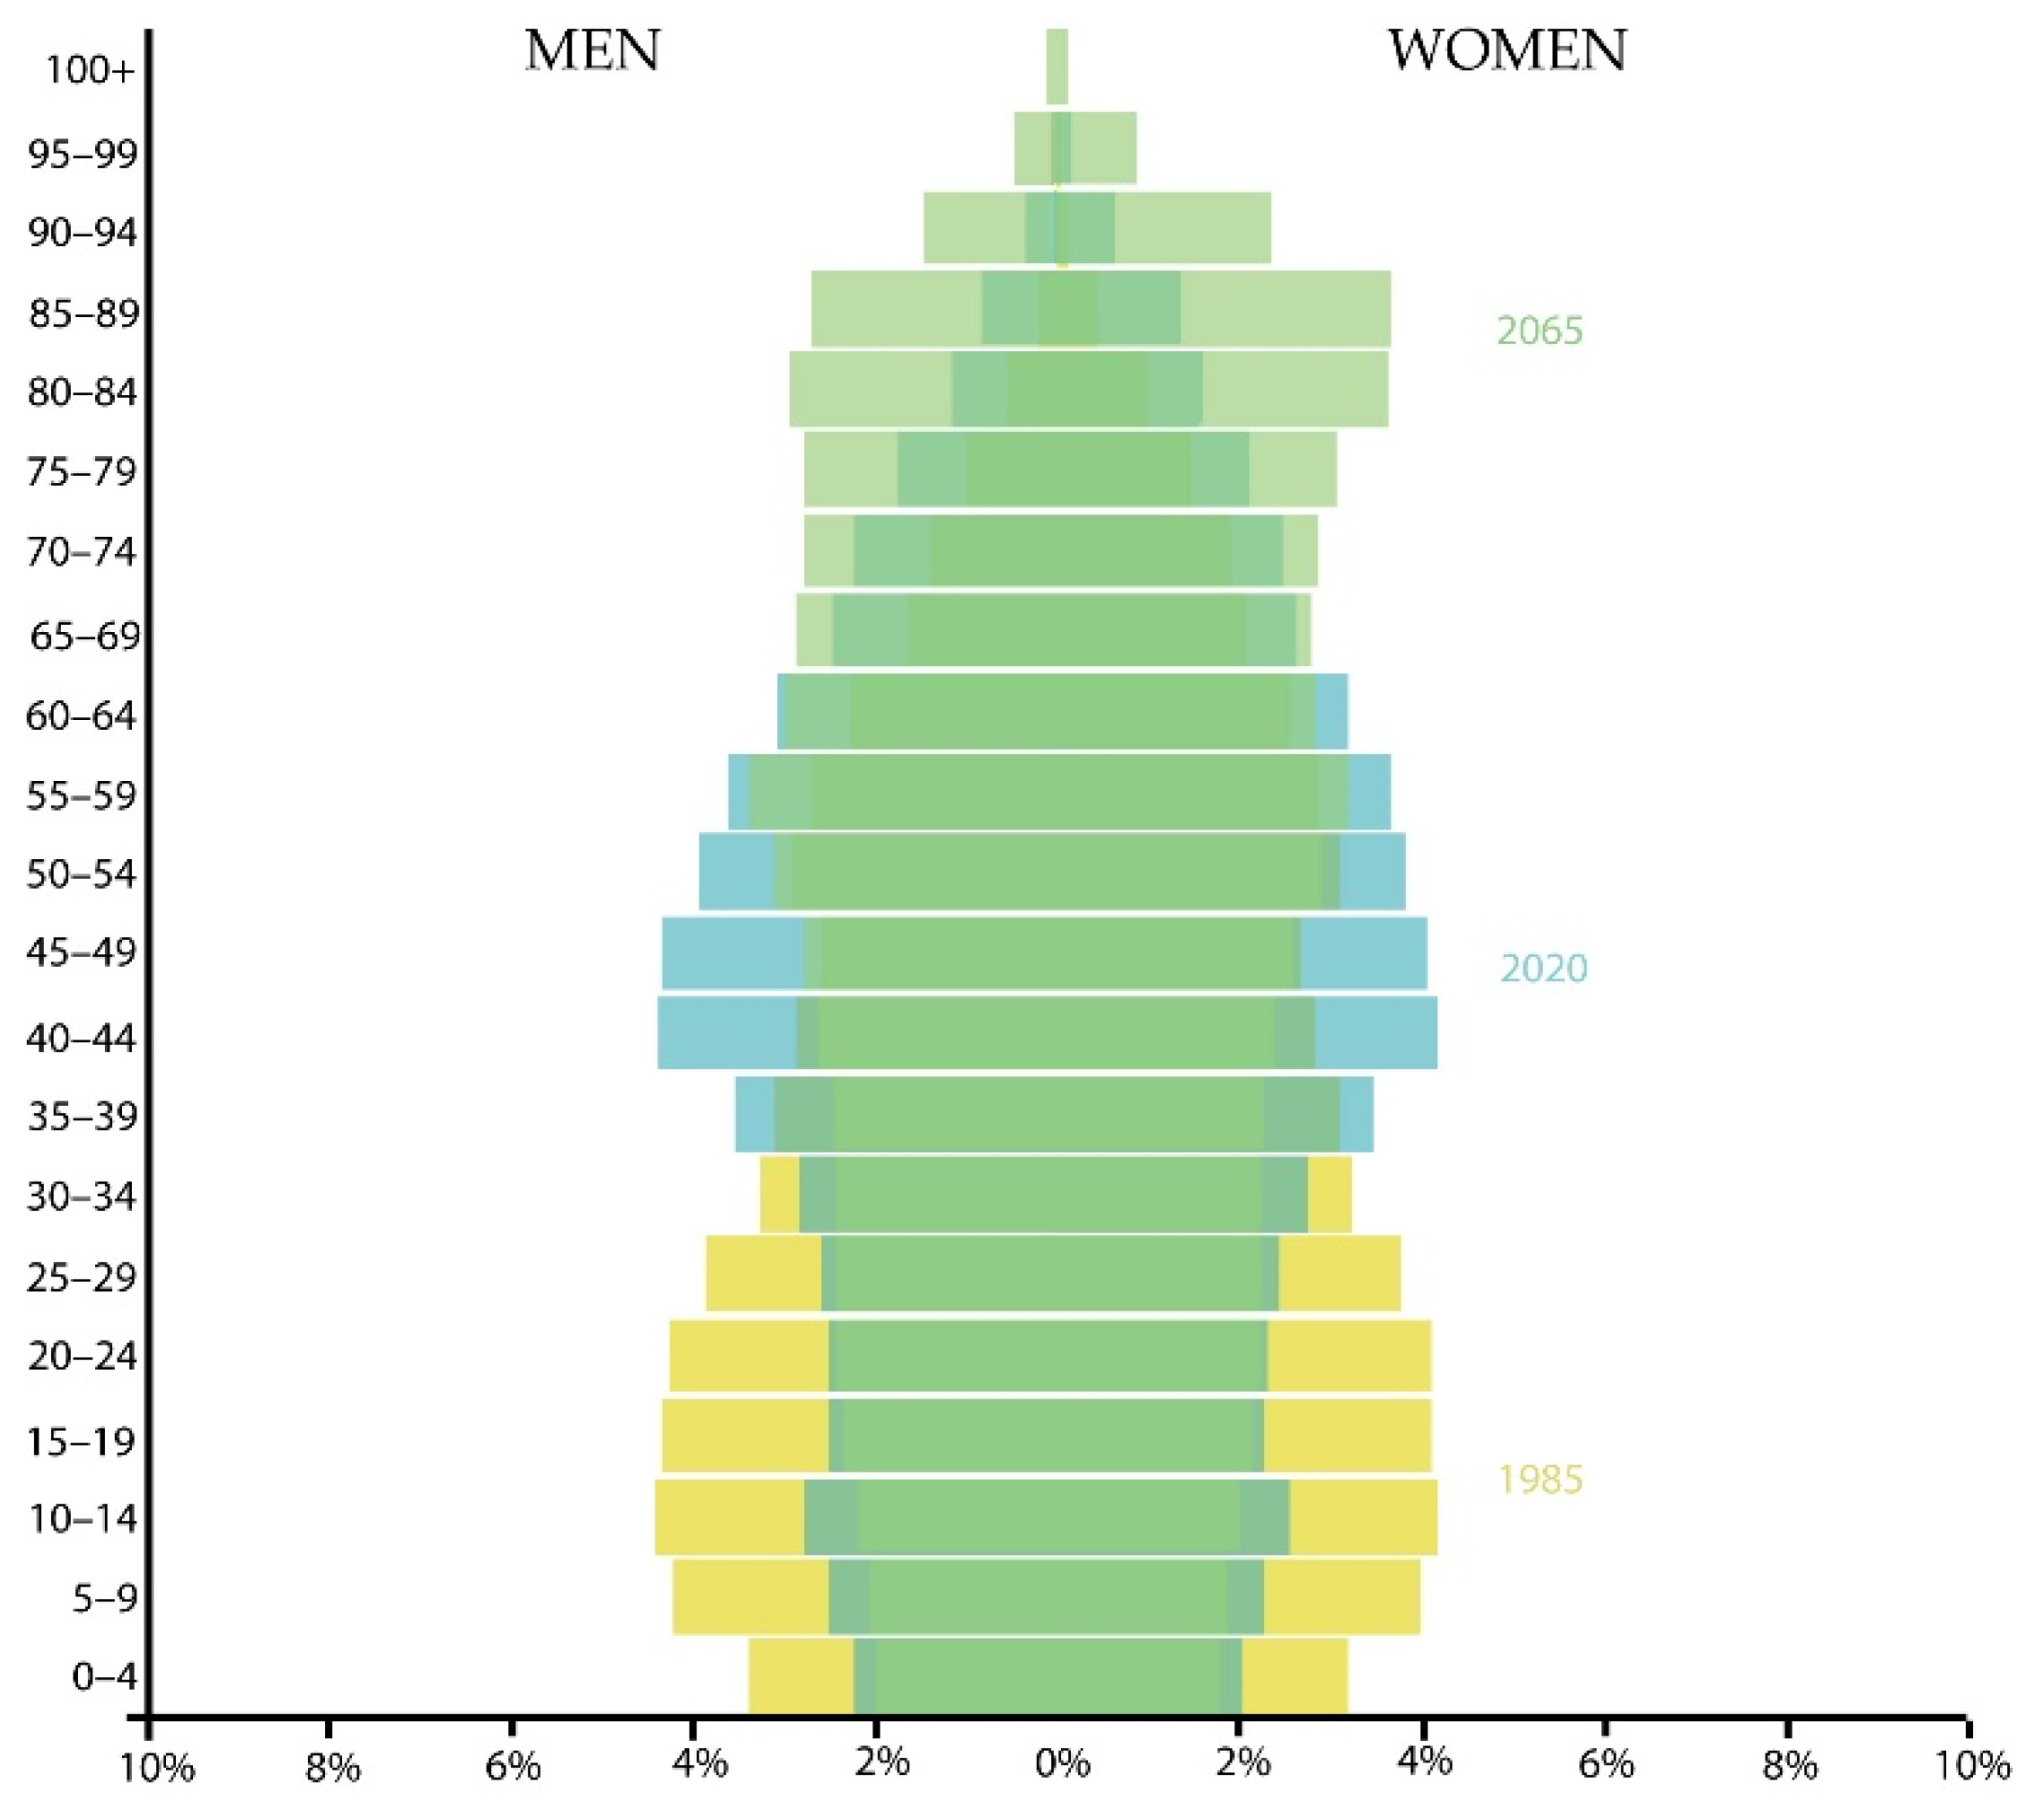
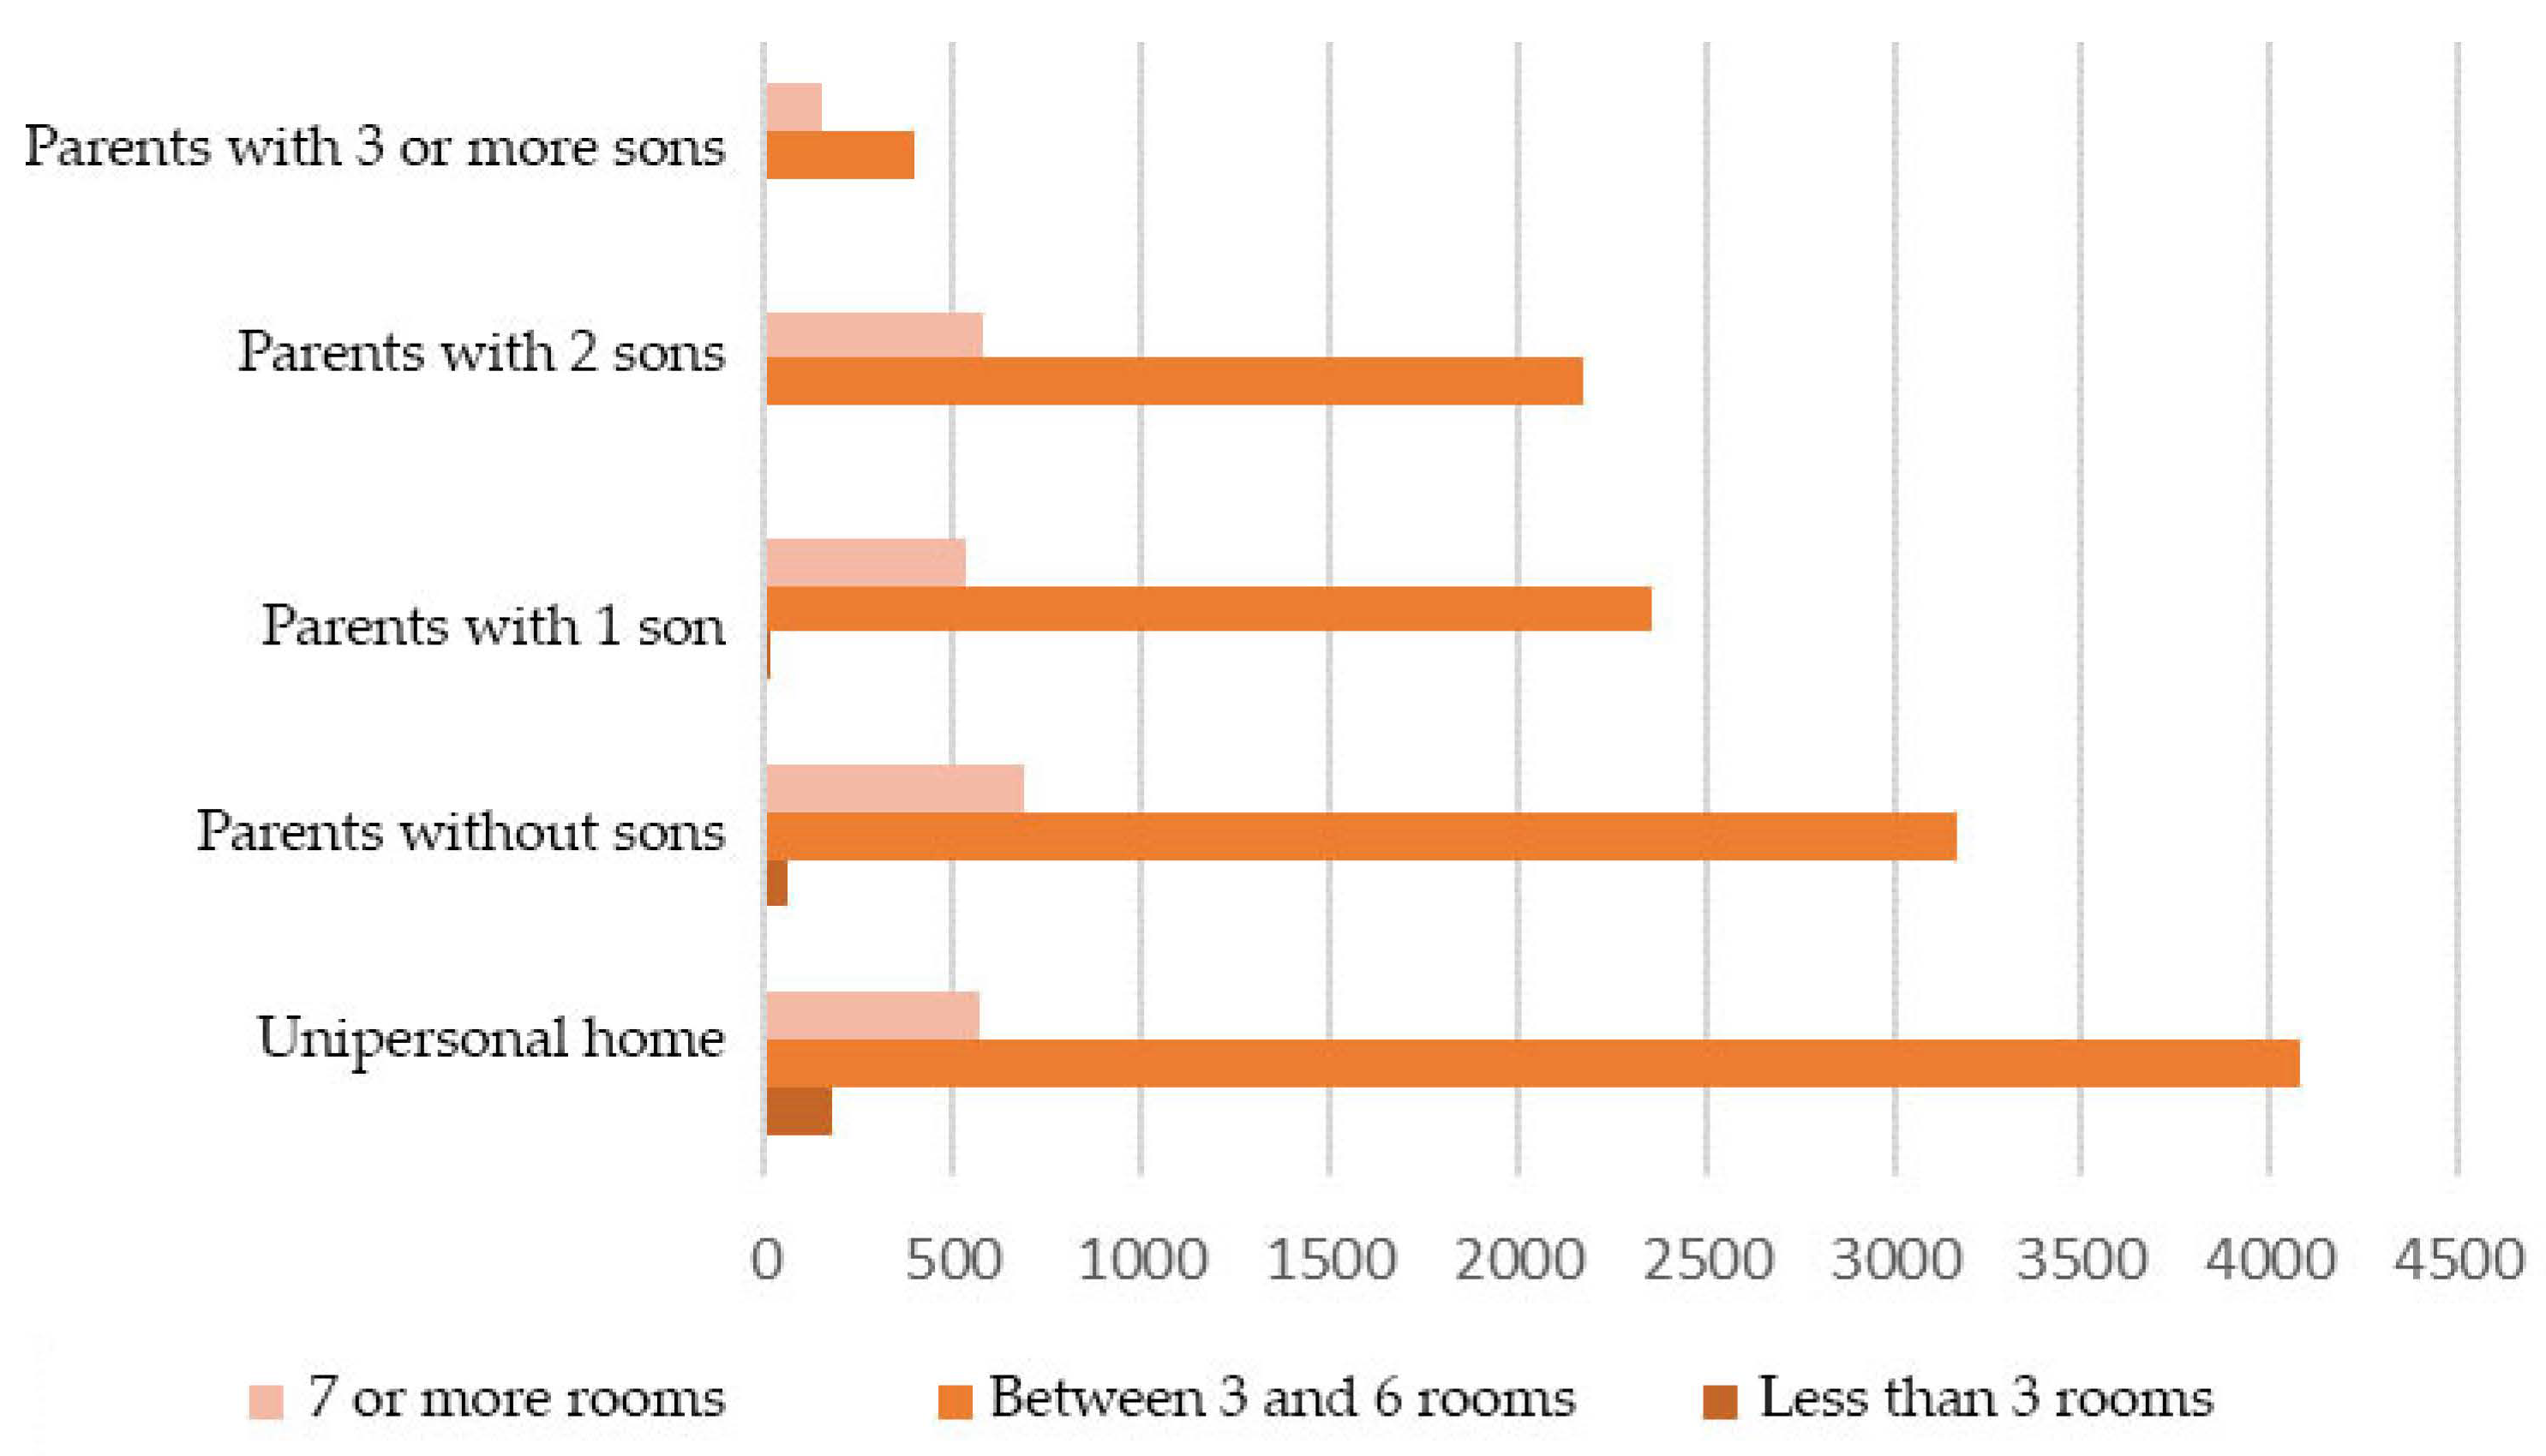
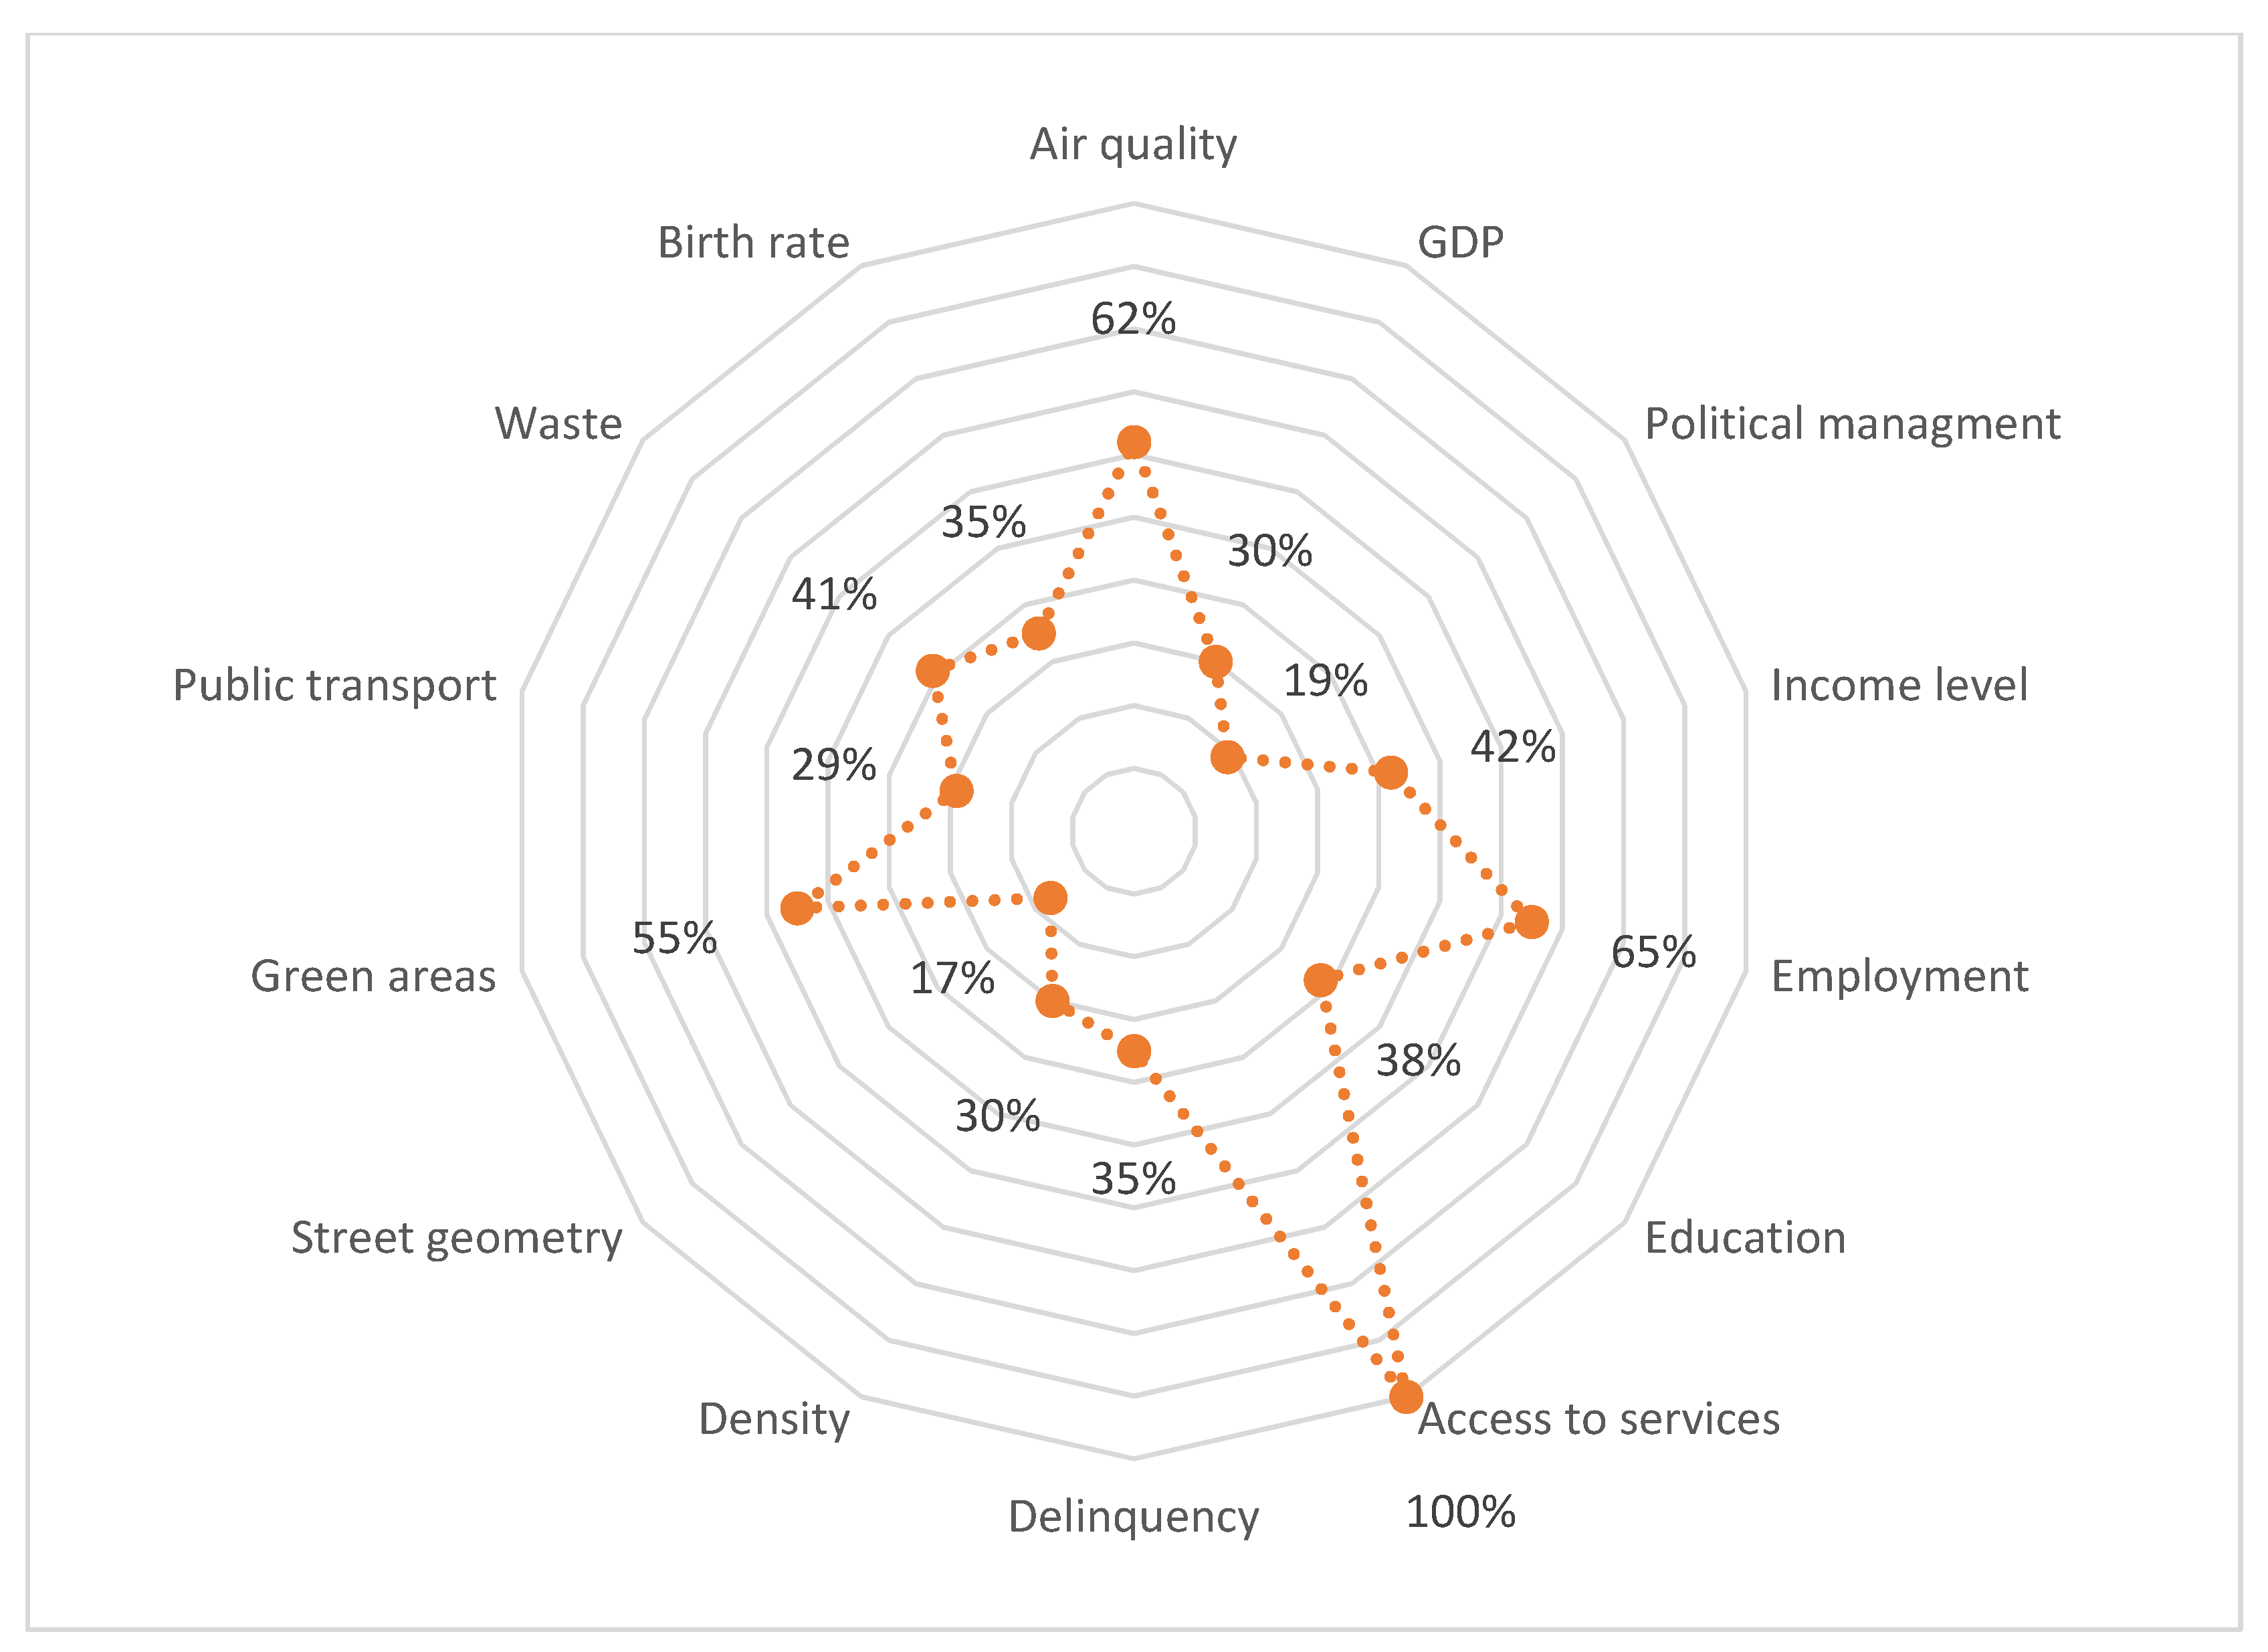
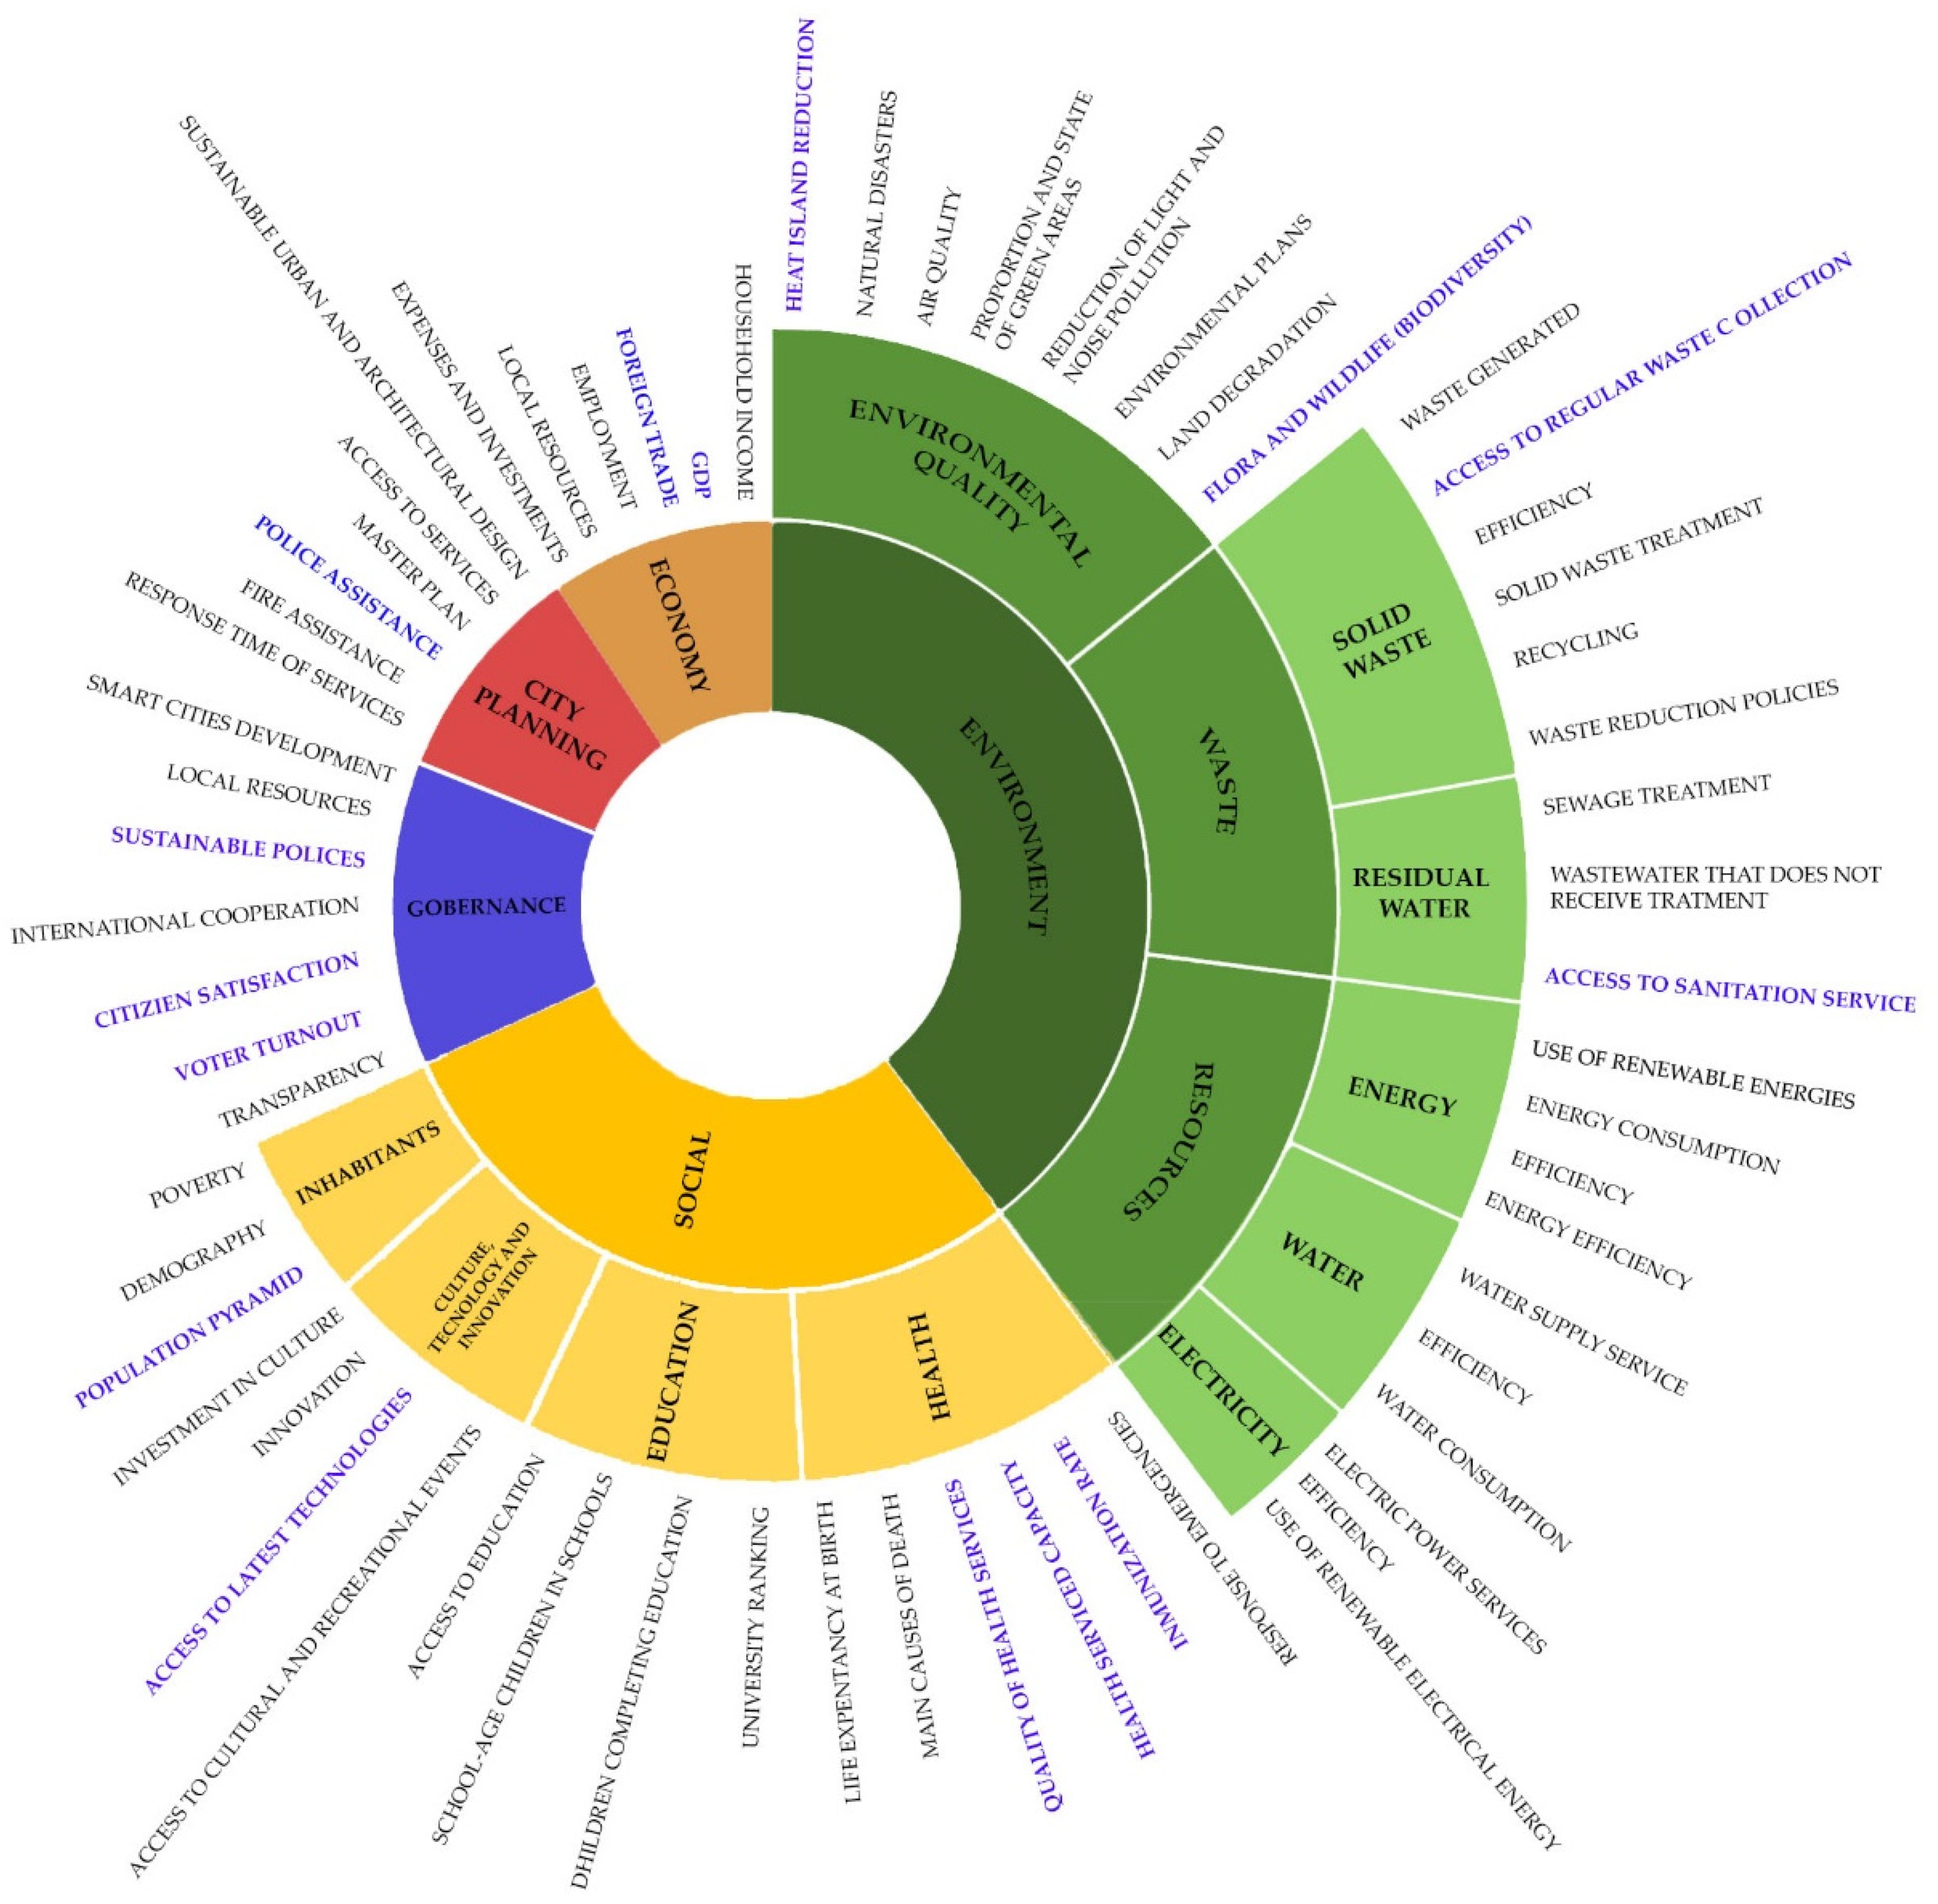
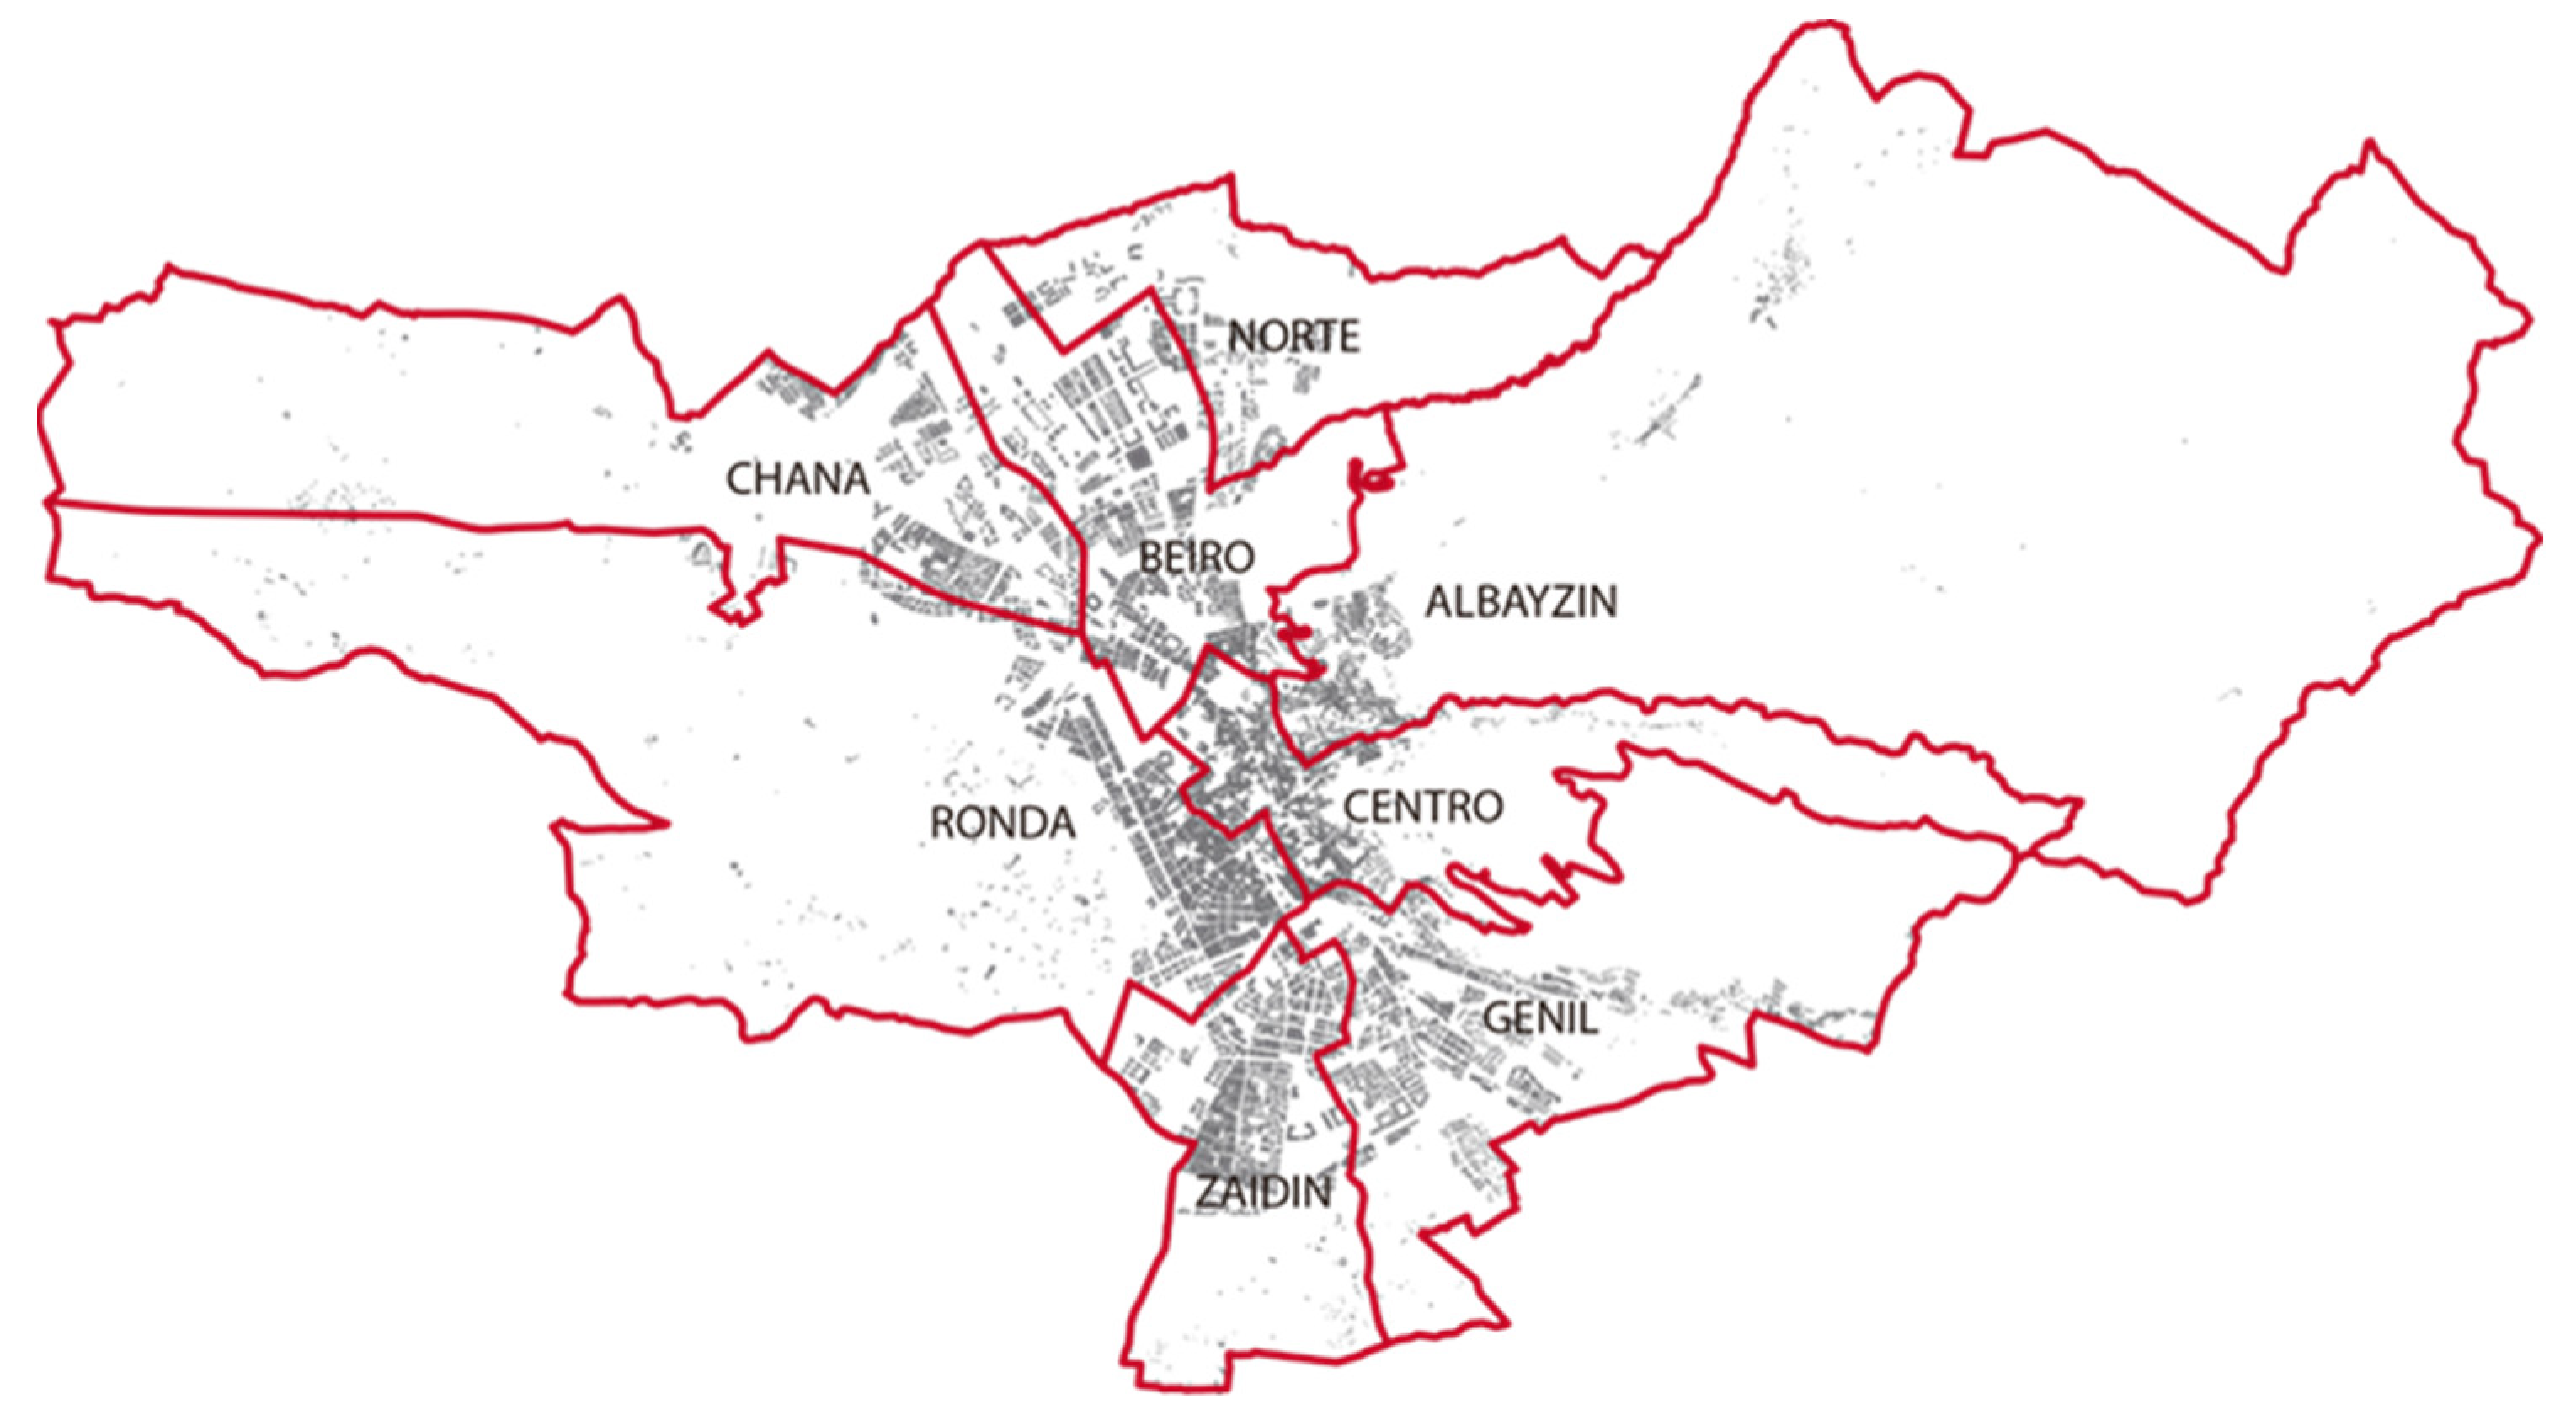

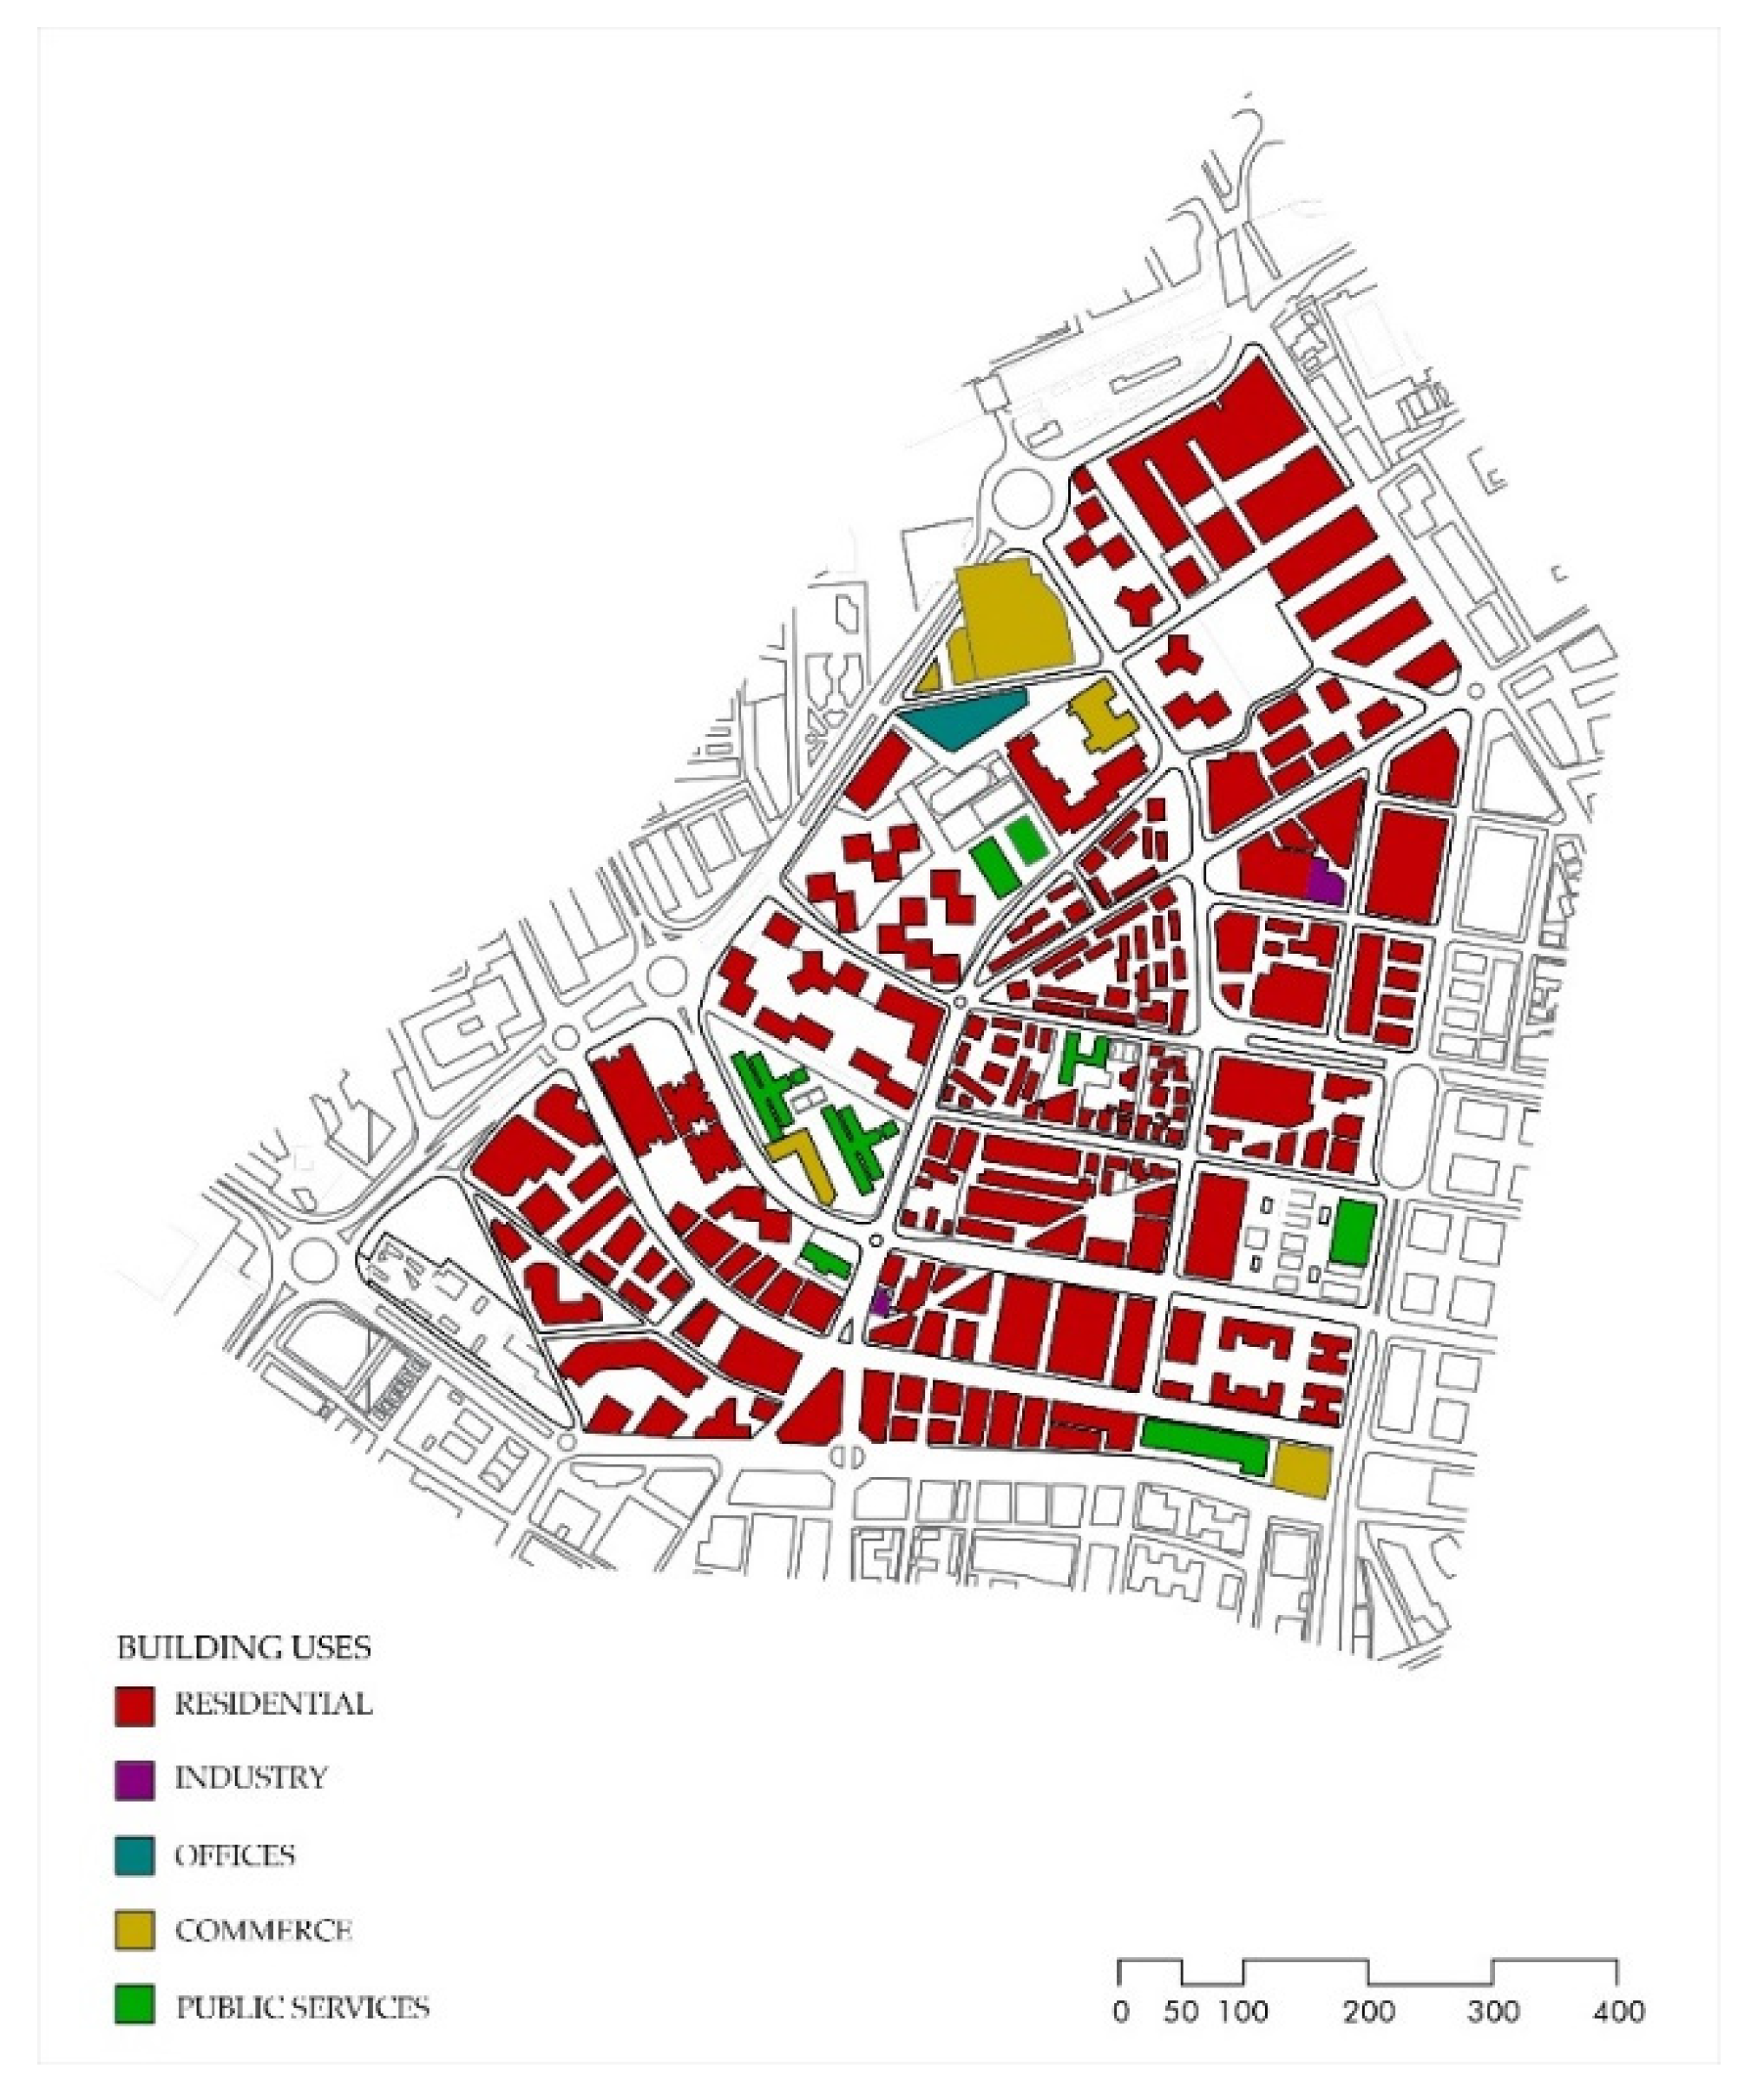

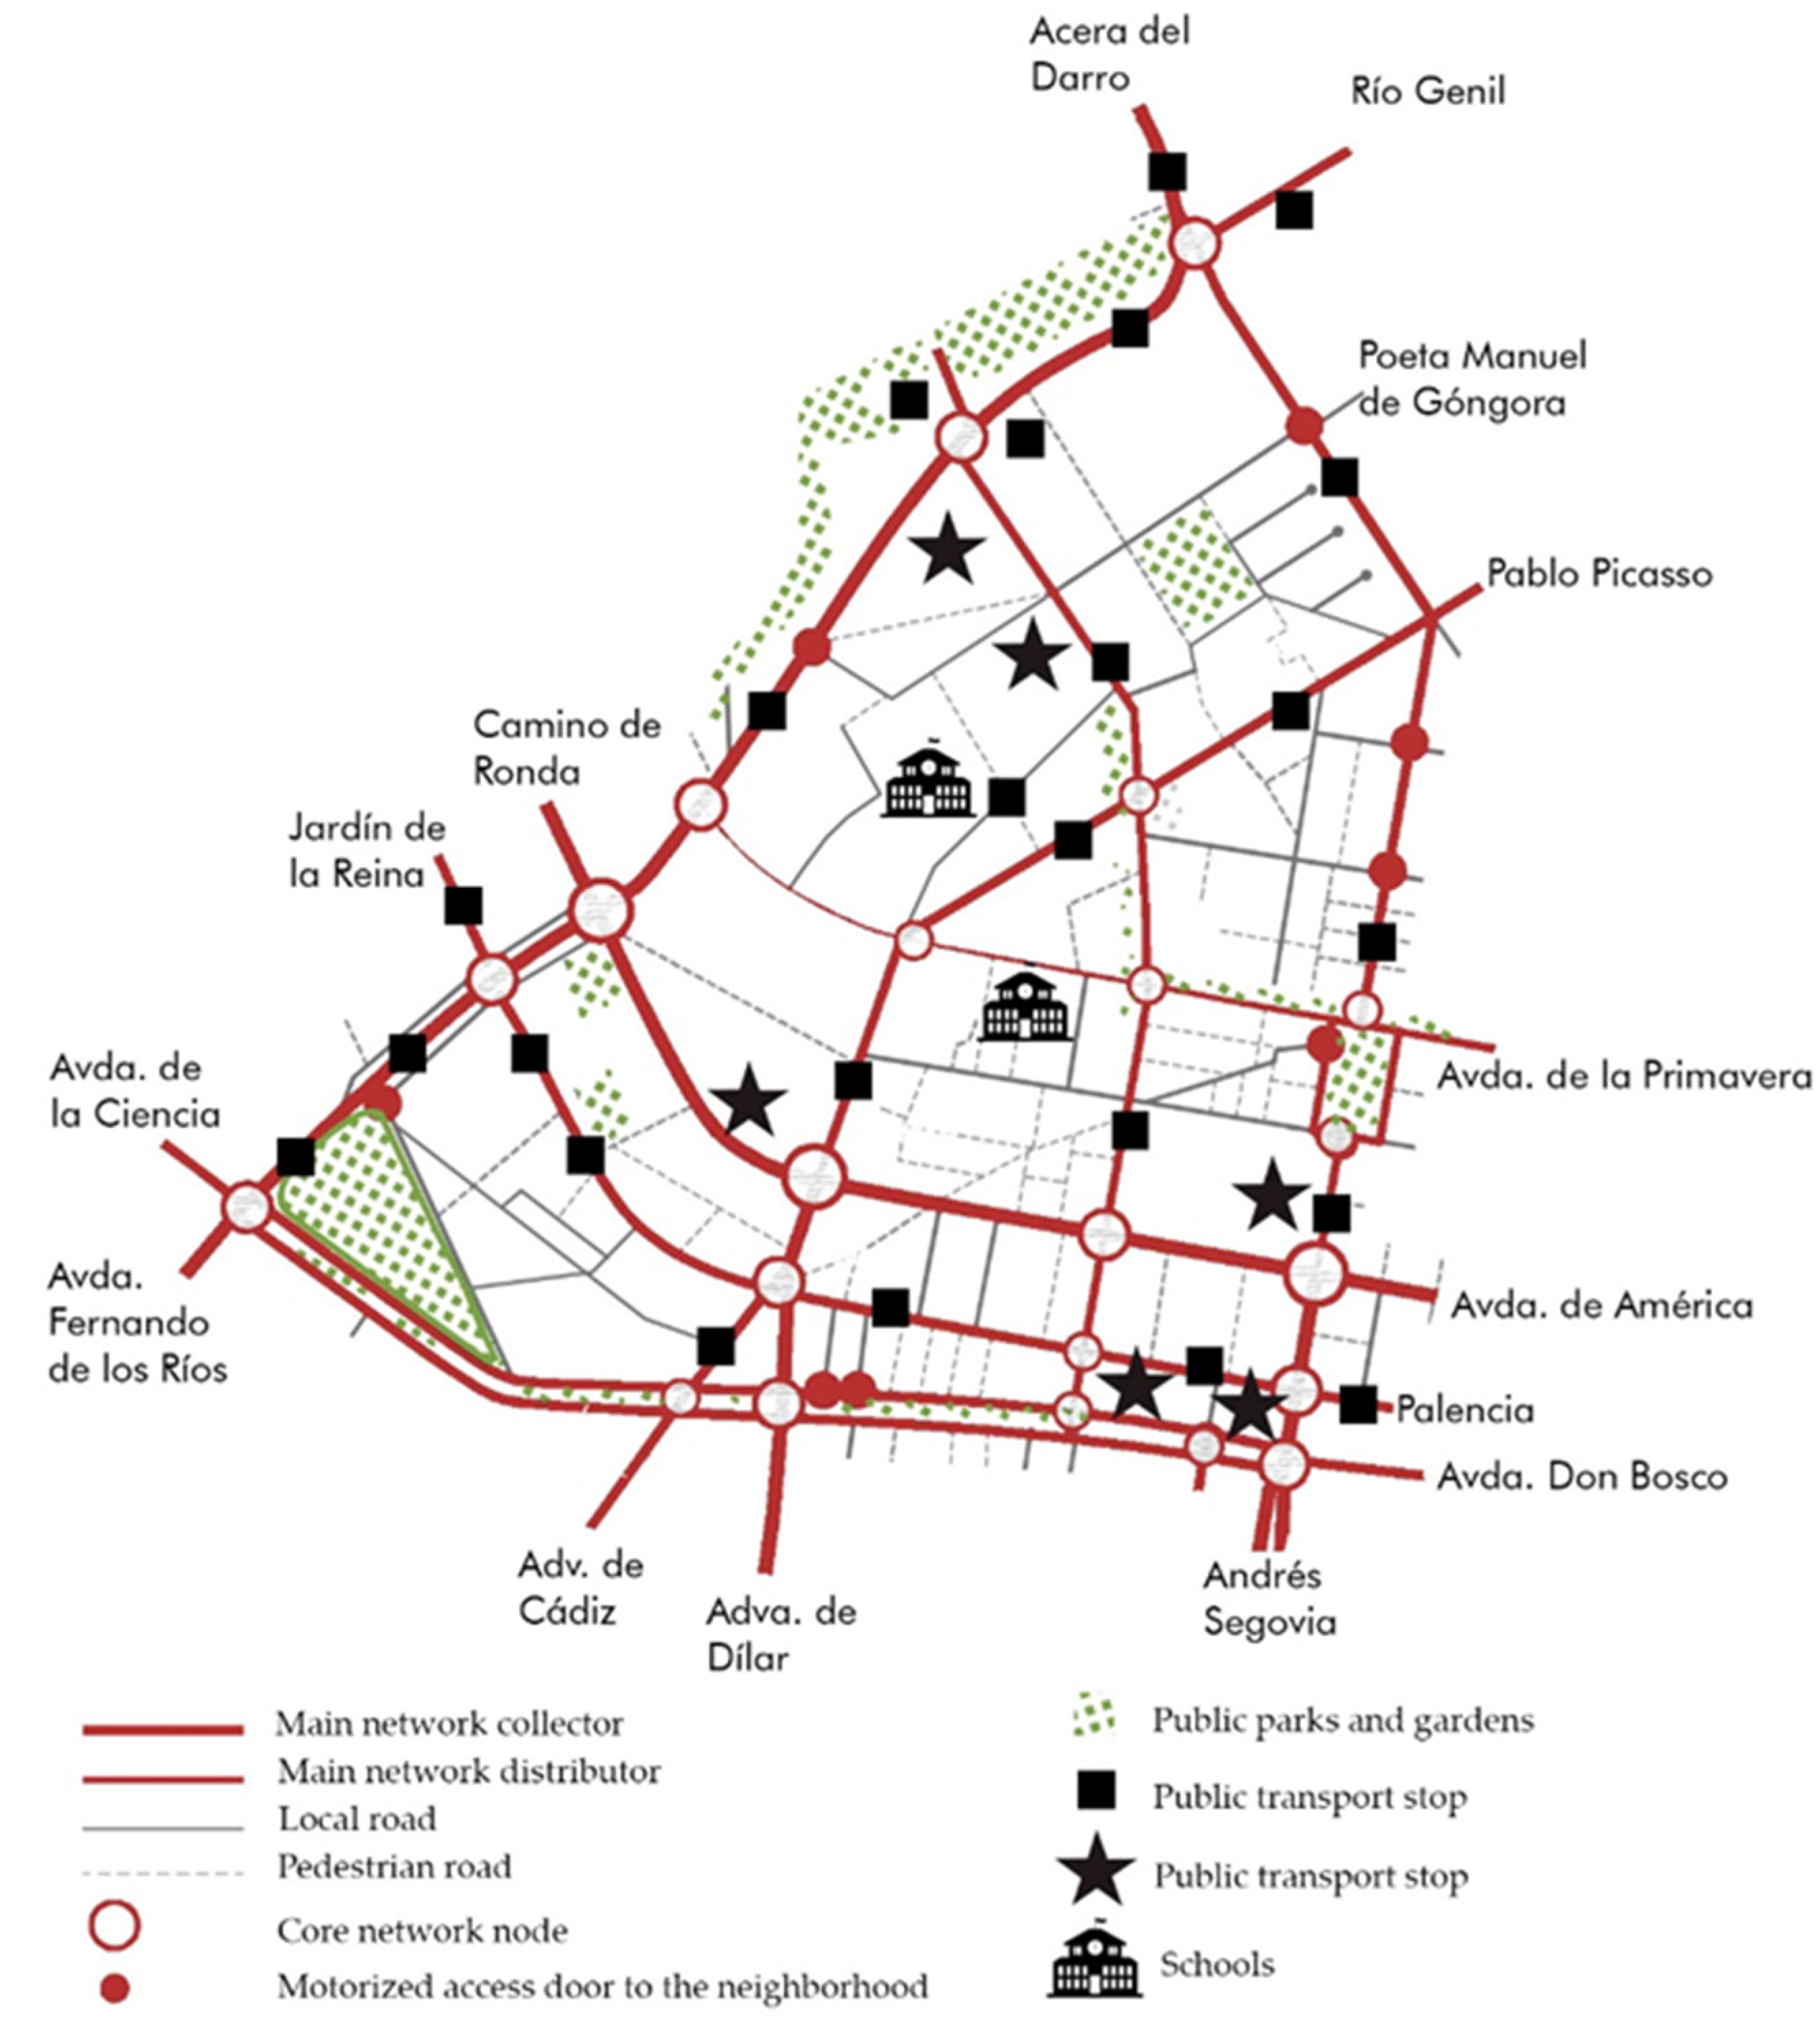
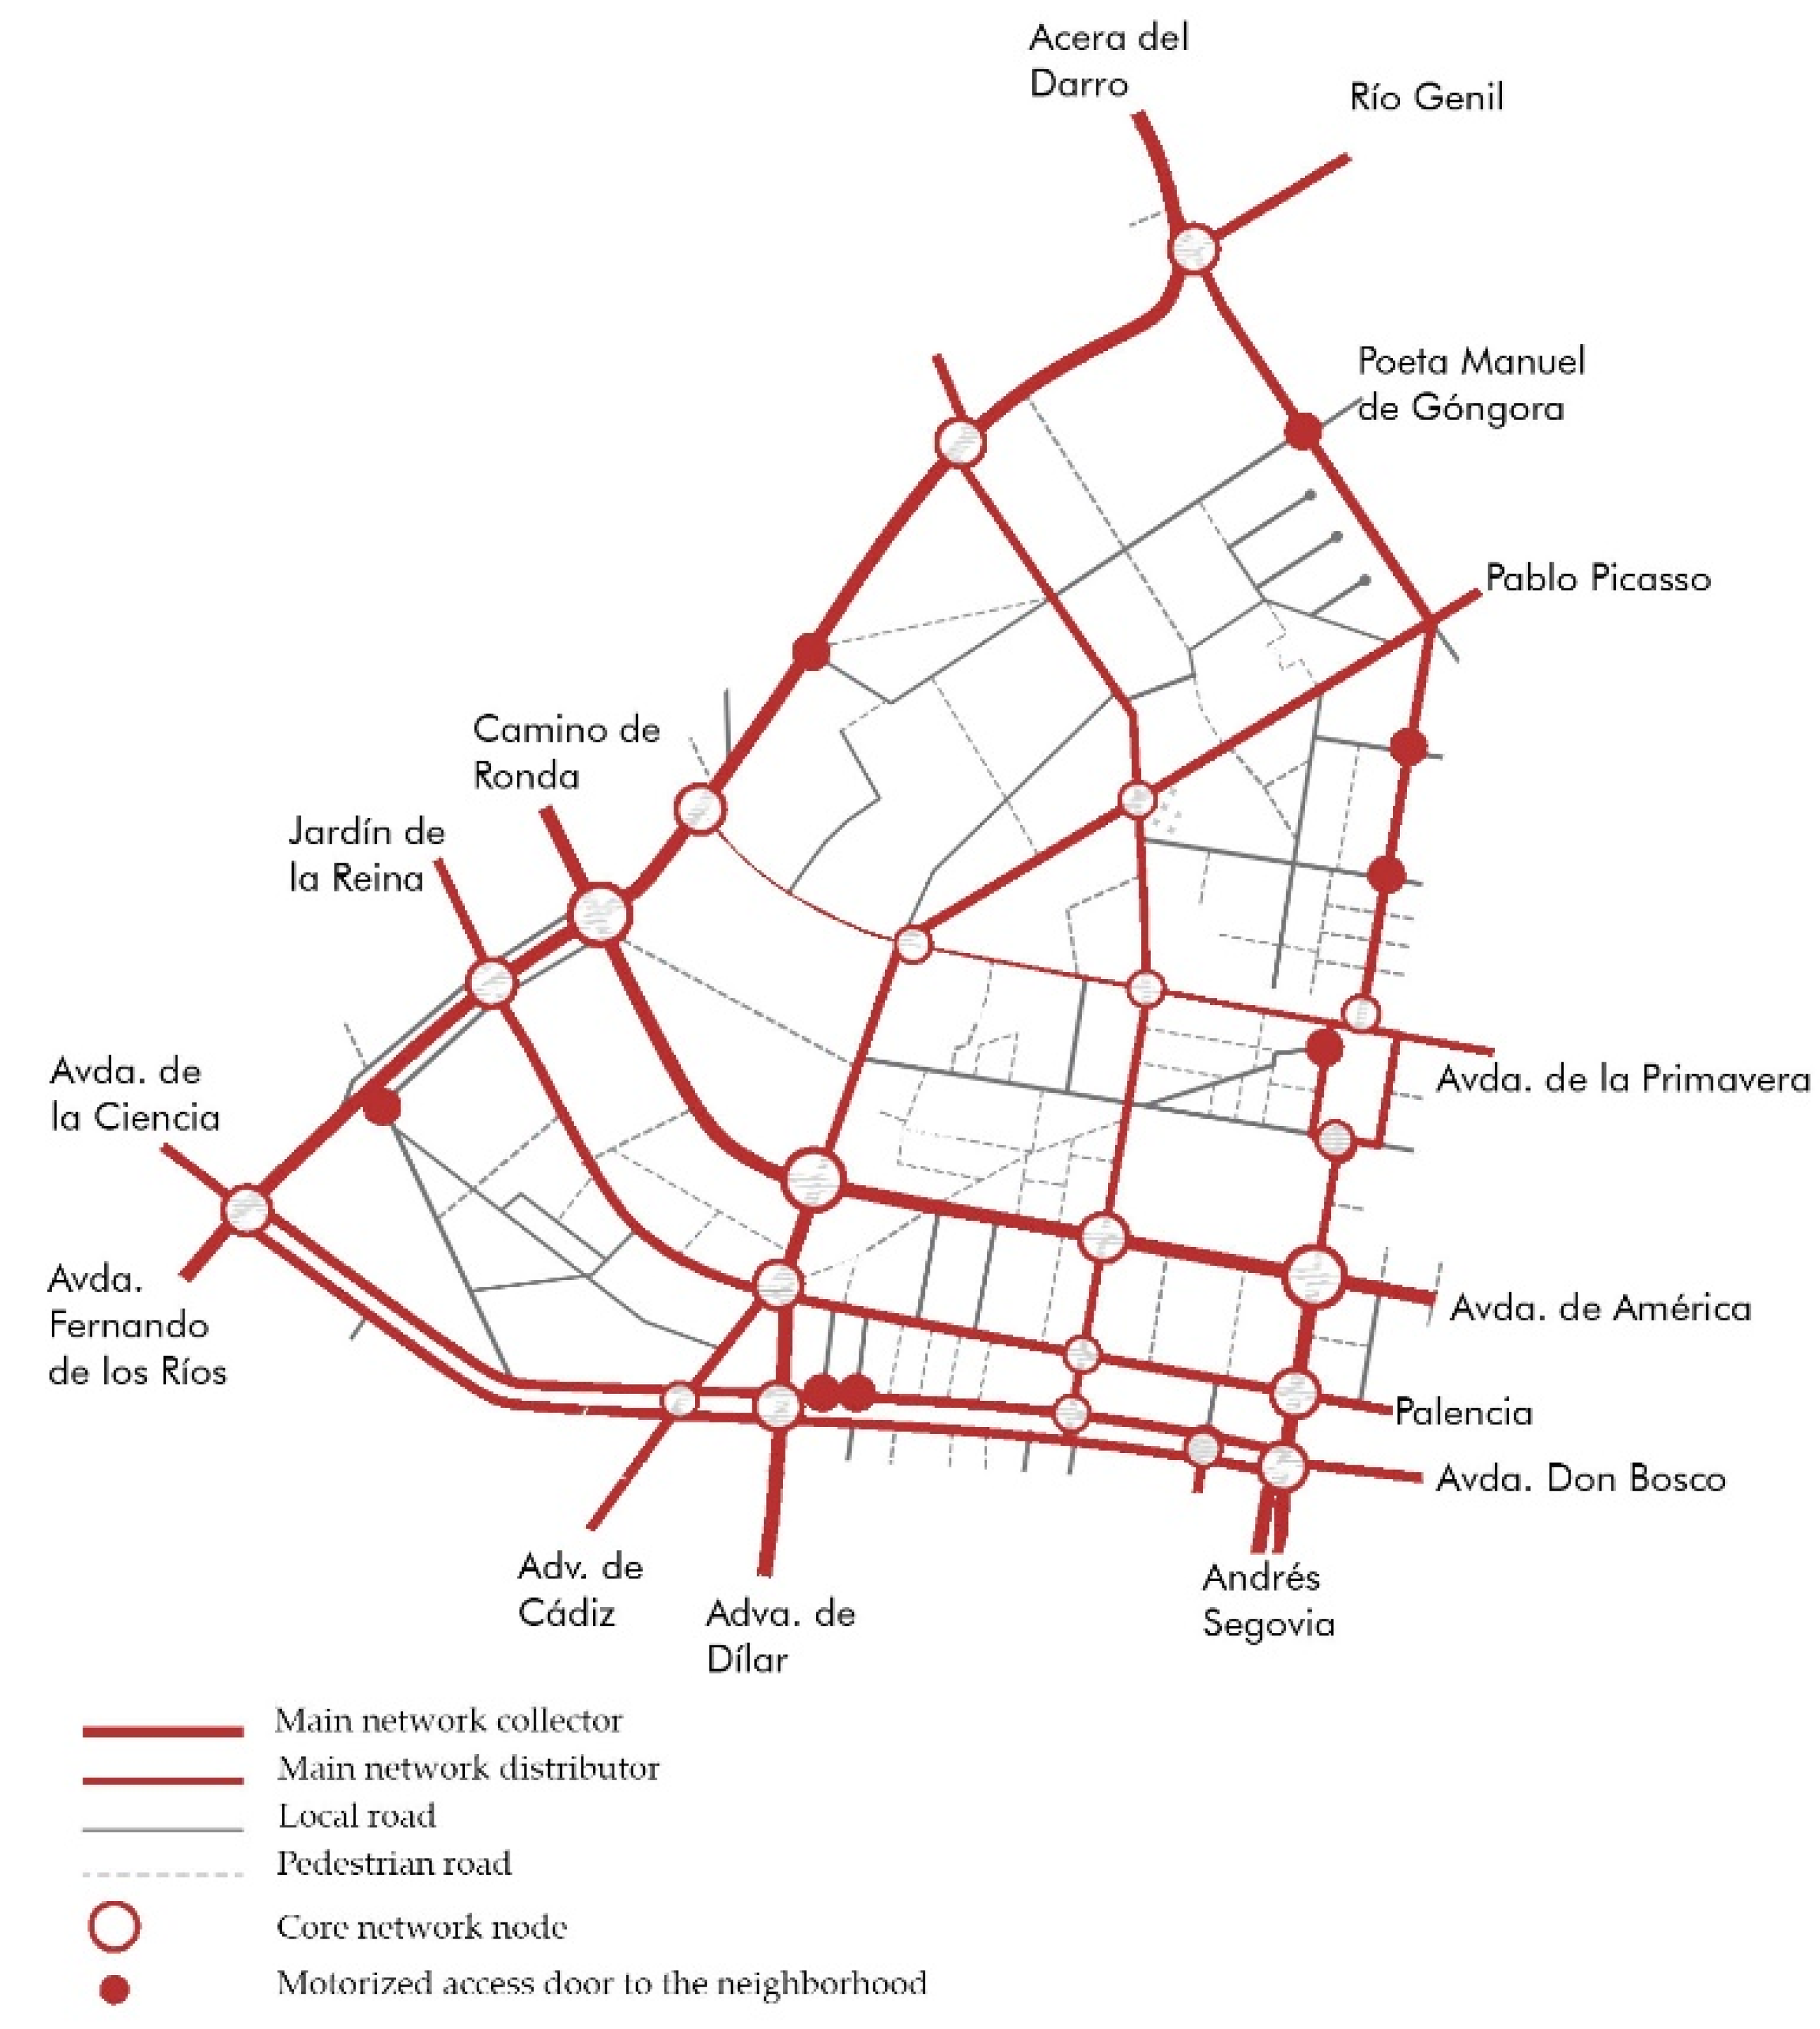

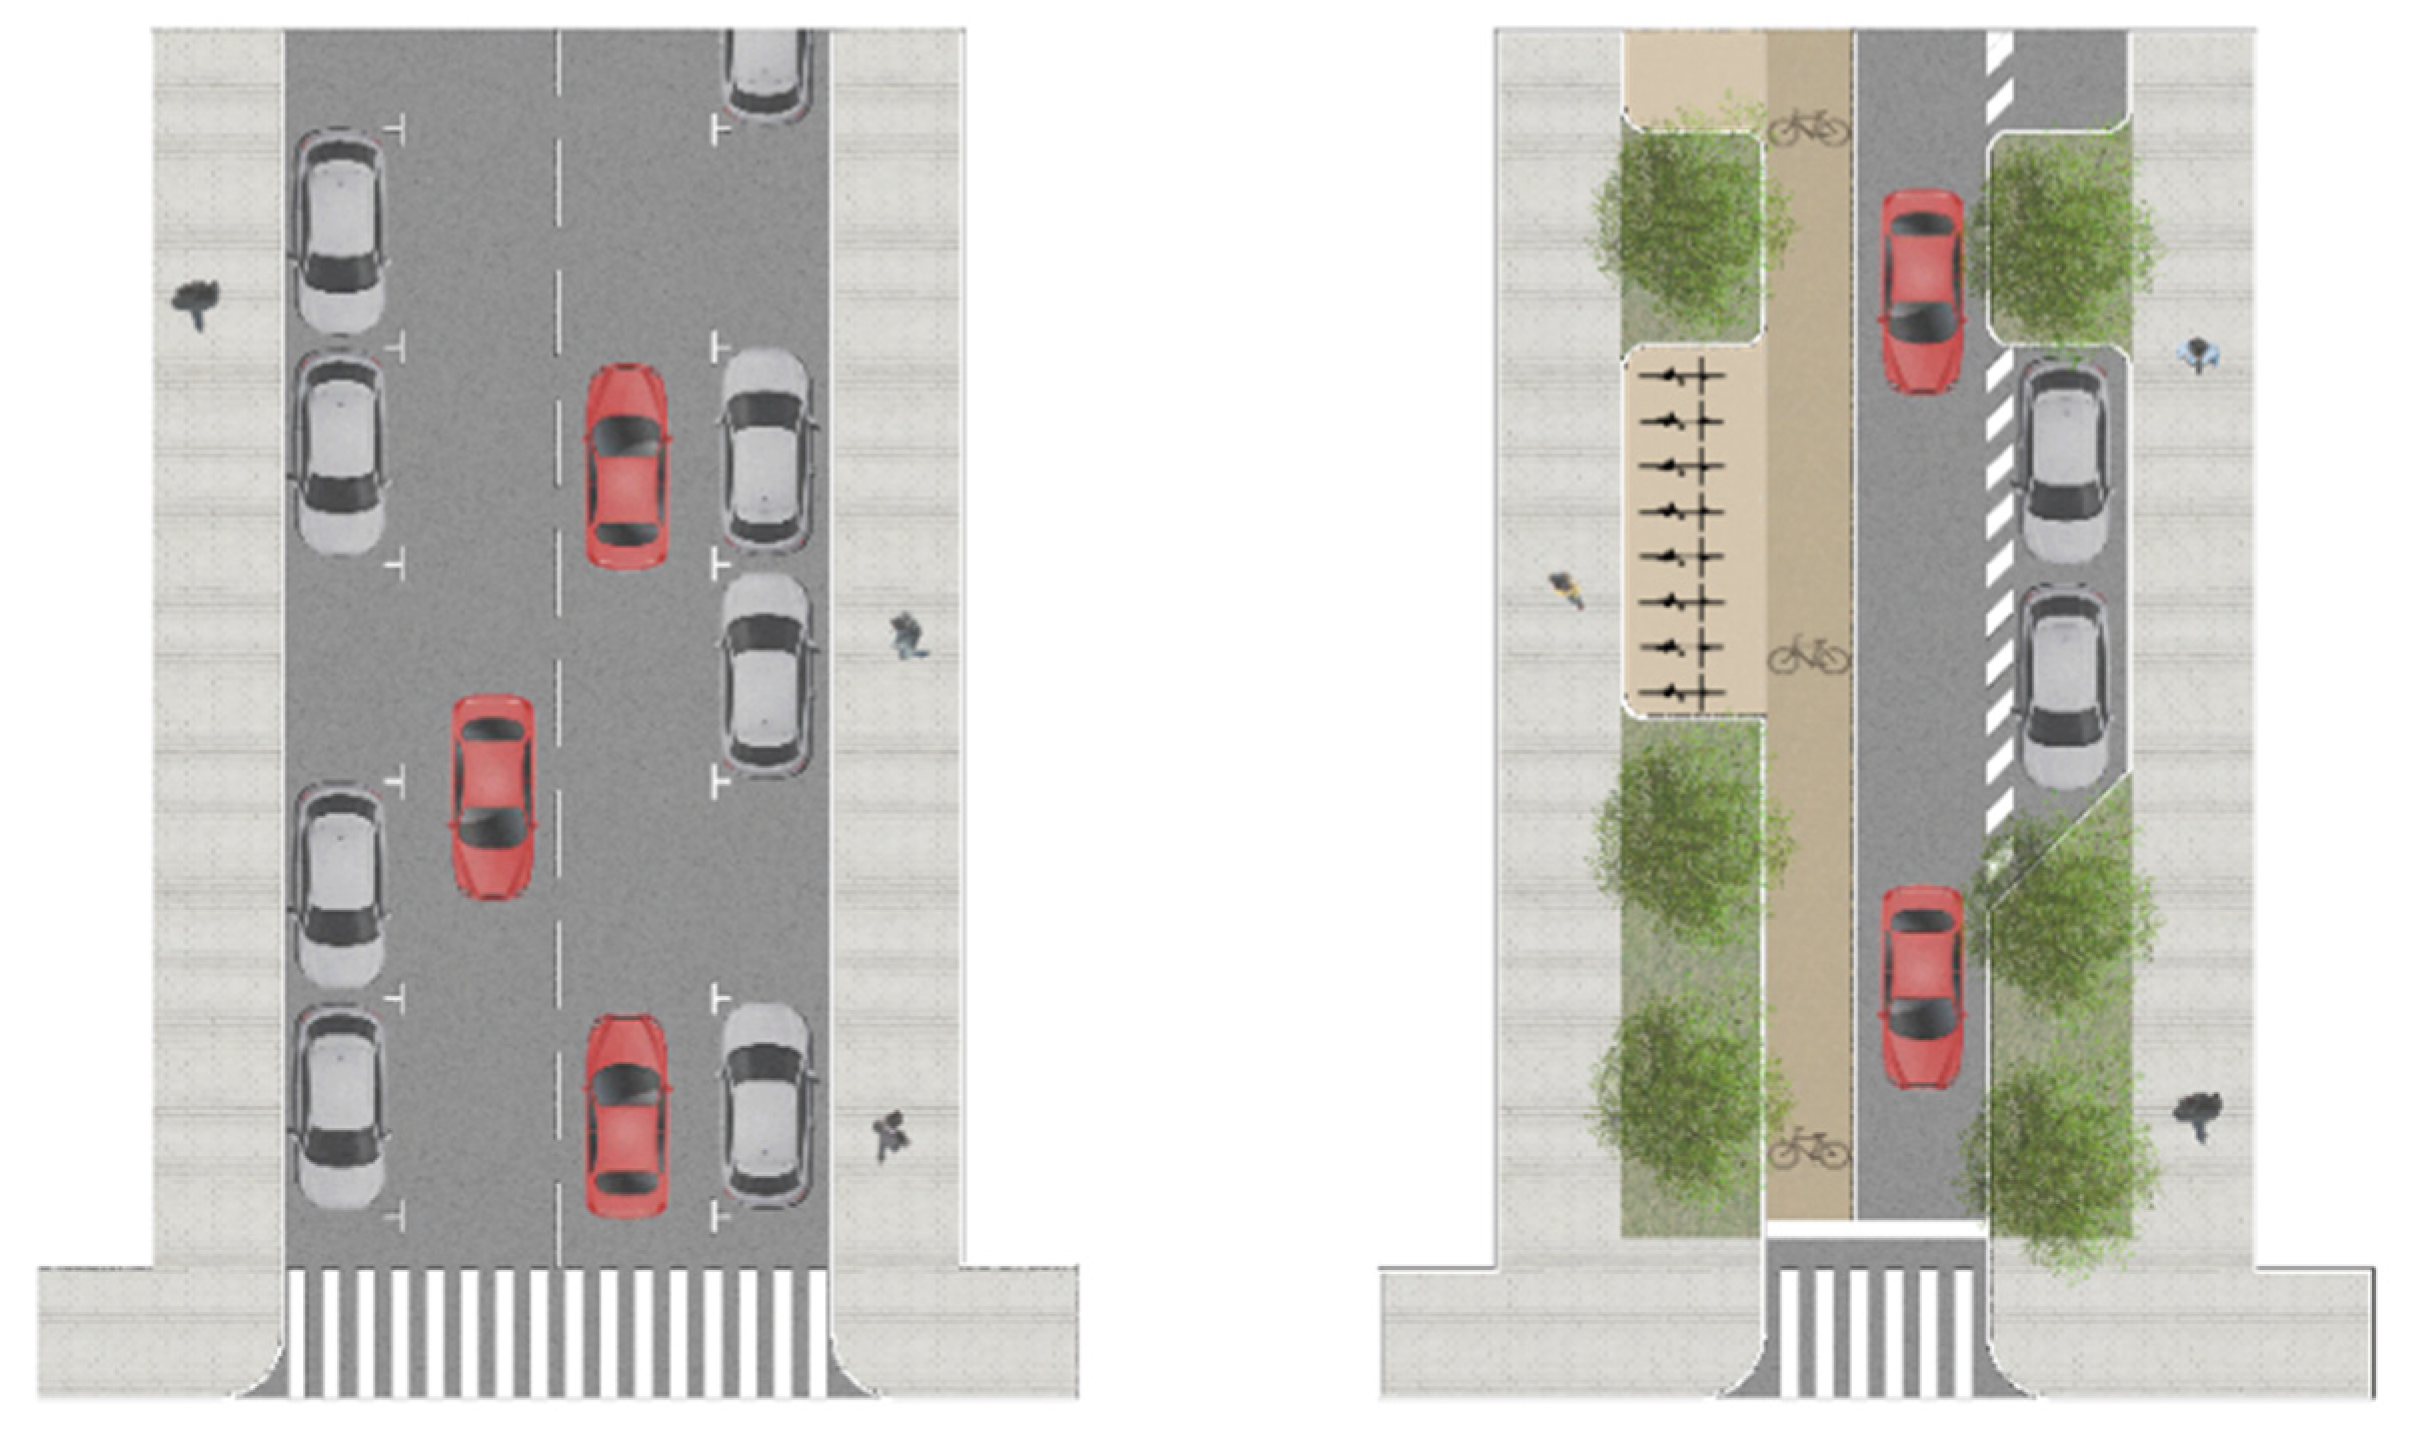
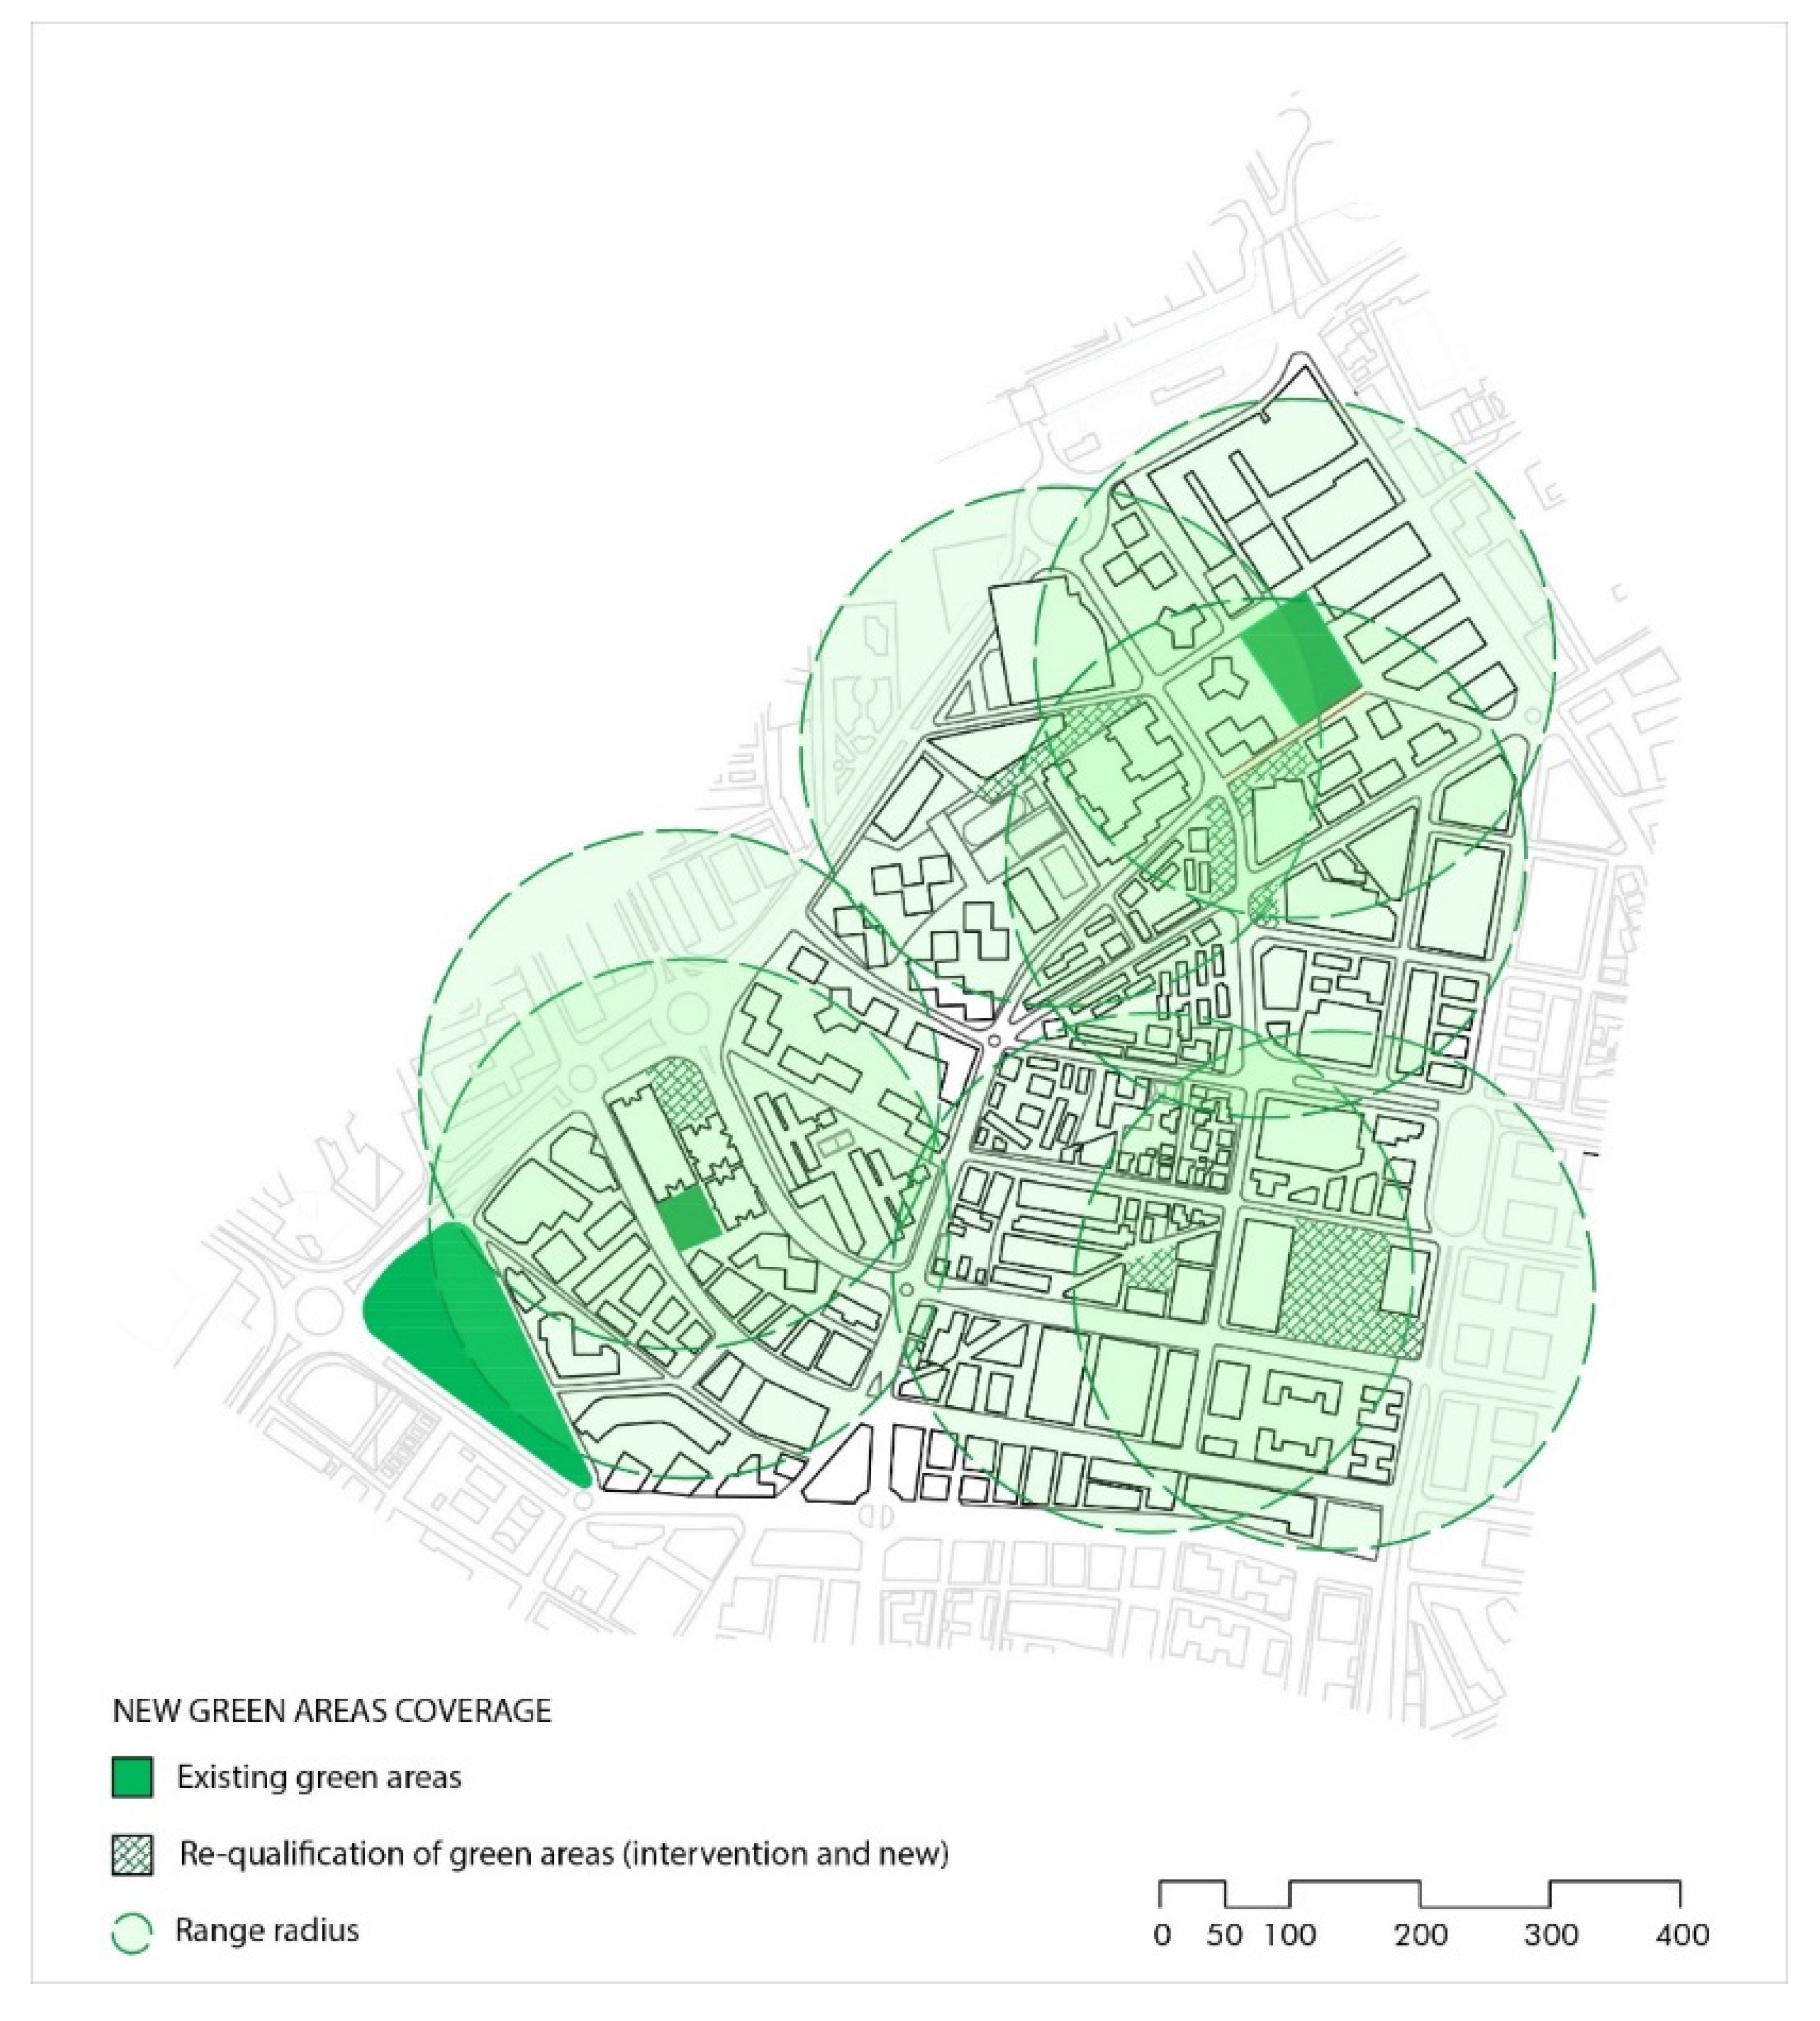
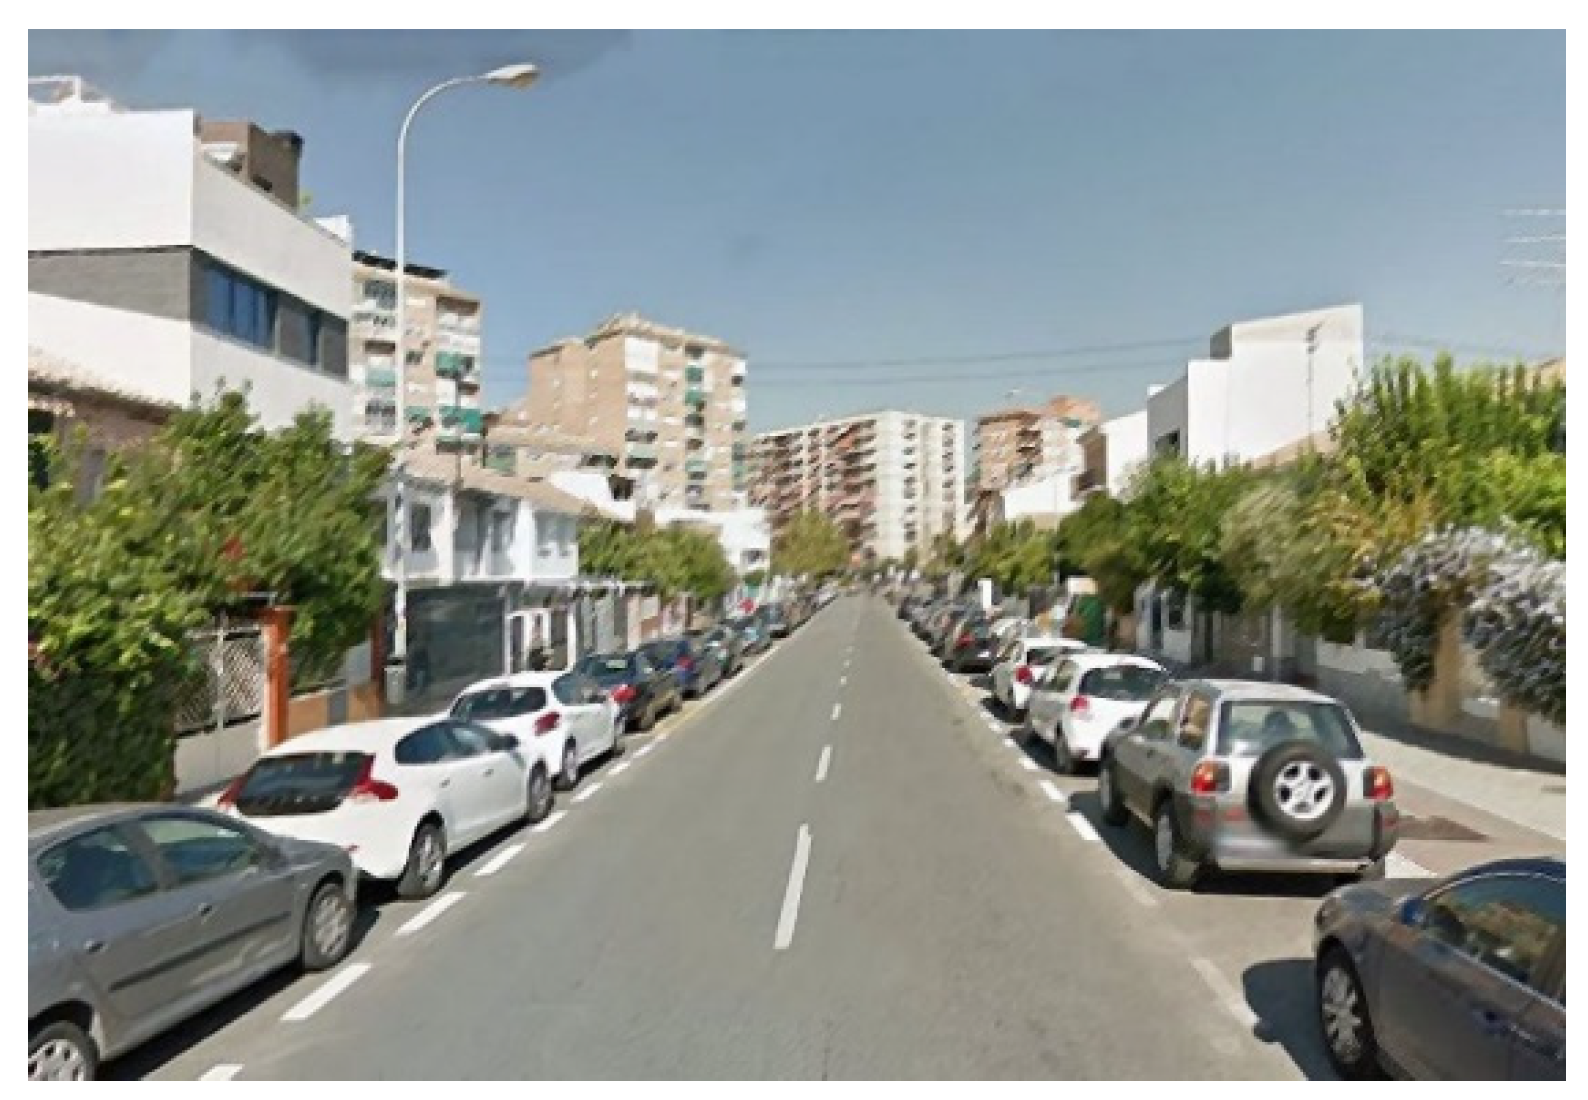

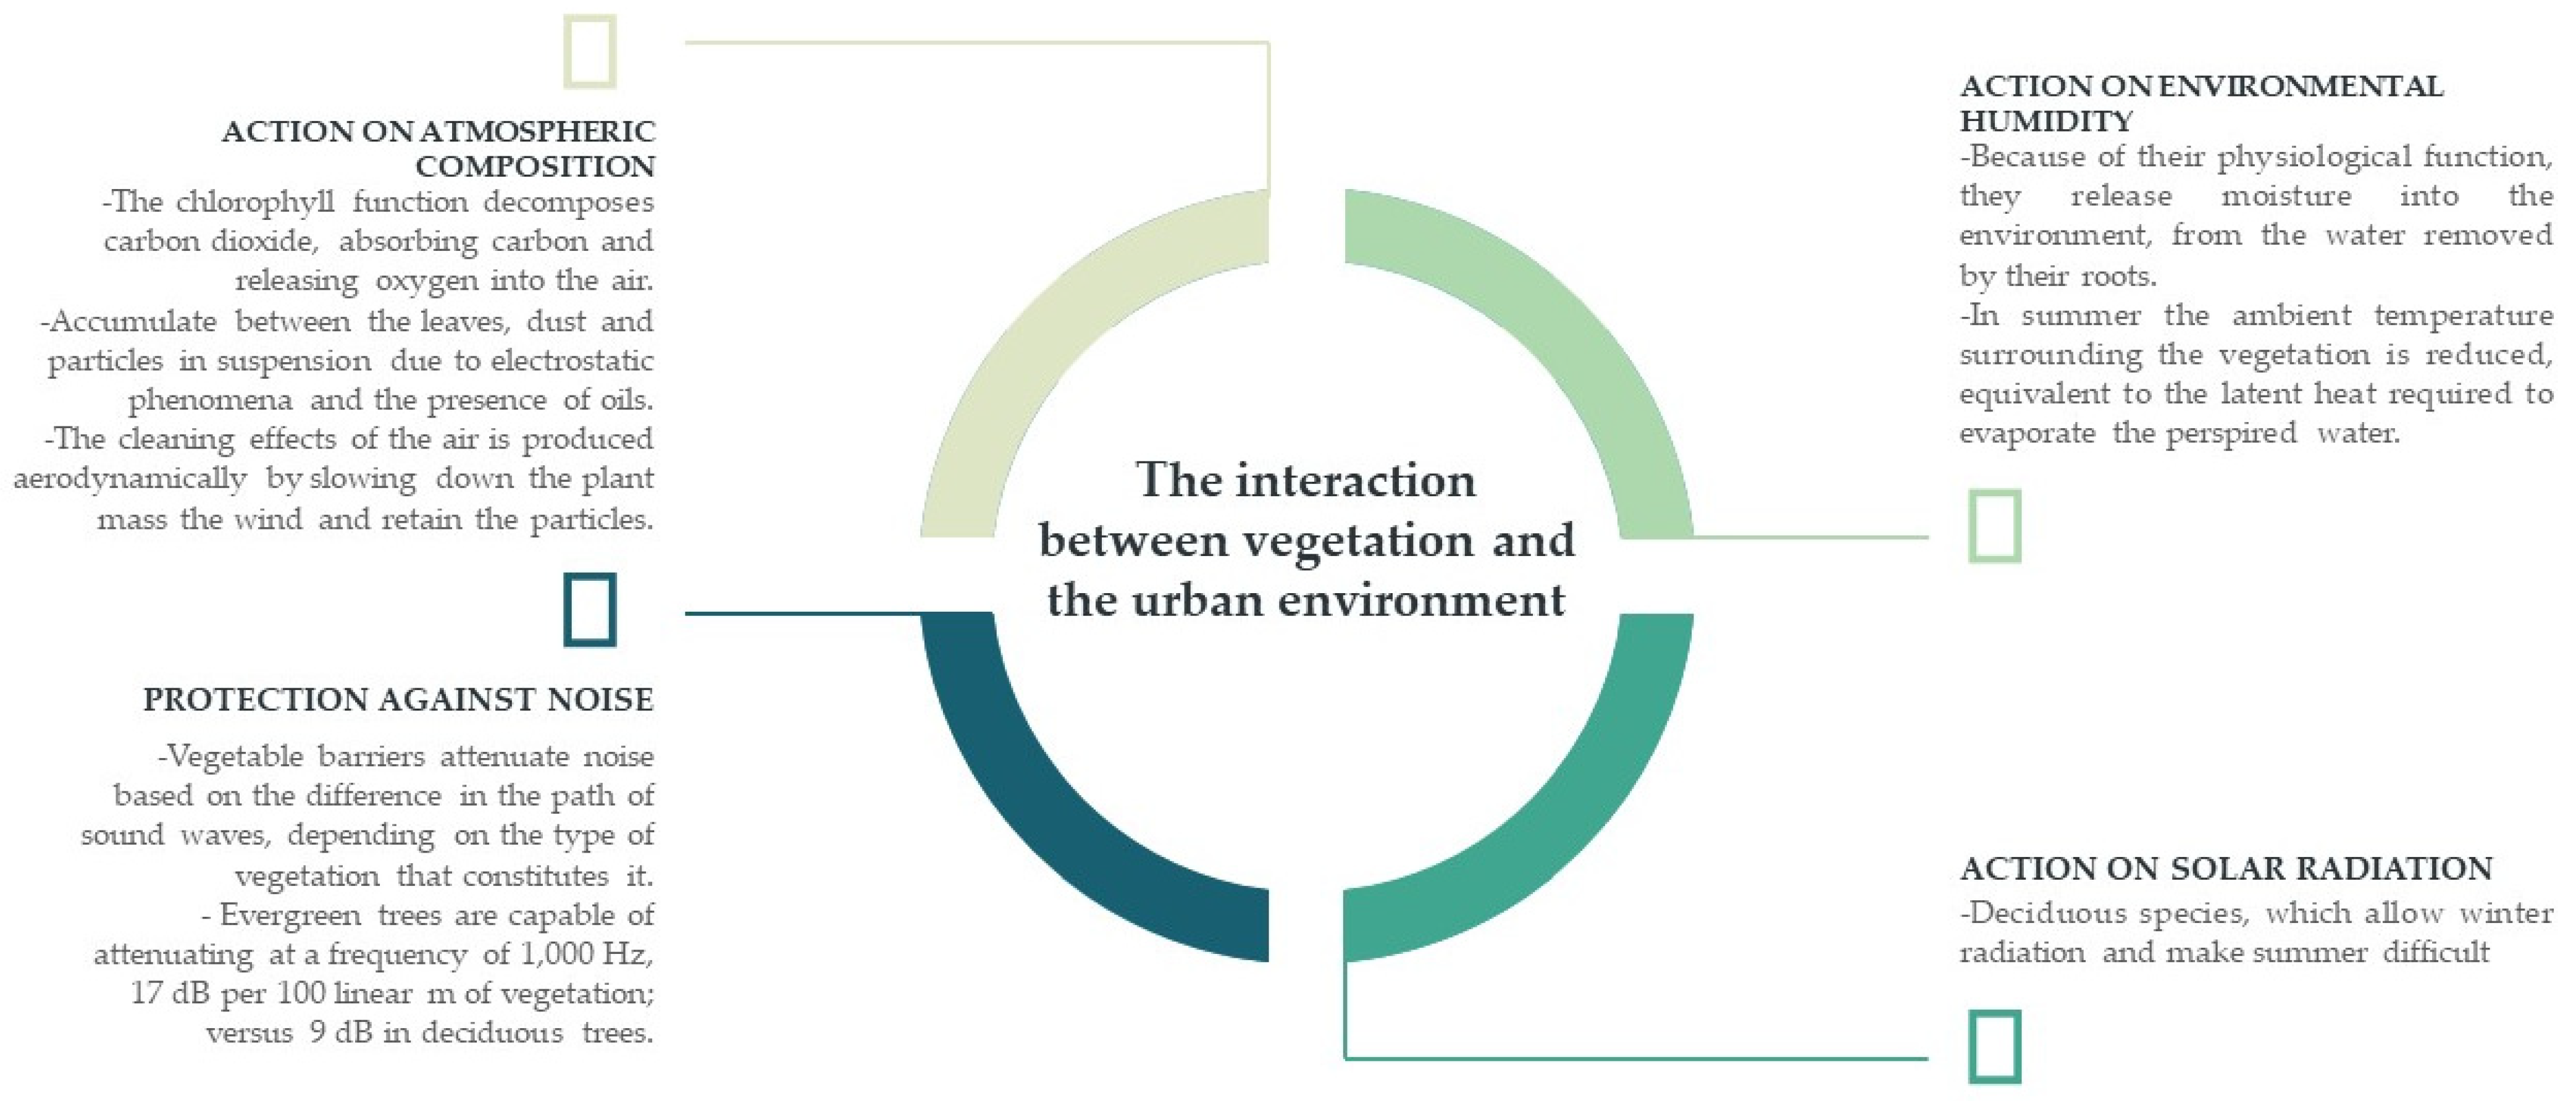
Publisher’s Note: MDPI stays neutral with regard to jurisdictional claims in published maps and institutional affiliations. |
© 2021 by the authors. Licensee MDPI, Basel, Switzerland. This article is an open access article distributed under the terms and conditions of the Creative Commons Attribution (CC BY) license (https://creativecommons.org/licenses/by/4.0/).