Article

Experimental Analysis of Modified DC-P&O Technique with Arm Controller for a Stand-Alone 40 W PV System

by
Ashish Kumar Singhal
1,
Narendra Singh Beniwal
2,
Khalid Almutairi
3,*,
Joshuva Arockia Dhanraj
4,5,
Ali Mostafaeipour
5,6,
Alibek Issakhov
7,8,
Prem Kumar Chaurasiya
9,
Hossein Goudarzi
10 and
Vinod Kumar Singh
11
1
Electrical Engineering Department, Dr. A.P.J. Abdul Kalam Technical University, Lucknow 226031, Uttar Pradesh, India
2
Electronics Engineering Department, Bundelkhand Institute of Engineering and Technology, Jhansi 284128, Uttar Pradesh, India
3
Mechanical Engineering Technology, Applied College, University of Hafr Al Batin, Hafar Al Batin 39524, Saudi Arabia
4
Centre for Automation and Robotics (ANRO), Department of Mechanical Engineering, Hindustan Institute of Technology and Science, Padur, Chennai 603103, Tamil Nadu, India
5
Environmental Assessment and Technology for Hazardous Waste Management Research Center, Faculty of Environmental Management, Prince of Songkla University, Hat Yai, Songkhla 90110, Thailand
6
Industrial Engineering Department, Yazd University, Yazd 8915818411, Iran
7
Department of Mathematical and Computer Modelling, Faculty of Mechanics and Mathematics, Al-Farabi Kazakh National University, Almaty 050040, Kazakhstan
8
Department of Mathematics and Cybernetics, Kazakh British Technical University, Almaty 050000, Kazakhstan
9
Faculty of Mechanical Engineering Department, Sagar Institute of Science and Technology, Gandhi Nagar, Bhopal 462036, Madhya Pradesh, India
10
School of Architecture and Planning, University of New Mexico, Albuquerque, NM 87131, USA
11
Electrical Engineering Department, SRGI, Jhansi 284002, Uttar Pradesh, India
*
Author to whom correspondence should be addressed.
Energies 2021, 14(19), 6169; https://doi.org/10.3390/en14196169
Submission received: 10 August 2021 / Revised: 23 August 2021 / Accepted: 26 August 2021 / Published: 27 September 2021

Abstract

:
The world is moving towards the generation of electricity with renewable energy sources (RES) due to the deterioration of the green environment and trying to replace non-renewable energy resources. The real-time results are achieved with the help of an arm controller, having good controller efficiency with the Waijung toolbox, compatible with MATLAB using STM32ST-link utility. In this paper, the authors are focused on areas such as easy to implement controller efficiency, and real-time solutions for modified direct-control perturbation & observation (DC-P&O) technique based on 32- bit ARM Cortex microcontroller (STM32F407VGT6) with embedded programming using Waijung blocksets, which offers very expected outcomes of the problem to make the stand-alone system efficient with fast-tracking. The observation setup is tested with a 40-watt photovoltaic (PV) panel with resistive load for achieving its stability. The designed algorithm enhances the efficiency of the controller by 84.48% for the real-time parameters of the PV panel at maximum power point (MPP) for a 57% duty ratio.

Graphical Abstract

1. Introduction

The global climate and energy crisis is demanding more renewable electricity to be generated by solar cells and also poses a major concern for the present civilized world. The limited reservoirs of conventional fuels and emission of greenhouse gases are greatly responsible. Moreover, it was reported that still today 86% of the world’s energy consumption is met by conventional fuels and it is increasing daily [1].
To overcome this concern, renewable energy sources (RES) play a vital role in producing power across the world throughout the year with a green concept [2].

1.1. Background, Motivation, and Related Work

J. Prasanth Ram et al. [3] have proposed an MPPT survey on different MPP algorithms and their critical analysis has been performed concerning areas like speed tracking, the complexity of the algorithm, difficulties in hardware implementation. Jen-Hao Teng et al. [4] presented that MPPT is very important to extract maximum power in real-time. The challenges of MPPT are the step size of control variables and the high cost of hardware implementation. This paper proposes an estimation of the MPPT parameter. Mahmoudian et al. [5] found a maximum output power, using MPPT. In this paper, an artificial intelligence (AI) based technique is suggested and others are proposed based on their performance and effectiveness compared to other MPPT techniques. Singh et al. [6] presented MPPT as useful for PV systems to get the maximum output power with the beta technique based on the merits of steady-state performance and their fast-tracking speed. New hybrid MPPT techniques were used with the help of adaptive scaling factor (ASF) and P&O. Dallago et al. [7] presented a D-MPPT based on identifying MPP. Hardware results were performed on the breadboard. The tracking efficiency is claimed to be 78.8% of the DC-P&O method. Francisco et al. [8] considered P&O methods are widely used because of their simplicity. The P&O has limitations for steady-state operation. Hegazy et al. [9] presented different MPPT techniques for boost converters and was simulated using PSIM and MATLAB software. The objective of this paper is to simulate different MPPT techniques to check their performance. In the conclusion, FLC techniques are proposed for reduction with a lower percentage for different duty cycles.
Dengsheng et al. [10] discussed the importance of the MPPT controller as suggested and also gave the direction to design it. Ehssein et al. [11] gave ideas for different topologies of a dc–dc convertor with their optimal controller using various techniques. Valenciaga et al. [12] introduced the novel technique of MPPT based on a second order sliding mode gradient server for a partial shading system. Rekioua et al. [13] worked on various MPPT methods for hybrid RES for a stand-alone system.

1.2. Research Gap

The literature suggests that solar technology is performing with flying colors across all green sources (GS). Solar technology consists of many solar cells combined in series and in parallel for producing large voltage and current, respectively. The authors have discussed the various energy sources available. The Sun itself is a massive fusion reactor in which hydrogen atoms are fused into helium. The energy from this fusion reaction is released into space in the form of radiation. The authors have already calculated the value of the radiation power of the sun (3.828×1026 W), which we used to calculate the solar constant (1367 W/m2). We totalled the energy according to the AM1.5 spectrum in Figure 1 and found 835 W/m2 was received. Thus 61% of the originally available 1367 W/m2 is received on earth as direct radiation [14]. However, it is important to pay attention to a large portion of radiation, namely the diffused radiation caused by the scattering of the light in the atmosphere for the given spectrum, where global radiation (G) is a summation of direct and diffuse radiation. Therefore, the authors used 1000 W/m2 as the total irradiance for peak power of a solar module [15].
In this study, the solar cell schematic is presented in Figure 2 with the DC load (resistive) and whose I-V characteristic is obtained when the load is varied with a different value of current and voltage is measured [16,17].
To amend the efficiency of solar cells, many maximum power point techniques (MPPT) have been proposed in the literature, e.g., perturb and observe (P&O) or hill-climbing, improved perturb and observe (IP&O), incremental conductance (IC) technique, open circuit voltage methods, a fuzzy logic technique, DC-P&O, short circuit current and suggested modified P&O technique with some changes in the parameter for less steady-state oscillation and fast-tracking [18].

1.3. Contribution and Case Description

  • This work is carried out with a modified and fast-tracking DC-P&O technique, which helps to fix the MPP at a certain point.
  • The observation setup is tested with a 40 W PV panel with a dc load for charging from the PV panel.
  • Designed algorithm for controller gives better efficiency of PV panel when comparing the result with PWM charge controller.
  • Modified DC-P&O technique used to improvise in the conventional P&O by using direct controlling with the help of proportional integral derivative (PID) controller by 84.48%.
This case is focused on the solution to the problem of solar cells with practical implementation. In the literature, some researchers are facing a problem in solar cells due to their high cost and inclination for low conversion efficiency. The authors are trying to focus the attention of the researcher with a feasible solution. The case is related to the design MPPT charge controller with modified DC-P&O method using an efficient DC–DC boost convertor and an intelligent, efficient and low-cost 32- bit ARM Cortex microcontroller (STM32F407VGT6) with 168 MHz frequency testing for optimal results with a 40 W panel having DC load [19].

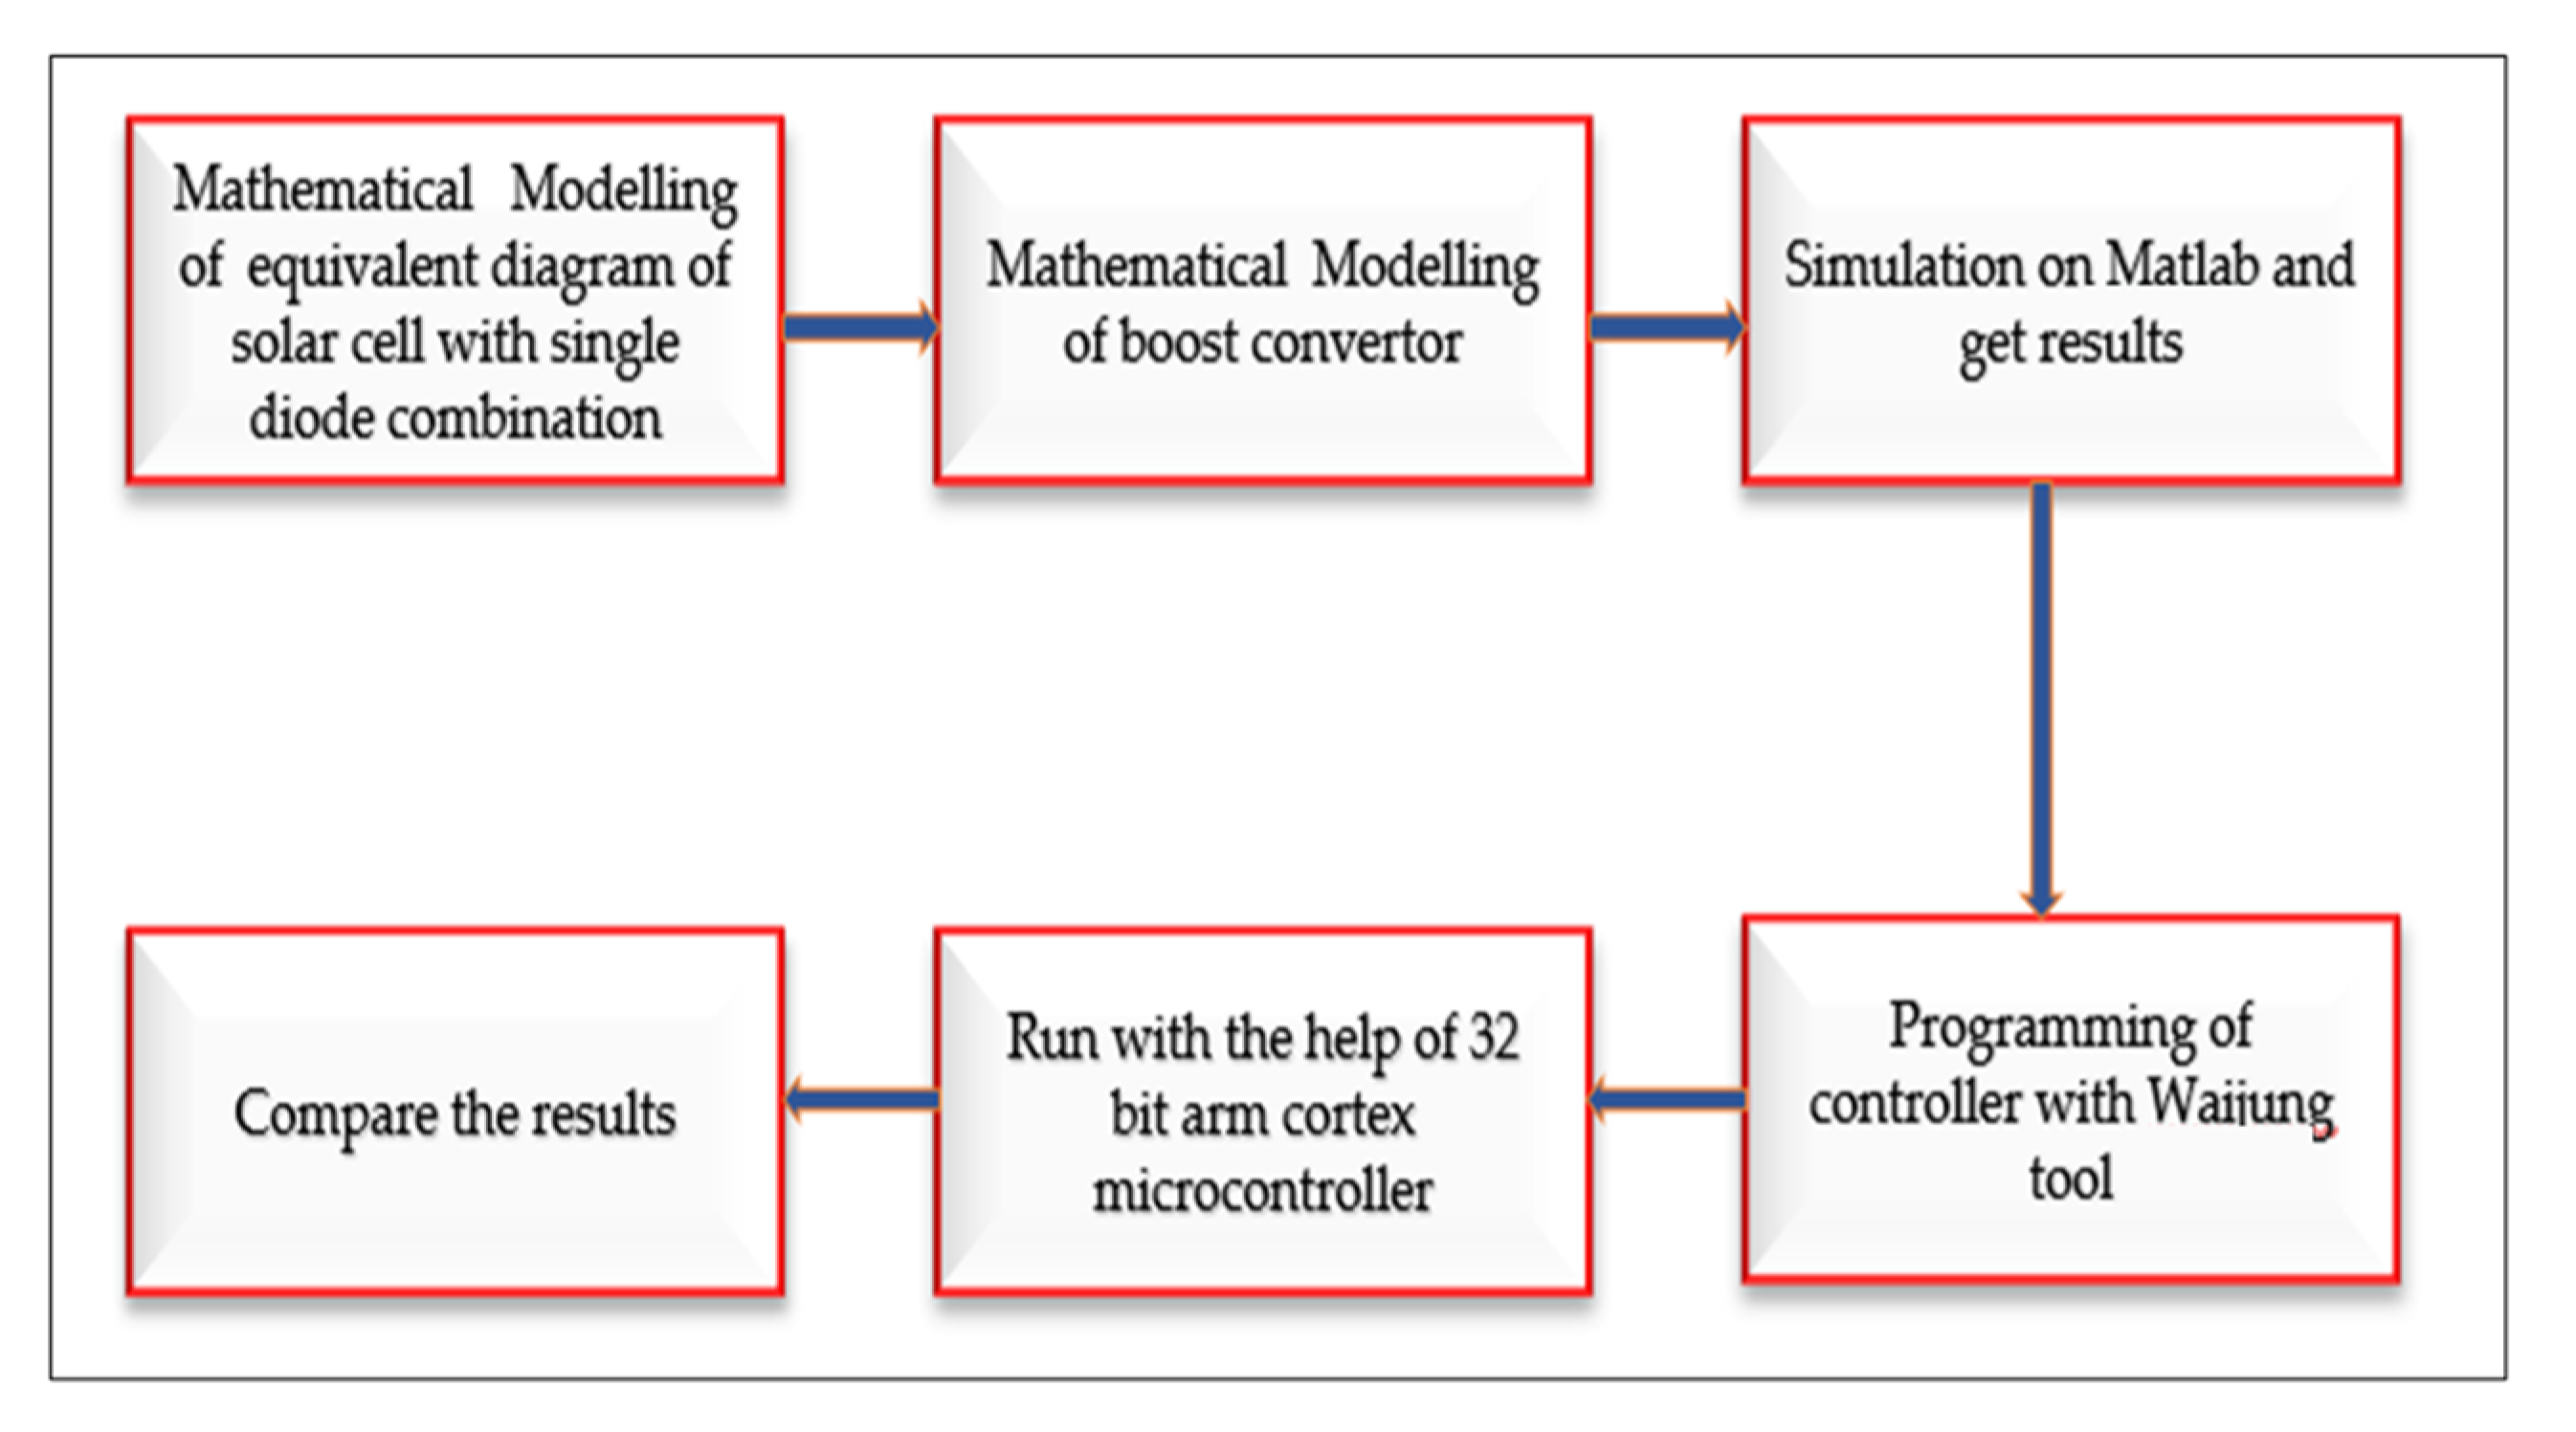
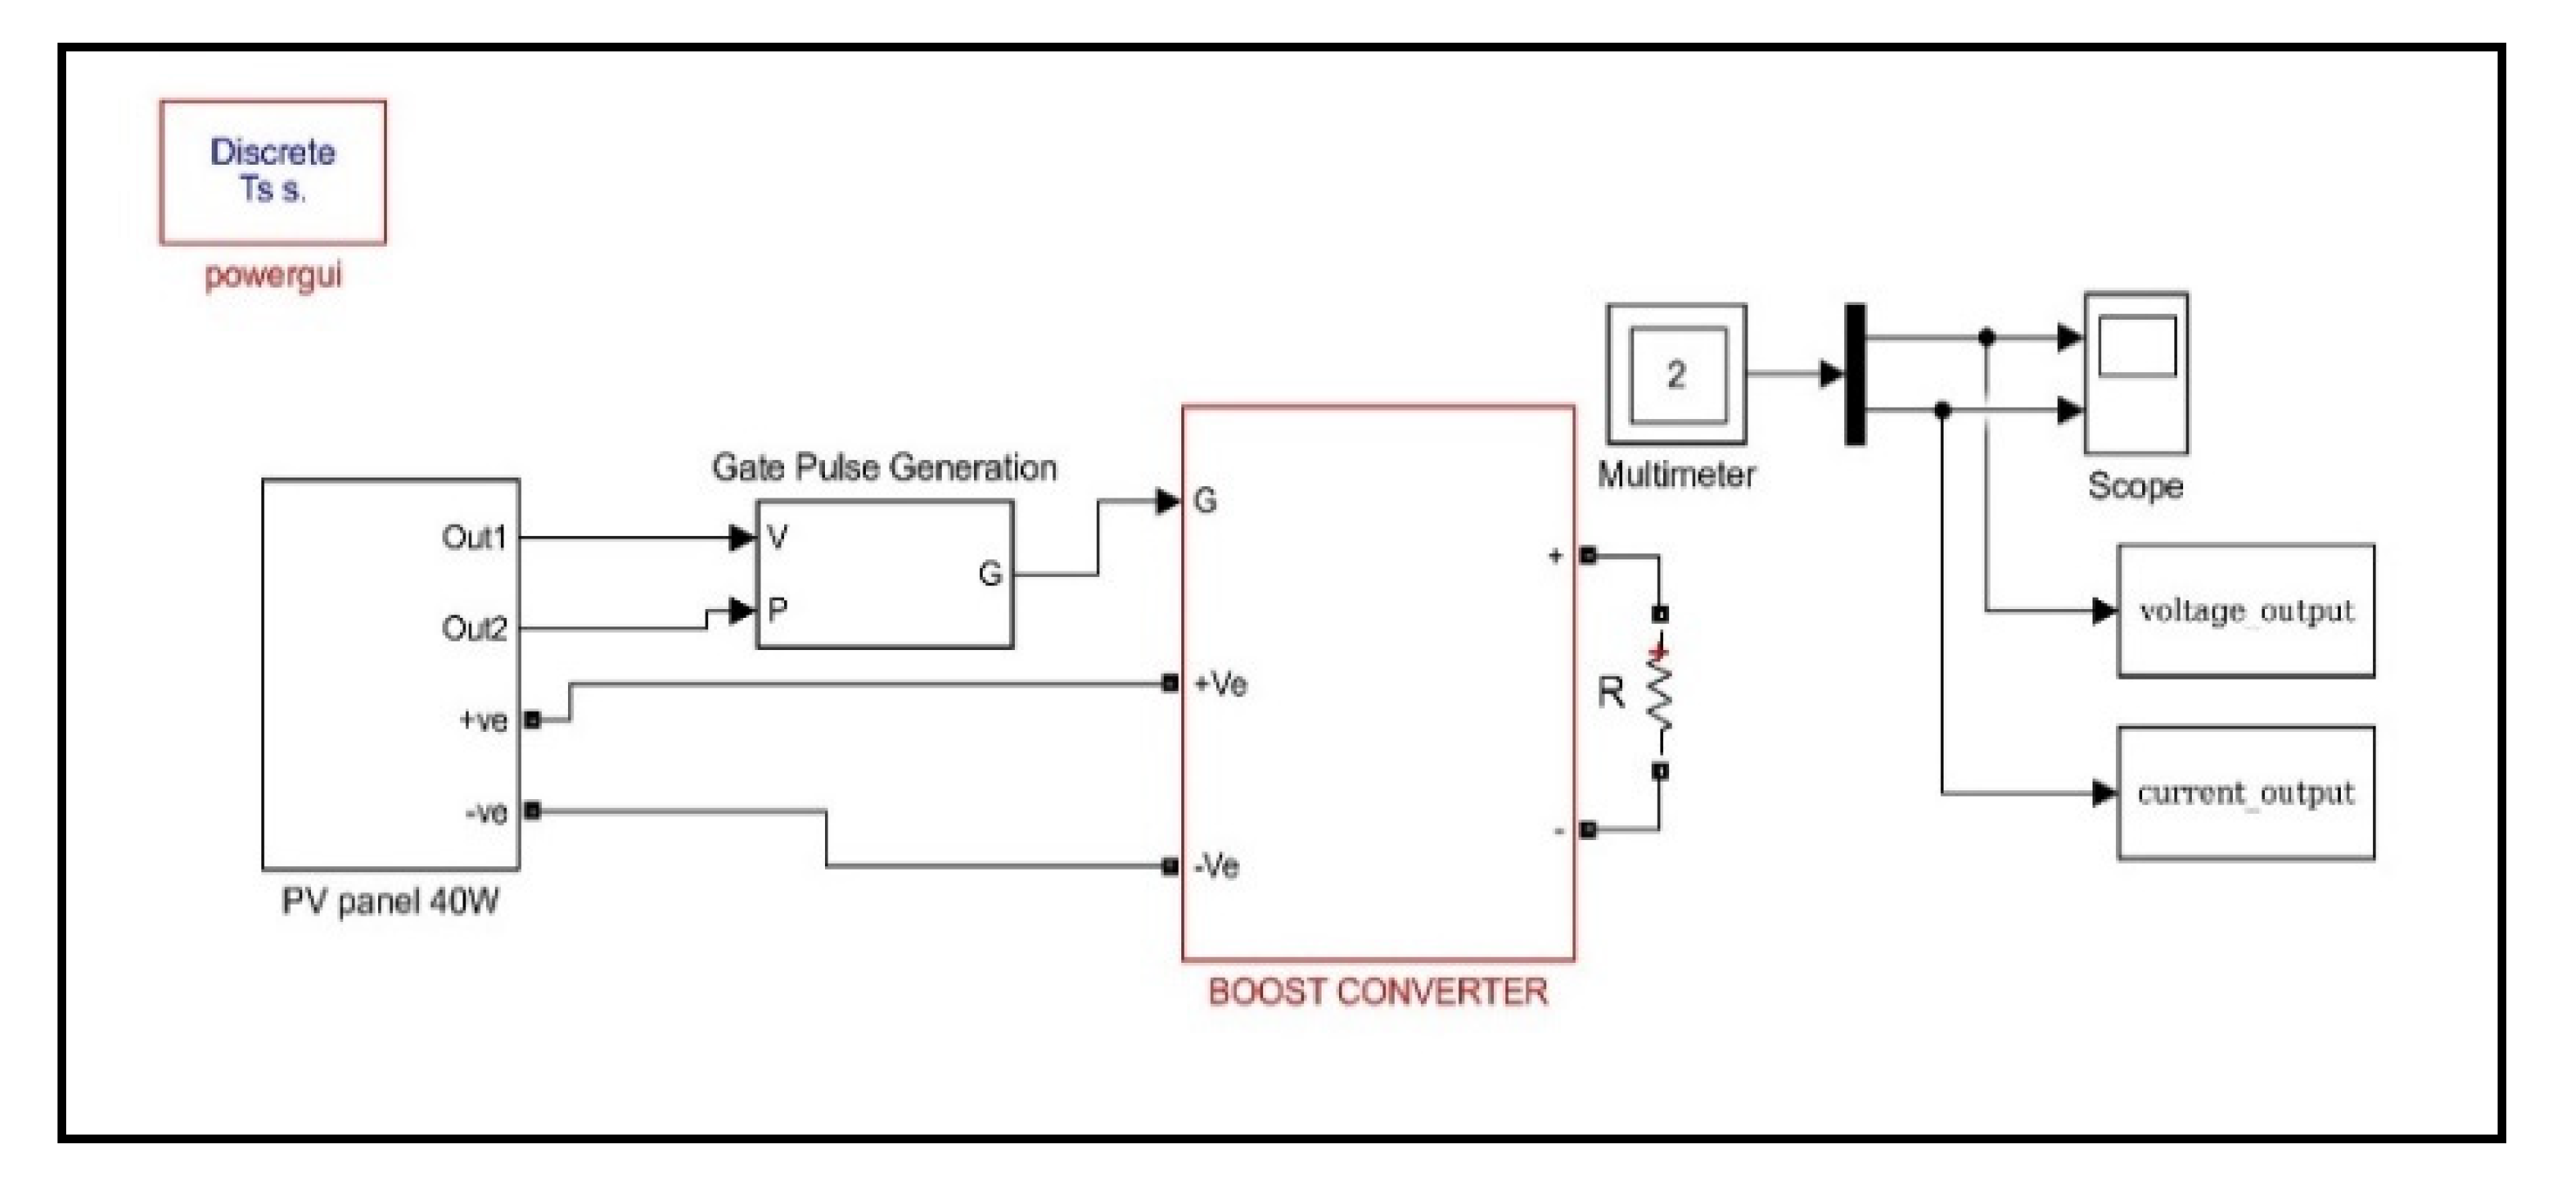
2. Materials and Methods
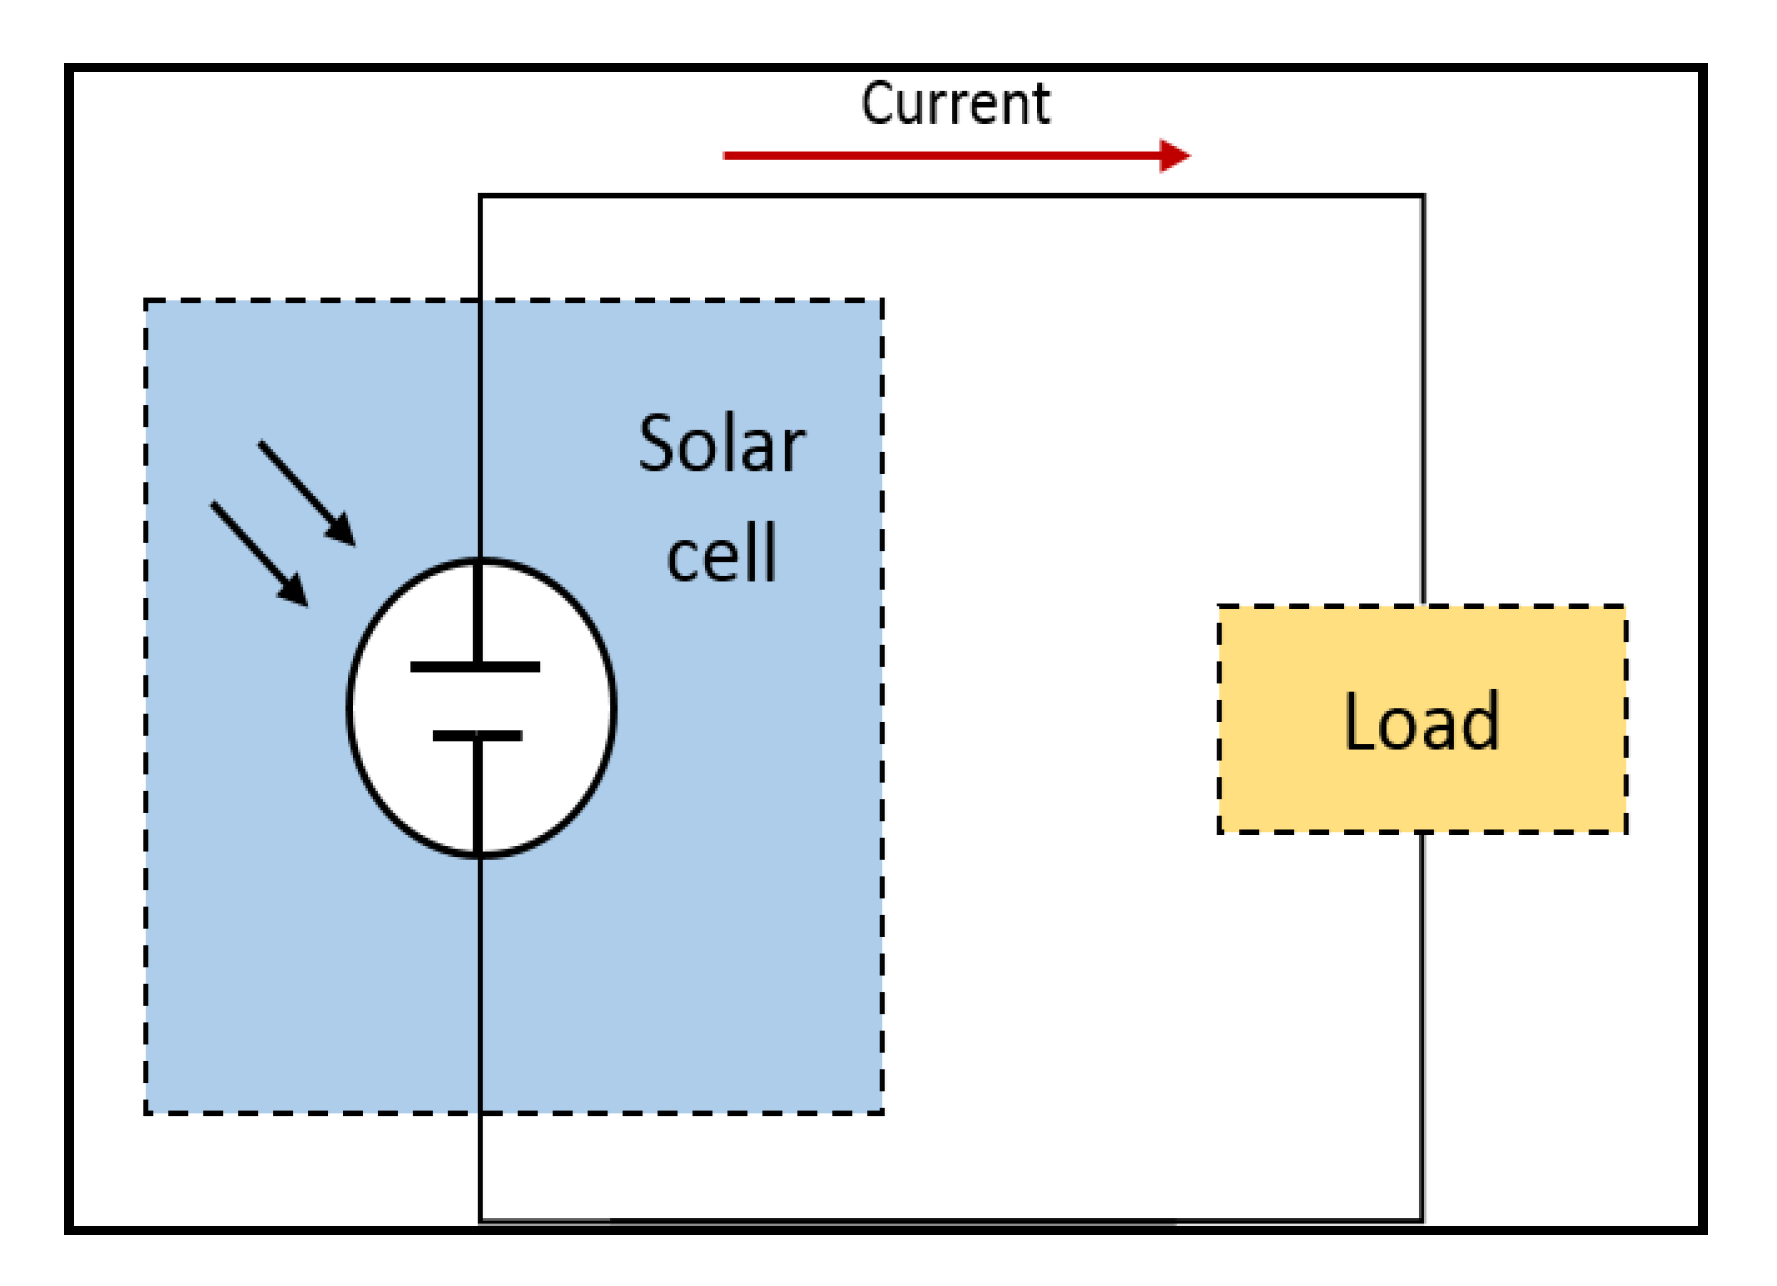
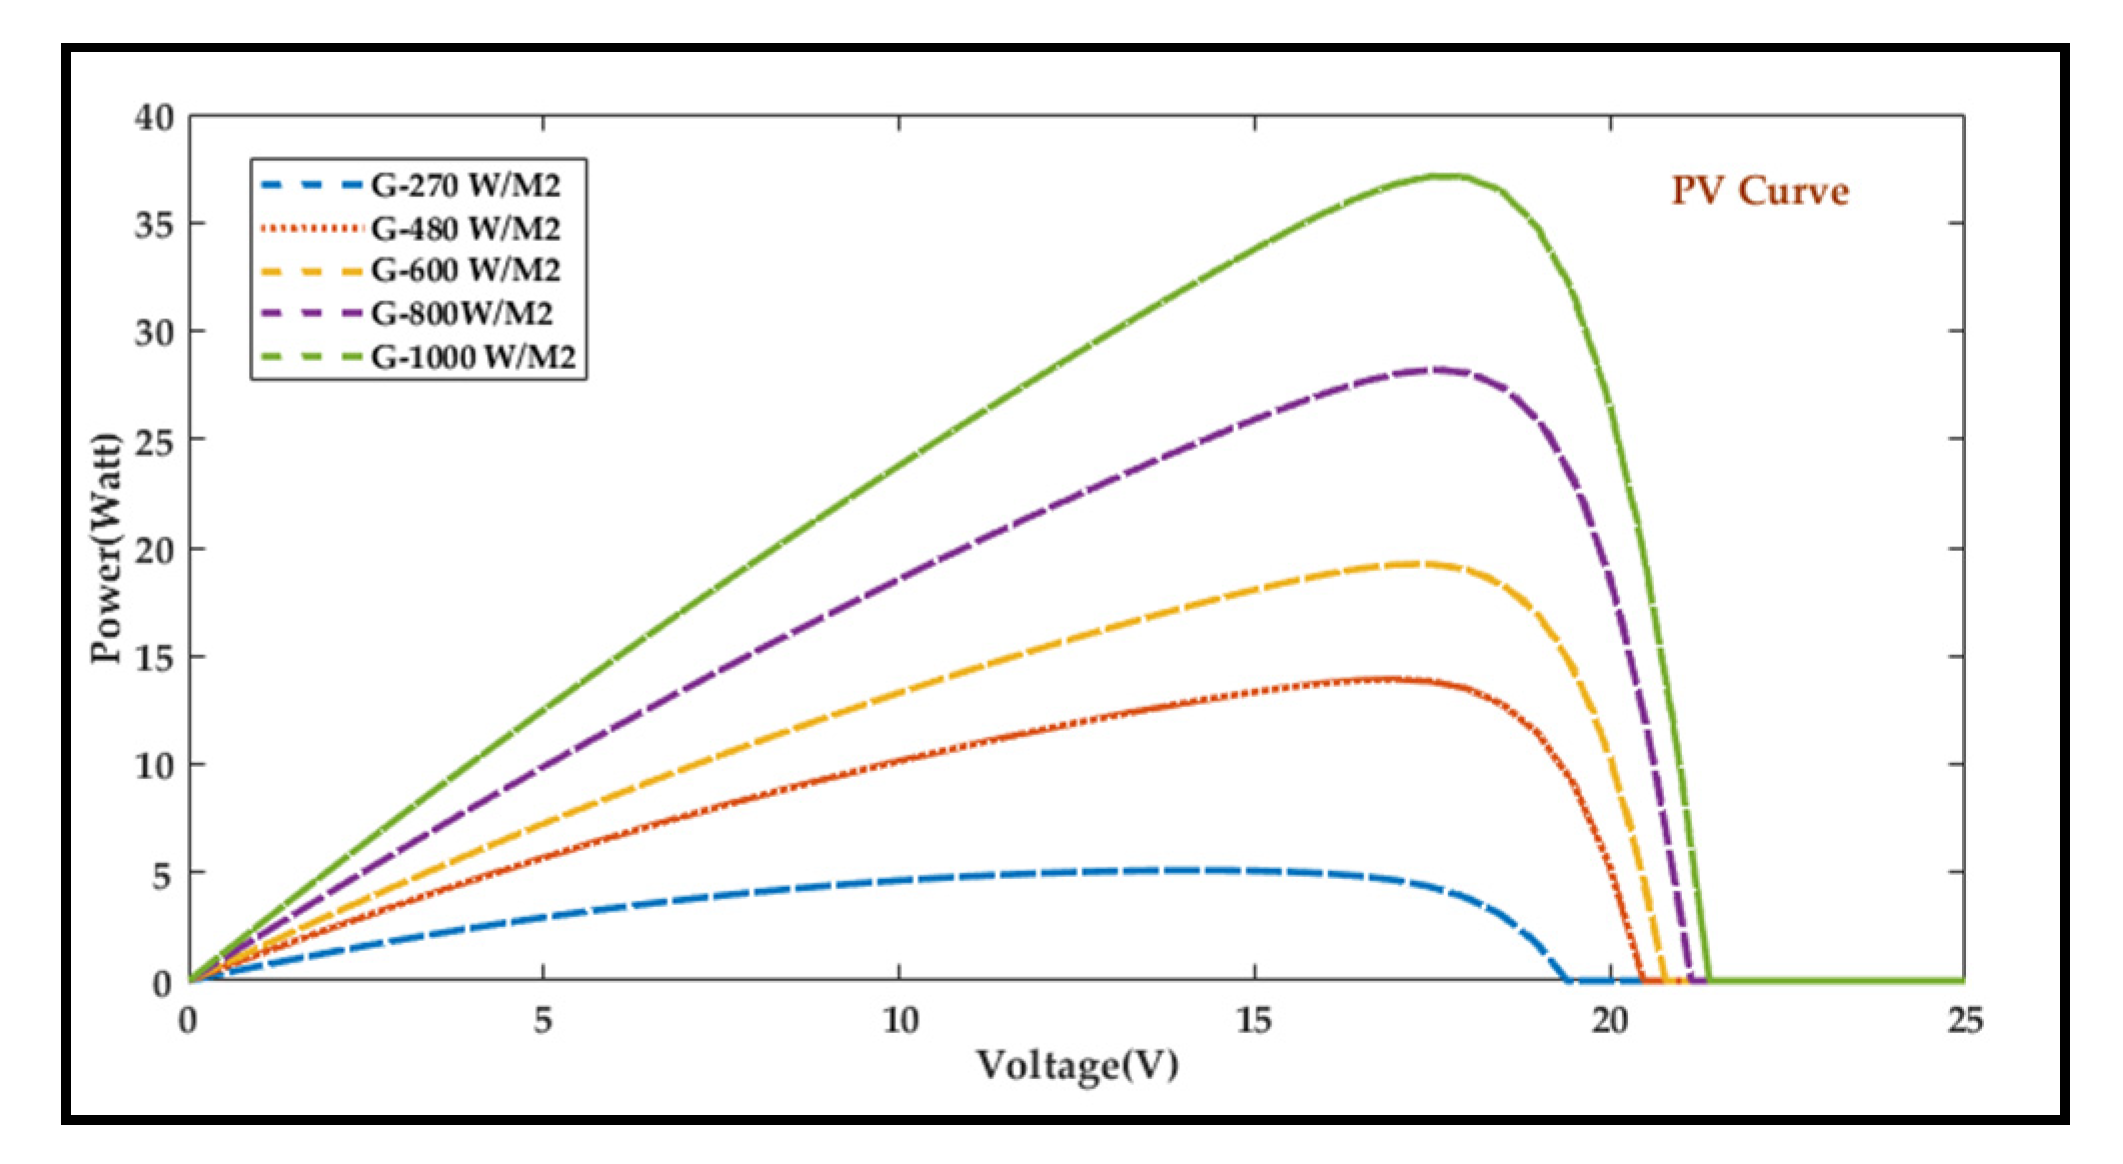
In this paper, the authors attempt to help all learners understand the overall workflow with the help of the block diagram given below in Figure 3. The methodology of the workflow is discussed step by step.

2.1. PV Technology

Despite the advantages of PV technology like clean, pollution-free, and non-exhaustible etc., solar cells are facing challenges due to their nonlinear characteristic, which lies in the irradiance and ambient temperature, and very low efficiency due to partial shading. In a stand-alone solar system, PV modules and batteries are pricier and directly coupled with PV modules, protecting against changing over [20].
Charge controllers play a very vital role as a solution to bring through the batteries from changing over. But charge controllers cannot operate PV modules at MPP, due to lower efficiency. To overcome this issue, the researcher needs to operate the PV module at the peak power point to deliver maximum power from the source to load under variable atmospheric conditions [21].

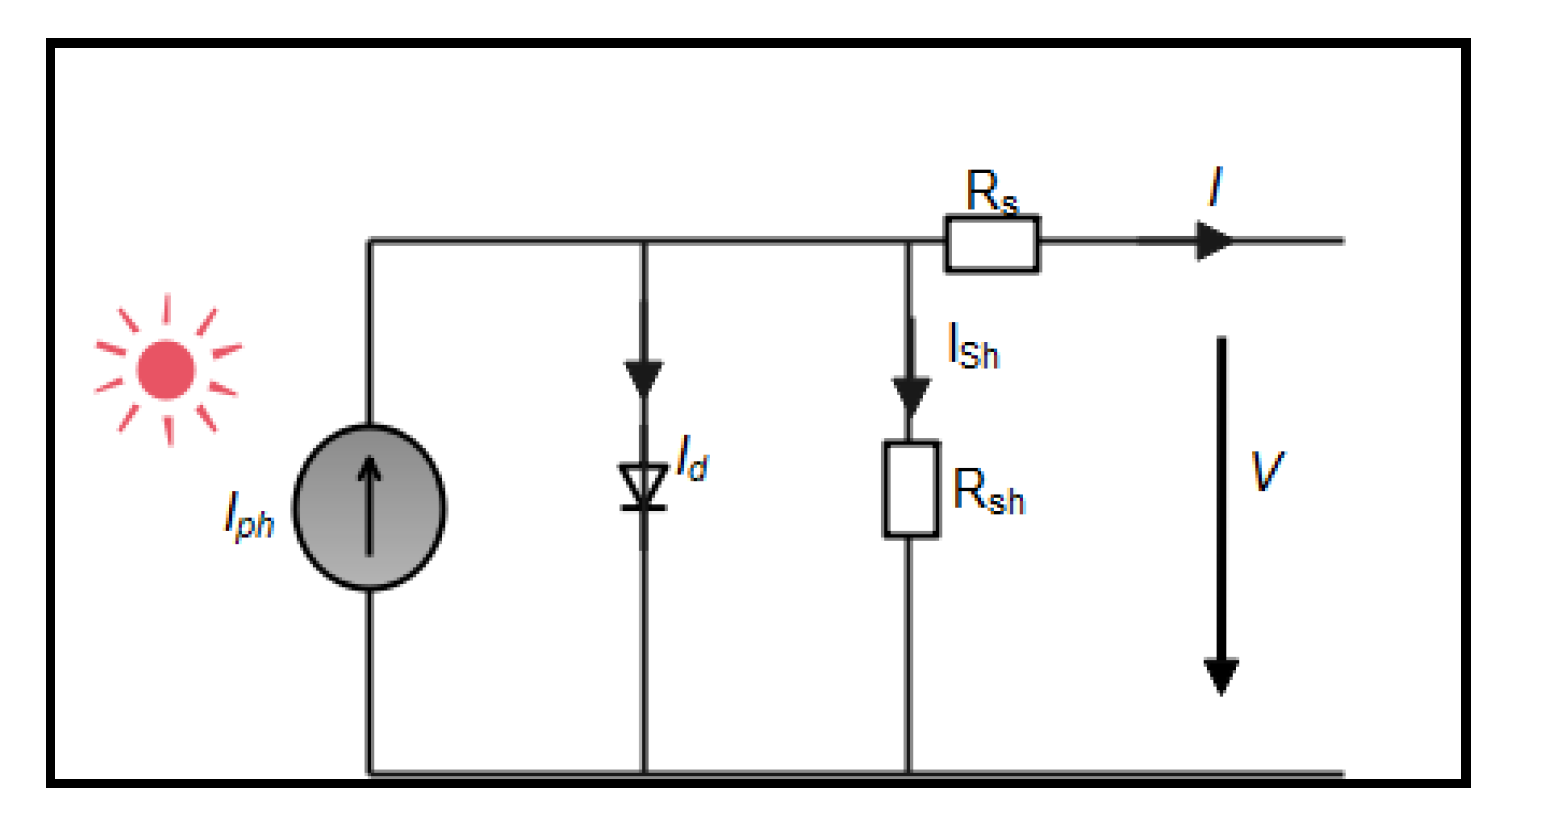
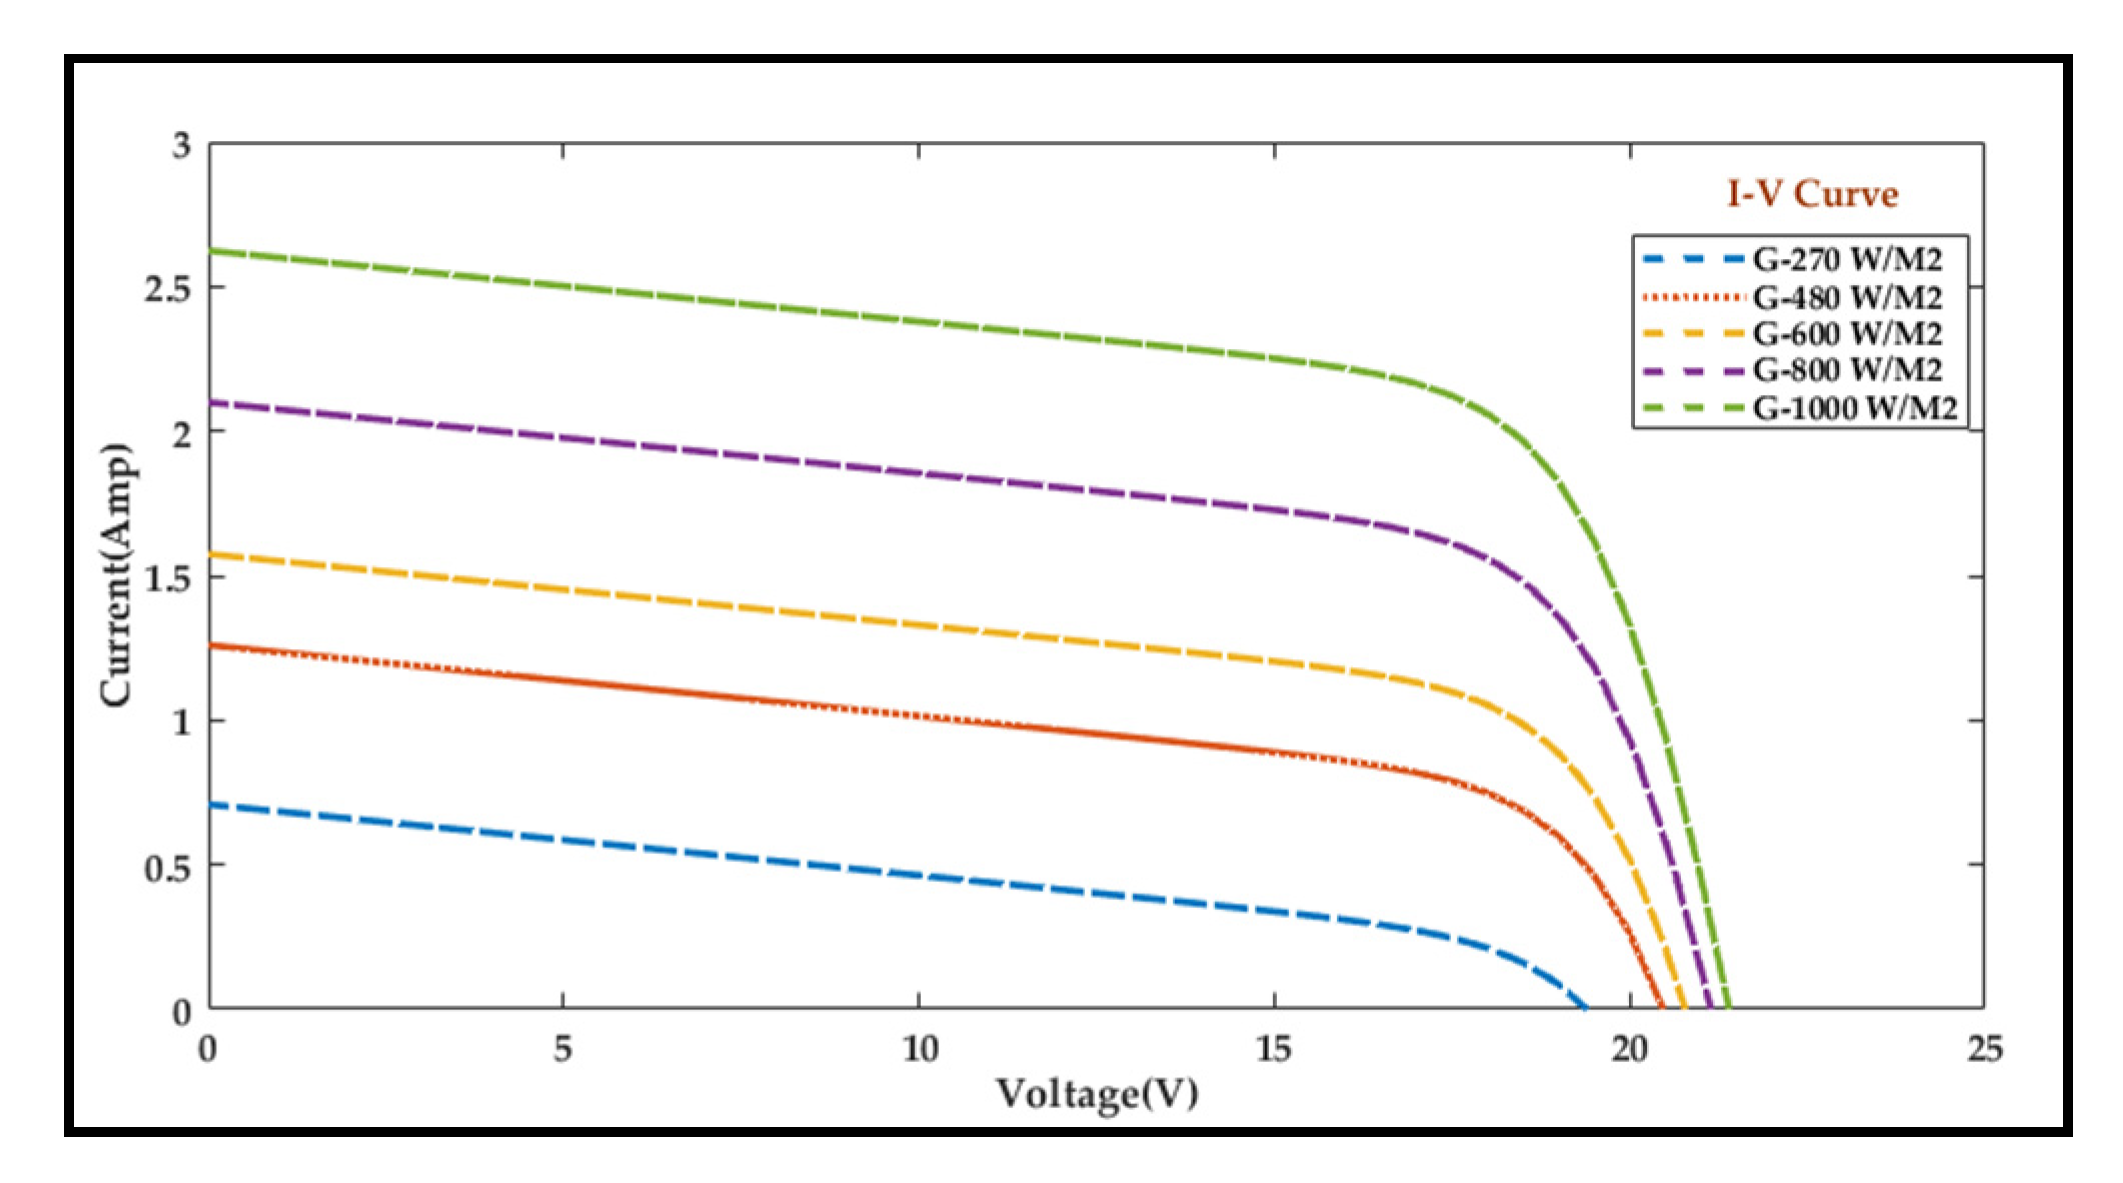
2.2. Single Diode Equivalent Circuit of PV Cell with their Simulation

Nowadays, PV has become popular for many applications such as lighting, battery charging, wireless power transmission, water pumping for agriculture, and satellite power systems. The single diode model is based on five important parameters discussed in Figure 4. The photon current (Iph) is generated by incident light (insolation) on the solar cell. The diode is connected for safety purpose due to any damage and disturbance in PV module. The shunt and series resistance are passive elements to represent the power losses. The single diode model is shown in Figure 4.
The model has experimented and simulated a PV panel (Waree solar 40 Watt) with different parameters specified in Table 1 on MATLAB software with different irradiance and temperature [21,22]. The output current can be measured from Figure 4, By applying KCL, we can obtain:
I = I p h I D I s h
where, Iph: Photon current (A), ID: diode current (A), Ish = shunt current (A), I: load current (A).
The diode current equation can be represented as follows:
I D = I 0 [ exp ( V + I R s m V T ) 1 ]
where I0: reverse saturation current (A), V: load voltage (V), Rs: series resistance (ohm), m: diode ideality factor (unitless), k: Boltzmann’s constant (1.381 × 10⁻²³ J/K).
I s h = ( V + I R s R s h )
where, Rsh: shunt resistance (ohm).
I = I p h I 0 { exp [ q ( V + I R s ) m k T ] 1 } V + I R s R s h
where, q: charge (1.6 × 10⁻¹⁹ C) T: absolute temperature ( V T = k T q 0.0259 V ) at 25 °C.
Simulation carried with different levels of irradiance 2,704,806,008,001,000 W/M2 at cell temperature 25 °C. Modeling of stand-alone PV obtains various results as shown in Figure 5, Figure 6 and Figure 7.
After getting the result of irradiance at 800 W/M2, we found the Voc = 17.5 volt, Isc = 2.15 amp, Vmp = 17.5 volt, Imp = 1.75 amp as shown in Figure 7.
Table 1, as shown below, represents the parameters of the PV panel used for the experimental bench. These parameters are useful for getting the optimal results as well as to find the efficiency of the solar cell. Panel efficiency can be calculated by [23].
η = P max P i n
% η = V o c × I s c × F F P i n × 100
% η = 21.4 × 2.65 × 0.78 343 × 100
% η = 12.8 %

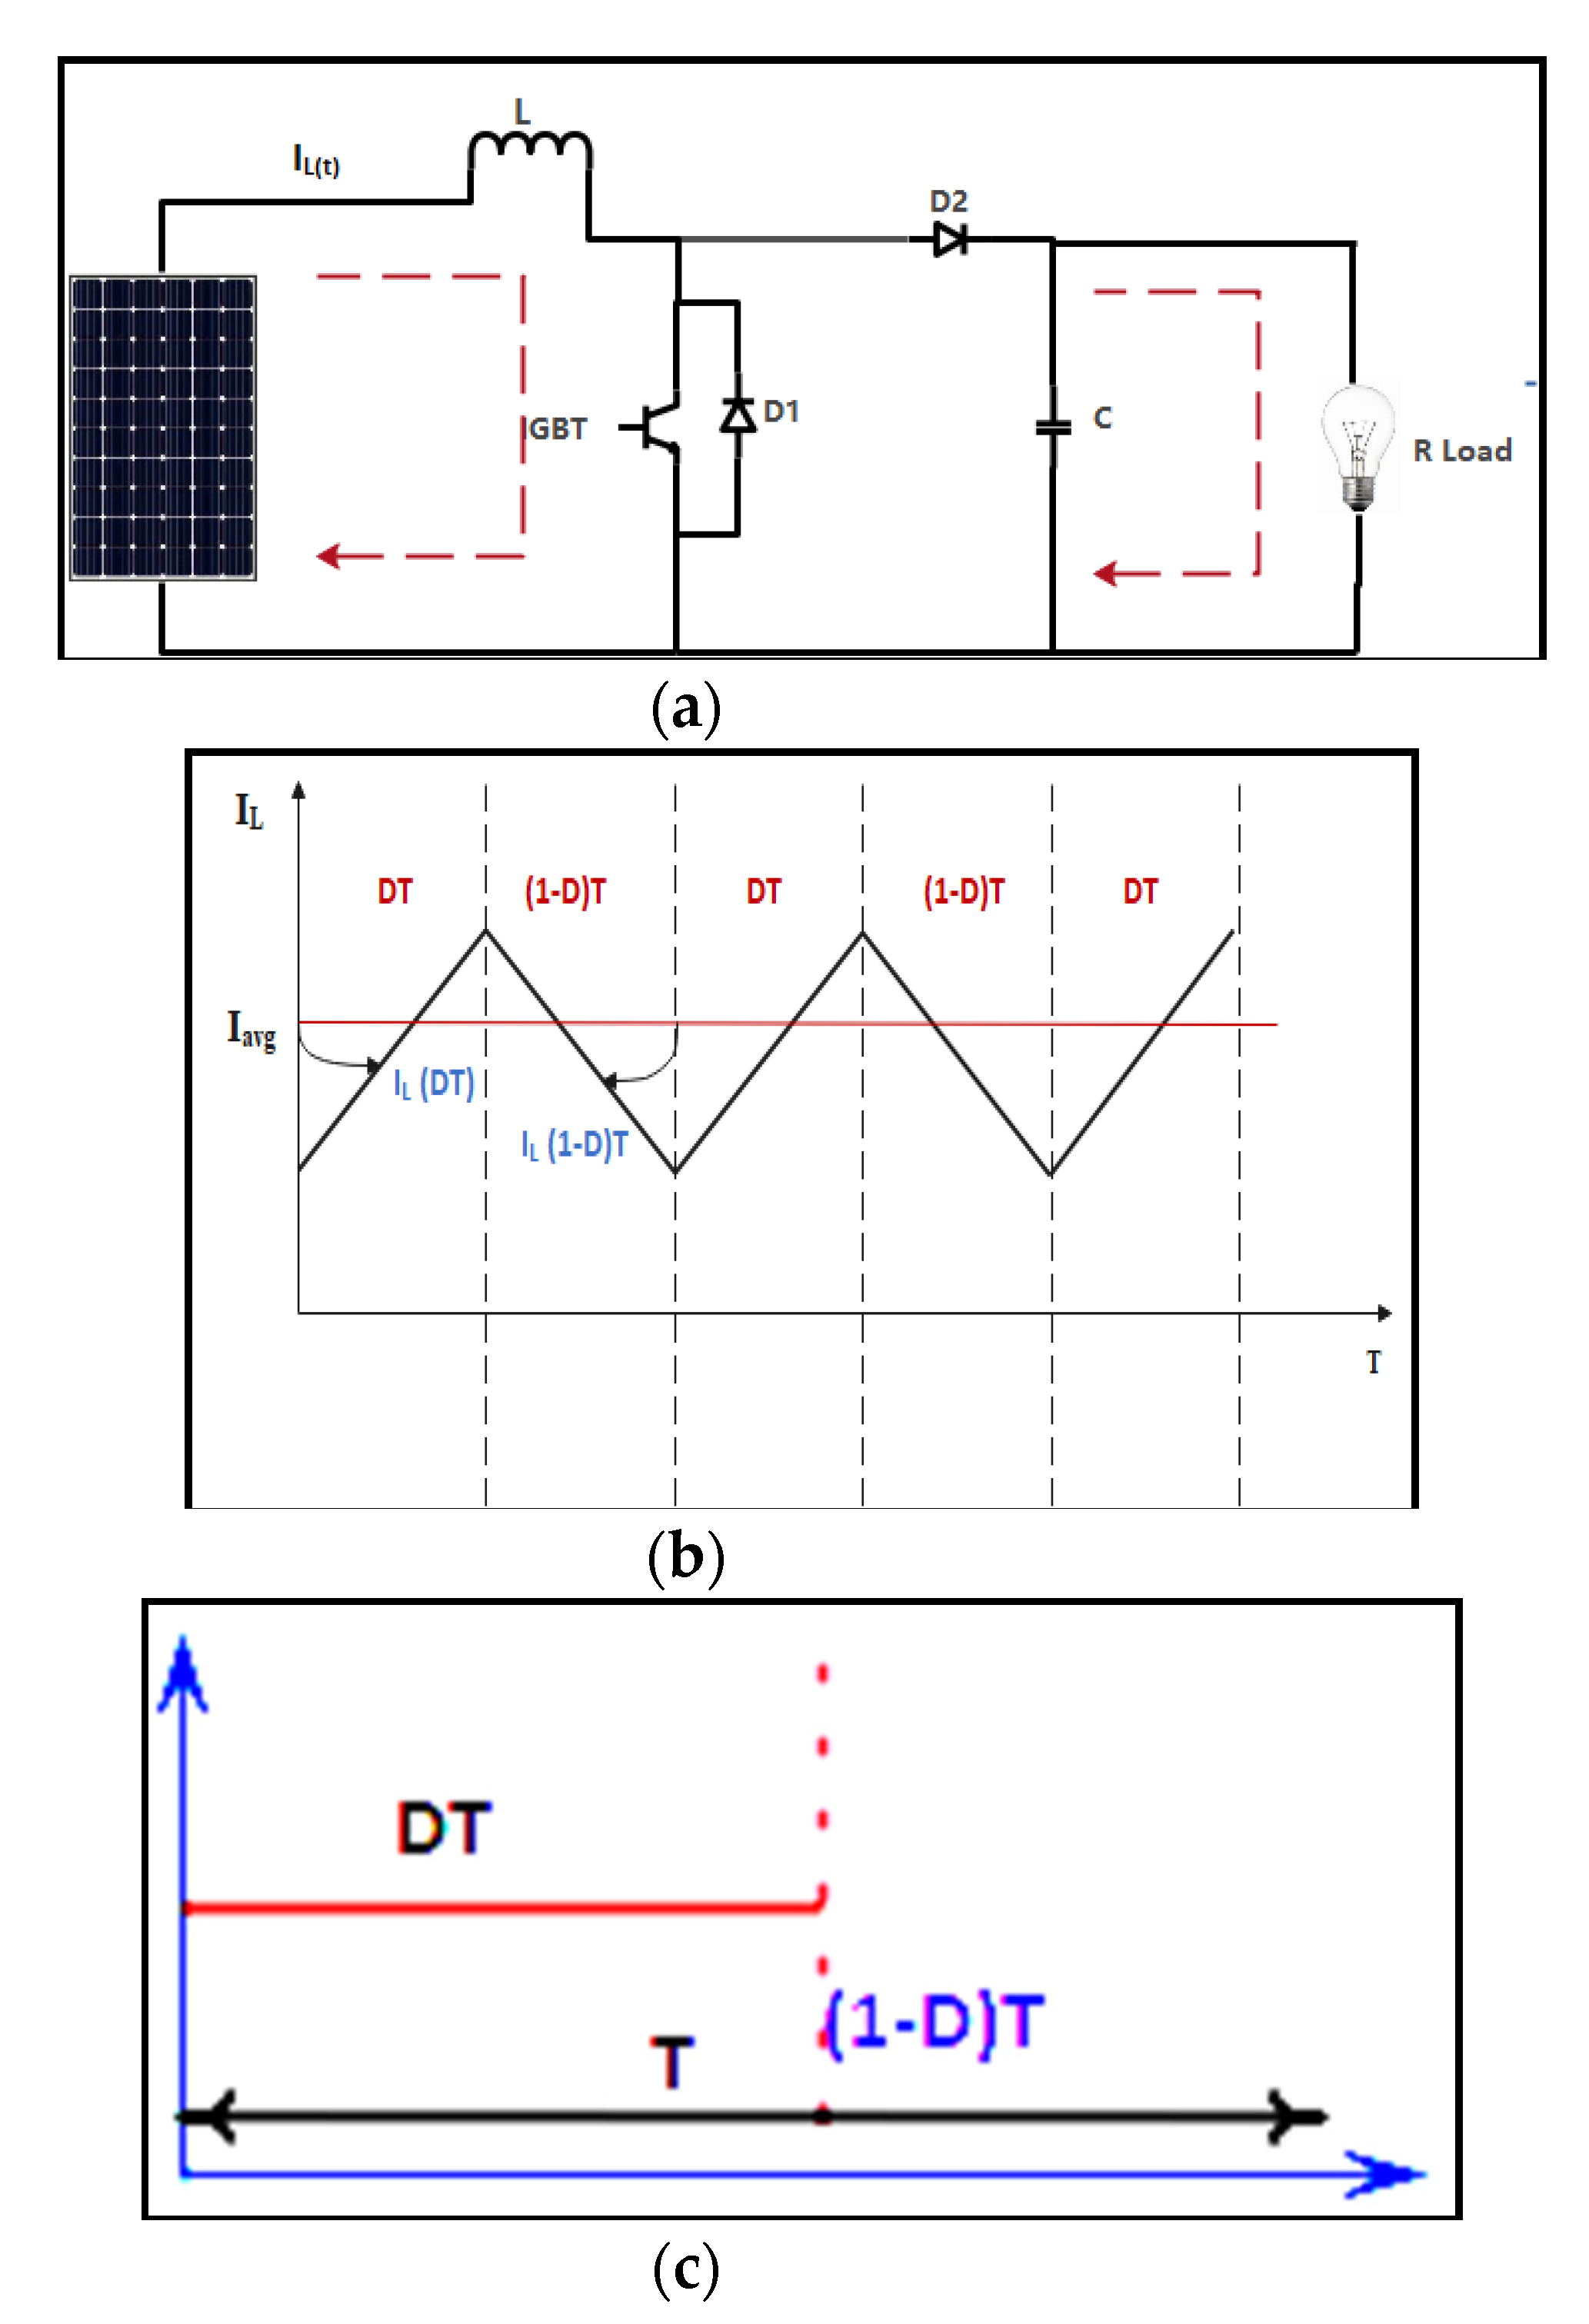
3. The Functioning of DC–DC Boost Converter

A DC–DC boost converter shown in Figure 8a, was used to step up the voltage level where the input end was low. It consisted of an inductor, output capacitor, and switching device. There were two modes of operation depending upon the switching shown in Figure 8b,c [24]. Switching can be achieved by either a metal-oxide field-effect transistor (MOSFET) or an insulated gate bipolar transistor (IGBT). For low voltage, MOSFET is preferred rather than high voltage applications. IGBT is preferred due to its high input impedance and high voltage rating application greater than 1 kV. The output voltage can be regulated by switching devices with the variation of the duty cycle [25]. It can be represented as follows:
V o V i = t s t o f f = 1 1 D
t o n + t o f f = t s
where, Vo = output voltage; Vi = input voltage; toff = IGBT off, sec; ton = IGBT on, sec; ts = total time.
When the switch is ON, the diode will develop reverse bias then the state–space equation can be written as follows:
i l v c = 0 0 0 1 R C i l v c + 1 L 0 v g + 0 1 C i c
When the switch is OFF, the diode will develop forward bias then the state–space equation can be written as follows:
( 1 d ) T s : i l v = 0 1 / L 1 / c 1 / R C i l v c + y l 0 v g + 0 1 / L C i c
The required minimum value of the inductor can be written in continuous conduction mode (CCM) as follows:
L = V o ( 1 D ) 2 I o f P W M
After consideration of the output voltage ripple, the capacitor value can be written as follows:
C = i o 4 Δ V f P W M
where il is the current across the inductor, ic is the current across the capacitor, vgis the input voltage, vc voltage across the capacitor, i l = change in the current across the inductor, v c is the change in voltage across the capacitor during switching, fpwm is the switching frequency, Δ V is the output voltage ripple, Io is the output current, D is the duty cycle, Vo is the output voltage. After calculation of the value of the inductor and capacitor we created Table 2, as below.

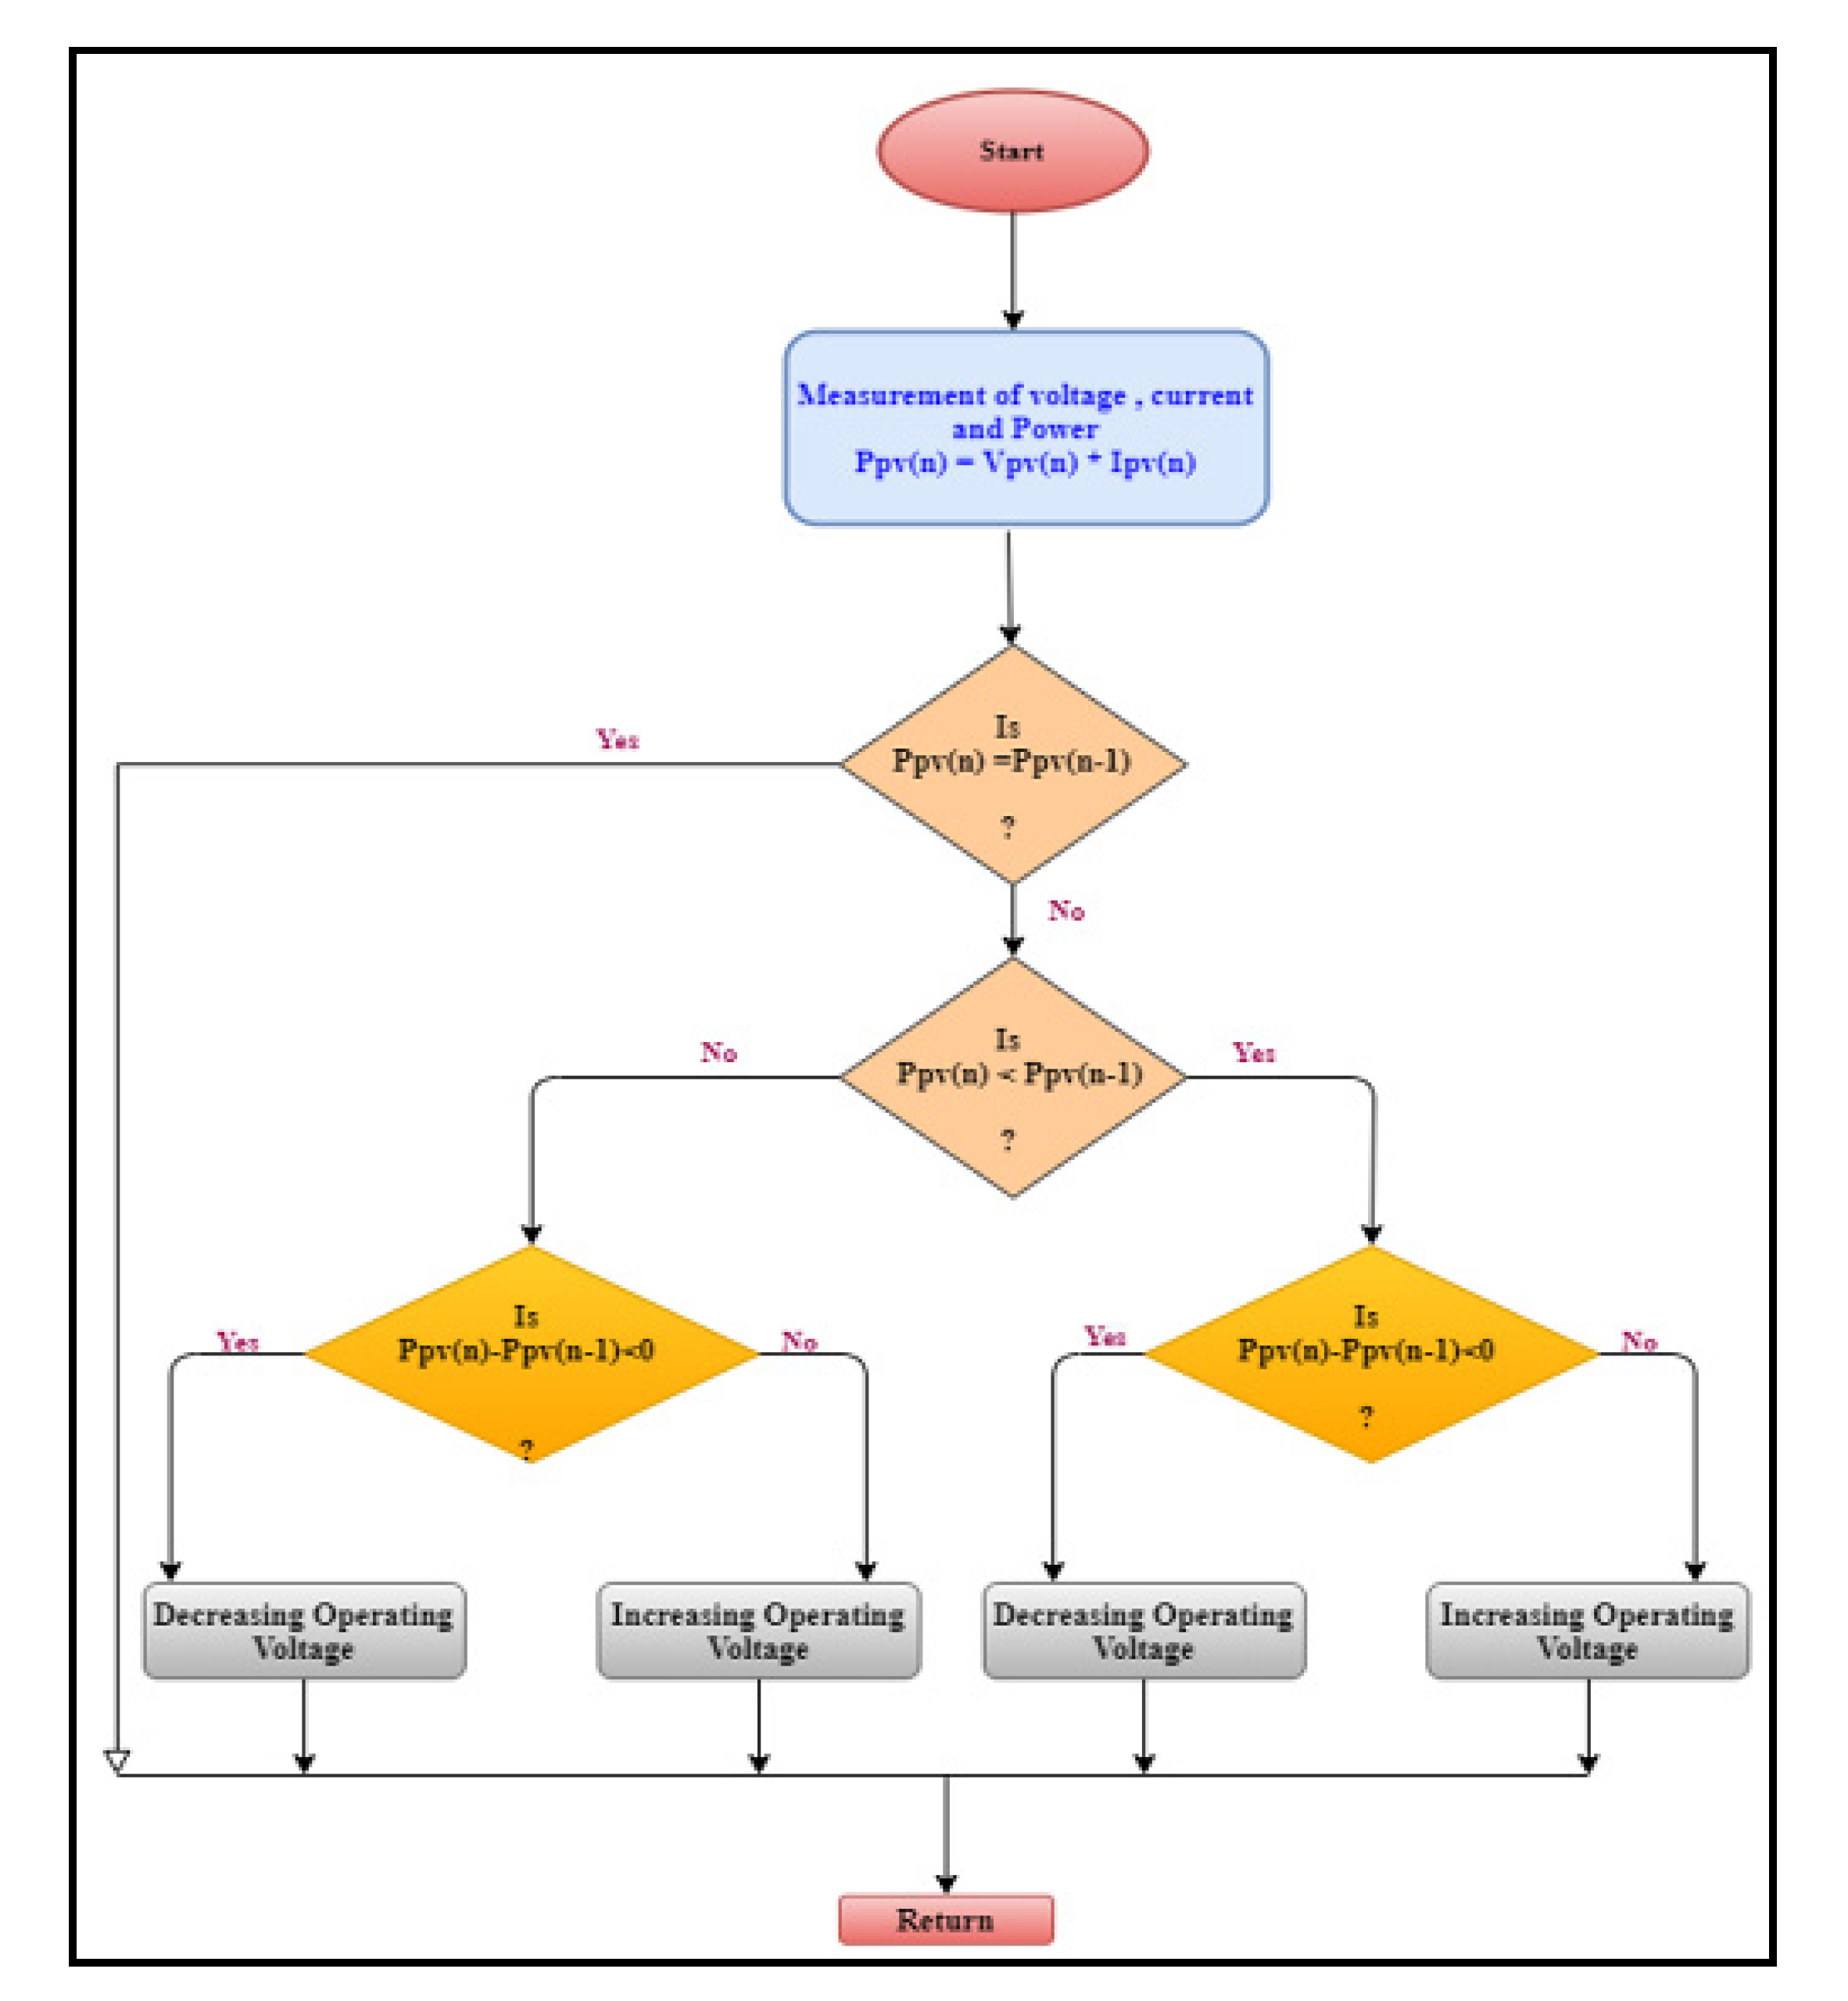
4. Modified Direct-Control Perturbation & Observation Technique

This technique is capable enough to track maximum power point (MPP) shown in Figure 9. The power level of the proposed technique was affected due to irradiance, unpredictable temperature and resistive (DC) load [26]. This method is very useful to obtain the MPP by the hill-climbing process. As per the literature, solar irradiance is directly proportional to power. If irradiance increases, power will be increased and vice versa. Table 3 represents the process of the implemented method [27]. The duty cycle plays a very vital role in deciding the perturbation. If the duty cycle is positive the change in power will be positive and the next perturbation will be positive. There are three more cases to discuss which are based on the duty cycle. If the change in power is negative (-ve) then the next perturbation will be negative that depends upon the nature of the duty cycle. In the next case, if the duty is negative and change in power is positive then the next perturbation would be negative. This process will be ongoing until it reaches the highest power [28].
The flow chart of this method shows very few sensors are utilized which makes it very cheap. The operating voltage is sampled and the algorithm changes the operating voltage in the required direction of slop dP/dV.
If dP/dV is positive, then the algorithm increases the voltage value towards the MPP until dP/dV is negative. This iteration is continued until the algorithm finally reaches the MPP. The voltage never actually reaches an exact value but perturbs around the MPP.
As soon as the slope becomes high the perturbation step will be more and vice versa. This calculation helps to improve the fast-tracking MPP.
There is so much literature available on various MPPT methods but the reason to choose this MPPT is improvisation in the conventional P&O by using direct controlling with the help of a proportional integral derivative (PID) controller. There are unique features associated with the proposed technique, which are also shown in Figure 8.
  • Very less PV array dependency;
  • It has the power to give true MPPT;
  • To get analog and digital output;
  • Having fast convergence speed;
  • Low complexity;
  • Having a fewer number of sensors.

5. Arm Cortex Microcontroller

There is a lack of literature for investigating the use of STMicroelectronics 32-bit arm as an MPPT controller with the specialty of an inexpensive, high performance, rapid processor, and easy to install feature which is supported by MATLAB 2014 and above versions. The microcontroller is a potential solution to the problem of low conversion efficiency in stand-alone solar systems. In this study, deploying MATLAB and STMicroelectronics−32-bit development board containing an ARM Cortex M4 microcontroller. For obtaining real-time operation on the PV system, the practical test is set up for easy and rapid changes with modified DC-P&O algorithm, to find the real data to track MPP in a short duration for small-scale stand-alone solar energy systems. Rapid control added more advantages to its performance. Mathematical models of modified DC-P&O are designed on MATLAB in Figure 9. The results were obtained under different irradiation and temperature levels with different modulation indexes. Designed Simulink models were transferred into the control board with the help of the Waijung block set on MATLAB [28,29].

Reasons to Choose

  • It has a 1 MB flash memory, 192 KB RAM in LQFP100 package running at 168 MHz providing a peak through 210 MIPs, comparatively greater than others (STM32 G491, STMG4 A1 with 512 KB of flash memory);
  • It has an on-board ST-LINK/V2 debugger for the hardware;
  • It has 3 × 12 bit, 2.4 MSPS A/D converter up to 24 channels, and 2 × 12 bit D/A converter;
  • General-purpose 16-stream DMA Controller with FIFOs;
  • There are 17 timers (12 for 16-bit and 2 for 32 bit with 168 MHz) present on the board;
  • There are six PWM channels with programmable dead time insertion;
  • The proposed hardware has 15 communication ports;
  • The proposed microcontroller has up to 5 V tolerances, which are better than existing microcontrollers.

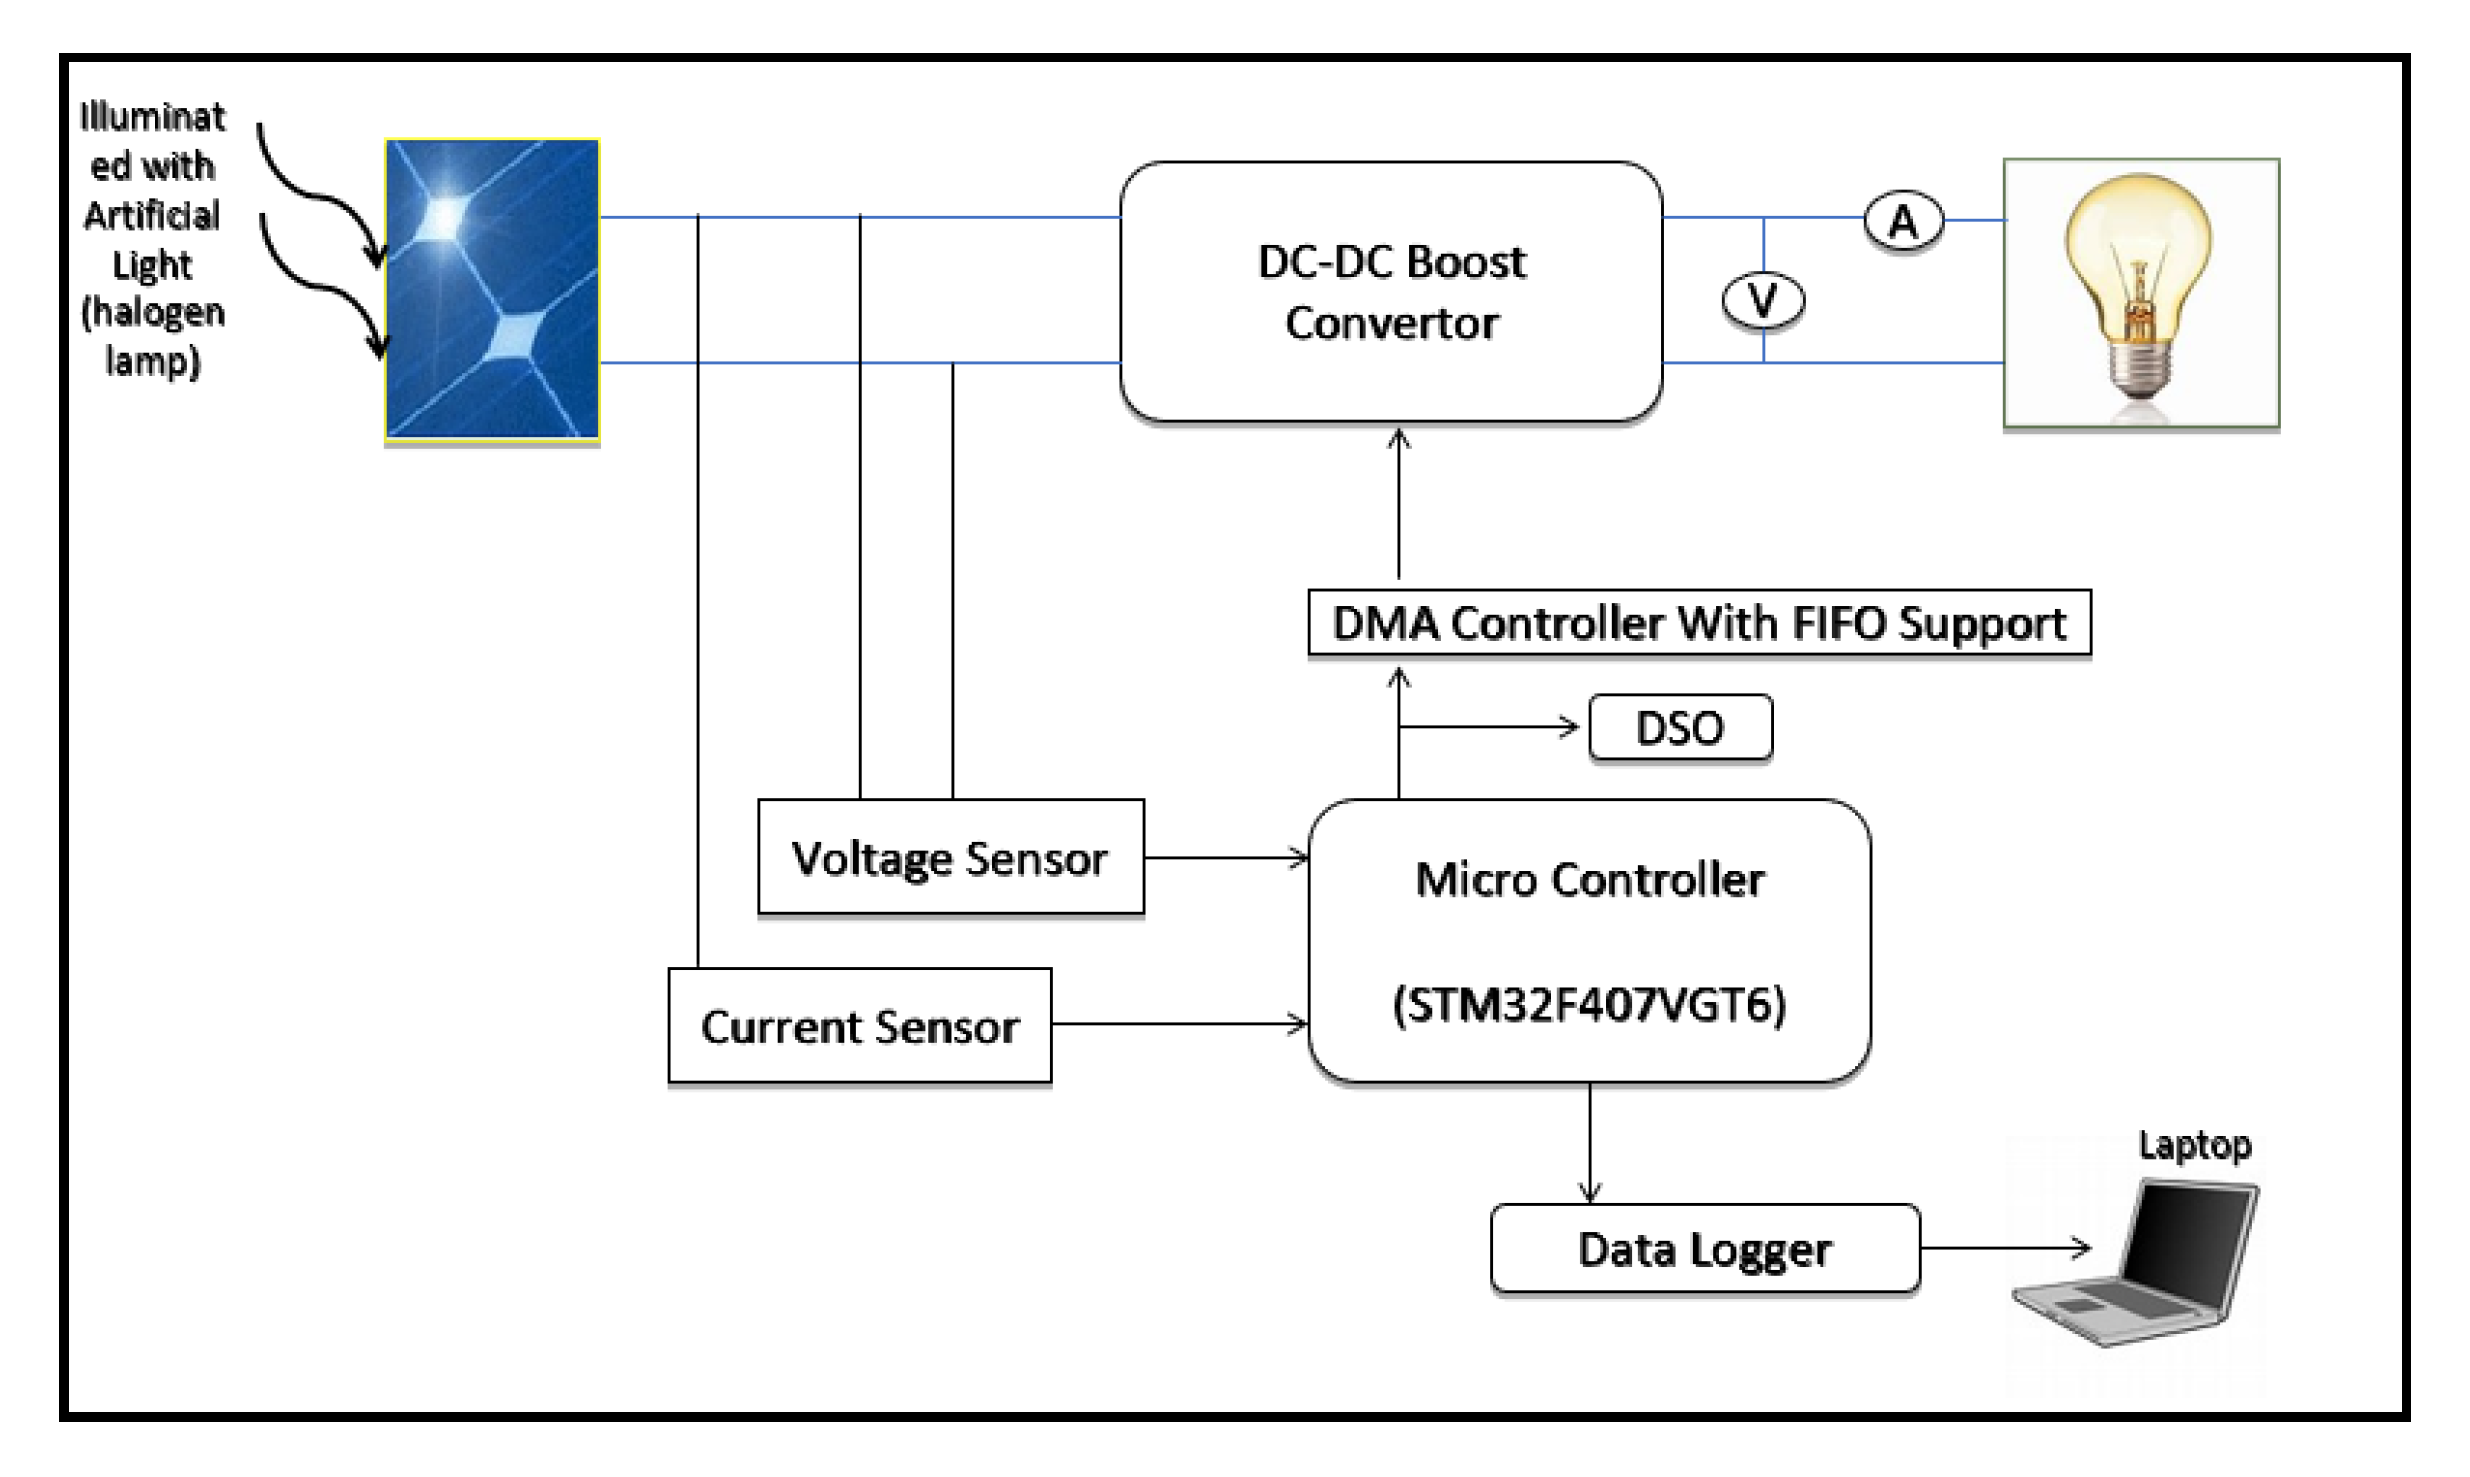
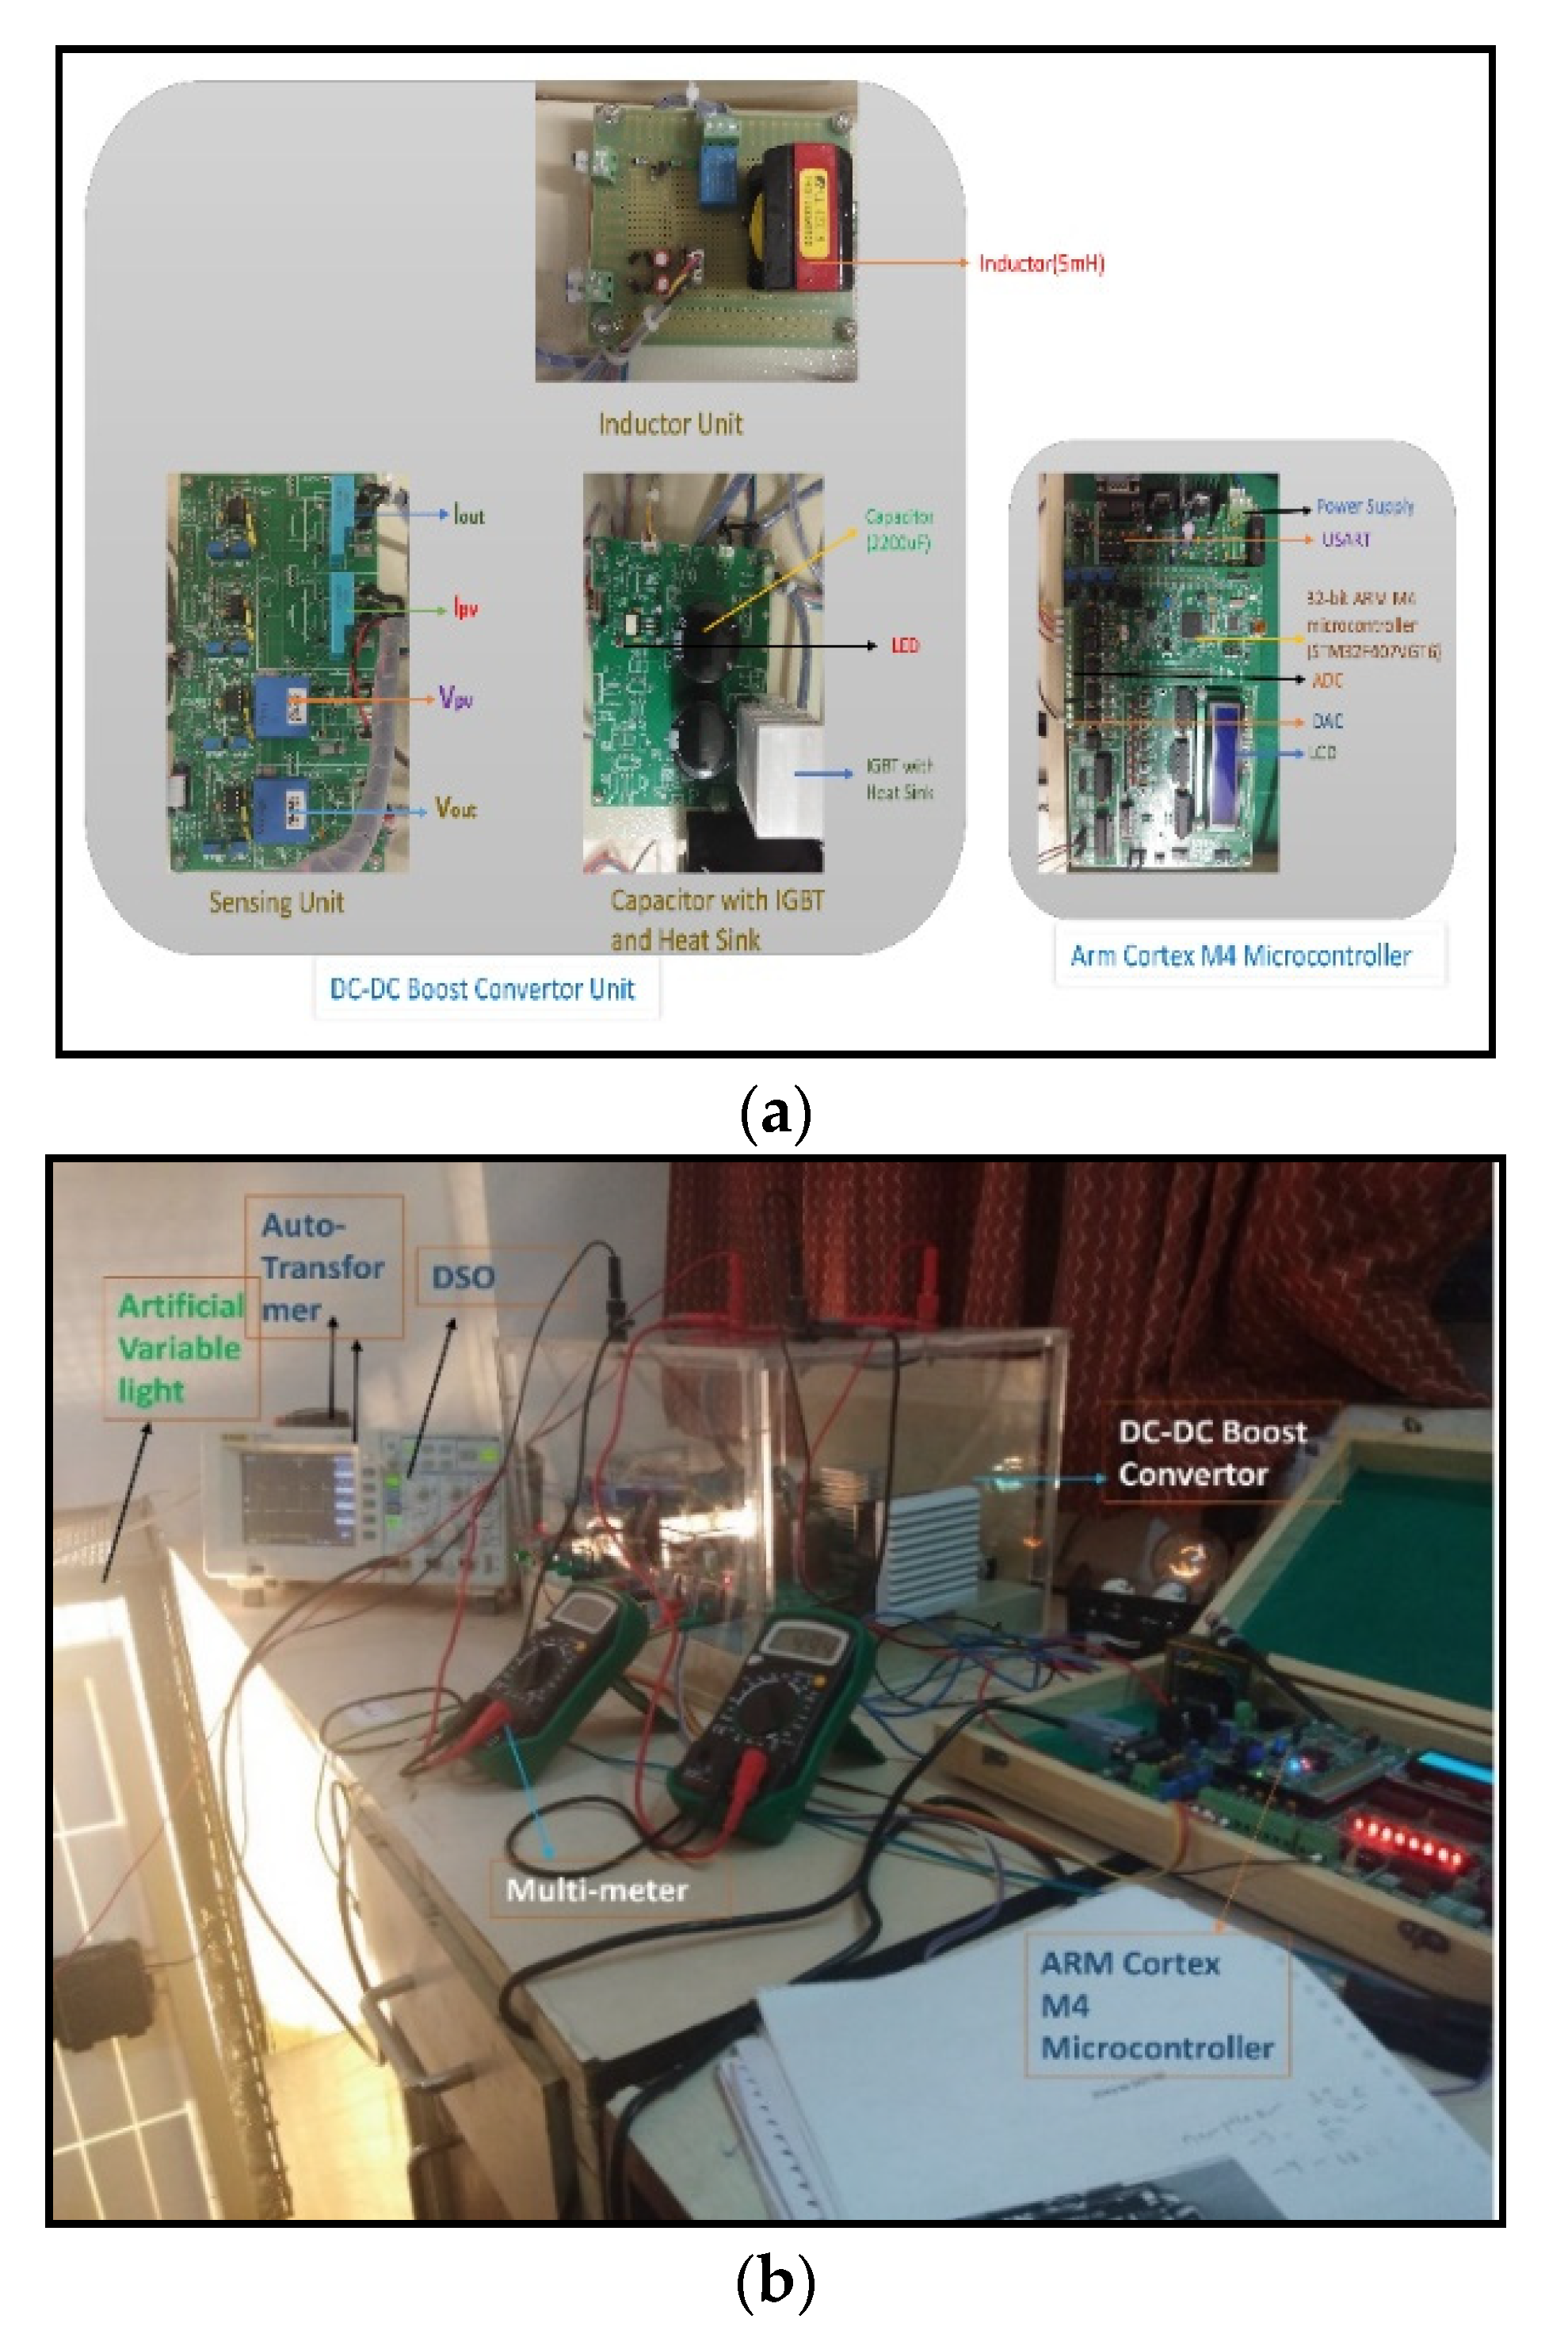
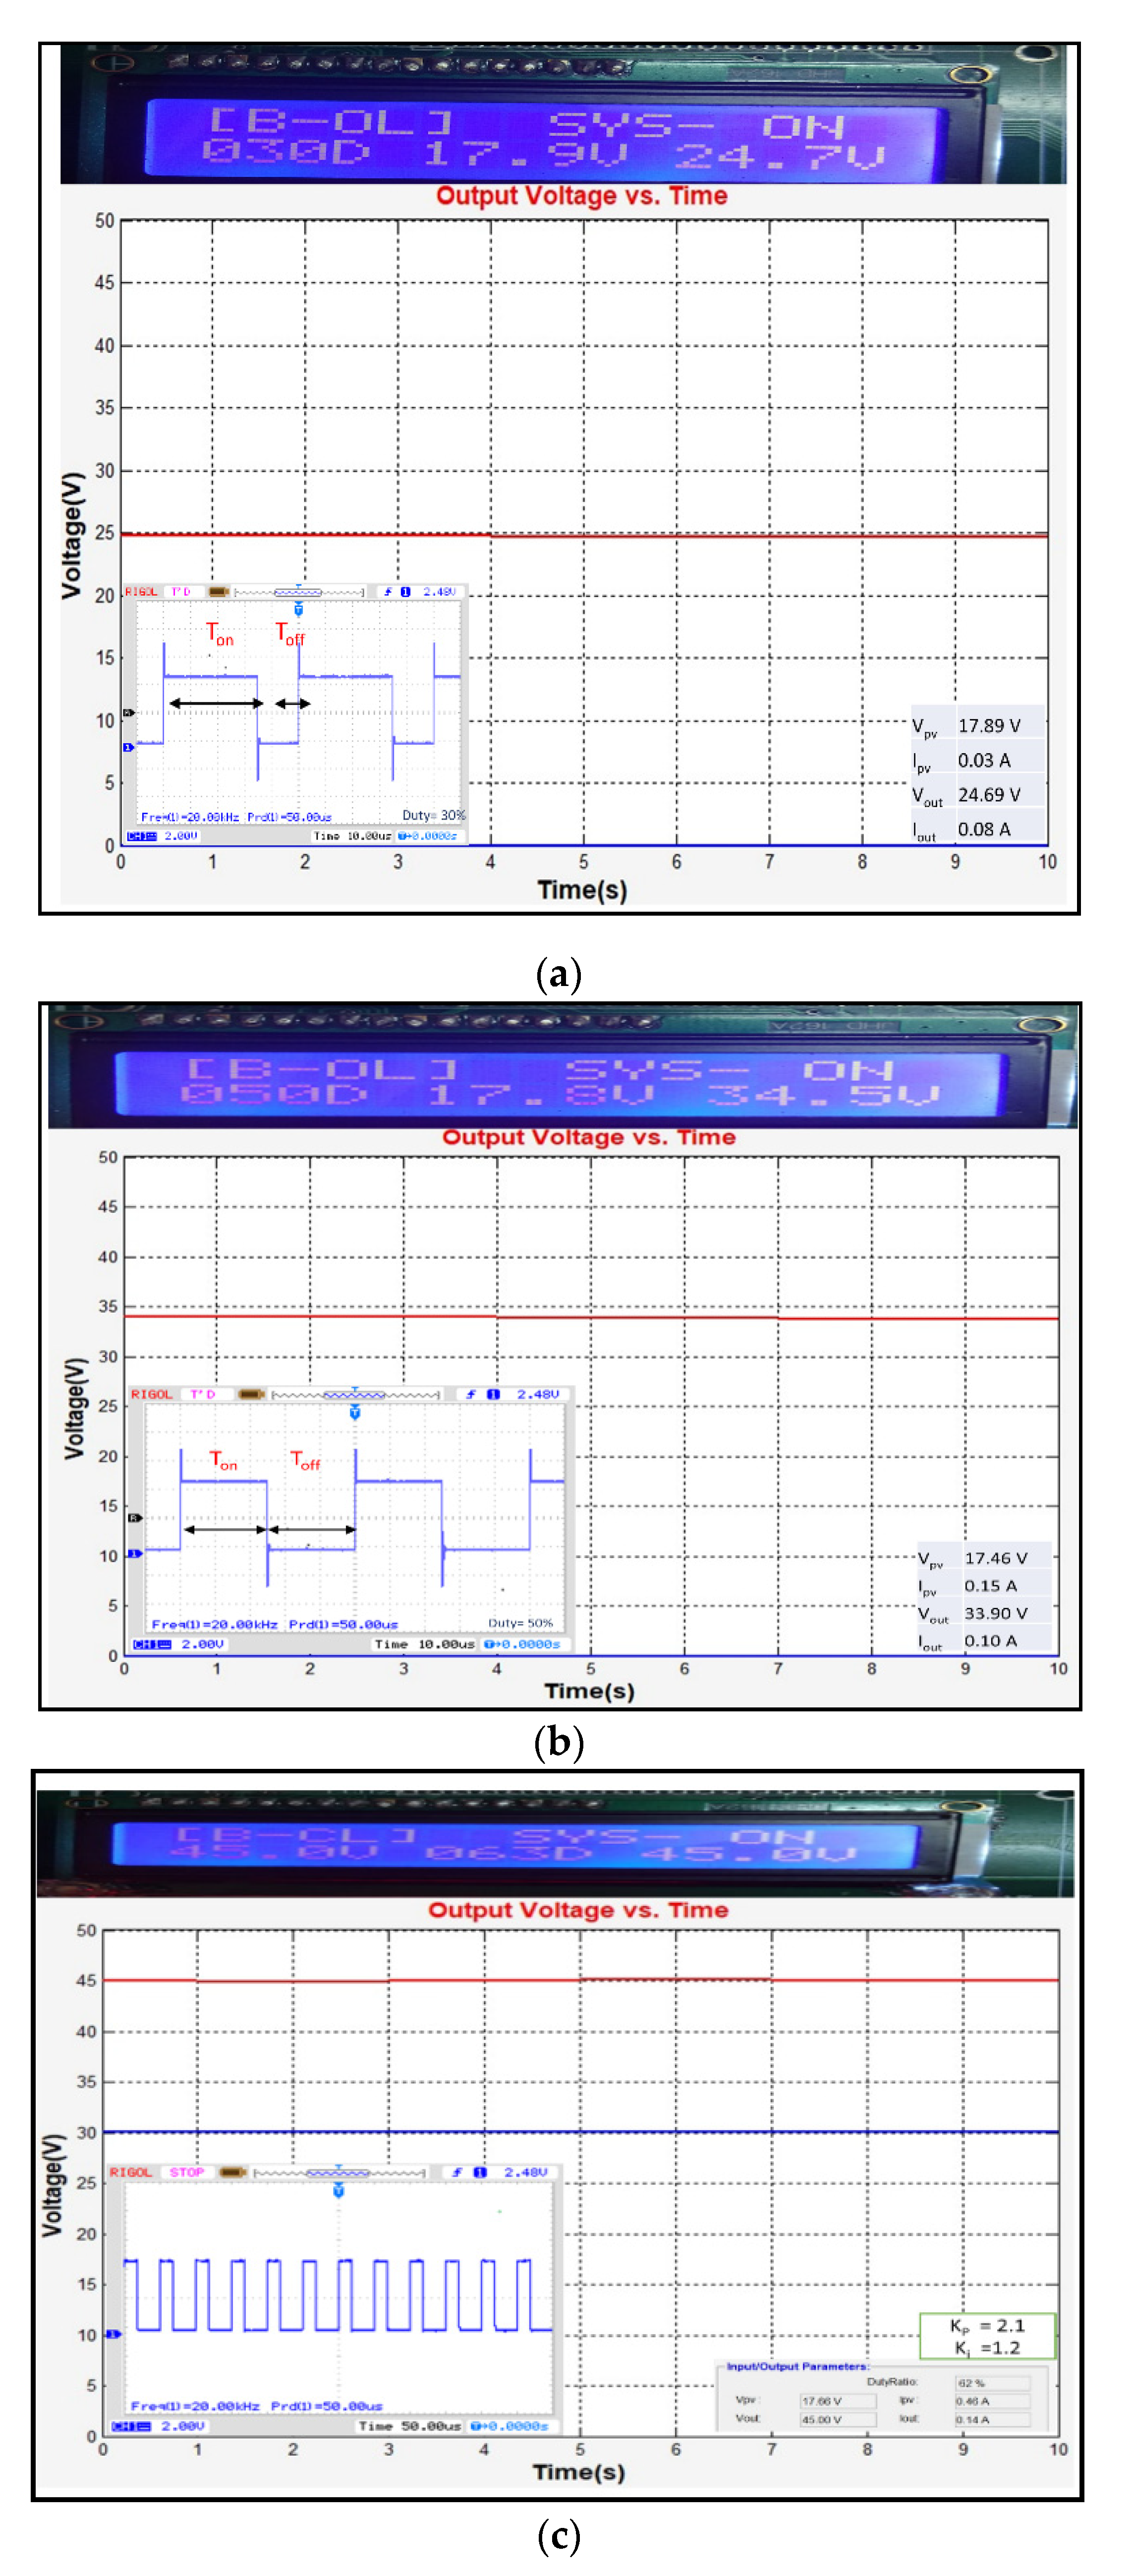
6. Experimental Setup

The experimental block diagram is shown in Figure 10 for testing the MPPT algorithm. The panel was illuminated with artificial light (halogen lamp); the intensity of artificial light was controlled by connecting the autotransformer and getting real data at different temperatures. The PV was connected to the DC–DC boost convertor as per the rating of the PV panel [30].
Input voltage and current are sensed by respective sensors and given input by the ARM Cortex M4 microcontroller (STM32 F407 VGT6). This ARM controller was used to simplify the process of the proposed MPPT and record the gate pulse through gate terminals or by sensing the output unit through a digital storage oscilloscope. A direct memory access (DMA) controller added more advantages with first in first out support (FIFO) for this user-friendly process with the help of PID. All data can be recorded with the help of a data logger, which is built-in programming [31,32]. The experimental set up is shown in Figure 11a,b.

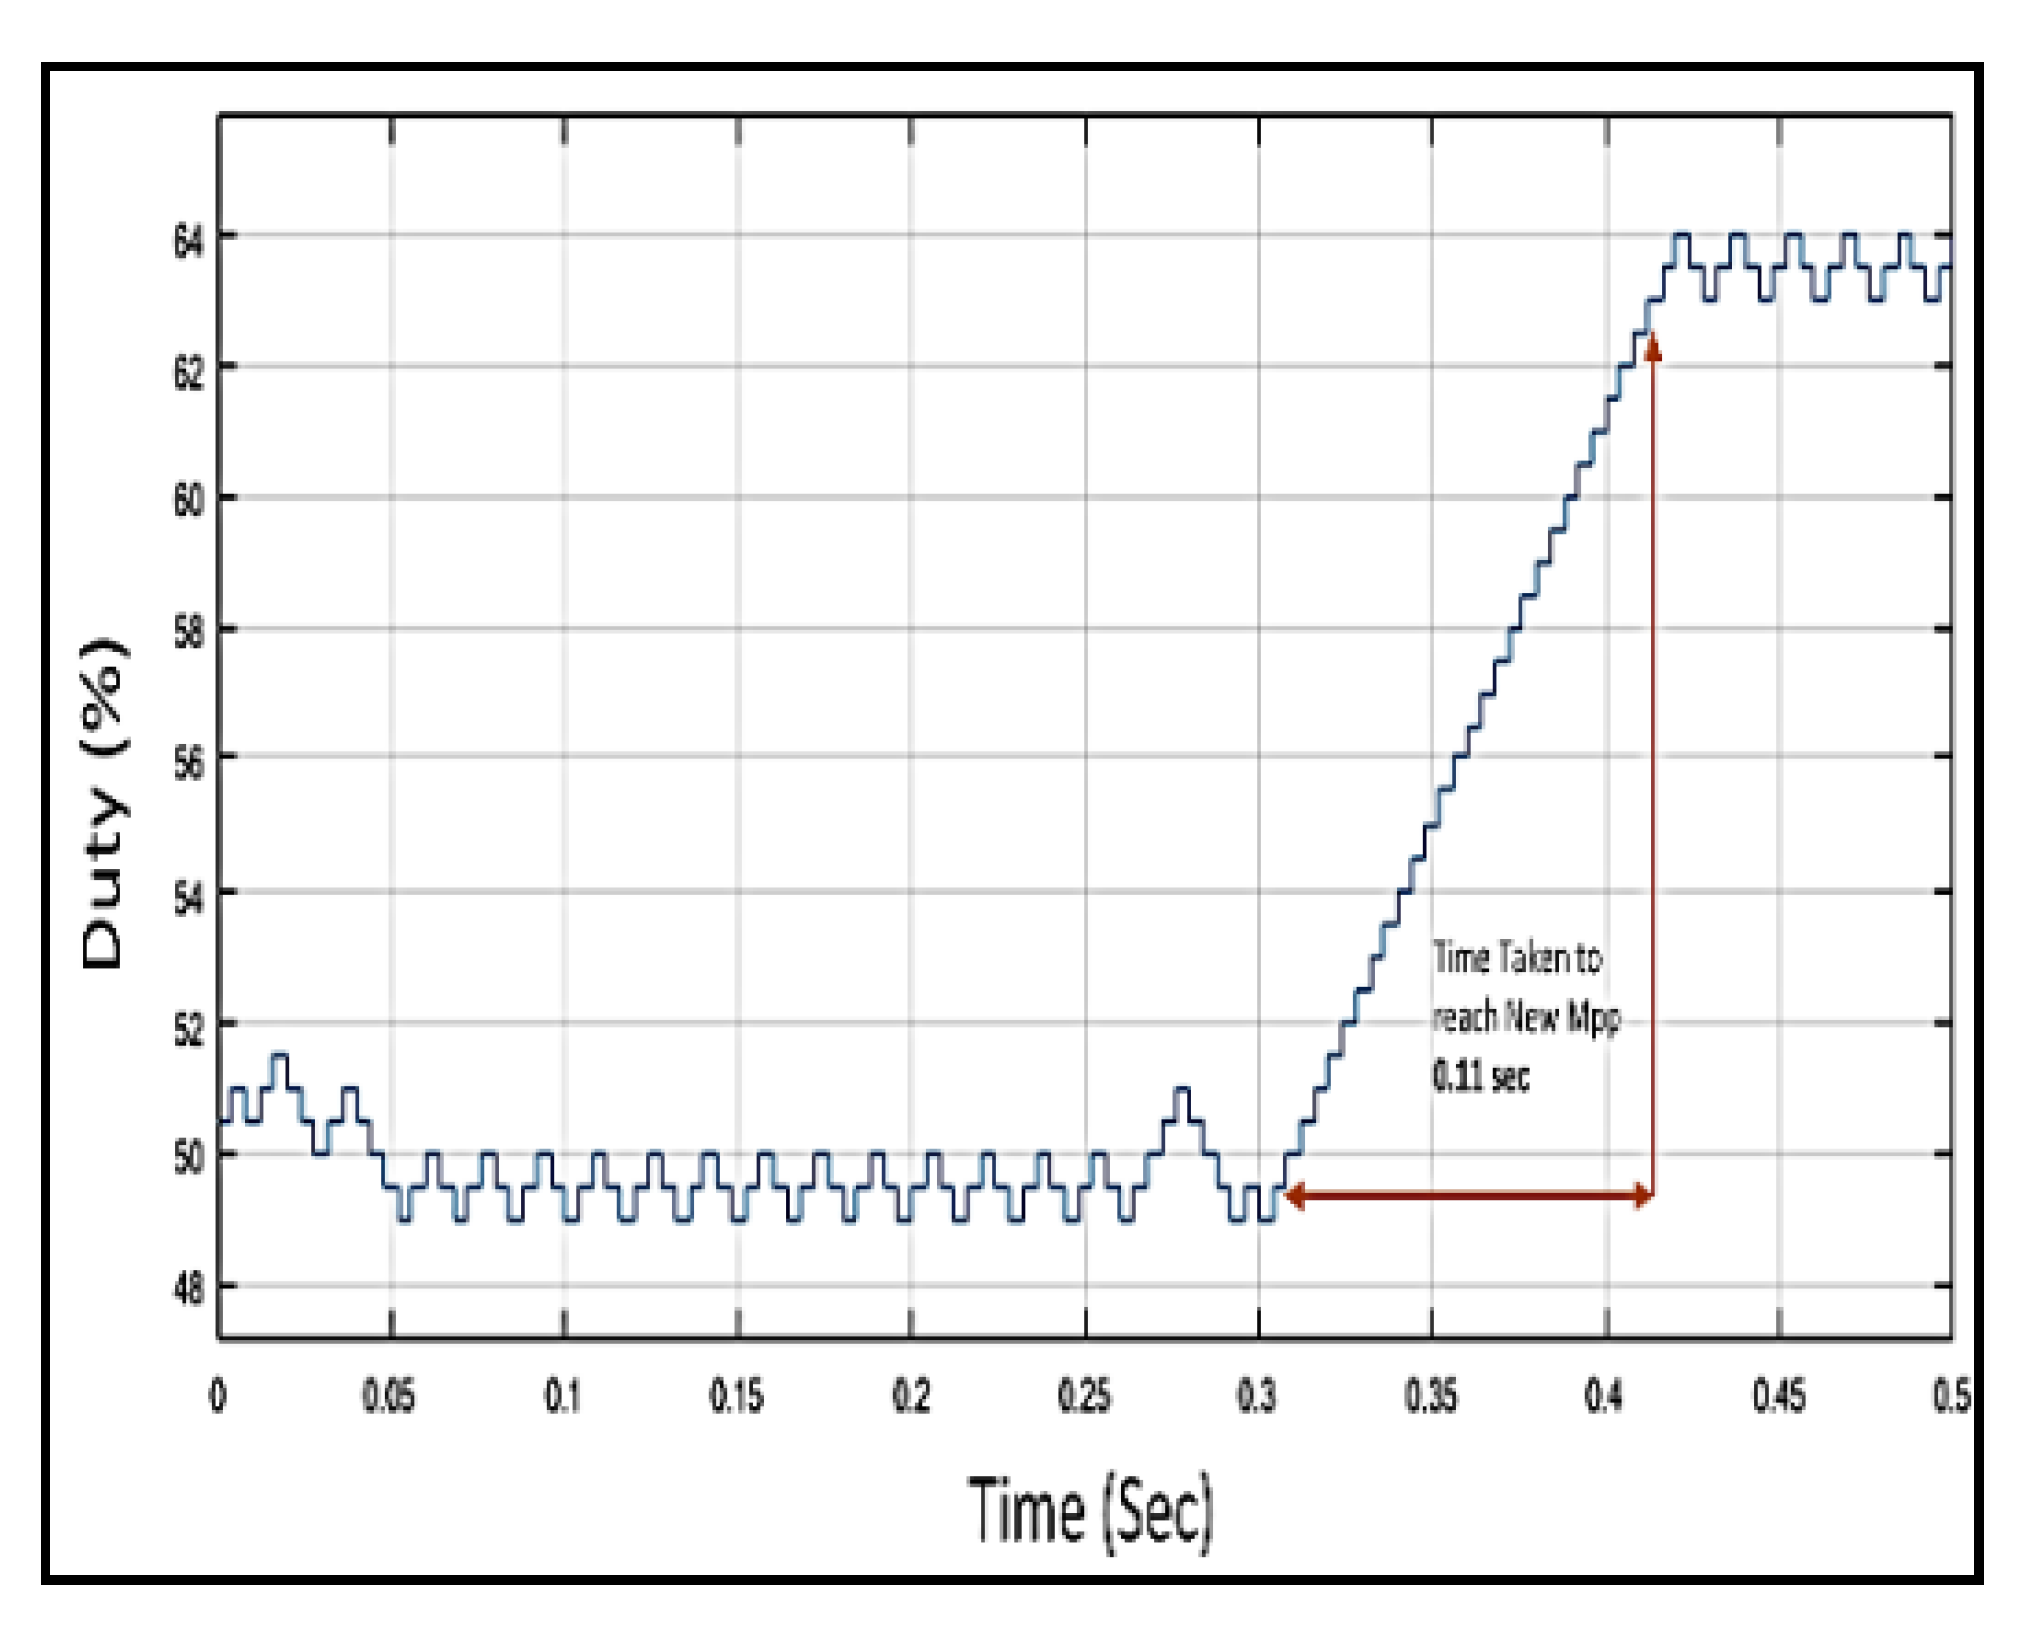
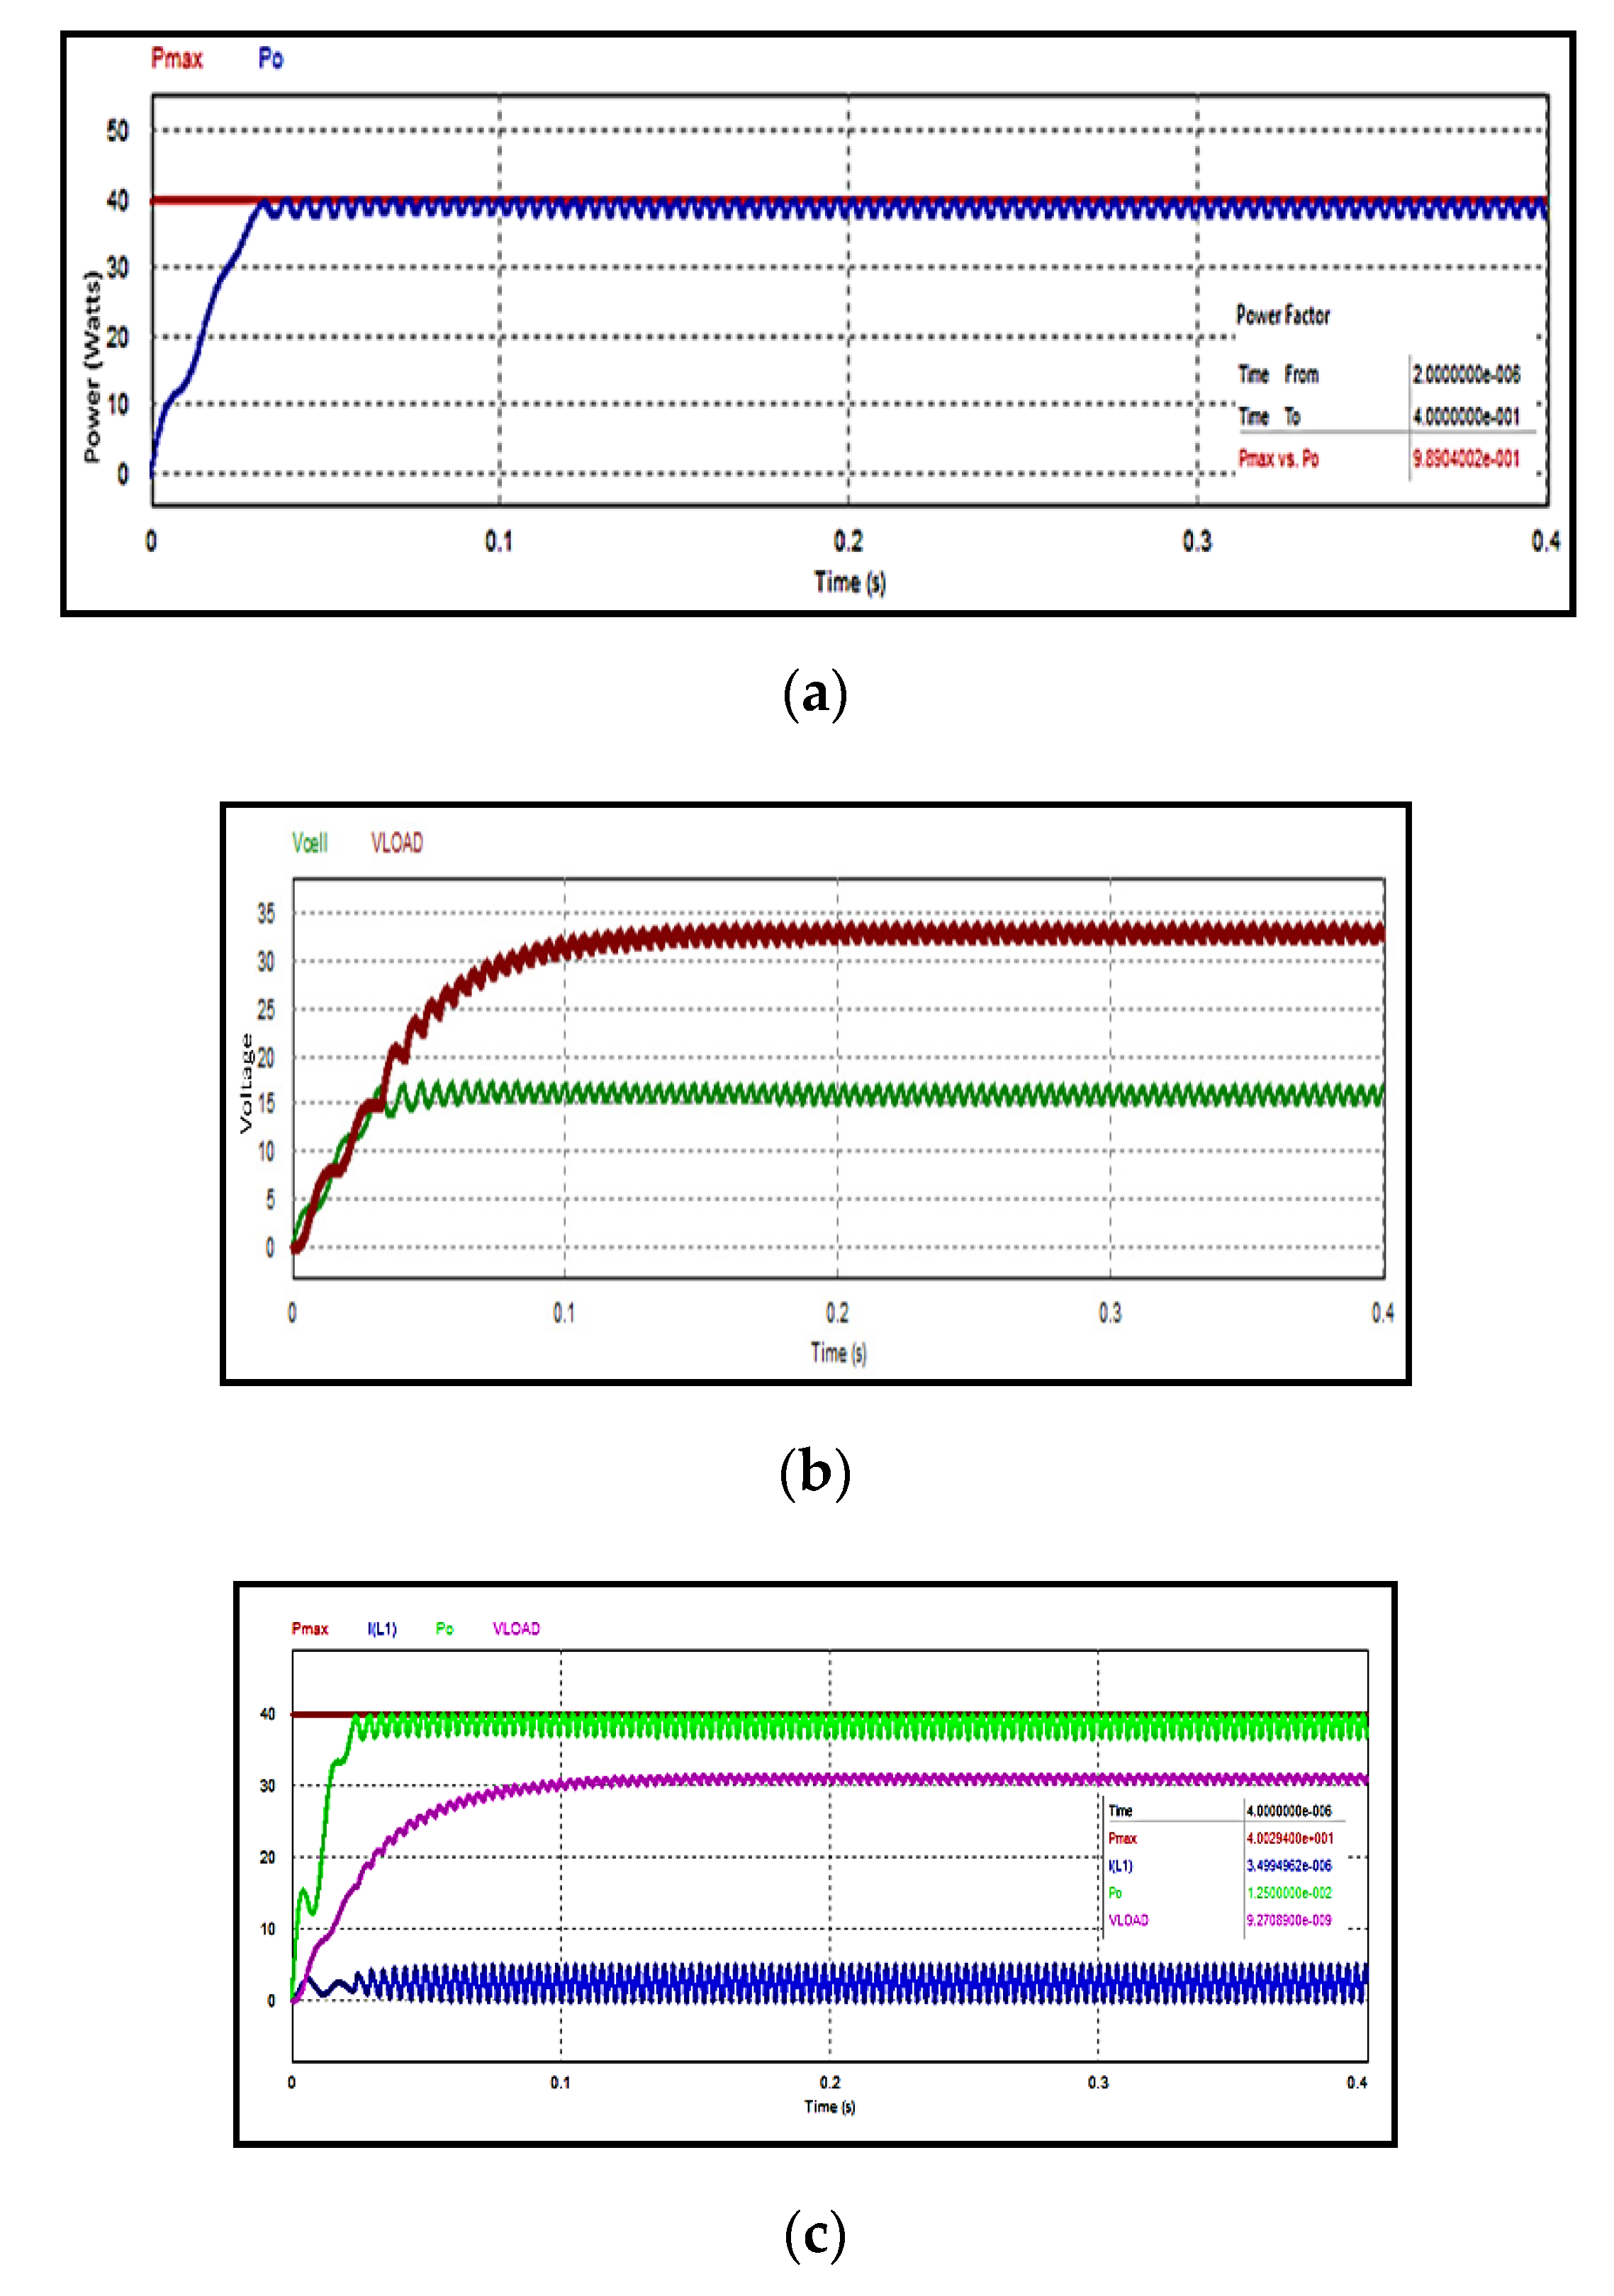
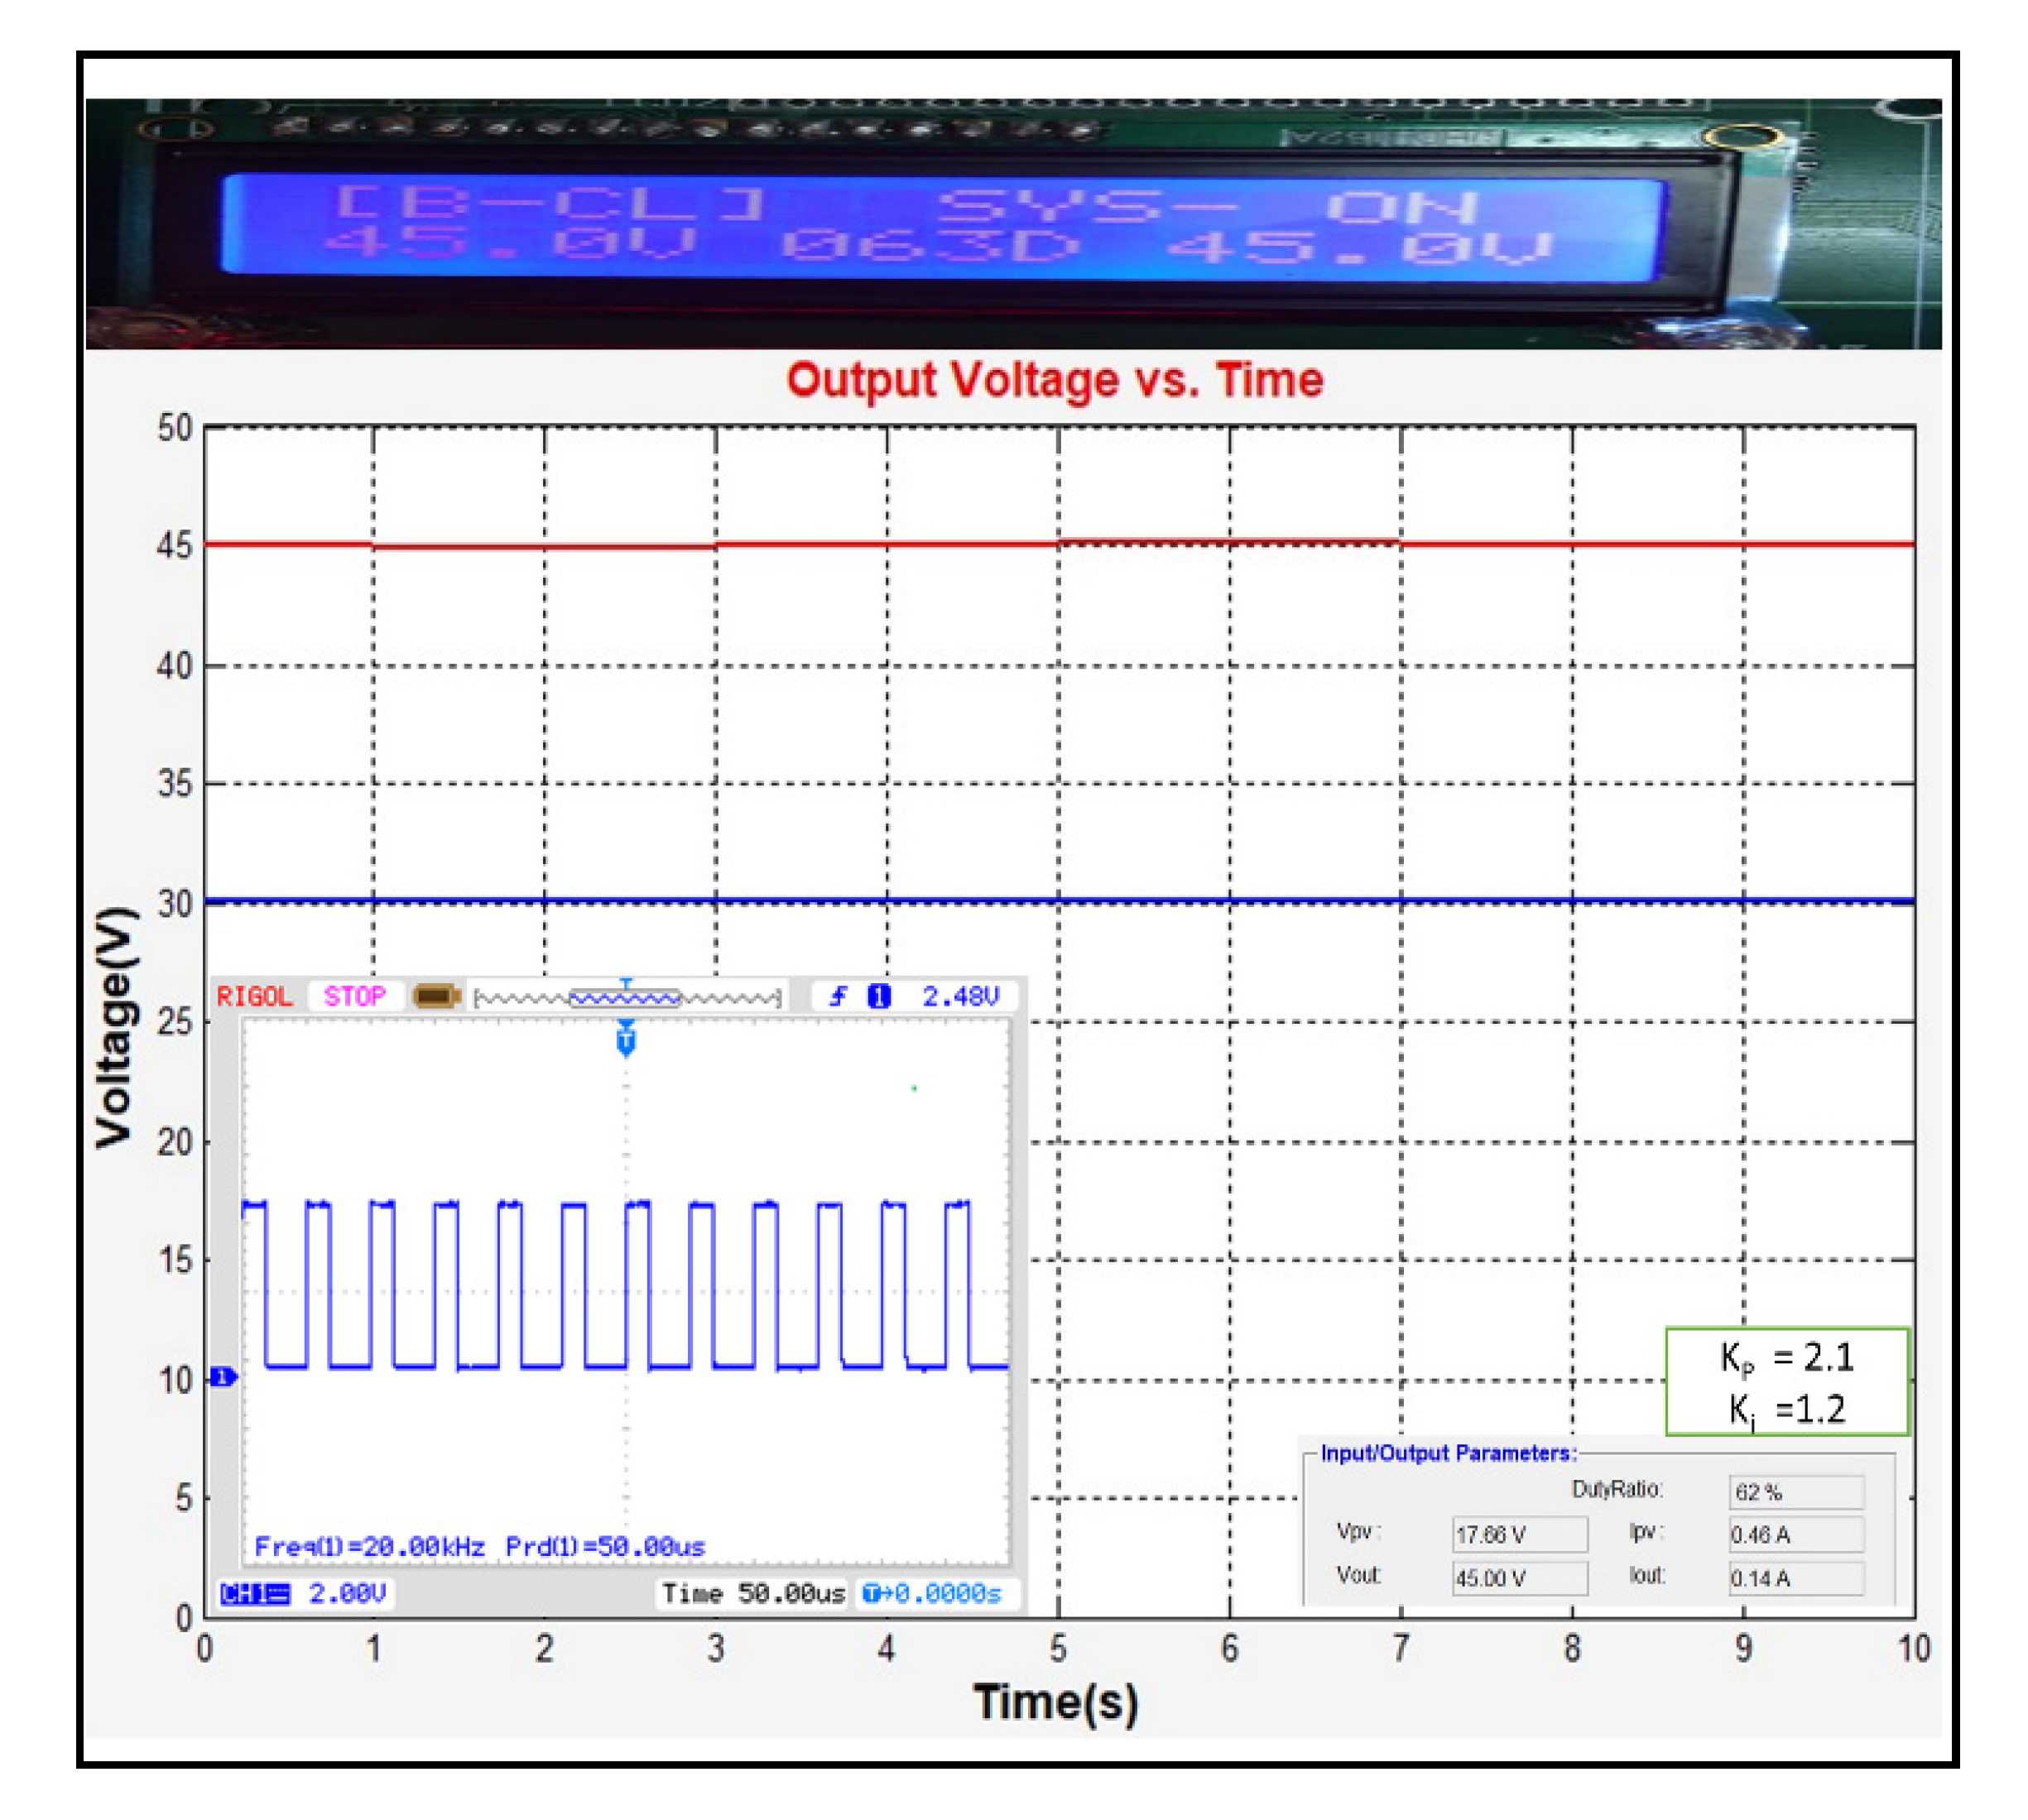
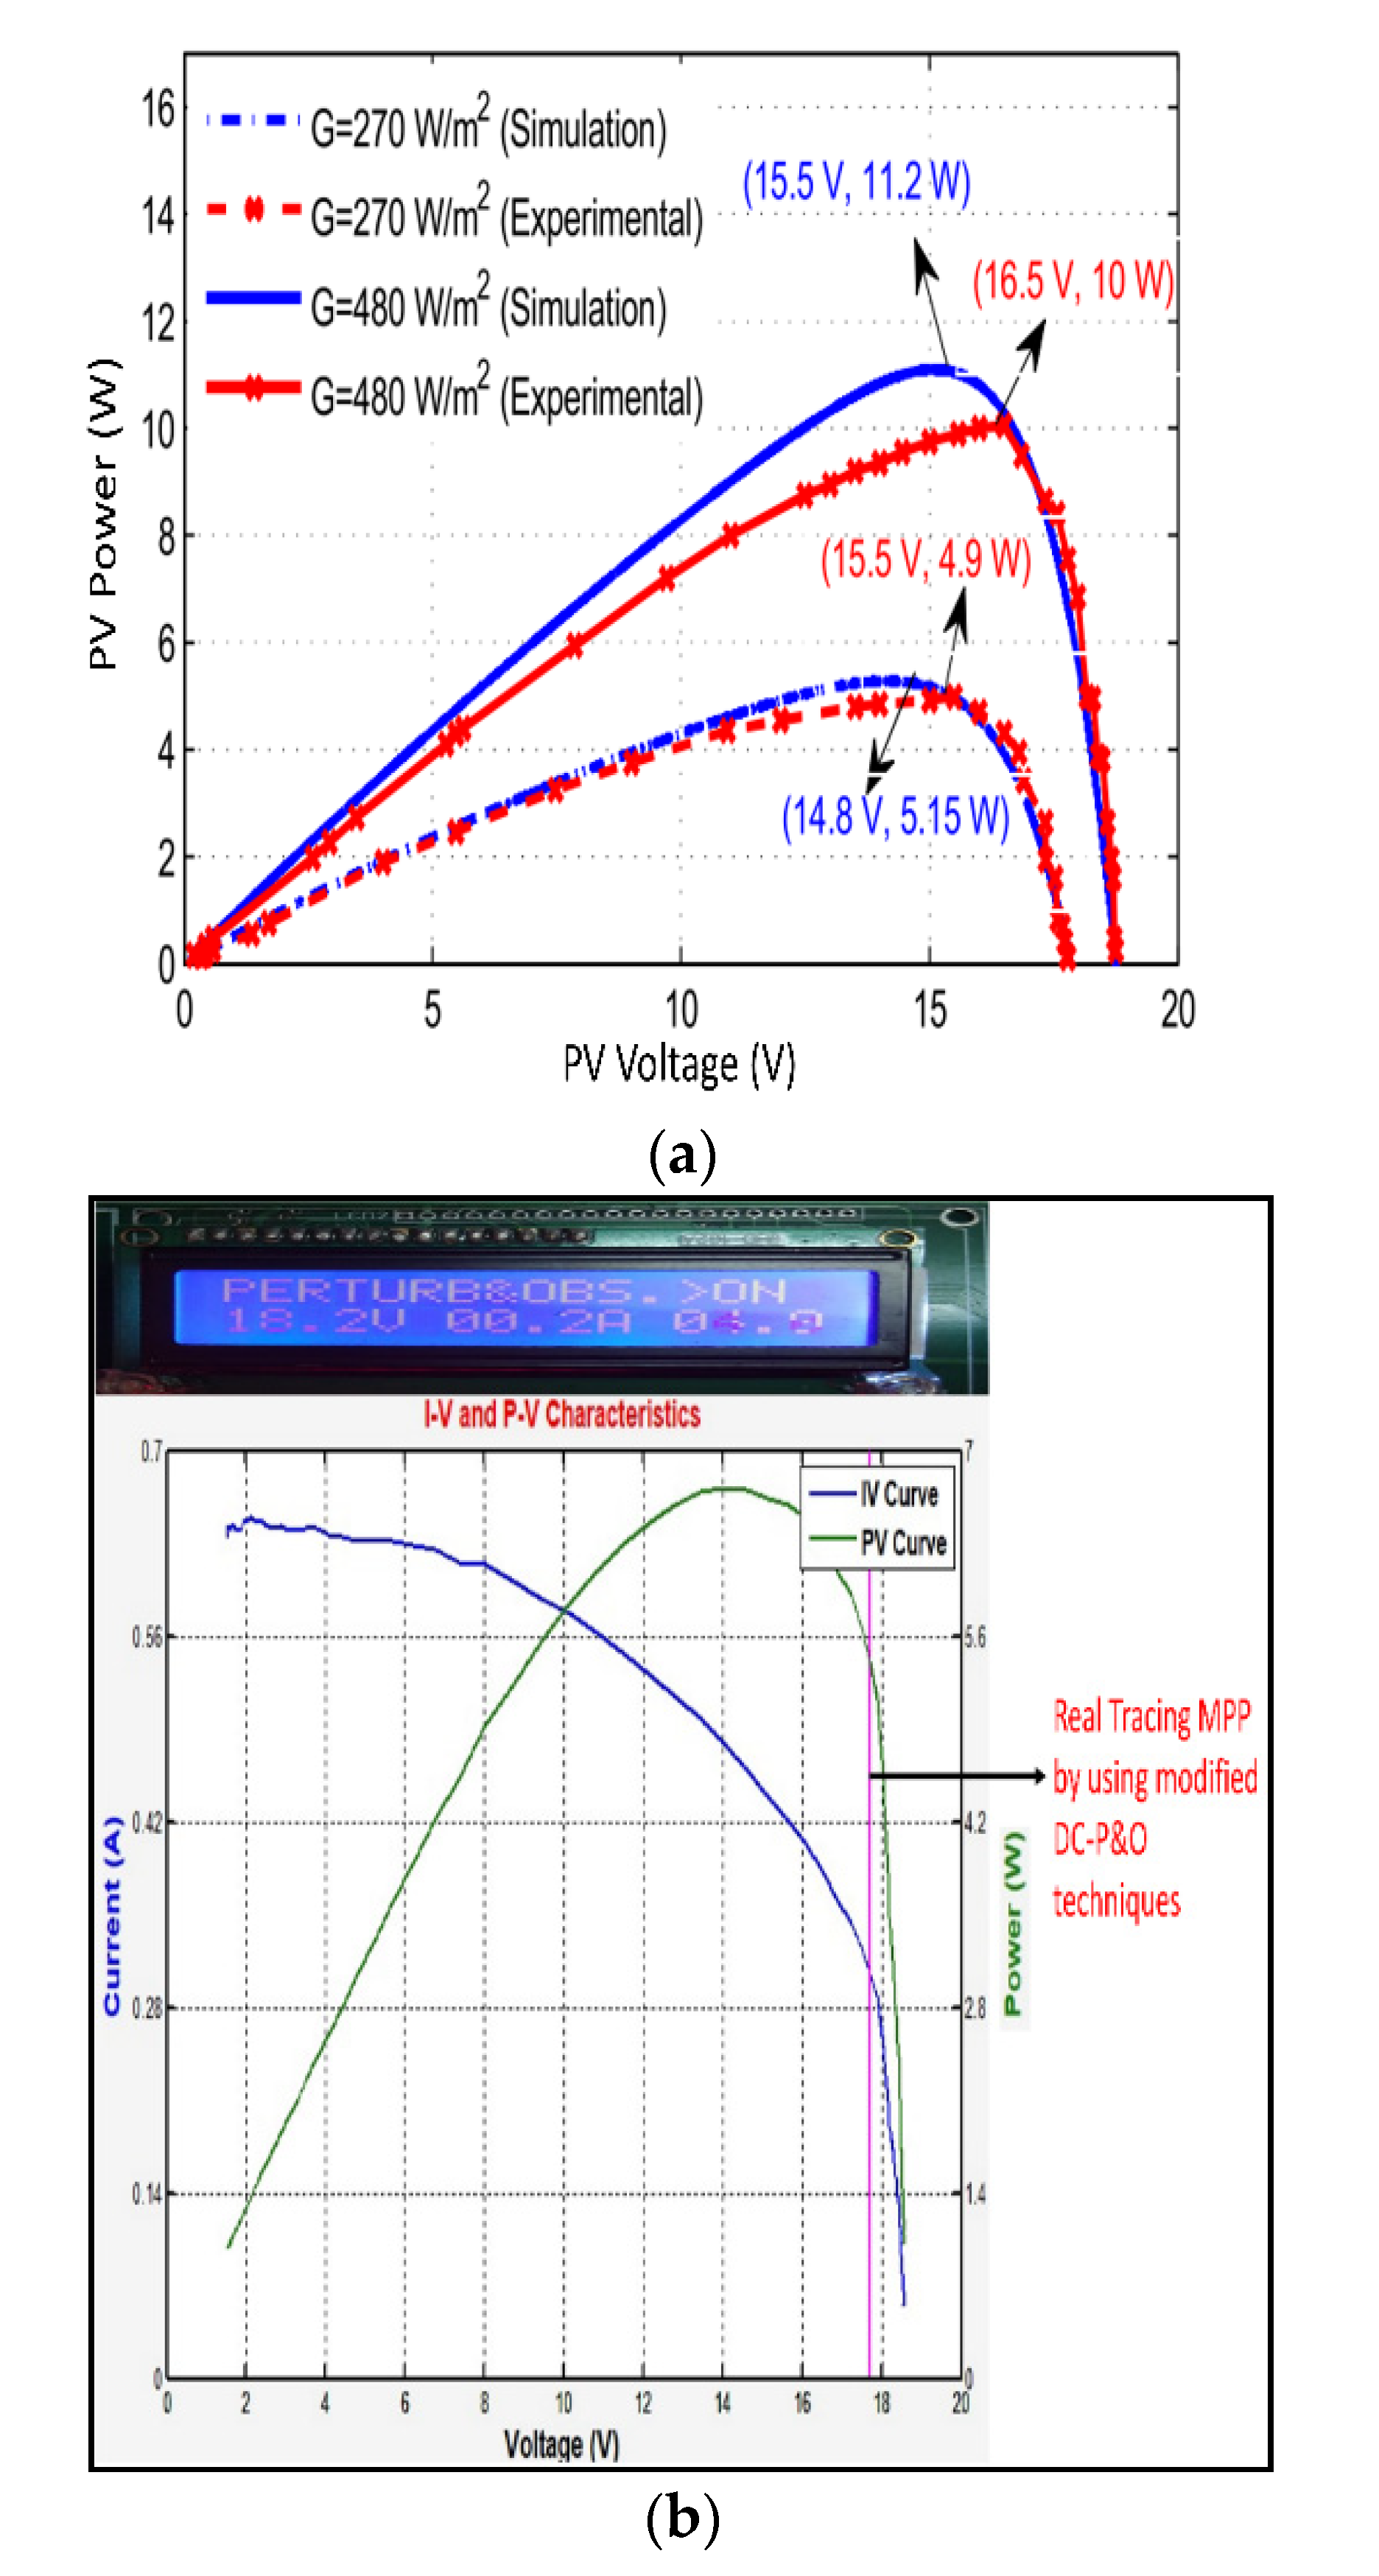
7. Results and Discussion

The attainment of the objectives was to look for an efficient, user-friendly, and high performing MPPT system with rapid changes. It allows the uses of electricity in the stand-alone DC grid. The simulation was tested in the MATLAB to understand the nature of the algorithm and introduce a quick transition in the system implementation [33,34].
Figure 12 represents the model of experimental studies with the ARM cortex microcontroller for implementation of the modified (DC-P&O) technique. This technique is quite useful and user-friendly with the ARM Cortex M4 microcontroller (STM32 F407 VGT6) for getting good results. This algorithm can reach the MPP within 0.11 sec as shown in Figure 13 [35,36].
The maximum output power was reached in a very short period of 0.02 s as shown in Figure 14. The proposed techniques help to reduce the steady-state oscillation and fast-tracking [37].
By varying the duty cycle of the boost converter (30% 50% 68%) for open-loop and closed-loop control, the convertor gave good real-time results on these duties cycles as the algorithm suggested [38].
By comparing the output voltage and control pulse of the DC–DC boost converter by simulation and hardware results at (30% 50% 68%), the duty cycle is shown in Figure 15.
In Figure 15, the open-loop control system of the boost convertor is shown for different duty cycles (30% 50% 68%). It is observed that as soon as the duty cycle increased the output voltage increased and the input voltage slightly decreased by 10 micro sec.
Figure 16 shows the result of a boost converter in the closed-loop control with the duty cycle of 63% where Kp and Ki are 2.1 and 1.2, respectively. The PID controller was used to control the gate pulse [39]. The gate pulse operates at 20 kHz in 50 micro sec for open loop and closed loop, respectively. In the real-time analysis, authors found that the boost convertor was more compatible with the ARM Cortex 32-bit microcontroller with the Waijung block [40].
It is clearly shown that the closed-loop action performed very well for getting an output voltage of 45 V with the supportive action of a boost convertor.
Figure 17a,b represents PV and IV curves at insolation of 270 W/m2 with real-time tracing of MPP by using the modified DC-P&O method. It is helpful to fetch the real-time parameters easily with the help of Waijung.
Comparative studies of hardware and software results of DC P&O technique at 270 W/M2 are shown in Table 4. Due to hardware limitations the experiment was not performed, only a simulation study was conducted at 800 W/M2.
It is essential to study the hardware results with the proposed technique from Table 5, where the open circuit voltage is 18.56 V, short circuit current is 0.635 A, maximum voltage is 15.5 V, max current is 0.48 A, and output power is 4.9 W, which is 6.5% more than conventional P&O and conversion efficiency is more than 7.9%.

8. Conclusions

The authors have analyzed the following:
  • The modified DC-P&O is having better results, i.e., output power is 4.9 W which is 6.5% more than convention P&O and conversion efficiency is more than 7.9% in comparison with conventional P&O.
  • The modified DC-P&O helps the boost converter for improving fast-tracking MPP through PID.
  • The proposed experiment can efficiently analyze the DC–DC boost converter operating in open-loop, closed-loop, real-time capturing and analyzing PV curve of MPPT.
  • The conversion efficiency of PV panel was found to be 84.48% with the ARM microcontroller in comparison to 76.56 % found from conventional P&O.
  • The proposed method is better suited to a stand-alone PV system because it requires a very low voltage (12–48 volts).

Author Contributions

Conceptualization, A.K.S. and N.S.B.; Methodology, K.A. and A.I.; Software, K.A., J.A.D., and A.M.; Validation, A.K.S., N.S.B. and P.K.C.; Formal analysis, A.M. and H.G.; Investigation, A.K.S., N.S.B. and K.A.; Resources, A.K.S. and K.A.; Data Curation, A.K.S. and J.A.D.; Writing—original draft preparation, V.K.S. and J.A.D.; Writing—review and editing, A.K.S., N.S.B., K.A. and J.A.D.; Visualization, A.M. and V.K.S.; Supervision, K.A., P.K.C. and H.G.; Project administration, A.K.S., N.S.B., K.A. and J.A.D. All authors have read and agreed to the published version of the manuscript.

Funding

This research received no external funding.

Institutional Review Board Statement

Not applicable.

Informed Consent Statement

Not applicable.

Data Availability Statement

Not applicable.

Conflicts of Interest

The authors declare no conflict of interest.

Abbreviation

TermDescription
MPPTMaximum power point technique
DC-P&ODirect control- perturbation & observe
RESRenewable energy sources
P&OPerturbation & observe
PSIMPower simulator
FLCFuzzy logic control
GSGreen sources
PVPhotovoltaic Cell
MPPMaximum power point
MOSFETMetal-oxide field-effect transistor
IGBTInsulated gate bipolar transistor
CCMContinuous conduction mode
PWMPulse width modulation
DCDirect current
PIDProportional integral derivative
RAMRandom access memory
D/ADigital to analog
DMADirect memory access
FIFOFirst in first out
VocOpen circuit voltage
IscShort circuit current
VmpVoltage at maximum power
ImpCurrent at maximum power
VoutOutput voltage
IoutOutput current
PoutOutput power

References

  1. Salman, S.; Xin, A.I.; Zhouyang, W.U. Design of a P-&-O algorithm based MPPT charge controller for a stand-alone 200W PV system. Prot. Control. Mod. Power Syst. 2018, 3, 1–8. [Google Scholar]
  2. Ahmad, R.; Murtaza, A.F.; Sher, H.A. Power tracking techniques for efficient operation of photovoltaic array in solar applications–A review. Renew. Sustain. Energy Rev. 2019, 101, 82–102. [Google Scholar] [CrossRef]
  3. Ram, J.P.; Rajasekar, N. A novel flower pollination based global maximum power point method for solar maximum power point tracking. IEEE Trans. Power Electron. 2017, 32, 8486–8499. [Google Scholar]
  4. Teng, J.H.; Huang, W.H.; Hsu, T.A.; Wang, C.Y. Novel and fast maximum power point tracking for photovoltaic generation. IEEE Trans. Ind. Electron. 2016, 63, 4955–4966. [Google Scholar] [CrossRef]
  5. Seyedmahmoudian, M.; Horan, B.; Soon, T.K.; Rahmani, R.; Oo, A.M.; Mekhilef, S.; Stojcevski, A. State of the art artificial intelligence-based MPPT techniques for mitigating partial shading effects on PV systems–A review. Renew. Sustain. Energy Rev. 2016, 64, 435–455. [Google Scholar] [CrossRef]
  6. Singh, O.; Gupta, S.K. A review on recent Mppt techniques for photovoltaic system. In Proceedings of the 2018 IEEMA Engineer Infinite Conference (eTechNxT), New Delhi, India, 13–14 March 2018; pp. 1–6. [Google Scholar]
  7. Dallago, E.; Liberale, A.; Miotti, D.; Venchi, G. Direct MPPT algorithm for PV sources with only voltage meas-urements. IEEE Trans. Power Electron. 2015, 30, 6742–6750. [Google Scholar] [CrossRef]
  8. Paz, F.; Ordonez, M. Zero oscillation and irradiance slope tracking for photovoltaic MPPT. IEEE Trans. Ind. Electron. 2014, 61, 6138–6147. [Google Scholar] [CrossRef]
  9. Rezk, H.; Eltamaly, A.M. A comprehensive comparison of different MPPT techniques for photovoltaic systems. Sol. Energy 2015, 112, 1–11. [Google Scholar] [CrossRef]
  10. Dengsheng, W.; Lidi, W.; Chuncheng, H.; Tong, L.; Chenglong, Z.; Chenyang, L. Research and Design of PV MPPT Based on STM32. In Proceedings of the 2018 Chinese Control and Decision Conference (CCDC), Shenyang, China, 9–11 June 2018; pp. 4971–4974. [Google Scholar]
  11. Ba, A.; Ehssein, C.O.; Mahmoud, M.E.; Hamdoun, O.; Elhassen, A. Comparative study of different DC/DC power converter for optimal PV system using MPPT (P&O) method. Appl. Sol. Energy 2018, 54, 235–245. [Google Scholar]
  12. Valenciaga, F.; Inthamoussou, F.A. A novel PV-MPPT method based on a second-order sliding mode gradient observer. Energy Convers. Manag. 2018, 176, 422–430. [Google Scholar] [CrossRef]
  13. Rekioua, D. MPPT methods in hybrid renewable energy systems. In Hybrid Renewable Energy Systems; Springer: Cham, Switzerland, 2020; pp. 79–138. [Google Scholar]
  14. National Institute of Solar Energy. Available online: https://www.mnre.gov.in (accessed on 18 August 2021).
  15. PV Performance Modeling Collaborative National Technology and Engineering Solutions of Sandia. Available online: https://pvpmc.sandia.gov/modeling-steps/2-dc-module-iv/diode-equivalent-circuit-models/ (accessed on 22 August 2021).
  16. Shang, L.; Guo, H.; Zhu, W. An improved MPPT control strategy based on incremental conductance algorithm. Prot. Control Mod. Power Syst. 2020, 5, 1–8. [Google Scholar] [CrossRef]
  17. Salman, S.; Xin, A.; Masood, A.; Jan, M.U.; Iqbal, S. Impact of DC-DC Converters for DC Grid Voltage Support. In Proceedings of the 2019 IEEE 3rd Conference on Energy Internet and Energy System Integration (EI2), Changsha, China, 8–10 November 2019; pp. 1949–1953. [Google Scholar]
  18. Mahmood, M.H.; Ali, I.I.; Ahmed, O.A. Design and Implementation of Intelligent MPPT Based on FPGA for PV System. In IOP Conference Series: Materials Science and Engineering; IOP Publishing: Philadelphia, PA, USA, 2020; Volume 881, p. 012138. [Google Scholar]
  19. Kulaksiz, A.A.; Alhajomar, F.; Gokkus, G. Rapid Control Prototyping based on 32-Bit ARM Cortex-M3 Microcontroller for Photovoltaic MPPT Algorithms. Int. J. Renew. Energy Res. (IJRER) 2019, 9, 1938–1947. [Google Scholar]
  20. Kabalci, E. Maximum power point tracking (MPPT) algorithms for photovoltaic systems. In Energy Harvesting and Energy Efficiency; Springer: Cham, Switzerland, 2017; pp. 205–234. [Google Scholar]
  21. Li, S. A variable-weather-parameter MPPT control strategy based on MPPT constraint conditions of PV system with inverter. Energy Convers. Manag. 2019, 197, 111873. [Google Scholar] [CrossRef]
  22. Necaibia, S.; Kelaiaia, M.S.; Labar, H.; Necaibia, A. Implementation of an improved incremental conductance MPPT control based boost converter in photovoltaic applications. Int. J. Emerg. Electr. Power Syst. 2017, 18, 1–19. [Google Scholar] [CrossRef]
  23. Elyaqouti, M.; Hakim, S.; Farhat, S.; Bouhouch, L.; Ihlal, A. Implementation in Arduino of MPPT using variable step size P&O algorithm in PV installations. Int. J. Power Electron. Drive Syst. 2017, 8, 434. [Google Scholar]
  24. Hashim, N.; Salam, Z.; Johari, D.; Ismail, N.F.N. DC-DC boost converter design for fast and accurate MPPT algorithms in stand-alone photovoltaic system. Int. J. Power Electron. Drive Syst. 2018, 9, 1038. [Google Scholar] [CrossRef]
  25. Dhaouadi, G.U.I.Z.A.; Djamel, O.U.N.N.A.S.; Youcef, S.O.U.F.I.; Salah, C. Implementation of incremental conductance based MPPT algorithm for photovoltaic system. In Proceedings of the 2019 4th International Conference on Power Electronics and their Applications (ICPEA), Elazig, Turkey, 25–27 September 2019; pp. 1–5. [Google Scholar]
  26. Abdel-Salam, M.; El-Mohandes, M.T.; El-Ghazaly, M. An efficient tracking of MPP in PV systems using a newly-formulated P&O-MPPT method under varying irradiation levels. J. Electr. Eng. Technol. 2020, 15, 501–513. [Google Scholar]
  27. Abdel-Salam, M.; Mohamed-Tharwat, E.M.; Goda, M. On the Improvements of Perturb-and-Observe-Based MPPT in PV Systems. In Modern Maximum Power Point Tracking Techniques for Photovoltaic Energy Systems; Springer: Cham, Switzerland, 2020; pp. 165–198. [Google Scholar]
  28. Kenan, Ö.Z.E.L.; Karaarslan, A. The design of standalone pv system using p&o algorithm for maximum power point tracking. Commun. Fac. Sci. Univ. Ank. Ser. A2-A3 Phys. Sci. Eng. 2020, 62, 14–25. [Google Scholar]
  29. Haque, A. Maximum power point tracking (MPPT) scheme for solar photovoltaic system. Energy Technol. Policy 2014, 1, 115–122. [Google Scholar] [CrossRef]
  30. Haque, A. A fast and reliable perturb and observe maximum power point tracker for solar PV system. Int. J. Syst. Assur. Eng. Manag. 2017, 8, 773–787. [Google Scholar] [CrossRef]
  31. Jotham Jeremy, L.; Ooi, C.A.; Teh, J. Non-isolated conventional DC-DC converter comparison for a photovoltaic system: A review. J. Renew. Sustain. Energy 2020, 12, 013502. [Google Scholar] [CrossRef]
  32. Babu, S.S.; Chary, S.S.K.; Abdullah, S.M.; Elangovan, D.; Karuppa, R.R.T. Design and analysis of power convertors for electric vehicle applications. In IOP Conference Series: Earth and Environmental Science; IOP Publishing: Philadelphia, PA, USA, 2019; Volume 312, p. 012026. [Google Scholar]
  33. Ram, J.P.; Babu, T.S.; Rajasekar, N. A comprehensive review on solar PV maximum power point tracking techniques. Renew. Sustain. Energy Rev. 2017, 67, 826–847. [Google Scholar] [CrossRef]
  34. Chaibi, Y.; Salhi, M.; El-Jouni, A. Sliding mode controllers for standalone PV systems: Modeling and approach of control. Int. J. Photoenergy 2019, 2019, 5092078. [Google Scholar] [CrossRef] [Green Version]
  35. Rezaei, M.M.; Asadi, H. A modified perturb-and-observe-based maximum power point tracking technique for photovoltaic energy conversion systems. J. Control Autom. Electr. Syst. 2019, 30, 822–831. [Google Scholar] [CrossRef]
  36. Schuss, C.; Fabritius, T.; Eichberger, B.; Rahkonen, T. Moving photovoltaic installations: Impacts of the sampling rate on maximum power point tracking algorithms. IEEE Trans. Instrum. Meas. 2019, 68, 1485–1493. [Google Scholar] [CrossRef]
  37. Necaibia, S.; Kelaiaia, M.S.; Labar, H.; Necaibia, A.; Logerais, P.O. Boost Chopper Implementation based on Variable MPPT Duty Cycle Control Applied to Photovoltaic Systems. In Proceedings of the 2017 International Renewable and Sustainable Energy Conference (IRSEC), Tangier, Morocco, 4–7 December 2017; pp. 1–6. [Google Scholar]
  38. Singhal, A.K.; Narvey, R.; Gwalior, S. PSIM and MATLAB based Simulation of PV Array for Enhance the Performance by using MPPT Algorithm. Int. J. Electr. Eng. (IEEE) 2011, 4, 511–520. [Google Scholar]
  39. Jana, S.; Kumar, N.; Mishra, R.; Sen, D.; Saha, T.K. Development and implementation of modified MPPT algorithm for boost converter-based PV system under input and load deviation. Int. Trans. Electr. Energy Syst. 2020, 30, e12190. [Google Scholar] [CrossRef]
  40. Bayrak, G.; Ghaderi, D. An improved step-up converter with a developed real-time fuzzy-based MPPT controller for PV-based residential applications. Int. Trans. Electr. Energy Syst. 2019, 29, e12140. [Google Scholar] [CrossRef]
Figure 1. Real-time direct light solar radiation spectrum for atmosphere and sea level.
Energies 14 06169 g001
Figure 2. Ideal circuit of PV model.
Energies 14 06169 g002
Figure 3. Block diagram of the workflow.
Energies 14 06169 g003
Figure 4. Single diode equivalent circuit of PV cell.
Energies 14 06169 g004
Figure 5. Simulation of Waree solar panel 40 watt.
Energies 14 06169 g005
Figure 6. I-V curve of PV panel.
Energies 14 06169 g006
Figure 7. P-V curve of PV panel.
Energies 14 06169 g007
Figure 8. Circuit diagram, waveform and duty cycle of DC–DC boost convertor (conduction state) (a) circuit diagram; (b) the waveform of DC–DC boost convertor with their average; (c) duty cycle.
Energies 14 06169 g008
Figure 9. Modified direct control perturbation & observation (DC-P&O) technique.
Energies 14 06169 g009
Figure 10. Block diagram of the experimental setup.
Energies 14 06169 g010
Figure 11. (a) Hardware components of experimental setup; (b): experimental set up.
Energies 14 06169 g011
Figure 12. MATLAB Simulink model for hardware.
Energies 14 06169 g012
Figure 13. Duty vs. time.
Energies 14 06169 g013
Figure 14. (a) Maximum power Vmp vs. time; (b) output power Pout vs. time; (c) load voltage VL vs. time and load current IL vs. time.
Energies 14 06169 g014
Figure 15. Results of DC–DC boost converter with the duty of (a) 30%; (b) 50%; and (c) 68% for open loop, respectively.
Energies 14 06169 g015
Figure 16. Results of boost convertor with the duty of 63% for the closed-loop system.
Energies 14 06169 g016
Figure 17. (a) Real-time PV curve; (b): real-time IV curve.
Energies 14 06169 g017
Table 1. Solar panel specification at 1000 W/M2 and cell temperature 25 °C.
S.NoName of the Parameter Values
1Maximum Power 40 W (Waree solar)
2Open Circuit Voltage Voc21.4 V
3Short Circuit Current Isc2.65 A
4Maximum Power Current Imp2.10 A
5Maximum Voltage Vmp17.7 V
6No. of Cell in series 36
7TypeMonocrystalline Panel
8Frame Type Aluminum
9Weight4.10 Kg
Table 2. Parameter of DC–DC boost converter.
S.NoName of the ParameterValues
1Vin12–22 V
2Vout36 V
3 f P W M 20 KHz
4Lboost5 Mh
5Cboost2200 µF
6DiodeRHR30120 with 10 Amp Heat Sink
7Relay5 V
8Pout40 W
9IGBTKGT25 N120 N, 1200 V, 25 A,
Fast Recovery
Table 3. Description of the modified Direct-Control Perturbation & Observation technique [9].
Perturbation Change in Power Next Perturbation
+ve+ve+ve
+ve−ve−ve
−ve+ve−ve
−ve−ve+ve
Table 4. Comparative results of simulation and hardware of DC-P&O technique at 800 W/M2, and 270 W/M2.
S.NOParameterSimulation
Results at 800 W/M2
Simulation
Results at 270 W/M2
Hardware Results at 270 W/M2
1Voc17.5 V18.50 V18.56 V
2.Isc2.15 A0.6 A0.635 A
3.Vmp17.5 V14.8 V15.5 V
4.Imp1.75 A0.5 A0.48 A
5.Duty Ratio57%57%57%
6.Vout40.02 V39.4 V40.74 V
7.MPP reaching Time0.11 s0.11 s0.68 s
8.Insolation with Artificial Light800 W/M2270 W/M2270 W/m2
9.Pout27.5 W5.15 W4.9 W
10.Real-time Ppv33.2 W6 W5.8 W
11.Conversion efficiency82.83%85.88%84.48%
Table 5. Compared hardware results of modified (DC-P&O) technique with conventional P&O.
S.NoName of the ParameterModified (DC-P&O)Conventional P&O
1Voc18.56 V17.86 V
2Isc0.635 A1.59 A
3Vmp15.5 V12.93 V
4Imp0.48 A0.43 A
5Pmp6.7 W5.6 W
6Conversion efficiency84.48%76.56%
7Panel Efficiency13%12.2%
8Duty Ratio57%57%
9Real-time Vpv17.76 V15.46 V
10Real-time Ipv0.38 V1.23 V
11Real-time Ppv6.8 W5.6 W
12Vout40.74 V39.8 V
13Iout0.135 A0.12 A
14Pout4.9 W4.6 W
Publisher’s Note: MDPI stays neutral with regard to jurisdictional claims in published maps and institutional affiliations.

