Abstract
Scarcity of resources and their waste, as well as deteriorating quality of life and the environment, are pressing problems of modern civilisations. Rational and efficient energy consumption is one of the possibilities for preventing harmful practices and the degradation of ecosystems. Understanding the consumer’s way of thinking and acting by identifying his needs and preferences are essential for effective efforts for smart, sustainable, and inclusive economic growth. Therefore, the aim of this article was a comprehensive socioeconomic analysis of particular behavioural types of energy consumers, as a continuation of the authors’ previous research. The paper uses statistical methods (chi-square test and correspondence analysis) dedicated to non-metric variables for an effective analysis of the data obtained from the questionnaires. The identification of socioeconomic factors was carried out on a representative sample of n = 4506 respondents from eight European countries (the Czech Republic, France, Greece, Spain, Germany, Poland, Romania, and the United Kingdom). This allowed for distinguishing a typical representative of five consumer segments (EI; AE; DS; O; I), developed on the basis of motivation to save energy. The authors succeeded in combining behavioural segmentation with the socioeconomic characteristics of the created classes. The results indicated that 10 out of 12 examined factors were significantly correlated with the behavioural type. These are (in order of significance): attitude towards saving energy; age; employment status; home country; the ownership status of the premises; the number of people in a household; average monthly income per person in a household; education; gender and place of residence.
1. Introduction
This paper is a continuation of work on universal behavioural segmentation [1], carried out as part of a research project on energy consumer behaviour in selected European countries. Energy consumption and related behaviours, attitudes, and preferences are one of the most important social problems today. Scarcity of resources, including energy, rational use, and change of beliefs and habits of a typical consumer are becoming an issue to be solved as soon as possible, not only on a global scale (world and national) but, above all, on a regional and local scale. Local communities may become the driving force of change and a role model at a time when ecological thinking, environmental protection, and natural resources protection are becoming not just a passing fad or whim but a necessity and even a long-term strategy. Therefore, it is necessary to support local pro-ecological initiatives, build social and environmental capital, and, above all, help understand the behaviours, attitudes, and needs of ordinary people. Understanding seems to be the first step necessary to shape attitudes and change behaviours. Education and promotion of pro-environmental actions are essential to improving the public’s knowledge on how to use resources more efficiently and eliminate harmful and wasteful practices.
The authors hope that the presented research results will contribute to increasing this knowledge, especially as there are still few researchers involved in a comprehensive analysis of energy consumer behaviour. In this regard, this paper fills the existing research gap and can serve as both a model and a contribution to further research for other scientists. The significant innovative contribution of the authors is both the developed behavioural segmentation and its combination with the socioeconomic characteristics of the segments. Such an approach allows for forming a full picture of a typical energy consumer, which is not a common practice in the literature. It should be emphasised that the segmentations developed so far explain a limited (geographically, size of the sample, and methodologically) research scope, hence the existing approaches characterise the energy consumer only in a fragmentary and often one-dimensional way. The authors’ research presented in this paper was conducted on a wide representative research sample of n = 4506 respondents from eight European countries, including seven European Union member states: the Czech Republic, France, Greece, Spain, Germany, Poland, Romania, and the United Kingdom. Therefore, the obtained results can serve as a universal tool to identify the basic motivations of energy consumers as well as their socioeconomic characteristics.
Attempting to provide answers to the following research questions was the main aim of this paper:
- Is it possible to identify a typical representative of each segment of the authors’ behavioural segmentation of energy consumers, in terms of distinguishing their socioeconomic characteristics?
- Are all the examined socioeconomic factors relevant to the characteristics of the different segments?
- Whether the profile of the typical energy consumer obtained as a result of the analysis is convergent (similar) to other typologies existing in the literature.
Analysing the data obtained, the authors tried to identify the basic relevant socioeconomic factors that could characterise a typical representative of behavioural segmentation. This analysis can be used by local and regional decision makers as a useful tool for shaping environmental policies and campaigns, but also by consumers themselves to learn and become more aware of their own motivations and preferences, and perhaps make them reflect on the values that are worth following in their daily lives.
The study used methods enabling the analysis of non-metric variables: chi-square test and correspondence analysis. The authors chose these statistical tools because they allowed not only to indicate significant relationships between the studied variables (socioeconomic factors and respondents’ behaviour towards energy saving), but also to show which categories of these variables are related to each other. Moreover, the possibility of visualising the obtained results in the correspondence analysis allows for an easy interpretation, without the need to be familiar with the method itself.
For a better understanding of the content, the article has been divided into the following six sections. An introduction of the topic and the aim of the research and the authors’ original contributions are included in Section 1. Section 2 provides an overview of the literature on energy behaviour, energy saving, existing segmentations of energy users, and factors influencing their behaviour. Section 3 describes the methodology used in the paper and Section 4 presents the obtained results. The article concludes with a discussion of the results obtained with previous works (in Section 5) and a short summary in Section 6.
2. Literature Review
Energy consumption, especially by individual users and households, is an important and complicated issue, interesting not only from the point of view of the scientific community and policy and decision-makers, but also for the various market entities like energy suppliers and manufacturers of various electronical appliances. A lot of emphasis, especially in the European Union, is placed on sustainable development and the related sustainable consumption, which can take two forms: weak (increasing efficiency as a way to improve the quality of life [2,3]) and strong (seeking to change behaviours, lifestyles, and consumer decisions based on social responsibility [4,5,6]).
2.1. Energy Consumption and Energy Savings
Energy consumption has been, and still is, the subject of many studies attempting to discern different factors that are influencing it in order, on the one hand, to predict its future size [7], which is of key importance for the supply side of the market [8] and energy security of a given country/region [9,10], and, on the other hand, to plan and take measures aimed at balancing the load on the electricity grid and shifting part of consumption outside peak periods [11]. Research in the field of energy consumption highlights a number of factors that can be assigned to various categories, such as, the socioeconomic characteristics of the household itself (e.g., the number of people in the household and their age, economic status [12,13,14]), the type of dwelling (e.g., type and age of the building, floor area [15,16]), number of owned and used appliances (e.g., whether the household uses renewable energy sources RES or if the heating uses electricity or another energy source [13,17,18]), external conditions (e.g., climate [19,20]), or the level of economic development of a given area [21,22]). The influence of consumers’ lifestyles on energy consumption [23,24] or childhood experiences from the family home [25] are also getting more attention from researchers.
In the case of behaviours related to energy saving, two main trends of undertaken actions, referring to the concept of strong and weak sustainable consumption, can be observed: actions aimed at increasing the efficiency of the energy used and actions aimed at persuading consumers to reduce their consumption [26]. Research concerning consumers energy-saving behaviours is trying to determine what socioeconomic features (e.g., income, education, gender [27,28,29,30,31]) or psychographic features (e.g., sense of duty, pro-environmental awareness [32,33,34,35]) are manifested by consumers willing to save energy and limit their consumption, and on the other hand, how to motivate other consumers to undertake such actions. In order to better understand consumers’ energy-saving behaviours, attempts to link them with the consumers’ lifestyles or the culture of the country of origin have also been made [36,37]. Two motivations recur most frequently in the research aimed at identifying factors that may motivate consumers to undertake energy-saving measures, one related to financial reasons (whether it is co-financing or subsidising a given type of solution or lowering the energy costs [38,39]) and the other related to pro-ecological awareness and attitude [40,41,42]. Additionally, the literature indicates that factors such as social pressure/influence [41,43,44] or attitudes towards technology/available technological support [45,46] may motivate consumers to save while concerns about reduced comfort and convenience resulting from reduced energy consumption [47,48] may act as demotivators.
Energy behaviours and promoting energy efficiency and energy savings are research directions that are of great interest currently due to such issues as energy scarcity, the need to change the energy mix to a more sustainable one, and climate change due to increasing CO2 emissions. Energy consumption and energy saving behaviours are influenced by many different factors. That is a reason why when planning interventions, a certain balance between the more personalized approach to a given consumer while motivating as many consumers as possible is needed. A segmentation of energy consumers may be used as a compromise to solve that dilemma and provide interested parties with a viable tool. Attempts at energy customer segmentation is one of the approaches to understanding and managing the demand side of the energy market. Most approaches to the segmentations do not combine behavioural and socioeconomic factors, both for distinguishing the segments and then characterising them. Additionally, most of existing segmentations focus only on a very narrow set of factors. That practice was identified as a research gap that the authors attempted to fill by developing a behavioural segmentation based on consumers’ motivations and beliefs and then using socioeconomic data to further characterise the different segments in order to provide more complex consumer profiles.
2.2. Segmentation of Energy Consumers Focused on Their Willingness to Save Energy
Segmentation studies aim at identifying homogeneous groups of consumers [49,50,51] to better understand motivations and factors influencing their decision-making process and/or in order to control and influence their future consumption behaviours. It is a complex process that requires researchers to identify and analyse the non-obvious (as they are largely ingrained in the person’s mind) motivations and reasons behind manifested (and observable) consumer behaviours [52]. Any attempts at energy users’ segmentation, especially those where the focus of the study is not so much on energy consumption as on consumers’ energy-saving behaviours, are faced with these challenges. When describing energy consumption (and subsequently energy-saving behaviours), one should mention the developed segmentations referring to the previously mentioned sustainable consumption [53,54], as some of them will also include issues related to energy use [55,56,57].
There are four most common types of segmentation: demographic segmentation, psychographic segmentation, behavioural segmentation, and geographic segmentation. Each type of segmentation assigns consumers to their respective segment basing on a different category of indicators. The most common forms of energy consumer segmentations are demographic segmentation and behavioural segmentation. Psychographic segmentation, being the most difficult to perform, is not very common [58]. Nevertheless, it should be noted that certain elements of psychographic segmentation are being included in segmentations focusing mainly on consumer behaviour (behavioural segmentations) [37,59,60,61,62]. When trying to identify types of energy consumers, energy consumption (energy load profiles [63,64,65]), socioeconomic/infrastructural characteristics (income, occupational status, dwelling type and size [64,66]), or behavioural indicators [50,67] are most commonly used to assign consumers to particular segments.
This approach to segmentation does not always work when trying to investigate and identify types of users in terms of their willingness to take on energy-saving actions, especially as [68] has shown that factors relevant for energy consumption may not necessarily be relevant for energy-saving behaviours. For segmentations attempting to distinguish consumers in terms of their energy-saving behaviours (or potential motivation for such behaviours), behavioural segmentation is most commonly used [69]. Existing studies on energy saving behaviours have adopted, e.g., general values [59]; lifestyles [58,66,70]; general consumer behavioural patterns [62,70]; attitudes towards the environment and environmental awareness [71]; attitudes towards the use of technology [61]; contextual factors [72,73]; and rebound effect [74] as a basis for segmentation, but they usually had a rather narrow focus and only concerned particular types of action (e.g., tariff choice [67]).
It should be emphasised that, regardless of the type of segmentation and the factors differentiating the segments, in the case of most energy consumer segmentations socioeconomic factors (such as income, age, education and others) are at times used to characterise and describe individual segments, but only if they have proven to be particularly relevant and distinctive for a particular segment. This practice is so popular that it is easier to indicate studies that have dispensed with the inclusion of these factors when describing segments [19,67,75,76,77] than to list all those in which such an element (even though socioeconomic factors themselves were not the basis for the given segmentation study) has been included.
Table 1 presents examples of segmentation of energy consumers focusing on their tendencies towards energy-saving behaviours, with an indication of socioeconomic factors that turned out to be particularly important for the characteristics of individual segments.

Table 1.
Overview of selected energy consumer segmentations with an indication of socioeconomic factors particularly relevant to segment characterisation.
Two differences can be observed in the case of segmentations presented in Table 1. Firstly, they differ by the number (between 1 and 9) of socioeconomic factors that were found to be important for characterisation, and secondly by the factors that were found to be important themselves. Among the most commonly included socioeconomic factors were income (10 out of 11), age (8 out of 11), education (6 out of 11), number of people in the household (6 out of 11), ownership of the housing (5 out of 11), and gender (5 out of 11). The selected and presented examples of segmentation do not include all of the previous scientific outputs related to the attempts at dividing the energy consumers into more homogeneous groups. Nevertheless, it can be assumed that they are a representative sample that allows for distinguishing three main trends, dividing segmentations (regardless of their type) into those that:
- refer to a specific type of solution (RES, green energy), action, or potential intervention [59,60,77,78,79,80,81,83,84,85,86,87],
- attempt to indicate how the characteristics of individual householders and their mutual dynamics will influence the behaviours related to energy consumption and saving [88,89],
- focus on the reasons, conditions, and motivations for taking or not taking actions aimed at saving energy [61,62,69,82,90,91].
Focusing on motivations rather than specific types of interventions provides greater insight into how and why consumers make decisions. That knowledge may be utilized to develop a universal strategy for engaging and motivating consumers to take different types of action tailored to their abilities and preferences. This was the goal of the authors for preparing their own behavioural segmentation for the eco-bot project (more details about the project itself [1,92,93]). The inclusion of socioeconomic factors in the characteristics of the segments (although they do not constitute the basis for distinguishing individual types of consumers per se) may allow for a better understanding and prediction of their behaviours. A more detailed description of the segments may allow stakeholders to better design and prepare their interventions.
3. Materials and Methods
The analysis presented in this article is based on empirical data obtained during a quantitative survey carried out by the CAWI method using a structured questionnaire survey. The gathering of data funded by the eco-bot project and conducted between March and June 2021 was commissioned to two research agencies: DRB Polonia and SW Research. A total of 4506 interviews were conducted with a representative sample of energy consumers in 8 European countries: the Czech Republic (n = 500), France (n = 500), Germany (n = 572), Greece (n = 500), the United Kingdom (n = 512), Poland (n = 900), Romania (n = 500), Spain (n = 522). The sample was selected using the quota method, taking into account the selection of individual participants in terms of gender, age, and region of residence (urban, rural). The assumptions of the conducted survey were based on a sample size of a minimum of 500 respondents in each country. The survey questionnaire was collected over a two-week period, and due to a high interest in the survey, in some countries more questionnaires were received than initially specified. The additional data received were analysed and selected to meet the conditions of quota representativeness. The authors therefore decided that the obtained material would enrich the conducted analysis, hence the extra questionnaires were not rejected. It should be mentioned here that we worked with relative and not absolute values, therefore the analysis performed and its results were not affected by the disproportionate sample. The average time to complete the questionnaire was 15 min. The countries of the consortium partners were primarily selected for the study due to the nature of the eco-bot project and the participation of some project partners in the pilot phase (Spain, Germany, the United Kingdom). In addition, the sample was expanded geographically, taking the following criteria into account:
- inclusion of the widest possible range of countries in the study in terms of geographical location, hence representatives of Central and Eastern Europe were also selected;
- inclusion of countries with a diversified energy mix;
- inclusion of countries due to sociocultural, income, lifestyle, climate, and energy price differences.
The survey mainly focused on identifying the main motivations, opinions, and declared behaviours regarding energy saving, as well as consumers’ attitudes towards various IT tools supporting energy management at home. The authors received a raw database of aggregated and anonymised data in the SPSS/MS Excel format for analysis. The survey contractors have all the remaining data, i.e., the completed online survey questionnaires of individual respondents, which they are obliged to archive for a period of one year.
3.1. Behavioural Segmentation—Novel Approach and Assumptions
The authors’ behavioural segmentation of consumers was performed on the basis of respondents’ answers to selected questions (prepared in terms of the hypotheses set—a priori approach to segmentation). All the assumptions of this segmentation, along with the methodology and the individual stages of the procedure used, are described in detail in our paper [1]. On this basis, five segments were distinguished, differentiating respondents in terms of their motivation to save energy:
Ecological Idealist (EI)—characterised by the highest environmental awareness, which is the main motivation for their actions. They manifest leadership qualities—they can be leaders and initiators as well as ambassadors inspiring others to take pro-environmental actions. They are very often financially involved in ecological activities.
Aspiring Ecologist (AE)—characterised by high environmental awareness, however, they are also very prone to follow trends, fashion, and the example of other social groups. Consumers assigned to this segment are willing to pay more for ecological products but are less motivated to behave and look for pro-environmental solutions on their own.
Dedicated Saver (DS)—representatives of this segment show average environmental awareness but are mainly motivated to act by potential financial benefits. They are often very well informed and have a wide knowledge of ecology which they are able to use (devoting their time) if it provides a chance at cost savings, even achievable in the long term. Potentially, over time, they could become representatives of EI or AE segments.
Opportunist (O)—consumers with very low ecological awareness, relatively uninvolved in pro-ecological behaviours and activities, are assigned to this segment. They may act occasionally, irregularly, and show pro-environmental behaviours under the influence of financial or ecological incentives, but only under the condition that these actions are easy to perform and convenient. Consumers in this segment are satisfied with their attitude and very often do not want to change it.
Indifferent (I)—this segment is characterised by a complete lack of environmental awareness, showing a complete lack of interest in and concern for energy consumption levels. Representatives assigned to this segment do not show any signs of motivation to change their behaviours to more sustainable ones. Hence, this segment is extremely resistant to any financial or worldview incentives that could influence the attitudes and behaviours of this type of people.
According to the behavioural segmentation procedure, the following distribution of the respondents was obtained (see Figure 1): EI—28.9%, AE—15.3%, DS—43.5%, O—4.2% and I—4.1%. As can be seen, 4332 people were unambiguously assigned to the individual segments. Only 3.8% of the total number of respondents (174 persons) were not unambiguously classified into the indicated groups, which is a very good result and validates the applied assumptions of segmentation procedure.
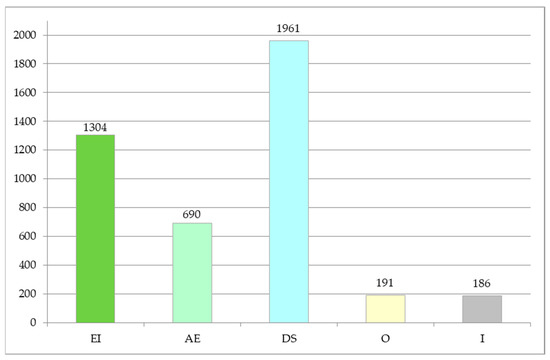
Figure 1.
Distribution of respondents assigned to particular behavioural segments.
3.2. Identifying the Relationship between a Behavioral Type and Socioeconomic Factors—Statistical Approach
The aim of this paper is to characterise the created behavioural types of energy consumers by taking into account socioeconomic factors that were not applied during the segmentation procedure. The actual analysis was therefore performed for pairs of variables, where each time one of them was segment membership (representing the respondent’s behavioural type) and the other was a selected socioeconomic factor describing the respondents. The intention of the study was both to identify the relationship between these variables and to measure similarities between their categories. Therefore, the study proceeded in the following steps:
- Step 1.
- The hypothesis about the independence of the studied variables was verified using the test, assuming a significance level of . Moreover, in the case of dependencies, the strength of the relationship between the studied variables was determined using the Cramer’s V coefficient.
- Step 2.
- Correspondence analysis was performed for pairs of variables that were found to be dependent to indicate which categories of these variables are related.
- Step 3.
- An auxiliary dendrogram to facilitate the interpretation of the results of the correspondence analysis was made using Ward’s method.
Achievement of the paper’s stated goal was possible mainly through the use of correspondence analysis. Benzécri (1973) [94] was the precursor of this method, but it was popularised mainly by Greenacre (1984) [95]. Hoffman and Franke (1986) [96], Carrol, and Green and Schaffer (1986) [97] proposed the first economic applications concerning marketing research.
Correspondence analysis is an exploratory technique for examining contingency tables, which aims to transform the points representing the rows and columns of this table into a space with a lower dimension, in which it is easier for the researcher to observe certain regularities. The purpose of this analysis is to graphically present the relationships between the categories of variables under study, which permits forming conclusions about the relationships occurring between these categories.
It is worth emphasising that the statistical methods the authors used for the analysis are dedicated to non-metric variables, as they often allow interesting conclusions to be drawn from empirical surveys. The possibility to visualise the results, which leads to easy interpretation, is another advantage and reason for using these methods.
The general scheme of operation in correspondence analysis can be presented by the following points:
- A correspondence table, or relative frequencies matrix, is created from the contingency table.
- The columns and rows of the correspondence table are transformed separately to obtain points (called row and column profiles) representing the categories of non-metric variables under study.
- A space with a smaller dimension is designated, to which the points (profiles) obtained in a previous phase are projected (with possible rotation). The choice of space and its rotation is made in such a way as to minimise the loss of information contained in the original data.
- The so-called correspondence map, which is a graphical presentation of the relationship between the categories of the studied variables is created.
- Appropriate conclusions about the dependencies involved are drawn on the basis of the map, which constitutes the interpretation of the obtained results.
The stage of inferring dependencies between categories of examined nominal variables takes place on the basis of the arrangement of points, representing these categories, presented on the correspondence map. Unfortunately, it is not always possible to draw clear conclusions from the obtained maps. In such cases, cluster analysis methods are generally used as an auxiliary. In this work, Ward’s hierarchical method was used [98].
As this article focuses on the applicability of the proposed segmentation procedure, the authors do not describe the methodology of the statistical tools used: the chi-square test and Cramer’s V coefficient, nor do they present in detail the subsequent steps of correspondence analysis. These methods are well known, and their detailed description can be found in many references. The chi-square test and measures of dependence for nominal variables are described, among others, in the works of Cramér (1946) [99] and Brzezińska (2011) [100], while correspondence analysis are described in papers by Greenacre (2021) [101], Rozmus (2004) [102], and Stanimir (2005) [103].
4. Results
The respondents divided, according to the authors’ behavioural segmentation [1], into five segments (EI, AE, DS, O, I) which differed in terms of their motivation to save energy, since this was the basis for assigning them to the right groups. However, the question is whether they are also significantly differentiated by other characteristics, such as age, employment status, or country of residence. The results of the analysis, carried out according to the procedure described in Section 3, show that most of the studied socioeconomic factors are significantly related to the behavioural type of energy users, represented by the segment to which they have been classified. As the results of the chi-square test (presented in Table 2) indicate, 10 out of 12 socioeconomic characteristics (empirically extracted factors) show a significant correlation with assigning the consumer to a specific segment (in each case the p–Value was lower than the adopted significance level, equal to 0.05). In addition, the calculated Cramer’s V coefficient allows for measuring the strength of this relationship, which is, however, weak in each of the studied cases ().
Table 2.
Results of the chi-square test between the respondent’s type/segment and individual socioeconomic factors, along with the values of the Cramer’s V coefficient.
Only the type of the respondent’s dwelling (house, apartment, etc.), as well as the average monthly electricity costs in a household, showed no significant correlation (factor 11 and 12 in Table 2). The first factor (type of housing) can be explained by the fact that there are now more opportunities to invest in RES or take other energy-saving measures in apartments and other types of collective housing and not only in detached or terraced houses, as was the case only a few years ago. An example of such energy-saving measures is the investment by the French energy company Électricité de France (EDF) in the town of Alès, where a photovoltaic installation was located on the roof of a residential block. This photovoltaic installation will directly supply energy to 100 households on a self-consumption model and the estimated annual savings could be around €100 for each family [104,105]. Another solution is the introduction of the so-called virtual prosumer option, where a person who does not have sufficient space to instal their own RES may join with another prosumer or a person who is considering such an investment and has the possibility to install required utilities. Such solutions available in the USA, Lithuania, Greece, Italy, Cyprus, and France allow more flexibility for energy consumers in terms of energy-saving measures regardless of the type of property they own. Hence, this factor may not have an impact on consumer profiling, as shown by our study.
The cost of electricity for households depends on its price and level of consumption. However, within the EU, both very large price differences and variations in consumption between countries can be observed [106]. In both cases, this is mainly due to the impact on price and consumption of a number of supply and demand conditions, such as the geopolitical situation of a given country, the characteristics of the national energy mix, diversification of energy imports, varying weather conditions, and all kinds of end-user taxes, network charges, or environmental protection costs [107]. Furthermore, the price of electricity relative to purchasing power parity can significantly alter the perceived cost of electricity for the individual consumer. At the same time, high energy consumption when it is the so-called green energy may not be perceived by consumers as something negative (the rebound effect). All these conditions may result in the lack of a demonstrated significant relationship between electricity costs and segment-specific consumer motivation to save electricity.
The results presented in Table 2, showing a significant relationship of the behavioural type of energy user with the 10 studied factors (1–10 in Table 2), indicate that conducting a correspondence analysis for these variables would be valid. This will allow to combine categories of the studied variables. As already mentioned, one of them is the segment into which the respondent is classified, and the other is one of the ten socioeconomic factors. The interpretation of the obtained results allows for characterisation of each of these segments, which in turn forms the basis for creating profiles of typical representatives of these classes.
The strongest dependence determining the classification of an energy consumer into a segment, as shown in Table 2, is whether the surveyed respondent declares taking any energy-saving measures (factor 1 from Table 2). Due to methodological limitations of correspondence analysis, it was not possible to create a correspondence map in this case (this is due to the fact that the variable representing the answers to the question about energy saving has only two categories: “yes” and “no”; the reduction of multidimensionality which is necessary here leads to the creation of only one dimension, which precludes the drawing of a two-dimensional correspondence map).
From the distribution of answers, it can be seen that energy saving is most often declared by respondents assigned to the DS segment, as well as by ecological idealists (EI segment). The group of consumers who declared not taking any steps towards energy saving included those assigned to groups: EI (1.3% of the total sample), AE (1.4%), and DS (2.3%). However, their percentage share in each segment does not differ significantly. When analysing the reasons given by respondents for not taking any steps to save energy, a certain consistency can be observed between the segments of consumers characterised by ecological motivation. Namely, both idealists (EI) and aspiring ecologists (AE) gave similar reasons for not saving energy. Lack of time was indicated as by far the main reason for not taking action, and to a large extent, representatives from both segments declared that both lack of relevant information on how to save energy and lack of capacity to make changes are important obstacles for taking energy-saving actions. Aspiring ecologists (AE) also strongly indicated that other household members were not interested in energy saving, which influenced their attitude. This should not come as a surprise since, as shown by the characteristics of the aspirants (AEs),consumers classified in this segment are very often guided in their actions by the opinions of other people, especially their family and friends. Therefore, the negative example of household members could be considered as a deterrent to making any effort. The last reason indicated by the segment of idealists (EI) was, to a large extent, the lack of technical or practical support. The reasons for not saving energy provided by consumers classified in the financially motivated segment (DS) seem to be interesting. Here, the main reason was the lack of technical and practical support and, as in the case of the AEs, the lack of interest in energy saving by other family members. It can be assumed that the representatives of this segment decided that a single effort, without the support of other household members, to reduce consumption would not significantly affect the reduction of bills, and therefore they did not take any actions in this direction.
The obtained results can also be analysed by extracting the individual countries participating in the survey from the sample. Interestingly, from this angle, in almost all countries the greatest number of people declaring energy savings were in the DS segment. Countries such as Poland, the Czech Republic (over 50%), France, Greece, and Romania (over 40%) recorded a clear advantage of DSs over other segments. Only in Spain, among energy-saving consumers, were ecological idealists (EI) the dominant segment (above 40%). When looking at non-savers (excluding the Indifferent segment, which is generally characterised by a passive attitude), Germany (14.1% of the total) and the United Kingdom (8.1%) recorded the highest number of such cases, and Poland (1.9%) and the Czech Republic (2.7%) the lowest. In all surveyed countries, the largest number of people declaring to be non-saving energy were also classified in the DS sector. The high percentage of non-savers classified as segments other than (I) in Germany can be explained, for example, by the high share of renewable and green energy in the overall energy mix, which may translate into a tendency to consume more energy and not to think about saving it in part of the population. On the other hand, energy costs in Germany are the highest in the entire EU (€0.3 per kWh), but at the same time, Germany is characterised by a dynamic increase in investment in small-scale photovoltaic installations (5 GW capacity additions in 2020 compared to 3.8 GW in 2019), which translates into a reduction in the costs associated with the purchase of electricity by households [108].
Another factor that is significantly related to the behavioural type of the energy user is the age of the respondent (factor 2 of Table 2). On the basis of the correspondence map (Figure 2), it is easy to notice that the ecological attitude to energy saving (EI and AE segments) is most often characteristic of people aged 26–40 years. In contrast, reducing energy consumption for financial reasons is most notable for people over the age of 40. The youngest people (aged 18–25) most often display opportunistic behaviour or are not interested in specific activities that could reduce their energy consumption.
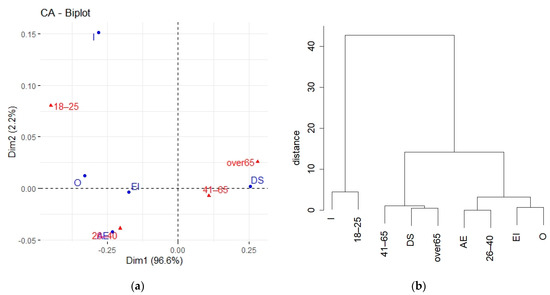
Figure 2.
Correspondence map (a) and an auxiliary dendrogram (b) showing the dependence of each behavioural type of energy consumer on their age groups.
Looking again at the results of individual countries, it can be noticed that in almost all countries the characteristics of the segments in terms of age groups coincide with the typical representative of the classes (see Table 3). Interesting differences can be observed in the case of Poland and Spain. Poland is dominated by the DS sector in each age bracket, which should not come as a surprise, since the analysis of correspondence of individual segments with the respondent’s country shows that the Polish are the closest to consumers motivated to save energy by financial factors. This can be explained by the fact that Poland is among the EU countries with the highest energy price calculated according to the purchasing power parity. In Spain, on the other hand, the dominant segment in almost every age group is the ecological idealist (EI). Only those over 65 are characterised by a financial approach and were mostly classified in the DS sector. However, this may change as Spain has been experiencing significant energy price rises recently, with a new time-of-day billing system being introduced across the country in June 2021. Differences in rates during the day can reach up to 50%. It is therefore likely that the Spanish will probably start to pay more attention to their electricity bills [109].
Analysing another factor significantly influencing the behavioural type of energy consumer, employment status (factor 3 from Table 2), the following relationships can be identified (Figure 3):
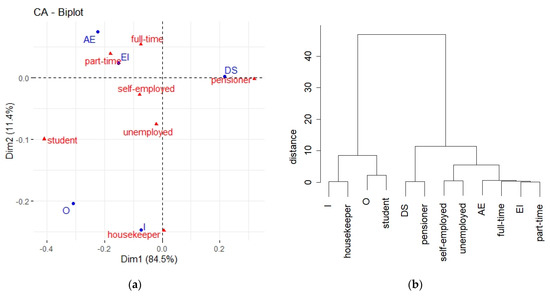
Figure 3.
Correspondence map (a) and an auxiliary dendrogram (b) showing the dependence of each behavioural type of energy consumer on their professional status.
- people who save energy for ecological reasons (EI and AE) most often work full-time and part-time; respondents who are self-employed and even unemployed also share an ecological idealist attitude (EI);
- financial motivation (specifically for the DS segment) is typical for retired people, which partially confirms the results of the survey taking into account the respondents’ age. This is also easily explained by the fact that in this occupational group, in most cases, there is a decrease in income. As a result, consumers are becoming more financially sensitive, also in relation to environmental and especially energy issues. Those two aspects are usually closely linked to energy prices, which are often the biggest burden on household budgets;
- housekeepers are very often indifferent (I) to the motion of reducing energy consumption;
- students are the most opportunistic (O) consumers.
Studying individual countries in detail, the results point to Germany and Spain as the countries that have the closest segment distribution to the typical representative obtained by correspondence analysis. In Central European countries (Poland, the Czech Republic) a slightly different distribution of respondents according to segment affiliation is observed. In these countries, the dominant segment, in almost every occupational group, is the DS. It should be emphasized that in these countries ecological, environmental, and climate protection issues are becoming relatively recent themes in public debates. Hence, it can be assumed that the level of environmental awareness and the ideological motivations of consumers to save energy will only become more apparent in the future.
It is worth emphasising again that, due to surveys being carried out in eight European countries, it was possible to find out what motivates respondents from different European countries to save energy (factor 4 of Table 2). As the results of the correspondence analysis illustrated in the chart (Figure 4) show, financial motivation (DS) is most often the key motivation for the Poles, French, and Czechs. The distribution of answers indicates that the characteristics of aspiring ecologists are relevant for the Greek population, but also for Romania. Respondents from the UK and Spain, on the other hand, generally reduce their energy consumption out of concern for the environment and ecology (EI). People from Germany were found to be the most opportunistic, however, it should be noted that the behaviours characteristic of both ecological idealists and opportunists are not as clear-cut as those of aspiring environmentalists and dedicated savers. This is indicated by the greater distance between the points representing the different categories of examined characteristics. Interestingly, the behaviour of indifferent consumers cannot be linked to any of the countries under study. Such people are certainly present in the analysed group, but it is difficult to unambiguously assign them to any nationality.
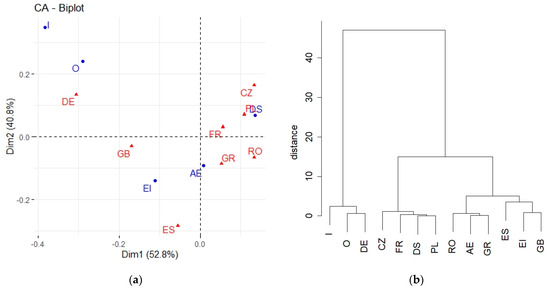
Figure 4.
Correspondence map (a) and an auxiliary dendrogram (b) showing the dependence of each behavioural type of energy consumer on their country of residence.
The assignment of energy consumers to the relevant behavioural segment is also significantly related to whether the respondent owns their flat or house or lives in a flat/building that they rent (factor 5 in Table 2). This is quite an understandable relation, as it is logical that non-owners are much less inclined to invest in solutions that can significantly reduce their energy consumption. These people are more likely to carry out simpler and less costly activities, which, however, are not as efficient or are perceived as natural everyday habits/routines and are not associated with significant energy savings.
For this factor, it was also impossible to create a correspondence map (factor 5 has only two categories, which precludes making a two-dimensional map). However, the analysis of the distribution of answers shows that, among those who declare to be flat and house owners, most show the characteristics of a dedicated saver, although this group also includes respondents with a pro-environmental attitude towards energy saving (both EI and AE). Tenants are more often opportunists and indifferent people. Due to the relatively weak influence of this factor on segment profiling, the links between the different categories of variables studied are not very obvious.
Considering individual countries, the case of Germany is interesting, where 63.8% of respondents declare that they rent their flats or houses. The dominant tenant sector in this case turned out to be DS, unlike the owners classified as EI. In the other surveyed countries, the situation is quite the opposite, as most respondents own their property. Romania and Poland are the leaders with 90.7% and 81.9% of declarations claiming ownership, respectively. Moreover, in these countries, both the owner and the tenant have mostly been assigned to the DS sector. This distribution is not surprising, looking at the current housing and cultural situation occurring, e.g., in Poland, where there is still a deficit of housing stock, especially for renting. Poles prefer taking out loans to buy their own property rather than rent it, which is still perceived as a temporary solution in extraordinary situations. Moreover, Poles have little knowledge of long-term investing. Combining those facts with a lack of ability to assess the real and full costs of buying and maintaining a flat, most often bought on credit, compared to the cost of renting, as well as high rental prices, translate into this type of preference [110]. On the other hand, highly developed countries are characterised by a flexible approach to rental housing that can adapt to changing housing needs and living situations, including work situation or the family’s financial capabilities.
The number of persons in the household (factor 6 in Table 2) is another one significantly differentiating respondents assigned to particular segments. The results of the correspondence analyses (Figure 5) show that:
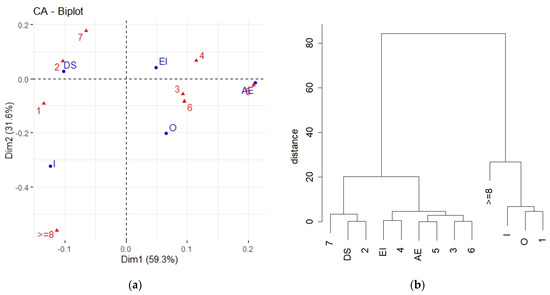
Figure 5.
Correspondence map (a) and an auxiliary dendrogram (b) showing the dependence of each behavioural type of energy consumer on the number of persons in the household.
- two-person households are characteristic to the dedicated saver segment; however, those living alone, as well as those forming multi-person households (seven persons), are most financially motivated to save energy;
- aspiring environmentalists (AE) are most often representatives of five-person households and environmental idealists (EI) of four-person households; however, members of three- or six-person households are also characterised by pro-environmental motivation to reduce energy consumption and can be classified as both AE and EI;
- for this analysis, it is not easy to indicate how many people the opportunist households consist of; moreover, it is not possible to assign to any category those in the indifferent segment, nor those in households consisting of eight or more people.
The results of the chi-square test showed that the income of the respondents was also related to the segments into which they were classified (factor 7 from Table 2). Income ranges shown in the graph have been calculated against the average earnings in each country, as reported by Eurostat [111]. In the course of the study, four income brackets were assumed (0–0.4 of the average earnings, 0.41–0.7 of the average, 0.71–1.4 of the average, and above 1.4 of the average), taking into account the analysis of minimum and average earnings per person in a household in each country. The authors attempted to set the brackets in such a way that the distribution of respondents by income would reflect as closely as possible a cross-section of the population in a given country in terms of earnings.
The arrangement of points representing categories of these two variables (Figure 6), indicates the occurrence of the following relationships:
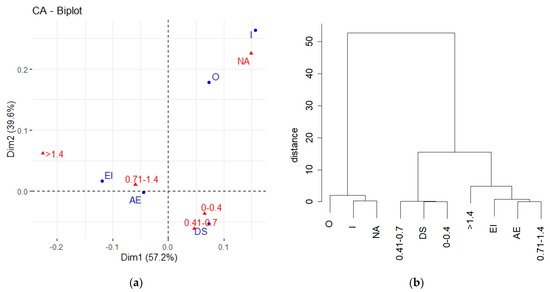
Figure 6.
Correspondence map (a) and an auxiliary dendrogram (b) showing the dependence of each behavioural type of energy consumer on their average monthly income.
- monthly per capita income in a household below 0.7 of the average earnings in a given country is characteristic of people in the DS segment;
- people who save energy for pro-ecological reasons (EI and AE) generally have a higher disposable income than DS; they range from 0.71 to 1.4 of the average earnings;
- Opportunists and indifferent respondents most often refused to provide answers about their income.
When analysing individual countries, the highest percentage of respondents who did not answer the question about income were from Poland (11.3% of all Poles participating in the survey) and Greece (10.5% of all Greeks). In both cases, most were classified to the DS sector. Taking the income factor into account, it can be noted that in all surveyed countries the distribution of respondents with respect to sectors was very close to the obtained typical representative (Table 3).
Examination of the relationship between the behavioural type of energy consumer and their education (factor 8 of Table 2, Figure 7) shows that people whose motivation to save energy comes from pro-environmental considerations tend to be better educated than dedicated savers or opportunists. Respondents assigned to the EI and AE segments most often have a bachelor’s or master’s degree, while most people in the DS segment have secondary education. Indicating the level of education for the typical opportunist is not so clear-cut, although the correspondence analysis, as well as the auxiliary dendrogram, most closely associate these individuals with primary education. Indifferent respondents most often declared other education. It can also be added that a doctoral degree was not typical for any of the segments.
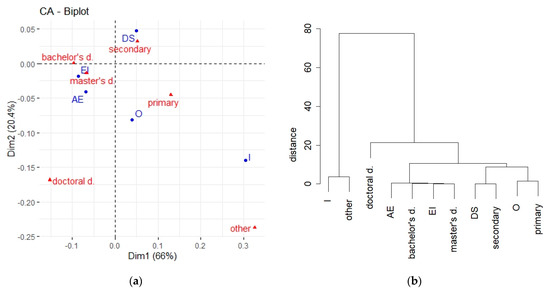
Figure 7.
Correspondence map (a) and an auxiliary dendrogram (b) showing the dependence of each behavioural type of energy consumer on their education.
The obtained distribution coincides to a large extent with the results of studies by other authors [61,69,78,80,81], where an increase in environmental awareness and attitudes among consumers is observed as they attain higher degrees of education. Environmental and ecological education helps people to make informed choices. Activities designed in the educational policies of European countries are aimed at shaping people’s behaviours to be more sustainable and environmentally friendly. Better educated consumers more often show pro-ecological attitudes, intentions, and behaviours. On the other hand, the obtained results confirm the necessity to reach those less educated and excluded with the appropriate message and reliable knowledge. The authors see great possibilities for action and positive influence of regional administration together with other local stakeholders, who have the potential to become focus and facilitators for communities of residents and family circles. Applications dedicated to energy management, such as the eco-bot [93], may, thanks to their simplicity, be used as an effective educational tool that will change the user’s habits.
When analysing another factor showing a significant relationship (factor 9 from Table 2), it was noticed that due to the presence of people declaring a different gender among the surveyed energy consumers, arrangement of points presented on the correspondence map (Figure 8) is not very clear. For this reason, the auxiliary dendrogram was used to interpret the results: It shows that when it comes to saving energy, mainly women are driven by financial motivation (DS), while menare most often motivated by pro-ecological considerations (EI and AE).
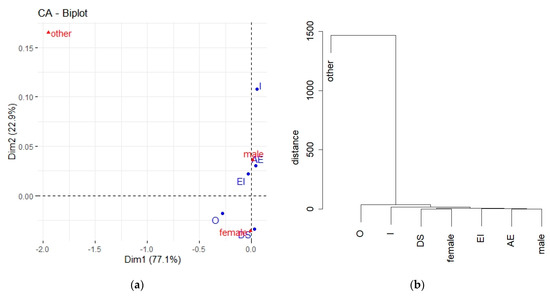
Figure 8.
Correspondence map (a) and an auxiliary dendrogram (b) showing the dependence of each behavioural type of energy consumer on their gender.
It can be assumed that such classification results from the fact that in households it is mostly women who take care of household matters, including finances. They control family expenditures and initiate pro-saving measures. Hence, they are very familiar with energy-saving opportunities and benefits, so their actions, behaviours, and even opinions may be financially motivated. Men, on the other hand, may look at environmental issues from a broader, long-term perspective, concerned about family security, and their pro-environmental motivations may stem from their desire to ensure healthy and better living conditions for their family.
The last factor that shows a significant dependence with the analysed behavioural segment is the place of residence (factor 10 from Table 2). The results of the correspondence analysis (Figure 9) show that:
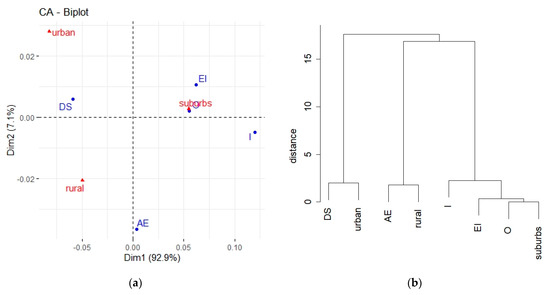
Figure 9.
Correspondence map (a) and an auxiliary dendrogram (b) showing the dependence of each behavioural type of energy consumer on their place of residence.
- people from the ecological idealist segment usually live in the suburbs; it turns out, however, that this location is typical for the opportunists as well;
- dedicated savers are more likely to live in rural and urban areas than in the suburbs;
- the place of residence of a typical aspiring ecologist is not as obvious as in the case of respondents from the already mentioned segments, although people from this group most often indicated that they live in the rural areas;
- once again, concerning their place of residence, the indifferent respondents are ambiguously assigned.
The location of residence of people characterised by pro-ecological motivations (suburbs, rural areas) results mainly from greater ecological awareness and following the currently fashionable trends, like the so-called “escape to the countryside”, the desire for greater contact with nature, seeking silence and peace, as well as breaking away from the hustle and bustle of the city and switching to the increasingly popular slow lifestyle. The dedicated saver is a city dweller. The financial motivation is not surprising here either—the rising prices of real estate and maintenance costs, shrinking areas suitable for habitation, and scarcity of natural resources (often in cities there are no or only limited possibilities to introduce ecological solutions, e.g., water recycling or RES installations), result in increased expenses for satisfying basic living needs. As [112] noted, despite the fact that city dwellers adopt and declare, to a large extent, pro-environmental values, their attitudes, behaviours, and actions are less pro-ecological than those of rural residents. The actions of the latter are more consistent with their expressed worldviews. This is also confirmed by the presented results.
5. Discussion
Using the results obtained from the analysis of socioeconomic characteristics of individual behavioural segments, an attempt was made to identify the profile of a typical representative for each segment. At the same time, the obtained profiles, presented in Table 3 (in the first row), were compared with previous works on behavioural segmentation of energy consumers. Unfortunately, it quickly turned out that such a comparison is only possible to a limited extent. In order to ensure the highest possible comparability of the obtained profiles, only segmentations with a certain level of similarity between the designated segments and the novel segmentation approach presented by the authors were selected. Despite the earlier indication (Section 2 and [1]) of such similarities, it turned out that for some segmentations a comparison of typical segment representatives in terms of socioeconomic characteristics is not possible due to insufficient representation of this aspect of the consumers studied by other researchers. For example, the Accenture end-consumer observatory on electricity management (2010) [79] identifies the following characteristics of six proposed segments: Eco-rationals—more often women, Proactives—no significant socioeconomic characteristics, Cost conscious—more often women, Pragmatics—more often men (two segments with financial motivation), Skepticals (equivalent to Opportunist)—higher income, and Indifferents—more often men with lower income under 24 years old. However, these descriptions mainly contain a reference to one socioeconomic characteristic, which was considered insufficient to include this segmentation in the comparisons. In the case of another segmentation that parallels the currently proposed one in terms of motives, the results of the study described by Tabi et al. (2014) [60] indicated that most socioeconomic characteristics (age, gender, income, household size) were evenly distributed across all segments, and only education was a distinguishing factor for the segment motivated by pro-ecological beliefs. In other segmentations, despite the occurrence of partial similarity between segments and motivation, the number and nature of factors motivating consumers to save energy were so different from those taken into account by the authors that this supported the removal of these works from the compilation [59,61]. Finally, for the comparison included in Table 3, three of the behavioural segmentations indicated in Section 2 were selected, which included, in addition to the factors used to prepare the segmentation, socioeconomic characteristics [69,78,80]. Segmentations of energy consumers that did not allow a comparison of segments due to differences with the approach to motivation were not taken into account.
Table 3.
Characteristics and comparison of a typical representative in selected existing energy consumer segmentations.
Table 3.
Characteristics and comparison of a typical representative in selected existing energy consumer segmentations.
| A Typical Representative of the Behavioural Segments | |||||
|---|---|---|---|---|---|
| Study | Ecological by Conviction | Eco-Friendly But with Other Focus | Focused on Costs and Money Saving | Comfort and Convenience Focused | Indifferent |
| Proposed segmentation | (EI) | (AE) | (DS) | (O) | (I) |
| most often declared energy-saving | most often declare energy-saving | ||||
| male | male | female | |||
| age 26–40 | age 26–40 | over 40 years of age, especially over 65 years of age | age 18–25 | ||
| resident of the suburbs | rural resident | urban and rural dweller | resident of the suburbs | ||
| employed full-time or part-time | employed full-time and part-time | pensioner | student | housekeeper | |
| flat or house owner | flat or house owner | flat or house owner | tenant | tenant | |
| bachelor or master’s degree | bachelor or master’s degree | secondary education | primary education | other education | |
| 4 people in household | 5 people in household | 1 or 2 people in household | |||
| 0.71–1.4 of earnings average | 0.71–1.4 of earnings average | 0–0.7 of earnings average | refuses to answer questions about earnings | refuses to answer about earnings | |
| The United Kingdom, Spain | Greece, Romania | France, the Czech Republic, Poland | Germany | ||
| Han et al. (2013) [80] | Environmentally minded residents (EMR) | Conscious residents (CR) | Cost focused residents (CFR) | Ease-driven residents (EDR) | |
| age does not differentiate | 35 years and more | age 27–35 | age 35–59 | ||
| highest income | income average and higher | lower income on average | income slightly above average | ||
| highest education | average education | ||||
| more often owners | more often tenants | more often tenants | more often owners | ||
| Sütterlin et al. (2011) [69] | Idealistic energy savers (IES) | Selfless inconsequent energy savers (SIES) and problem-aware wellbeing-oriented energy consumers (PAWOEC) | Thrifty energy savers (TES) | Convenience-oriented indifferent energy consumers (COIEC) | |
| well educated (higher technical education) | two types of semi-environmental consumers but only one (PAWOEC) was distinguished by higher general education | more often vocational or secondary education | |||
| more often female | more often male | ||||
| the oldest | |||||
| lowest income | |||||
| Pedersen (2008) [78] | Devoted conservationists (DC) | Stumbling proponents (SP) | Cost-conscious practitioners (CCP) | Comfort seekers (CS) | Tuned-out and carefree (TOaC) |
| the oldest segment—6 out of 10 consumers are over 65 years old | “the average segment” | age 35–44 | younger than 45 years | ||
| lowest income | high income | highest income | |||
| retired | |||||
| slightly more females | mainly male | ||||
| highest education | least people with higher education | ||||
| rather house dwellers | more often flat dwellers | rather tenant | |||
| rather from out of town | more often urban resident | rather from urban areas | |||
| more often live with children and more (3+) people in the household | |||||
| other nationalities (languages) | |||||
| Similarities between segment characteristics | mostly higher education | more often higher education | on average lower education | no similarities—the segments here may actually differ in their motivation/approach to comfort and convenience | problems with distinguishing that segment or lack of distinctive features in this segment |
| highest income | average and higher income | on average lower income | |||
| more often owner | more often older | ||||
| more often female | |||||
The last row of the Table 3 identifies, on the basis of the prepared comparison, the socioeconomic characteristics common to the different behavioural segments distinguished in terms of the motivation behind energy-saving behaviours. It should also be noted that certain characteristics indicated as important in the segmentations which are not included in Table 3 overlap to some extent with the authors’ findings (e.g., women with low incomes are more likely to represent mainly financially motivated segments [59,79], or higher education is characteristic of the pro-environmental segment [59,60]). The prepared analysis of socioeconomic factors, which complements the basic characteristics of behavioural segments determined on the basis of the distinguished motivation of the consumer, allows for a better definition of individual segments. It can be considered an attempt to extend the behavioural type of segmentation to include socioeconomic factors. It should be emphasised that the aim was not to determine segments on this basis alone (it is not a demographic type of segmentation) but to extend behavioural segmentation with an additional aspect that may make it easier for potential stakeholders to use the tool prepared by the authors.
By analysing and comparing the existing research, it can be noticed that the image of energy consumers is constantly changing. This is related not only to changing fashion or culture but also to changing socioeconomic and environmental conditions. Perception and sensitivity to the problems of modern civilisation, as well as knowledge and willingness to prevent them, play an important role. Consumers increase their environmental awareness through education and the influence of local communities and associations of residents.
However, there is still little research into identifying motivations and attitudes, as well as comprehensive characterisation, of energy consumers. This seems crucial at a time when behavioural change and greater care for the natural environment are becoming a necessity, not only for the present but also for future generations. In order to achieve this, it is necessary to understand the needs, aspirations, and motives of consumers’ behaviours as well as prioritise the preservation of natural heritage and encourage the building of the social capital. The authors hope that the results of the presented research will contribute significantly to promoting behavioural changes and raising environmental awareness of consumers as well as serving as a starting point for other researchers’ further considerations.
6. Conclusions
The article aimed to identify the main socioeconomic factors specific to the distinct behavioural segments of the energy consumer. The identified factors were used to characterise a typical representative of the created segments. It should be emphasised that the segmentation presented in the paper is an original and innovative concept of the authors, as well as a result of continuing research on the motives of energy consumers’ behaviours. The combination of behavioural segmentation with socioeconomic characteristics of the created classes is an approach rarely seen in the literature, hence the results provide a comprehensive picture of the energy consumer. Moreover, the statistical tools used in this paper (chi-square test and correspondence analysis), which allow us to find out significant relationships between behavioural type and the indicated factors, have not been used so far in studies on energy consumption.
In the course of the analysis, the authors managed to positively verify the first, and partially the second, posed research question. Namely, as the research results showed, it is possible to indicate a typical representative for each of the obtained segments, as well as its socioeconomic characteristics. However, it turned out that not all the socioeconomic factors assumed in the study are relevant for describing the typical representative. Two of the twelve characteristics (type of housing and electricity costs) are irrelevant for the differentiation of the segments. In the case of the third research question, it turned out that the picture of the typical energy consumer has changed over time and a comparison of typologies is not entirely possible. The authors were able to identify three other existing behavioural segmentations whose class characteristics are relatively close to those developed and presented in this paper. However, it should be emphasised that in each of the identified segments, only a small number of factors coincided with previous proposals by other authors and that the similarity of factors was not the same for all three compared segmentations.
The approach to a comprehensive analysis of the energy consumer presented in the paper is not free from certain limitations. Some of them have been described in detail in [1] and concern the constructed research tool, which was used both to validate the segmentation proposed by the authors and to characterise the segments. First of all, it concerns the impossibility of including in the questionnaire all contextual factors influencing the attitudes and motivations of consumers and the fact that the answers of the respondents reflect their self-assessment of behaviour and not actually the observed behaviour. Moreover, it should be noted that in the case of some demographic questions, the respondents had the option not to provide the answer, which they sometimes took. Although it was not a large percentage of the respondents, it could have influenced the final results. Of course, the countries chosen for the study can also be seen as a kind of limitation, but the authors tried to select representatives of Europe, taking into account existing economic, social, and cultural differences.
According to the authors, the most important limitation of the presented approach is the necessity of repeating the research and verifying the segmentation obtained. Along with the changing political-economic and sociocultural conditions, it may turn out that the main motivations of energy consumers can change dramatically—which will have an impact on their segmentation.
It is also important to note that the segmentation presented is based on the results of extensive empirical research, including several European countries, which is not a common practice. This comprehensive analysis of individual behavioural types of energy consumers can serve many different stakeholders as a baseline tool for the construction of policies, instruments, and plans that take into account the problems of energy saving, climate change, and dwindling natural resources. Consumers from different European countries themselves, for whom the results of the study can provide interesting insights into their own internal motivations for saving energy and can also be a starting point for considering changes in their behaviour and attitudes, should also be mentioned as stakeholders. In addition, consumer organisations and energy suppliers can use the results to better reach a diverse customer base. This will increase their efficiency in operating, providing tailored products and services, and helping to effectively promote sustainable consumption and attitudes that reduce energy consumption. We also hope that our publication will be of interest to other researchers, and by referring to and discussing our results they will further expand the common knowledge and understanding of the consumers’ energy behaviours.
The authors see the possibility of extending the comprehensive analysis of the energy consumer further, for example, by examining the relationship of individual behavioural types with the various types of instruments, measures, and incentives used to support energy management at home, as well as enabling energy savings and behavioural change in a pro-environmental direction. Furthermore, it might be interesting to investigate the influence of social groups on particular segments and their approaches to modern technologies. The authors plan to extend the research in those directions and publish the results in future articles.
Author Contributions
Conceptualization, S.S., J.K.-Ł. and J.T.; methodology, S.S., J.K.-Ł. and J.T.; formal analysis, S.S., J.K.-Ł. and J.T.; investigation, S.S., J.K.-Ł. and J.T.; data curation, J.T.; writing—original draft preparation, S.S., J.K.-Ł. and J.T.; writing—review and editing, S.S., J.K.-Ł. and J.T.; funding acquisition, S.S. All authors have read and agreed to the published version of the manuscript.
Funding
This research was funded by European Union’s Horizon 2020 research and innovation program: “Reducing energy consumption and carbon footprint by smart and sustainable use”, as a part of the currently implemented project “Personalised ICT-tools for the Active Engagement of Consumers Towards Sustainable Energy. Eco-bot” under grant agreement No. 767625.
Institutional Review Board Statement
Not applicable.
Informed Consent Statement
Not applicable.
Data Availability Statement
Not applicable.
Conflicts of Interest
The authors declare no conflict of interest.
References
- Słupik, S.; Kos-Łabędowicz, J.; Trzęsiok, J. An Innovative Approach to Energy Consumer Segmentation—A Behavioural Perspective. The Case of the Eco-Bot Project. Energies 2021, 14, 3556. [Google Scholar] [CrossRef]
- Neale, A. Zrównoważona konsumpcja. Źródła koncepcji i jej zastosowania. Pr. Geogr. 2015, 141, 141–158. [Google Scholar] [CrossRef]
- Seyfang, G. The New Economics of Sustainable Consumption. In Seeds of Change; Palgrave Macmillan: New York, NY, USA, 2011. [Google Scholar]
- Matel, A. Przesłanki ekologizacji konsumpcji z perspektywy zachowań konsumenckich. Zarządzanie. Teor. Prakt. 2016, 16, 55–61. [Google Scholar]
- Kiełczewski, D. Wpływ ekologizacji konsumpcji na zmiany w zarządzaniu organizacjami. Han. Wew. 2016, 6, 55–63. [Google Scholar]
- Lorek, S.; Fuchs, D. Strong sustainable consumption governance—Precondition for a degrowth path? J. Clean. Prod. 2013, 38, 36–43. [Google Scholar] [CrossRef]
- IEAE. Energy, Electricity and Nuclear Power Estimates for the Period up to 2050, No. 1; International Atomic Energy Agency: Vienna, Austria, 2019. [Google Scholar]
- Steinbuks, J.; de Wit, J.; Kochnakyan, A.; Foster, V. Forecasting Electricity Demand: An Aid for Practitioners; World Bank: Washington, DC, USA, 2017. [Google Scholar]
- Leal-Arcas, R.; Ríos, J.A.; Grasso, C. The European Union and its energy security challenges: Engagement through and with networks. Contemp. Politics 2015, 21, 273–293. [Google Scholar] [CrossRef]
- Kovacic, Z.; Di Felice, L.J. Complexity, uncertainty and ambiguity: Implications for European Union energy governance. Energy Res. Soc. Sci. 2019, 53, 159–169. [Google Scholar] [CrossRef]
- Yang, Y.; Wang, M.; Liu, Y.; Zhang, L. Peak-off-peak load shifting: Are public willing to accept the peak and off-peak time of use electricity price? J. Clean. Prod. 2018, 199, 1066–1071. [Google Scholar] [CrossRef]
- McLoughlin, F.; Duffy, A.; Conlon, M. Characterising domestic electricity consumption patterns by dwelling and occupant socio-economic variables: An Irish case study. Energy Build. 2012, 48, 240–248. [Google Scholar] [CrossRef]
- Huebner, G.; Shipworth, D.; Hamilton, I.; Chalabi, Z.; Oreszczyn, T. Understanding electricity consumption: A comparative contribution of building factors, socio-demographics, appliances, behaviours and attitudes. Appl. Energy 2016, 177, 692–702. [Google Scholar] [CrossRef]
- Cayla, J.-M.; Maizi, N.; Marchand, C. The role of income in energy consumption behaviour: Evidence from French households data. Energy Policy 2011, 39, 7874–7883. [Google Scholar] [CrossRef]
- Bartusch, C.; Odlare, M.; Wallin, F.; Wester, L. Exploring variance in residential electricity consumption: Household features and building properties. Appl. Energy 2012, 92, 637–643. [Google Scholar] [CrossRef]
- Estiri, H. Building and household X-Factors and energy consumption at the residential sector. Energy Econ. 2014, 43, 178–184. [Google Scholar] [CrossRef]
- Karatasou, S.; Laskari, M.; Santamouris, M. Determinants of high electricity use and high energy consumption for space and water heating in European social housing: Socio-Demographic and building characteristics. Energy Build. 2018, 170, 107–114. [Google Scholar] [CrossRef]
- Sakah, M.; Can, S.D.L.R.D.; Diawuo, F.A.; Sedzro, M.D.; Kuhn, C. A study of appliance ownership and electricity consumption determinants in urban Ghanaian households. Sustain. Cities Soc. 2019, 44, 559–581. [Google Scholar] [CrossRef]
- Mohamed, A.M.A.; Al-Habaibeh, A.; Abdo, H.; Elabar, S. Towards exporting renewable energy from MENA region to Europe: An investigation into domestic energy use and householders’ energy behaviour in Libya. Appl. Energy 2015, 146, 247–262. [Google Scholar] [CrossRef]
- Laetitia, M.; Jiyun, S.; Alan, S.C.; Shuqin, C.; Jindong, W.; Wei, Y.; Jie, X.; Qiulei, Z.; Jian, G.; Meng, L.; et al. The hot summer-cold winter region in China: Challenges in the low carbon adaptation of residential slab buildings to enhance comfort. Energy Build. 2020, 223, 110181. [Google Scholar] [CrossRef]
- Thapar, S. Energy consumption behavior: A Data-Based analysis of urban Indian households. Energy Policy 2020, 143, 111571. [Google Scholar] [CrossRef]
- Fouquet, R. Lessons from energy history for climate policy: Technological change, demand and economic development. Energy Res. Soc. Sci. 2016, 22, 79–93. [Google Scholar] [CrossRef]
- Sanquist, T.F.; Orr, H.; Shui, B.; Bittner, A.C. Lifestyle factors in U.S. residential electricity consumption. Energy Policy 2012, 42, 354–364. [Google Scholar] [CrossRef]
- De Meester, T.; Marique, A.-F.; De Herde, A.; Reiter, S. Impacts of occupant behaviours on residential heating consumption for detached houses in a temperate climate in the northern part of Europe. Energy Build. 2013, 57, 313–323. [Google Scholar] [CrossRef]
- Hansen, A.R. ‘Sticky’ energy practices: The impact of childhood and early adulthood experience on later energy consumption practices. Energy Res. Soc. Sci. 2018, 46, 125–139. [Google Scholar] [CrossRef]
- Umit, R.; Poortinga, W.; Jokinen, P.; Pohjolainen, P. The role of income in energy efficiency and curtailment behaviours: Findings from 22 European countries. Energy Res. Soc. Sci. 2019, 53, 206–214. [Google Scholar] [CrossRef]
- Poruschi, L.; Ambrey, C.L. On the confluence of city living, energy saving behaviours and direct residential energy consumption. Environ. Sci. Policy 2016, 66, 334–343. [Google Scholar] [CrossRef]
- Belaïd, F.; Garcia, T. Understanding the spectrum of residential energy-Saving behaviours: French evidence using disaggregated data. Energy Econ. 2016, 57, 204–214. [Google Scholar] [CrossRef]
- Schleich, J. Energy efficient technology adoption in low-income households in the European Union—What is the evidence? Energy Policy 2019, 125, 196–206. [Google Scholar] [CrossRef]
- Mills, B.; Schleich, J. Residential energy-Efficient technology adoption, energy conservation, knowledge, and attitudes: An analysis of European countries. Energy Policy 2012, 49, 616–628. [Google Scholar] [CrossRef]
- Liu, X.; Wang, Q.; Wei, H.H.; Chi, H.L.; Ma, Y.; Jian, I.Y. Psychological and demographic factors affecting household energy-saving intentions: A TPB-based study in northwest China. Sustainability 2020, 12, 836. [Google Scholar] [CrossRef]
- Urban, J.; Ščasný, M. Exploring domestic energy-Saving: The role of environmental concern and background variables. Energy Policy 2012, 47, 69–80. [Google Scholar] [CrossRef]
- Diaz-Rainey, I.; Ashton, J.K. Investment inefficiency and the adoption of eco-Innovations: The case of household energy efficiency technologies. Energy Policy 2015, 82, 105–117. [Google Scholar] [CrossRef]
- Gupta, S.; Ogden, D.T. To buy or not to buy? A social dilemma perspective on green buying. J. Consum. Mark. 2009, 26, 378–393. [Google Scholar] [CrossRef]
- Pothitou, M.; Hanna, R.F.; Chalvatzis, K.J. Environmental knowledge, pro-Environmental behaviour and energy savings in households: An empirical study. Appl. Energy 2016, 184, 1217–1229. [Google Scholar] [CrossRef]
- Hori, S.; Kondo, K.; Nogata, D.; Ben, H. The determinants of household energy-Saving behavior: Survey and comparison in five major Asian cities. Energy Policy 2013, 52, 354–362. [Google Scholar] [CrossRef]
- Botetzagias, I.; Malesios, C.; Poulou, D. Electricity curtailment behaviors in Greek households: Different behaviors, different predictors. Energy Policy 2014, 69, 415–424. [Google Scholar] [CrossRef]
- Vassileva, I.; Campillo, J. Increasing energy efficiency in low-Income households through targeting awareness and behavioral change. Renew. Energy 2014, 67, 59–63. [Google Scholar] [CrossRef]
- Mi, L.; Qiao, L.; Du, S.; Xu, T.; Gan, X.; Wang, W.; Yu, X. Evaluating the effect of eight customized information strategies on urban households’ electricity saving: A field experiment in China. Sustain. Cities Soc. 2020, 62, 102344. [Google Scholar] [CrossRef]
- van der Werff, E.; Steg, L.; Keizer, K. It is a moral issue: The relationship between environmental self-Identity, obligation-Based intrinsic motivation and pro-Environmental behaviour. Glob. Environ. Chang. 2013, 23, 1258–1265. [Google Scholar] [CrossRef]
- Sloot, D.; Jans, L.; Steg, L. Can community energy initiatives motivate sustainable energy behaviours? The role of initiative involvement and personal pro-Environmental motivation. J. Environ. Psychol. 2018, 57, 99–106. [Google Scholar] [CrossRef]
- Martinsson, J.; Lundqvist, L.J.; Sundström, A. Energy saving in Swedish households. The (relative) importance of environmental attitudes. Energy Policy 2011, 39, 5182–5191. [Google Scholar] [CrossRef]
- Nakamura, H. Effects of social participation and the emergence of voluntary social interactions on household Power-Saving practices in Post-Disaster Kanagawa, Japan. Energy Policy 2013, 54, 397–403. [Google Scholar] [CrossRef]
- Fornara, F.; Pattitoni, P.; Mura, M.; Strazzera, E. Predicting intention to improve household energy efficiency: The role of Value-Belief-Norm theory, normative and informational influence, and specific attitude. J. Environ. Psychol. 2016, 45, 1–10. [Google Scholar] [CrossRef]
- Wittenberg, I.; Blöbaum, A.; Matthies, E. Environmental motivations for energy use in PV households: Proposal of a modified norm activation model for the specific context of PV households. J. Environ. Psychol. 2018, 55, 110–120. [Google Scholar] [CrossRef]
- Corradi, N.; Priftis, K.; Jacucci, G.; Gamberini, L. Oops, I forgot the light on! The cognitive mechanisms supporting the execution of energy saving behaviors. J. Econ. Psychol. 2013, 34, 88–96. [Google Scholar] [CrossRef]
- Sweeney, J.C.; Kresling, J.; Webb, D.; Soutar, G.N.; Mazzarol, T. Energy saving behaviours: Development of a Practice-Based model. Energy Policy 2013, 61, 371–381. [Google Scholar] [CrossRef]
- Pukšec, T.; Mathiesen, B.V.; Duić, N. Potentials for energy savings and long term energy demand of Croatian households sector. Appl. Energy 2013, 101, 15–25. [Google Scholar] [CrossRef][Green Version]
- Choi, S.; Feinberg, R.A. The LOHAS lifestyle and marketplace behavior: Establishing valid and reliable measurements. In Handbook of Engaged Sustainability; Springer International Publishing: Cham, Switzerland, 2018; Volume 2, pp. 1069–1086. [Google Scholar] [CrossRef]
- Zhang, T.; Siebers, P.O.; Aickelin, U. A three-dimensional model of residential energy consumer archetypes for local energy policy design in the UK. Energy Policy 2012, 47, 102–110. [Google Scholar] [CrossRef]
- Witek, L. Typologia konsumentów na rynku produktów ekologicznych. Probl. Zarządzania, Finans. Mark. 2014, 35, 209–218. [Google Scholar]
- Kotler, P.; Wong, V.; Saunders, J.; Armstrong, G. Principles of Marketing, 4th ed.; Pearson Education Limited: Essex, UK, 2005. [Google Scholar]
- Shukla, R.K.; Upadhyaya, A. Perceptual Mapping of Green Consumers: An Innovative Market Segmentation Strategy. J. Int. Mark. Strategy 2014, 2, 28–38. [Google Scholar]
- Finisterra do Paço, A.M.; Raposo, M.L.B. Green consumer market segmentation: Empirical findings from Portugal. Int. J. Consum. Stud. 2010, 34, 429–436. [Google Scholar] [CrossRef]
- Poortinga, W.; Darnton, A. Segmenting for sustainability: The development of a sustainability segmentation model from a Welsh sample. J. Environ. Psychol. 2016, 45, 221–232. [Google Scholar] [CrossRef]
- Newton, P.; Meyer, D. Exploring the attitudes-action gap in household resource consumption: Does ‘Environmental Lifestyle’ segmentation align with consumer behaviour? Sustainability 2013, 5, 1211–1233. [Google Scholar] [CrossRef]
- Graczyk, A.M. Households behaviour towards sustainable energy management in poland—The homo energeticus concept as a new behaviour pattern in sustainable economics. Energies 2021, 14, 3142. [Google Scholar] [CrossRef]
- Axsen, J.; TyreeHageman, J.; Lentz, A. Lifestyle practices and pro-environmental technology. Ecol. Econ. 2012, 82, 64–74. [Google Scholar] [CrossRef]
- Yang, Y.; Solgaard, H.S.; Haider, W. Value seeking, price sensitive, or green? Analyzing preference heterogeneity among residential energy consumers in Denmark. Energy Res. Soc. Sci. 2015, 6, 15–28. [Google Scholar] [CrossRef]
- Tabi, A.; Hille, S.L.; Wüstenhagen, R. What makes people seal the green power deal?—Customer segmentation based on choice experiment in Germany. Ecol. Econ. 2014, 107, 206–215. [Google Scholar] [CrossRef]
- Smart Energy Consumer Collaborative. Consumer Pulse and Marketing Segmentation Wave. Available online: https://smartenergycc.org/consumer-pulse-and-market-segmentation-wave-7-report/ (accessed on 28 August 2021).
- Słupik, S.; Kos-łabędowicz, J.; Trzęsiok, J. Energy-related behaviour of consumers from the silesia province (Poland)—Towards a low-carbon economy. Energies 2021, 14, 2218. [Google Scholar] [CrossRef]
- Albert, A.; Rajagopal, R. Smart meter driven segmentation: What your consumption says about you. IEEE Trans. Power Syst. 2013, 28, 4019–4030. [Google Scholar] [CrossRef]
- Gouveia, J.P.; Seixas, J. Unraveling electricity consumption profiles in households through clusters: Combining smart meters and door-to-door surveys. Energy Build. 2016, 116, 666–676. [Google Scholar] [CrossRef]
- Pan, S.; Wang, X.; Wei, Y.; Zhang, X.; Gál, C.; Ren, G.; Yan, D.; Shi, Y.; Wu, J.; Xia, L.; et al. Cluster analysis for occupant-behavior based electricity load patterns in buildings: A case study in Shanghai residences. Build. Simul. 2017, 10, 889–898. [Google Scholar] [CrossRef]
- Hayn, M.; Bertsch, V.; Fichtner, W. Electricity load profiles in Europe: The importance of household segmentation. Energy Res. Soc. Sci. 2014, 3, 30–45. [Google Scholar] [CrossRef]
- Maréchal, K.; Holzemer, L. Unravelling the ‘ingredients’ of energy consumption: Exploring home-related practices in Belgium. Energy Res. Soc. Sci. 2018, 39, 19–28. [Google Scholar] [CrossRef]
- Abrahamse, W.; Steg, L. How do socio-demographic and psychological factors relate to households’ direct and indirect energy use and savings? J. Econ. Psychol. 2009, 30, 711–720. [Google Scholar] [CrossRef]
- Sütterlin, B.; Brunner, T.A.; Siegrist, M. Who puts the most energy into energy conservation? A segmentation of energy consumers based on energy-related behavioral characteristics. Energy Policy 2011, 39, 8137–8152. [Google Scholar] [CrossRef]
- Santin, O.G. Behavioural patterns and user profiles related to energy consumption for heating. Energy Build. 2011, 43, 2662–2672. [Google Scholar] [CrossRef]
- Vicente, P.; Reis, E. Segmenting households according to recycling attitudes in a Portuguese urban area. Resour. Conserv. Recycl. 2007, 52, 1–12. [Google Scholar] [CrossRef]
- Lutzenhiser, L. Social and Behavioral Aspects of energy use. Annu. Rev. Energy Environ. 1993, 28, 247–289. [Google Scholar] [CrossRef]
- Steg, L. Promoting household energy conservation. Energy Policy 2008, 36, 4449–4453. [Google Scholar] [CrossRef]
- Sorrell, S.; Dimitropoulos, J.; Sommerville, M. Empirical estimates of the direct rebound effect: A review. Energy Policy 2009, 37, 1356–1371. [Google Scholar] [CrossRef]
- Sapci, O.; Considine, T. The link between environmental attitudes and energy consumption behavior. J. Behav. Exp. Econ. 2014, 52, 29–34. [Google Scholar] [CrossRef]
- van Der Werff, E.; Steg, L. One model to predict them all: Predicting energy behaviours with the norm activation model. Energy Res. Soc. Sci. 2015, 6, 8–14. [Google Scholar] [CrossRef]
- Frankel, D.; Heck, S.; Tai, H. Using a Consumer Segmentation Approach to Make Energy Efficiency Gains in the Residential Market; McKinsey and Company: Chicago, IL, USA, 2013; pp. 1–9. [Google Scholar]
- Pedersen, M. Segmenting residential customers: Energy and conservation behaviors. In Proceedings of the ACEEE Summer Study on Energy Efficiency in Buildings, Pacific Grove, CA, USA, 7–22 August 2008; pp. 229–241. [Google Scholar]
- Guthridge, G.S. Understanding Consumer Preferences in Energy Efficiency: Accenture end-CONSUMER Observatoryon Electricity Management; Accenture: Dublin, Ireland, 2010. [Google Scholar]
- Han, Q.; Nieuwenhijsen, I.; de Vries, B.; Blokhuis, E.; Schaefer, W. Intervention strategy to stimulate energy-saving behavior of local residents. Energy Policy 2013, 52, 706–715. [Google Scholar] [CrossRef]
- Albert, A.; Maasoumy, M. Predictive segmentation of energy consumers. Appl. Energy 2016, 177, 435–448. [Google Scholar] [CrossRef]
- Seidl, R.; Moser, C.; Blumer, Y. Navigating behavioral energy sufficiency. Results from a survey in Swiss cities on potential behavior change. PLoS ONE 2017, 12, e0185963. [Google Scholar] [CrossRef] [PubMed]
- Tumbaz, M.N.M.; Moğulkoç, H.T. Profiling energy efficiency tendency: A case for Turkish households. Energy Policy 2018, 119, 441–448. [Google Scholar] [CrossRef]
- Michelsen, C.C.; Madlener, R. Motivational factors influencing the homeowners’ decisions between residential heating systems: An empirical analysis for Germany. Energy Policy 2013, 57, 221–233. [Google Scholar] [CrossRef]
- Sanguinetti, A.; Karlin, B.; Ford, R. Understanding the path to smart home adoption: Segmenting and describing consumers across the innovation-decision process. Energy Res. Soc. Sci. 2018, 46, 274–283. [Google Scholar] [CrossRef]
- Ropuszynska-Surma, E.; Weglarz, M. Profiling end user of renewable energy sources among residential consumers in Poland. Sustainability 2018, 10, 4452. [Google Scholar] [CrossRef]
- Abrahamse, W.; Steg, L.; Vlek, C.; Rothengatter, T. The effect of tailored information, goal setting, and tailored feedback on household energy use, energy-related behaviors, and behavioral antecedents. J. Environ. Psychol. 2007, 27, 265–276. [Google Scholar] [CrossRef]
- Bell, S.; Judson, E.; Bulkeley, H.; Powells, G.; Capova, K.A.; Lynch, D. Sociality and electricity in the United Kingdom: The influence of household dynamics on everyday consumption. Energy Res. Soc. Sci. 2015, 9, 98–106. [Google Scholar] [CrossRef]
- Boudet, H.S.; Flora, J.A.; Armel, K.C. Clustering household energy-saving behaviours by behavioural attribute. Energy Policy 2016, 92, 444–454. [Google Scholar] [CrossRef]
- Sardianou, E. Estimating energy conservation patterns of Greek households. Energy Policy 2007, 35, 3778–3791. [Google Scholar] [CrossRef]
- Wang, Z.; Zhang, B.; Yin, J.; Zhang, Y. Determinants and policy implications for household electricity-saving behaviour: Evidence from Beijing, China. Energy Policy 2011, 39, 3550–3557. [Google Scholar] [CrossRef]
- Słupik, S.; Kos-Łabędowicz, J.; Trzęsiok, J. Report on Findings from Consultations and Online-Survey. Personalised ICT-Tools for the Active Engagement of Consumers Towards Sustainable Energy; Report on Findings from Consultations and Online-Survey. Eco-Bot. Project. Available online: http://eco-bot.eu/publications/ (accessed on 28 August 2021).
- Eco-Bot. 2021. Available online: http://eco-bot.eu/ (accessed on 28 August 2021).
- Benzécri, J.P. L’Analyse des Données. Volume II. L’Analyse des Correspondances; Dunod: Paris, France, 1973. [Google Scholar]
- Greenacre, M.J. Theory and Applications of Correspondence Analysis; Academic Press: London, UK, 1984. [Google Scholar]
- Hoffman, D.L.; Franke, G.R. Correspondence Analysis: Graphical Representation of Categorical Data in Marketing Research. JMR 1986, 23, 213–227. [Google Scholar] [CrossRef]
- Carrol, D.J.; Greek, P.E.; Schaffer, M.C. Interpoint distance comparisons in correspondence analysis. JMR 1986, 23, 271–280. [Google Scholar] [CrossRef]
- Ward, J.H. Hierarchical Grouping to Optimize an Objective Function. J. Am. Stat. Assoc. 1963, 58, 236–244. [Google Scholar] [CrossRef]
- Cramér, H. Mathematical Methods of Statistics; Princeton University Press: Princeton, NJ, USA, 1946. [Google Scholar] [CrossRef]
- Brzezińska, J. Analiza logarytmiczno-liniowa. In Teoria i Zastosowania z Wykorzystaniem Programu R; Wydawnictwo C.H. Beck: Warszawa, Poland, 2015. [Google Scholar]
- Greenacre, M. Correspondence Analysis in Practice, 3rd ed.; Chapman and Hall/CRC Press: London, UK, 2021. [Google Scholar] [CrossRef]
- Gatnar, E.; Walesiak, M.; Rozmus, D. Analiza korespondencji. In Metody Statystycznej Analizy Wielowymiarowej w Badaniach Marketingowych; Gatnar, E., Walesiak, M., Eds.; Wydawnictwo AE we Wrocławiu: Wrocław, Poland, 2004; pp. 283–315. [Google Scholar]
- Stanimir, A. Analiza Korespondencji Jako Narzędzie Badania Zjawisk Ekonomicznych (Correspondence Analysis as a Tool for the Study Economic Factors); Wydawnictwo AE we Wrocławiu: Wrocław, Poland, 2005. [Google Scholar]
- Électricité de France (EDF). A Rochebelle, Une Résidence Pionnière en Autoconsommation Collective. 2019. Available online: https://www.youtube.com/watch?v=LYsIQb22ZVM&t=29s (accessed on 24 August 2021).
- Gramwzielone.pl. “Energia Ze Wspólnego PV Dla Mieszkańców Bloku. W Polsce to Na Razie Nierealne”. 2019. Available online: https://www.gramwzielone.pl/energia-sloneczna/100687/energia-ze-wspolnego-pv-dla-mieszkancow-bloku-w-polsce-to-na-razie-nierealne (accessed on 22 August 2021).
- Eurostat. Electricity Prices for Household Consumers—Biannual Data (from 2007 Onwards). 2020. Available online: https://appsso.eurostat.ec.europa.eu/nui/submitViewTableAction.do (accessed on 18 August 2021).
- Eurostat. Electricity Price Statistics. 2021. Available online: https://ec.europa.eu/eurostat/statistics-explained/index.php?title=Electricity_price_statistics (accessed on 25 August 2021).
- gramwzielone.pl. W Niemczech Przybyło 100 tys. Prosumentów z Magazynami Energii. 2021. Available online: https://www.gramwzielone.pl/magazynowanie-energii/105012/w-niemczech-przybylo-100-tys-prosumentow-z-magazynami-energii (accessed on 22 August 2021).
- Opińska, G. Hiszpanie Protestują Przeciwko Wzrostowi Opłat za Prąd i ich Zróżnicowaniu w Ciągu Doby. 2021. Available online: https://www.bankier.pl/wiadomosc/Hiszpanie-protestuja-przeciwko-wzrostowi-oplat-za-prad-i-ich-zroznicowaniu-w-ciagu-doby-8138776.html (accessed on 22 August 2021).
- Cipiur, J. Dlaczego Niemcy Wolą Wynajmować Mieszkania a Polacy Kupować? 2015. Available online: https://forsal.pl/artykuly/872555,dlaczego-niemcy-wola-wynajmowac-mieszkania-a-polacy-kupowac.html (accessed on 27 August 2021).
- Eurostat, Wages and Labour Costs. 2021. Available online: https://ec.europa.eu/eurostat/statistics-explained/index.php?title=Wages_and_labour_costs (accessed on 27 August 2021).
- Berenguer, J.; Corraliza, J.A.; Martin, R. Rural-Urban differences in environmental concern, attitudes, and actions. Eur. J. Psychol. Assess. 2005, 21, 128–138. [Google Scholar] [CrossRef]
Publisher’s Note: MDPI stays neutral with regard to jurisdictional claims in published maps and institutional affiliations. |
© 2021 by the authors. Licensee MDPI, Basel, Switzerland. This article is an open access article distributed under the terms and conditions of the Creative Commons Attribution (CC BY) license (https://creativecommons.org/licenses/by/4.0/).