1. Introduction
As globalization progresses, the importance of the region increases as a place where development factors (information, knowledge, innovation and the natural environment) of the modern economy operate. Understanding the regional aspects of development is important for regional, economic and environmental policy. It enables a rational allocation of resources [
1]. Authors dealing with theoretical concepts of development (regional or local) provide various concepts explaining this process. The most popular are: economic base theory, growth poles theory, Myrdal’s cumulative causality theory, and the core and peripheries model, which indicate the essence of the endogenous economic base in the development process [
2,
3,
4,
5]. R. Solow, J. Stiglitz, and J. Hartwick, describing the economies of natural resources, determined the roles of natural resources only in the context of supporting economic growth and defining the so-called optimal path for the exploitation of non-renewable natural resources [
6,
7,
8]. The importance of capital investments for growth, and thus also for economic development, was emphasized by T.W. Swan [
9].
The issue of socio-economic development is a complex phenomenon. It is related to financial, economic, demographic, infrastructural and natural aspects. At the regional level, there is a lack of information enabling local authorities to perform realistic assessments of the situation and analyze economic trends and their social consequences [
10,
11,
12,
13]. The region’s potential is the result of a combination of local conditions; it defines its possibilities and directions of development. Regional differentiation of the conditions of socio-economic development determines the pace and directions of this development. This differentiation, both in terms of value and quality, results in different conditions for running a business, and a different quality of life for the inhabitants. The accumulation of negative phenomena in the region leads to a slowdown or even inhibition of development processes [
14].
The poviat (a County in Poland; a unit of local government and second-degree administrative division) performs public tasks of a supra-communal nature specified by statute in the scope of, inter alia, environmental and nature protection, preventing extraordinary threats to the environment. The development of poviats is spatially polarized. The actions implemented by the poviat are a combination of interrelated factors (including property resources, natural environment, demographic resources, infrastructure, and financial resources). They should not be viewed as single variables [
15,
16]. The socio-economic potential of a poviat is a specific synthesis of economic, social, technical and ecological potential. In order for a poviat to be competitive, it must arouse interest among potential clients, which may be residents, investors, tourists, holidaymakers, people interested in changing their place of residence, etc. This ability must be supported by technical and social infrastructure and a complex system of relations functioning in the region [
17].
The state of the natural environment of Poland is territorially diversified. The values of the natural environment (natural resources) create the specificity of the region and, at the same time, constitute a constantly unexploited potential. They are conditions, but also an important determinant of socio-economic development. Overexploitation of natural resources reduces the endogenous potential of the individual and may turn out to be an ecological barrier to development. The impact of geographic and natural conditions on the development of economic regions results from their spatial diversity and their role in the economy. Geographical location, topography, climate, and natural resources have had an impact on the shaping of agriculture, settlement and the development of transport, as well as the quality of life. They may also limit or exclude certain types of economic activity, and favor the development of other types of activity.
Poland is a country quite rich in natural goods; however, their economic use is generally devoid of rational features, and often exhibits the features of a wasteful economy. The use of natural resources (requiring the appropriate quality of resources, and an appropriate attitude towards them) should be carried out in accordance with the principles of sustainable development. It is based on the rational management of natural resources and their protection. An important issue in the concept of sustainable development is the measurement and assessment of the level of development or the state of preservation of its three basic dimensions: ecological (environmental), social, and economic [
18,
19,
20,
21,
22,
23].
The aim of the article was to determine the spatial diversity of the natural environment and ecology in relation to the development of poviats in Poland. Particular attention was paid to the assessment of the mutual response of the synthetic measure of both indicated research areas, as well as an assessment of the impact of elements of the natural environment and ecology on the development process. Answers to the following research questions will bring the authors closer to achieving the main goal. The research questions were: Is the level of development dependent on the level of variables in the natural environment and ecology and how?; What is the spatial distribution of development, natural environment and ecology in the area of poviats in Poland?; Which environmental and ecology variables shape the level of development?
Development takes place in a specific geographical space (fragment of space), or economic space. It seems necessary to pay attention to poviats located in the voivodeships (Regions in Poland) of Eastern Poland. It is the area with the lowest level of economic development in Poland and one of the weakest in the European Union. The nature of the problems adversely affecting the socio-economic situation and the development prospects of this area are a consequence of historical conditions and have structural dimensions. The area is characterized by a low effectiveness of the structure of the economy and the labor market, a constant outflow of its inhabitants to other regions, or a low level of innovation. The region also differs from the rest of the country in terms of its natural environment, labor resources, economic potential, the level of infrastructure, limited professional activity, household income ratio and quality of life. They are additionally negatively strengthened by the effects of the peripheral location of the region on the external border of the European Union, beyond which are, to a large extent, even less developed areas. Regions are an example of peripheral areas, both spatially (geographical distance, directly related to the historical aspect, geographical location, diversification of the economic structure and social issues) and non-spatially (economic, social, organizational and institutional distance), which reflects the level of socio-economic development of these areas [
24].
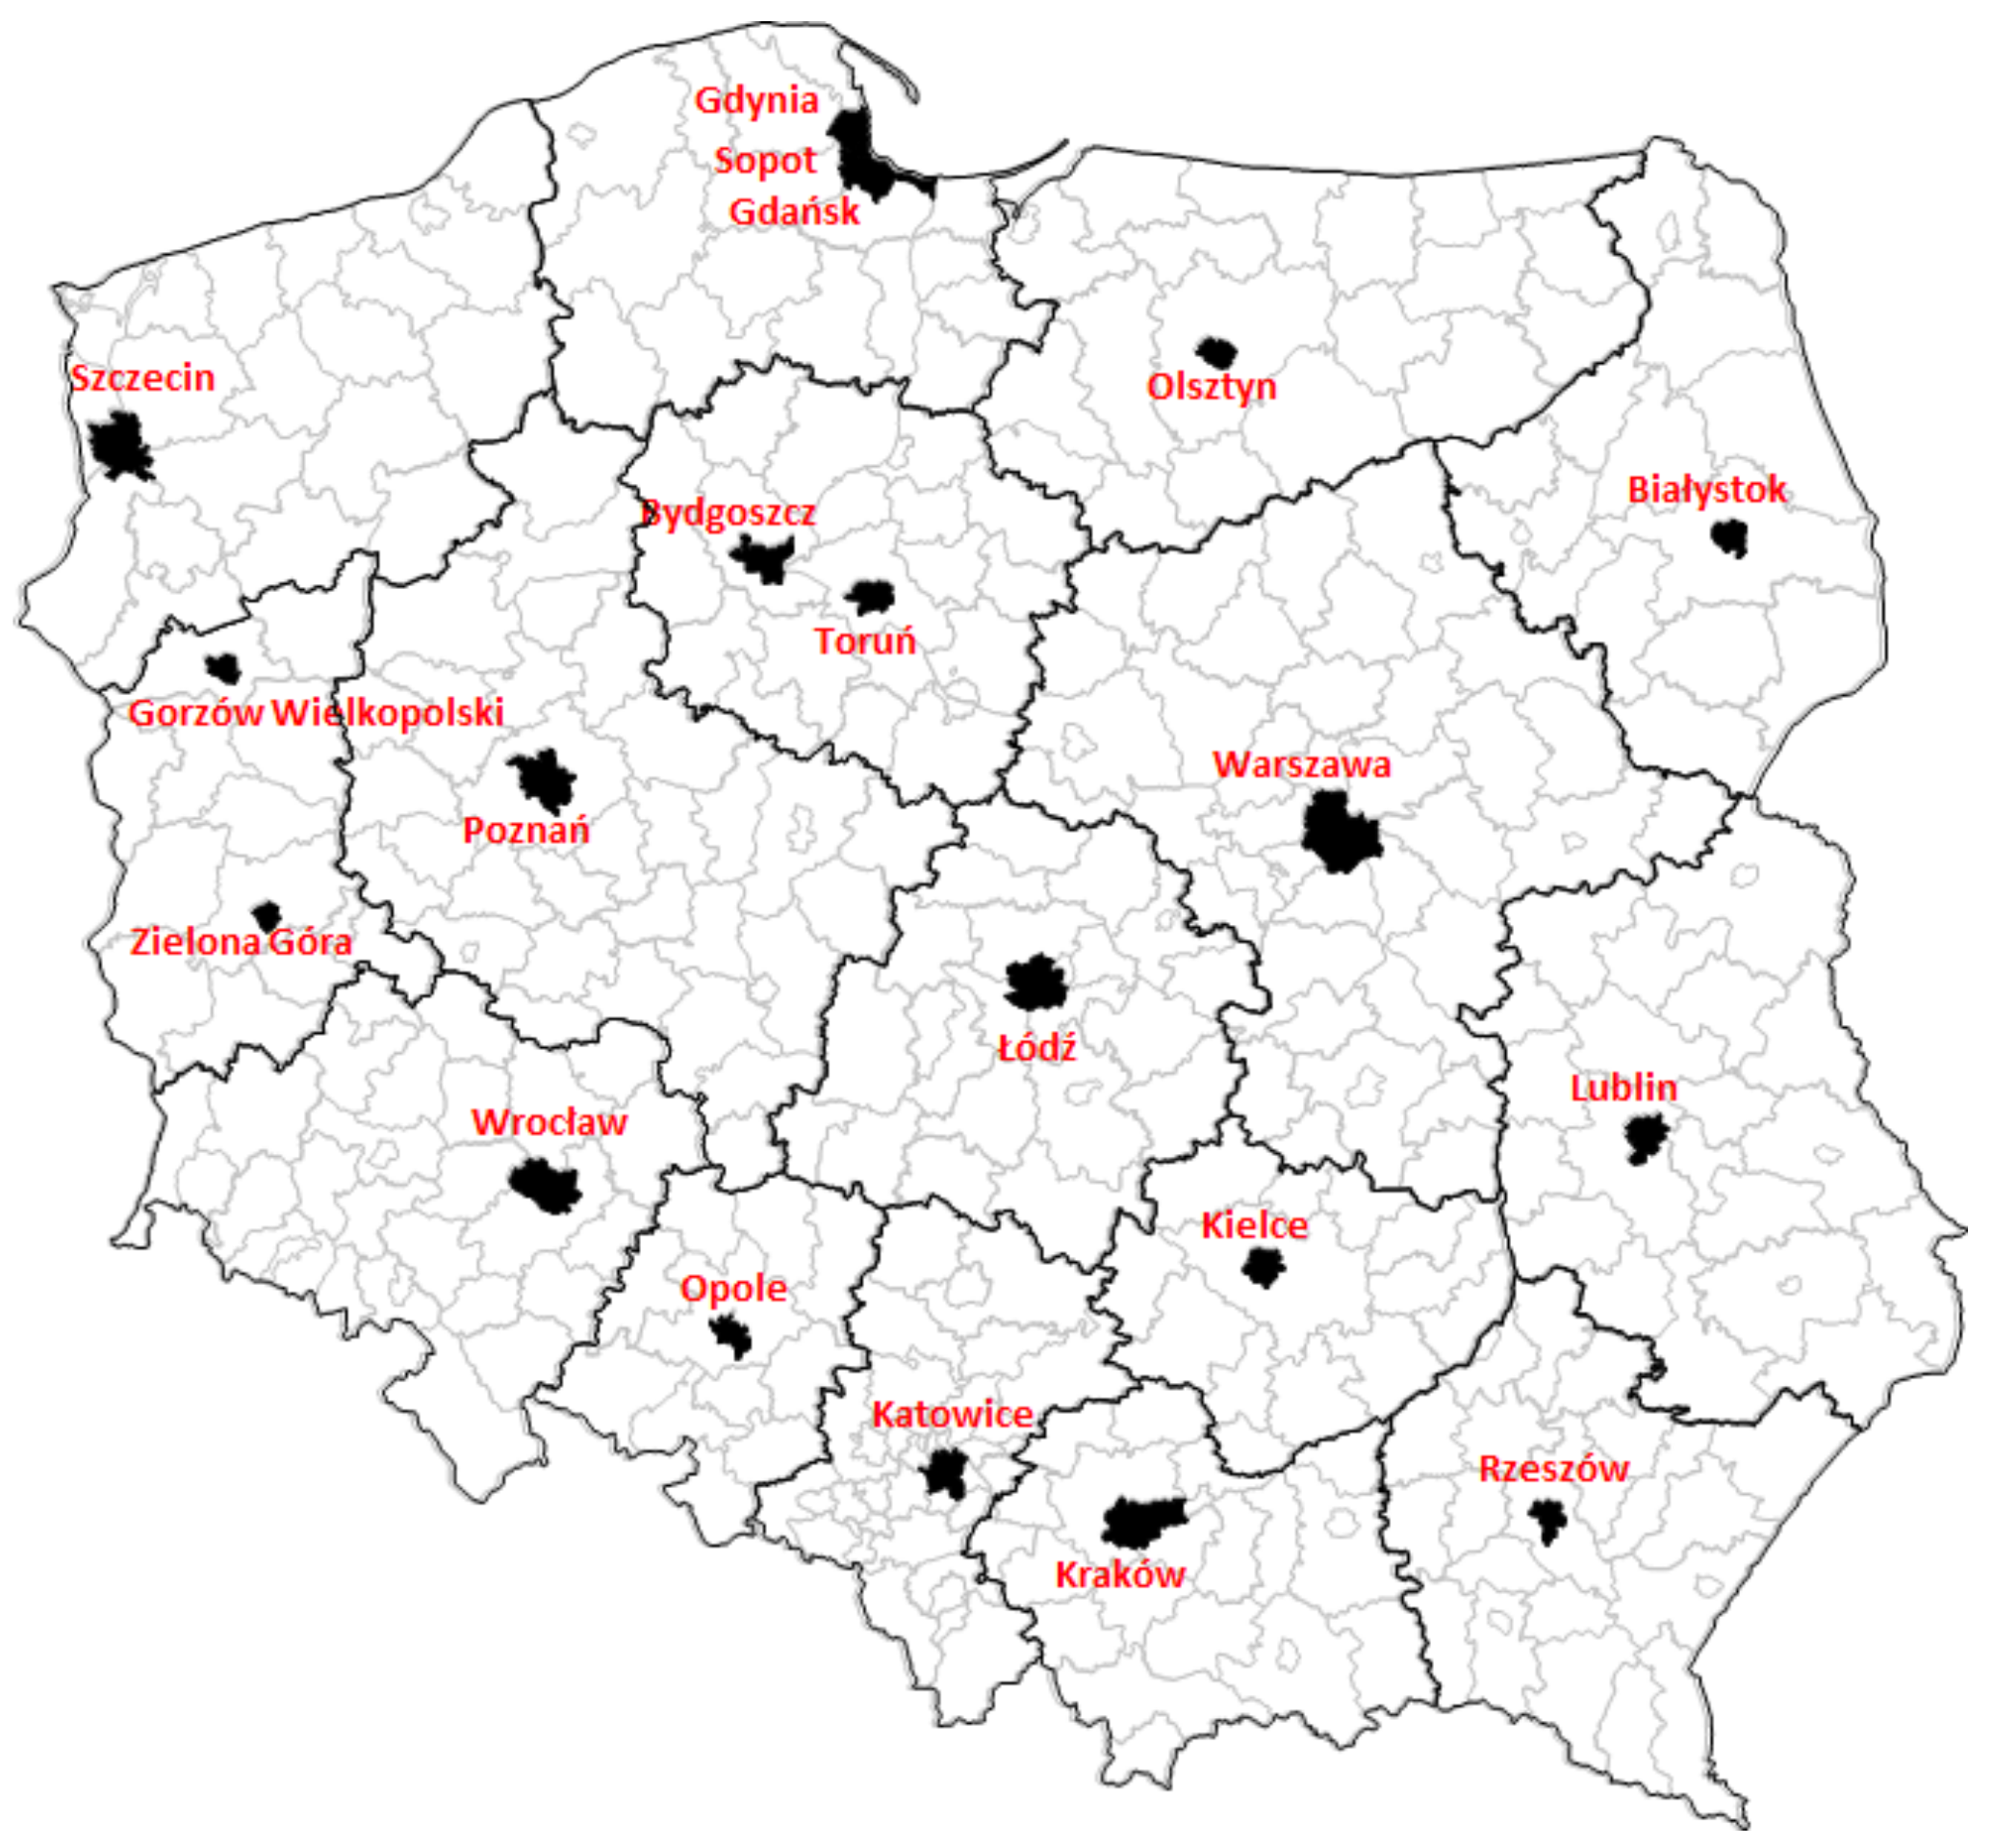
The assessment of the diversity of the indicated research areas (natural environment and ecology and development) was performed with the use of a synthetic measure. In order to build synthetic measures, the non-standard method was used. Statistical data were collected of poviats in Poland (which resulted from a greater delimitation of the natural environment variables at this level;
Figure 1). A poviat is a local self-government community (all inhabitants) and an appropriate territory, i.e., a unit of basic territorial division covering the area from a few to a dozen or so communes, or the entire city area with poviat rights (i.e., a commune with the status of a city to which poviat rights have been granted) [
25,
26,
27,
28]. The research area was mainly arable land (60.0% in area of the country), forests (30.2% in area of the country), and residential areas, industrial areas, recreation and leisure areas, land under water and agricultural wasteland (as of December 2019). In the case of poviats, the choice of variables was conditioned by the availability of data from the Local Data Bank of the Central Statistical Office for 2010–2019.
2. Literature Review
The key challenges of sustainable development relate to the ability to meet the basic needs of the (local) community without the need to excessively affect the natural environment. In the economic aspect, the challenge concerns the relationship between inputs and economic effects of running an economy (i.e., the effectiveness of the economy). The role of the spatial aspect (as an independent element) concerns rational spatial management (i.e., the effectiveness of the functioning of local structures, such as transport and network infrastructure). The determinants of development include exogenous factors (including macroeconomic factors and global changes and trends), which are independent of the activities of local and endogenous entities, which may be shaped by the policy of local government authorities. Local units should base their development on unique endogenous resources (i.e., local endogenous capital, human capital, and infrastructure). These are all elements important for the economy of a given area, often of a specific and unique character, corresponding only to a given local system [
29]. It should be emphasized that there are a number of feedback loops between the external and internal conditions. This is particularly evident in the conditions of progressing globalization and integration, where local systems are becoming more and more open to network connections with the external environment.
Gunnar Myrdal, in the theory of cumulative causality relating to the analysis of the interdependence of social, economic and institutional phenomena, proved that each element interacting with another element influences its behavior, and at the same time, is modified by the reaction of that element. Migration of the workforce, capital, as well as goods and services are specific media that participate in the process of determining the development of some regions at the expense of the degradation of others [
30]. J. Parysek pointed out that a certain group of factors is common, whereas others may occur and interact only in certain places and certain moments of time. The diversified economic structure of an individual creates a specific climate of development in which the conditions for undertaking business activity by new entities are created and the conditions for cooperation with other entities are shaped [
31].
Local governments undertake activities aimed at local (regional) development. For this purpose, they engage local resources (human, natural, and material) and use and acquire external support to engage them jointly to achieve the best effects of development dynamics [
32,
33,
34,
35]. The determinants of development include such groups as: economic, social, spatial, ecological, political, technical, and local. Many of them are the so-called traditional development factors, which include the resources of the local market, infrastructure equipment, demographic structure, and the level of education of human capital. On the other hand, the new factors of economic growth include, inter alia, innovations, achievements of science and technology, modern management styles, cooperation networks, and social capital [
36,
37,
38,
39,
40,
41,
42].
In the process of development, numerous goals should be achieved, which should be considered as meeting the basic needs of the population, using the resources at hand to create economic development and entrepreneurship, ensuring sustainable development and the reliability of system operation, and supplying them with the necessary production resources [
43,
44,
45,
46,
47]. Sustainable socio-economic development takes place in a well-defined space, at different territorial levels, e.g., local, regional, and national. It is defined through a prism of changes in economic potential, economic structure, natural environment, infrastructure management, spatial order, and the standard of living of the inhabitants. The development of the region is therefore an integral part of the entire national economy [
48,
49].
The concept of sustainable development is a response to uncontrolled economic growth, which so far has often taken place at the expense of the degradation of natural resources (depletion of natural resources, pollution of the natural environment, etc.) [
50,
51,
52,
53,
54,
55,
56,
57,
58,
59]. The basic idea of sustainable development is to integrate three main aspects: social, economic, and environmental (triple bottom line) [
60,
61,
62]. This will ensure a lasting improvement in the quality of life of the present and future generations by appropriate shaping of the proportions between the various types of capital: economic, human, and natural [
63]. Instead of analyzing each aspect of the impact of sustainable development separately, they should be treated as a coherent concept in which these aspects nestle one-another. There can be no healthy economy and society without respect for the environment [
64]. Sustainable development is a multi-dimensional concept that consists of many interrelated components, including ecological, environmental, economic, technological, social, cultural, ethical, and political dimensions [
65].
The assessment of the level of sustainable development should be based on its goals as well as its basic dimensions: protection of long-term ecological balance, satisfaction of basic needs and promotion of intergenerational and intergenerational justice [
66,
67,
68]. It should therefore be led by analyzing economic, social, and environmental indicators, and combining them into an integrated sustainable development indicator. Each composite index aggregates a number of selected indicators that are necessary to evaluate the development process, competitiveness, financial situation, and the natural environment [
69].
The spatial heterogeneity of development factors is recognized as the cause of development differences in the regional system [
70,
71,
72,
73]. They occur with varying strength in the economic space, which also shapes them. The new economic geography drew attention to the need to take greater account of spatial conditions based on the theory of location in explaining the processes of socio-economic development, leading to significant differences in territorial systems [
74,
75]. In turn, the so-called the new growth theory initiated by the works of Romer (1989) is based on the concept of endogenous development which, although more and more clearly emphasizing the so-called new growth factors, included mainly the importance of human capital. Local resources of individual areas are characterized by size, generic structure, land ownership structure, the possibility of using physical, spatial and financial accessibility for development, and use costs. Undoubtedly, one of the main resources influencing local development is the natural environment. The literature on the subject lists a wide set of local development factors, which can be broadly divided into four categories: (1) socio-cultural; (2) economic; (3) technical and organizational; and (4) natural [
76].
External conditions of the development process are related to changes in the socio-economic system. In these conditions, the challenge becomes to effectively influence the factors of regional development, which are effectively aimed at increasing convergence. These factors change their scope, method of interpretation, mechanism of influence and they differ in space [
77].
The natural environment is a universal value [
78]. Environmental degradation forces us to intensify and integrate organizational efforts of the society, and to create system solutions. It is the administration apparatus that has obligations in terms of the natural environment and its protection [
79]. Today, environmental protection is also perceived in the aspect of sustainable development and reorganization in this direction [
80]. The universal use of the environment is entitled to everyone for the satisfaction of personal and household needs. In particular, natural capital (environmental capital) is broken down into non-renewable resources, renewable resources that are harvested and those that are not used in production. Maintaining these resources should be an integral part of economic policy, especially in less developed regions [
81]. Sustainability is defined in terms of the consistent quality of the environment. Basic human needs are the minimum requirement influencing the level of sustainable development and the use of natural resources [
82].
Elements of the natural environment may constitute a factor increasing the competitiveness of poviats in the implementation of social, economic, and ecological functions. The possibility of using the natural environment for development requires the appropriate quality and quantity of resources. The environmental advantage of poviats is the result of the activities of all units (households, enterprises, institutions, etc.) operating in these areas. The quantitative increase in this capital has certain limits (i.e., the maximum level of social wealth, depending on the amount of natural resources available, soil quality, and the nature of the climate). The condition of the environment and the measures taken to protect it are more and more often treated as a development factor. Due to its economic nature, it is, among other things, a source of obtaining raw materials and energy, provides geographical space, a field of economic activity, and a place to live or rest [
83].
3. Materials and Methods
The main aim of the research was to assess the spatial differentiation of development relations as well as the natural environment and ecology of poviats in Poland with the use of a synthetic measure. This made it possible to rank and group the surveyed individual units. It also enabled examination as to whether there are relationships between socio-economic development and the natural environment and ecology.
Statistical data were collected in the spatial terms of 314 poviats in Poland. They should be understood as a local self-government community and the relevant territory, i.e., a unit of basic territorial division covering the area from a few to a dozen or so communes, or the entire city area with poviat rights (i.e., a commune with the status of a city to which poviat rights have been granted). The choice of variables in 2010–2019 was largely determined by the availability of data collected in the poviat system in the Local Data Bank of the Central Statistical Office (BDL GUS). The synthetic measure (development, environment, and ecology) was determined using a measure based on the model-less method, based on the Hellwig method [
84]. An unambiguous assessment of the degree of development, whether of the natural environment and ecology, is not easy due to various levels in which the studied processes can be considered.
The synthetic measure facilitated the comparison of objects in multidimensional spaces, a comprehensive look at the level of the phenomenon under study in individual objects, conducting comparative analyses of objects, both in spatial and temporal terms, and their linear ordering. The following procedure was used in the process of building a synthetic measure:
- (1)
Selection of simple variables and their verification in terms of content and/or statistics;
- (2)
Division of variables into stimulants and deterrents. Determining the direction of the preferences of variables in relation to the examined (main) research criterion;
- (3)
Normalization of variables according to the zero unitarization method;
- (4)
Calculation of the value of the synthetic measure in the studied area using the modeless method (based on the Hellwig method);
- (5)
Linear ordering of objects. Identification of typological classes for the entire area of variability of the synthetic measure. Analysis and conclusions [
85,
86,
87,
88,
89,
90,
91,
92,
93].
In the first stage of constructing a synthetic measure is the selection of simple variables describing selected poviats. In terms of the development process, poviats were characterized with variables including the demographic situation, the labor market, social potential, the economic structure, infrastructure (social and technical) as well as the condition and protection of the natural environment and ecology. The natural environment is an important component of the region’s wealth, as well as an essential component of the quality of life. It is a source of obtaining raw materials and energy, it provides geographical space to live or rest, and is a field of economic activity. This creates a multi-dimensional space for the functioning and a set of interdependent elements that occur in the same time and space horizon.
The description of the set may be presented in the form of an observation matrix
in the form:
where
denotes the values of the jth variable for the ith object,
i is the object number (
i = 1, 2,… n), and
j is the variable number (
j = 1, 2, …, m).
The described variables were used to build a synthetic measure in
Table 1. Problems related to the implementation of the study resulted from changes in legal regulations in the income system, the scope of tasks by territorial units, budget reporting, changes in the administrative division, changes in the socio-economic situation, or the lack of data collected as part of public statistics at the level of poviats.
The development is very difficult to define with the use of statistical methods. it was concluded that the most appropriate method for its determination was the use of a synthetic index, constructed on the basis of a defined number of diagnostic variables. It is shaped by many different elements that make up the demographic, economic, financial, and environmental aspects, as well as the links between these elements of the multi-dimensional space of the facility. They form a network of mutual connections, and because they act for the benefit of a given community, they are interdependent and should be considered jointly.
Finance makes it possible to perform a comprehensive assessment of the commune’s activities and its development possibilities or the implementation of public tasks. There is a feedback loop between the socio-economic and financial variables.
The sources of independent income of the poviat are: flows from fees constituting the poviat’s income, paid on the basis of separate regulations; income obtained by poviat budgetary units and payments from poviat budgetary establishments; income from poviat property; inheritance, bequests, and donations to the poviat; and interest on funds accumulated in the poviat’s bank accounts. A certain amount of the share in revenues was from personal and corporate income tax. The revenues of local government units include total income, general subsidy, and targeted subsidies from the state budget.
Transfers from the budget are the sum of subsidies and subsidies obtained by the poviat from the state budget. The general subsidy is a statutory cash benefit of the State Treasury for individual local government units; for provinces. Subsidies are defined as funds from the state budget, the budget of local government units and from state earmarked funds subject to specific accounting rules, allocated under the Public Finance Act, separate acts, or international agreements, for financing or co-financing the implementation of public tasks [
94,
95,
96].
Appropriate entrepreneurial potential contributes to an increase in the standard of living, increased production, better social situation, and greater public safety. It is one of the indicators showing the economic situation of the region. Companies of the national economy are entered into the register (REGON), i.e., legal persons, organizational units without legal personality, natural persons running a business and local units entered by a legal unit (companies are entered in the register per 1000). REGON (Register of National Economy), National Journal of the National Economy Register is a register kept by the President of the Central Statistical Office. The notion of REGON is also understood as the REGON identification number, i.e., the nine-digit identifier given to the entity in this register.
The quality of the adopted set of variables affects the credibility of the results and the accuracy of decisions made on their basis [
97]. Diagnostic variables should be defined so that they fully describe the analyzed phenomenon [
98,
99]. The selected variables should provide the greatest informative and differentiating values in relation to the considered objects and important for the studied phenomenon [
100].
The final set of features includes variables characterized by high spatial variability (coefficient of variation above 0.10) [
101], and low correlation within groups of variables (coefficient below 0.75) [
102]. A. Malina noticed that a high value of the correlation coefficient causes a duplication of information about the analyzed phenomenon and may lead to incorrect conclusions. Two features strongly correlated with each other are carriers of similar information; thus, one of them is redundant. Features over-correlated (diagonal elements correspond to them) in the case of an inverse matrix with values greater than 10 are eliminated from the set of variables. The procedure is repeated until the stability of the R-1 matrix is achieved [
103].
The analysis of the dependence made on the basis of the coefficient of variation (the variable X23 was removed) and the inverse correlation matrix (the study X4, X27 was removed) leads to the conclusion that the selected input variables are slightly correlated with the others. All the variables selected for the analysis are characterized by sufficient discriminant ability. The analyzed indicators can be associated with three dimensions of cohesion (economic, social and territorial). It is the EU objective of the actions of public authorities as part of the regional policy.
The value of the coefficient of variation of the variables used was the highest for the X34 variable, the smallest for X2 in 2010, and X14 and X10, respectively, in 2019. In the case of the range in 2010, the highest value was for X14, the lowest was X10 in 2010, and X14 and X12 in 2019, respectively, and for standard deviation X14 and X10, X11 in 2010 and 2019. Moreover, it should be noted that almost all variables were characterized by positive asymmetry (only X1, X11, X27, X40 in 2010; X10, X11, X12 in 2019 negative asymmetry;
Table 2). In the case of stimulants, negative asymmetry is not a favorable situation. It means that a greater number of poviats have values of these variables lower than their average value.
In doubtful cases, it is worth using Grabiński’s procedure, which uses the fact that stimulants should be positively correlated with stimulants (similarly for deterrents) and negatively correlated with deterrents [
104,
105,
106]. The correctness of determining the nature of the variables can be verified by defining the direction of correlation of individual variables with the decision variable. For a stimulant, this direction should be positive, and for a deterrent, the direction should be negative [
107].
Diagnostic variables usually have different titers and different ranges of variation, which makes it impossible to compare and add them directly. To change this situation, stimulants were subjected to the zero unitarization procedure according to the formula:
where
, S is the stimulant,
D is the deterrent,
i = 1, 2… n;
j = 1, 2… m, maxx
ij is the maximum value of the jth variable, minx
ij is the minimum value of the jth variable, and x
ij means the value of the jth feature for the tested unit [
108,
109,
110]. In the zeroed unitarization method, there is a fixed reference point, which is the range of the normalized variable: R (x
ij) = max {x
ij}—min {x
ij}. The research was carried out dynamically, determining the values of min {x
ij} and max {x
ij} for the entire period, i.e., 2007–2019.
After transformation, diagnostic variables were standardized in the range [0; 1] [
111]. As a result of the unitarization process, a matrix of feature values was obtained:
where Z
ij is the unitary value of the jth variables for the ith object
The basis of linear ordering is a synthetic variable. The first synthetic measure of development was proposed by Z. Hellwig to evaluate the economic development of countries [
84]. It made it possible to order the examined objects according to that of the analyzed phenomenon, which cannot be measured with one tool. Additionally, it enables the assessment and comparison of multi-feature objects according to the established criteria, or to indicate weaker and better areas of the unit’s operation. Moreover, it enables grouping the analyzed territorial units into classes with a similar level of development. It can be a helpful tool for assessing the accuracy of past decisions and the effectiveness of past regional management instruments.
The design of the synthetic measure is based on a non-model method using the formula:
where
means the value of the zenitarised trait for the test unit in year t, and
p is the number of characteristics. The pattern in the presented process is often taken at the level of the maximum values of the included max{x
ij} indicators. The indicator takes a value between 0 and 1. A value closer to unity means that the object is characterized by a high level of the analyzed phenomenon, whereas when the values are closer to 0, the object is less developed in the examined respect [
112,
113,
114].
In the last stage, the study area was divided into four quartile groups. A quartile is one of the measures of central tendency used to determine the value of the variable around which the data are grouped. The first, second and third quartiles were adopted as threshold values. The size of the synthetic measure in the first group is the unit that is better; the last group is the weakest in terms of the examined criterion (in order to calculate the quartiles, MS Excel and the “QUARTILE” function were used). Subsequently, the correlation coefficient (Pearson) was assessed. If it is close to ±1, it means that the quantities are well correlated and there is a functional relationship between them. A scatterplot with a line of fit for synthetic measures was also presented, and a linear regression analysis was performed [
90,
91,
115,
116,
117,
118,
119].
Regression analysis examines the relationship between the variables of interest. It describes the relationship between the dependent variable (Y) and the explanatory variable (X). Regression analysis fits such a straight line to the examined variables so that the model is as good as possible. In the process of building a regression model, a high autocorrelation of variables should be excluded. First, the fit of the model is checked using analysis of variance. Then, the percentage of the variance is determined by reading the R2 statistic. The coefficient of determination determines the degree to which the estimated regression function explains the variability of the variable y. It takes values from 0 to 1. The closer to 1, the better the fit of the regression function to empirical data.
The area under study was divided into four quartile groups, and the values of the first, second and third quartiles were adopted as the threshold for subsequent groups. We describe a linear regression model with the following formula:
In the case of the multiple regression model, when we have a larger number of variables, we use the following formula:
where b is the regression coefficient calculated for the individual variables of the model,
x is the explanatory variable,
y is the dependent variable, and a is an intercept [
85,
86,
87].
Spatial autocorrelation is a situation in which the occurrence of a single phenomenon in one spatial unit increases or decreases the occurrence of this phenomenon in adjacent entities [
120,
121]. Global Moran’s I statistics check whether adjacent parcels form clusters with similar values of synthetic measure, based on the formula [
122,
123,
124]:
Local form of the I-Factor of Moran for observation and, determining the similarity of the spatial unit to the neighbors and the statistical significance of that relationship, is determined by the formula:
where
n is the number of spatial objects (number of points or polygons),
xi, xj are the values of the variable for the compared objects,
is the average value of the variable for all objects, and
wij is the elements of the spatial weight matrix (weights matrix standardized with rows to one),
- variance.
Moran’s I statistic takes a value from the interval (−1, 1), where the value 0 means no spatial autocorrelation. Negative autocorrelation consists of units with different values appearing next to each other in space, differentiation of the examined objects. Positive autocorrelation means that units with similar values appear next to each other forming clusters [
125,
126].
The Gini coefficient (concentration coefficient) is a measure of the unequal distribution of the studied variable, which takes a value between 0 and 1). An index with a value of 0 indicates that there is no inequality, whereas an index with a value of 1 means complete inequality [
127]. If the observations for
yi are ordered in ascending order, then the Gini coefficient is given by the formula:
where
yi is the value of the
i observation, and
is the average value of all
yi observations (e.g., average income of territorial units), which is [
128]:
4. Results
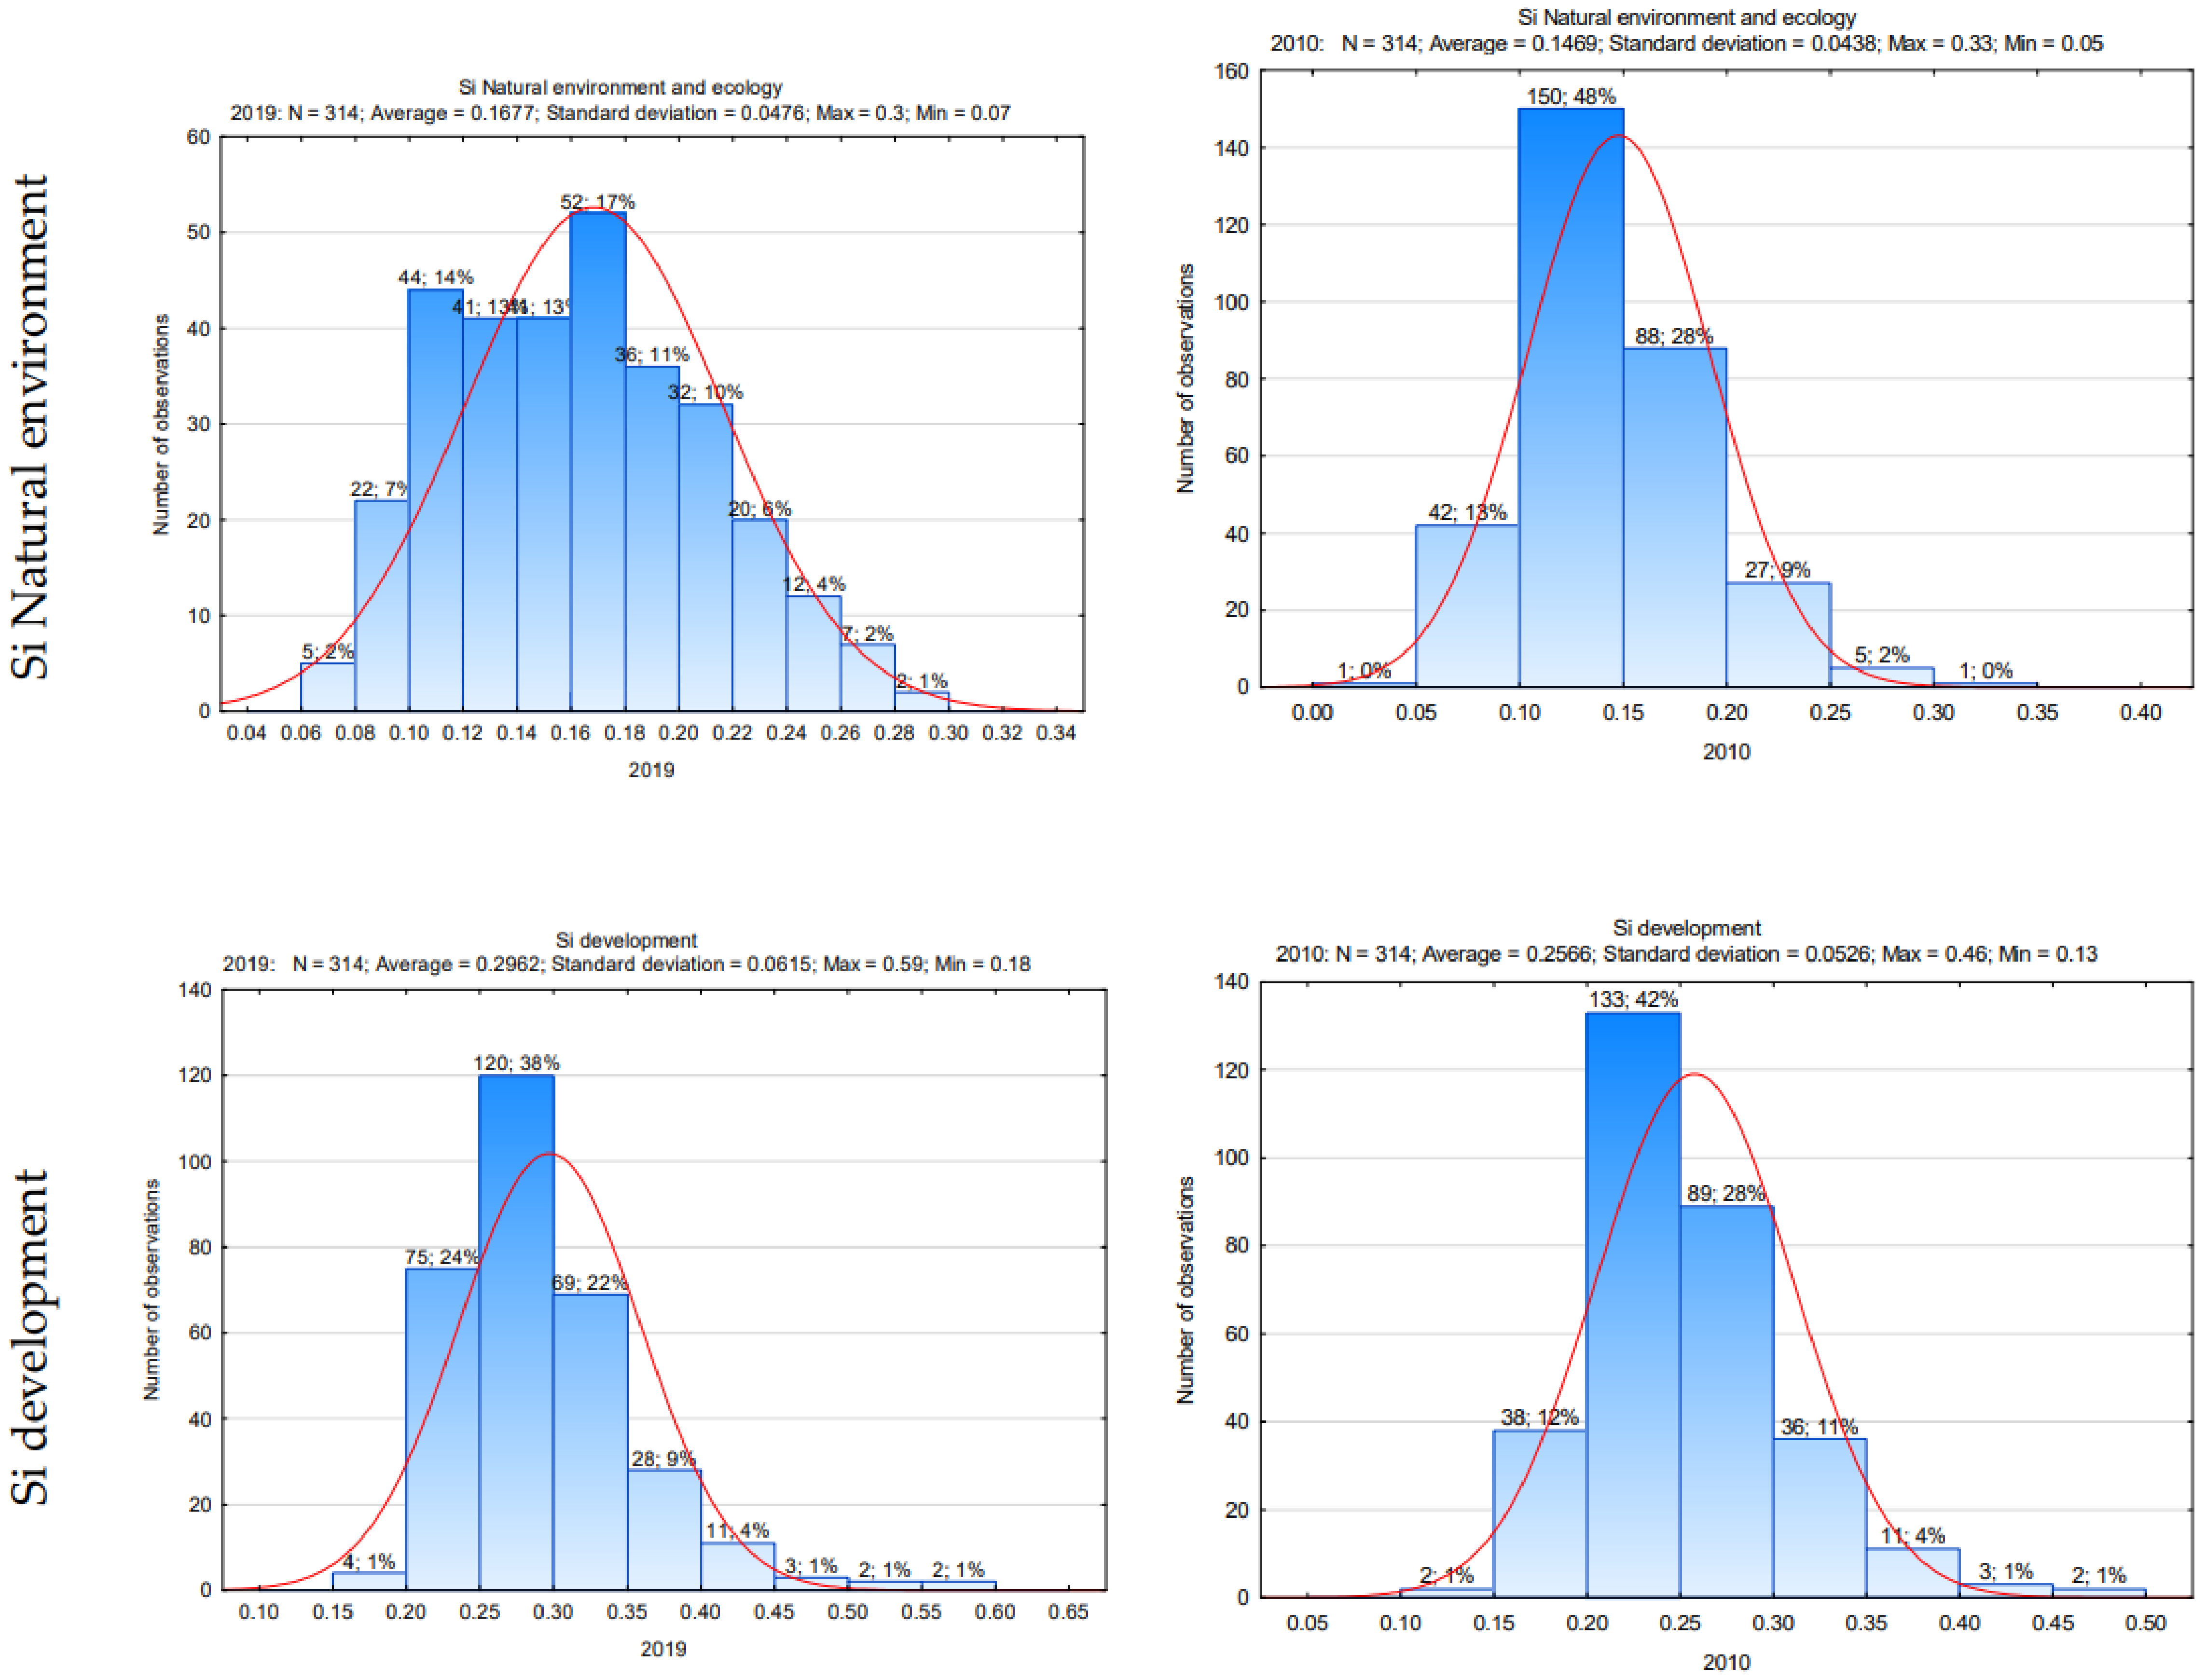
As a result of the research procedure, the spatial diversity of counties (314) in Poland in 2010–2019 was shown in terms of the level of socio-economic development, as well as the natural environment and ecology. In 2010, the synthetic measure, natural environment and ecology, ranged from 0.05 to 0.33, and in 2019, it ranged from 0.07 to 0.30. The range of the range value in 2010 was higher (0.28) than in 2019 (0.24), which indicates a decrease in the diversity of units in the studied area. The synthetic measure Si of development ranged from 0.13 to 0.46 in 2010 and from 0.18 to 0.59 in 2019. An increase in the range measure (from 0.33 to 0.41) indicates an increase in differentiation units in terms of development.
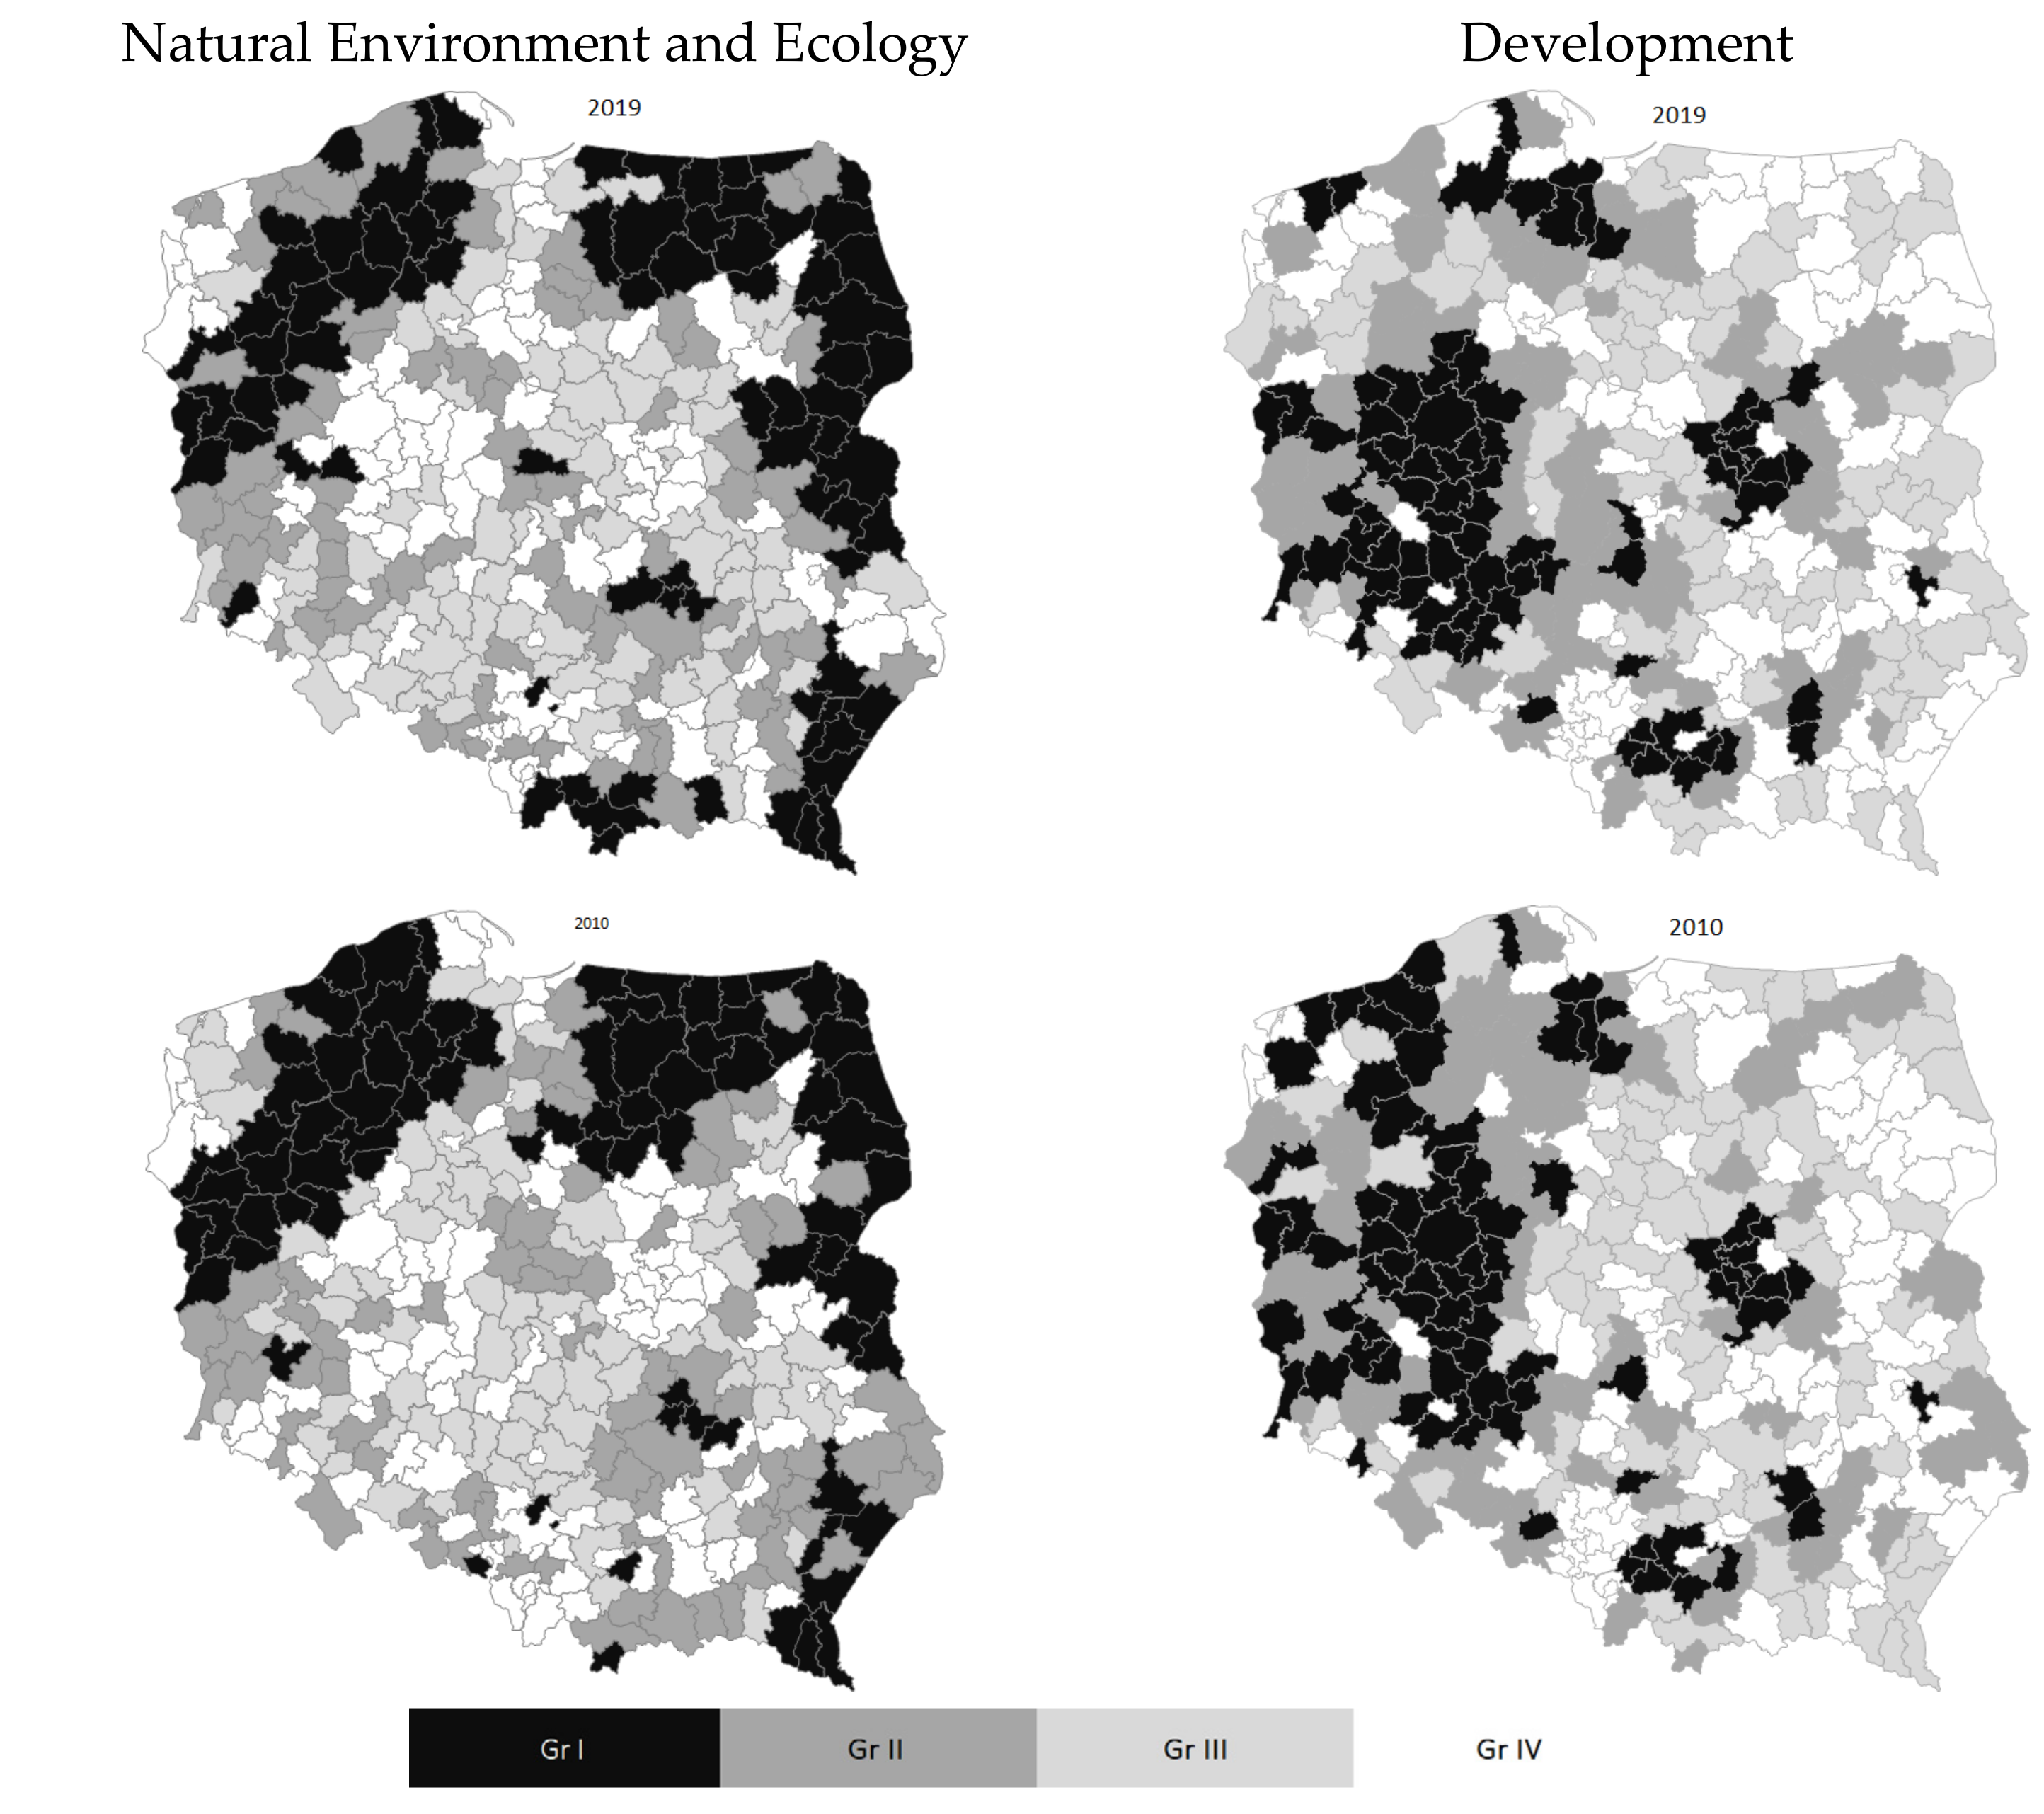
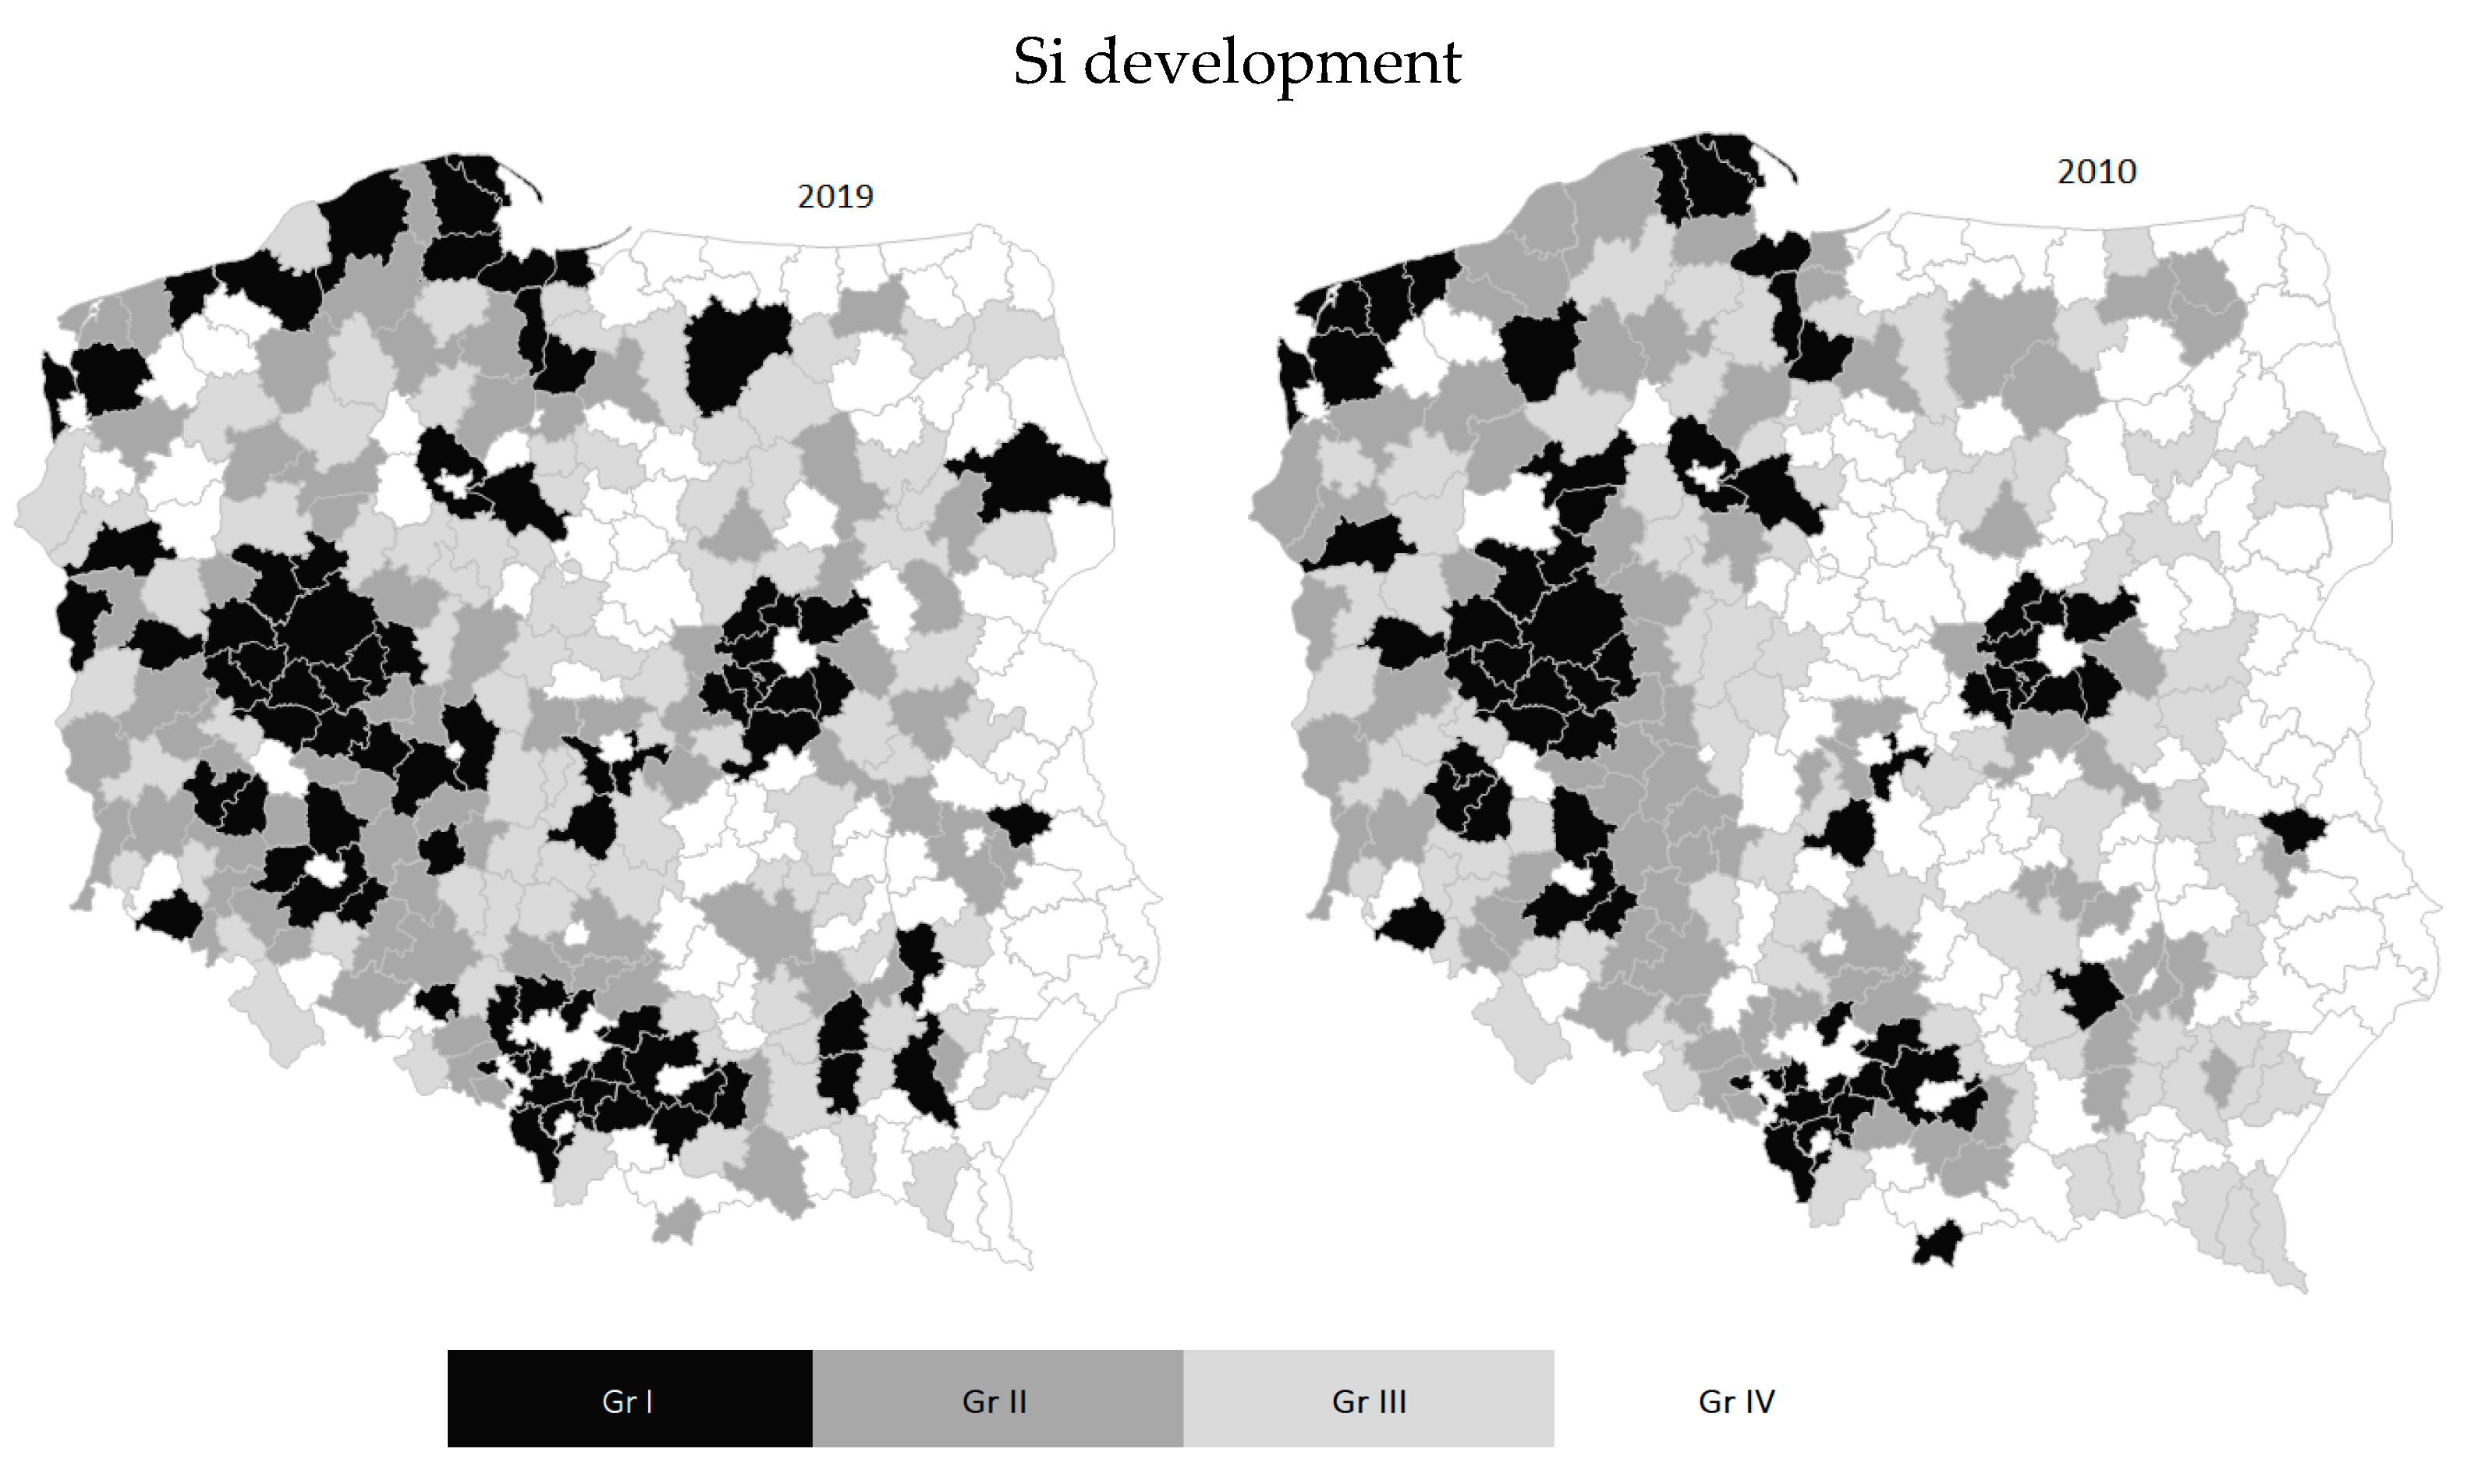
Figure 2 shows the spatial differentiation of development as well as the natural environment and ecology of poviats in Poland in 2010 and 2019 (black is the best unit; the lighter the shade, the weaker the development). The position in the ranking of poviats was determined by the variables of the development aspect (migration balance, the number of the unemployed and employed, the number of economic entities and natural persons running a business, the level of own income and transfers from the state budget, etc.), as well as the natural environment and ecology (the level of wastewater discharged and treated, the level of mixed waste collected, the population using the water and gas network).
The poviats in Poland in 2010 and 2019 are characterized by disproportions in terms of development variables, as well as the natural environment and ecology. Poviats distinguished by a higher level of natural environment and ecology are not distinguished by a higher measure of development. The synthetic measure of the natural environment potential in group I ranged from 0.21 to 0.23 (2010 to 2019), and in group IV, it ranged from 0.10 to 0.11. The ranges in these groups were 0.02 and 0.01, respectively, which indicates a slight variation in the studied range.
Group I municipalities (the best: in 2019 there were 73 units, i.e., 23.24% of counties in Poland) compared to group IV municipalities (the weakest: 71 units, i.e., 22.61% of counties) were characterized by (
Table 3):
- (1)
A much higher level of the synthetic measure of the natural environment and ecology, and the same level of the synthetic measure of development as in groups II and IV, lower than in group III;
- (2)
Higher rate of birth rate and net migration per 1000 population and lower value of population per km2;
- (3)
In terms of entrepreneurial potential, the number of the unemployed, employed, economic entities and natural persons running a business per 1000 population was higher;
- (4)
In terms of the financial situation, a slightly higher ratio of investment expenditure to total expenditure and a lower proportion of own income and transfer income in total income;
- (5)
Lower value of the measure: investment outlays, gross value of fixed assets and sold production of industry per capita in enterprises (in relation to other groups);
- (6)
In terms of infrastructure—lower values of water and gas network users as a percentage of the total population.
In terms of variables describing the situation of the natural environment and ecology, groups I in relation to IV in 2019 were characterized by:
- (1)
Lower value of dust and gaseous pollutant emissions per 1 km2;
- (2)
A higher value of the variable is the share of forest land in the total area;
- (3)
Higher value of the variable generated and conditioned waste per 1 km2 of area;
- (4)
The lower value of the variable sewage discharged and treated per year per 1 km2;
- (5)
A higher value of the variable population using sewage treatment plants and legally protected areas.
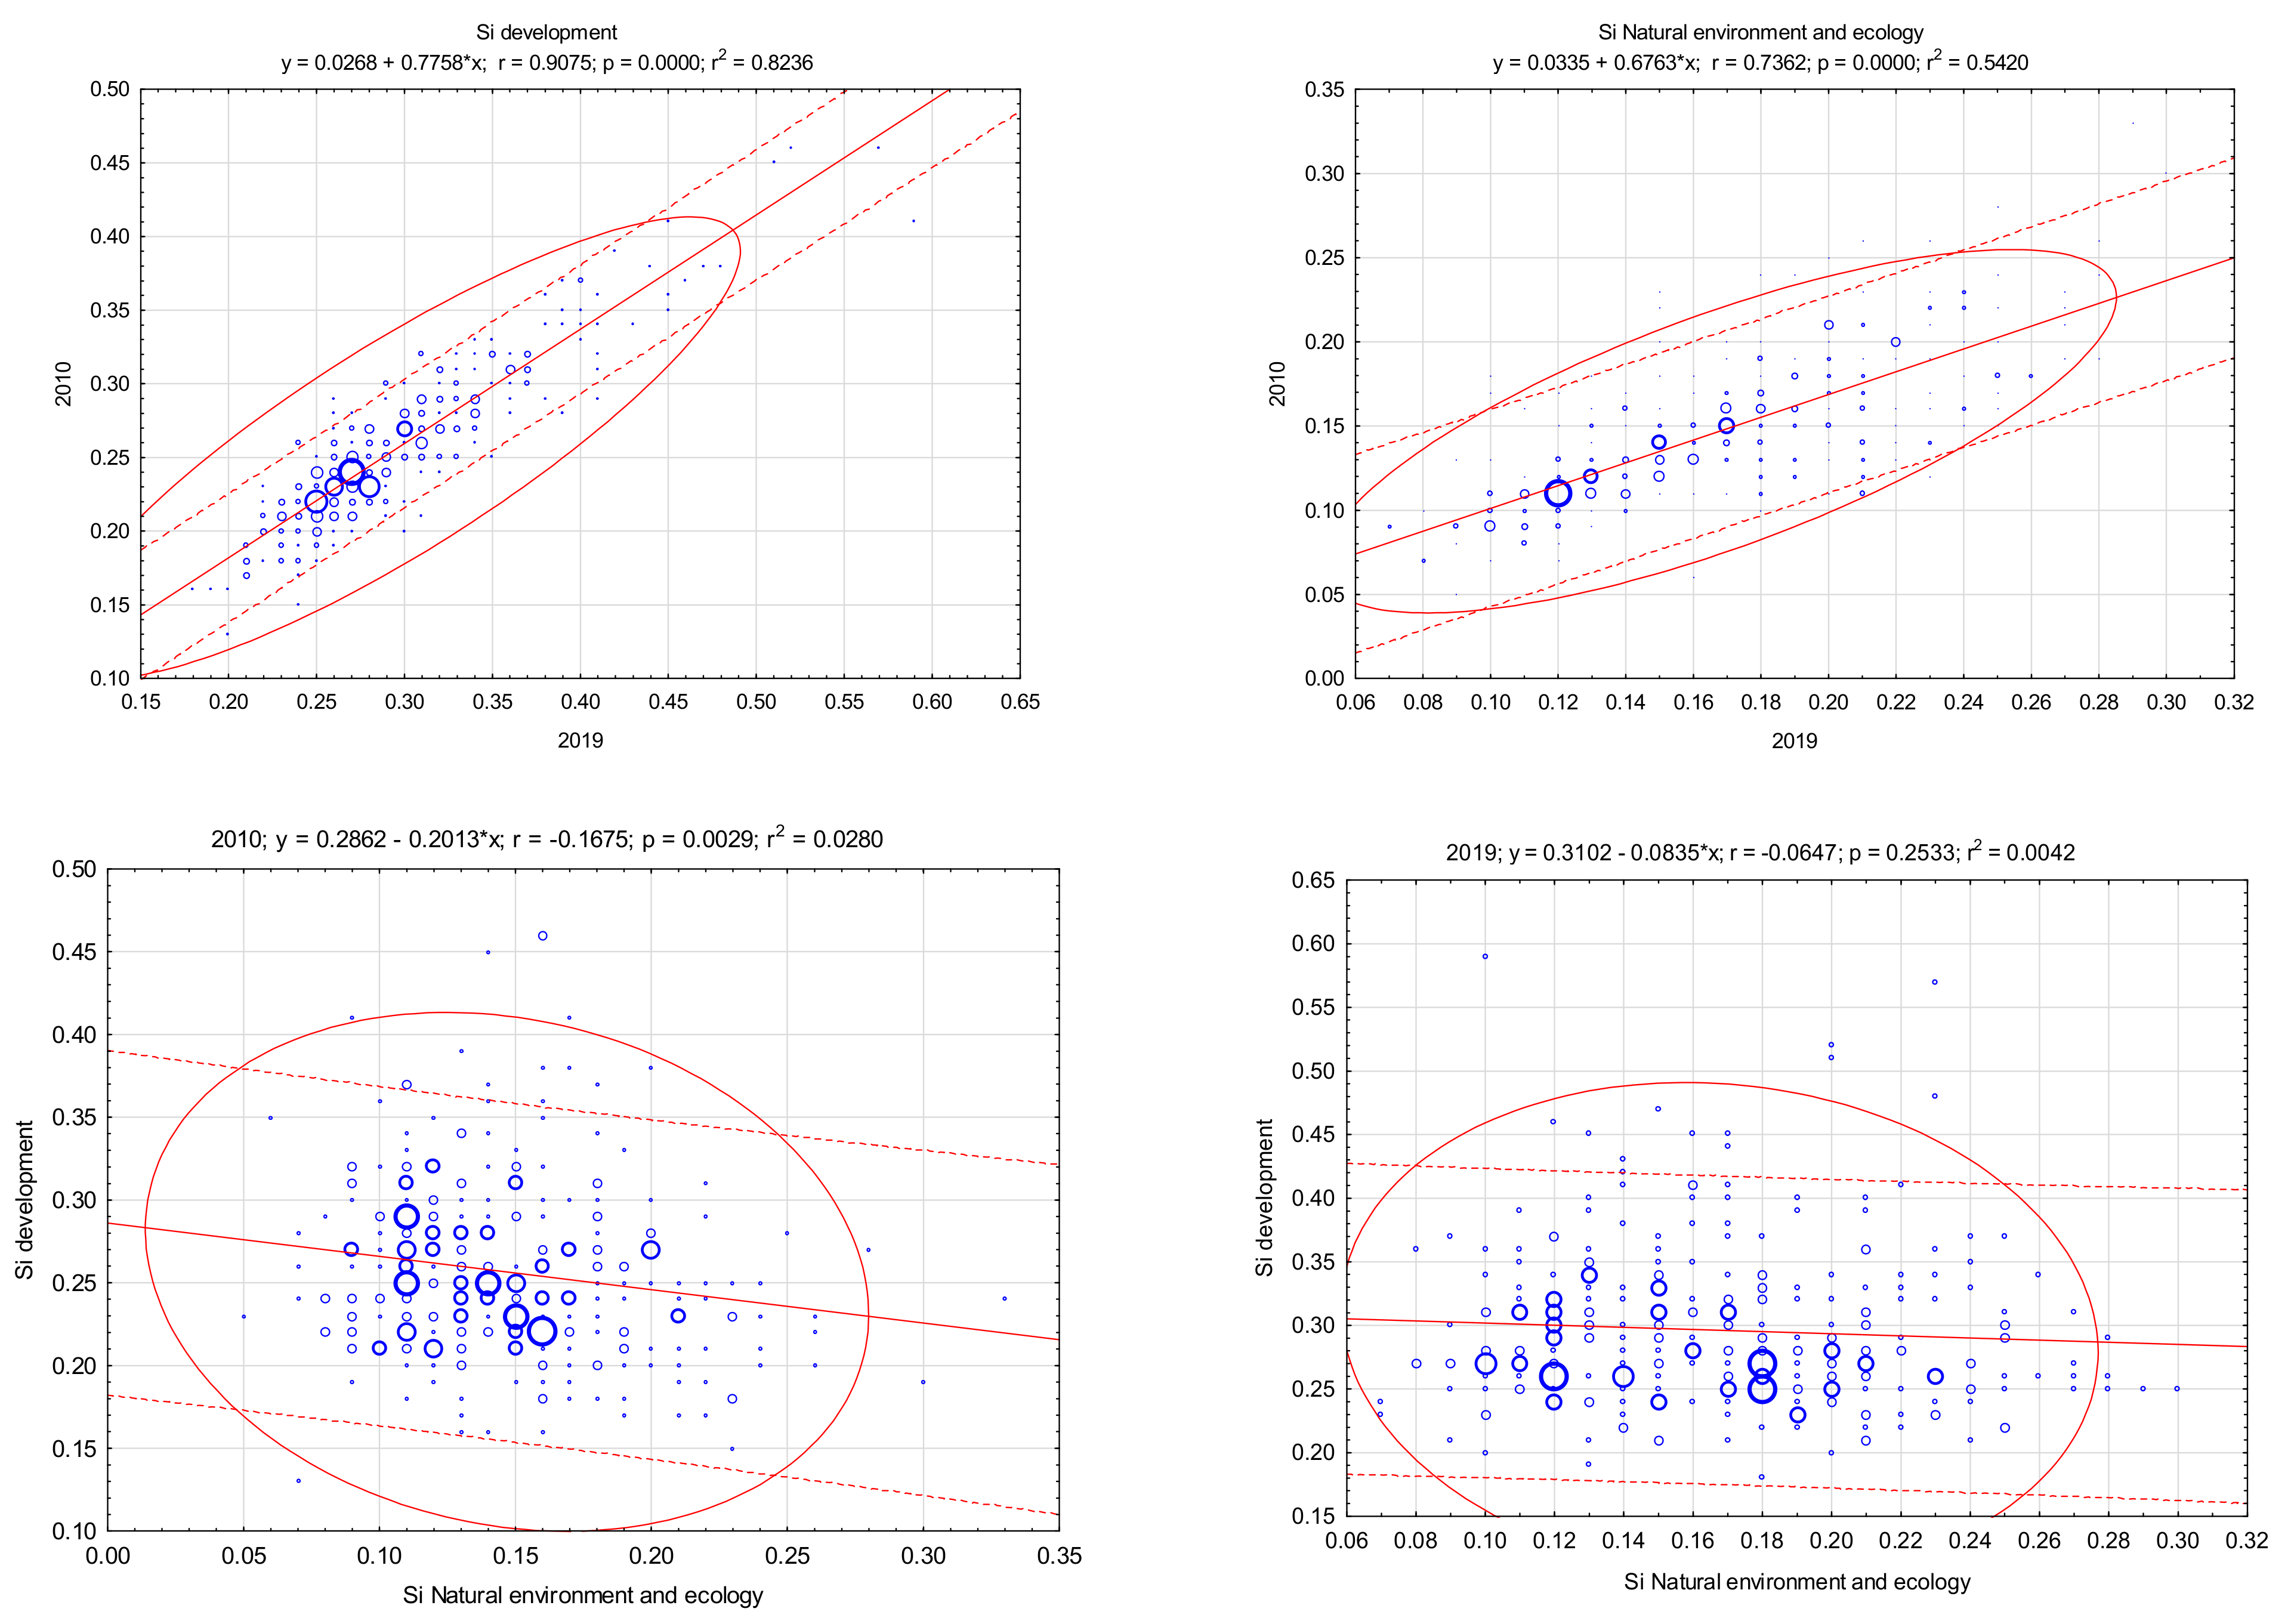
Figure 3 shows the distribution model for the synthetic measure of development and financial situation. In the case of the development measure, we observe the right-hand distribution of Si (development; As > 0) in 2010 and 2019, as well as Si (natural environment and ecology). The right-hand skewness indicates that a greater number of powers have values of these variables smaller than their average value. This indicates the weakness of the studied region in the indicated area. The most numerous range in 2019 for the Si measure (development) was 0.25–0.30 (120, 38%), and the Si measure (environment and ecology) was 0.16–0.18 (52, 17%). There was a dominance in the indicated range.
The statistical characteristics of the synthetic measure of development as well as the natural environment and ecology of Polish poviats in 2019 compared to 2010 do not clearly indicate a decrease or increase in the diversity of the phenomenon in the studied area (
Table 4). The measure of development in terms of the range measure, standard deviation, and coefficient of variation indicated an increase in the differentiation of units (other measures indicated a decrease in differentiation). In the case of the synthetic measure of natural environment and ecology, the range and coefficient of variation indicated a decrease in differentiation (other measures indicated an increase in differentiation).
Pearson’s correlation coefficient between the value of the synthetic measure of development and the measure of the natural environment and development was −0.167 in 2010, and −0.064 in 2019 (
Figure 4). This may confirm that the spatial differentiation of the studied area was quite stable, and the units reacted similarly to changes taking place in the economy.
Each region has its endogenous potential which, in connection with the exogenous potential and the ability to respond to changes in the environment, may constitute an opportunity for the development of a given area. Endogenous factors define the developmental (competitive) ability of units. As emphasized by S. Korenik, these are all elements important for the economy of a given area, often of a specific and unique character, corresponding only to a given local system [
77]. In terms of the variables of the natural environment, the development measure was positively correlated with the level of discharged (0.6317) and treated (0.6317) water and mixed waste (0.6106). On the other hand, it was negatively correlated with the demographic dependency ratio (−0.1192), the number the unemployed (−0.5846), the level of transfers from the state budget (−0.7309), the variable on communal and poviat hard surface roads per 100 km
2 (−0.4777), the level of industrial sewage discharged (−0.0837), and the share of legally protected areas in the total area (−0.1181). The level of the poviat development measure in Poland (in 2010–2019) was also correlated with the migration balance (0.619), population density (0.5539), the number of employed persons (0.7109) and economic entities (0.7251), natural persons running a business (0.7276), share of own income in total income (0.7756), gross value of fixed assets in enterprises (0.6012), sold production of industry (0.5718), average monthly gross wages and salaries (0.5181), and users of gas installations (0.5534) (
Table 5).
The regression analysis of the development potential and variables of the natural environment and ecology of poviats in Poland (in 2020–2019) indicates that the presented regression model explains 0.476966 (R; which is a poor result) of the model’s variability. The model shows the importance of forest land area, dust and gaseous pollutant emissions, generated waste, natural monuments, levels of industrial wastewater, people using wastewater treatment plants and mixed waste collected in the context of environmental and environmental impacts, and ecology on the development process. These are the variables that build the endogenous economic base of the region. Their appropriate level contributes to raising the standard of living and a better social situation. The model fit is measured with the corrected R
2 (0.475630). Further increasing the multidimensionality of the model would result in a slight increase in value, and the model could contain statistically insignificant variables. The model could contain statistically insignificant variables. The F statistic is F (8, 3131) 356.9035 and is statistically significant (p) (
Table 6).
In the next step, the spatial measures of synthetic development as well as the natural environment and ecology were analyzed in terms of poviats in Poland. The calculated values of the global Moran’s I statistics are presented in
Table 7. Based on the data, it can be concluded that the values of the Moran global statistics for the studied area have significant and greater values than the expected value of this statistic, which indicates a positive spatial autocorrelation. Therefore, in the analyzed case, there is a tendency to concentrate units with a similar value of the measure of development in the neighborhood. The decrease in the value of the global statistics of Moran’s I between 2010 and 2019 informs about the ongoing process of weakening the spatial dependence, which applies to both studied areas.
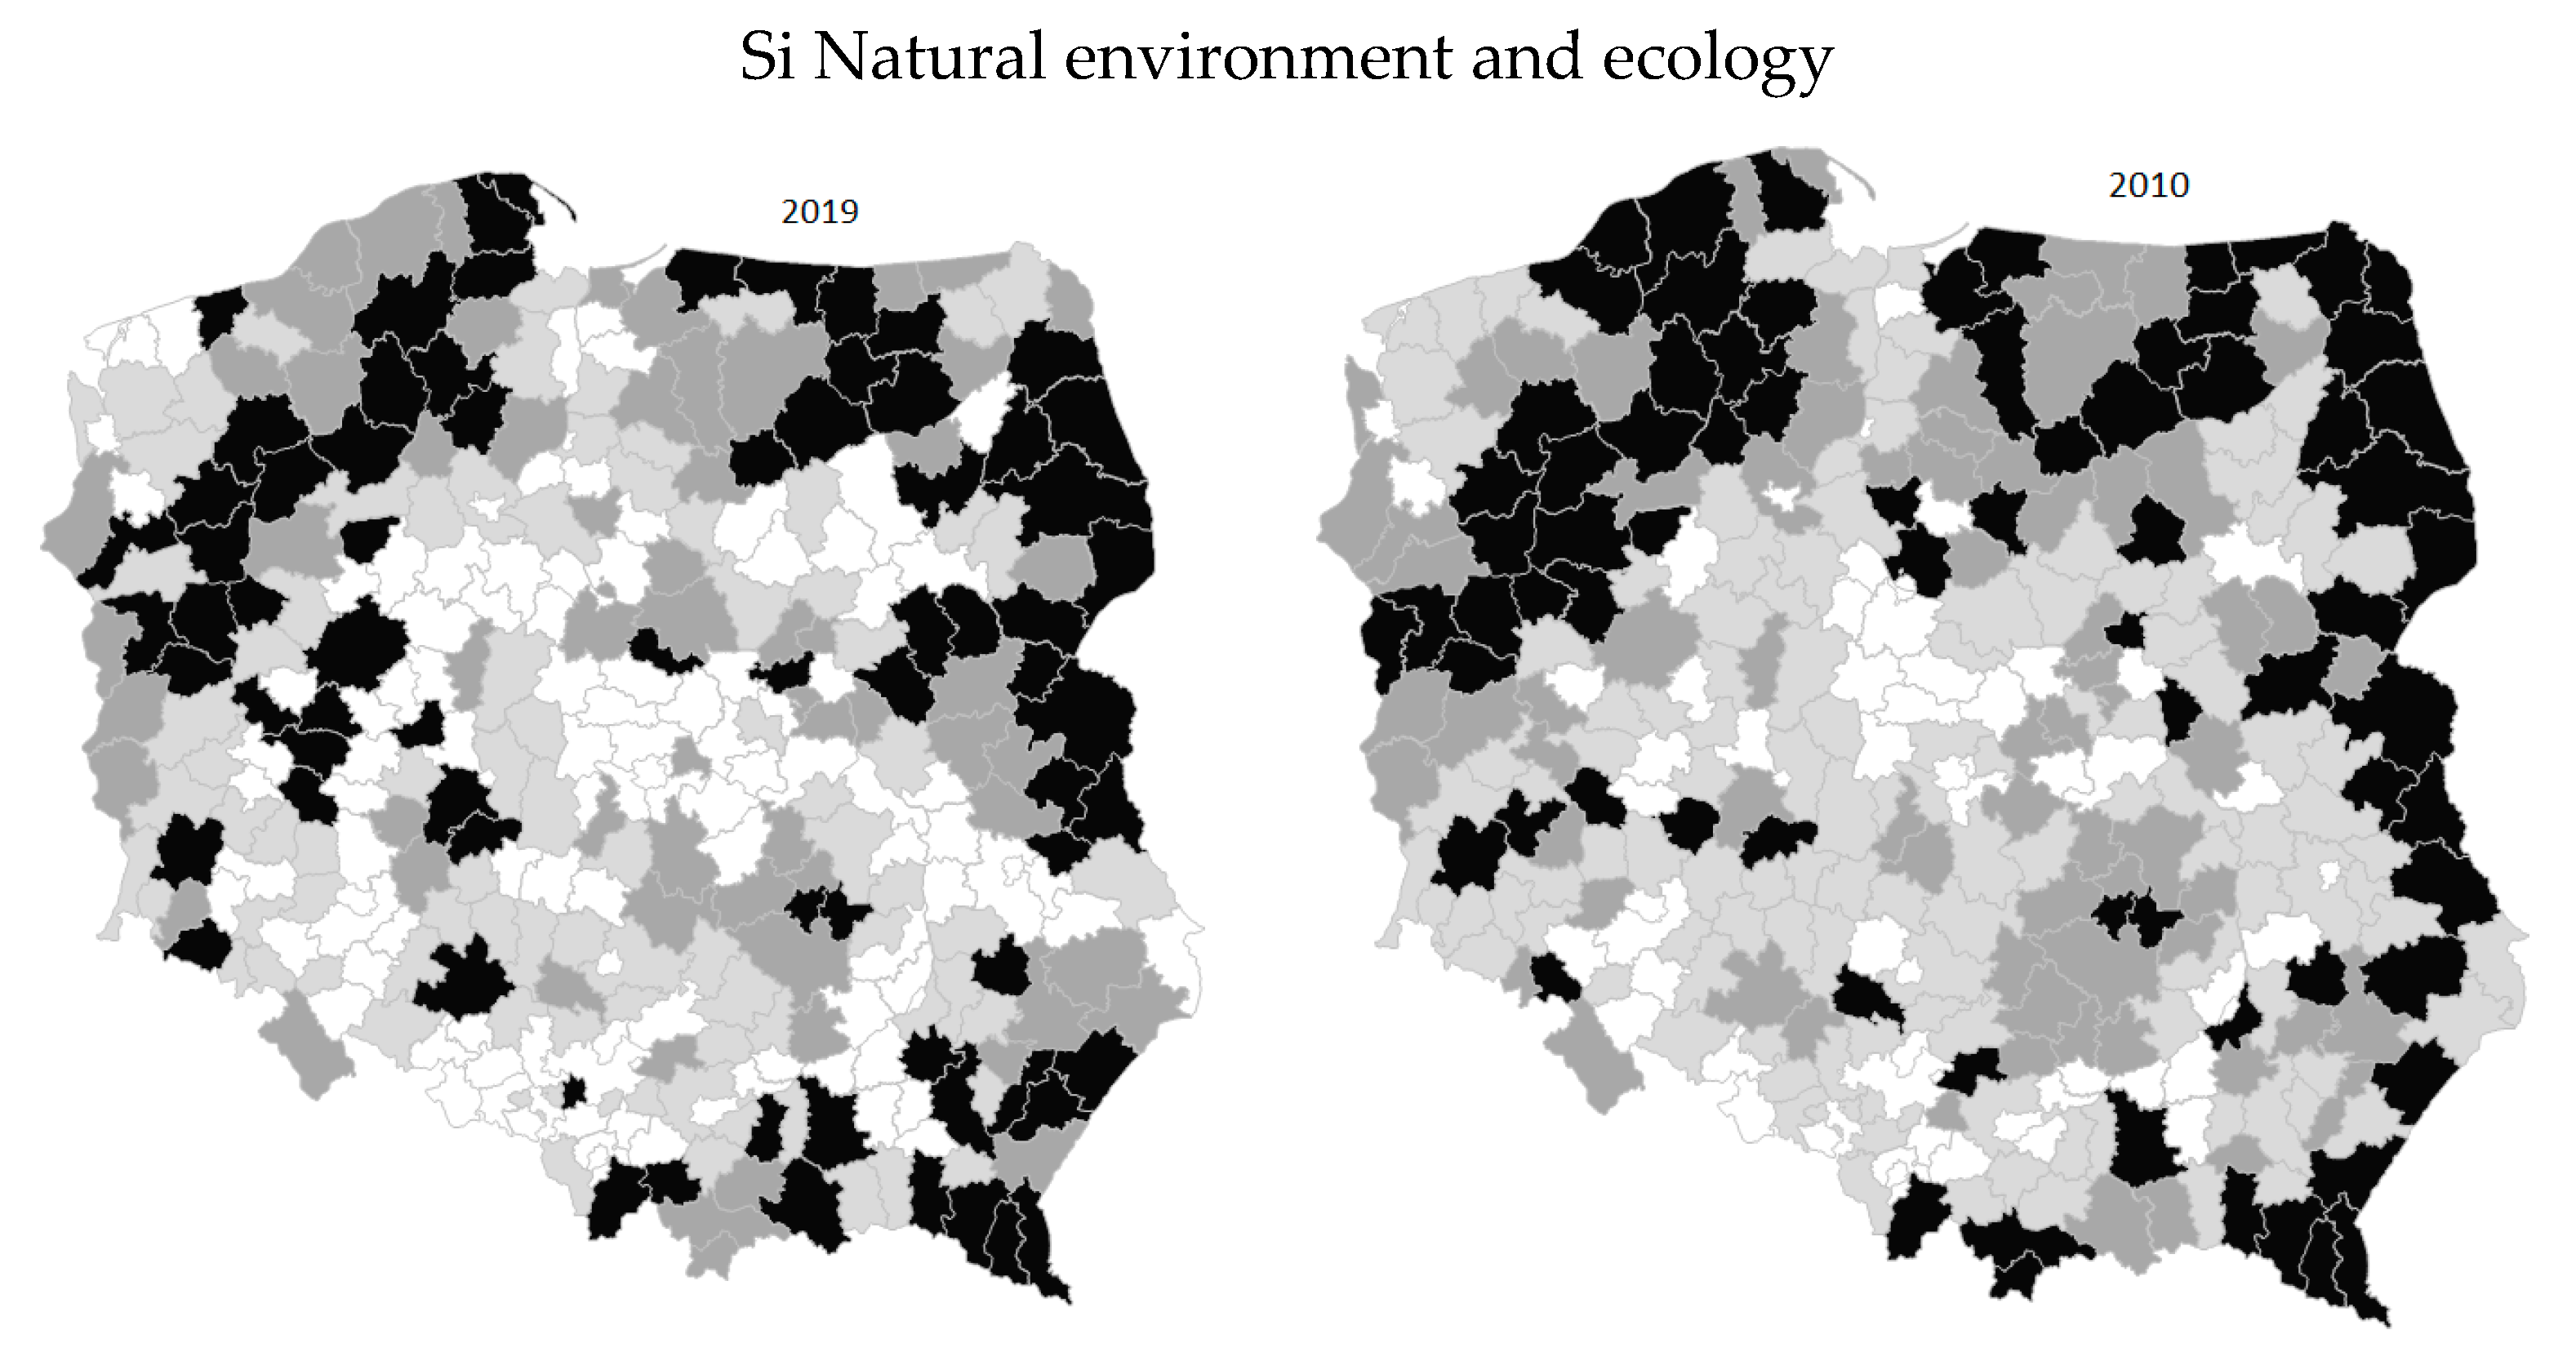
The local Moran’s I statistics for each poviat were successively determined. The obtained values of this statistic are shown in
Figure 5. In the years 2010–2019, the local Moran’s I statistics for poviats in Poland were significant and greater than zero, which means that these units are surrounded by regions with significantly similar values of the synthetic measure of development, natural environment, and ecology. Significant and high positive and negative values of the local Moran’s I statistics were obtained in the units of the central and western part of the country (with an industrial function, good labor market, and developed SME sector). The figure also shows that development is not related to a better situation in the area of the natural environment and ecology.
5. Discussion
Development is a multidimensional process of qualitative and quantitative changes, based on the rational use of endogenous resources, supported by exogenous resources. The key challenges of sustainable development concern the ability to meet all the basic needs of the community without having to overly interfere with the natural environment. Currently, the efforts of representatives of city authorities focus on ways to provide the society with a high quality of life using available technologies, infrastructure, natural environment resources, and others: the so-called endogenous factors. The decentralization of power, competences, and management means that the growing importance of local material and non-material resources in the development process can be discussed [
129]. Due to the geographic and natural conditions and the effect of socio-economic factors, individual regions of the country are characterized by a different economic situation [
130,
131,
132,
133].
The multidimensionality of the development process is evidenced by the directions in which poviats operate as a system of interdependent and interconnected economic, social, infrastructural, and natural factors (see
Table 2). The authors of the article focus on the assessment of the relationship between the potential of the natural environment and the sustainable development of poviats (for the years 2010–2019). These activities focus on the process of sustainable development, increases in the income of residents and the budget, or the development of entrepreneurship, and building social, economic and territorial cohesion.
A characteristic feature of contemporary development is a clear diversification of the economic potential of individual counties. Despite various forms of regional policy in Poland, it is still not possible to compensate for the disproportions that primarily divide the country into the more economically developed western part of the country and the less economically developed eastern part (see
Figure 2). It should be emphasized, however, that the observed differences over the analyzed years show a gradual downward trend, which favors the strengthening of economic cohesion in the horizontal dimension.
The spatial socio-economic differentiation of regions results in different conditions for running a business as well as a different level and living conditions of the inhabitants [
14]. In the case of the synthetic measure of development, we see a great similarity according to the measure of concentration (black color means a high value of the indicator; a lighter color indicates a decreased value) of the development process in the case of poviats in eastern Poland and greater differentiation of the process in the rest of Poland. In the case of the measure of the natural environment, we can see greater differentiation between poviats (
Figure 6). The phenomenon of concentration is regional in nature; thus, it is mainly at this level that measures should be taken to limit negative phenomena for a given area or community.
Diversification of development is the basic problem of the modern economy. If it is excessive, it can lead to many unfavorable phenomena, both of an economic nature, such as the sub-optimal use of resources, and non-economic, such as increased crime, social degradation, environmental devastation, and the problem of migration. The level of economic development of poviats is largely determined by the sectoral structure of economic activity. Another important factor for the poviat’s situation is the fact that a dominant entity operates in its territory, around which business activity may concentrate. This provides support for increasing real incomes, education levels, improving the health of the population and quality of life [
134,
135]. Sustainable development integrates the economic, social, and environmental dimensions of human activity [
136,
137].
Miłek D. diagnosed and assessed the diversity of socio-economic development of counties in the Świętokrzyskie Province and indicated groups of counties with a similar level of development. Indicators characterizing socio-economic development were used in the study (in terms of the demographic situation, labor market, social potential, economic structure, technical infrastructure, as well as the condition and protection of the natural environment, the authors of the article adopted similar areas of variables in the analysis). The Hellwig method was used for the synthetic assessment of socio-economic development. The conducted analysis enabled the identification of poviats with the highest, high, low and very low level of development [
138].
Łuczak A. analyzed land poviats of the Greater Poland Voivodeship in 2005 and 2013. The Hellwig’s method in the quantifiable SWOT method was used to assess the development position. Four main types of development items have been distinguished. The aggressive developmental type appeared in thirteen poviats. A type of competitive development position was present in Konin County, whereas a form of conservative development was poorly marked in five counties distant from urban centers. In nine poviats located in the eastern part of the voivodeship, the type of defensive development position was revealed [
139].
T. Siudek, K. Drabarczyk, and A. Jakubiec analyzed the level of economic development of poviats in the Mazowieckie Voivodeship in 2005 and 2014. They used the Hellwig development measure. The obtained data show that the most developed poviats were cities with poviat rights, and the least developed poviats were land poviats located in the southern part of the Mazowieckie Voivodeship [
140].
K. Kozłowska evaluated the level of regional development in terms of sustainable development. The analysis indicated that disproportions between regions depend, inter alia, on whether a given area belongs to areas with specific natural, social and economic functions. Specialization of the area has an impact on the direction and pace of development of individual spheres of the sustainable order. Research shows that regions with large urban clusters achieve much higher economic and social indicators, and lower environmental indicators. On the other hand, poviats of an agricultural or tourist nature are much better at coping with environmental problems. For this reason, activities for the development of the region and reducing disproportions must take into account its character (which is also indicated by the research presented in the study) [
141].
M. Spychała analyzed the level of socio-economic development of counties in Poland on the basis of indicators included in the regional development factors: material human capital, financial capital, human capital, and innovation. The author points out that the socio-economic development of poviats in Poland is highly diversified, and its highest level is recorded in the largest cities that are also the capitals of voivodeships: Warsaw, Kraków, Wrocław, Poznań, Gdańsk, and Katowice [
142].
A. Malina presents the results of empirical research on the differentiation in the level of development of counties in the Małopolskie Voivodeship in the years 2000–2004. The conducted research allowed the author to assess the spatial differentiation of counties in the Małopolskie Voivodeship in terms of living standards and infrastructure development in the analyzed period (2000–2004) [
143].
The issue of development and its polarization at the level of individual poviats and the country is extremely important. The research presented in the article may constitute the basis for taking actions aimed at reducing the development disproportions of poviats located in different voivodeships. Administrative activities aimed at eliminating disproportions between regions are also important. Development is more dynamic in more developed areas. At the same time, this situation contributes to the further marginalization of problem areas. Based on empirical research, the authors present the problem of barriers to local sustainable development (taking into account the functional division of the economic, social and environmental spheres, as well as spatial) from the Polish poviat perspective. The indicated results can support local entrepreneurship in terms of changing their overall business strategy by not only incorporating sustainable development into their core values and activities. The obtained results may constitute an important source of information for local government authorities on the disproportions existing between units, for determining the potential directions of optimization of the structure of the implemented policy.
Local authorities should first of all take care to improve the economic potential, which will increase the attractiveness of the area and attract new entrepreneurs, create new jobs and improve the quality of life of the inhabitants, bearing in mind the importance of the natural environment. Actions taken at the local level should support development initiatives focused on the areas of sustainable development, promoting pro-environmental attitudes, building or improving the quality of the existing infrastructure, improving the condition of the natural environment, and skillful use of the values and conditions found in the district. Strong dependence of powiats’ budgets on transfer revenues from the state budget and the amount of current expenses stabilizes the economy, making it relatively insensitive to the influence of other factors, which has an impact on the quality of the local policy.
6. Conclusions
The assessment of spatial differentiation on the level of development of the studied counties indicates the existence of a low impact of natural conditions on the process of social and economic development. As evidenced by the evaluation on the synthetic measure of development, it can be concluded that the poviats in Poland was characterized by diversification. The disproportion between the most and the least developed poviats deepened. The synthetic measure of development ranged from 0.13 to 0.46 in 2010 and from 0.18 to 0.59 in 2019. Actions taken in the aspect of development should focus on achieving social, economic, and spatial cohesion. It is also becoming important to indicate the poviat’s development profile, which should become their significant asset. The barrier to socio-economic development in the poviats in Poland was the condition of the local economy and the quality of life of the residents, or the amounts transferred from the state budget (which made budgets more rigid and stabilized). Favorable development conditions are provided by the vicinity of an economically developed city (as a local development center).
Natural resources are a specific economic category. They are a barrier and also an important determinant of socio-economic development. The overexploitation of resources and environmental degradation reduce national wealth. In 2010, the synthetic measure, natural environment, and ecology ranged from 0.05 to 0.33, and in 2019, ranged from 0.07 to 0.30. The data show a greater spatial disproportion in the diversity of units in the area of natural environment and ecology than in terms of development. It is influenced by the geographical location, the function performed (i.e., agricultural, industrial, or tourist), and the local economic potential, the standard of living, better social situation, and greater public safety. The poviats’ main problem is the scarcity of endogenous factors, which is a barrier to the independent initiation of development.
The obtained results of the analyses indicate a positive correlation between the measure of poviat development and the measure of their natural environment and ecology. A higher level of development (in the case of poviats in Poland) is related to a lower measure of the natural environment. Local authorities should take care to improve the economic potential, prevent the leaching of local capital, improving attractiveness, to attract new entrepreneurs, and improve the quality of life of the inhabitants, bearing in mind the importance of the natural environment.
This article presents the methodology of a synthetic measure of development and the natural environment in the case of poviats in Poland. The greatest advantage of the proposed calculation method is its flexibility, because it can be applied to any assessment period of the indicated areas, with the possibility of selecting the desired number of aspects of sustainable development or the natural environment that best reflect the evolution of the region. The obtained results confirmed the usefulness of synthetic measures for the assessment of complex phenomena (e.g., development, financial situation, assessment of the environment and ecology, infrastructure, entrepreneurship, economic security). The results of completed research may constitute an important source of information for local government authorities on the disproportions between units, about potential directions of optimization of the local finance structure or local politics. The indicated procedure may be applied in other regions (countries). Comparisons between countries should include the same variables in the indicated research areas.
New research directions may include comparing the results of ordering on the basis of a larger number of variables, or with another method (e.g., cluster analysis), conducting dynamic analysis. The results indicate the need to analyze outliers and determine their impact on the situation of the studied area. The added value of the article is in the research results focused on the assessment of the relationship between the potential of the natural environment and ecology and the development of poviats (for the years 2010–2019).


