Article

A Vision for Energy Decarbonization: Planning Sustainable Tertiary Sites as Net-Zero Energy Systems

1
Department of Energy Systems and Infrastructures, Fraunhofer Institute for Factory Operation and Automation IFF, 39106 Magdeburg, Germany
2
Department of Engineering and Industrial Design, Magdeburg-Stendal University of Applied Sciences, 39114 Magdeburg, Germany
3
Department of Agro-Environmental and Territorial Sciences, University of Bari Aldo Moro, 70121 Bari, Italy
*
Author to whom correspondence should be addressed.
Energies 2021, 14(17), 5577; https://doi.org/10.3390/en14175577
Submission received: 28 July 2021 / Revised: 26 August 2021 / Accepted: 2 September 2021 / Published: 6 September 2021
(This article belongs to the Special Issue Alternative Energy Policy)

Abstract

:
The power system is changing towards a decarbonized one. The Kyoto protocol and the Paris climate agreement have prompted many nations to approve energy policies based on volatile renewable energy sources (RESs). However, the integration into the grid of the power generated by RESs as well as the electrification of the heating, gas and transportation sectors is becoming a huge challenge. Planning industrial and tertiary sites as net-zero energy systems (NZESs) might contribute to advance the solutions of fully integrating volatile RESs into the power system. This study aims to point out the importance of planning large energy consumer sites such as NZESs, and to depict a holistic modeling approach for this. The methodology is based on a multi-layer approach, which focuses on on-site power generation by RESs, on the improvement of energy efficiency, and on the increase of system flexibility. A qualitative case study has been conducted. It considers the planning of a Net-Zero Energy Data Center located in Germany. Results point out that new interdisciplinary and in particular social analysis methods are necessary. They might be used for accelerating the decision making process during the planning of RES-based on-site power generation systems. Besides, for computation and cooling systems, new technologies that are continuously emerging in the market should be taken into account. If well designed, they contribute to significantly decrease the whole energy demand of data center. Finally, optimal sizing of energy storage systems (electric and thermal) as well as an expedient choice of performance indicators to evaluate technology options are identified as the key factor for decreasing the external energy demand of tertiary sites, such as data center.

1. Introduction

A rapid change in the increased ecological awareness in value chain sectors has been revealed in recent years. Many companies now have better ecological production and follow a carbon-neutral supply chain to increase their responsibility for a sustainable world balance. Carbon dioxide taxes and the European Emissions Trading System foster positive developments. The ecological awareness is also driven by the political decisions aiming to increase the amount of power generated from renewable energy sources (RESs) and; therefore, to decarbonize not only the electric but also the gas, transportation, and heat energy systems. However, this process foresees that electricity will be mostly generated through volatile energy sources, such as wind and sun. Such volatility causes huge problems for the system operators, which have to activate expensive solutions to compensate for the variable power generation of wind farms or photovoltaic plants. As a non-marginal consequence, the costs supported by the system operators are shared mostly among the small consumers. Among the European states, the German residential consumers pay the highest electricity price (see Figure 1). However, the electricity generation costs cover only 30% of the final electricity price. The rest is mostly due to the grid fee (which covers the costs kept up by the system operators), the fee to support the Renewable Energy Act, and taxes. Increasing the electric power generation by RESs will entail an increase of the costs for the grid fee. In such a scenario, the full decarbonization of the energy systems (electricity, transportation, gas, and heat) might create huge costs for the small consumers [1] and can affect the acceptance of installing new RES-based power plants.
Different solutions have been investigated regarding accelerating the decarbonization process. Among them, stronger interconnections between regional power grids have been identified as one of the solutions to be adopted [3,4]. The contribution that the development of microgrids and virtual power plant systems provide has also been analyzed. Such a solution, if planned as a self-sufficient system, offers high advantages in terms of volatile RES integration [5,6,7]. In addition, the use of energy storage systems (ESSs) has also been investigated intensively as a potential solution for storing the RES-based energy generated during off-peak times [8,9]. Regarding the German power system, full decarbonization might require an enormous energy storage capacity of about 43 TWh if only this solution is applied [10]. Such a huge amount is 1139 times higher than the total installed energy storage capacity in Germany right now. A combination of more solutions might depict the right way for the decarbonization process. Net-zero energy systems (NZESs) integrate different kinds of flexibility, which are necessary to compensate for the volatility of the generation from RESs. However, little research has been dedicated to the NZESs as a holistic solution for efficient decarbonization. Different NZES concepts have been developed and investigated. The technical and economic constraints of different energy services, which might serve for net-zero emissions energy systems have been presented in [11]. On a smaller scale, the concept of net-zero energy buildings has been analyzed [12]. The technologies, construction design, and their operation have been presented in [13,14]. The research has generally focused on small residential systems [15,16,17] and to a lesser extent on industrial systems [18,19,20,21]. However, large industrial operators have begun to take an interest in NZESs. The companies Tesla and Mitsubishi are planning their new manufacturing sites as net-zero energy factories [22,23].
The article analyzes the concept of NZESs in the tertiary sector, which is characterized by primarily offering services to the customers. Different from the industrial sector manufacturing processes are not linked with the supplied services. In more detail, the analysis has been performed for a data center whose digital services are becoming more and more essential in our society. The impact of different energy storage technologies to operate a data center as a NZES has already been analyzed in [24]. Different NZES concepts for data centers have been suggested, integrating both electric and thermal RES-based power generation [25,26]. However, to the best of the authors’ knowledge, most research has considered a different concept of NZES. It has focused either on planning and sizing the energy generation plants (electric and thermal) or on sizing the flexibility options necessary for integrating the volatile power generated by RESs. All approaches prioritize the option of feeding back into the electric grid, if the electric power generated is higher than the electricity demand. There are a few studies that advance the planning of NZESs from the power generation site to the flexibility options through the active control of the loads. Therefore, this study aims to contribute to developing a holistic planning methodology that focuses on the generation from RESs, the flexibility of consumption, and new flexibility options necessary to operate NZESs in a secure, sustainable and economic way. In the NZES concept examined, the electricity supply from the grid is only considered in the case of failure of the on-site generation or for exceptional circumstances. The suggested methodology will be presented using mainly qualitative values. Quantities are included for exemplary technologies and to clarify the methodic approach. This choice is mostly due to the restriction against publishing the data analyzed gained through practical implementation in the proposed case study. However, the methodology will be not affected by this restriction since it points to depicting a general approach and not to analyzing a specific system. This study is structured as follows: Section two covers the aspects related to the methodology developed. Section three depicts the analysis of the study case to which the methodology has been applied. The main conclusions are given in section four.

2. Holistic Planning Methodology for NZESs in Industrial and Tertiary Sectors

2.1. General Aspects

The suggested NZES is identified by how it is operated. The operation of the former implies that energy (mostly in an electric form) has to be generated on-site, supply the loads, can be converted into other forms (i.e., from electric power to heat or from electric power to gas) and can be stored in ESSs. One of the main characteristics of the NZES is that all the components (energy generators, energy converters, and ESS) should be selected and sized in a way that the energy generated covers the loads and is not fed into the grid. In this option, the NZES concept enables the operator to optimally integrate the volatility of generated power by RESs without straining the external electricity grid. Equation (1) depicts the NZES suggested concept mathematically. Egrid represents the power exchanged with the external grid, Egen outlines the power generated by RESs, Econv illustrates the electric power converted into another form and Eload delineates the energy demand.
E grid = E gen E conv E load 0
From the technical point of view, the security of supply is the most important aspect. Therefore, all the NZES concepts have to consider either being connected to the grid and/or seize large backup systems, such as internal combustion engines and/or ESSs, allowing the NZES to be operated as an isolated system. In addition to the security of supply, the reduction of peak loads, increase of the energy efficiency, and exploitation of renewable sources for producing electricity, heat, and cold are other significant technical criteria. Indeed, optimal load control to avoid high peak times enables planner not to oversize components (i.e., power generators or ESSs) and; therefore, optimize the investment costs. Hence, all the loads must be monitored and controlled within a NZES. The monitoring should be done using an appropriate data acquisition system, able to store and access data to perform necessary optimization processes. Standardized protocols, such as MODBUS TCP [27] or OCP-UA, are widely used [28,29] for the communication between dedicated measurement devices and the data acquisition platform. EnOcean [30,31], for special applications lacking a dedicated supply, is also used for building automation-specific applications and only a small amount of data is used.
Demand-side management (DSM) programs can be considered as control strategies for the loads. Figure 2 shows different DSM programs for smart grid systems allowing the control of the load efficiently and flexibly. DSM programs, such as peak clipping, load shifting, and flexible load shapes are supporting new flexibility options (i.e., through ESSs) to meet the requirements for future markets [32,33]. Besides these, valley filling is suitable for processes operated in the evening and night hours. In manufacturing processes, strategic load growth and strategic conservation are highly depending on the capacity of material storages and buffers.
Related to the increase in the energy efficiency and; therefore, to the ecological aspects, the planning of NZESs has to focus on new technologies requiring less primary energy (fuel, sun radiation, geothermal heat) to produce the same amount of energy output (electricity, mechanical, heat or cold). Even if there is no clear definition, a short-term planning horizon is generally understood as a planning action, which will be put in place within one or two years. A long-term planning horizon generally considers the possibility of upgrading a system in a time horizon ranging between eight and ten years. In this context, it is important to choose technologies with a technology readiness level (TRL) at least equal to 8 for short-term planning actions. Table 1 explains the state of technology development for different readiness levels. It is important for long-term planning, to consider the prospective industrial maturity of prototypical technologies and; therefore, also emerging technologies which might affect the whole energy efficiency of the NZES. Figure 3 points out some of the most promising disruptive technologies for energy generation, storage, architectures and systems. According to [35,36,37,38,39,40], the Perovskite-based solar cells, multi-rotor wind turbines, and geothermal-based technologies have the highest disruptive effect among the RES technologies. New lithium-based batteries, as well as hydrogen and liquid batteries, might dominate the market solutions for energy storage applications. Microgrids, virtual power plants, and net-zero energy systems can be chosen as architecture to plan the industrial and tertiary sites. It is a good practice to choose technologies, which have already been tested in pilot projects. In addition, another important factor to think about when selecting the technologies necessary is their “ready-to-use” parameters. The latter indicates the time horizon during which the technology chosen will affect the system.
Another important aspect to be considered when selecting the technologies is their “cradle-to-grave” parameter, which analyses the life cycle of a construction product using ecological key indicators, such as the resources used, the upstream and downstream products, and the emissions to air, land, and water (see Figure 4).
From the economic point of view, the choice of the technologies and the actions necessary to upgrade a NZES have to consider both the investment and operation costs. Different economic indicators must be taken into consideration to make the right decision. The return on investment, levelized energy unit costs, and payback time are normally analyzed for each technology and used as comparison “means.” Finally, the regulatory conditions have to be contemplated. They can limit or promote a choice of one technology instead of another. Regarding the generation of energy, the economic incentives they might receive, the incentive for self-consuming, and the possibility of not paying a fee to support the RES-based generation should be considered.

2.2. Requirements Analysis

The main pillar on which the planning of a NZES has to build is the use of the data available and the degree of detail. The data might be sorted into four categories: Technical, social, spatial development, and strategical (see Table 2). The energy and resources demands allow one to estimate the technical potential of supplying loads of a system so that it is operated as a NZES. The energy provision and purchasing mechanisms are crucial for the economic analysis and; therefore, to point out additional conditions which need to be considered in the planning phase. The data relating to the energy and resource infrastructures permit one to estimate the degree of efficiency of the system, identify the losses and; therefore, plan the related actions for reducing the consumption. The building and zone data enable one to have a detailed energy analysis of smaller infrastructures and to specify the necessary planning actions better. The data relating to the system engineering, process and operation, and redundancy and dependency permit one to perform detailed energy analysis and evaluate the dependency between plants and infrastructures. Regarding the social category, the data relating to the people working on the site allow one to estimate the appropriateness of an identified solution and to point out its limitations. The data relating to spatial development are necessary to estimate the visual impact of installing new infrastructures (i.e., small wind turbines on the roof). In this case, the virtual reality technic might support the decision-makers and speed up the decisional process [44]. Finally, the enterprise’s internal strategy might prescribe particular conditions, which could limit or accelerate the planning process.

2.3. Determination of the Sustainable Development Path

The energy generation, its transformation from one form to another, the efficiency with which it is consumed, and how it might be stored are the aspects that the decision-makers have to consider in the planning phase. It might be useful to draw up a portfolio of technologies, which could be considered. It should screen the technologies highlighting the classes in which they might be used (see an example in Table 3).
However, to perform decisions it is important to use parameters able to compare the technologies with each other. The parameters have to depict technological, economic, system integration, and operational and organizational criteria. Table 4 show examples of lists of parameters for planning industrial and tertiary NZESs.
The application of the defined parameters not only allows for the comparison of the technologies but also for constraining the choice of technologies. Therefore, a sustainable development path can be determined. Within the concept of NZESs, the sustainable development path contains a combination of three sub-paths:
  • Increasing power generation from RESs;
  • Boosting energy efficiency; and
  • Integration actions.
When it comes to decarbonized power generation, three aspects have to be considered:
  • The power and energy which have to be covered in a defined time-horizon (it is generally yearly based);
  • The weather conditions of the site and/or the availability to use energy coming from a site area nearby (e.g., a farm making biogas available); or
  • The potential of space development on-site and/or areas near the site (e.g., the possibility of installing wind turbines on the nearest area of the site).
Boosting energy efficiency mostly focusses on energy recovery, on the reutilization of waste (e.g., heat) and on using more efficient technologies compared to the status quo (e.g., heat pumps if heat is required at low enthalpy [45]).
The integration actions contemplate all the measures which do not directly impact the energy generation or the improvement of the carbon footprint. But these actions impact to the better integration of other technologies into the system, therefore take account of volatile generation characteristics of RESs. ESSs, for example, stationary or mobile (e.g., electric cars), belong to typical integration.

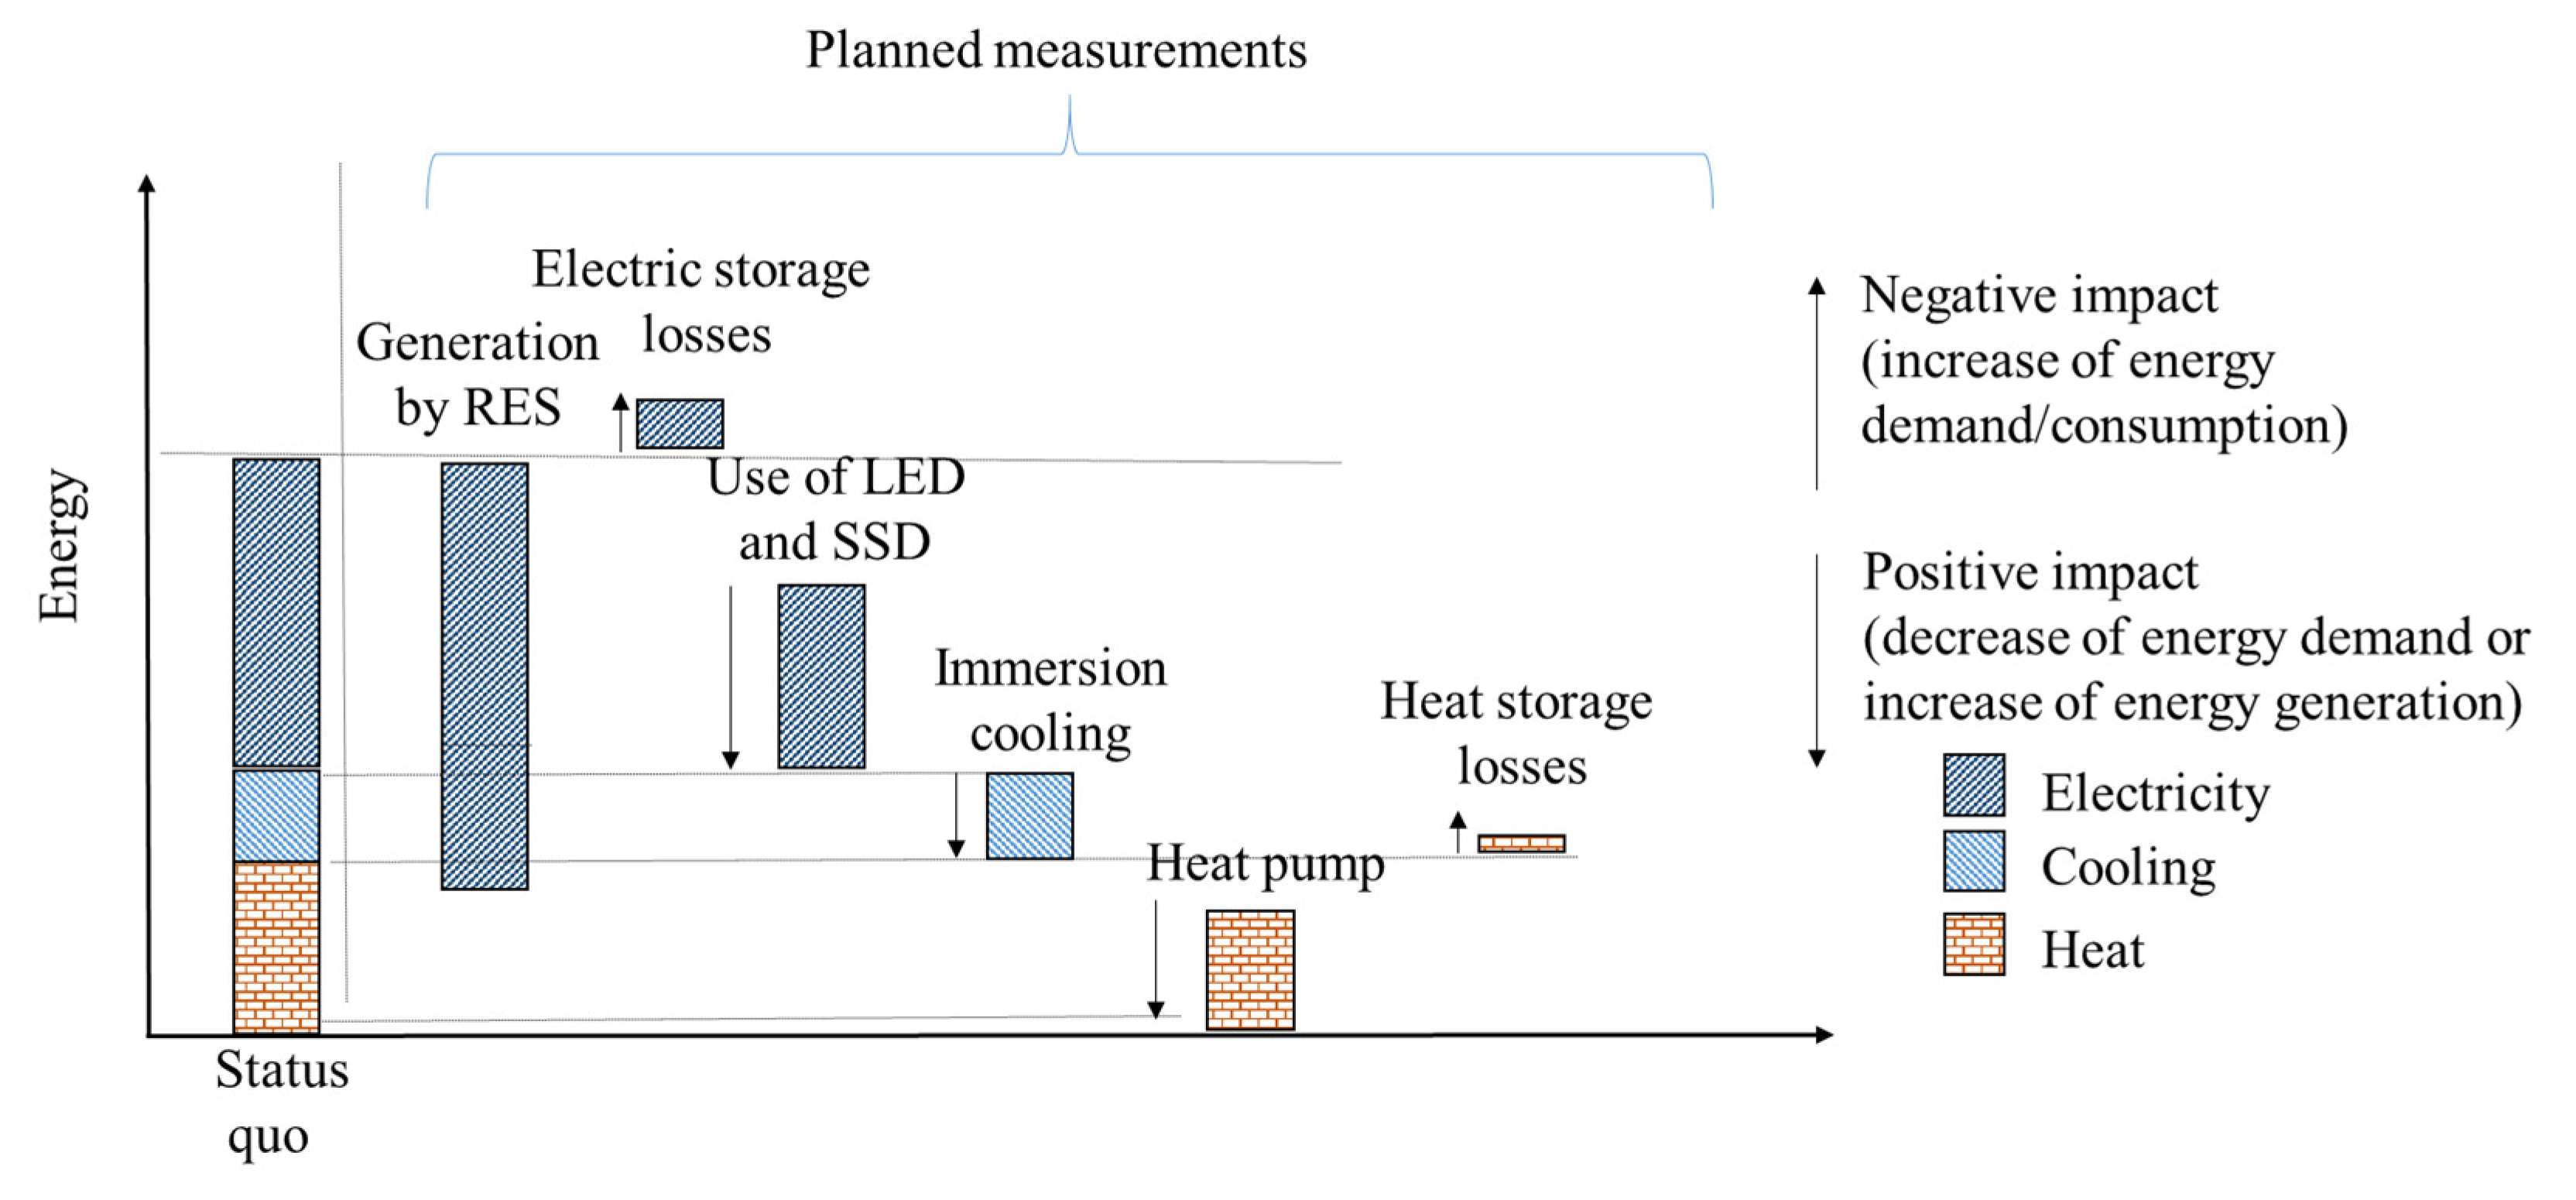
3. Planning Actions for NZESs in a German Data Center

An existing German data center has been considered as a study case. The aim is to develop planning actions aiming to operate the data center as a NZES. The analysis will partially depict normalized values due to the restriction regarding the publishing of measured data. The system consumes electricity to cover the electric and thermal loads with a power usage effectiveness of 1.3. The heating and cooling processes are supplied using electric-driven heat pumps and cooling systems. The heating, cooling, light, and process data were analyzed vis-à-vis, whose energetic results are depicted in Figure 5. Electric power is mostly used to supply the demand for data processing (72%). The thermal demand (heating and cooling) requires 13.7% and 11.2%, respectively. Ventilation, light, and other loads demand 3.1% of the total electricity consumption.
Wind turbines and photovoltaic plants have been considered as the electric power generation technology because of a space development analysis and taking into account the local weather conditions. Since there are no plants able to supply biogas nearby, this option has been not contemplated.
The space development analysis assesses the visual and spatial planning effects parallel in one planning model. This approach uses photorealistic three-dimensional models and tools based on virtual reality aiming to improve interdisciplinary project communication, strengthen the acceptance of development projects in the population and reduce the risk of unintended effects. Figure 6 shows a virtual reality-based representation of the data center analyzed and the visual impact that photovoltaic panels and a wind farm might have on the tertiary site. Such analysis allows for accelerating the process of social acceptance of the residential users living near the considered site (see houses located on the center-right part of the picture).
The improvement of the energetic efficiency is the second layer on which the methodology is based on. It entails an analysis of the performance of the technologies used for the heating, cooling, light, and process data. Heat pumps, using an immersion cooling system instead of water-to-air-reversible heat pumps, and the replacement with LED and SSD systems can increase energy efficiency compared to the status quo of the data center. Compared with air-cooled systems, immersion cooling systems allow one to save cooling energy in the range of 22% to 53% [46,47]. In the analyzed study case an improvement of energy efficiency of 41% could be identified. Regarding the energy saving for lighting, the LED systems are 5% to 20% more efficient compared with compact fluorescent light systems [48]. A saving potential of 10% has been assumed for calculating the effect of LED on the electricity consumption of the whole system. The saving potential from using solid-state drives instead of hard-disk drivers depends mostly on how the servers are operated and the type of data they operate with [49]. Energy-saving potential of about 90% has been considered by analyzing the workloads of the data center.
It is necessary to install ESSs to compensate for the volatility of power generated by RESs. The use of the electric ESSs and the heat storage system contributes to the increase in energy demand. The losses of the ESSs within each cycle (charging and discharging) can be estimated with values between 20% and 30% of the stored energy [50]. The estimation of the energy losses of the thermal systems is more complex as they depend on how the technology and the storing material are used and on the temperature difference between the energy storage medium and the ambient temperature where the ESS is located [51,52]. In this model, a 15% loss has been taken into consideration.
Once the technologies have been identified, next step is to estimate the indicators able to perform technical and economic analyses. Table 5 shows the energy indicators for the planning measurements. The listed values are related to the technology and to the weather conditions of the data center site. The negative sign in the accountable energy balance indicates the amount of energy that can be locally generated or can be saved if suggested technologies are installed.
Table 5 describes exemplary intermediate results covering the technical evaluation of selected measures to follow the decision process. By calculating their accountable energy balance power generation (i.e., wind turbine and mono-crystalline silicon) and energy efficiency measures (i.e., LED, immersion cooling, and SSDs) become comparable.
The economic indicators are depicted in Table 6, following a similar approach. Through the balancing of the yearly economic value technologies and measures with different mechanisms in terms of energetic contribution can be prioritized. They are evaluated according to the German market price in 2020 considering an electricity tariff of 150 €/MWh. The negative sign on the yearly economic balance depicts the amount of money saved for each kW installed.
The necessary flexibility options to compensate for the volatility generation of RESs focused on ESSs (electric and thermal) allow for the development of DSM controlling strategies. The identification and planning of the required flexibility options depict the third layer of the suggested methodology. The sizing and control of such flexibility options affect the maximal integration of RESs positively. However, their use also has a negative impact since it increases energy losses. The integration of RESs into the NZES requires that the flexibility options are properly sized. Since the NZES concept targets considered minimizing the power to be fed into the grid, Equation (1) can be considered as a starting point for sizing the ESS. The sizing has to consider both the power and the energy capacity of the ESS. By considering a long-term horizon, the power capacity is evaluated by finding the maximal value of Pgrid(t), while the energy capacity might be estimated by considering the highest area tracked above the positive y-axis, indicated by Est_max (see Figure 7). It is important to note that this approach does not guarantee that the sizes found are optimal, but it gives an indication of the sizes expected.
Li-ion, sodium-sulfur, and flow batteries might be chosen as electric energy storage technology. Li-ion and sodium-sulfur batteries might also be used as an uninterruptable power supply system [53], while flow batteries, even if less efficient, are suitable for storing large amounts of energy for a longer time [54]. On the other hand, a combination of latent and sensible ESSs might be adopted for the thermal ESS.
Figure 8 shows, from a qualitative point of view, the effect of the planned measurement on the operation of the system as net-zero energy. The status quo depicts the amount of energy consumed by the data center. It is divided into three energy forms: electricity, cooling, and heat. The on-site generation of electric power by RES might contribute to cover more than half of the total energy demand. On the energy efficiency layer, LED and SSDs as well as immersion cooling systems and more efficient heat pumps offer a relevant contribution to decrease the demanded energy. However, the needed flexibility to integrate the volatile RES negatively affect on the energy balance of the data center. Indeed, the use of energy storage systems (electric and thermal) increases the losses and; therefore, contribute to an increase of the energy demand.

4. Conclusions

The decarbonization of the energy system is one of the most challenging aims of European society. Integrating a high amount of volatile RES into the electric, gas and thermal grid requires new flexibilities. Large ESSs, stronger interconnectors, and microgrids will contribute to compensate for the volatility generated by RESs. However, large consumers in the industrial and tertiary sectors can offer a high contribution to the decarbonization process.
In this article, a new approach utilizing a NZES was formulated. The main goal is an energy system generating the energy demand locally by RESs without stressing the external electric grid. For this purpose, flexibility options must be locally planned and optimized. In this context, this study presents a holistic planning approach, that is based on three layers, namely energy generation, energy efficiency, and flexibility. The proposed methodology allows for the comparison and the prioritization of technologies and measures with different impacts and mechanisms in terms of their economic, ecologic and energetic effects. Therefore, it can be applied as a tool for evaluating technologies and measures between different allocations and to create benchmark systems.
An exemplary study case was qualitatively analyzed. It depicts the methodology to plan a net-zero energy data center and points out the contribution that different planning actions provide to increase the energy efficiency and the flexibility needed. Consequently, by selecting the appropriate technologies for energy generations (electric, heat, and cooling), by identifying the solutions allowing to increase the energy efficiency (i.e., immersion cooling and LED), and by properly sizing the energy storage systems (electric and thermal), the analyzed data center showed large potential to operate as a NZES. As such it contributes to increase the marketing image and add economic value to the related company. If correctly quantified, this might be the key for encouraging decision-makers to further invest in NZESs.

Author Contributions

Conceptualization, M.R., P.L., P.K. and A.P.; methodology, M.R.; software, B.A., A.H., A.N.; validation, M.R., P.L., P.K. and A.P.; formal analysis, M.R., A.N.; investigation, M.R. and P.L.; writing—original draft preparation, M.R.; writing—review and editing, M.R., P.L., A.P. and P.K.; visualization, A.H., P.L. and B.A.; supervision, P.K., A.N.; project administration, M.R. and P.K. All authors have read and agreed to the published version of the manuscript.

Funding

This research received no external funding.

Conflicts of Interest

The authors declare no conflict of interest.

Abbreviations

CHPCombined heat and power
COPCoefficient of performance
DCDirect current
DECDesiccant cooling
DSMDemand-side management
ESSEnergy storage system
EUEuropean Union
LEDLight-emitting diode
NZESNet-zero energy system
ORCOrganic Rankine cycle
PERCPassivated emitter and rear cell
PVPhotovoltaic
PVTPhotovoltaic and thermal
REACHRegistration, Evaluation, Authorization and Restriction of Chemicals
RESRenewable energy source
SSDSolid-state drive
TRLTechnology readiness level

References

  1. Finkelstein, J.; Frankel, D.; Noffsinger, J. Fully decarbinizing the power industry. McKinsey Q 2020, 2, 106–110. [Google Scholar]
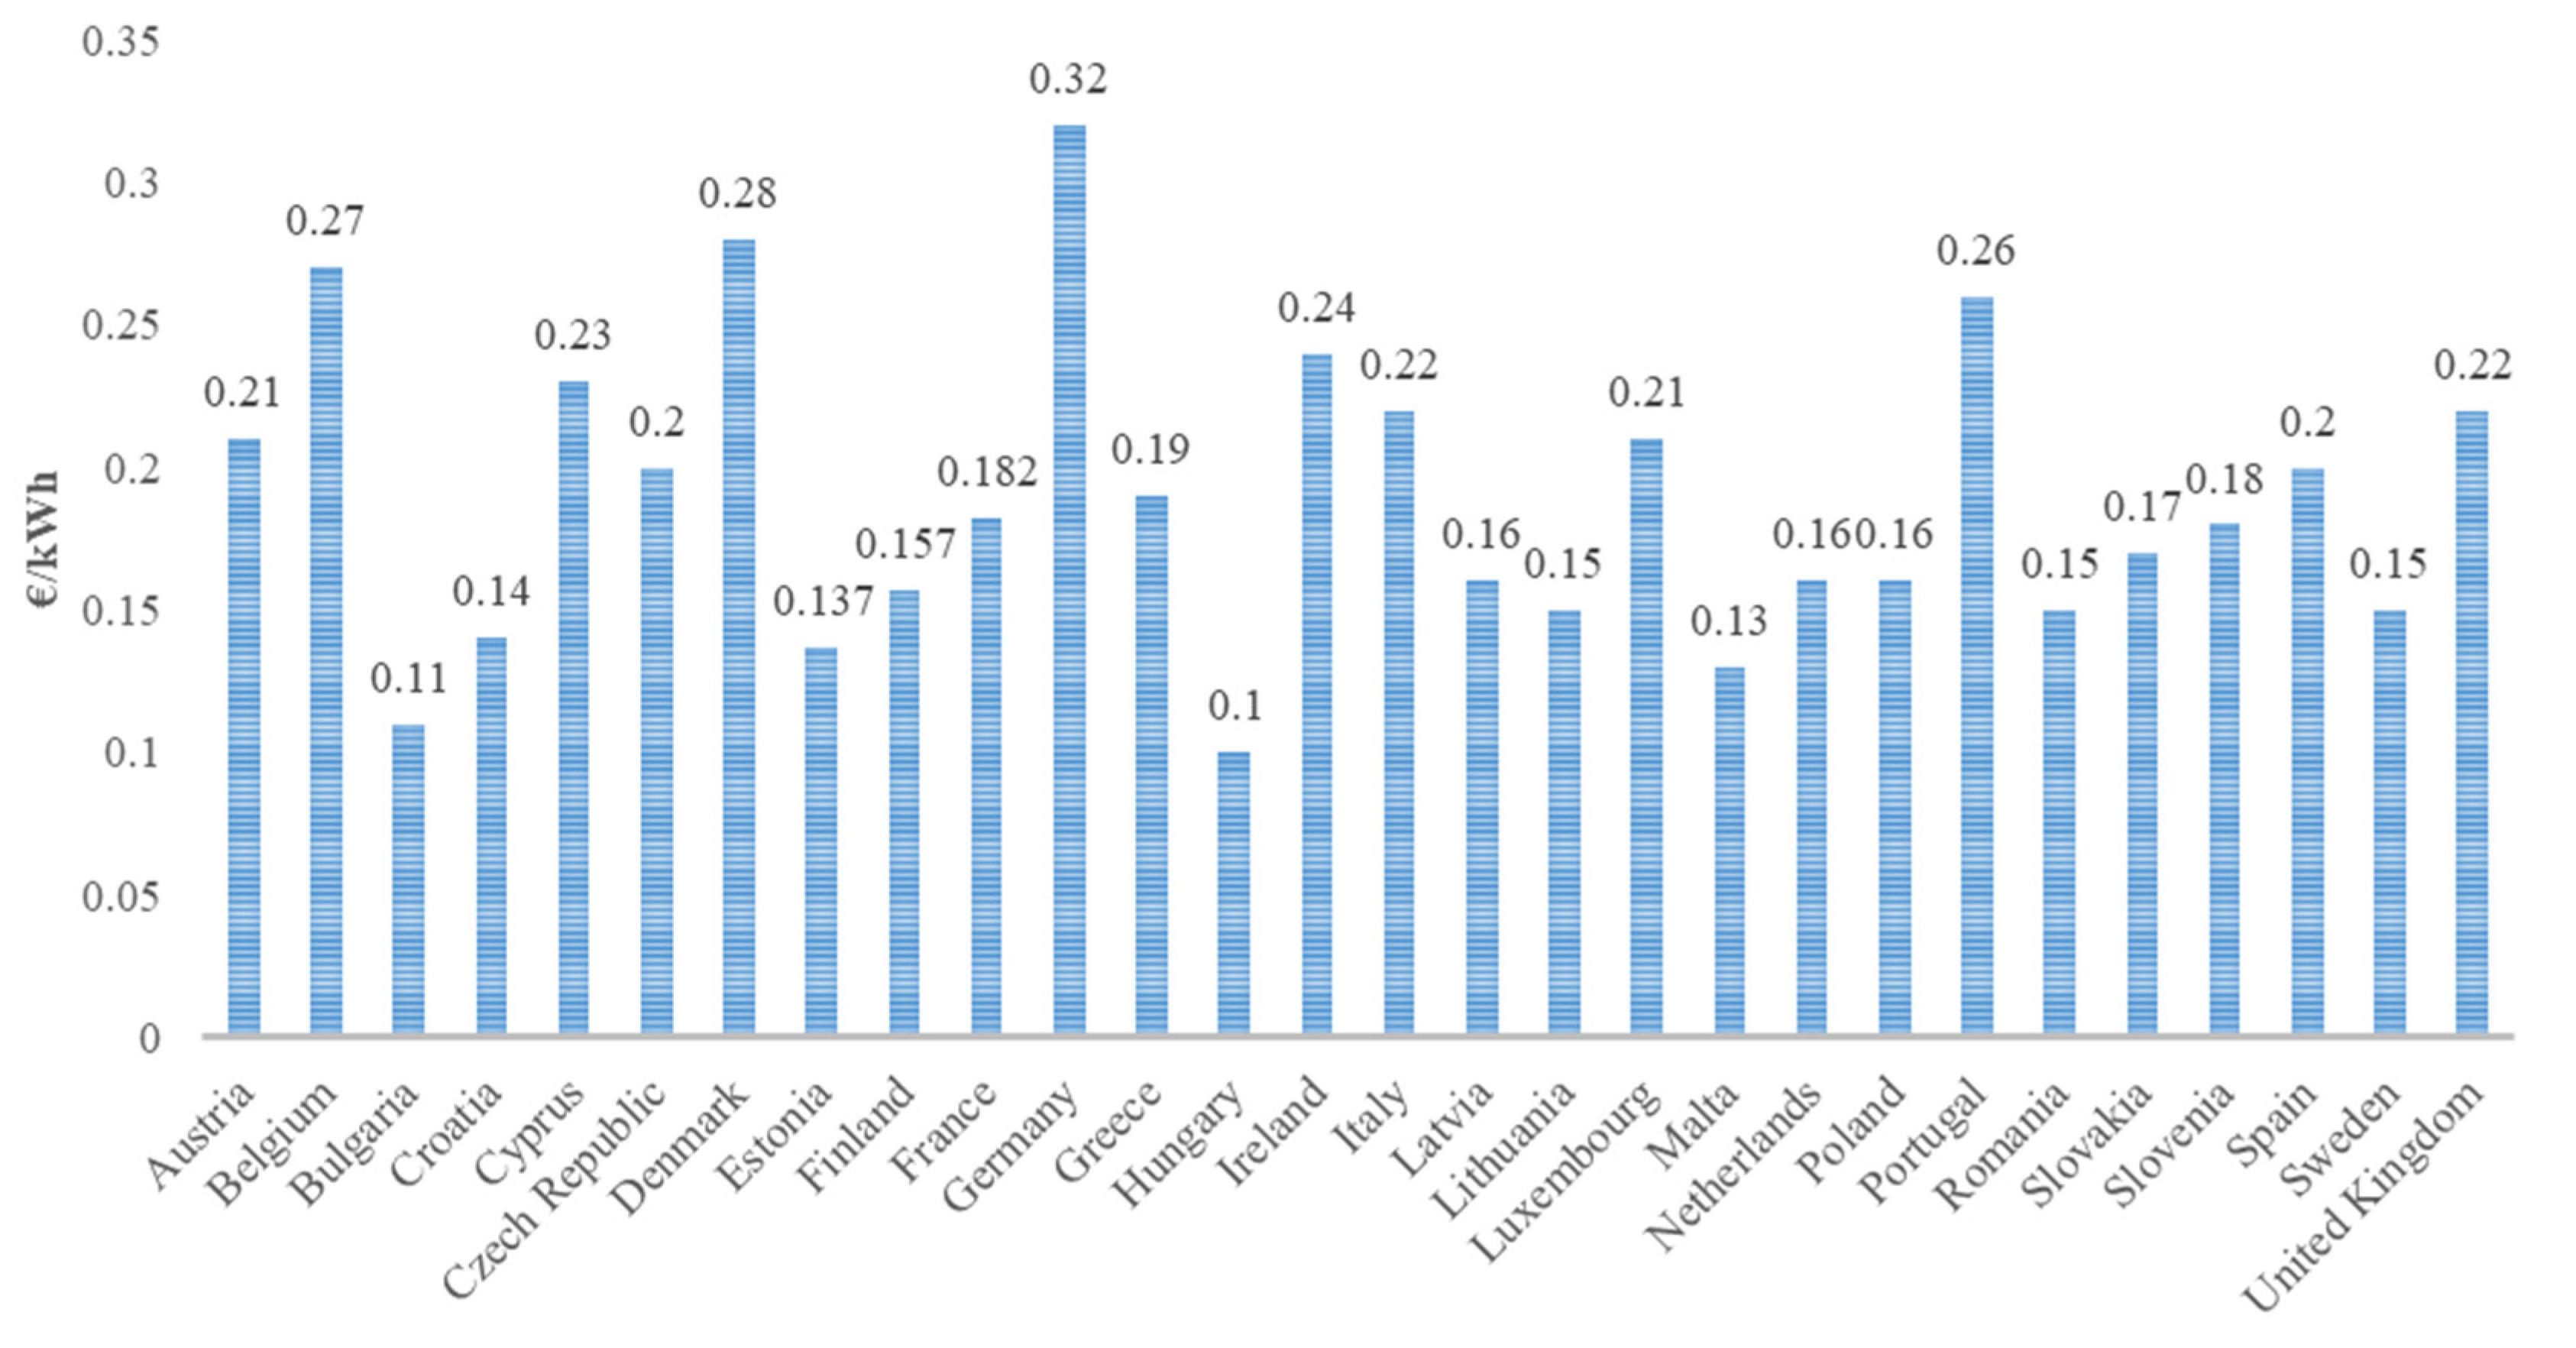
  2. Germany Electricity Prices. 2020. Available online: https://ec.europa.eu/eurostat/statistics-explained/index.php?title=Electricity_price_statistics (accessed on 25 August 2021).
  3. Naimoli, S.; Ladislaw, S. Climate Solutions Series: Decarbonizing the Electric Power Sector. CSIS Briefs. 2020. Available online: https://www.csis.org/analysis/climate-solutions-series-decarbonizing-electric-power-sector (accessed on 23 December 2020).
  4. Hatziargyriou, N.; De Siqueira, I.P. Electricity Supply Systems of the Future; Springer: Berlin/Heidelberg, Germany, 2020. [Google Scholar]
  5. Marnay, C.; Chatzivasileiadis, S.; Abbey, C.; Iravani, R.; Joos, G.; Lombardi, P.; Mancarella, P.; von Appen, J. Microgrid evolution roadmap. In Proceedings of the 2015 International Symposium on Smart Electric Distribution Systems and Technologies, EDST 2015, Vienna, Austria, 8–11 September 2015. [Google Scholar]
  6. Lombardi, P.; Powalko, M.; Rudion, K. Optimal operation of a virtual power plant. In Proceedings of the 2009 IEEE Power and Energy Society General Meeting, PES ’09, 2009, Calgary, AB, Canada, 26–30 July 2009. [Google Scholar]
  7. Hatziargyriou, N.; Asano, H.; Iravani, R.; Marnay, C. Microgrids—An overview of ongoing research, development, and demonstration projects. IEEE Power Energy Mag. 2007, 2007, 78–94. [Google Scholar] [CrossRef]
  8. Komarnicki, P.; Lombardi, P.; Styczynski, Z. Electric Energy Storage Systems: Flexibility options for smart grids. IEEE Ind. Electron. Mag. 2018, 12, 54–55. [Google Scholar]
  9. Wenge, C.; Pietracho, R.; Balischewski, S.; Arendarski, B.; Lombardi, P.; Komarnicki, P.; Kasprzyk, L. Multi usage applications of li-ion battery storage in a large photovoltaic plant: A practical experience. Energies 2020, 13, 4590. [Google Scholar] [CrossRef]
  10. Sinn, H.W. Buffering volatility: A study on the limits of Germany’s energy revolution. Eur. Econ. Rev. 2017, 99, 130–150. [Google Scholar] [CrossRef]
  11. Davis, S.J.; Lewis, N.S.; Shaner, M.; Aggarwal, S.; Arent, D.; Azevedo, I.L.; Benson, S.M.; Bradley, T.; Brouwer, J.; Chiang, Y. Net-zero emissions energy systems. Science 2018, 360, eaas9793. [Google Scholar] [CrossRef] [PubMed] [Green Version]
  12. Gong, H.; Rallabandi, V.; Ionel, D.M.; Colliver, D.; Duerr, S.; Ababei, C. Dynamic Modeling and Optimal Design for Net Zero Energy Houses including Hybrid Electric and Thermal Energy Storage. IEEE Trans. Ind. Appl. 2020, 56, 4102–4113. [Google Scholar] [CrossRef]
  13. Attia, S. Net Zero Energy Buildings (NZEB), 1st ed.; Elsevier: Amsterdam, The Netherlands, 2018. [Google Scholar]
  14. Lopes, R.A.; Martins, J.; Aelenei, D.; Lima, C.P. A cooperative net zero energy community to improve load matching. Renew. Energy 2016, 93, 1–13. [Google Scholar] [CrossRef]
  15. Sokolnikova, P.; Lombardi, P.; Arendarski, B.; Suslov, K.; Pantaleo, A.M.; Kranhold, M.; Komarnicki, P. Net-zero multi-energy systems for Siberian rural communities: A methodology to size thermal and electric storage units. Renew. Energy 2020, 155, 979–989. [Google Scholar] [CrossRef]
  16. Rafique, M.M.; Rehman, S.; Alhems, L.M. Developing zero energy and sustainable villages—A case study for communities of the future. Renew. Energy 2018, 127, 565–574. [Google Scholar] [CrossRef]
  17. Nematchoua, M.K.; Nishimwe, A.M.R.; Reiter, S. Towards nearly zero-energy residential neighbourhoods in the European Union: A case study. Renew. Sustain. Energy Rev. 2021, 135, 110198. [Google Scholar] [CrossRef]
  18. Caro-Ruiz, C.; Lombardi, P.; Richter, M.; Pelzer, A.; Komarnicki, P.; Pavas, A.; Mojica-Nava, E. Coordination of optimal sizing of energy storage systems and production buffer stocks in a net zero energy factory. Appl. Energy 2019, 238, 851–862. [Google Scholar] [CrossRef]
  19. Lombardi, P.; Arendarski, B.; de Carne, G.; Wenge, W.; Komarnicki, P.; Liserre, M. Smart Transformer Use in Net-Zero Energy Factories. 2020. Available online: https://www.researchgate.net/publication/344610453_Smart_Transformer_Use_in_Net-Zero_Energy_Factories (accessed on 25 August 2021).
  20. Lombardi, P.; Komarnicki, P.; Zhu, R.; Liserre, M. Flexibility options identification within net zero energy factories. In Proceedings of the 2019 IEEE Milan PowerTech, Milan, Italy, 23–27 June 2019. [Google Scholar]
  21. Bandeiras, F.; Gomes, M.; Coelho, P.; Fernandes, J. Towards net zero energy in industrial and commercial buildings in Portugal. Renew. Sustain. Energy Rev. 2020, 119, 109580. [Google Scholar] [CrossRef]
  22. Mitsubishi Electric Facility Receives Net Zero Energy Building Certification. First Medium-Scale Office Building to Be Certified in Japan While Still under Construction. 2019. Available online: https://emea.mitsubishielectric.com/en/news/releases/global/2019/0807-a/index.html (accessed on 25 August 2021).
  23. Tesla Gigafactory. 2018. Available online: https://www.tesla.com/gigafactory?redirect=no (accessed on 25 August 2021).
  24. Lombardi, P.A.; Moreddy, K.R.; Naumann, A.; Komarnicki, P.; Rodio, C.; Bruno, S. Data centers as active multi-energy systems for power grid decarbonization: A technical and economic analysis. Energies 2019, 12, 21. [Google Scholar] [CrossRef] [Green Version]
  25. Anderson, M. Green Data: The Next Step to Zero-Emissions Data Centers. IEEE Spectrum, 18 September 2019. [Google Scholar]
  26. U.S. Department of Energy, Reducing Data Center Loads for a Large-Scale, Net Zero Office Building. 2010. Available online: https://www.nrel.gov/docs/fy12osti/52786.pdf (accessed on 25 August 2021).
  27. IEC (The International Electrotechnical Commission). IEC 61158-1:2019 Industrial Communication Networks—Fieldbus Specifications–Part 1: Overview and Guidance for the IEC 61158 and IEC 61784 Series; IEC: Geneva, Switzerland, 2019. [Google Scholar]
  28. IEC (The International Electrotechnical Commission). IEC TR 62541-1:2020 OPC Unified Architecture—Part 1: Overview and Concepts. 2020. Available online: https://webstore.iec.ch/publication/61109 (accessed on 20 November 2020).
  29. Nicola, M.; Nicola, C.; Duta, M. SCADA Systems Architecture Based on OPC and Web Servers and Integration of Applications for Industrial Process Control. Int. J. Control Sci. Eng. 2018, 8, 13–21. [Google Scholar]
  30. ISO/IEC (International Organization for Standardization/The International Electrotechnical Commission). ISO/IEC 14543-3-10:2012 Information Technology—Home Electronic Systems (HES) Architecture—Part 3-10: Wireless Short-Packet (WSP) Protocol Optimized for Energy Harvesting—Architecture and Lower Layer Protocols. 2012. Available online: https://www.iso.org/standard/59865.html (accessed on 20 November 2020).
  31. Serpanos, D.; Wolf, M. Internet-of-Things (IoT) Systems Architectures, Algorithms, Methodologies; Springer: Berlin/Heidelberg, Germany, 2017. [Google Scholar]
  32. Richter, M. Prospektive Flexibilitätsoptionen in der Produzierenden Industrie. October 2020. Available online: https://www.researchgate.net/publication/344617286_Prospektive_Flexibilitatsoptionen_in_der_produzierenden_Industrie (accessed on 17 June 2021).
  33. Stötzer, M.; Hauer, I.; Richter, M.; Styczynski, Z.A. Potential of demand side integration to maximize use of renewable energy sources in Germany. Appl. Energy 2015, 146, 344–352. [Google Scholar] [CrossRef]
  34. Gelazanskas, L.; Gamage, K.A.A. Demand side management in smart grid: A review and proposals for future direction. Sustain. Cities Soc. 2014, 11, 22–30. [Google Scholar] [CrossRef]
  35. Kramer, G.J. Energy scenarios—Exploring disruption and innovation. Energy Res. Soc. Sci. 2018, 37, 247–250. [Google Scholar] [CrossRef]
  36. OECD (Organisation for Economic Co-Operation and Development). A Chain Reaction: Disruptive Innovation in the Electricity Sector. 2018. Available online: https://www.oecd.org/competition/A-chain-reaction-disruptive-innovation-in-the-electricity-sector.pdf (accessed on 20 November 2020).
  37. Competitiveness, R.O.N.; Author, D. Report on Competitiveness of the Geothermal Industry. 2020. Available online: http://www.etip-dg.eu/front/wp-content/uploads/D4.6-Report-on-Competitiveness.pdf (accessed on 25 August 2021).
  38. Deloitte. Tech Trends 2021. 2021. Available online: https://www2.deloitte.com/content/dam/insights/articles/6730_TT-Landing-page/DI_2021-Tech-Trends.pdf (accessed on 25 August 2021).
  39. Spencer, R.S.; Macknick, J.; Aznar, A.; Warren, A.; Reese, M.O. Floating Photovoltaic Systems: Assessing the Technical Potential of Photovoltaic Systems on Man-Made Water Bodies in the Continental United States. Environ. Sci. Technol. 2018, 53, 1680–1689. [Google Scholar] [CrossRef] [PubMed]
  40. Frankel, D.; Wagner, A. Battery Storage: The Next Disruptive Technology in the Power Sector. McKinsey Co. 2017. Available online: https://www.mckinsey.com/business-functions/sustainability/our-insights/battery-storage-the-next-disruptive-technology-in-the-power-sector (accessed on 25 August 2020).
  41. Cao, C. Sustainability and life assessment of high strength natural fibre composites in construction. In Advanced High Strength Natural Fibre Composites in Construction; Woodhead Publishing: Sawston, UK, 2017; pp. 529–544. [Google Scholar]
  42. Balaman, S.Y. Decision-Making for Biomass-Based Production Chains; Academic Press: New York, NY, USA, 2018. [Google Scholar]
  43. Brownson, J.R.S. Solar Energy Conversion Systems; Elsevier: Amsterdam, The Netherlands, 2014. [Google Scholar]
  44. Lombardi, P.; Sokolnikova, P.; Arendarski, B.; Franke, R.; Hoepfner, A.; Komarnicki, P. Multi-Criteria Planning Tool for a Net Zero Energy Village. In Proceedings of the 2018 IEEE International Conference on Environment and Electrical Engineering and 2018 IEEE Industrial and Commercial Power Systems Europe, EEEIC/I and CPS Europe 2018, Palermo, Italy, 12–15 June 2018. [Google Scholar]
  45. Nieto, I.M.; Borge-Diez, D.; Blázquez, C.S.; Martín, A.F.; González-Aguilera, D. Study on geospatial distribution of the efficiency and sustainability of different energy-driven heat pumps included in low enthalpy geothermal systems in Europe. Remote Sens. 2020, 12, 1093. [Google Scholar] [CrossRef] [Green Version]
  46. Coles, H.; Herrlin, M. Immersion Cooling of Electronics in DoD Installations. In Ernest Orlando Lawrence Berkley Natl. Lab.; 2016. Available online: https://datacenters.lbl.gov/sites/default/files/ImmersionCooling2016.pdf (accessed on 25 August 2021).
  47. Ohadi, M.M.; Dessiatoun, S.V.; Choo, K.; Pecht, M.; Lawler, J.V. A comparison analysis of air, liquid, and two-phase cooling of data centers. In Proceedings of the 2012 28th Annual IEEE Semiconductor Thermal Measurement and Management Symposium (SEMI-THERM), San Jose, CA, USA, 18–22 March 2012; pp. 58–63. [Google Scholar]
  48. de Souza, D.F.; da Silva, P.P.F.; Fontenele, L.F.A.; Barbosa, G.D.; de Oliveira Jesus, M. Efficiency, quality, and environmental impacts: A comparative study of residential artificial lighting. Energy Rep. 2019, 5, 409–424. [Google Scholar] [CrossRef]
  49. Tomes, E.; Altiparmak, N. A Comparative Study of HDD and SSD RAIDs’ Impact on Server Energy Consumption. In Proceedings of the 2017 IEEE International Conference on Cluster Computing (CLUSTER) 2015, Honolulu, HI, USA, 5–8 September 2017; pp. 625–626. [Google Scholar]
  50. Halicka, K.; Lombardi, P.A.; Styczyński, Z. Future-oriented analysis of battery technologies. In Proceedings of the 2015 IEEE International Conference on Industrial Technology (ICIT), Seville, Spain, 17–19 March 2015. [Google Scholar]
  51. Cabeza, L.F.; Oró, E. Thermal energy storage for renewable heating and cooling systems. Syst. Des. Assess. Appl. 2016, 2016, 139–179. [Google Scholar]
  52. Kalaiselvam, S.; Parameshwaran, R. Thermal Energy Storage Technologies. System Design, Assessment and Applications; Elsevier: Amsterdam, The Netherlands, 2014. [Google Scholar]
  53. Breeze, P. Power System Energy Storage Technologies; Academic Press: New York, NY, USA, 2018. [Google Scholar]
  54. Arenas, F.C.; Ponce de León, L.F.; Walsh, C. Engineering aspects of the design, construction and performance of modular redox flow batteries for energy storage. J. Energy Storage 2017, 11, 119–153. [Google Scholar] [CrossRef] [Green Version]
Figure 1. Electricity price for EU residential users (based on [2]).
Energies 14 05577 g001
Figure 2. Demand-side management programs in smart grid systems [34].
Energies 14 05577 g002
Figure 3. Disruptive technologies to be considered in upgrading NZESs (based on [35,40]).
Energies 14 05577 g003
Figure 4. Cradle-to-grave scheme for evaluating the ecological impact of a technology (based on [41,42,43]).
Energies 14 05577 g004
Figure 5. Distribution of the electricity consumption in data centers.
Energies 14 05577 g005
Figure 6. Virtual reality representation of the system analyzed.
Energies 14 05577 g006
Figure 7. Qualitative visualization of energy storage systems sizing approach.
Energies 14 05577 g007
Figure 8. Qualitative visualization of the effect of the planning measurements of the Net-Zero Energy System.
Energies 14 05577 g008
Table 1. Technology readiness level.
TRLState of Development
Research1Basic principles observed
2Technology concept formulated
3Experimental proof of concept
Development4Technology validated in lab
5Technology validated in relevant environment
6Technology demonstrated in relevant environment
Deployment7System prototype demonstration in operational environment
8System complete and qualified
9Actual system proven in operation environment
Table 2. Data requirements.
CategoryDataDescription and Grade of Details
TechnicalEnergy and resources demandsYearly energy demand and load profile for electricity, heat, water, natural gas, and other fossil sources
Energy provision and purchasing mechanismEnergy price, regulatory condition for energy fee, tax, cost allocations
Energetic and resources infrastructuresElectrical grid, heat and natural gas grid, water, and wastewater grids
Building and zoneTypology, construction year, gross and net energy demands, number of floors, surface, lighting,
System EngineeringProducer, identification plate, power data
Process and operation dataControl logic, operation regime, load profile, characteristic curve, operational points
Redundancy and dependencyCombined heat and power, uninterruptable power supply
SocialPeopleNumber of people and their activities
Spatial development and weather conditionsRoom development and weather conditionsLand use plan, weather conditions, legal limitation
Strategical developmentCertificateResults of energy audits, energy certifications
Strategic and intrinsic conditionsMedium- and long-term decisions, preferred suppliers, long-term liabilities
Table 3. Portfolio classification.
ClassTechnologies
RES-based electricity generationBifacial solar cell (PERC technology), cadmium telluride solar cells, copper indium (gallium) diselenide, organic solar cells, concentrator cells, PVT modules, solar trees, tracking systems for PV, biomass
Thermal energy conversionAbsorption chillers, adiabatic cooling, adsorption chillers, DEC systems, air conditioning systems, and air circulation optimization, dynamic controllable ventilation, split air conditioning units, compression chillers, ORC modules, heat pumps
Electric energy storageLead-based storage, compressed/liquid air storage, lithium-based storage, sodium-based storage, redox flow storage, flywheel storage
Thermal energy storageCold water and ice storage, gravel and basalt water storage, latent heat storage (paraffin), thermochemical heat storage (silica gel, zeolite), sensible heat storage
Biogenic fuel useFuel cells, decentralized biomass boilers (pellets, wood chips, logs), gas engine CHP with ORC module
Green gas productionElectrolyzer, fermentation process/biogas substrates, methanation (Sabatier process)
Information technologiesEnergy-efficient processor technology, solid-state drives
Process optimizationIndividual
Infrastructure optimizationCompressed air supply, electro-mobility concepts, LED lighting, DC supply networks
External reuse plantsWaste heat reuse for industrial processes, biomass drying, hot water preparation, and interior heating
Table 4. List of typical parameters.
ParameterDescriptionUnit(s)
Technical parameter
Performance rangeRange of an industrially available technology’s limitations related to performance and energyW
Specific outputPerformance, energy, or efficiency specifications related to an expedient reference value (e.g., average annual energy per area for photovoltaics)e.g., Wh/m2
Energy conversion efficiency/efficiencyRatio of the useful energy to the energy supplied by the technology%
Energy reuse factorRatio of reusable recovered energy to total energy%
Round-trip efficiencyEnergy conversion efficiency of one complete process of storage and retrieval for storage technologies, factoring in internal losses%
Energy efficiency ratioRatio of cooling output at evaporator Q0 and heating output at generator QA%
Coefficient of performance (COP)Ratio of heat produced to the electricity required-
Technical maximumTheoretical physical limit of the energy conversion efficiency or efficiency (e.g., Shockley-Queisser limit of solar cells based on absorption and reemission)%
Lifetime degradationAverage or maximum period of a technology’s use/impacts of phenomena that affect operation or efficiency adversely%/a
Auxiliary demand-lossesPart of energy the technology needs to be self-sufficient/the technology releases unutilized to the environment when operating or stopped%, W
Manufacturers- vendorsBusinesses that supply or sell the technology-
Reference systemsModel implementations in which similarly scaled technology was sized, implemented, or tested in the field-
Economic parameters
Specific capital expendituresNumerical estimate (range) the capital expenditures made based on the specific economic characteristics from the area charte.g., EUR/W
Ongoing operating expendituresImputed estimate of the operational cost factors, e.g., servicing/maintenance, insurance (specified as a percentage of total capital expenditures)e.g., %, EUR/(W*a), EUR/Wh
Integration parameter
Utility connectionsConnections required to operate the technology (e.g., electricity, heat, gas, water)-
Area/space requiredSpace specification, specific or for reference size-
DesignsType of engineering of technology (e.g., open or rooftop areas for photovoltaics, containers, chassis for 19-inch rack), information of transportable or stationary use-
Ecologic and miscellaneous parameters
Organizational planning dependenceImpacts of a technology’s use on other development pathways, commitment periods, technologies consequently ruled out, periods, identification of synergistic technologies-
Significant regulatory developmentsInformation on potential changes to laws, guidelines, or standards that can affect the technology’s use positively or negatively-
Sustainability and environmental compatibilityAssessment of the technology’s ecological footprint concerning its operation or manufacture (e.g., specification of the ecological payback period)-
Energy returned on energy investedRatio of energy generated during the lifetime to energy expended for manufacture-
Hazardous substances and pollutantsList of substances contained that can harm health or the environment according to the regulations concerning the Registration, Evaluation, Authorisation, and Restriction of Chemicals (REACH),-
Hazard minimization actionsActivities or structures required to minimize existing hazards during the technology’s operation or installation-
Table 5. Energetic indicators of the planning measurements.
Electricity Generation by RESsReference Nominal Power in kWSpecific Yearly Generation in MWh/kWYearly Generation in MWhAccountable Energy Balance in MWh
Mono-crystalline silicon1111
Wind turbine4.2001.77.136−7.136
Light SystemAverage Duty Cycle h/aIncrease of Efficiency in %Yearly Energy Consumption MWhAccountable Energy Balance in MWh
Reference
1 kW compact fluorescent light
1.00001.0000
LED equivalent1.000100.9−0.1
Cooling SystemAverage Duty Cycle h/aIncrease of Efficiency in %Yearly Energy Consumption MWhAccountable Energy Balance in MWh
Reference air cooling
1 kW
6.00006.00
Immersion cooling
;equivalent
6.00041%3.54−2.46
SSDsStorage Capacity in TBSpecific Energy Demand in kWh/(TB*a)Yearly Energy Consumption in MWhAccountable Energy Balance in MWh
Reference hard-disc drivers (80% of time in idle modus)1.00055550
SSD
equivalent
1.00055−50
Table 6. Economic indicators of the planning measurements.
TechnologySpecific Investment Costs in €/kWLifetime in YearsYearly Economic Balance in €/kW
Mono-crystalline Si.1.62520−150
Wind turbine1.20020−255
LED4543−750
Immersion cooling12.83715−900
SSDs5443−1.314
Publisher’s Note: MDPI stays neutral with regard to jurisdictional claims in published maps and institutional affiliations.

