1. Introduction
Globally, 36% of final energy use and 39% of energy and process-related CO
2 emissions are connected to the civil/residential sector [
1]. Moreover, relevant variability of the energy consumption is observed in the different cases.
Considering the buildings for civil/residential use, the energy consumption is evaluated by means of the values of energy intensity (EI), which accounts for the annual energy use of the building per floor area. Typical values range from 50 kWh/m
2 to about 600 kWh/m
2 [
2]. The values of energy consumption are dependent on a series of factors, identified in meteorological, architectural, and structural ones, but also on the operation of the installed equipment and on the occupants’ behavior [
3].
Although meteorological factors such as the temperature of the site are known to have a major influence on the energy consumption, the variability can also be found at a local level emphasizing the importance of the other factors: values of EI ranging from 50 kWh/m
2 to 430 kWh/m
2 are reported referring to the city of Shanghai in [
4],; values from 120 kWh/m
2 to 730 kWh/m
2 and from 140 kWh/m
2 to 430 kWh/m
2 are reported referring to large buildings in some cities of the USA as New York and Chicago in [
5],. Those relevant large gaps in the energy consumption of buildings compared to best practice ones, emphasize the energy saving potential of this sector.
Since a great part of the non-residential building consumptions is attributed to heating, ventilation, and air conditioning systems (HVACs) [
6], their energy management represent one of the pillars for improving energy efficiency in this sector. A review of different strategies for HVAC energy saving is for example provided in [
7].
The final services provided by HVACs are thermal comfort and indoor air quality, which are key elements in determining a favorable indoor environment, along with visual and acoustic comfort [
8]. Due to the recent COVID-19 pandemic, indoor air quality (IAQ) has gained importance because its accurate management can help to prevent airborne virus transmission [
9,
10]. The IAQ requirements have drawn major attention on increasing the energy efficiency of these systems, since their share in buildings’ energy consumption is expected to rise [
11].
HVAC energy management is very complex due to the high number of variables involved, and therefore its assessment requires a holistic approach, considering the energy flow from the energy sources to the final services [
12].
The implementation of renewable energy sources (RES) as substitution of fossil fuels [
13] has been investigated both to reduce the energy intensity and the carbon footprint of buildings.
Concerning the final services which are usually evaluated in terms of environmental parameters [
14], they are often object of multi-objective optimization to involve the building energy management and the satisfaction of the occupants, as provided in [
15,
16].
Amid the energy source and the final service there are two physical elements represented by the HVAC system itself and the building, which both play a relevant role in influencing the energy flow from the source to the service. The former one represents a conversion device in which energy is used and transferred to the process fluid, and the second one is the passive system in which the energy supplied is exploited for the service. Regarding the HVAC system, the use of advanced components, energy recovery measures and accurate control have been investigated; instead, regarding the building, the envelope composition, the window-to-wall ratio, the shape factor, and other heat transfer related parameters have been widely discussed.
Some studies regarding energy management in the building sector approach this topic with a narrow scope, focusing only on few elements and losing sight of the relation between the considered elements and all the others involved. Considering only few of the influencing factors may lead to miss the key points for achieving a significant energy efficiency increase. For example, overly advanced mathematical techniques are commonly applied to elements that do not play a major role in reducing the energy consumption of the building. Moreover, techniques that only slightly reduce energy consumption could be affected by the so-called “rebound effect”, in which the user desire for improved comfort leads to an increased energy consumption [
17]. This shows the need for an accurate evaluation of the energy management, considering all the influencing factors. Accordingly, efforts should be directed to elements that represent bottle necks for energy reductions, to obtain results on full scale.
In this study, we explore HVAC operational characteristics and associated savings through the analysis of buildings for educational purposes. In a previous paper [
18], the authors have shown how a significant energy consumption reduction, of about 80%, can be achieved in a large academic building with the use of electrically driven heat pumps (HPs), of Variable Air Volume (VAV) systems, and of Demand Controlled Ventilation (DCV), compared to a benchmark solution involving the use of fossil fuels and a Constant Air Volume (CAV) system. This has led to the identification of a fossil-fuel-free generation and an occupancy-aware ventilation as the possible keys to improve the energy management in the building sector on full scale.
Assessing whether the significance of the achieved improvements with some Energy Conservation Measures (ECMs) can be extended to other buildings and to a whole sector is a crucial task that it is often not understood nor carried out [
19]. The elements considered in the literature are different. The first is represented by the renowned attention for recognized HVAC energy conservation measures which are often relegated to a secondary role when compared to building envelope ones. The second contribution is that of verifying whether the significance of the results can be extended to buildings with very different features, leading to the determination of an energy efficiency potential achievable at a sector level.
Although there are many published studies on HVAC control optimization and energy saving perspectives have been largely discussed in recent papers, as [
20,
21], the focus of the analysis is often represented by commercial buildings. Moreover, there has not been an in-depth investigation that quantifies the HVAC-related savings in different applications. This type of analysis results in a deeper understanding of variables such as building type and destination, climate zone, and occupancy profile.
To this purpose, the paper will analyze the energy efficiency potential in shared buildings, focusing on energy saving measures regarding the HVAC system; in particular, it will examine the use of HPs in substitution to fossil fuel boilers and the implementation of an energy-aware ventilation based on occupants monitoring. The last aspects will be deeply investigated in the present paper in the application to two different buildings with different geometric characteristics.
The application of the control strategies applied to different buildings is certainly helpful for investigating whether the different features of the buildings influence the overall energy savings and vary the relative importance of each measure. Moreover, with respect to the analysis already provided in [
18], the comparison between two different buildings also puts the shape factor at the center of the analysis.
The comparison between the implementation of the different HVAC control strategies to the two different buildings considered will be undertaken by means of the dynamic simulation of the plant and building systems.
2. HVAC Energy Conservation Measures
The high energy consumption in buildings for public use as in particular commercial, offices and educational structures is mainly correlated with the HVAC system operation. In this section some general energy conservation measures aimed at obtaining reduction of HVAC energy consumption are analyzed and discussed. The proposed measures represent the state of the art in HVAC control and are therefore present in many new or retrofitted solutions. However, due to the high number of involved stakeholders [
22], there are usually conflicts between their needs, which preclude to achieve manifest progresses. Moreover, today, the need for ensuring healthy indoor conditions, because of the COVID-19 pandemic, this necessity became even more evident. The increased demand for ventilation to reduce the infection risk led to increased use of HVAC systems to maintain adequate indoor conditions, which has consequences for energy consumption.
The interventions proposed represent straightforward measures that can guarantee a great reduction of the energy use and a greater flexibility of the energy management system. The win-win characteristic of the proposed measures should favor the agreement with every stakeholder, from occupants to operators and owners, and should be therefore promoted by policy makers on a massive scale. ECMs applied to HVACs compared to those applied to the building envelope, which are most common, represent a step forward for improving the energy management, as they are active solutions that can face the different conditions the building is subjected to and the different needs of the occupants. Moreover, in buildings with certain restrictions, as historical ones, they represent the best choice due to a complex exploitation of renewable technologies, thermal storages, and sometimes also of envelope interventions [
23].
2.1. The Use of Electrically Driven Heat Pmps for Heating and Cooling
Electrically driven HPs represent one of the most interesting way to reduce the energy consumption of the HVAC system and at the same time they provide the perspective of implementing active actions, as they can be driven by electricity produced by RES, such as PhotoVoltaic (PV) plants. It this way, HPs can be considered as a strategic element for reducing the carbon footprint of the building, since European directives identify aerothermal, hydrothermal, and geothermal energies as renewables.
However, a strong penetration in the market is still lacking, as these machines only account for 3% of space heating in buildings [
24]. Studies regarding HP emission reduction potential are usually performed regarding the residential sector, because of a greater uniformity of the buildings that belong to this typology. For example, in [
25] a potential reduction of 23% in greenhouse gas (GHG) emissions and of 36% in the energy consumptions are identified for the Canadian housing stock, while in [
26] a potential reduction of about 50% in space heating emissions is identified for the California housing stock. The achievable potential reduction is directly linked with RES penetration in the electricity generation, and, as shown in [
27], the primary energy savings lay in the range of 10–40% with a median value of 30%. Typical HVACs have a great potential for the combination with these devices, because of the low heating temperature required, which can enhance the HP performance.
Moreover the substitution of fossil-fuel-based systems like a conventional boiler with more efficient and environmental-friendly devices as HPs represents a useful tool for increasing the flexibility of the systems on multiple levels. On the building level, when coupled with a thermal storage, they can provide peak-shaving and demand-response features to satisfy occupants’ requests at a lower energetic cost [
28]; on the stock level, they can enhance stable operation of power grids and permits further integration of renewables in the energy system, as discussed in [
29].
2.2. Energy-Efficient Ventilation
Ventilation is one of the main functions that a HVAC system must provide. It is used to dilute pollutants’ concentration by supplying a certain amount of external air and extracting polluted air from the conditioned space. Moreover, in all-air systems, air is also used as the energy carrier for satisfying the building energy demands.
Regarding the air flow rate for energy purposes, different systems can be used: commonly used CAVs are being replaced by VAVs that are able to modulate the flow rate to reduce the fan energy consumptions thanks to Variable Speed Drive (VSD) technology [
30]. VAVs control the energy supplied by varying the supply flow rate instead of the supply temperature, as for CAVs. VAV systems’ improvements highly depend on the system controls that are implemented, an analysis of which is presented in [
31]. For example, in [
32] the introduction of VSD has provided a cooling energy saving of almost 23% compared to constant speed HVAC systems.
Regarding the air flow rate for IAQ requirements, it is commonly performed on the evaluation of the flow rate on typical occupancy situations, using a precautionary approach. This practice turned out to be useful during the diffusion of the COVID-19 pandemic, in which the guidelines prescribed to supply as much fresh air as possible, because of safety priorities. However, after more than a year and with an increased awareness of practices that can avoid the virus spreading, the energy perspective must be recovered. Demand controlled ventilation has been widely used for reducing fresh air supply when not needed by IAQ requirements, reducing the load on the HVAC system. For example, in [
33], a reduction of fan energy consumption equal to 50% and of ventilation heat losses of more than 35% have been observed in offices and schools. This technology can be based on direct carbon dioxide monitoring [
34] but also on indirect measures such as smartphone counting. The presence of DCV could also help to operate an IAQ based on increased safety requirements and tailored on the actual contagion situation, providing a compromise solution between the energy consumption and the risk of infection [
35].
2.3. Proposed HVAC Control Strategies and Application to Real Buildings
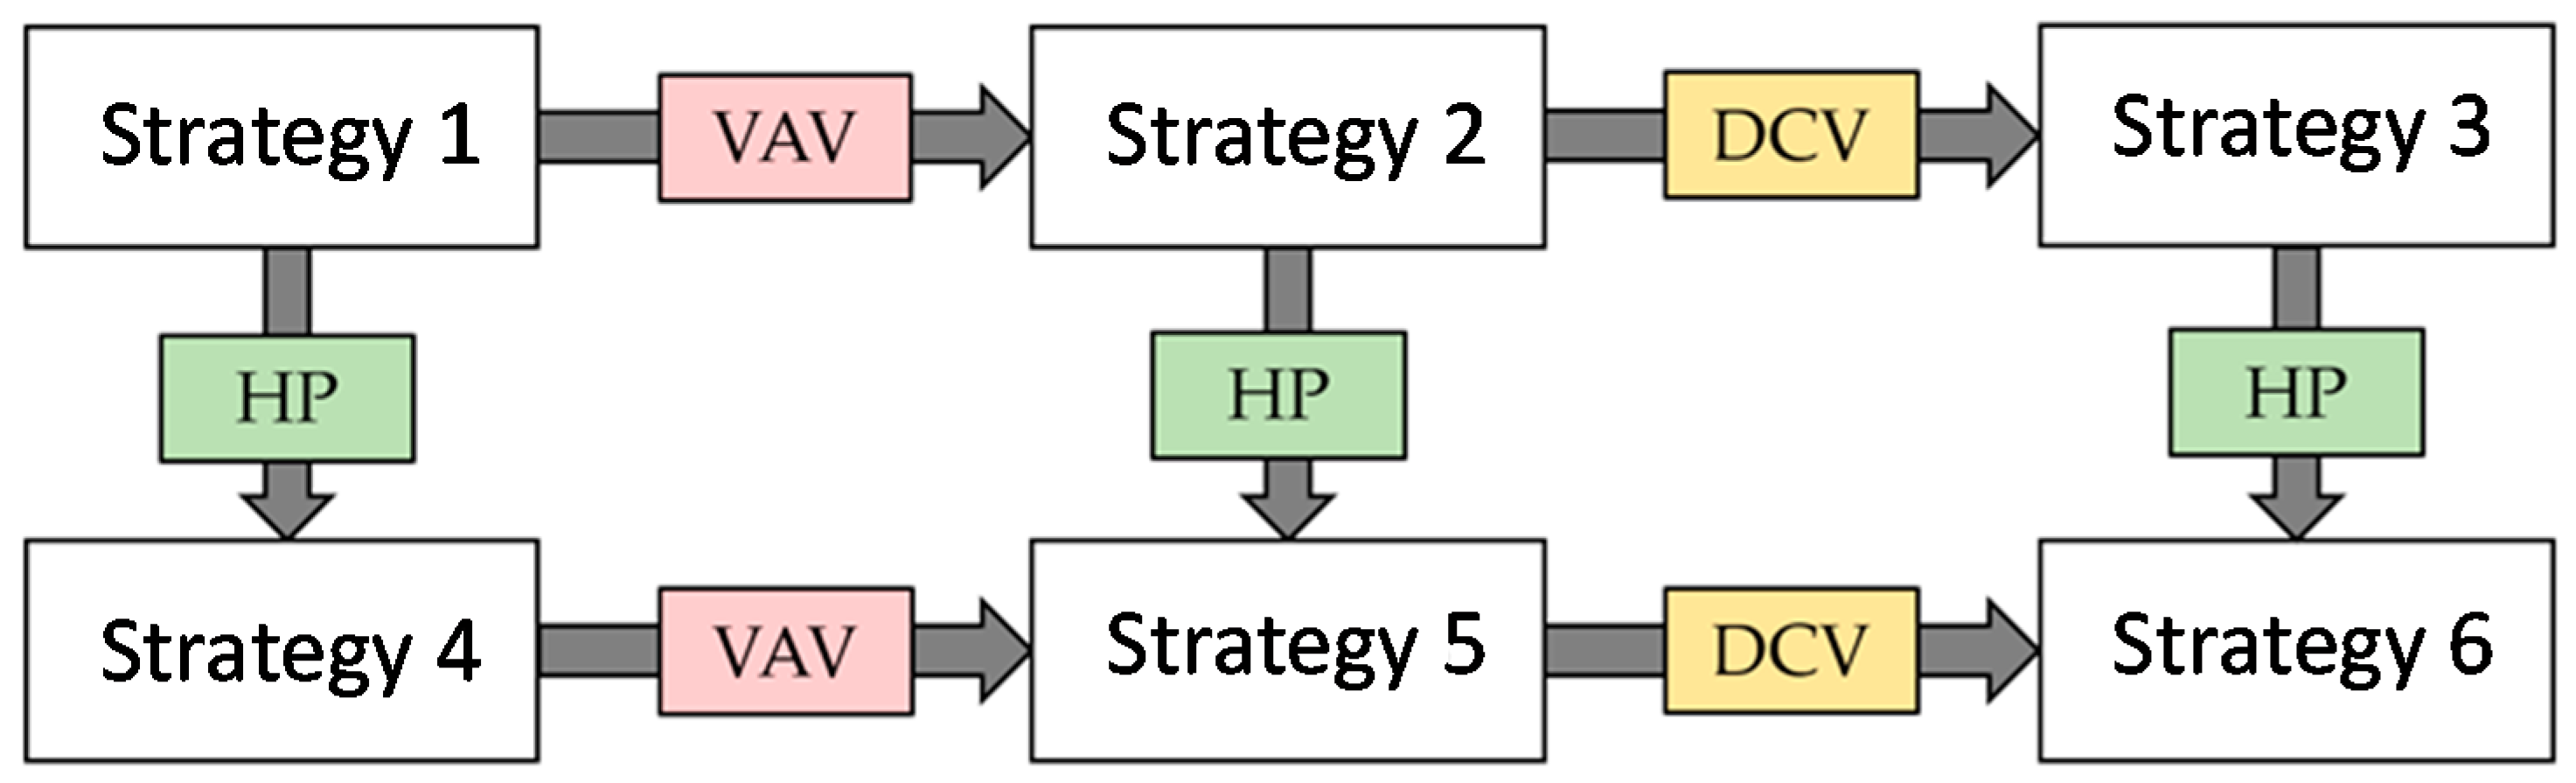
The measures presented above will be analyzed in combination with each other and compared to a reference benchmark solution, named strategy S1. This solution represents a common configuration of HVAC systems, and it is characterized using a steam boiler for heating, and a CAV system which is not able to modulate neither the supply air flow rate nor the renewal “fresh air” flow rate, which is evaluated on peak occupancy level, and which is provided even when very few occupants are present within the building.
The various analyzed control strategies are presented in
Figure 1, in which six different configurations (control strategies) can be identified, three for each kind of heating system considered (boiler, S1 to S3 or HP, S4 to S6). The different cases will help to investigate the energy saving achievable with different “progress level” of the HVAC system and the relation between the different control strategies.
According to the indications of
Figure 1, the application of a VAV system to S1 leads to the definition of strategy S2, and in turn the addition of DCV to the VAV system leads to the definition of strategy S3. These three strategies are characterized using the steam boiler for heating. Strategies from S4 to S6 can be considered as enhanced version of strategies from S1 to S3 with the utilization of the HP as the heating system. Accordingly, strategy S4 is characterized by the use of a HP and a CAV system, strategy S5 is characterized by a HP and a VAV system, while strategy S6 is characterized by a HP and a VAV system equipped with DCV, representing all the three measures introduced together. Clearly, since strategy S6 is characterized by all the three measures for efficiency increase (VAV, DCV and HP for heating), it is expected to outperform all the others, even if the amount of the energy saving guaranteed by every measure depends on the amount of HVAC energy consumption.
3. Methodology for the Dynamic Simulation of HVAC System Operation
In this section the methodology for the dynamic simulation of the building with the main equations involved is presented. The dynamic simulation is performed by means of physically based models, using a lumped capacity system. The defined time horizon used for the simulation is one hour, and differential equations are discretized with the explicit method. Both the models for the building and HVAC system are self-written in MATLAB code.
3.1. Building Model
The building model consists of a resistance-capacitance thermal network with the definition of multiple nodes for the envelope and a single node for indoor air and which has been prior validated. This represents the modeling of a single thermal zone, since all the spaces in the building are controlled with the same setpoints. Opaque envelope elements are modeled as a series of resistance-capacitance nodes in correspondence of the wall layers, plus two purely resistive nodes for surfaces adjacent to indoor and outdoor air. Glazed surfaces are modeled as single node purely resistive elements, plus two resistive nodes for surfaces adjacent to indoor and outdoor air. Partition walls are also modeled as the other opaque elements, but do not present exchanges with outdoor air. The following energy exchanges are considered: conductive heat transfer in the inner layers of opaque walls, convective and the radiant long-wave heat transfer between the envelope surfaces and the indoor/outdoor environments, radiant long-wave heat transfer with the sky, absorption of solar radiation, radiant long-wave heat transfer among internal surfaces, and radiant long-wave heat transfer with internal gains (e.g., occupants).
For each one of these energy exchanges, a thermal resistance matrix is evaluated based on the building structural and geometrical characteristics, and then the algebraic linear system represented by the sum of these matrices is solved to obtain the temperature of each node, based on the information of the temperature distribution in the previous timestep. In case of temperature control, air temperature is equaled to the setpoint, and the other nodes are calculated consequently. The sensible energy demand of the air node is evaluated by a thermal balance considering thermal dispersions, infiltration losses, internal gains, solar gains, and thermal inertia, as in [
36]:
In Equation (1) a positive value of
represents a heating demand. Instead, the latent energy demand is evaluated by a mass balance on the air node considering internal latent loads, infiltrations, and the inertial term, as:
In Equation (2) a positive value of represents a humidification demand.
The mechanical ventilation demand is evaluated with reference to the carbon dioxide mass balance:
In Equation (3) the first term on the right regards the CO
2 human production rate, estimated and the second term regards the ventilation contribution with a constant value for the external carbon dioxide concentration, that can be fixed equal to 400–500 ppm. The methodology is better described by one of the authors of the present paper in [
37].
Regarding the simulation, a range of acceptable values can be considered both for internal temperature of the building and relative humidity: referring to the Italian climate for the temperature, the setpoint values are 20 °C for cold season (when the heating systems is on) and 26 °C for hot season (when the cooling system is on). The setpoint values for the relative humidity are 40% and 60%, respectively. The simulation is performed firstly by evaluating the temperature evolution without considering the operation of the HVAC system. At a second step it is verified whether the calculated values are far from the two setpoints; if so, the calculation is performed again with the temperature setpoint of 20 °C in case temperature is too low and of 26 °C in case temperature is too high.
3.2. HVAC System Model
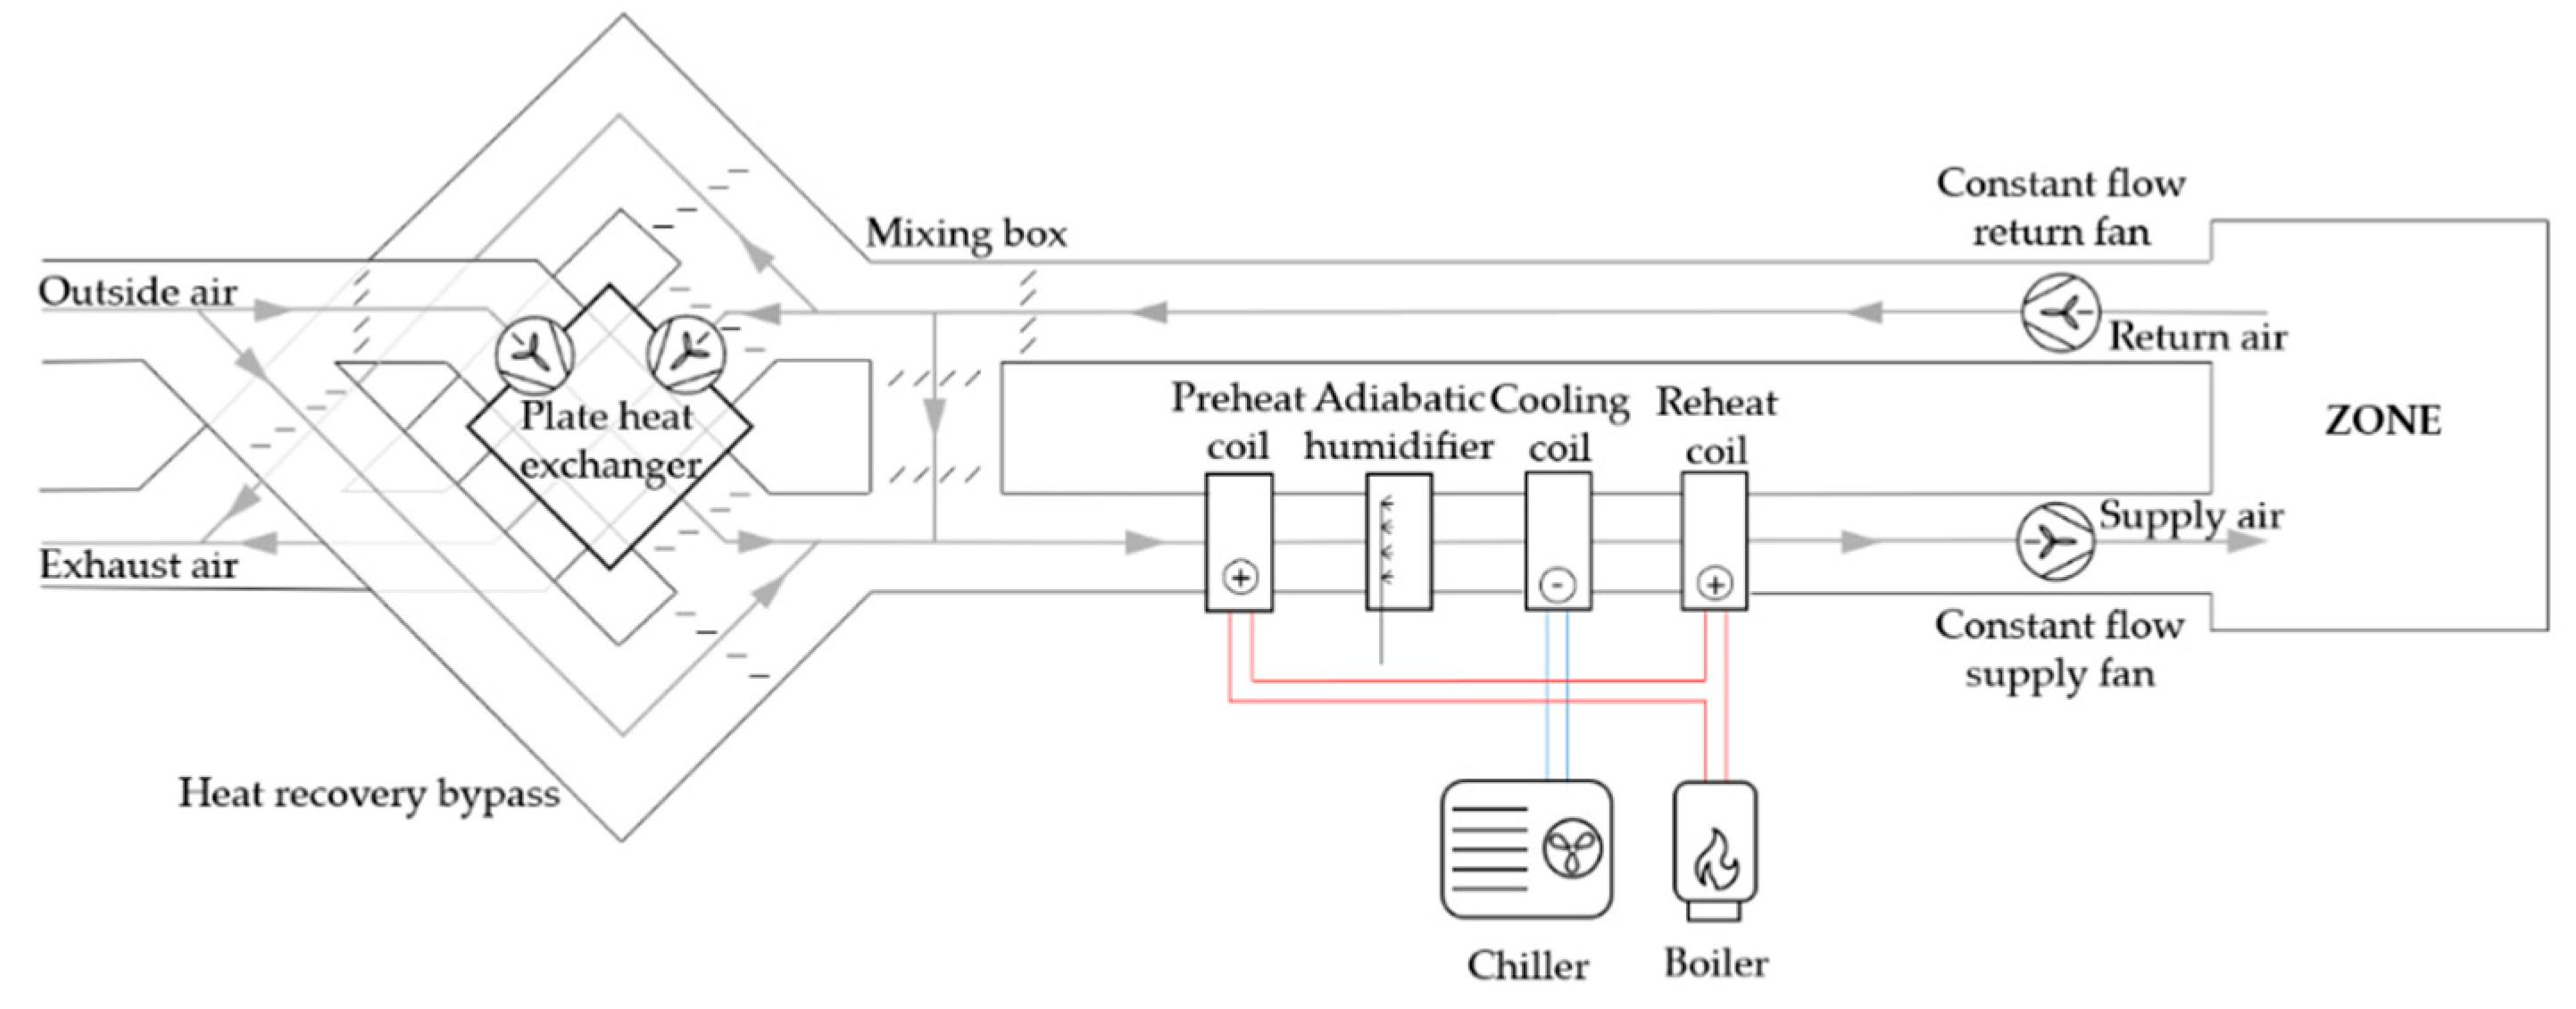
The HVAC system consists of an Air Handling Unit (AHU) equipped with a plate heat exchanger for Heat Recovery (HR), a mixing chamber, a preheat, cooling and dehumidification, and reheat coil heat exchangers, an adiabatic humidifier, a chiller, a boiler or an air-to-water heat pump, and fans. The model has been extensively described in recent papers by the authors, as [
9,
18], and its representation in the baseline configuration involving the boiler, a hydraulic scheme and constant flow rate fans is presented in
Figure 2.
The building energy demands are used to evaluate the air supply flow rate, temperature, and humidity ratio to guarantee the exact balance between the energy required and the energy delivered based on the control strategy involved: the values depend on the considered ventilation technique, since CAVs operate at a constant flow rate while VAVs modulate it according to the needs. The air renewal in case of DCV is evaluated by means of the carbon dioxide concentration balance of Equation (3).
The working conditions of every component are evaluated by physical equations based on lumped parameter models, and, once they are all defined, all the energy consumptions can be evaluated. A constant boiler efficiency of 0.85 has been considered; this value that is apparently quite low considers the losses for transient operations. At the same time, the Coefficient of Performance (COP) of the HP system has been evaluated considering a supply water temperature following a climatic rule and a reduction coefficient for representing part-load operation, as suggested in [
38]; the chiller Energy Efficiency Ratio (EER) has been evaluated in the same manner of the COP of the HP but considering a constant supply water temperature. The nominal values are based on recent scientific studies about state of the art and market status on HP, as [
39]. In
Figure 3 the performance map at nominal conditions for both heat pump and chiller, and the correction for part-load operation are presented. The data are obtained using a theoretical model based on real data.
The total energy consumption is obtained by summing that of the fans, that of the chiller and that of the boiler or HP. The determination of the total primary energy consumption in case of the use of the boiler as heating system is obtained with the following equation:
where the energy used by all the components is weighted using the primary energy conversion factors for natural gas,
, and electricity,
. In a similar way, the determination of the total primary energy consumption in case of the use of HP for energy generation is obtained with a similar equation:
The values of the primary energy conversion factors for natural gas and electricity are respectively 1.05 and 1.95, as suggested by European Standards as [
40] and by Italian national law.
4. Case Studies for Testing the Method
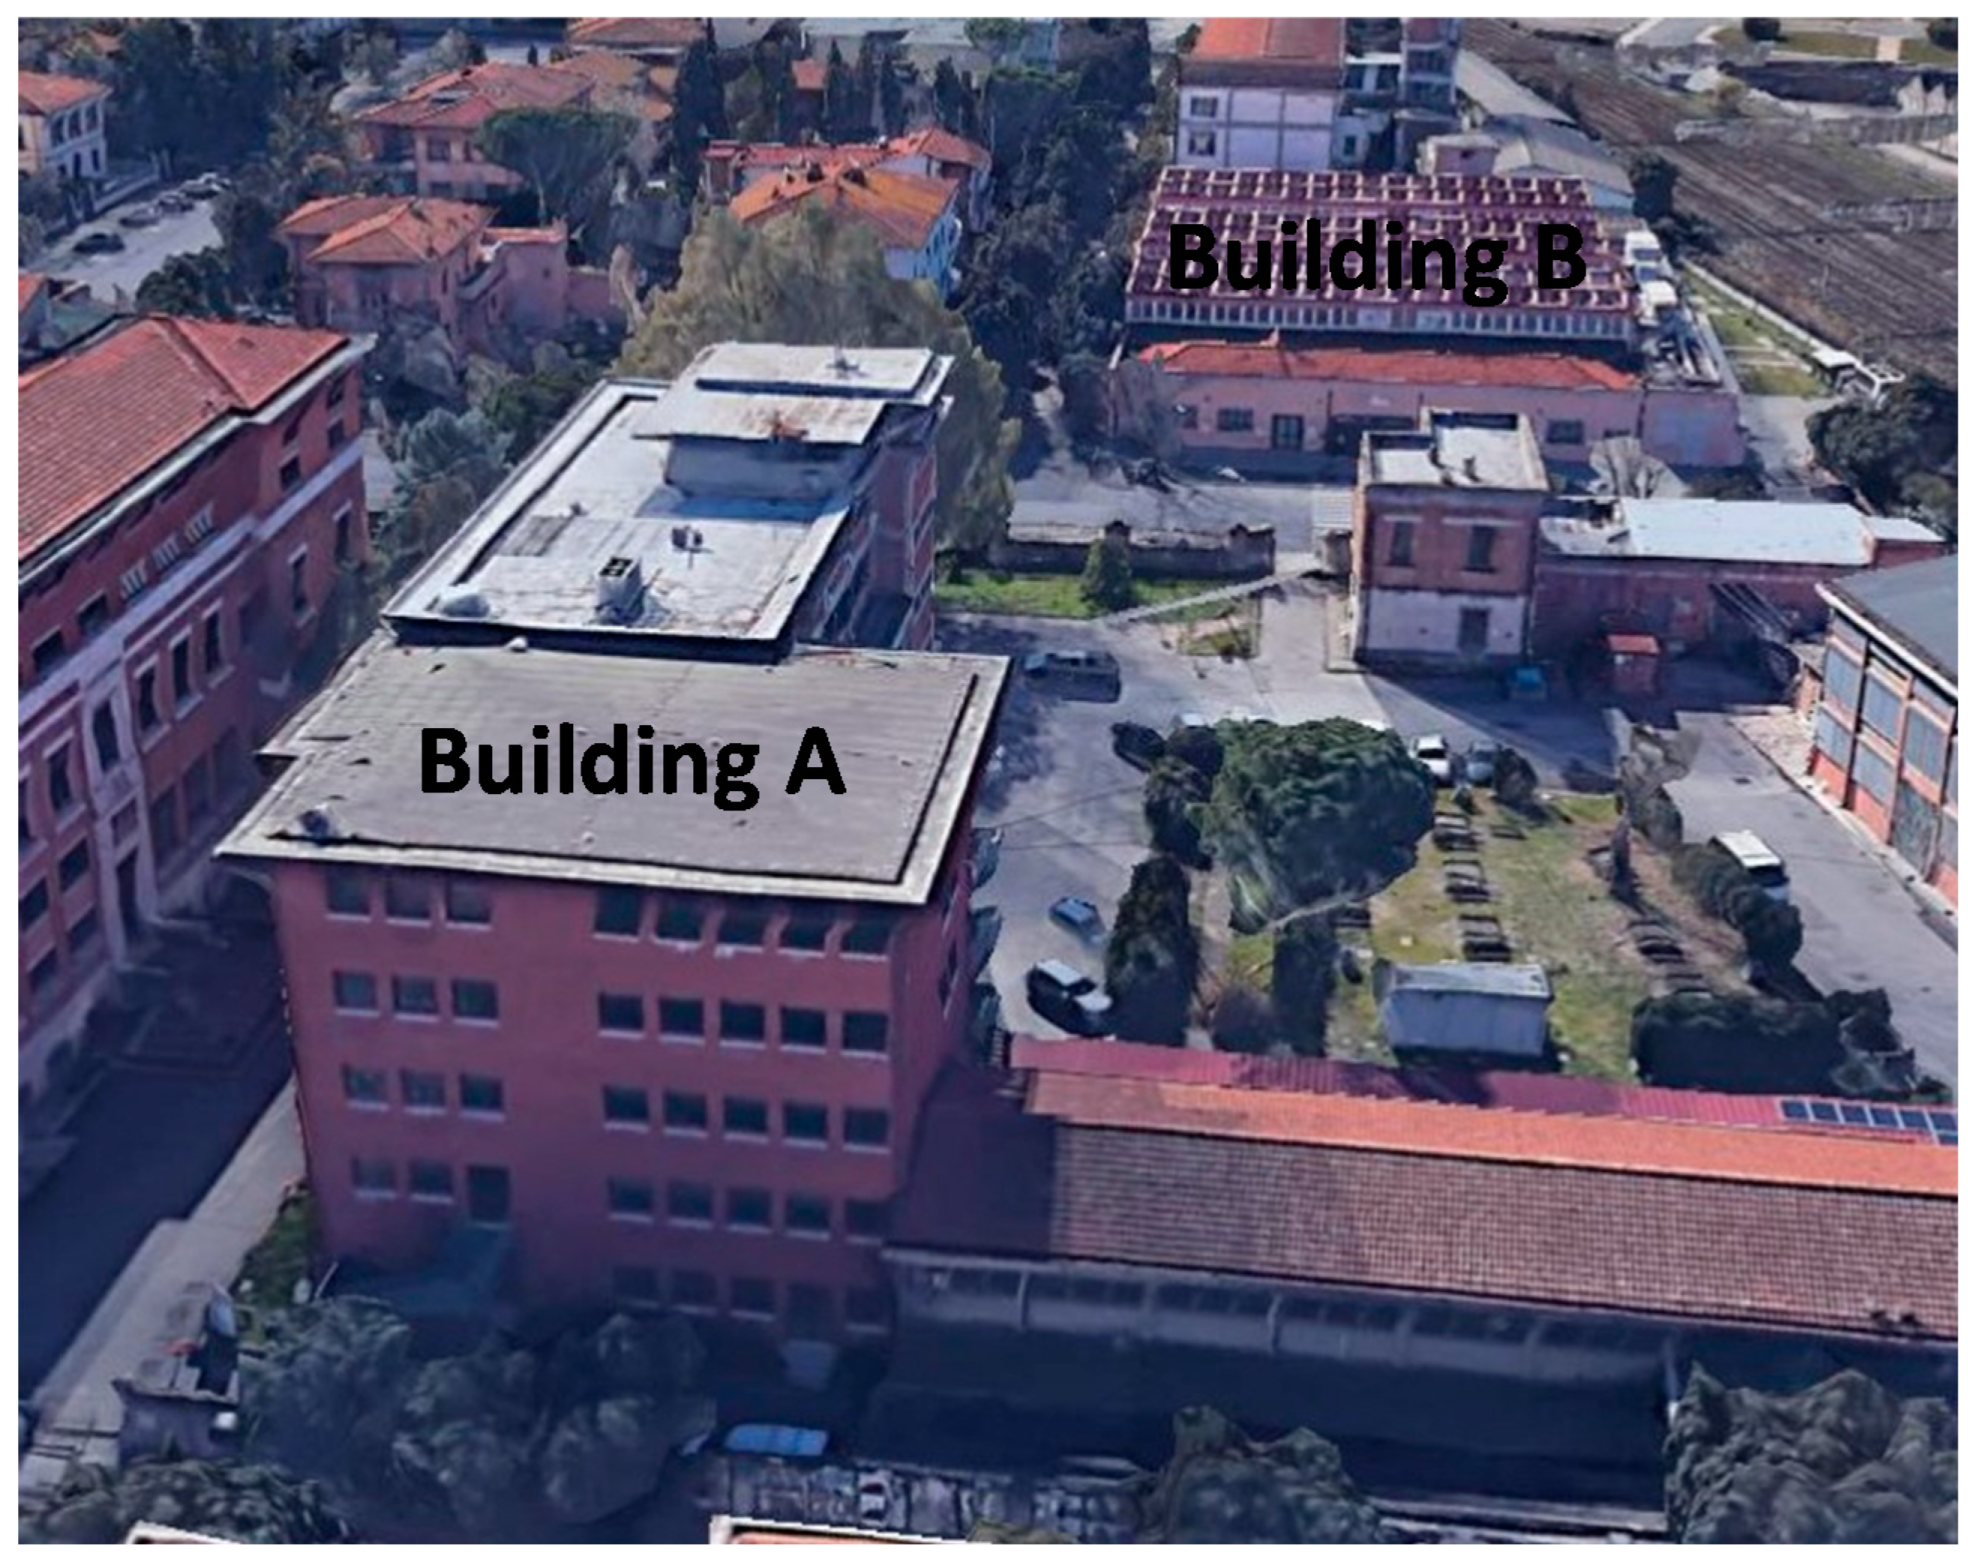
The methods proposed in the previous section, have been tested on two educational structures of different shape and characteristics. These are representative structures in Italian university buildings in recent years as they are centers dedicated only to student activities such as lessons, exams, and studies. Both buildings are in Pisa (1694 Heating Degree Days), and the evaluations considered in the present paper are referred to this specific climatic condition.
The first one, Building A, has five different levels, a total floor surface of about 1560 m2 and a gross volume of approximately 6200 m3, of which about 4540 m3 are occupied by classrooms. A total number of 12 classrooms are present in the building: the size ranges from 18–25 seats (3 classrooms), 36–38 seats (3 classrooms), 65–72 places (3 classrooms), 160 places (2 classrooms) up to 180 places (1 classroom).
The external building surface is approximately 2000 m2 (both opaque and glazed), corresponding to an aspect ratio area/volume of about 0.33 m−1. The glazed surface represents 16% of the total surface. The envelope is characterized by stone walls with face bricks and a reinforced concrete structure, which result in a thermal transmittance of about 1 W/(m2 K), while windows are double-glazed. At a full occupancy level, the number of students present inside the building is estimated in the number of 878.
The second structure, referred as Building B, is an old factory modified for educational purposes in 2004. The considered building has a floor area of about 2100 m
2 (35 m × 60 m), a total available volume of about m
3, and is oriented 24 degrees North. The external building area is approximately 5500 m
2 (both opaque and glazed), corresponding to an aspect ratio area/volume of about 0.53 m
−1. The type of structure is masonry wall with face bricks and reinforced concrete structure, which result in a thermal transmittance of about 1 W/(m
2 K). The saw-tooth roof includes 500 m
2 of single-glazed windows. In the building there are 10 classrooms. The classrooms have relatively high volumes and volume to area ratios. Five different sizes of classrooms are present: five with 100–110 available seats, two with a number of seats between 140 and 150, one with 196 seats, one with 208 seats, and the biggest one with 310 seats. At full occupancy, the number of students can approach the number of about 1500.
Figure 4 provides a photo in which the two buildings object of the study are represented.
After the pandemic crisis of COVID-19, several papers, as [
41], provided useful suggestions and guidelines for educational buildings, to make classrooms safe and sustainable indoor places. According to those analysis, the maximum occupancy is reduced for both the structures at a level of less than 50%.
Table 1 provides the main characteristics of the two structures. A HVAC with mechanical ventilation is used to control the indoor air parameters. The occupancy of the building is based on the real building schedule available from the pre-pandemic year 2019, introducing the above-mentioned reduction coefficient of 50%. A randomization coefficient based on a normal distribution ranging from 50% to 100% has been introduced to simulate the random presence or absence of students during classes, to obtain a realistic occupancy profile. The same analysis can be based on real time dynamic monitoring of the building occupancy, as considered in some recent studies, using Internet of Things (IoT) prototypes, as [
15,
42] or with smart and low-cost sensing control, [
43,
44].
5. Results Obtained by the Application of the Different Control Strategies
In this section the methodology exposed in
Section 2 and
Section 3 is tested with application to the two buildings described in
Section 4. The results obtained in terms of energy consumption and of energy intensity are presented with specific attention to the energy savings achievable with the HVAC control strategies, reported in
Figure 1. The results can be compared with those available in many studies in the literature, as [
45,
46].
Before analyzing the achieved energy results, some further notes about the building energy flows for the two building types are enclosed. The analysis of the different thermal behavior and energy flows of the two buildings is an essential task for highlighting the consequences of their geometrical differences. Only when significant differences are outlined, the analysis of the different control strategies can lead to the identification of energy savings patterns which apply to such different buildings.
5.1. Building Thermal Behavior and Energy Flows
In
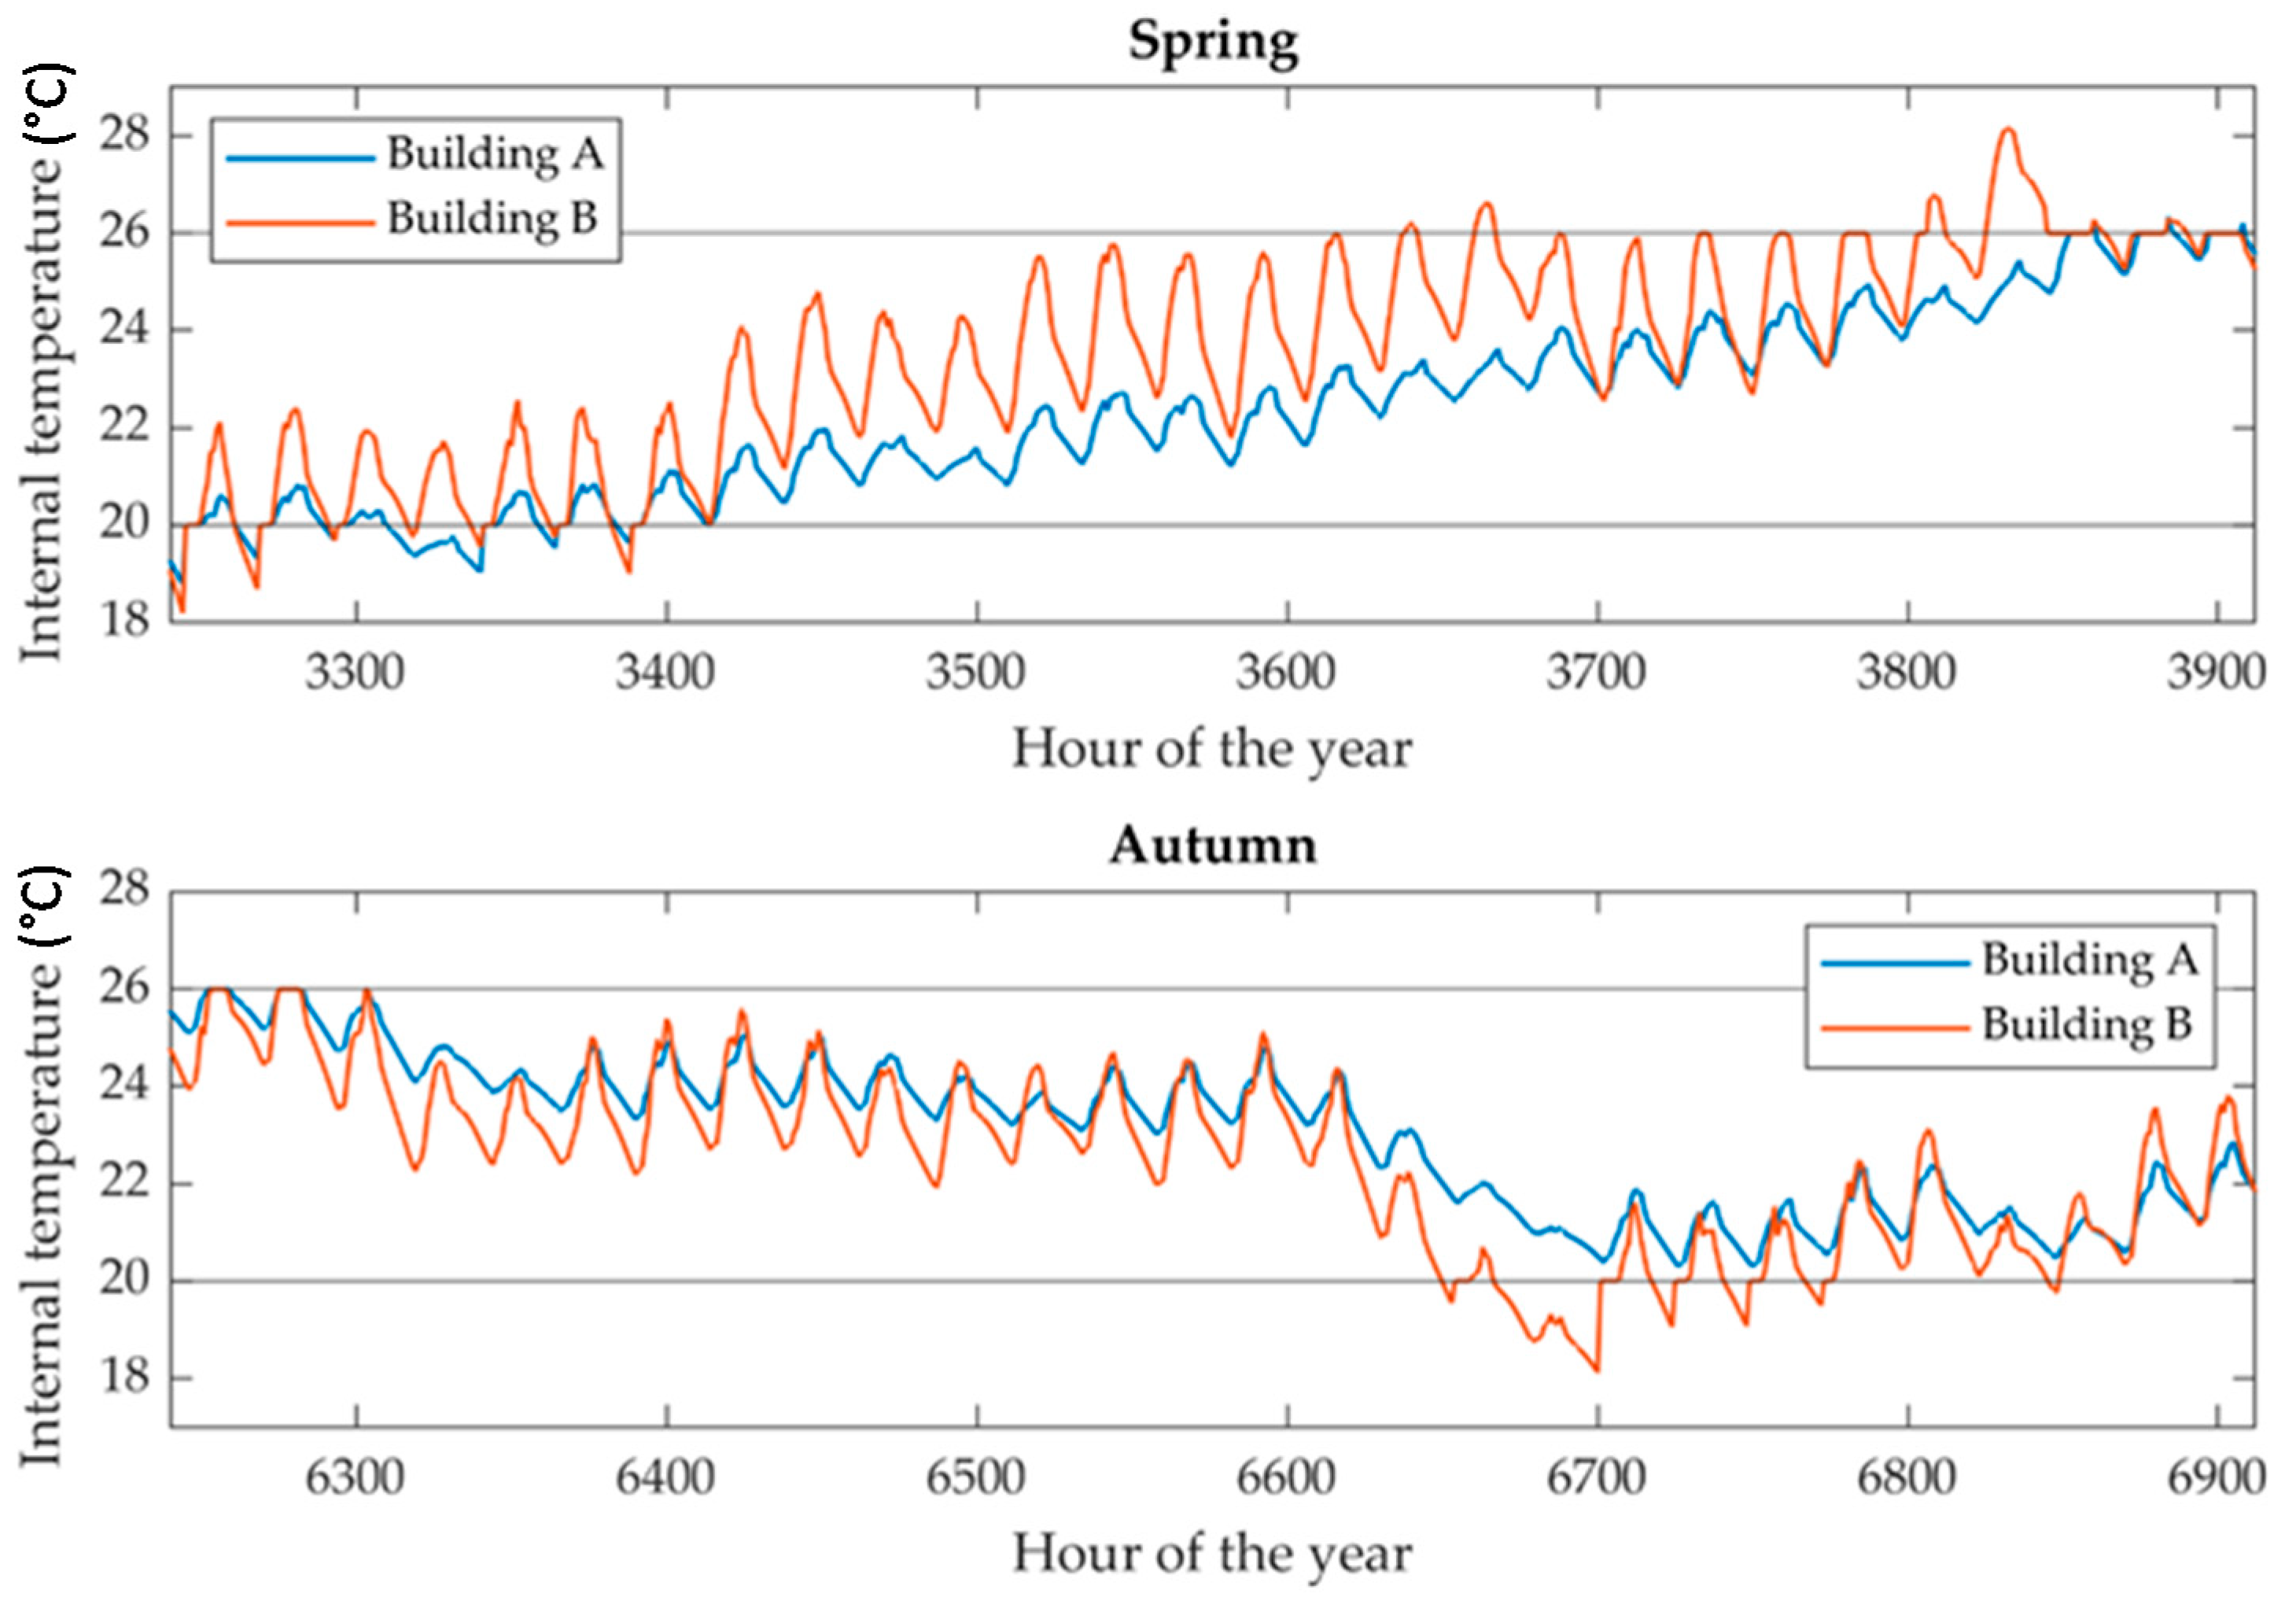
Figure 5 the internal temperature profiles for the two buildings are represented for two consecutive four-weeks periods belonging respectively to spring season (hours from 3250 to 3900) and autumn (hours from 6250 to 6900).
In particular, these periods correspond to the weeks from May 15 to June 11 and from September 18 to October 15. Concerning the buildings’ schedule, they correspond to opening days 104 to 128 and 185 to 209, respectively. From the spring period, it is clear how Building A is the first building which requires energy for cooling due to the reaching of the 26 °C threshold much earlier than Building B.
From the autumn period, it is clear how Building A is the first building which requires energy for heating due to the reaching of the 20 °C threshold in a moment in which the temperature of Building B is still above that limit. Furthermore, the different thermal inertia of the two buildings can be seen in the greater oscillations of Building B temperature, compared to that of Building A. The different thermal behavior affects the building energy demand, as can be seen in
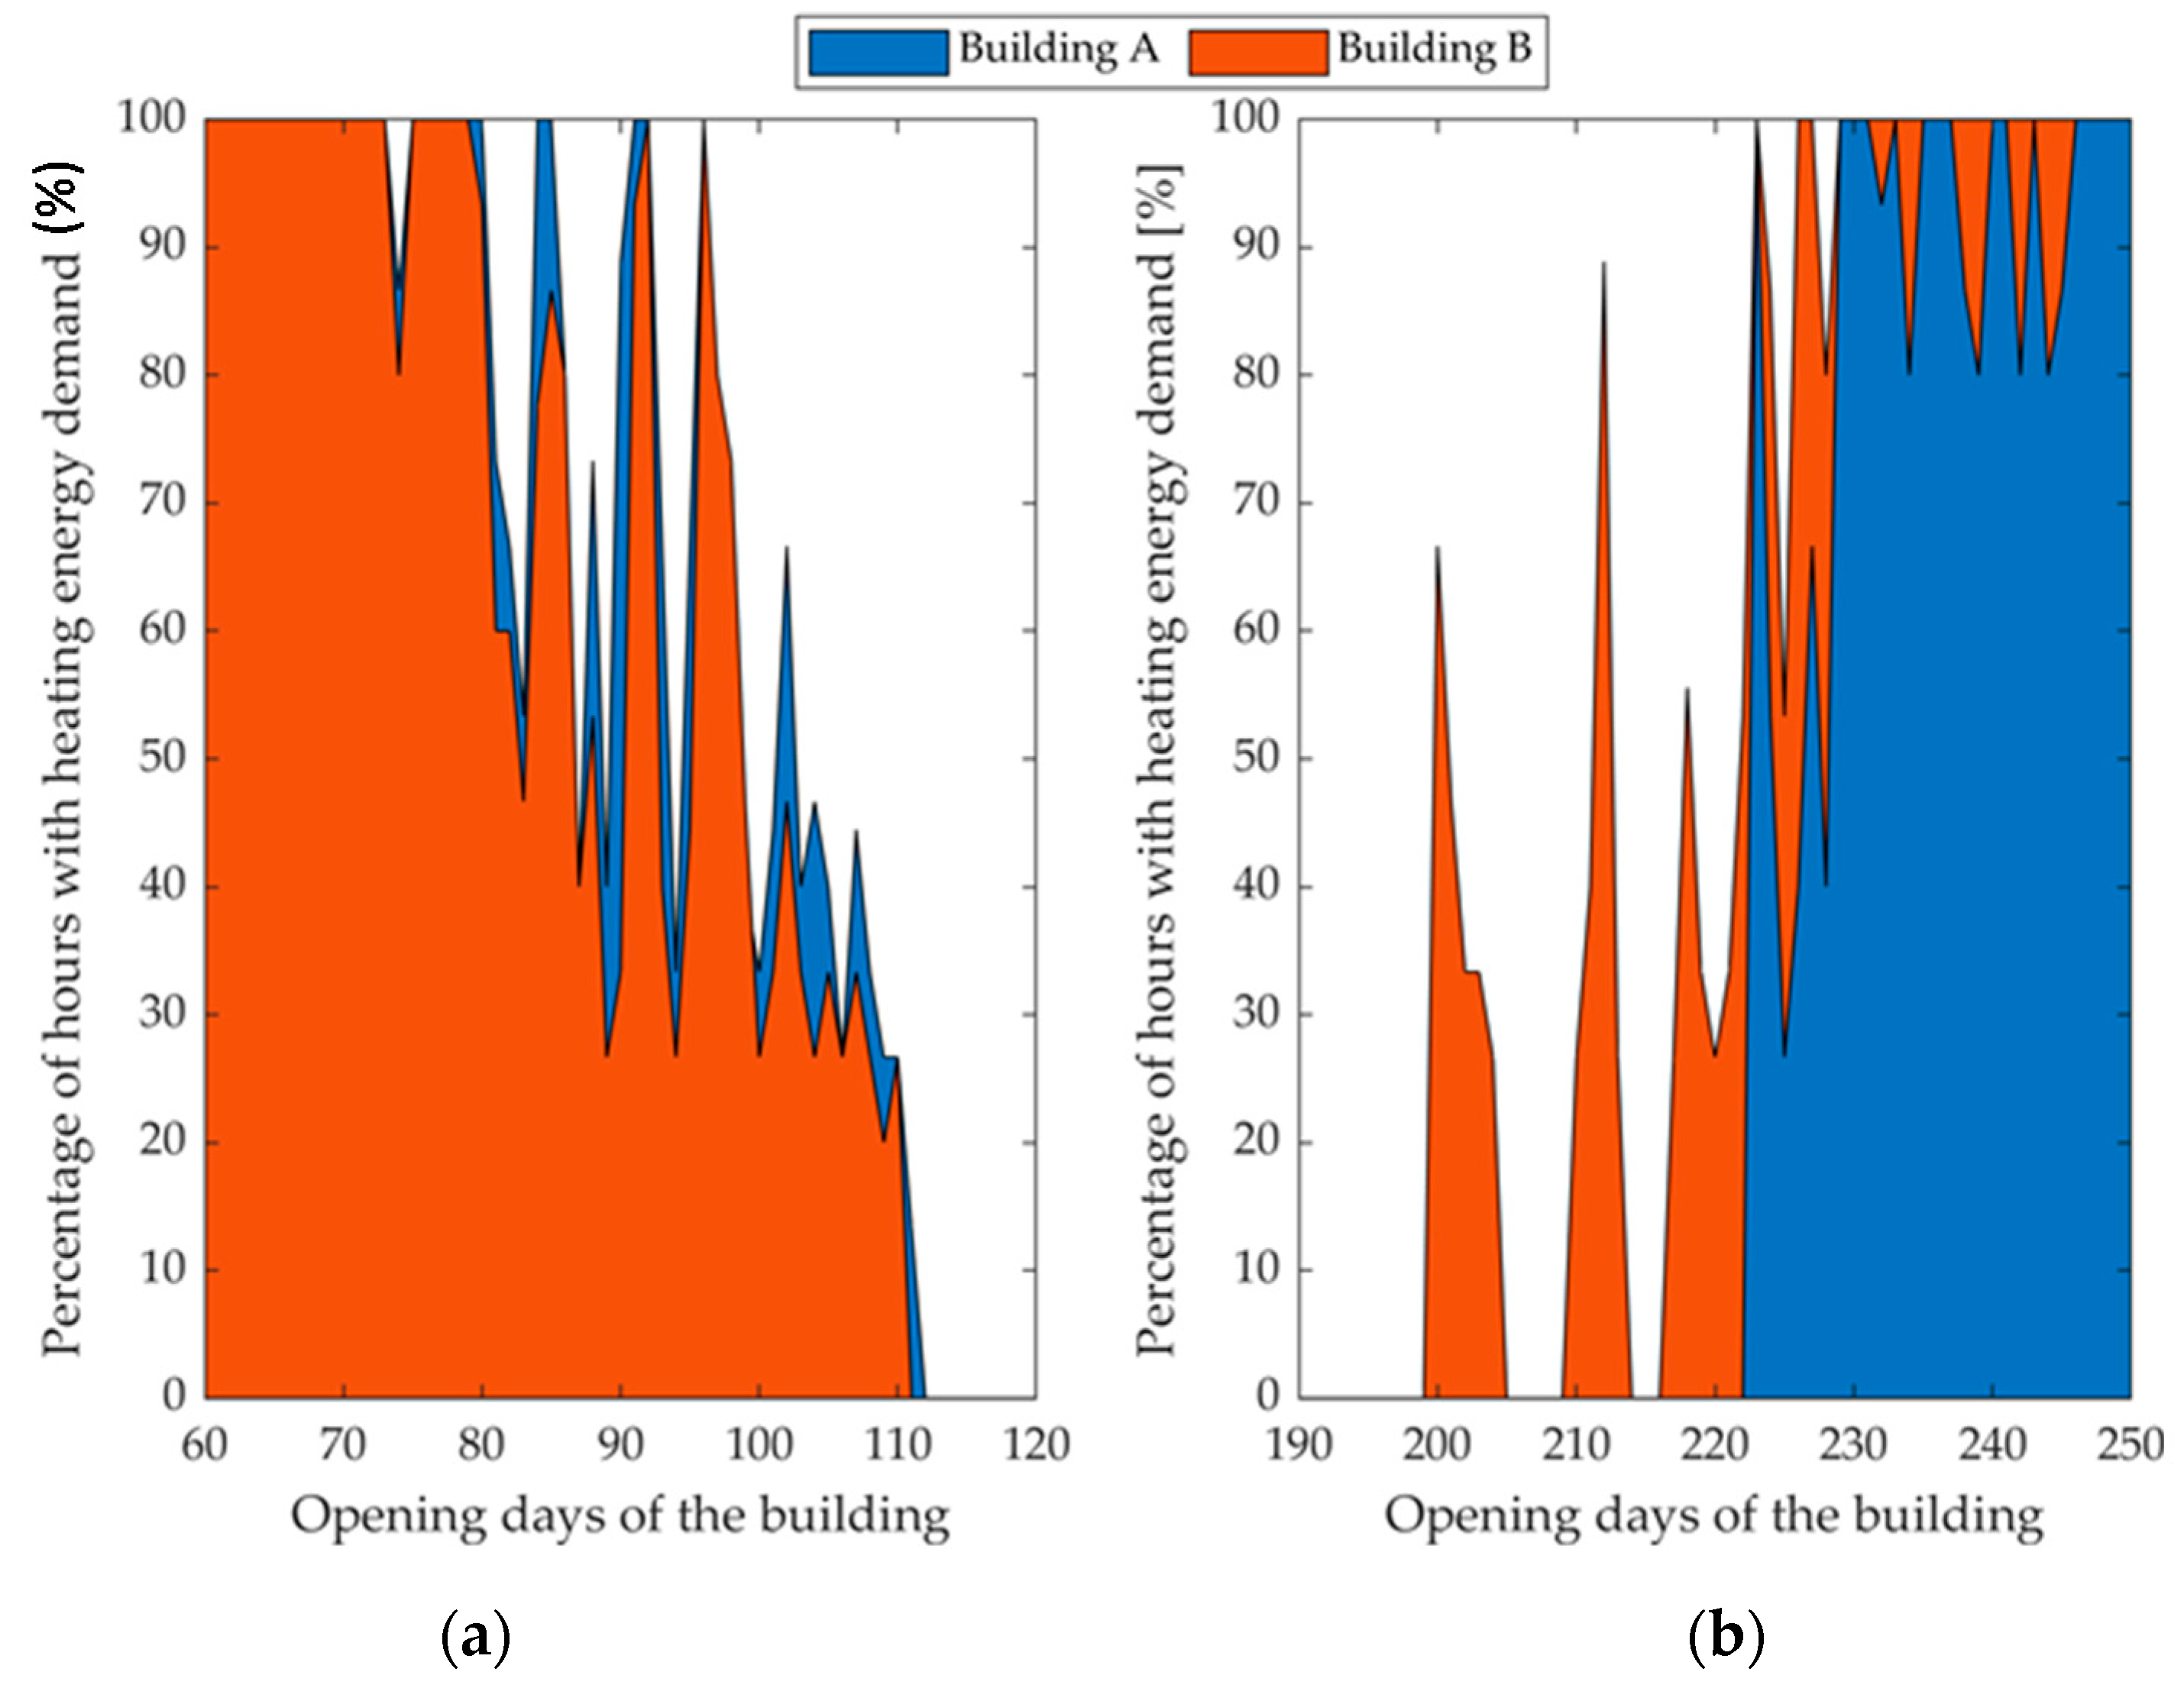
Figure 5 which shows the normalized hours of the envelope energy demand for the two mid-seasons. Concerning
Figure 6a which regards the transition from the cold season to the hot one (progressive opening day of the year from 60, corresponding to the beginning of March to 120, corresponding to beginning of May), it is shown how Building B reacts faster than Building A and requires a lower number of heating hours during mid-season days. Likewise, concerning
Figure 6b which regards the transition from the hot season to the cold one (progressive day of the year from 200, corresponding to the end of September, to 250, corresponding to the beginning of December), Building B reacts faster than Building A and requires the switch-on of the system more than 20 days earlier.
The greater difference in the autumn period is because in August the buildings remain closed and therefore the temperature of the envelope and of the partition walls increase in an uncontrolled way. Consequently, Building A, which has more thermal inertia, exploits this stored energy not requiring heating to maintain internal temperature above the 20 °C threshold for a longer period.
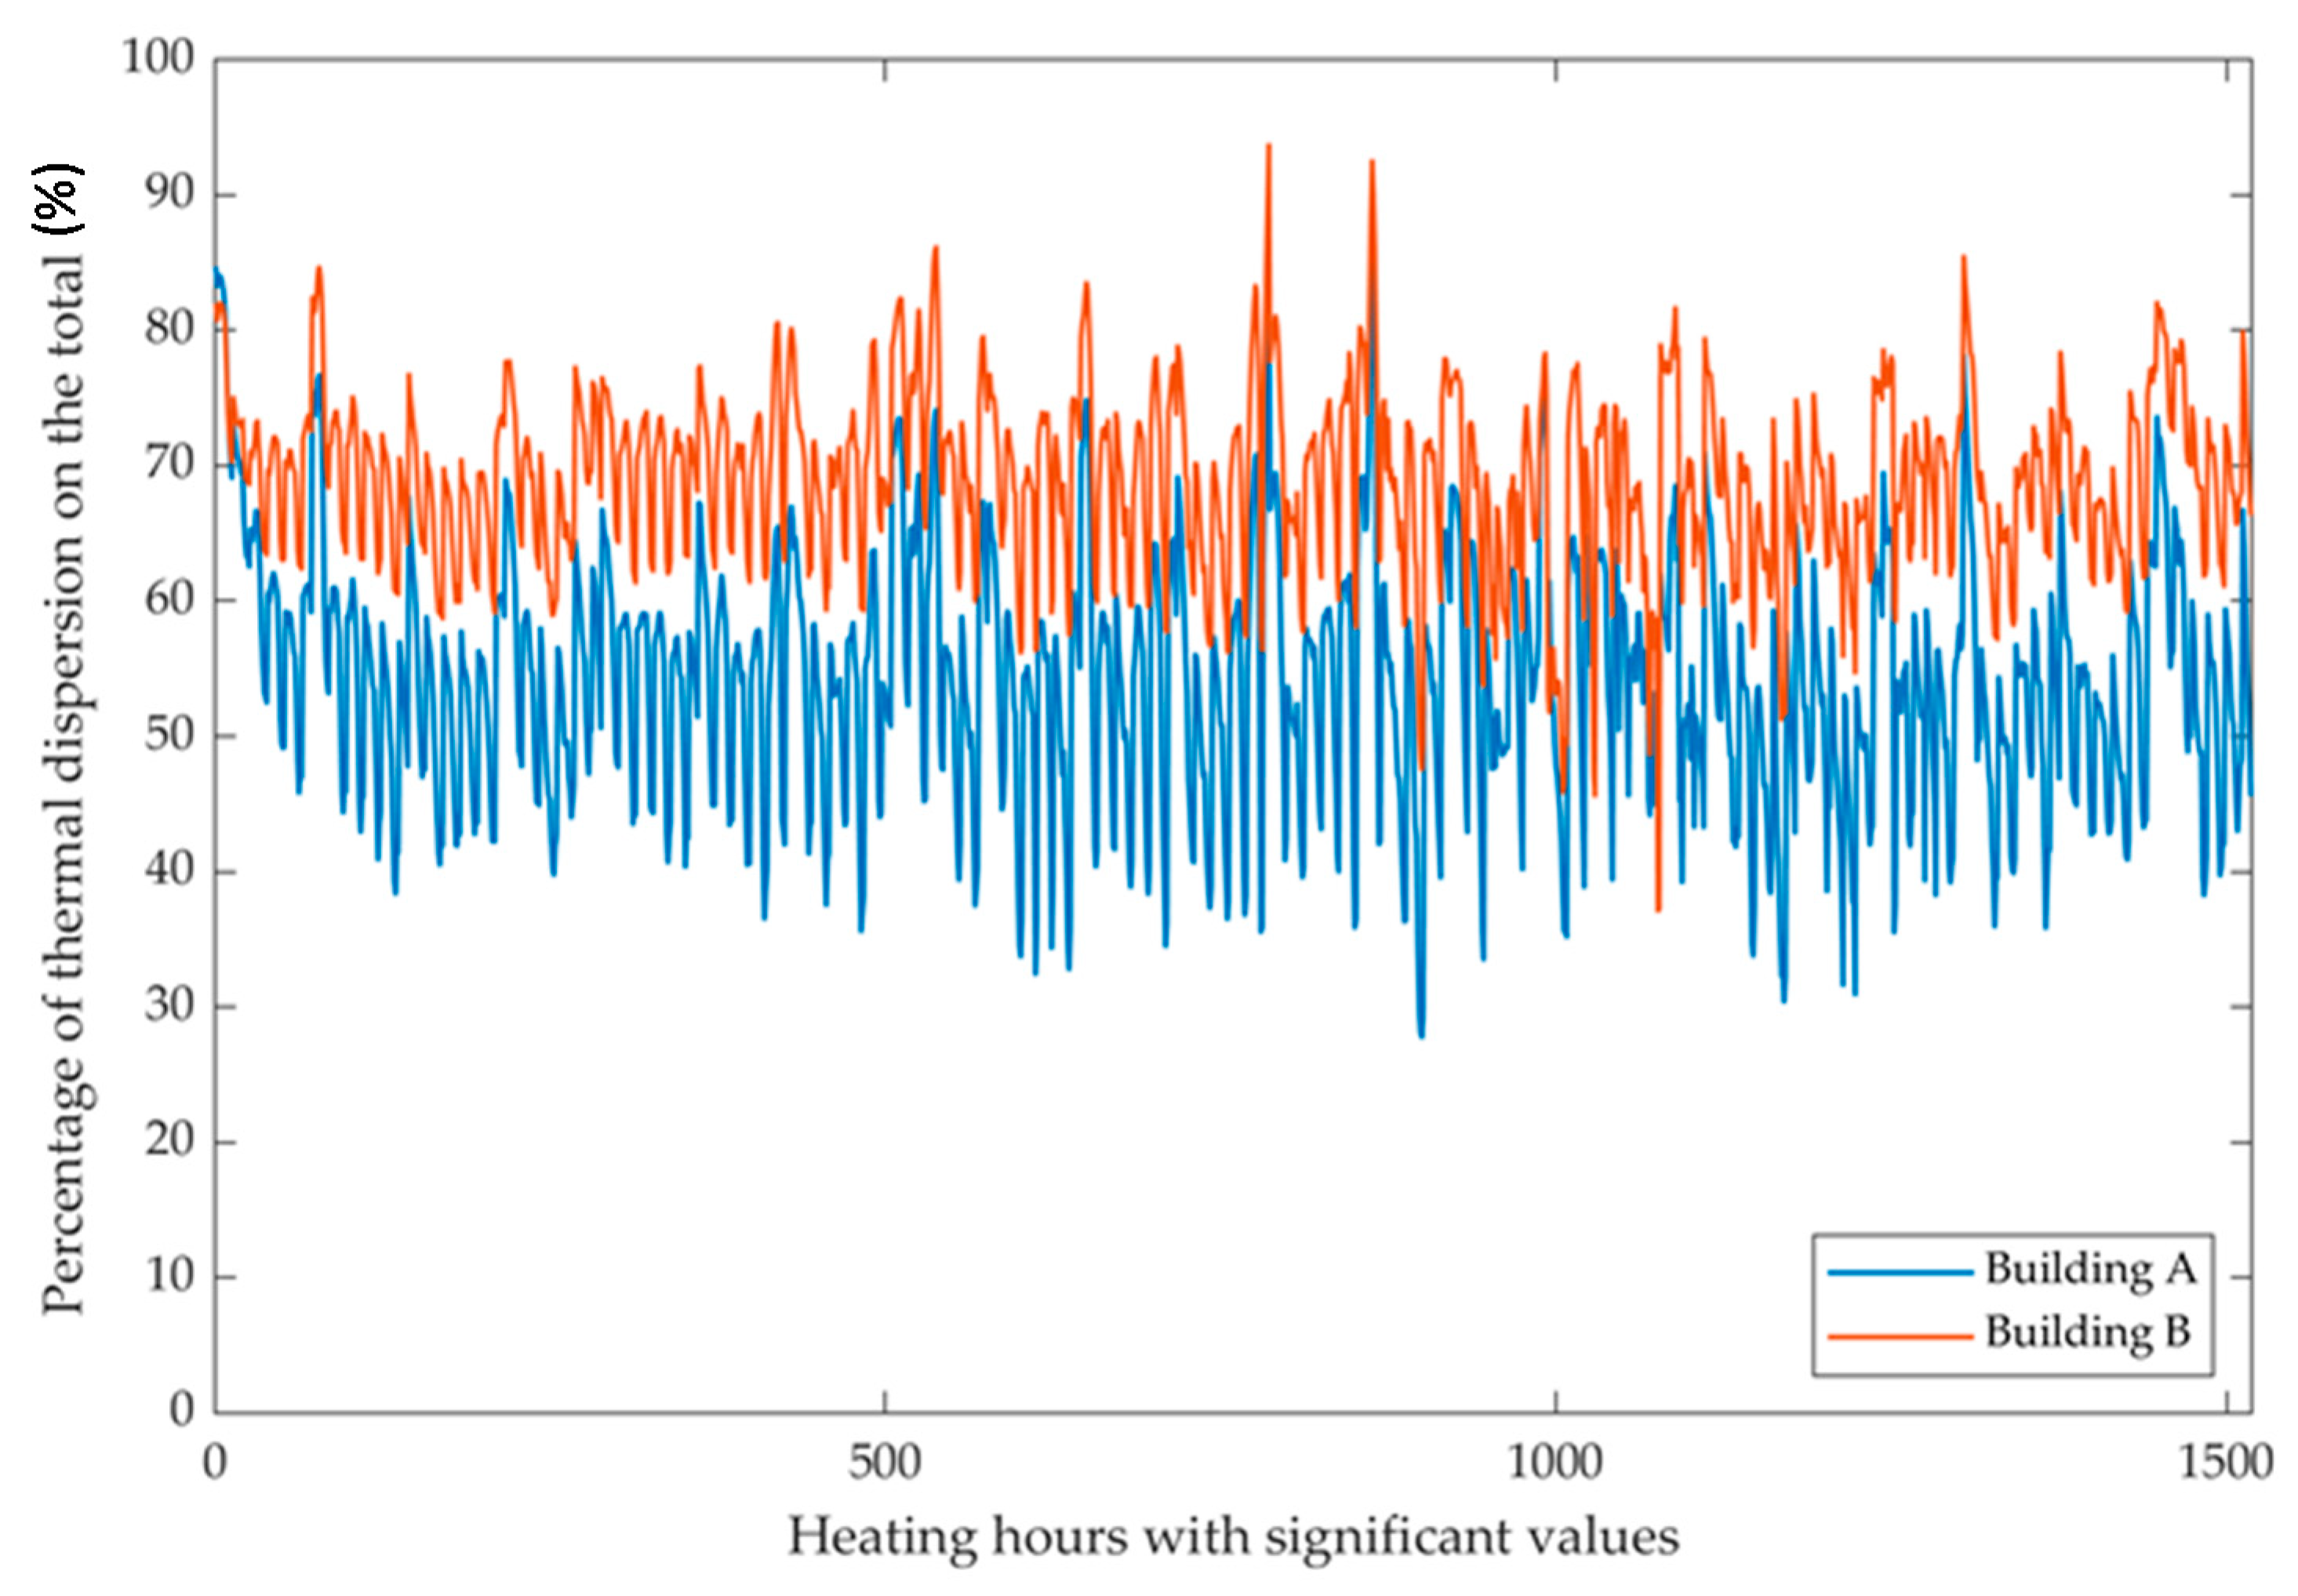
The main consequence of a different shape factor of the two buildings on the building energy flows is represented by the ratio between thermal dispersions and ventilation thermal losses. While the ventilation thermal losses are linked to the volume of the building, the thermal dispersions are linked to its surface; this is clearly highly influenced by the building shape factor. Here, for ventilation thermal losses, the energy needed to bring the renewal air flow rate to ambient condition is considered. These ventilation thermal losses do not represent an envelope energy demand but rather a ventilation energy demand due to IAQ requirements. The shares of the thermal dispersions on the sum of thermal dispersions and ventilation thermal losses during heating hours are presented in
Figure 7. To avoid outliers,
Figure 7 refers only to hours in which, for both buildings, the thermal dispersions and the ventilation energy demands are greater than 5% of their maximum values.
As it can be clearly seen with a careful analysis of the figure, in Building A, which is characterized by a lower shape factor, the thermal dispersion shares oscillate between 28% and 89% of the total, while in Building B the thermal dispersion shares mainly oscillate between 37% and 94%. In particular, the values for Building A have a mean of 54.2% with a standard deviation of 9.4%, while the values for Building B have a mean of 69.1% with a standard deviation of 6.7%. Building A values are always lower compared to Building B ones, as expected because of the lower shape factor, and are also characterized by a lower variability due to the higher inertia of the partition walls, which smooths the trend.
The oscillations of the two trends follow the same period for the two buildings, having the same typology of envelope. The different thermal capacity of the building results in a different standard deviation of the two trends.
The difference in the proportion of the energy demands of the building will be reflected in the HVAC energy consumption proportion: Building A which has a higher share of thermal dispersions will have total energy consumptions more oriented towards heating, vice versa Building B will have its total energy consumptions slightly more oriented towards fans energy consumption.
5.2. HVAC System Energy Consumption with the Different Control Strategies
Moving from the building thermal demands, it is important to assess the consequences that the observed differences have on the energy consumptions of the two buildings, and on the different energy saving achieved with the various ECM combinations. In
Table 2 the energy intensity per unit area and per unit volume for the benchmark scenario (S1) are reported. It is shown how the indicator per unit area is greater for Building B, while the indicator per unit volume is greater for Building A.
This is due to the different height of the two buildings, which emphasizes the need for a thorough characterization of the analyzed building, when presenting the obtained results. In fact, using an indicator instead of the other could make a building look better than another or vice-versa.
Table 3 provides the composition of the primary energy consumption referring to a basic HVAC control strategy, with boiler and without controlled ventilation. It is shown how in Building A, in which the thermal dispersions are reduced, the heating consumption share is lower than 60%, while in Building B it is almost 70%. Since the HR additional fan energy consumption is linked with ventilation losses, it is shown how in Building A this represent a higher value.
Focusing on the main scope of the study that is the comparison between the energy savings that can be achieved in the different cases correspondent to the control strategies provided in
Figure 1; the results are presented in
Figure 8.
Figure 8 provides the normalized value of the energy consumption with respect to the one achievable with the reference control strategy S1. So that referring to control strategies S2 and S3 for building A reduction of energy use of 30% or 62% is possible. Better results can be obtained referring to the use of HP as heating system, obtaining reduction of 33%, 58% and 76%, using control strategies from S4 to S6. Similar results can be obtained in the application to Building B.
As it can be appreciated from a careful analysis of
Figure 8, the energy saving achievable with HP and the more complete control strategy, namely S6, which is characterized by the application of all the ECMs analyzed, are quite similar and lay between 75–80% with a slightly higher value for Building A compared to Building B. This is really an interesting result, because in general, electric-driven heat pumps are one of the most encouraging systems for civil sector energy consumption, especially with reference to the countries with a high contribution of renewable energy sources in electricity generation mix, as well evidenced in recent studies, as [
47].
Analyzing the ventilation-related measures, which can be observed thanks to the comparison between the three control strategies correlated with the use of boiler, in particular strategies S1, S2 and S3, it is shown how the results are slightly better for Building A, which achieves energy savings of 30% and 62% compared to 16% and 57% of Building B. This is due to a greater importance of the ventilation on the overall energy consumption for Building A. The greater difference is ascribed to the use of the VAV system, which shows its importance even in combination with the use of HP as heating system (strategy S5 compared to S4) and by DCV.
Concerning the specific operation of the HVAC system, during the winter period, the highest HVAC load is in early morning hours due to the low external temperatures and switching off the system at nighttime; the reduction is thus more significant in the subsequent hours in which the reduced load can be satisfied with a lower supply flow rate. Vice versa, in summer period, the highest HVAC load occurs during mid-day hours due to the high external temperature and solar radiation; the reduction is thus more significant during early morning hours.
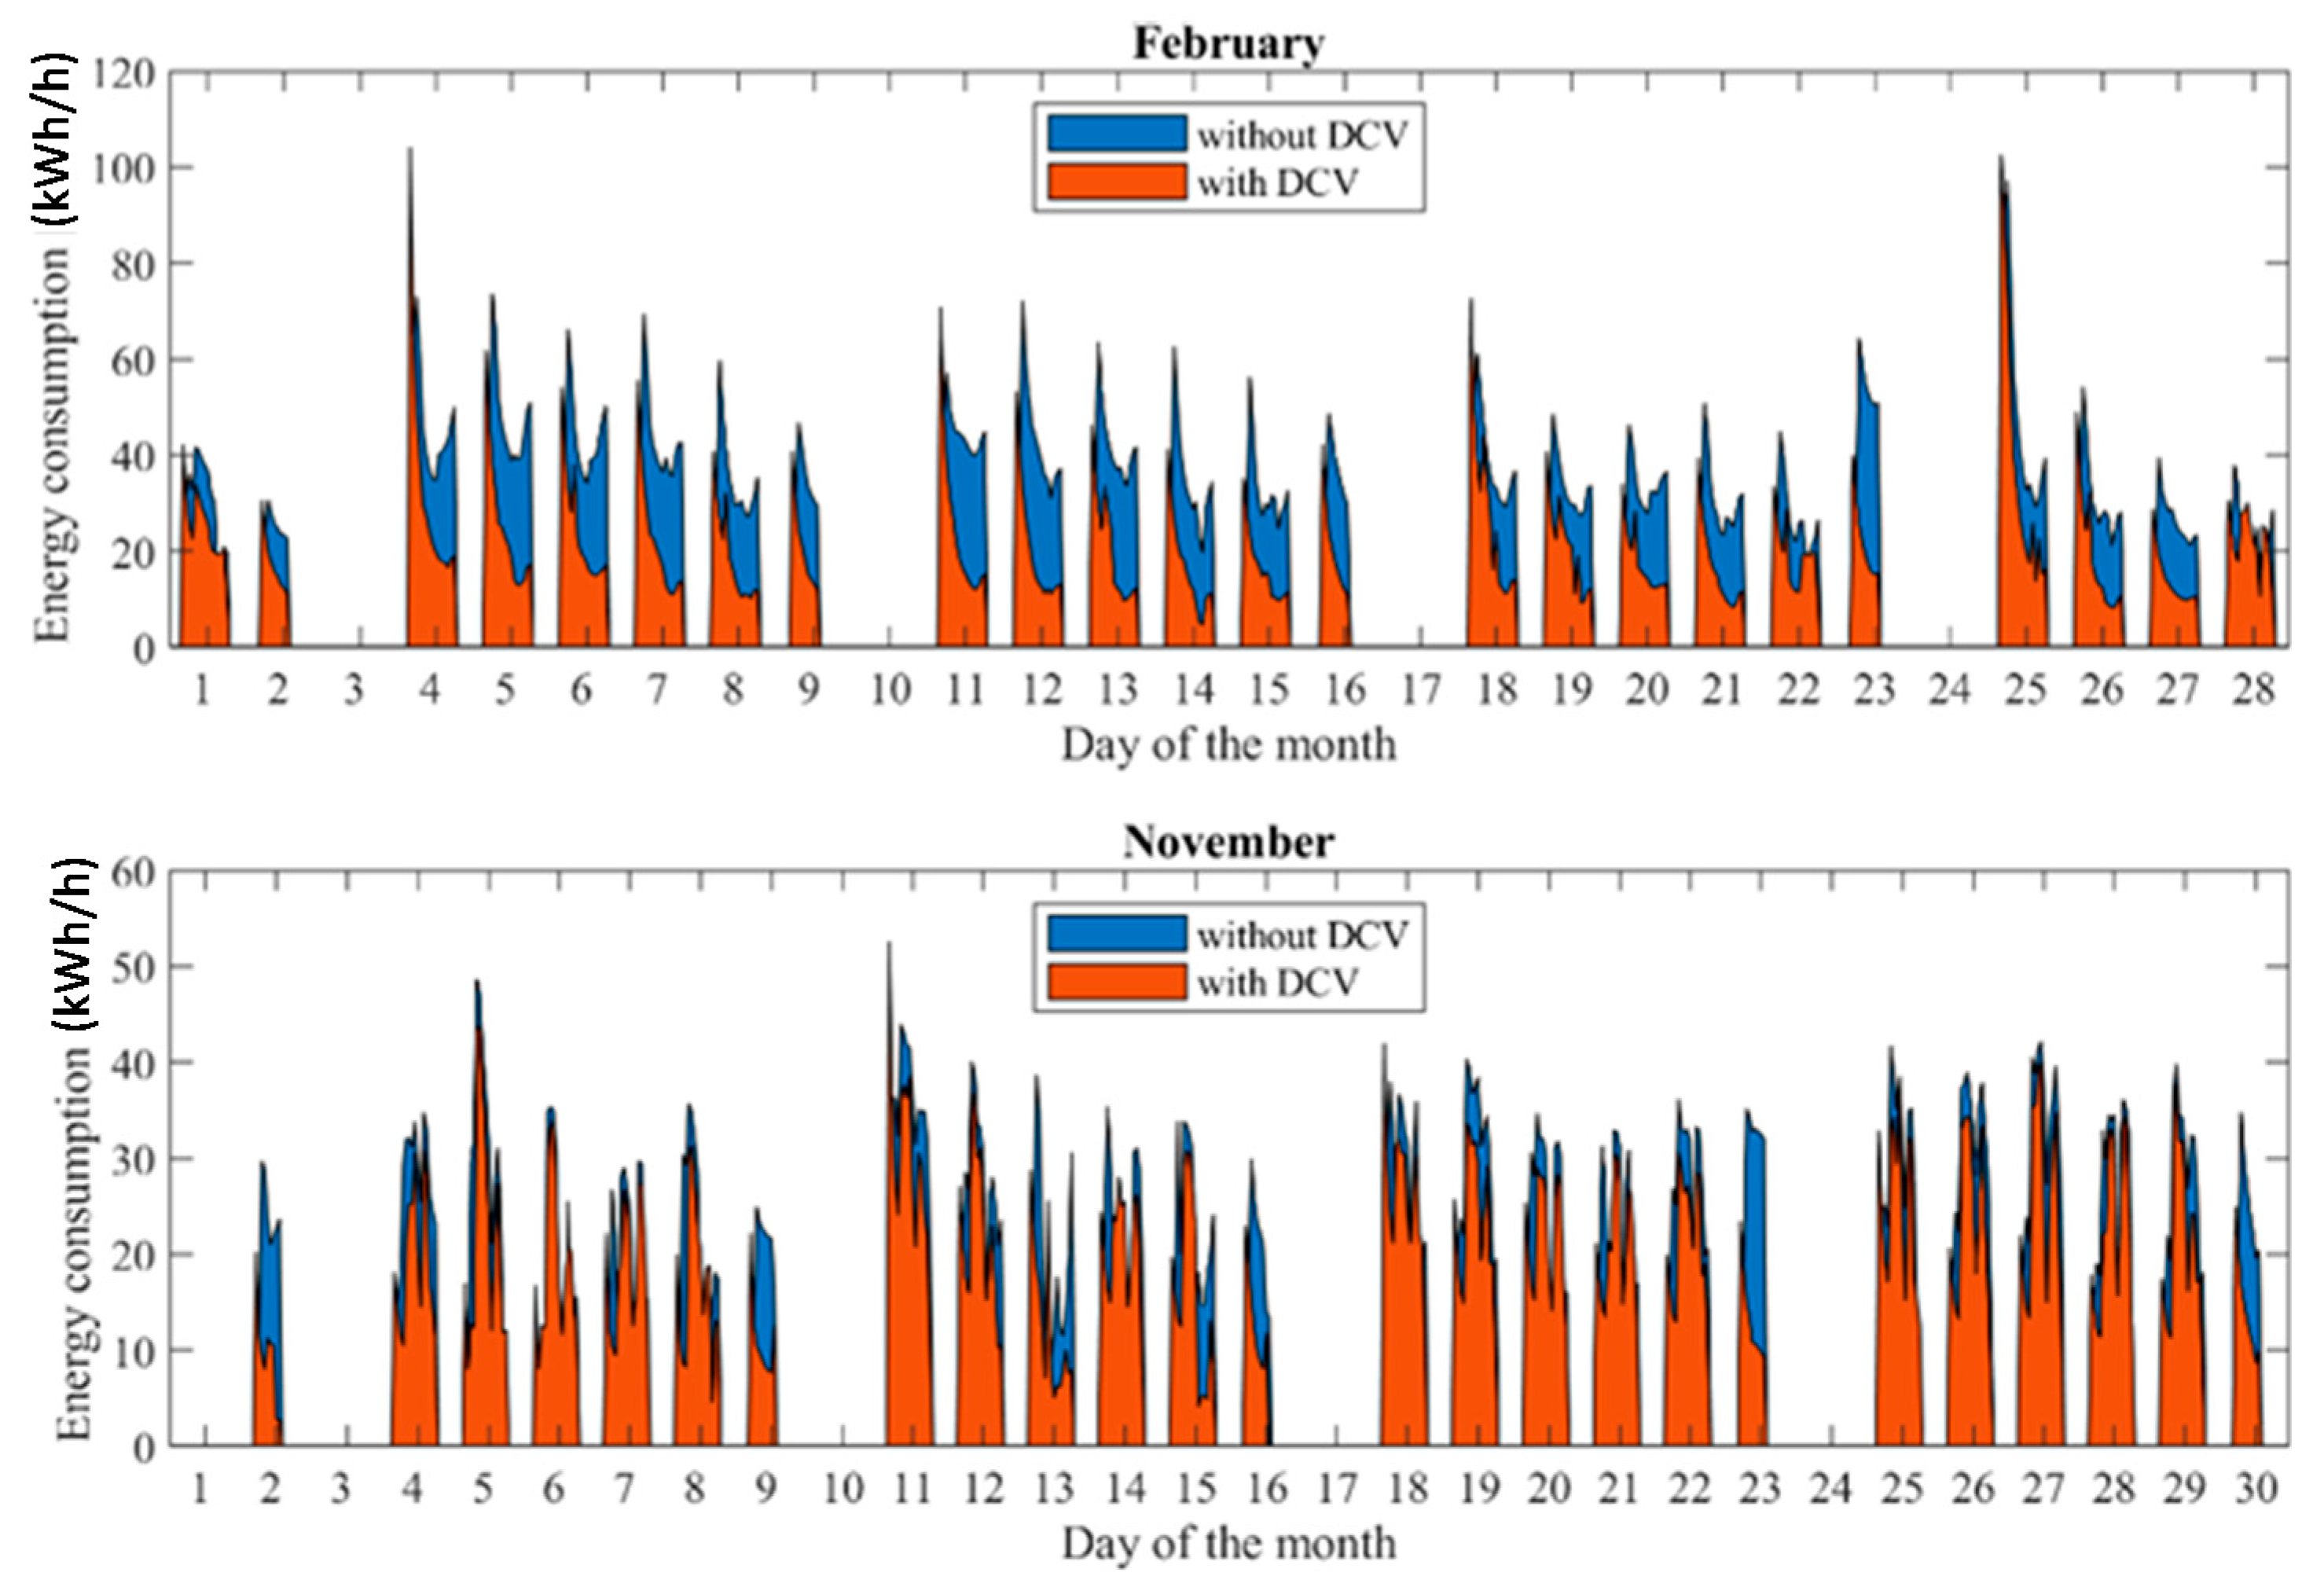
The energy savings provided by DCV come from the renewal flow rate decrease which reduces the fans energy consumption but also the heating or cooling consumption. The higher reductions occur when no occupants are present in the building, as for the case of Saturdays or lunch break.
A comparison between the hourly energy consumption of the HVAC system with and without DCV for two specific months, in particular February and November for one of the two buildings analyzed (building A) is provided in
Figure 9.
Analyzing the importance of the HP as heating system as substitute of a conventional boiler, it can be remarked how this measure is important in both the buildings, even if it appears to be more important in Building B due to the higher share of energy consumption for heating. In Building A, the VAV system and the HP show comparable energy savings, while in Building B HP outperforms the VAV system with a greater energy saving.
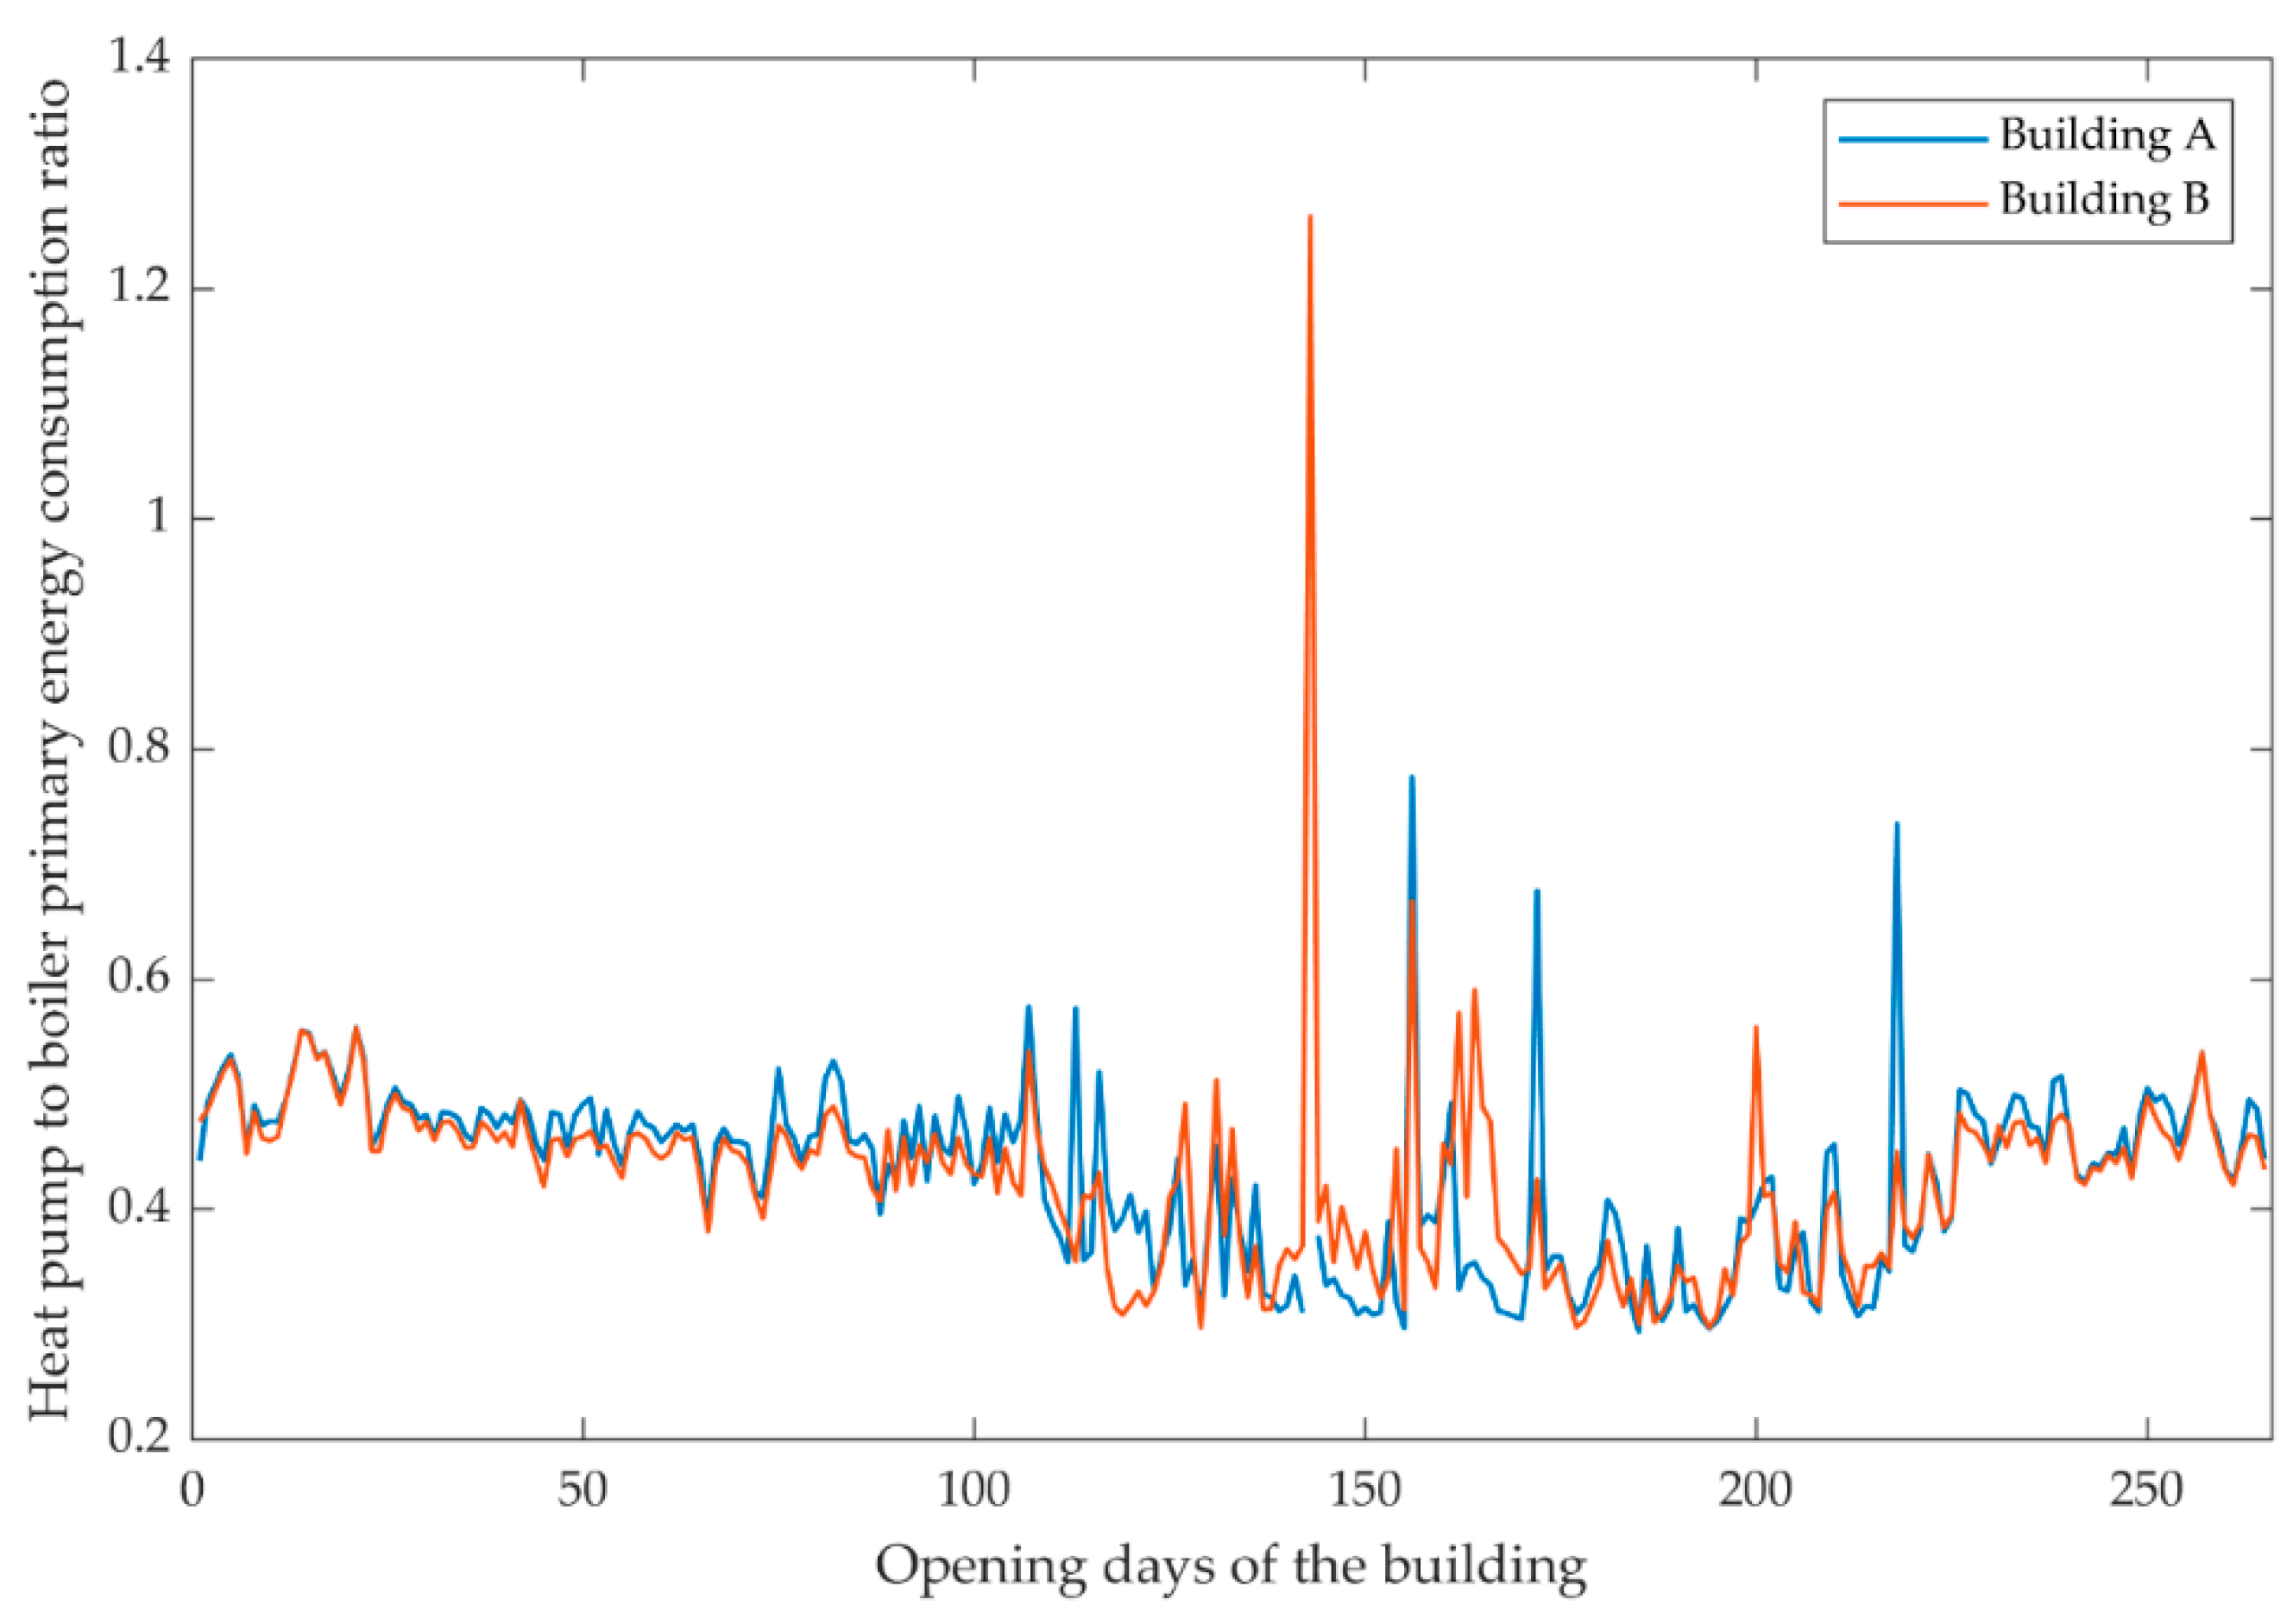
Figure 10 shows the daily ratio between the primary energy consumption of the HP and that of the boiler, referring to the comparison between the two basic control strategies introduced in
Figure 1, S1 and S4. It shows how despite the primary energy conversion factor of electricity, which is almost the double of that of natural gas, the primary energy consumption of the HP stands at about 50% of that of the boiler for most of the time. The analysis shows that the benefits resulting from the application of HP can be found in every period of the year, and that the penalization due to climatic conditions or part-load operation is greatly overcome by the improved performance compared to the case in which a fossil fuel boiler is used as heating system.
The application of the afore-mentioned control strategies in case of different buildings is certainly helpful for investigating whether the different features of the buildings influence the overall energy savings and vary the relative importance of each measure.
The comparison between a five-floor building and a single-floor one puts the shape factor at the center of the analysis; this influences the ratio between thermal dispersions, which depend on surface area, and ventilation energy demands, which depend on the volume. We can justify this considering that, in a more compact building the ventilation energy represents a greater share in the total energy demand for its reduced surface area under the same volume; in a less compact one, thermal dispersions represent a greater share in the total energy demand for its reduced volume under the same surface area. Furthermore, multi-floor buildings are characterized by a greater inertia due to the presence of more partition walls, which store thermal energy during daylight hours and the hot season and release it during nighttime and the cold season.
Anyway, the results obtained in the two cases under analysis clearly show that notwithstanding the apparent differences between the two buildings, concerning both the shape and other characteristics, the energy intensity is similar in the two cases and the improvements available in terms of energy consumption reduction with an optimal control of the HVAC system, are minimally dependent on the building shape.
5.3. Discussion about the Significance of the Resuts Obtained and Future Work
The aim of this work has been to analyze available control strategies aimed at the minimization of the energy consumption of large-scale buildings of public use, equipped with a central HVAC system thermally powered by heat pumps. The energy efficiency potential has been focused on the HVAC system and on the implementation of an energy-aware ventilation based on real-time occupancy monitoring, today possible using IoT or soft and smart sensors (mandatory in some buildings of public use) and on the use of HPs in substitution of conventional boilers. Even though the various elements are well considered in the literature, the objective of the work was to clearly highlight the relative impact of each single measure, as VAV, DCV, and the use of HPs for heating in place of conventional boilers, in the perspective of reducing the energy consumption and promoting further diffusion of renewable energies, as for example Building Integrated Photovoltaic (BIPV) systems. In fact, while boilers are often fueled by natural gas, HPs can be powered by electricity produced with RES.
The methodology has been applied to two representative educational buildings characterized by different geometrical characteristics. The results analyzed show the reduced importance of the shape of the building; for this reason, it is possible to think that the results can be extended to the whole sector of public buildings, with relevant advantages.
Moreover, in the specific context of the restart of activities after the COVID-19 pandemic, which has brought increased attention on the impact of shared buildings on human health, the significant potential of energy efficiency could be considered together with safeguarding human health. To this purpose, the potential of the energy efficiency measures regarding the HVAC system must be joined with the safeguard of occupants’ health and comfort, considering the new paradigm for shared building activity that leads to higher energy consumption due to increased air renewal and is in contrast with the energy efficiency targets. Hence, it will be important to explore the potentialities of a multi-objective optimization for the determination of the HVAC optimal control, considering the conflicting objectives, as discussed by the authors of the present paper in [
9].
6. Conclusions
In the paper a set of control measures for HVAC systems operating in public buildings with variable occupancy profile have been tested with the aim of evaluating the reduction of the energy intensity of the buildings and improve the overall energy performance of the HVAC systems. The concept is to test the use of relatively simple solutions, which could be easily implemented in HVAC system controls, instead of considering complex modifications in the control systems and the use of specific predictive and adaptive strategies.
In particular, the paper has analyzed the energy consumption obtainable when operating the HVAC systems alternatively with Boiler or HP as heating systems, with three different control strategies at different levels of complexity. The strategies have been tested with reference to two different cases, representing typical educational buildings for universities of different shape.
Among the different elements considered in the analysis, we can state that the installation of HP as heating system in substitution of a boiler is surely beneficial, in terms of primary energy consumption. The energy savings achievable just with the application of HP can be of more than 30%. Another relevant element permitting important additional energy saving is the application of DCV strategy, based on the estimation of the effective occupancy of the buildings, possible using direct and indirect detection methods. The combination of using HP and DCV, in case of the tested buildings, made possible to obtain energy saving up to 75% with respect to those available with conventional HVAC (heating system represented by a boiler and no controlled ventilation). Since many technologies for occupants’ monitoring are currently available on the market, its large-scale deployment for HVAC control and the consequent energy saving seems to be important.
The results obtained are really promising, showing that, in case of buildings located in typical central Italy climatic conditions, the use of HPs as thermal generator instead and the use of specific control strategies such as Demand Controlled Ventilation, allows to reduce the energy intensity up to 75% compared to the baseline case.
As final remark, it seems interesting to state that, as shown in the paper, the measures proposed for increasing the efficiency of the HVAC system and for reducing the energy intensity of the buildings are only marginally dependent on the type of structure under analysis. Really similar results are obtained for the two analyzed buildings, which however are very different from each other, leading to a conclusion of generalization of the obtained results in terms of primary energy saving potential and consequent carbon footprint reduction. Nevertheless, the simulation results should be field-tested to verify whether the significance of the results can be extended to the whole sector of medium to large size public shared buildings.


