Article

Experimental Characterization of an Alkaline Electrolyser and a Compression System for Hydrogen Production and Storage

1
Merchant Ship Division, Fincantieri S.p.A., 34123 Trieste, Italy
2
Department of Engineering and Architecture, University of Trieste, 34127 Trieste, Italy
3
CEnergy, 34122 Trieste, Italy
*
Author to whom correspondence should be addressed.
Energies 2021, 14(17), 5347; https://doi.org/10.3390/en14175347
Submission received: 22 June 2021 / Revised: 30 July 2021 / Accepted: 18 August 2021 / Published: 27 August 2021
(This article belongs to the Special Issue Sustainable Technologies)

Abstract

:
Storing renewable energy in chemicals, like hydrogen, can bring various benefits like high energy density, seasonal storability, possible cost reduction of the final product, and the potential to let renewable power penetrate other markets and to overcome their intermittent availability. In the last year’s production of this gas from renewable energy sources via electrolysis has grown its reputation as one feasible solution to satisfy future zero-emission energy demand. To extend the exploitation of Renewable Energy Source (RES), small-scale conversion plants seem to be an interesting option. In view of a possible widespread adoption of these types of plants, the authors intend to present the experimental characterization of a small-scale hydrogen production and storage plant. The considered experimental plant is based on an alkaline electrolyser and an air-driven hydrogen compression and storage system. The results show that the hydrogen production-specific consumption is, on average, 77 kWh/kgH2. The hydrogen compressor energy requirement is, on average, 15 kWh/kgH2 (data referred to the driving compressed air). The value is higher than data found in literature (4.4–9.3 kWh/kgH2), but the difference can be attributed to the small size of the considered compressor and the choice to limit the compression stages.

1. Introduction

The transition from traditional carbon-based non-renewable energy sources to renewable ones is one of the most discussed and urgent themes of our times. Renewable energy installed power capacity in 2019 grew more than 200 GW, establishing a record for the largest increase of capacity deployed in a year [1]. Although over a five-year span Renewable Energy Sources (RES) represented less than one-third of the global energy growth, their installation rate was anyway higher than fossil fuel-based plants and nuclear ones. While renewable energy sources are progressing in the power generation sector, the transportation and industrial sectors continue to depend highly on traditional carbon-based fuels.
One of the main reasons for the difficulty of penetration of RES in these sectors is the fact that most of them, such as solar or wind, are not entirely and directly dispatchable as they are intermittent and therefore unable to meet load requirements, especially if highly variable. To overcome these obstacles, Energy Storage Systems (ESS) must be employed.
Among the different energy storage systems, storing renewable energy in chemicals, like hydrogen, can bring various benefits like high energy density, seasonal storability, possible cost reduction of the final product, and the potential to expand renewable power exploitation. In the last years, the production of this gas from renewable energy sources via electrolysis has grown its reputation as one feasible solution to satisfy future zero-emission energy demand. This production process is often called Power-to-Gas [2,3] and is considered the most cost-efficient solution for long-term energy storage [4]. It is beneficial because it can connect electrical power and gas networks and can help the diffusion of zero-emission energy sources in sectors like heat production, transportation, and heavy industries [5]. In this context, water electrolysis can be the key enabling technology for this type of energy storage. Alkaline, Proton Exchange Membrane (PEM), and the latest solid oxide electrolysers are the main commercially accessible technologies today on the market [6].
Alkaline Electrolyser Cells (AEC) have been in commercial use in industrial application since the 1920s and can be considered as the most mature electrolyser technology available today. An alkaline solution of sodium hydroxide (NaOH) or potassium hydroxide (KOH) in water is utilized as electrolyte while electrodes are in most cases manufactured of steel covered with a nickel coat. AEC is a mature technology and these types of electrolysers have been working even for decades [7,8]. Alkaline electrolysers with kilowatt scale have been integrated to get up to megawatt capacities, letting them be considered as the main option for the production of large quantities of hydrogen [9]. Their working principle is illustrated in Figure 1.
When a DC voltage is applied between the two electrodes of an AEC (typically between 1.8–2.0 V), water molecules in contact with the cathode acquire electrons to form hydroxide (OH) ions and release H2 molecules according to the Hydrogen Evolution Reaction (HER):
2 H2O + 2e → H2 + 2 OH
The OH ions migrate through the electrolyte to the anode where, with the release of electrons, H2O and O2 are produced according to the Oxygen Evolution Reaction (OER):
2 OH → ½ O2 + H2O + 2e
In the AEC the recombination of the hydrogen and oxygen produced at the electrodes is avoided by a separator (typically made of ceramic material), placed between the two electrodes. Typical hydrogen output pressure is between 1 bar g and 30 bar g.
Regarding electrolyser’s efficiency, report [10] specifies the state-of-the-art values of large-scale alkaline electrolysers and the future targets set by the European Community. These values are shown in Table 1.
Studies [11,12] helped the authors to compare different alkaline electrolysers models available on the market. With reference to Table 2, the average specific energy consumption is 57.6 kWh/kgH2. The data shown in Table 2 confirm the value presented in Table 1 taking into account the smaller size of the models.
Since hydrogen has a low volumetric energy density, work must be applied to reduce its storage volume. The most widespread hydrogen storage systems are 200 bar g pressure gas cylinders. However, light-weight composite cylinders are being studied and manufactured for small capacities and can tolerate pressures up to 800 bar g.
Mechanical compressors are normally used to compress hydrogen [17,18], and the reciprocating type is the most widespread technology. Reciprocating compressors are best suited for plants characterized by moderate flows and high pressures and can bring to high efficiencies particularly when a multi-stage configuration is employed. In addition, they offer good flexibility in size and capacity. Oil-free reciprocating compressors are preferred because they can bring good performances and high-purity compressed gas [19].
In literature, different works deal with hydrogen production, compression, and storage systems, especially when considering hydrogen refueling stations.
In [20], in order to study the effect of combining different renewable energy sources with energy storage on grid stability, the characterization of a hydrogen production and storage system composed of a 1.33 Nm3/h alkaline electrolyser and an air-driven reciprocating compressor is presented. In particular, the study focuses on the system control strategy.
The development of a hydrogen refueling station design tool is described in [21]: a Simulink model is created consisting of an electrolyser, a compressor, a storage tank, a dispensing unit, and a vehicle that consumes the hydrogen fuel. Simulation results in terms of time predictions to refill storage tanks and station operational cost are compared with three different existing hydrogen refueling stations.
In [22], a data collection and analysis on different existing hydrogen refueling stations is presented. Amongst the different presented data, average electrolyser and hydrogen compression performances are shown. However, no data is available regarding hydrogen refueling station design in terms of electrolyser and compressor technology.
In [23], the compression section of a hydrogen refueling station has been studied: experimental data from over 20,000 compression cycles were used to build a simulation tool of an air-driven hydrogen booster. This equipment is used to increase the hydrogen pressure from 200 to 500 bar g. Some interesting data on compressor-specific energy consumption are presented.
In [24], a hydrogen compression system powered by renewable energy sources is described. The system has a specific energy consumption that varies from 4.4 to 9.3 kWh/kgH2. However, compression ratios considered are different from the study presented in this article because the hydrogen compression system described in [24] is characterized by an inlet pressure decreasing from 200 to 120 bar g, and outlet pressure of the storage of 450 bar g.
Report [25] is focused on compressor’s efficiency in hydrogen refueling stations. The report highlights a specific energy consumption of about 10 kWh/kgH2 for the considered pressure range (4.6 to 200 bar g).
In this article, a small-size hydrogen production and storage plant is described and the experimental data presented. The hydrogen production section of the plant is based on an alkaline electrolyser capable of 5 Nm3/h, while the hydrogen compression and storage section is composed of an air-driven reciprocating compressor and 200 bar g gas cylinders. The aim of the work is to assess the energy performance of the electrolyser and the compression system in order to evaluate the overall system energy efficiency in terms of specific energy consumption. The goal is to increase the experimental data available about hydrogen production and storage plants of this capacity. This size of plants in the future could be very interesting from a commercial point of view; enabling for household application and small or medium industries the possibility to store the renewable energy that they produce when not immediately used.

2. Test Rig Description

As previously mentioned, the considered plant is composed of an alkaline electrolyser capable of 5 Nm3/h, an air-driven hydrogen compressor, and a 200 bar g storage. In order to produce the required compressed air to drive the hydrogen compressor a screw-type air compressor is also included.
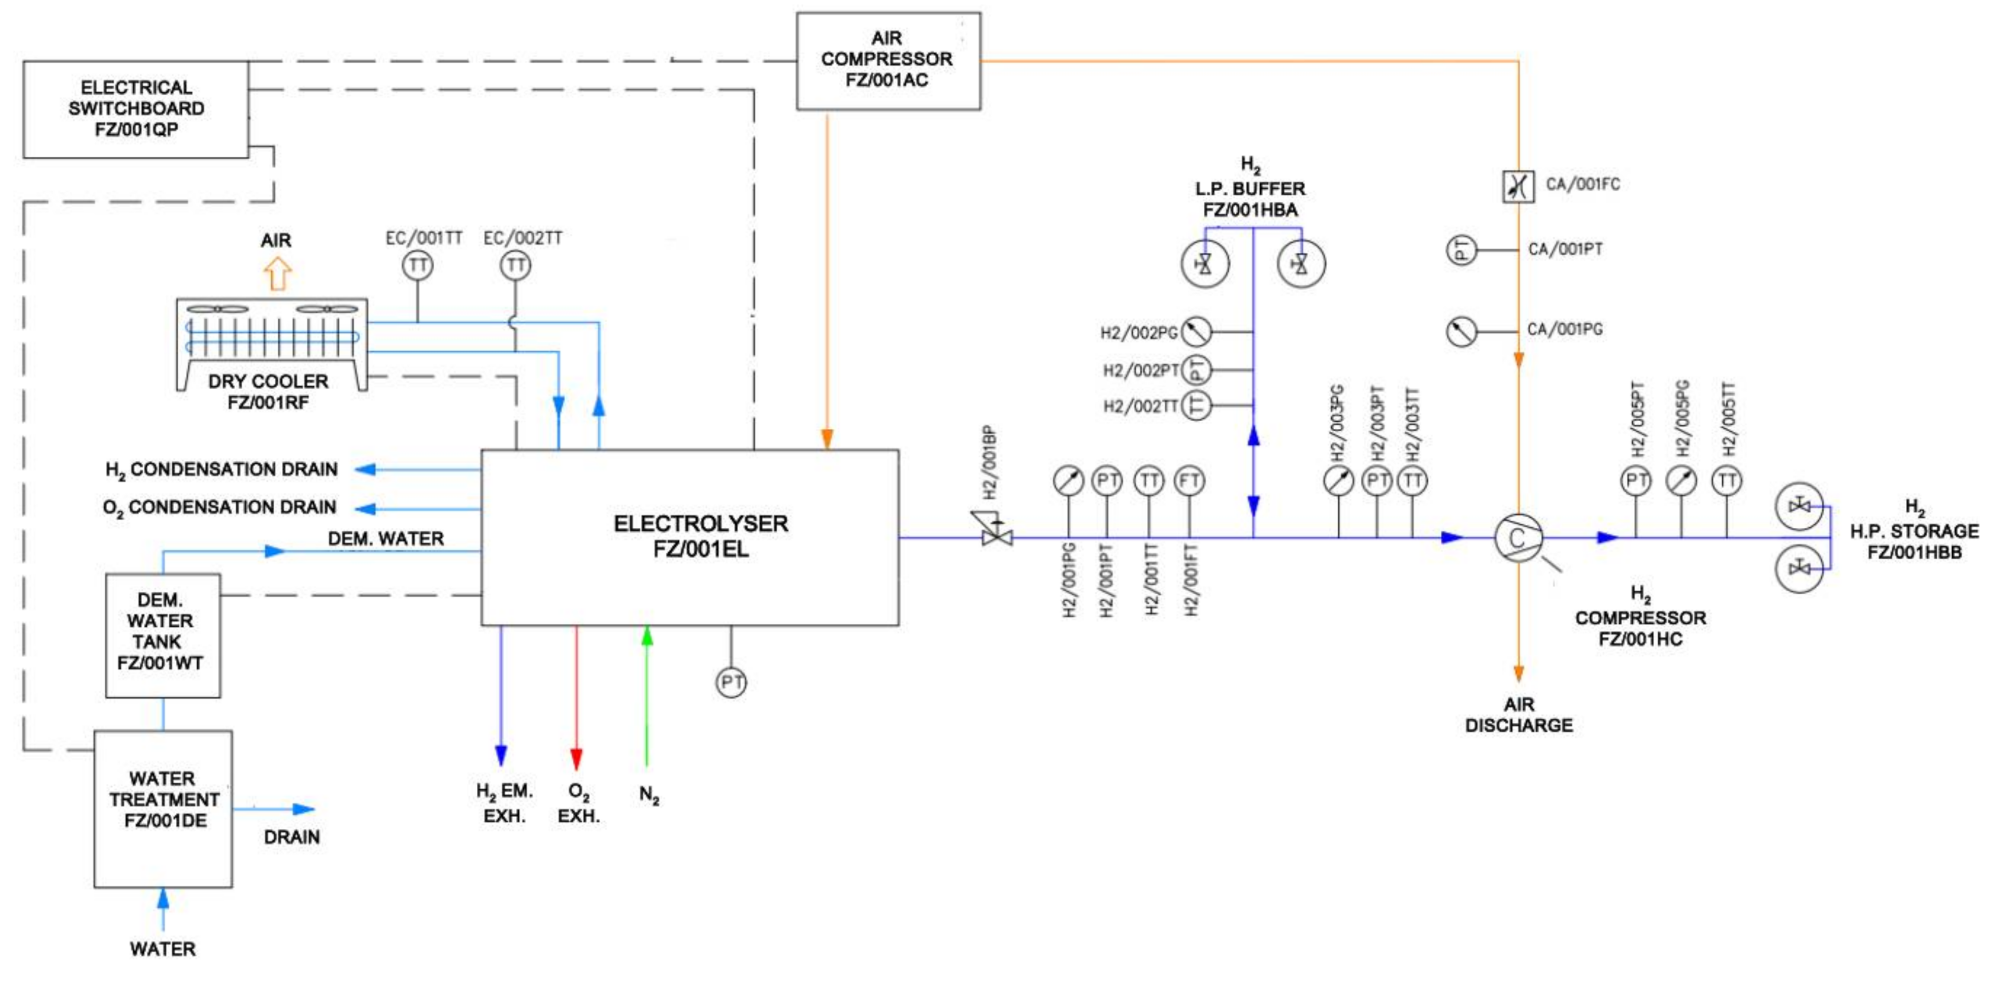
A Piping and Instrumentation Diagram (P&ID) of the plant complete with the identification codes of the main components and instruments is shown in Figure 2.

2.1. Process Flow

The process flow of the test facility can be summarized as follows:
  • Water is treated and appropriately demineralized using a water treatment system (FZ/001DE) in order to reduce its conductivity below the limit imposed by the electrolyser manufacturer;
  • Demineralized water goes then to the electrolyser where is converted into hydrogen and oxygen. The electrolyser hydrogen production internal pressure is precisely controlled and limited by an external back-pressure regulator (H2/001BP);
  • The produced hydrogen fills a set of buffer cylinders (FZ/001HBA), with a geometric volume of 50 l, interposed between the electrolyser and an air-driven hydrogen compressor (FZ/001HC). The buffer cylinders (FX/001HBA) are filled at a pressure of about 5 bar g. The purpose of these “low-pressure” buffer systems is to ensure smooth and continuous operation of the electrolyser and of the hydrogen compressor;
  • The oxygen produced in the electrolysis reaction, which for the purpose of the project is considered a by-product, is suitably vented to the atmosphere in a safe location;
  • Hydrogen pressure is then raised up to 200 bar g by an air-driven hydrogen reciprocating compressor (FZ/001HC);
  • Flow of compressed hydrogen is then stored in high-pressure cylinders with a geometric volume of 50 l (FZ/001HBB).

2.2. Main Components Data

2.2.1. Alkaline Electrolyser (FZ/001EL)

The industrial alkaline electrolyser used in the testing facility (FZ/001EL) is a stand-alone unit provided with a built-in electrical power system which, at the same time, supplies the generator balance of the plant and converts from AC to DC the electrical power required for the operation of two alkalines (NaOH electrolyte) stacks.
An integrated PLC-based process control system provides local monitoring of the hydrogen production process and controls the correct operation of the generator and of the water pumps that extract process water from the reservoir tank (FZ/001WT), pressurize it, and distribute it to the stacks.
The electrolyser includes hydrogen and oxygen separators to separate electrolytes from the hydrogen and the oxygen outlet streams.
The hydrogen output section of the unit includes a zeolites-based gas purification system for removing any traces of unwanted reactant from the hydrogen stream. Hydrogen generated by the unit reaches the purity of 99.999% and is therefore suitable for high purity applications, such as PEM Fuel Cell feeding. The hydrogen purification system uses regenerative cartridges to increase the time interval between maintenance stops of the plant. The electrolyser automatically manages cartridges regeneration when required while guaranteeing a continuous production of hydrogen by using part of the produced gas stream.
Downstream the gas purification a drying unit reduces and controls the humidity content of the hydrogen outlet flow. The alkaline electrolyser is provided with a built-in closed-loop cooling system with water/glycol mixture circulation. The cooling system includes a radiator (FZ/001RF) and an active air fan.
As indicated in Figure 2, the electrolyser is connected with the air compression system (FZ/001AC) for activation of the pneumatic valves involved in the internal controls. Connection with a nitrogen bottle is provided for possible purging operations during start-up and maintenance activities.
The main data of the alkaline electrolyser (FZ/001EL) are shown in Table 3.

2.2.2. Compressed Air Package (FZ/001AC)

The main data of the electric-driven air compressor included in the air compressed package (FZ/001AC) are shown in Table 4.

2.2.3. Reciprocating Air-Driven Hydrogen Compressor (FZ/001HC)

The main data of the reciprocating air-driven hydrogen compressor (FZ/001HC), hereafter also called booster, are shown in Table 5. An air-driven hydrogen booster has been chosen for this study because it is safer than an electrically driven one, especially when considering hazardous areas.

2.3. Field Instrumentation

The experimental plant has been designed including field instrumentation and dedicated automation and monitoring system for plant and components characterization.
The monitoring and control system is based on an electronic controller including a real-time processor, a Field Programmable Gate Array (FPGA), and I/O modules. The I/O modules are directly connected to field instrumentation, and the controller itself is then connected to a host PC on which the user interface has been developed. Both controller and host PC can be connected to the internet for remote system monitoring and control.
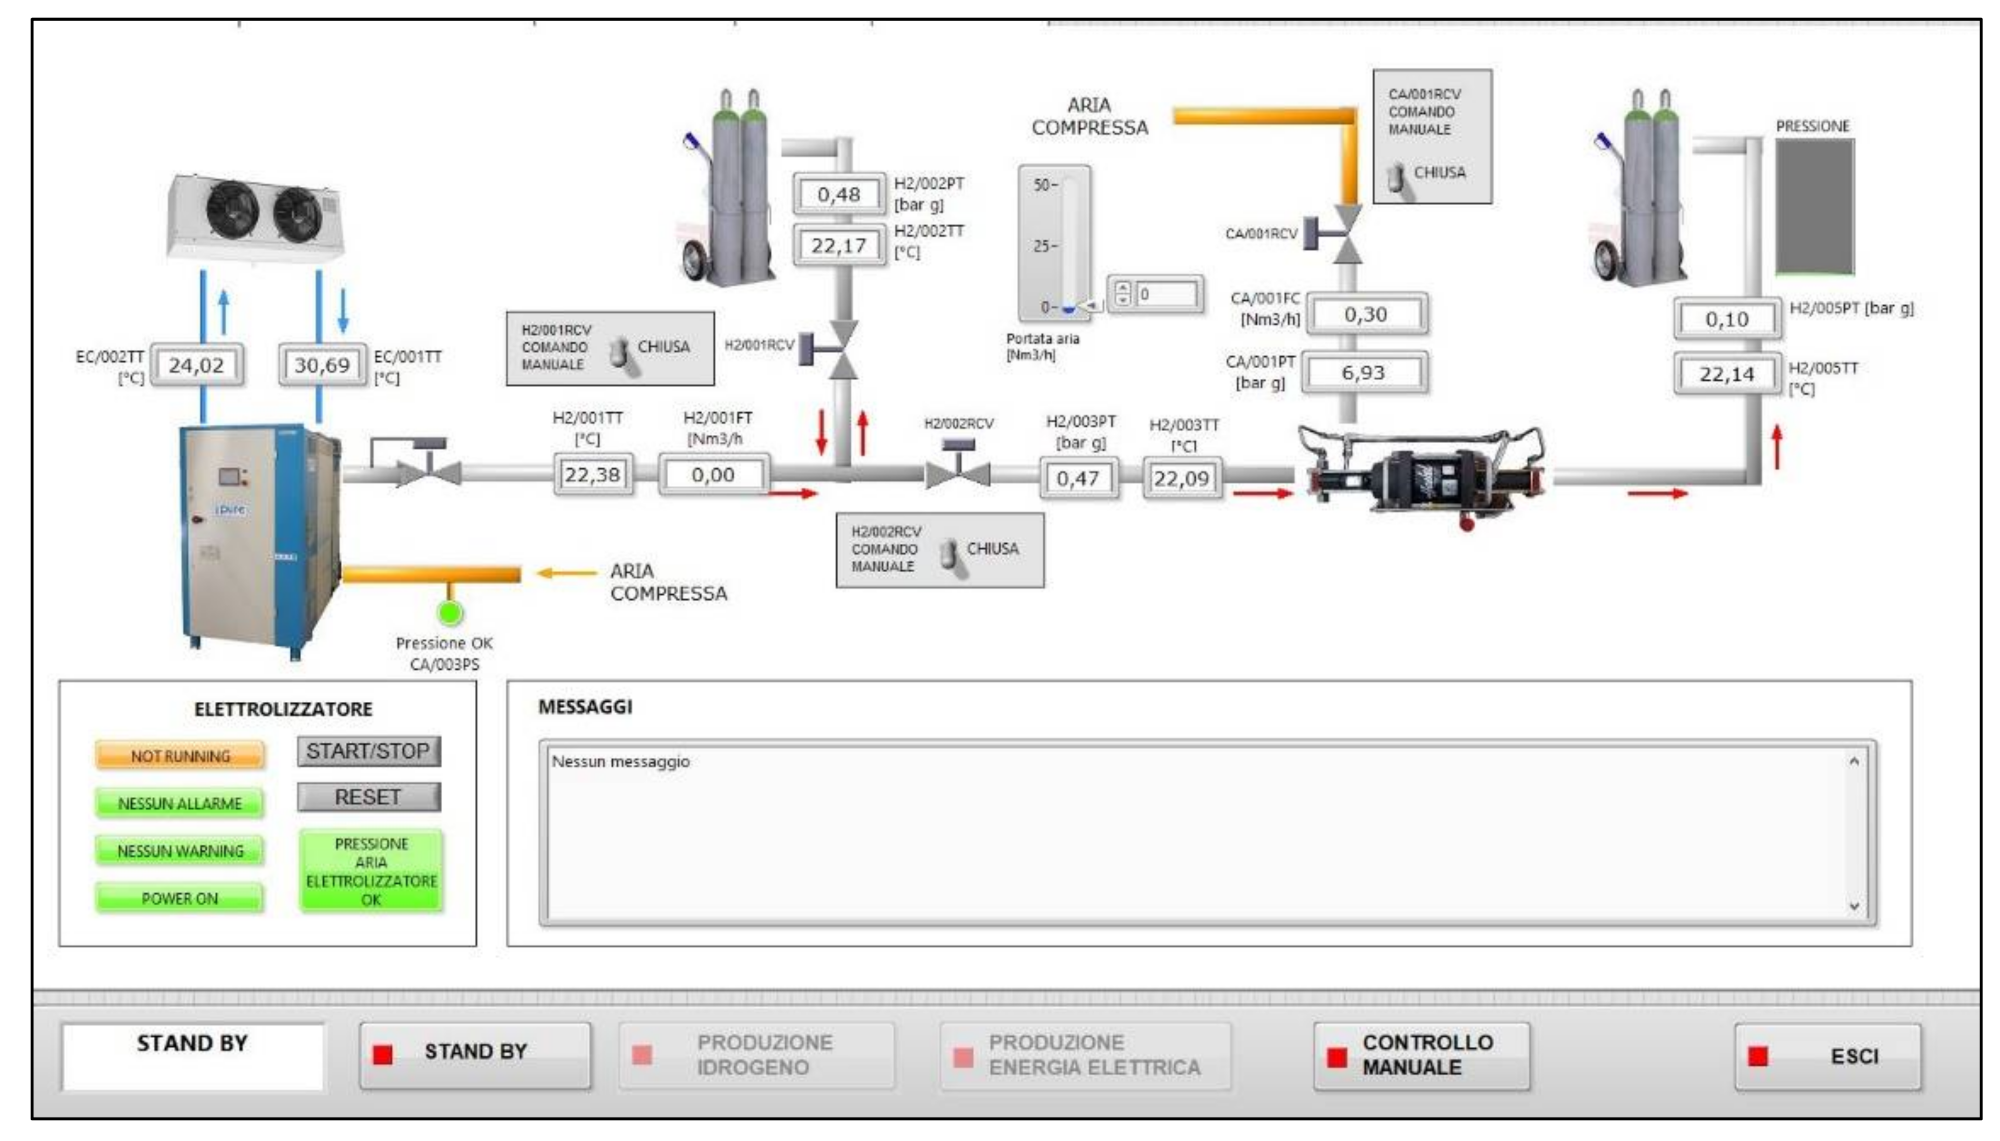
Figure 3 shows the automation system overview page developed for the test plant, including the real-time monitoring of the main process parameters and process vales control. Other pages of the user interface are dedicated to graphs of the monitored quantities and the display of calculated and statistical data of the system. The electrical power measurements were made with a portable power analyser.

2.3.1. Hydrogen Line

Instrumentation providing analog input to the automation system controller is installed on the four branches that make up the hydrogen piping system:
  • Between the electrolyser and the low-pressure buffer;
  • Upstream the low-pressure buffer;
  • Upstream the hydrogen compressor;
  • Hydrogen compressor delivery side, upstream the high-pressure storage.
On each branch, hydrogen pressure and temperature are monitored through dedicated transmitters. These instruments are indicated respectively with suffix PT (Pressure Transmitter) and TT (Temperature Transmitter–IEC751 class A Pt100 sensors) in the P&I diagram of Figure 2. Hydrogen flowrate from the electrolyser is then monitored by the automation system through a dedicated flowmeter (H2/001FT) installed downstream the back-pressure regulator.

2.3.2. Compressed Air Lines

Compressed air line between the compressed air package and the hydrogen compressor is interfaced with the automation system for pressure monitoring via the pressure transmitter CA/001PT, and for monitoring and regulating the flow via the controller CA/001FC. The accuracy of the main instruments used is presented in Table 6.

3. Methods Used for Carrying Out Tests and Results Obtained

3.1. Hydrogen Production Efficiency Characterization

3.1.1. Purpose of the Test

The tests aimed at evaluating the efficiency at two hydrogen flow rates: the full flow rate and a reduced flow rate. To change the flow rate the back pressure regulator was set at two values: 4.6 bar g and 4.2 bar g respectively.

3.1.2. Test Procedure

At the end of the set-up and warm–up phase, the hydrogen production is started, and the data listed in Table 7 are recorded.
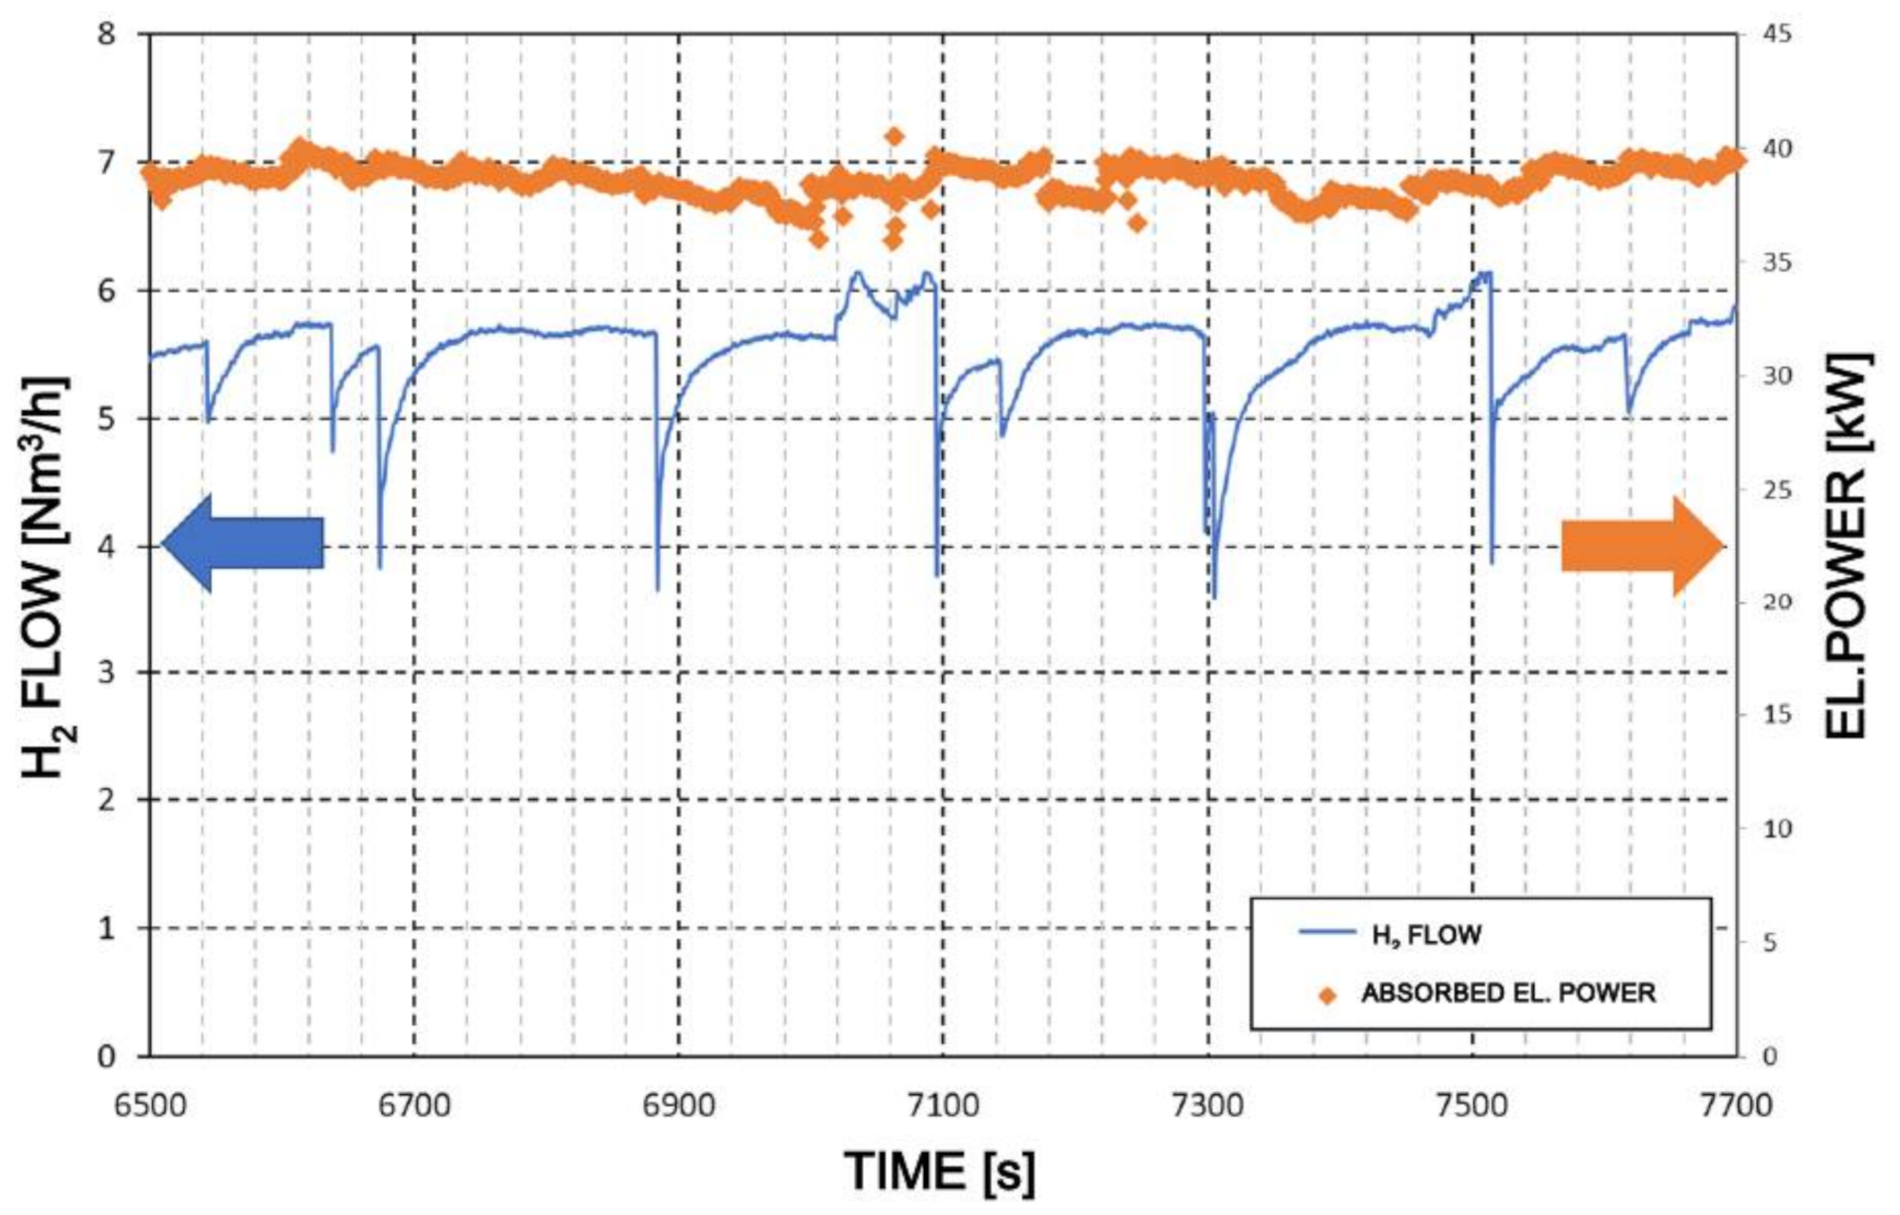
The plots over time of the hydrogen flow rate (in blue) and of the electrical power absorbed by the electrolyser (in orange) during the tests performed at 4.6 and 4.2 bar g output pressure are shown in Figure 4 and Figure 5. The two figures show trends recorded by the automation system during the tests for a duration of about 30 min. It is possible to observe as, in both tests, sudden changes in flow rate occur for a few seconds at intervals of about three minutes. This phenomenon is related to the electrolyser internal hydrogen purification unit which, as anticipated in Section 2.2.2, uses a part of the hydrogen produced to periodically clean the filter cartridges.

3.1.3. Electrolyser Efficiency Calculation

The electrolyser efficiency (in percentage) is evaluated with Equation (3) as the ratio between the power available in the produced hydrogen (referred to LHV (Lower Heating Value)) and the electrical power absorbed by the electrolyser:
η e l = P H 2 P e l ; i n × 100           %
The average power associated with the hydrogen produced by the electrolyser ( P H 2 ) is calculated with Equation (4):
P H 2 = ρ H 2 × V ˙ 3600 × L H V             kW
The meaning of the quantities shown in the above formulas, the corresponding unit of measurement, and the methodology used to calculate them are summarized in Table 8.

3.1.4. Test Results: Hydrogen Production Efficiency

The results of the tests performed with the electrolyser operating at 4.6 and 4.2 bar g output pressure are summarized in Table 9.
Moving from part load operation to design load operation (design flow rate) the electrolyser efficiency is increased from 36% to 43%.
It should also be noted that, for the unit under test, the calculated specific energy consumption, id est the kW per hour needed to make one kg of hydrogen available at the electrolyser output, is in line with the data reported in the manufacturer’s technical specification and is also higher than the available data referred to large scale alkaline electrolysers considering both the state-of-the-art of this technology and the future targets set by the European Community shown in Table 1 of the introduction section.
The result of our study can be compared with different electrolysers available on the market, as per data given in Table 2 that can be found in the introduction. When the average value of the specific energy consumption for alkaline electrolysers (57.6 kWh/kgH2) is compared to the authors’ experimental data (77 kWh/kgH2) it is evident that the tested system has, even in this case, a lower efficiency. As above mentioned, part of the hydrogen is used for the regeneration of the cartridge of the hydrogen purification system and so this flow is lost and brings to a decrease in efficiency. Therefore, we can conclude that the experimental value of the efficiency is at least in line with one of the models presented in Table 2.

3.2. Hydrogen Production and Storage Plant Overall Characterisation

3.2.1. Purpose of the Test

The purpose of this test is to characterize the performance of the whole test plant in terms of specific energy consumption. After having characterized the hydrogen production system in Section 3.1, in this test hydrogen is produced at 4.6 bar g and then compressed at 200 bar g.
The test was carried out with the electrolyser operating at the nominal output pressure of 4.6 bar g because this condition is the one that assures the best performance of the hydrogen booster. The test has been carried out with the air-driven hydrogen booster operating at rated speed first (44 cycles per minute), and then and at a reduced speed of 35 cycles per minute to compare the influence of the booster’s speed on the specific energy consumption.

3.2.2. Test Procedure

The same set-up procedure described in Section 3.1.1 is carried out to collect the data for the hydrogen production and storage analysis: Table 10 shows the quantities measured during the test.

3.2.3. Test Results: Booster Hydrogen and Driving-Air Flow Rate Variation with Time and Booster Specific Energy Consumption

The test has been divided into two steps. In the first step, the hydrogen storage pressure was raised from 10 to 100 bar g and, in the second step from 100 to 200 bar g. The overall filling time was about 5 h. The plots overtime of the hydrogen flow rate processed by the booster and its driving-air flow rate, for the booster running at 44 cycles per minute, are shown in Figure 6 and Figure 7.
When the electrolyser hydrogen output flow rate is considered, it can be noticed that this is reduced if compared to the test on the electrolyser as a stand-alone unit and working at the same output pressure. This depends on the processing capability limits of the booster. The already described fluctuations of the hydrogen flow from the electrolyser due to the internal recirculation for filter cleaning can be noticed as well. From Figure 7 it can be noticed that the booster driving-air flow rate is progressively increased in steps by the automation control system, in order to keep the compressor speed constant as the pressure in the storage system increases.
The specific energy required by the hydrogen booster can be evaluated as follows. At first, the energy associated with the isentropic air compression process required to produce the compressed air is calculated. This air is the one required to drive the hydrogen booster for the entire storage process. Then, the energy content of the mass of hydrogen stored is quantified. The specific energy required by the hydrogen booster is calculated as the ratio between energy associated to compress air and the one of the hydrogen stored. The calculated specific energy of the hydrogen booster for compression from 4.6 bar g to 200 bar g is equal to 15 kWh/kgH2.
It could be interesting to compare this value with other data, but literature on these types of boosters, as shown in the introduction section, is scarce. Moreover, using this approach to assess the efficiency implies that the operating conditions have to be the same (initial pressure and final pressure). Therefore, it is difficult to make a comparison with the tested system and other data. As already pointed out in a study cited in the introduction section, the specific energy consumption of an air-driven hydrogen booster can vary from 4.4 to 9.3 kWh/kgH2 with an inlet pressure decreasing from 200 to 120 bar g and outlet pressure of the storage of 450 bar g. These values, although lower, are comparable with the ones referred to the hydrogen booster used in this study.

3.2.4. Test Results: Hydrogen Pressure Variations with Time

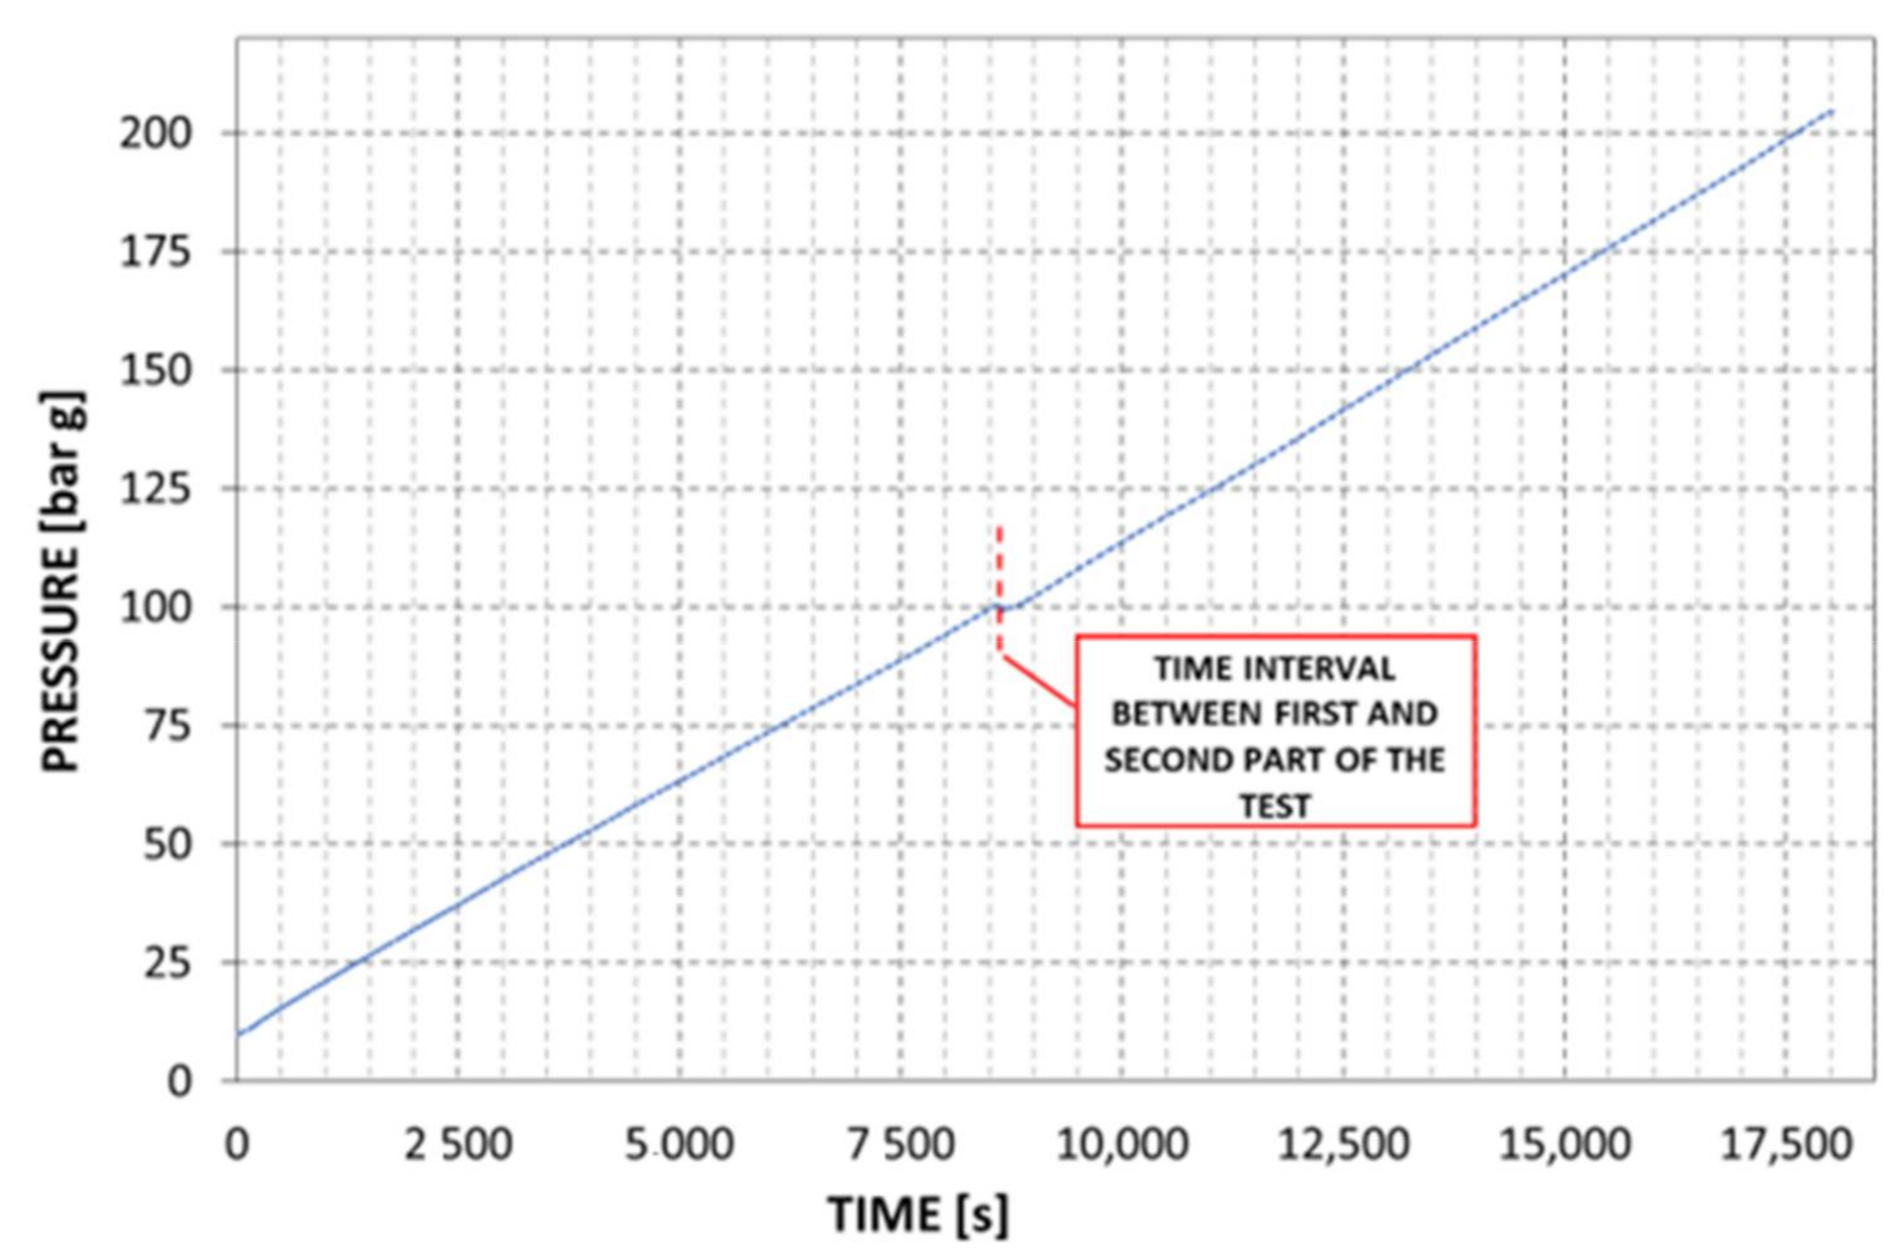
The plots overtime of the hydrogen pressure measured on the hydrogen buffer and the high-pressure storage during the test with the electrolyser working at output nominal pressure of 4.6 bar g and the hydrogen booster running at 44 cycles per minute are shown in Figure 8 and Figure 9. As shown in Figure 8 the hydrogen pressure in the low-pressure buffer is almost constant during the test. It is also evident the interruption of the test during the night (at a time of approx. 8500 s).

3.2.5. Test Results: Booster Running at 35 Cycles Per Minute

A similar storage system filling test was then performed with the electrolyser operating at rated output pressure (4.6 bar g), but with the booster running at a reduced speed of 35 cycles per minute. As in the previous case, the test was divided into two steps. With reference to the pressure in the storage system, in the first step of the test, the pressure was raised from 0 to 172 bar g and, in the second step from 172 to 200 bar g. In this case, the overall filling time was about 6 and a half hours. Plots of booster hydrogen flow rate and hydrogen storage pressure variations with time were similar in trend to those recorded in the previous test and are shown in Figure 8 and Figure 9.

3.2.6. Test Results: Production and Storage Specific Energy Consumption Considerations

Table 11 shows the mean values calculated from the data collected with the electrolyser operating at output nominal pressure and booster running at 44 cycles per minute.
Based on these data and considering the electricity required to compress the air for driving the booster, it is possible to define the storage-specific energy consumption as the overall energy required to compress 1 kg of hydrogen from 4.6 to 200 bar g. For the considered case, a 65 kWh/kgH2 value has been calculated. This value is significantly higher than the air driven booster specific energy consumption previously stated (15 kWh/kgH2) and it is higher than figures found in literature for the considered pressure range (4.6 to 200 bar g): in the introduction section, a value of about 10 kWh/kgH2 is reported. It must be however highlighted that this specific energy consumption is related to an electric-driven hydrogen compressor. Such a solution is intrinsically more efficient since the conversion from electricity to compressed air is not required. Moreover, the air compressor used in the presented test to drive the hydrogen booster is a constant-speed electric screw compressor. This type of compressor, once the set pressure is reached, does not switch off the electric motor, and keeps operating in the so-called “unload mode”. When operating in this mode, power adsorbed can reach 50% of the full load without producing any useful effect (compressed air). This behavior of the air compressor is illustrated in Figure 10, where the air compressor’s electrical power consumption is shown for different booster output pressure. Figure 10a shows the air compressor electrical power consumption when the booster works at low hydrogen outlet pressure (abt. 10 bar g), whereas Figure 10b shows the air compressor electrical power consumption when the booster works at high hydrogen outlet pressure (abt. 200 bar g).
The electrical consumption peaks shown in Figure 10a,b correspond to the air compressor “load mode” (compressor feeding the air storage while the electrical consumption valleys correspond to the “unload mode”. Comparing Figure 10a,b it is also possible to observe that the electrical energy adsorbed when the compressor is in “unload mode” is higher when the hydrogen outlet pressure is low.
On the basis of the measured data, considering the electrolyser working at a design flow rate (77 kWh/kgH2 at 5.53 Nm3/h) and a hypothetical compressor able to elaborate this hydrogen flow with the same specific energy consumption as the one installed in the test rig (65 kWh/kgH2), the production and storage required specific energy would be 142 kWh/kg.
Table 12 summarizes the results obtained with the electrolyser operating at output nominal pressure and booster running at a reduced speed of 35 cycles per minute. Slowing down the hydrogen booster, the processed hydrogen flow rate is further decreased to an average value of 1.19 Nm3/h. The electrolyser and booster efficiencies are reduced as well. These data show that, for achieving high production and storage efficiencies, it is important to choose the right match of system components. For example, when the electrolyser is considered, its efficiency is severely affected when operated at part load.

4. Conclusions

In this article, the authors present experimental data acquired on a small hydrogen production and storage system, based on an alkaline electrolyser and an air-driven hydrogen booster. The goal of this study is to increase the experimental data available about hydrogen production and storage plants of small capacity (5 Nm3/h of hydrogen, storage at 200 bar g). This size of plants in the future could be very interesting from a commercial point of view; enabling for household application and small or medium industries the possibility to store the renewable energy that they produce when not immediately used.
The experimental data show that the electrolyser efficiency is in line with the manufacturer specifications, and this is equal to 36% (93 kWh/kgH2) at a reduced flow rate (pressure 4.6 bar g) and to 43% (77 kWh/kgH2) at a design flow rate (4.2 bar g). This difference is due to the large increase in the hydrogen flow. Data available in literature for similar electrolysers show an average specific energy consumption of 57.6 kWh/kgH2. Since part of the hydrogen generated by the tested electrolyser is used for the regeneration of the cartridge of the hydrogen purification system, it is possible to conclude that the experimental value of the efficiency is in line with the values available in literature. Power absorbed by the air-driven hydrogen booster is high if compared to other literature data. Calculated specific energy of the hydrogen booster for compression from 4.6 bar g to 200 bar g is equal to 15 kWh/kgH2 (when referred to the compressed air only) and 65 kWh/kgH2 (if the electrical power consumption of the air compressor is included).
Possible actions to increase the overall plant efficiency could be:
  • Replacement of the hydrogen booster with a multistage unit capable of processing a higher flow rate;
  • Modification of the electrolyser unit in order to avoid using hydrogen to regenerate the filter cartridges;
  • Increase of the electrolyser output pressure.
It would therefore be necessary to carry out an in-depth analysis aimed at identifying, among the proposed solutions, the best compromise in terms of technical, economic, and safety requirements.

Author Contributions

Investigation, N.Z. and S.M.; Methodology, R.T.; Resources, R.T.; Writing—original draft, A.P., M.G., R.T.; Writing—review & editing, A.P., M.G., N.Z. and R.T. All authors have read and agreed to the published version of the manuscript.

Funding

Part of the research has been funded by Fincantieri S.p.A. APC funded by University of Trieste.

Institutional Review Board Statement

Not applicable.

Informed Consent Statement

Not applicable.

Data Availability Statement

Not applicable.

Conflicts of Interest

The authors declare no conflict of interest.

References

  1. REN21. Renewables 2020 Global Status Report; REN21: Paris, France, 2020. [Google Scholar]
  2. Parra, D.; Patel, M.K. Techno-economic implications of the electrolyser technology and size for power-to-gas systems. Int. J. Hydrog. Energy 2016, 41, 3748–3761. [Google Scholar] [CrossRef]
  3. Ferrero, D.; Gamba, M.; Lanzini, A.; Santarelli, M. Power-to-Gas Hydrogen: Techno-economic assessment of processes towards a multi-purpose energy carrier. Energy Procedia 2016, 101, 50–57. [Google Scholar] [CrossRef] [Green Version]
  4. Samsatli, S.; Samsatli, N.J. The role of renewable hydrogen and inter-seasonal storage in decarbonising heatComprehensive optimisation of future renewable energy value chains. Appl. Energy 2019, 233–234, 854–893. [Google Scholar] [CrossRef]
  5. Schmidt, O.; Gambhir, A.; Staffell, I.; Hawkes, A.; Nelson, J.; Few, S. Future cost and performance of water electrolysis: An expert elicitation study. Int. J. Hydrog. Energy 2017, 42, 30470–30492. [Google Scholar] [CrossRef]
  6. FCH JU. Development of Water Electrolysis in the European Union; Fuel Cells and Hydrogen Joint Undertaking (FCH JU): Brussels, Belgium, 2014. [Google Scholar]
  7. Kiaee, M.; Cruden, A.; Chladek, P.; Infield, D. Demonstration of the operation and performance of a pressurised alkaline electrolyser operating in the hydrogen fuelling station in Porsgrunn, Norway. Energy Convers. Manag. 2015, 94, 40–50. [Google Scholar] [CrossRef]
  8. Artuso, P.; Gammon, R.; Orecchini, F.; Watson, S.J. Alkaline Electrolisers: Model and real data analysis. Int. J. Hydrog. Energy 2011, 36, 7956–7962. [Google Scholar] [CrossRef]
  9. FuelCellToday. Water Electrolysis & Renewable Energy Systems; FuelCellToday: Royston, UK, 2013. [Google Scholar]
  10. FCH JU Addendum to the Multi-Annual Work Plan 2014–2020; Fuel Cells and Hydrogen Joint Undertaking (FCH JU): Brussels, Belgium, 2018.
  11. Gallandat, N.; Romanowicz, K.; Züttel, A. An Analytical Model for the Electrolyser Performance Derived from Materials Parameters. J. Power Energy Eng. 2017, 5, 34–49. [Google Scholar] [CrossRef] [Green Version]
  12. Buttler, A.; Spliethoff, H. Current status of water electrolysis for water storage, grid balancing and sector coupling via power-to-gas and power to liquids. A review. Renew. Sustain. Energy Rev. 2018, 82, 2440–2454. [Google Scholar] [CrossRef]
  13. Angstrom Advanced. Available online: https://angstromadvancedhydrogen.wordpress.com/2016/11/15/angstrom-advanced-hgh100001700085000170000-large-hydrogen-generator/ (accessed on 6 June 2021).
  14. Green Energy. Available online: https://greenhydrogen.dk/wp-content/uploads/2021/02/A-Series-brochure-120421.pdf (accessed on 6 June 2021).
  15. NEL Hydrogen. Available online: https://nelhydrogen.com/product/h-series/ (accessed on 6 June 2021).
  16. Sagim. Available online: https://sagim-gip.com/wp-content/uploads/M%205000_TECHNICAL%20SPECIFICATIONS.pdf (accessed on 6 June 2021).
  17. Zuttel, A. Hydrogen Storage methods. Naturwissenschaften 2004, 91, 157–172. [Google Scholar] [CrossRef] [PubMed]
  18. Nour, U.M.; Awad, S.; Yusup, S.; Sufian, S. Technical Evaluation of Current Hydrogen Storage Technologies for Vehicles. J. Appl. Sci. 2010, 10, 1200–1203. [Google Scholar] [CrossRef] [Green Version]
  19. Sdanghi, G.; Maranzana, G.; Celzard, A.; Fierro, V. Review of the current technologies and performances of hydrogen compression for stationary and automotive applications. Renew. Sustain. Energy Rev. 2019, 102, 150–170. [Google Scholar] [CrossRef]
  20. Sanchez, C.; Gonzalez, D. Experimental characterization of a grid-connected hydrogen energy buffer: Hydrogen production. Int. J. Hydrog. Energy 2013, 38, 9741–9754. [Google Scholar] [CrossRef] [Green Version]
  21. Riedl, S.M. Development of a Hydrogen Refueling Station Design Tool. Int. J. Hydrog. Energy 2020, 45, 1–9. [Google Scholar] [CrossRef]
  22. Saur, G.; Sprik, S.; Kurtz, J.; Onorato, S.; Gilleon, S.; Winkler, E. National Renewable Energy Laboratory. Hydrogen Station Data Collection and Analysis, DOE Hydrogen and Fuel Cells Program. In Proceedings of the 2019 Annual Merit Review and Peer Evaluation Meeting, Arlington, VA, USA, 29 April–1 May 2019. [Google Scholar]
  23. Ligen, Y.; Vrubel, H.; Arlettaz, J.; Girault, H. Experimental correlations and integration of gas boosters in a hydrogen refueling station. Int. J. Hydrog. Energy 2020, 45, e16663–e16671. [Google Scholar] [CrossRef]
  24. Sánchez-Diaz, C.; Monrabal, J.; González, D.; Alfonso, D.; Peñalvo-López, E. Experimental results of the hydrogen production control of a hydrogen energy buffer. Int. J. Hydrog. Energy 2015, 40, 5013–5024. [Google Scholar] [CrossRef]
  25. Cornish, A.J. Hydrogen Fueling Station Cost Reduction Study; Engineering, Procurement & Construction, LLC: Cheyenne, WY, USA, 2011. [Google Scholar]
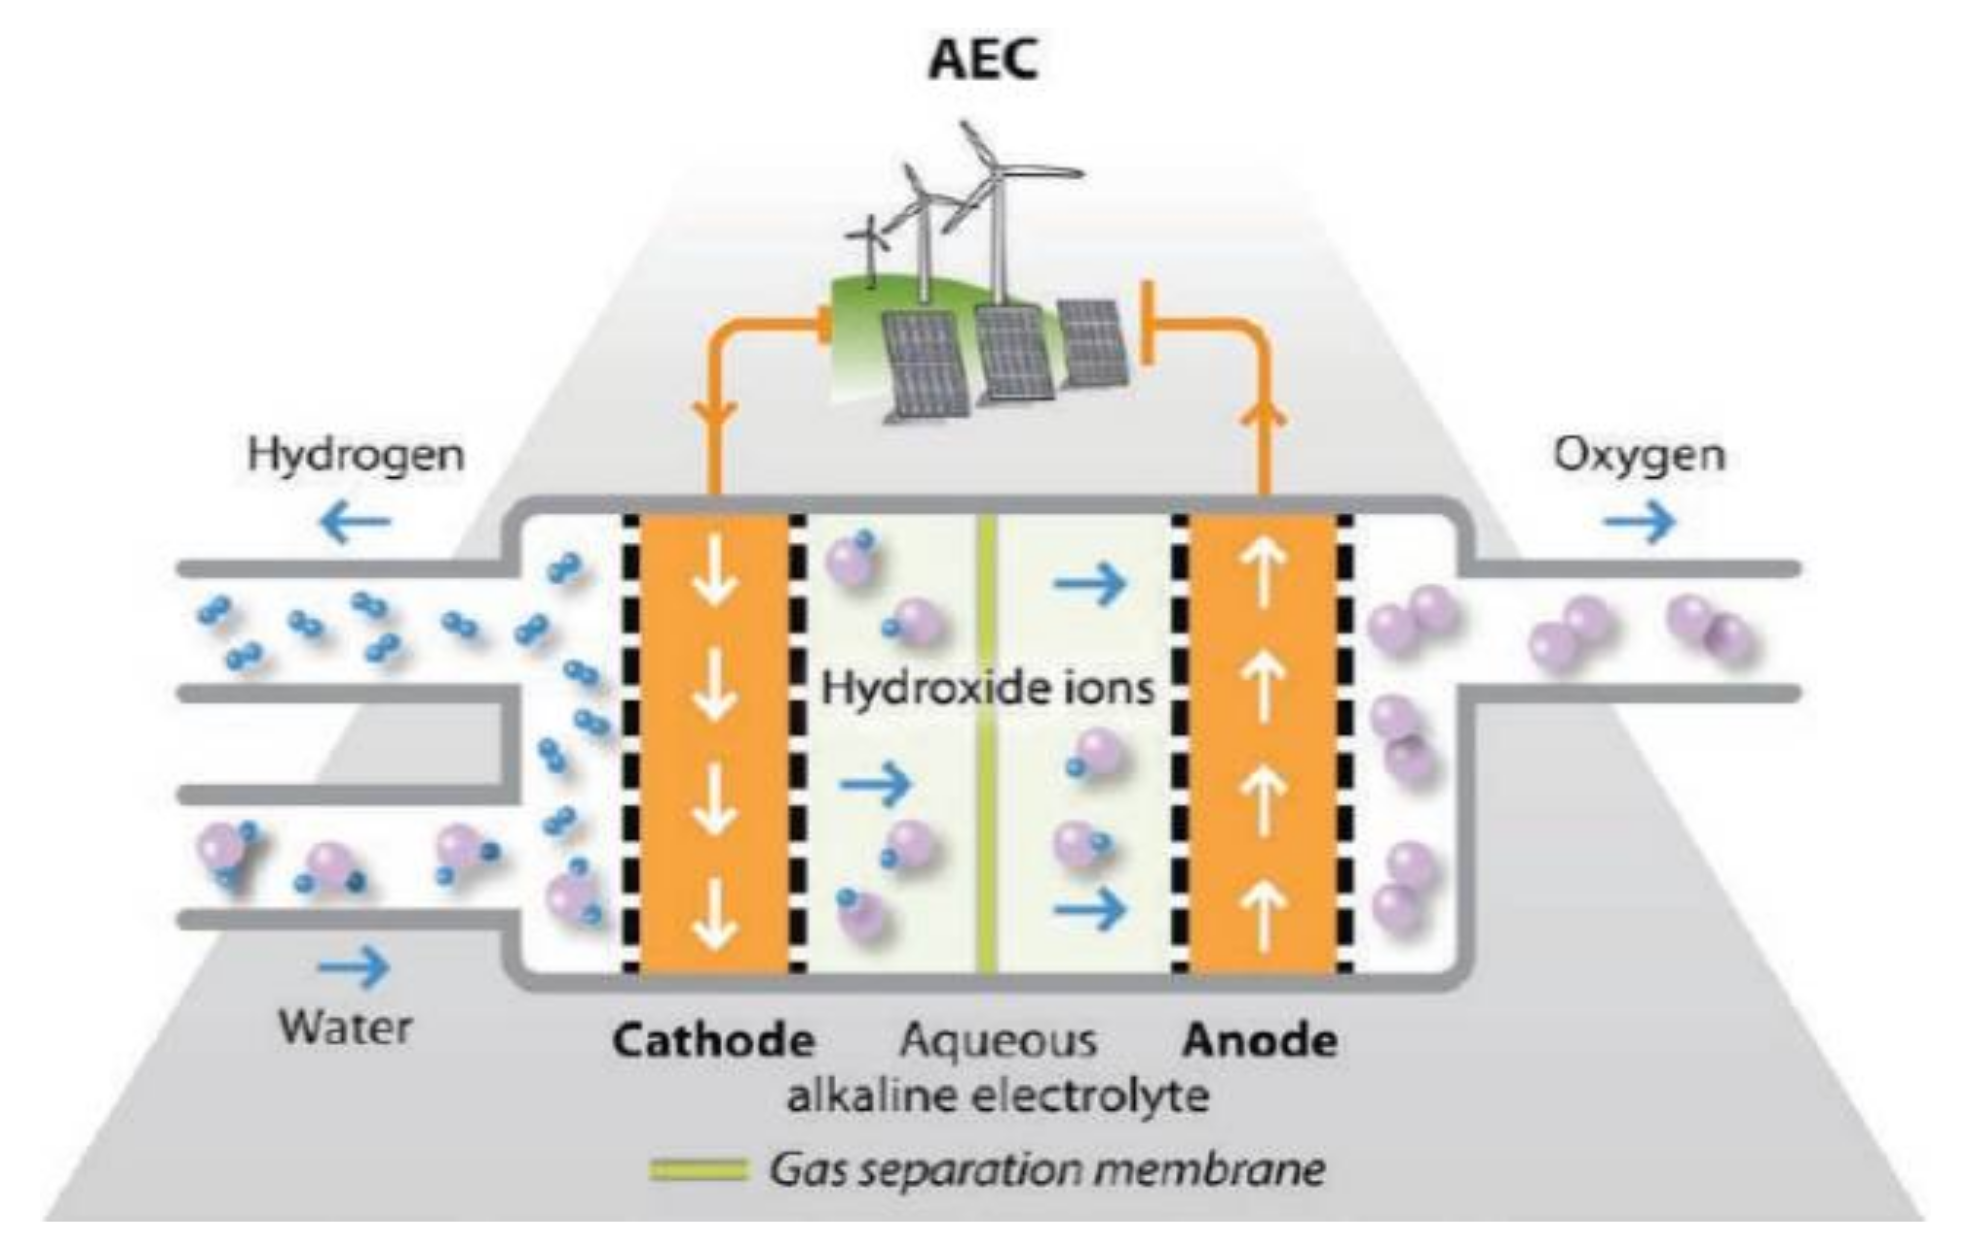
Figure 1. Alkaline Electrolyser Cell (AEC) working principle. Reprinted from ref. [9] with permission. Copyright 2013 FuelCellToday.
Energies 14 05347 g001
Figure 2. Piping and Instrumentation Diagram (P&ID) of the testing facility.
Energies 14 05347 g002
Figure 3. Hydrogen production and storage plant automation system main page.
Energies 14 05347 g003
Figure 4. Plot over time of the electrical power absorbed and of the hydrogen outlet flowrate during test 4.6 bar g.
Energies 14 05347 g004
Figure 5. Plot over time of the electrical power absorbed and of the hydrogen outlet flowrate during test 4.2 bar g.
Energies 14 05347 g005
Figure 6. Plot over time of the hydrogen flow from the electrolyser during the test with hydrogen booster running at 44 cycles per minute.
Energies 14 05347 g006
Figure 7. Plot over time of the booster driving-air flow rate during the test with hydrogen booster running at 44 cycles per minute.
Energies 14 05347 g007
Figure 8. Plot over time of the hydrogen pressure in the low-pressure buffer during the test with hydrogen compressor running at 44 cycles per minute.
Energies 14 05347 g008
Figure 9. Plot over time of the hydrogen pressure on the hydrogen storage during the test with hydrogen compressor running at 44 cycles per minute.
Energies 14 05347 g009
Figure 10. Electric power consumption of the air compressor in an interval of 10 min. respectively: (a) with a hydrogen outlet pressure of abt. 10 bar g; (b) with a hydrogen outlet pressure of abt. 200 bar g.
Energies 14 05347 g010
Table 1. Large scale electrolyser current and future objectives for electrical energy consumption per each kilogram of hydrogen produced at nominal capacity [10].
Electricity Consumption @ Nominal Capacity [kwh/kgh2]
State-of-the-ArtFCH 2JU Target
20122017202020242030
5751504948
Table 2. List of electrolysers available on the market (not exhaustive) and key performance metrics of devices with similar capacity and output pressure to the one considered in this article. Most of the data are elaborated from [11,12], in all the other cases data are derived from product data sheets.
CompanyCountryTypeModelCapacity [Nm3/h]H2 Output Pressure [bar g]H2
Purity [%]
Electrical
Consumption [kWh/kgH2]
HHV
Efficiency [%]
ActaItalyAEMEL100012999.9453.274%
Angstrom Advanced [13]USAPEMHGH17000010499 to 99.999964.5 161.4% 2
Elogen (ex AREVA H2 Gen)FrancePEMELYTE 10103099.99947.8–60.0 165.6–82.4% 4
Enapter (ex Acta)ItalyAEMEL 2.10.53599.953.3 173.9% 4
ErredueItalyPEMSIRIO 200215 (Opt. 30)99.9953.3 173.9% 4
GreenHydrogen [14] DenmarkPEMHyProvide P1150>99.99561.2 164.9% 2
H-TEC SYSTEMSGermanyPEMEL30/1443.629N/A55.471.1%
IdroenergyItalyAlkalinemod. 8.05.334>99.562.5 363.0% 4
ITM PowerUKPEM HGAS3SP3.2N/A99.999N/AN/A
Nel Hydrogen [15]NorwayPEMH6615 (Opt. 30)99.999575.5 152.2% 4
Pure Energy CentreUKAlkaline4Nm34Up to 12>99.36263% 4
Sagim [16]FranceAlkalineM50005799.955.6 170.8% 2
Teledyne Energy SystemsUSAAlkalineNH–45045010N/A65.6 160.2% 2
1 Data obtained by conversion from kWh/Nm3 to kWh/kg using a hydrogen density of 0.09 kg/Nm3; 2 Data obtained by conversion from an efficiency given on an LHV basis; 3 Data calculated by authors from production rates and maximum electrical consumption stated in data sheets; 4 Data calculated by authors from the electrical consumption.
Table 3. Technical data of the alkaline electrolyser (FZ/001EL).
QuantityUnitValue
Deionized water inlet[l/h]4.7 max.
Hydrogen outlet[Nm3/h]5.3 max.
[bar g]5 max.
Oxygen outlet[Nm3/h]2.5 max.
[bar g]5 max.
Compressed air[m3/h]1
[bar g]5 to 8
Table 4. Technical data of the air compressor.
QuantityUnitValue
Output pressure[bar g]10 max.
Air flow[m3/min]1.59
Efficiency at full load[%]89
Table 5. Technical data of the air driven hydrogen compressor (booster) (FZ/001HC)
QuantityUnitValue
Compression stages-2
Inlet pressure[bar g]2 to 5
Max. discharge pressure[bar g]200
Drive air pressure[bar g]2.8 to 10.3
Table 6. Main metrological characteristics of the instrumentation.
ComponentFeatureValue
Hydrogen flowmeter (H2/001FT),Accuracy±0.5% Rd plus ± 0.1% FS
Repeatability<0.2% Rd
Pressure transmitter H2/001PT, H2/002PT, H2/003PTAccuracy±0.50% FS
Repeatability<0.1% FS
Pressure transmitter (CA/001PT)Linearity error≤±0.5% FS
Repeatability≤±0.1% FS
Air flow meter/controller (CA/001FC)Accuracy±(0.5% Rd plus 0.5% FS)
Portable network analyser Voltage accuracy0.1% of Vnom
Ampere accuracy±(0.5% Rd plus 5% counts)
Table 7. Quantities measured during the hydrogen production efficiency test with unit of measurement, instrument used for the survey and reference to the position on the P&ID of Figure 2.
QuantityUnitInstrumentP&I Reference
Electrolyser H2 outlet flow rate[Nm3/h]Flow meterH2/001FT
Electrolyser H2 outlet pressure[bar g]Electrolyser displayPT
Electrolyser power consumption[kW]Power analyser-
Ambient temperature[°C]Weather station-
Ambient pressure[hPa]Weather station-
Table 8. Quantities used for the calculation of the electrolyser production efficiency, unit of measurement and methodology used for the calculation.
QuantityUnitFormula, Calculation Method or Value
P H 2 [kW]Equation (4)
L H V [MJ/kg]120 1
V ˙ [Nm3/h]Flow rate measured by the H2/001FT flowmeter referred to normal conditions: 101.325 Pa, 0 °C
ρ H 2 [kg/m3]0.0899 2
P e l ; i n [kW]The average electrical input power in the electrolyser is obtained as an average of the input power values provided from the power analyser
1 IEC 62282-3-200–Stationary fuel cell power systems–Performance test method.; 2 National Institute for Standards and Technology (NIST)–Reference Fluid Thermodynamic and Transport properties Database (REFPROP).
Table 9. Test results for tests with electrolyser operating at 4.6 and 4.2 bar g output pressure.
QuantityUnitAverage
@ 4.6 Bar g
Average
@ 4.2 Bar g
Electrolyser H2 outlet flow rate[Nm3/h]2.525.53
Electrolyser H2 outlet pressure[bar g]4.64.2
Electrolyser power consumption[kW]21.238.6
Ambient temperature[°C]2525
Ambient pressure[hPa]10171017
Electrolyser efficiency 1[%]3643
Specific Energy Consumption 1[kWh/kg]9377
1 Including hydrogen used for filter cartridges regeneration.
Table 10. Quantities measured during the hydrogen production and storage analysis test with unit of measurement, instrument used for the survey and reference to the position on the P&ID of Figure 2.
QuantityUnitInstrumentP&I Reference
Electrolyser H2 outlet flow rate[Nm3/h]Flow meterH2/001FT
Electrolyser H2 outlet pressure[bar g]Electrolyser displayPT
Electrolyser power consumption[kW]Network analyser-
Air compr. power consumption[kW]Network analyser-
H2 compr. driving air flow rate[Nm3/h]Flow controllerCA/001FC
H2 compr. speed[Cycles/min]Stopwatch-
H2 buffer pressure[bar g]Pressure transducerH2/002PT
H2 storage pressure[bar g]Pressure transducerH2/005PT
Ambient temperature[°C]Weather station-
Ambient pressure[hPa]Weather station-
Table 11. Test results for tests with electrolyser operating at 4.6 bar and hydrogen compressor running at 44 cycles per minute.
QuantityUnitFrom
10 to 100 Bar g
From
100 to 200 Bar g
Overall Process: from
10 to 200 Bar g
Electrolyser H2 outlet flow rate (average)[Nm3/h]1.541.431.51
Electrolyser H2 outlet pressure (average)[bar g]4.64.64.6
Electrolyser power consumption (average)[kW]21.221.221.2
Air compressor power consumption (average)[kW]89.78.85
Peak air compressor power consumption[kW]12.412.7-
Peak H2 compressor driving air flow rate[Nm3/h]3556.5-
Storage initial pressure[bar g]1099.3-
Storage final pressure[bar g]100204.5-
Buffer pressure (average)[bar g]4.534.514.52
H2 compressor booster speed[cycles/min]444444
Table 12. Test results for tests with electrolyser operating at 4.6 and hydrogen compressor running at 35 cycles per minute.
QuantityUnitFrom
0 to 172 Bar g
From
172 to 200 Bar g
From
0 to 200 Bar g
Electrolyser H2 outlet flow rate (average)[Nm3/h]1.261.121.19
Electrolyser H2 outlet pressure (average)[bar g]4.64.64.6
Electrolyser power consumption (average)[kW]21.221.221.2
Air compressor power consumption (average)[kW]89.48.7
Peak air compressor power consumption[kW]12.712.7-
Peak H2 compressor driving air flow rate[Nm3/h]35.743.7-
Storage initial pressure[bar g]0167-
Storage final pressure[bar g]172202-
Buffer pressure (average)[bar g]4.584.464.52
H2 compressor booster speed[cycles/min]353535
Publisher’s Note: MDPI stays neutral with regard to jurisdictional claims in published maps and institutional affiliations.