Abstract
Automotive airbags protect occupants from crash forces during severe vehicle collisions. They absorb energy and restrain the occupants by providing a soft cushion effect known as the restraint effect. Modern airbags offer partial restraint effect control by controlling the bag’s vent holes and providing multi-stage deployment. Full restraint effect control is still a challenge because the closed-loop restraint control system needs airbag–occupant contact and interaction feedback. In this work, we have developed novel single and matrix capacitive tactile sensors to measure the occupant’s contact data. They can be integrated with the airbag surface and folded to follow the dynamic airbag shape during the deployment. The sensors are tested under a low-velocity pendulum impact and benchmarked with high-speed test videos. The results reveal that the single sensor can successfully measure occupant–airbag contact time and estimate the area, while the contact position is additionally identified from the matrix sensor.
1. Introduction
In the event of severe vehicle collisions, the airbag deploys in 30–50 milliseconds and restrains the occupants providing a cushion effect [1]. An airbag offers optimum restraint effect when it deploys as designed for the situation; otherwise, there can be mortal injuries. A 20 ms late deployment can increase the risk of head injuries by 14% caused by the airbag and it also increases the risk of collision with the headrest [2]. Therefore, there is a need for control and optimization of the airbag deployment. Since the introductionof airbags, there have been many attempts to optimize the restraint effect and reduce the injuries for different crash situations by tuning various parameters such as airbag deployment time, early occupant coupling with the airbag, pressure dispersion direction and stage-wise deployment [2,3,4,5]. Mercedes-Benz developed PRE-SAFE® Impulse Side. In this technology, the occupant is pushed forward during the potential crashes and engaged with the restraint system to reduce the kinetic energy difference between the occupant and the restraint system. The technology achieved a 35% reduction in upper rib displacement in a standard pole test [3]. Kim et al. designed a low-risk deployment airbag with a protective wrap. It disperses the airbag pressure in lateral directions and reduces the force on the occupants [4]. The self-adaptive vent (SAV) is a useful optimization technique for keeping the airbag inflated for a longer protection time. When the airbag is fully deployed, the tether tightens and closes the vent holes. The airbag remains inflated for a longer time and protects the occupants [5].
The mentioned state-of-the-art technologies do not consider occupant detection and classification (size and position of impact). The occupant contact data with the airbag and the bag pressure feedback are essential to make the airbag self-adaptive. Ultrasonic sensors, capacitive sensors, seat sensors, infrared cameras and computer vision systems can detect the occupants [6,7,8,9,10,11,12,13,14]. Izumi et al. developed an occupant detection system using a far-infrared camera, which provides the occupant’s thermographic images. A vital shortcoming of the IR camera is its difficulty in tracking the occupant after the airbag deployment. Due to the overlap, the occupant or the airbag’s contour cannot be obtained from the thermographic images. Dust particles and temperature changes make occupant tracking further complicated [6].
Computer vision systems have evolved. The occupant’s presence and position can be detected using a stereo camera. If an occupant is present, the geometry and position of the occupant’s head can be calculated further [11]. Farmer et al. developed a vision-based system to classify (adult or child) and track the occupant’s motion. The airbag can be suppressed if an infant seat or an adult who is critically out-of-position is detected [12,13]. Further, adaptive airbag deployment (trigger time) decisions can be made by tracking the occupant’s head’s position and deciding in-position and out-of-position situations [10]. Airbag deployment power can cause mortal injuries if the occupant is in an improper posture. Hence, posture estimation is also crucial for the airbag deployment strategy [12,14].
The vision systems discussed in the literature support only the airbag deployment strategy, for example, trigger time. The airbag deployment strategy is purely based on a set of pre-determined inputs from the machine vision. Airbag-induced injury mitigation requires continuous occupant motion and contact feedback with the airbag during the ride-down phase. Hence, an alternative solution is required.
There is significant technological advancement in capacitive sensing methods to detect the occupant. Blackburn et al. developed an occupant sensing apparatus using a variable capacitor that gives the occupant’s position relative to the cockpit. Airbag trigger time can be decided based on the sensed position, but occupant–airbag interaction is not addressed [7]. Kithil et al. developed a capacitance sensing array mounted at different locations in the cockpit. The sensors provide the occupant position measuring the dielectric change between the plates. However, the array gives only the position. It is hard to address when the occupant contacts the airbag and differentiate between the occupant and the airbag [8]. White et al. designed a capacitive sensor using a rendered portion of the airbag. There is conductive paint on the bag surface connected to a capacitive sensor circuit outside the airbag. The sensor gives the occupant’s contact time with the airbag, but to control the airbag power, we need first contact, out-of-position, and the occupant’s area [9].
2. Problem Description and Research Contribution
The research discussed in the literature focuses mainly on optimizing the airbag for a long-standing time and less impact force. On the other hand, occupant detection systems aid only airbag deployment decisions based on size, motion and posture. The sensing methodologies are successful until the first contact with the airbag. There is a lack of occupant sensing methods for in-crash and post-crash phases. Further, to continuously adapt the airbag power and mitigate the injuries, we need airbag–occupant interaction data, which is still an open research opportunity. The interaction between the occupant and the airbag can be addressed by answering the following questions.
- What are the first and total contact times?
- What is the contact area?
- Where is the contact position?
In this work, we have developed novel single and matrix tactile sensors to detect the occupant and measure the contact parameters, especially contact time and area. The research work answers the stated questions and bridges the gap between pre-crash and in-crash occupant monitoring.
3. Method Overview
This paper focuses on designing and testing capacitive tactile sensors, which answer the stated questions and provide more insight into the airbag–occupant interaction. The sensors consist of a conductive woven fabric connected to a conducting thread. Two sensor variants discussed in this paper are a single sensor, which gives occupant contact time and contact area, and a matrix sensor, which additionally provides the position. Figure 1 shows the sensors’ configuration. The sensors are integrated with the airbag and follow the airbag’s shape during the deployment. In this work, an airbag with sensors is tested under low-velocity pendulum impact. Understanding the sensor’s behavior for different external parameter changes and the airbag deployment phases is crucial. We studied various deployment phases like the textile unfolding, time-to-first-gas, bag inflation and the cable capacitance effects [15]. Time-to-first-gas and inflation do not influence the sensor, whereas the unfolding event and cable capacitance significantly affect the sensor. Additionally, the sensor was benchmarked with contact times from the camera [15]. This paper’s main objectives are sensor calibration, occupant’s contact detection, position estimation and contact area calculation. The contact area and position enable adult-child classification with out-of-position cases, which is crucial to modulate the airbag’s pressure.
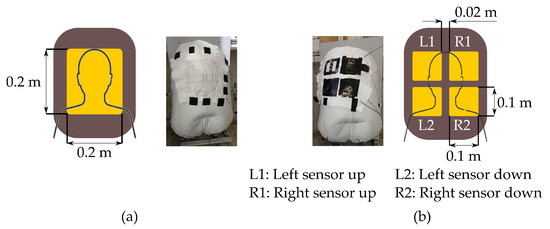
Figure 1.
Sensors’ configuration: (a) single sensor; (b) matrix sensor.
The results of this work have a significant impact on the vent hole control. The vent hole opening can be controlled based on the occupant’s data to optimize the restraint effect and minimize the injuries [16].
4. Capacitive Sensing
The human body has 100 to 300 pF capacitance, which is used to sense the occupant contact with the airbag [17]. In this work, projected self-capacitance theory in loaded mode is applied [18]. A single sensing electrode is installed behind the airbag surface, which acts both as transmitter and receiver [18,19,20,21,22,23,24]. It is called active capacitive sensing due to the single electrode [18]. The sensor is connected to a resistor. The sensor’s voltage is measured using an RC circuit. Suppose the occupant comes near the sensor, the capacitance increases due to the active coupling resulting in voltage drop [21]. The familiar examples of self-capacitance applications are a touch screen of a cell phone, sliders and wheels, control buttons on home appliances and the on-board infotainment of an automotive system [20,21]. Figure 2 shows the analogy between a capacitor and a capacitive sensor. A capacitor comprises two electrodes separated by a dielectric material. If a conducting electrode is removed, it assumes a virtual ground through the human body. This phenomenon is known as projected capacitance [18,19]. In our case, the sensor forms a conductive layer and the airbag textile forms the dielectric layer. A conducting thread is used for the connection between the sensor and the external circuit.
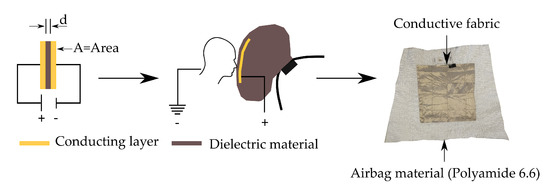
Figure 2.
Sensor concept.
The sensor has a reference capacitance and voltage based on its geometry and dielectric values. Firstly, the reference value has to be measured to detect the touch. The voltage drop from the reference gives the touch. Figure 3 shows the capacitance variation as a function of occupant’s distance from the sensor [22,25]. The capacitance increases when the occupant is in the sensor’s proximity and observes a sharp gradient during the contact. There is a C increase in capacitance, corresponding to V voltage drop across the sensor.
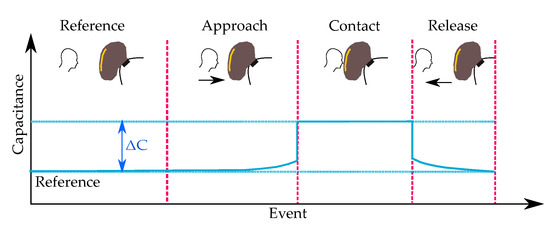
Figure 3.
Capacitance variation as a function of occupant’s distance from the airbag.
Equation (1) gives the voltage across the sensor [19,20,24,25]. The voltages across the capacitor and the supply are and , respectively. t is the time elapsed after the supply and R is the resistor’s resistance. The permittivities of vacuum and dielectric material are and , respectively. A denotes the plate area (contact surface area between the occupant and the sensor), and d is the separation distance (Figure 2).
The sensor voltage behaviour without and with touch is illustrated in Figure 4. The green and blue curves show the voltage () across the sensor without and with touch, respectively, for a supply voltage (). In a transient state, there is a voltage drop of . The time constant T can be varied by varying the resistance. is used as a contact detection parameter. Based on this value, the contact area can be calculated. When there are multiple sensors, an appropriate threshold can be applied to determine the first contact point.
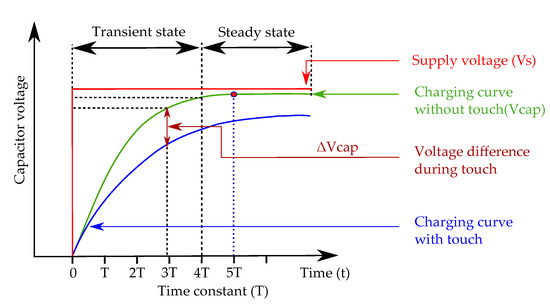
Figure 4.
Capacitor charging curve with and without touch.
Equation (1) is implemented in Matlab® to simulate the sensor voltage behaviour as a contact area’s function. In the theoretical simulation model, a 5 V source signal is given. The airbag fabric is mm thick with . A 220 k resistor is used in series with the capacitor. Figure 5a shows the simulated sensor voltage as a function of the contact area. 5 V is taken as a reference value. If there is a contact, for example, m2, the voltage will be V. The drop from 5 V to V is the illustrated in Figure 5b. As the contact area increases, the voltage drop increases.
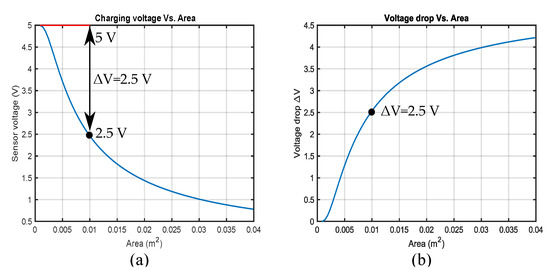
Figure 5.
Sensor’s voltage: (a) voltage–area relation; (b) voltage drop versus increase in contact area.
5. Method
5.1. Sensor Hardware and Circuit
The sensing surface consists of woven conductive fabric with a conductive thread (Figure 6). The fabric is a copper and nickel-plated nylon material that finds application in smart wearable technologies [26]. The thread is made of 30% stainless steel fibers [27].
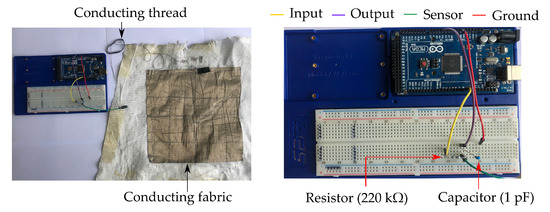
Figure 6.
Hardware connections.
The sensor dimensions are chosen to cover the full human face and partly the neck. The single sensor is a square with 200 mm sides and the matrix sensor has four individual sensors. Each sensor has a square shape with a 100 mm edge (Figure 1). A 20 mm gap is maintained between the sensors to avoid mutual capacitance and mutual touch.
Figure 7 shows the sensor’s circuit diagram [21,23,28]. It is a simple RC circuit. The resistance has to be chosen based on the charging time. A smaller value requires an increased sampling rate; hence a 220 k is selected. A 1 pF capacitor is connected to the ground to stabilize the sensor. The sensing surface is mounted on the airbag. The circuit is implemented using an Arduino development board as shown in Figure 6.
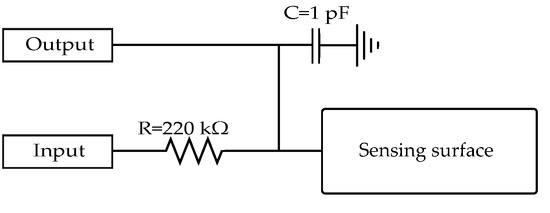
Figure 7.
Sensing circuit.
5.2. Algorithm for Sensor Voltage Change Measurement
Digital input and analog output channels on the Arduino board are utilized to measure the voltage change. The channels are pulled down with internal resistors to avoid floating. A 5 V input signal is given for 136 microseconds. The voltage change across the sensor is measured from the analog channel. After the measurement, input and output channels are discharged and the next cycle is executed.
5.3. Test Bench
A low-impact velocity pendulum test bench is designed to test the sensors as it offers flexibility to change the parameters (Figure 8). It consists of a m swinging arm and a human head-form of diameter 150 mm. The standard head mass of kg is scaled in this work to kg to increase the force. A 5 mm thick rubber sheet is glued to the head to damp the vibrations. Further, a thin aluminum sheet is attached to make the head conductive. The airbag is mounted rigidly and kept inflated. The measurement system (Table 1) includes a standard rotary encoder, an airbag pressure sensor and two high-speed cameras.
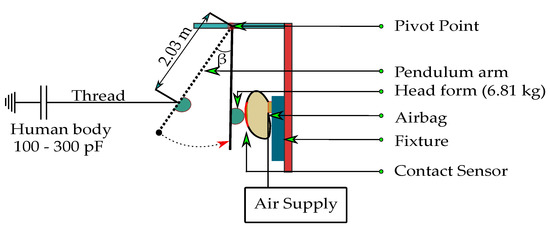
Figure 8.
Low-impact velocity pendulum test bench.

Table 1.
Instrumentation.
A conducting thread provides electrical contact between the pendulum head and the human body to simulate actual human body capacitance, which is kept constant throughout the calibration and testing.
5.4. Sensor Calibration
Squared conducting plates of length 40 mm to 200 mm are used to calibrate the single and the matrix sensors. The plates are pressed against the sensors and voltage drop is measured. Figure 9 shows an exemplary single sensor voltage drop for 200 mm square plate. The maximum voltage drop for the single sensor is V. A mean reference voltage is calculated by averaging the first 300 samples. After many threshold iterations, a 4% threshold is applied to identify the touch. Suppose there is a touch, the voltage drops and reaches a minimum. A 20% threshold is used for the lower voltage because of the high noise. The mean value within a 20% voltage band (yellow curve in Figure 9) is calculated. The difference between mean reference and lower mean is , which gives contact time and the area.
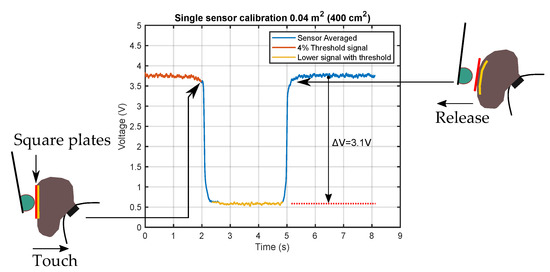
Figure 9.
Voltage drop calculation method.
The voltage drops for different plates are obtained (Figure 10a). A non-linear 4th-order polynomial (in a least-square sense) equation is applied to the voltage drop data to fit the curve. The values of the contact areas are centered at zero and scaled to have a unit standard deviation, which improves the numerical properties of the polynomial. The fitted curve is interpolated using Piecewise Cubic Hermite Interpolating Polynomial (PCHIP) method to calculate the area from the voltage drop (Figure 10b). The curve’s behavior matches the theoretical voltage drop calculation shown in Figure 5b. From the theoretical simulation model, the maximum voltage drop is close to V. During the calibration, the maximum observed drop is V. Cable effects, stray capacitances and environmental parameters contribute to the deviation.
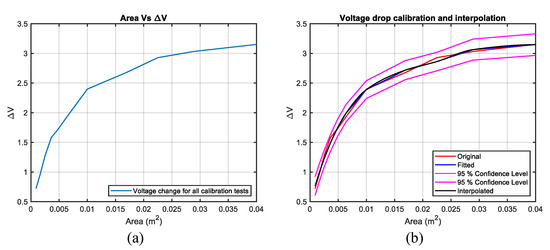
Figure 10.
Calibrated voltage drop curve for single sensor: (a) sensor voltage drop; (b) calibrated and interpolated voltage drop.
Similar to single sensor, individual sensors in the matrix are calibrated (Figure 11 and Figure 12). The maximum voltage drop for all the sensors is between 2 V and V, whereas the simulated voltage drop is close to V.
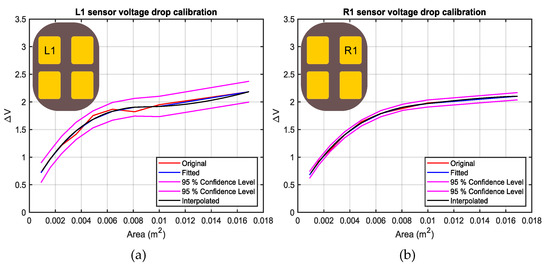
Figure 11.
Calibrated voltage drop curve for L1 and R1: (a) L1 sensor; (b) R1 sensor.
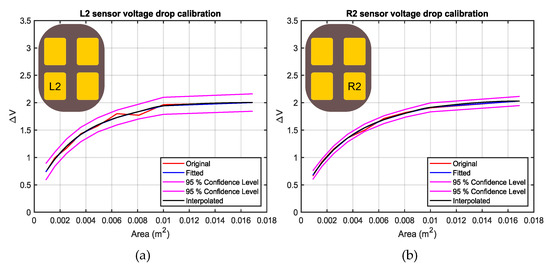
Figure 12.
Calibrated voltage drop curve for L2 and R2: (a) L2 sensor; (b) R2 sensor.
5.5. Hypothesis
It is hypothesized that the sensor voltage decreases with contact progression. At constant pressure and increasing velocity, the voltage drop increases with less contact time due to increased area. Further, the magnitude and peak time depend on the airbag pressure and the impact velocity. The hypothesis is tested by comparing the contact sensor results with the high-speed videos.
5.6. Experimental Design
Airbag pressure, occupant’s impact velocity and the sensor position are the variables that decide the restraint effect in real crash situations. Therefore, we choose these parameters to design the experiments. Changing the pendulum position for out-of-position cases is a challenge to the test results’ reproducibility; hence, the sensor’s position is varied. The head’s velocity is chosen based on the occupant’s motion modeling during crashes [29]. Pressure values are chosen such that there is a perfect contact between the airbag and the sensor (Table 2).
Table 2.
Single-sensor test matrix.
The single sensor is tested by varying airbag pressure and impact velocity (Table 2) while keeping the sensor position and the impact point constant. The matrix sensor is tested with an approximately constant pressure ( bar) and velocity ( m/s) by varying the sensor’s position to identify the position additionally. The matrix sensor has four individual sensors, which are geometrically symmetric on the airbag surface; hence, three experiments are carried out. Two experiments involve L1- and R1-centered impacts, which simulate out-of-position impact with respect to sensors’ configuration and one in the middle of all sensors to simulate in-position impact.
5.7. Sensor Benchmark and Data Analysis Method
5.7.1. Head Depth Calculation from the Contact Sensor
The contact sensors are benchmarked with high-speed videos. Figure 13 shows an exemplary contact event for the single sensor. Since contact occurs before the trigger, the times before 0 s are negative. From the camera, the first touch is at ms and peak displacement occurs at ms. The total contact time is ms. The contact time from the sensor is ms. There is a ms difference with a reasonable agreement between camera and contact sensor time.
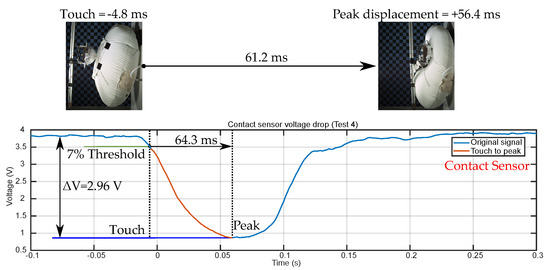
Figure 13.
Sensor benchmarking.
Further, the contact sensor voltage drop at the peak displacement is V. From the calibration curve (Figure 10) the area at V is m2. Since the head is a hemispherical form, the area obtained is the curved surface area of the hemisphere. The head depth ( in Figure 14) is calculated from the curved surface area, which is m (63 mm).
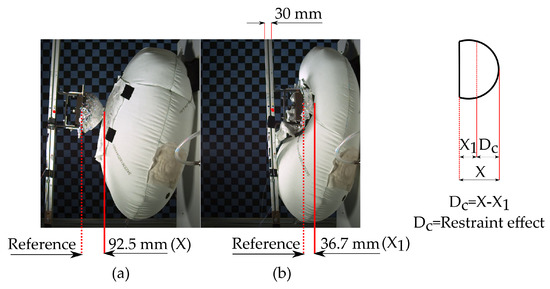
Figure 14.
Depth calculation from high-speed video: (a) first contact; (b) peak displacement.
5.7.2. Head Depth Calculation from the High-Speed Videos
The calculated depth from the contact sensor (Section 5.7.1) is compared with the depth obtained from the high-speed test video analysis. An open-source software (Tracker) is used for kinematic analysis. Initially, the pendulum’s arm width ( m) is calibrated in the video and the impact velocity is calculated. The impact velocities calculated from the swing angle and the video for an exemplary test are m/s and m/s, respectively. Then the peak head displacement is calculated. At the beginning of the contact, head depth (X) from the reference is mm (Figure 14a). When the head is at peak displacement, the depth () from the reference is mm (Figure 14b). The depth is the head depth inside the airbag during the restraint phase, which is mm. There is a mm difference between the depth calculated from the contact sensor (63 mm from Section 5.7.1) and the video.
6. Results
6.1. Single Sensor
The sensor’s voltage is a function of velocity and bag pressure. In the first set of experiments (tests 1 to 4), we observe that when the velocity is increased from a minimum of m/s to m/s, there is a major difference in voltage drop and contact time. From Figure 15a and Table 3 it can be seen that the voltage drop increases from V (test 1) to V (test 3) indicating an increase in the contact area. On the other hand, from Figure 15b, it can be noted that the contact time from the first touch to peak displacement decreases from 114 ms to ms from the test 1 to 3. When the velocity is increased beyond m/s, we observe no further drop in the voltage because the pendulum head covers the sensor completely at m/s. Similar behaviour is observed for tests 5 to 8.
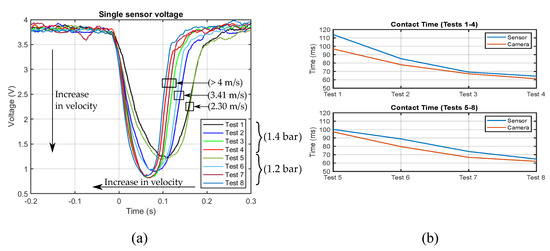
Figure 15.
Single sensor results: (a) sensor voltage drop; (b) contact time comparison for sensor and high-speed camera.
Table 3.
Single sensor results.
Further, Figure 15b shows the contact time comparison for the contact sensor and the camera for different tests. The contact time (first contact to peak depth) decreases with the increase in impact velocity. The maximum and minimum deviations from the camera are 17.76% (test 1) and 2.97% (test 3), respectively.
In the second set of experiments (tests 5 to 8), we reduced the bag’s pressure from bar to bar. The bag pressure variation changes the impact positions dramatically due to its thickness in the inflated condition. The pendulum hits the bag even before achieving maximum velocity, which is a challenge to the reproducibility of the tests. Hence, we varied pressure such that impact always occurs at peak pendulum velocity. We observed similar behavior as in tests 1 to 4. There is no major deviation in the voltage drop values and contact times. From Figure 15a, we observe that the voltage drop for tests 1 and 5 (same velocity and different pressures) are approximately the same (highlighted in black box). Further, the drop behavior for m/s (test 2 and 6) is also similar. After m/s all the tests have the same behavior due to full contact between the pendulum and the sensor.
The contact area is calculated at the peak depth as the kinetic energy and sensor variations are low. Firstly, the depth ( in Figure 14) is calculated from the high-speed video. The voltage drop () from the sensor is compared with the calibration curve and the contact area, A, is calculated. Then the depth () is calculated. is the difference between the depths obtained from the camera and the contact sensor. The deviation is calculated, keeping camera values as the reference (Table 3). The sensor has a minimum and maximum deviation of 13.32% and 16.41%, respectively.
6.2. Matrix Sensor
Figure 16 illustrates matrix sensor results for L1, R1 and middle impacts.
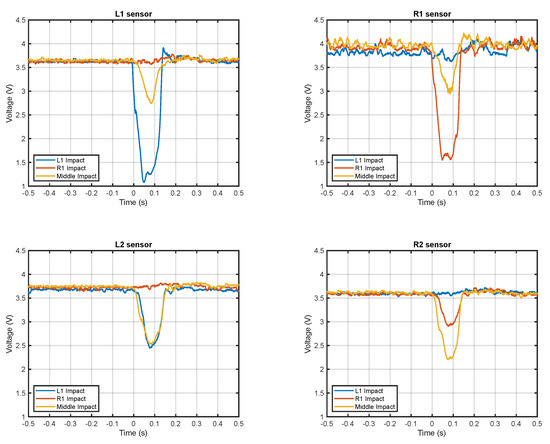
Figure 16.
Matrix sensor tests with different impact points by changing sensor position.
- Impact at L1 sensor: The voltage drops for L1 and L2 are V and V, respectively. The pendulum does not touch R1 and R2.
- Impact at R1 sensor: In this test, the sensor is moved to make R1-centered impact. R1 and R2 sensors record V and V, respectively. R1 has full contact while R2 has partial contact. L1 and L2 record no touch.
- Impact in the middle of all the sensors: The sensors’ voltage drop varies from V to V. The voltage drops are identical since the impact and the sensors are symmetrical.
First contact point estimation is crucial for the in-position and out-of-position decision. The first contact is detected when the voltage drops below 4% of the mean reference value. Table 4 shows the estimated first contact time from the tests. The first column is the impact position. During the L1 impact test, the head first touches the L1 sensor, detecting early touch at ms. Once the airbag starts to deform, the head touches the L2 sensor at ms, followed by R1 touch at ms.
Table 4.
First touch identification for matrix sensor using threshold.
The contact area is calculated similarly to the single sensor (Table 5). The voltage drops of L1, L2, R1 and R2 for the L1 impact are V, V, V and V, respectively. These voltage drops are compared with the calibration curves and the corresponding contact area is calculated. A is the total contact area obtained by adding the gap area between sensors. The depth is then determined and deviation from the camera is calculated. The deviation is close to 22%.
Table 5.
Matrix sensor depth calculation for head-form impact tests.
7. Discussion
Airbag performance is assessed through various test stages. Firstly, static deployment is performed to analyze the unfolding and filling behaviour, followed by linear impactor or pendulum impact tests. These tests are performed to analyze free-form body motion without vehicle deformation to assess airbag performance only. Further, sled tests are carried out on a rigid sled where vehicle motion and seatbelt restraint effects are considered. Finally, full-vehicle crash tests are performed to consider vehicle structural deformation, airbag displacement, and restraint effects. We have chosen pendulum tests in our work while it is practically feasible to change the parameters and provide scaled-down occupant free-form head kinematics and restraint effect. The experiments are cost and time-effective, hence better suited for first performance evaluation and hypothesis testing of the sensors. However, there are certain limitations of the test bench and experiments. The arm length limits the pendulum’s impact velocity and, vibrations in the pendulum increase with arm length. Hence in our study, we have restricted the velocity to m/s. Airbag pressure also has limitations. Pressure change increases the bag thickness, making pendulum impact before maximum kinetic energy, resulting in lower voltage drop and higher contact times. These limitations can be overcome by testing the airbag in a drop tower facility. The results of single and matrix sensors are further discussed in the following subsections.
7.1. Single Sensor
As hypothesized, the sensor voltage drops with contact progression and reaches a minimum when the head reaches peak depth. When the impact velocity is increased, the voltage drop increases due to the larger contact surface.
The deviation (Table 3) for low velocities is less as the sensor makes perfect contact with the head. When the velocity is high, the sensor flies and contacts different parts of the pendulum assembly, contributing to the deviation. This problem can be overcome by knitting the sensor on the airbag. On the other hand, the contact area is smaller when the head slides on the airbag beyond the sensor area. The drop increases when the velocity is increased. The deviations (Table 3) for the single sensor are reasonably acceptable due to dynamic irregular complex deployment. They can be further reduced by adequately integrating the sensor with the airbag. From the single sensor results (Table 3), it can be concluded that as the impact velocity increases, the area deviation also increases. In real-time moderate speed vehicle collisions, the deviation is acceptable.
Further, the contact times obtained from the sensor are in good agreement with the high-speed video times (Figure 15). With the increase in impact velocity, contact time decreases with a higher drop.
7.2. Matrix Sensor
The minimum deviation for the matrix sensor (from the camera depth) as a whole is 21.44% (Table 5), which means the measured area is smaller than the area obtained from the camera. There are several possible reasons. Firstly, the shape of the head is circular. When the head makes contact, the airbag wraps around the head, making contact with other parts at different time stamps. One solution to this problem is to provide a flat contact. This can be achieved by using a square plate. Although the square plate is not a real condition, it can ease the testing and analysis. The second reason is mutual capacitance and contact capacitance induced between the sensors when the object makes contact. A correction parameter can be incorporated in the occupant detection algorithm by testing individual sensors in the matrix. Mutual capacitance can be reduced by increasing the distance between the sensors.
Further, the experimental results answer the questions in Section 2.
- What are the first and total contact times?The contact time from the first contact to the peak can be estimated from both sensors (Figure 15 and Figure 16). Irrespective of the contact position, the single sensor provides first contact time, total contact time, whereas the matrix sensor is position-specific. It gives contact parameters on different regions on the airbag. If there is a single-chambered airbag and out-of-position is not of interest, the single sensor can be preferred over the matrix. If region-specific times are required, the matrix is a choice of application.
- What is the contact area?Both sensors can estimate the area. The deviation for the matrix sensor (Table 5) is higher than the single sensor (Table 3). Hence, when the contact area is the only parameter of interest, the single sensor works better than the matrix sensor. A matrix sensor can be installed to estimate the overall area and the individual sensor area if a multi-chambered passenger airbag is used.
- Where is the contact position?When the impact position is the parameter of interest, then the matrix sensor plays a significant role. The position can be identified from the matrix sensor based on the threshold crossing time for different sensors in the matrix (Table 4). Early position estimation helps decide in-position and out-of-position, which is crucial information to control the individual chamber pressure.
Three main results—first contact point, time and position—significantly impact the vehicle’s passive safety system (airbag or seat belt) during in-crash and post-crash phases. Each parameter can be used to tune the restraint system. Curtain airbags are usually multi-chambered with optional gas flow control between the chambers [30]. The integration of matrix sensors with such airbags enables inflation and exhaust pressure control of each chamber to define an optimal control strategy, which minimizes the occupant’s rebound velocity.
Furthermore, sensor data also play a significant role in injury monitoring and rescue strategies. The vehicle can be used as a diagnostic space by installing accelerometers to monitor the respiration [31,32]. The head depth obtained (Table 3) can be combined with respiration data to correlate injuries and respiration. The detailed injury estimation analysis is beyond the scope of this paper. Finally, there is an eCall system in the vehicles which communicates the accident with vehicle data [33]. The diagnostic data and injury data can be integrated with the eCall system.
8. Conclusions
Airbag–occupant contact detection was an open research opportunity due to the short deployment time, sensor material and complex airbag shape during deployment. In this research, we have successfully developed tactile occupant detection sensors capable of estimating contact time with position and the area. The single sensor can be used when there is less probability of OOP occurrence, whereas the matrix sensor is suitable for bigger multi-chambered airbags with pressure control. The passive safety systems can be fully controlled and tuned from the sensor feedback. Injuries can also be estimated and communicated, which makes airbags smarter and adaptive to various crash scenarios.
Author Contributions
Conceptualization, N.S. and C.B.; methodology, N.S., C.B., T.M.D., R.H.; software, N.S.; validation, N.S. and C.B.; formal analysis, N.S., C.B., T.M.D., R.H.; investigation, N.S.; resources, N.S.; data curation, N.S.; writing—original draft preparation, N.S.; writing—review and editing, N.S., C.B., T.M.D., R.H.; visualization, N.S., C.B., T.M.D., R.H.; supervision, C.B., T.M.D., R.H.; project administration, C.B.; funding acquisition, C.B. All authors have read and agreed to the published version of the manuscript.
Funding
This work was financially supported by Bayerisches Staatsministerium für Wirtschaft, Landesentwicklung und Energie under the grant IUK-1902-0007//DIK0102/01 and APC was funded by Technische Hochschule Ingolstadt.
Institutional Review Board Statement
Not applicable.
Informed Consent Statement
Not applicable.
Data Availability Statement
Data is contained within the article.
Conflicts of Interest
The authors declare no conflict of interest.
References
- Hinch, J.; Hollowell, W.T.; Kanianthra, J.; Evans, W.D.; Klein, T.; Longthrone, A.; Ratchford, S.; Morris, J.; Subramanian, R. Airbag Technology in Light Passenger Vehicles. Available online: https://www.nhtsa.gov/sites/nhtsa.gov/files/rev_report.pdf (accessed on 27 August 2019).
- Ionut Radu, A.; Cofaru, C.; Tolea, B.; Dima, D. Study regarding the influence of airbag deployment time on the occupant injury level during a frontal vehicle collision. MATEC Web Conf. 2018, 184, 01007. [Google Scholar] [CrossRef]
- Schöneburg, R.; Paurevic, M.; Fehring, M.; Richert, J.; Bogenrieder, R. (Eds.) Evaluation of Occupant Protection Systems: From a Preventive to a Pre-Impacting Restraint System. In Proceedings of the 24th International Technical Conference on the Enhanced Safety of Vehicles (ESV), Gothenburg, Sweden, 8–11 June 2015. [Google Scholar]
- Kim, D.E.; Park, W.I.; Shin, B.S.; Kang, M.C. Optimized low-risk deployment of a passenger airbag with a passenger protection wrap considering pressure dispersion. Proc. Inst. Mech. Eng. Part D J. Automob. Eng. 2017, 231, 27–34. [Google Scholar] [CrossRef]
- Kim, Y.S.; Fischer, K.; Nayef, E.; Choi, H.H. (Eds.) Single Stage Driver Airbag Module Development for Out-of-Position. In Proceedings of the 23rd International Technical Conference on the Enhanced Safety of Vehicles (ESV), Seoul, Korea, 27–30 May 2013. [Google Scholar]
- Izumi, T.; Saito, H.; Hagihara, T.; Hatanaka, K.; Sawai, T. Development of Occupant Detection System Using Far-Infrared Ray (FIR) Camera. Available online: https://sumitomoelectric.com/sites/default/files/2020-12/download_documents/69-10.pdf (accessed on 14 April 2020).
- Blackbrun, B.K.; Gentry, S.B.; Mazur, J.F.; Steffens, C.E.; Bessonen, J.E.; Jarocha, W.M. Method and Apparatus for Sensing an Occupant Position Using Capacitance Sensing. U.S. Patent No. 5722686, 3 March 1998. [Google Scholar]
- Kithil, P.W.; Barron, M.H.; McIntosh, W.C. Vehicle Occupant Sensing. U.S. Patent No. US6275146B1, 14 August 2001. [Google Scholar]
- White, C.; Burdock, J.; Clancy, E. Airbag with Bag Mounted Sensor. U.S. Patent No. US2004/0090053 A1, 19 March 2004. [Google Scholar]
- Krotosky, S.J.; Cheng, S.Y.; Trivedi, M.M. (Eds.) Face detection and head tracking using stereo and thermal infrared cameras for “smart” airbags: A comparative analysis. In Proceedings of the 7th International IEEE Conference on Intelligent Transportation Systems, Washington, WA, USA, 3–6 October 2004; IEEE: Piscataway, NJ, USA, 2004. [Google Scholar] [CrossRef]
- Faber, P. Image-based Passenger Detection and Localization inside Vehicles. Int. Arch. Photogramm. Remote. Sens. 2000, 33, 230–237. [Google Scholar]
- Mikic, I.; Trivedi, M. (Eds.) Vehicle Occupant Posture Analysis Using Voxel Data. In Proceedings of the Ninth World Congress on Intellgient Trasport Systems 2002, Chicago, IL, USA, 14–17 October 2002. [Google Scholar]
- Farmer, M.E.; Jain, A.K. Smart Automotive Airbags: Occupant Classification and Tracking. IEEE Trans. Veh. Technol. 2007, 56, 60–80. [Google Scholar] [CrossRef]
- Yang, Y.; Zao, G.; Sheng, J. (Eds.) Occupant Pose and Location Detect for Intelligent Airbag System Based on Computer Vision. In Proceedings of the 2008 Fourth International Conference on Natural Computation, Jinan, China, 18–20 October 2008; IEEE: Piscataway, NJ, USA, 2008. [Google Scholar] [CrossRef]
- Shirur, N.; Birkner, C.; Henze, R.; Deserno, T.M.; Dudhat, D. (Eds.) Effect of Airbag Deployment Phases on Tactile Occupant Sensor. In Proceedings of the 2020 XII International Science-Technical Conference AUTOMOTIVE SAFETY, Kielce, Poland, 21–23 October 2020; IEEE: Piscataway, NJ, USA, 2020. [Google Scholar] [CrossRef]
- Zimmermann, R.E. Vent control as a means of enhancing airbag performance. Shock Vib. 2002, 9, 123–128. [Google Scholar] [CrossRef]
- Jonassen, N. Electrostatics, 2nd ed.; The Springer International Series in Engineering and Computer Science; Springer Science+Business Media New York and Springer: Boston, MA, USA, 2002; Volume 700. [Google Scholar] [CrossRef]
- Grosse-Puppendah, T.; Holz, C.; Cohn, G.; Wimmer, R.; Bechtold, O.; Hodges, S.; Reynolds, M.S.; Smith, J.R. (Eds.) Finding Common Ground: A Survey of Capacitive Sensing in Human-Computer Interaction; ACM: New York, NY, USA, 2017. [Google Scholar] [CrossRef]
- Gray, T. Projected Capacitive Touch; Springer International Publishing: Cham, Switzerland, 2019. [Google Scholar] [CrossRef]
- Touch Sensors Design Guide. Available online: http://www.farnell.com/datasheets/1504633.pdf (accessed on 2 February 2019).
- Russo, T.V. Application Note, Atmel QTouch. Available online: https://www.microchip.com/content/dam/mchp/documents/OTH/ApplicationNotes/ApplicationNotes/Atmel-42094-QTouch-Schematic-and-Layout-Checklist_ApplicationNote_AT02259.pdf (accessed on 10 May 2019). [CrossRef]
- Terzopoulos, N. Capacitive Touch Solutions for Wearable Applications. Available online: https://www.dialog-semiconductor.com/sites/default/files/capacitive_touch_solutions_for_wearable_applications_april_2017.pdf (accessed on 2 February 2019).
- Fischer, D. Capacitive Touch Sensors. Available online: https://pdf4pro.com/view/capacitive-touch-sensors-fujitsu-global-e79f7.html (accessed on 5 March 2019).
- Application Note: Capacitive Touch Sensing Layout Guidelines. Available online: https://www.mouser.com/pdfdocs/semtech-capacitive-touch-sensing-layout-guidelines.pdf (accessed on 6 May 2019).
- Takamatsu, S.; Yamashita, T.; Imai, T.; Itoh, T. Fabric Touch Sensors Using Projected Self-Capacitive Touch Technique. Sens. Mater. 2013, 25, 627–634. [Google Scholar] [CrossRef]
- Adafruit Woven Conductive Fabric. Available online: https://www.adafruit.com/product/1168 (accessed on 15 February 2019).
- EXPTECH, Conductive Thread. Available online: https://www.exp-tech.de/zubehoer/sonstige/7419/conductive-thread-60g-stainless-steel?gclid=EAIaIQobChMI-L_1-42I5gIVUaqaCh2NOgvwEAQYBSABEgJ2KfD_BwE (accessed on 10 February 2019).
- Arduino Capacitive Sensing Library. Available online: https://playground.arduino.cc/Main/CapacitiveSensor/ (accessed on 20 May 2019).
- Lina, P.-V.; Jurkauskas, A. Research into Occupant’S Motion in Vehicles During Crashes. Transport 2004, 19, 184–190. [Google Scholar] [CrossRef][Green Version]
- Eung-Seo, K.; Dae-Young, K.; Hyeong-Ho, C.; Han-Il, B.; Seung-Hui, Y.; Seung-Man, K.; Dong-Jun, L.; Kwang-Soo, C. (Eds.) A Stufy of Curtain Airbag Design Factors for Enhanancement of Ejection Mitigation Performance. In Proceedings of the 22nd International Technical Conference on the Enhanced Safety of Vehicles (ESV), Washington, DC, USA, 13–16 June 2011. [Google Scholar]
- Wang, J.; Warnecke, J.M.; Deserno, T.M. The Vehicle as a Diagnostic Space: Efficient Placement of Accelerometers for Respiration Monitoring uring Driving. ICT Health Sci. Res. 2019, 258, 206–210. [Google Scholar] [CrossRef]
- Wang, J.; Warnecke, J.M.; Haghi, M.; Deserno, T.M. Unobtrusive Health Monitoring in Private Spaces: The Smart Vehicle. Sensors 2020, 20, 2442. [Google Scholar] [CrossRef] [PubMed]
- Bonyar, A.; Geczy, A.; Krammer, O.; Santha, H.; Illes, B.; Kaman, J.; Szalay, Z.; Hanak, P.; Harsanyi, G. (Eds.) A review on current eCall systems for autonomous car accident detection. In Proceedings of the 2017 40th International Spring Seminar on Electronics Technology (ISSE), Sofia, Bulgaria, 10–14 May 2017; IEEE: Piscataway, NJ, USA, 2017. [Google Scholar] [CrossRef]
Publisher’s Note: MDPI stays neutral with regard to jurisdictional claims in published maps and institutional affiliations. |
© 2021 by the authors. Licensee MDPI, Basel, Switzerland. This article is an open access article distributed under the terms and conditions of the Creative Commons Attribution (CC BY) license (https://creativecommons.org/licenses/by/4.0/).