Article

Opportunities in Measuring Multiscale Pore Structure of the Continental Shale of the Yanchang Formation, Ordos Basin, China

1
Faculty of Urban Construction, Beijing University of Technology, Beijing 100124, China
2
Oil and Gas Survey, China Geological Survey, Beijing 100083, China
3
Tianjin Centre, China Geological Survey, Tianjin 300170, China
4
Key Laboratory of Shale Gas and Geoengineering, Institute of Geology and Geophysics, Chinese Academy of Sciences, Beijing 100029, China
*
Authors to whom correspondence should be addressed.
Energies 2021, 14(17), 5282; https://doi.org/10.3390/en14175282
Submission received: 19 July 2021 / Revised: 13 August 2021 / Accepted: 17 August 2021 / Published: 26 August 2021

Abstract

:
Pores of shale exhibit multiscale characteristics, and pore characterization is challenging due to the complexity of pore systems. Currently, research is focused on nano-submicron pores, but the structure of micrometer-scaled pores is not well understood. In this research, an investigation of the three-dimensional pore network of the Chang 7 shale in the Ordos Basin of China was conducted, in order to provide an insight into the full characteristics of pore systems. Nano-CT and micro-CT scanning technology was used to comprehensively delineate the pore structure at different scales, for further understanding the gas storage mechanism in shale rocks. Results show that the radius of micro-scale pores ranges from 1 to 15 μm, with an average of 2.8 μm, and pores with radii of 1–5 μm occupy approximately 90% of all the pores. For the nano-scale pores, the size ranges from 86 to 2679 nm, with an average of 152 nm, yet it has a rather concentrated distribution within 300 nm. The nano-scale pores constitute most of the pore amount in the shale, whereas the micro-scale pores constitute most of the pore volumes. Moreover, the results show that more than 70% of nano-scale pores in the Chang 7 shale are isolated pores, indicating that pore bodies formed in the shale reservoir have poor connectivity. Positive linear relationships between pore sizes and the number of pore throats at the micro-scale and nano-scale were both obtained, suggesting that larger pores tend to have better connectivity than smaller pores.

1. Introduction

Shale gas in the Ordos Basin of China is mainly stored in the lacustrine deposits of the Upper Triassic Yanchang Formation [1,2]. Unlike sandstone or carbonate rock conventional reservoirs, the pores of shale have a complex structure. It is deemed that pores play a vital role in the gas storage and enrichment in shale [3,4,5,6,7]. Investigation on the geometry and connectivity of shale pores plays a vital role in gas exploitation in shale reservoirs [8,9].
Methods to characterize the structure of pores could be classified into three broad categories: direct methods, indirect methods, and methods combined direct methods with indirect methods [10]. The indirect method, for example, the gas adsorption method, is widely used to determine the pore size distribution, yet it could not obtain the shape and the connectivity information of pores [10,11] The direct method, such as scanning electron microscopy (SEM), field emission SEM (FE-SEM), focused ion beam SEM (FIB-SEM), and X-ray computed tomography (X-ray CT, including Micro-CT and Nano-CT), is utilized to obtain the geometry of pores [12,13]. SEM and FE-SEM are only utilized to observe the pore structure in two dimensions [14]. The resolution of FIB-SEM could be several nanometers and thus it provides a useful tool to study the three-dimensional pore structure at a nanoscale. However, a shale sample should be destroyed to perform an FIB-SEM test, and unfortunately, the sample could not be used for further study [15]. Currently, combined methods are also applied to characterize 2D and 3D pore geometry [16,17]. However, the experimental conditions of different methods often vary, and thus an unacceptable error may occur. Among these methods, X-ray CT is a non-destructive method and could be successfully applied to determine the 3D structure of pores. Besides, it could efficiently characterize macro-pores larger than 79 nm and micro-fractures, without generating new fractures during high-pressure fluid injection or destroying shale samples [14].
Currently, several gas reservoirs have been found in the Ordos Basin, China [18]. The source of the gas in these reservoirs is the Chang 7 shale from the Yanchang Formation [19]. To evaluate the gas resource potential, studies on the pore structure of the Chang 7 shale were conducted [20,21]. However, these studies mainly focused on nano-submicron pores, whereas the contribution of microscale pores to the pore system of shale reservoirs is neglected, and thus fails to cover the wide range of pore sizes [22]. The distribution of microscale pores in unconventional reservoirs strongly affects the flow behavior and recoverability of reservoir fluid. Compared with nanopores, the fluid in microscale pores is easier to be removed, which plays an important role in the gas production process [23]. To reveal the 3D pore network of the Chang 7 shale at different scales, a multi-scale investigation of pore structure is carried out in this research. Based on the Nano-CT and Micro-CT imaging, the geometry of pores and their connectivity are analyzed. Besides, the relationship between pore size and pore throat distribution is discussed.

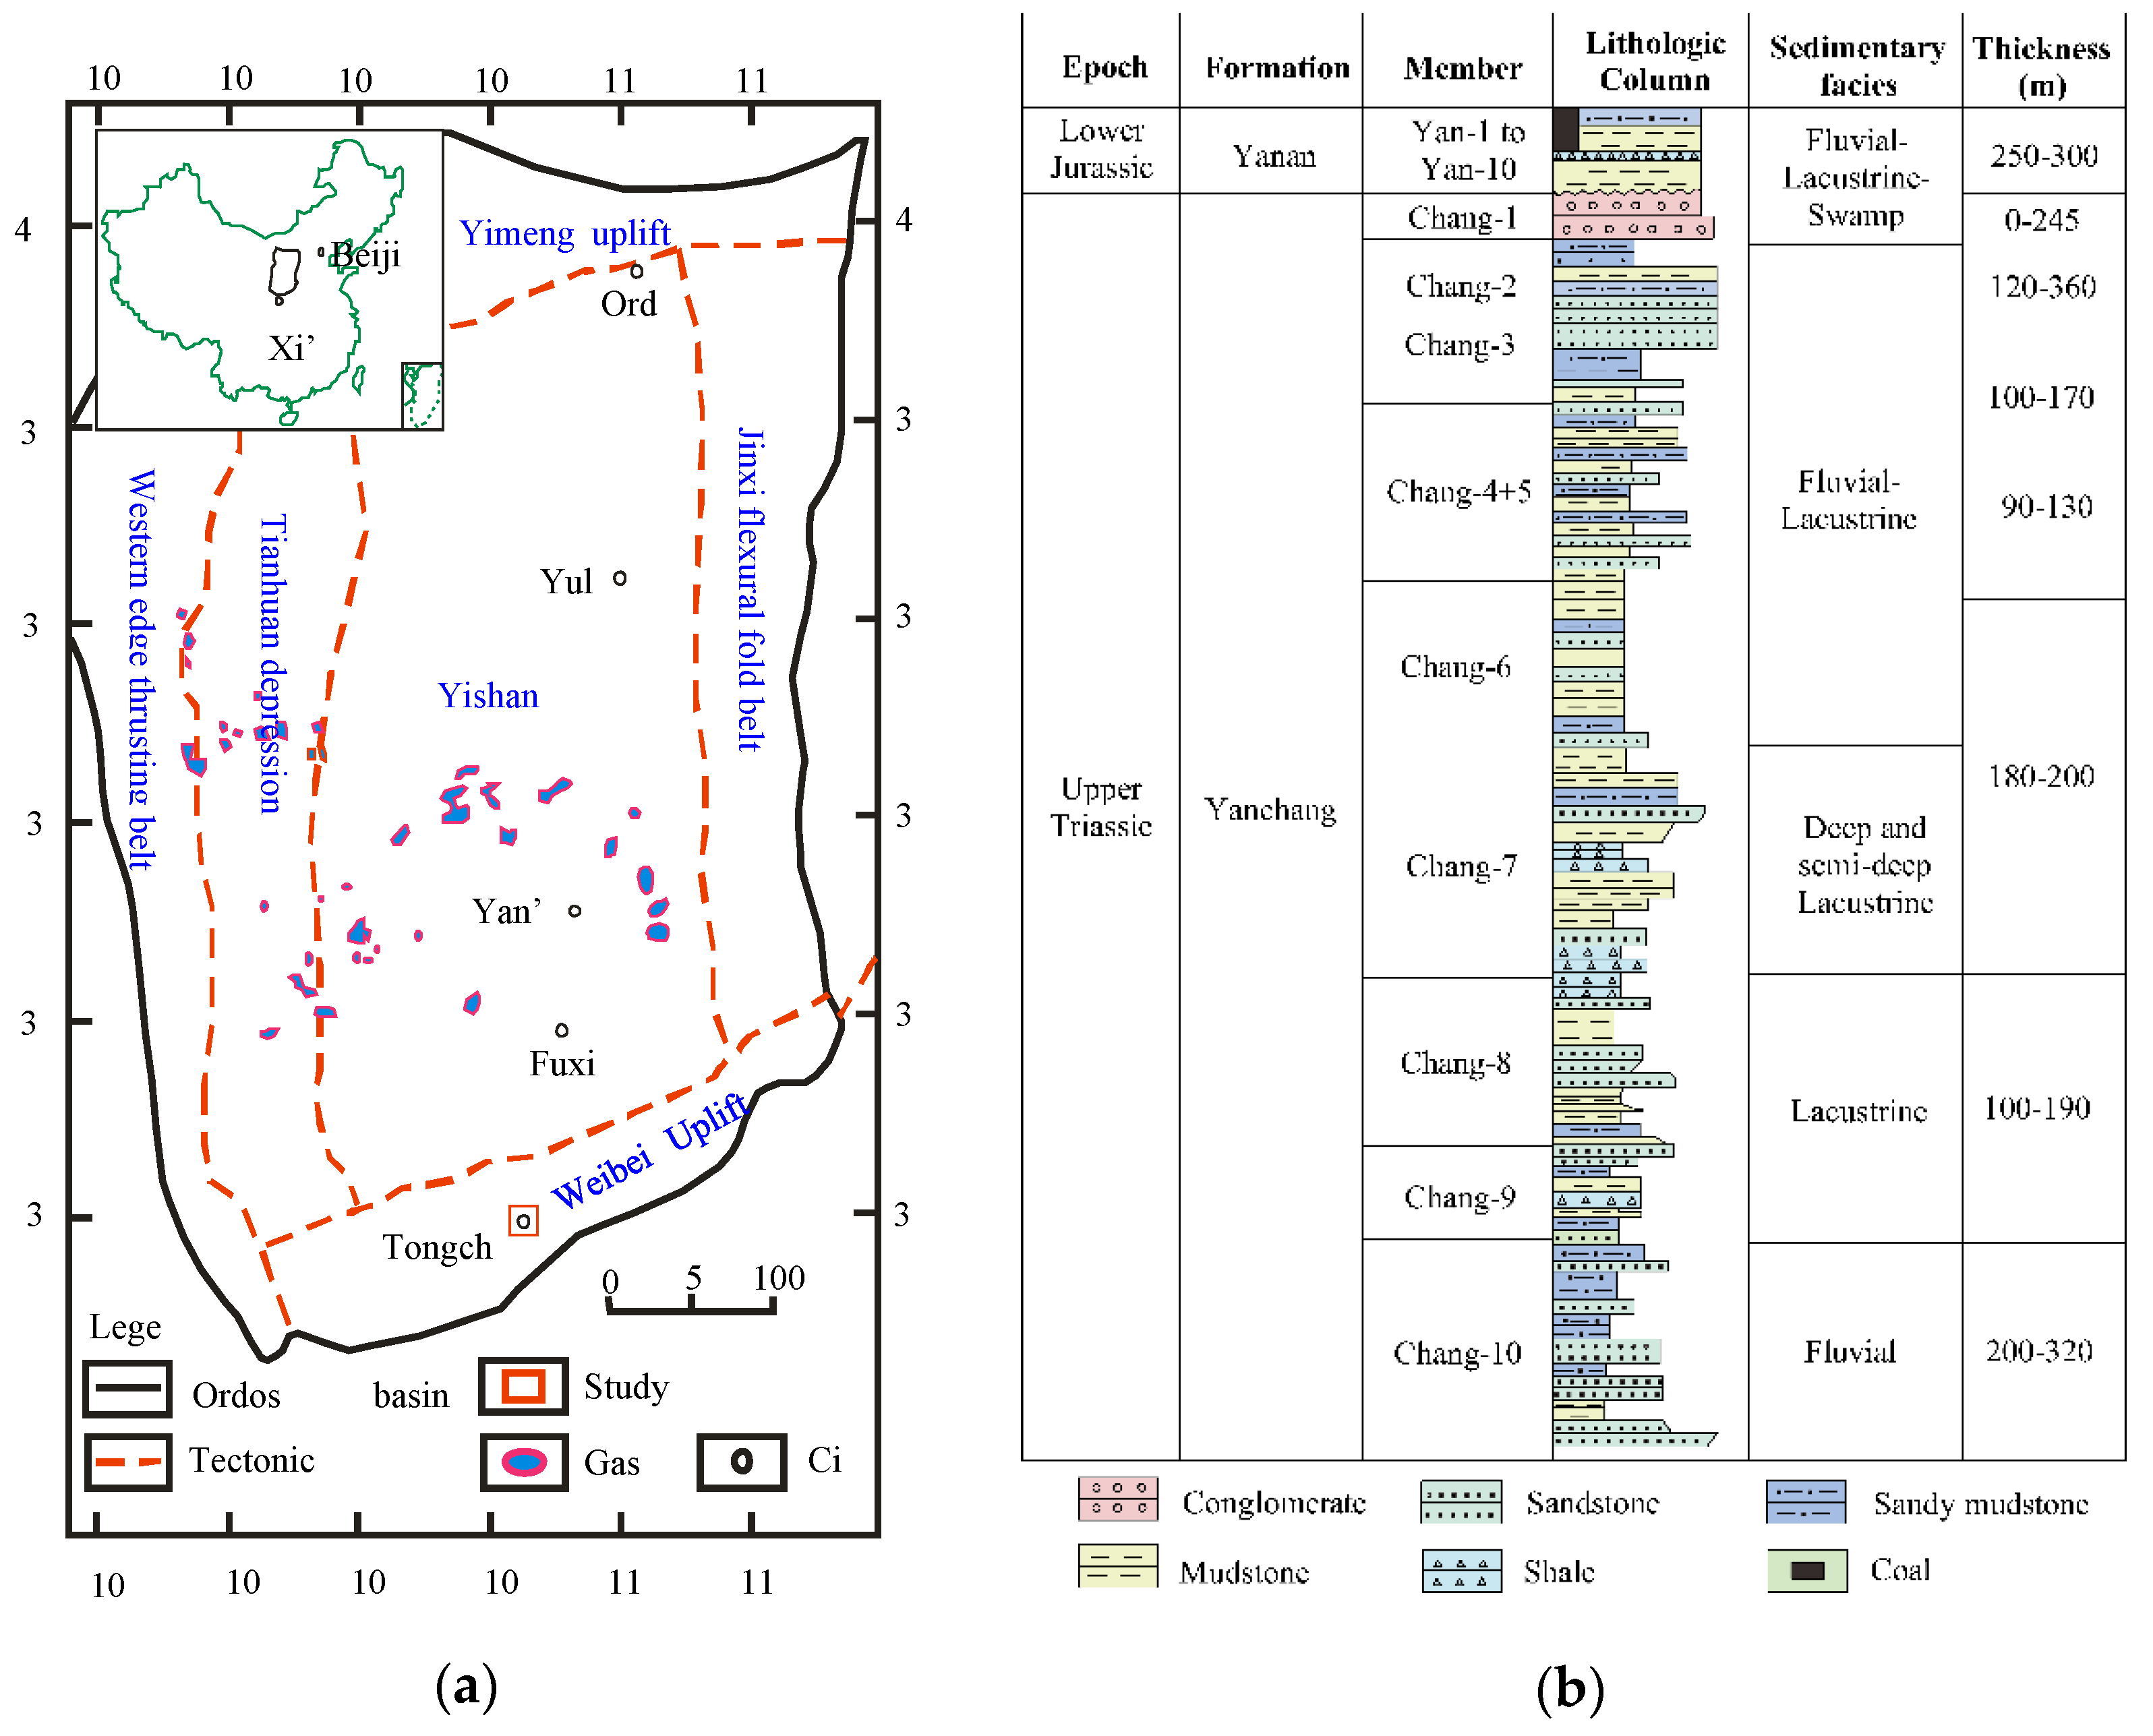
2. Geological Setting

The study area is located in the Yaoqu town of Tongchuan city, south of the Ordos basin (Figure 1a), China. Tectonically, the Ordos basin is surrounded by six orogenic belts [24,25], and the study area is located at the Weibei uplift zone. The main source of rock for a gas resource is shale from the Upper Triassic period [26]. The shale rock in this area is strongly fractured due to complicated sedimentation processes and tectonic movements.
The Upper Triassic strata, named the Yanchang Formation, with a thickness of about 1300 m, provide about 75% of the oil resources of the Ordos basin [25]. It is divided into 10 members from Chang 10 (bottom) to Chang 1 (top). The Chang 7 shale was developed in a lacustrine environment. It is the main hydrocarbon source rock in the basin. The Chang 7 member is mainly composed of black shale and sand-mudstone, with a depth varying from 1000 m to 1650 m [28]. The average thickness of the Chang 7 layer is about 60 m. A previous study in this area shows that the total organic carbon (TOC) content of the Chang 7 layer varies from 0.5% to 6.1%, and the average gas capacity is approximately 3.71 m3/t [28]. According to the sedimentary cycle, the Chang 7 layer could be classified into three sub-members: Chang 7-1, Chang 7-2, and Chang 7-3. Scientific research on well YK01, with a depth of 502 m, was performed to explore the physical and mechanical properties of the Yanchang Formation. The strata exposed by the YK01 well are the Chang 4-10 Members, as shown in Figure 1b. The Chang 7-2 shale is deemed to be the main source rock for gas development attributed to the high content of organic carbon [29]. It is mostly made up of black shale and dark mudstone, and the average thickness is approximately 20 m. In this work, the Chang 7-2 shale is studied to investigate the characteristics of pores and the sample was obtained from cores of the YK01 well.
The XRD results in Table 1 show that the Chang 7 shale is mainly composed of clay minerals, feldspar, and quartz, with average contents of 42.5%, 15.8%, and 29.1%, respectively [20]. The clay minerals mainly consist of illite, chlorite, and kaolinite. The total organic carbon (TOC) values vary from 0.5% to 11.4%, with an average of 4.7%. The BSE image (Figure 2a) of the sample from the YK01 well shows that the predominant minerals in the shale are feldspar, pyrite, quartz, and organic matter. Note that the contents of oligoclase and anorthite in the shale are much higher than other members of the plagioclase group, and, therefore, the two minerals were distinguished from the plagioclase group in Figure 2a. The plagioclase in Figure 2a refers to other members of the plagioclase group excepted for oligoclase and anorthite. Figure 2a shows that the distribution of minerals is characterized by layers and the mineral composition in different layers differs. The content of quartz, pyrite, and feldspar occupies 12%, 17%, and 20% of the sandy layer, respectively. However, in the tuffaceous layer, feldspar is dominant (55%), other minerals including quartz, calcite, and pyrite occupy 9%, 8%, and 5%, respectively. The organic matter in the sandy layer has a relatively low content and is distributed uniformly in the shale rock (Figure 2b). In the tuffaceous layer, the organic matter has a relatively high content and is distributed concentratedly (Figure 2c). In this work, the samples for micro-CT and nano-CT were taken from the organic matter-enriched laminas since quantifying the pore size distribution in these laminas is important for gas adsorption and desorption process modeling, which can provide significant guidance for actual production [30,31].

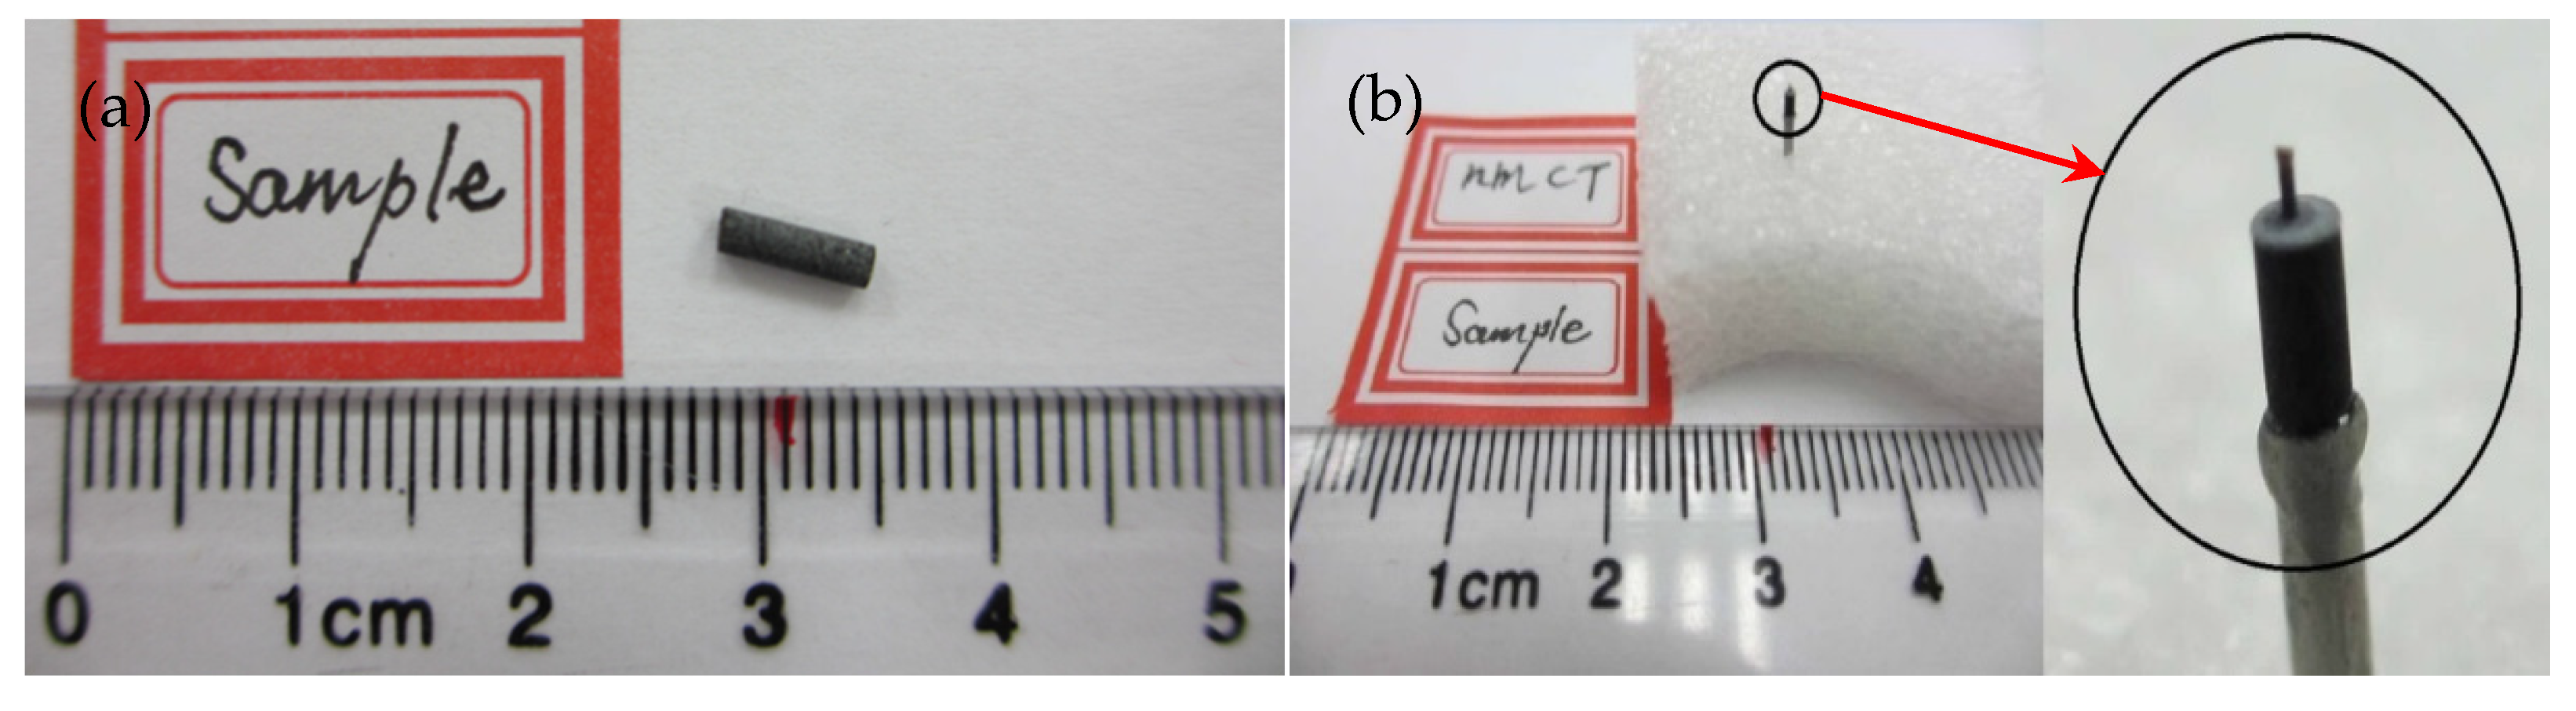
3. Materials and Methods

The shale sample used in this research was collected from the YK01 well. Proper core handling procedures during sampling and storage were performed to reduce physical or chemical alterations [32]. A micro-drilling machine was used for preparing a cylindrical shale sample for micro-CT scanning (Figure 3a). The size of the sample is 2 mm (diameter) × 2 mm (height). The sample was prepared perpendicular to the bedding direction. After the micro-CT analysis was finished, a sample of 65 μm in diameter and 65 μm in height (Figure 3b) was sampled from the 2 mm diameter sample and then was used for nano-CT scanning.
An Xradia VERSA-500 micro-CT scanner was used to characterize the micro-scale structure of shale pores. The maximum spatial resolution of this equipment is 1 μm. The scanning area was set as 2 mm × 2 mm. The sample was scanned under a temperature of 22 °C, and the exposure time for each slice was 30 s. It took about 24 h to finish the scanning. We obtained 1984 two-dimensional (2D) slices with a size of 2048 × 2048 pixels through micro-CT scanning. The nano-scale pore structure of shale was obtained using an Xradia UltraXRM-L200 nano-CT. The maximum resolution of the nano-CT is 65 nm, and the scanning area was 65 μm × 65 μm. 1021 slices of 2D images with a size of 1024 × 1024 pixels were obtained through nano-CT scanning. The nano-CT scanning was conducted at the same temperature as the micro-CT, but the exposure time for one slice was 120 s. A total of 40 h was needed to complete the scanning. Due to the influences of shale sample thickness, exposure time of the experiment, and other factors, the minimum pore size characterized by nano-CT scanning and micro-CT scanning was 86 nm and 1.3 μm, respectively [10,33].

4. Results and Discussions

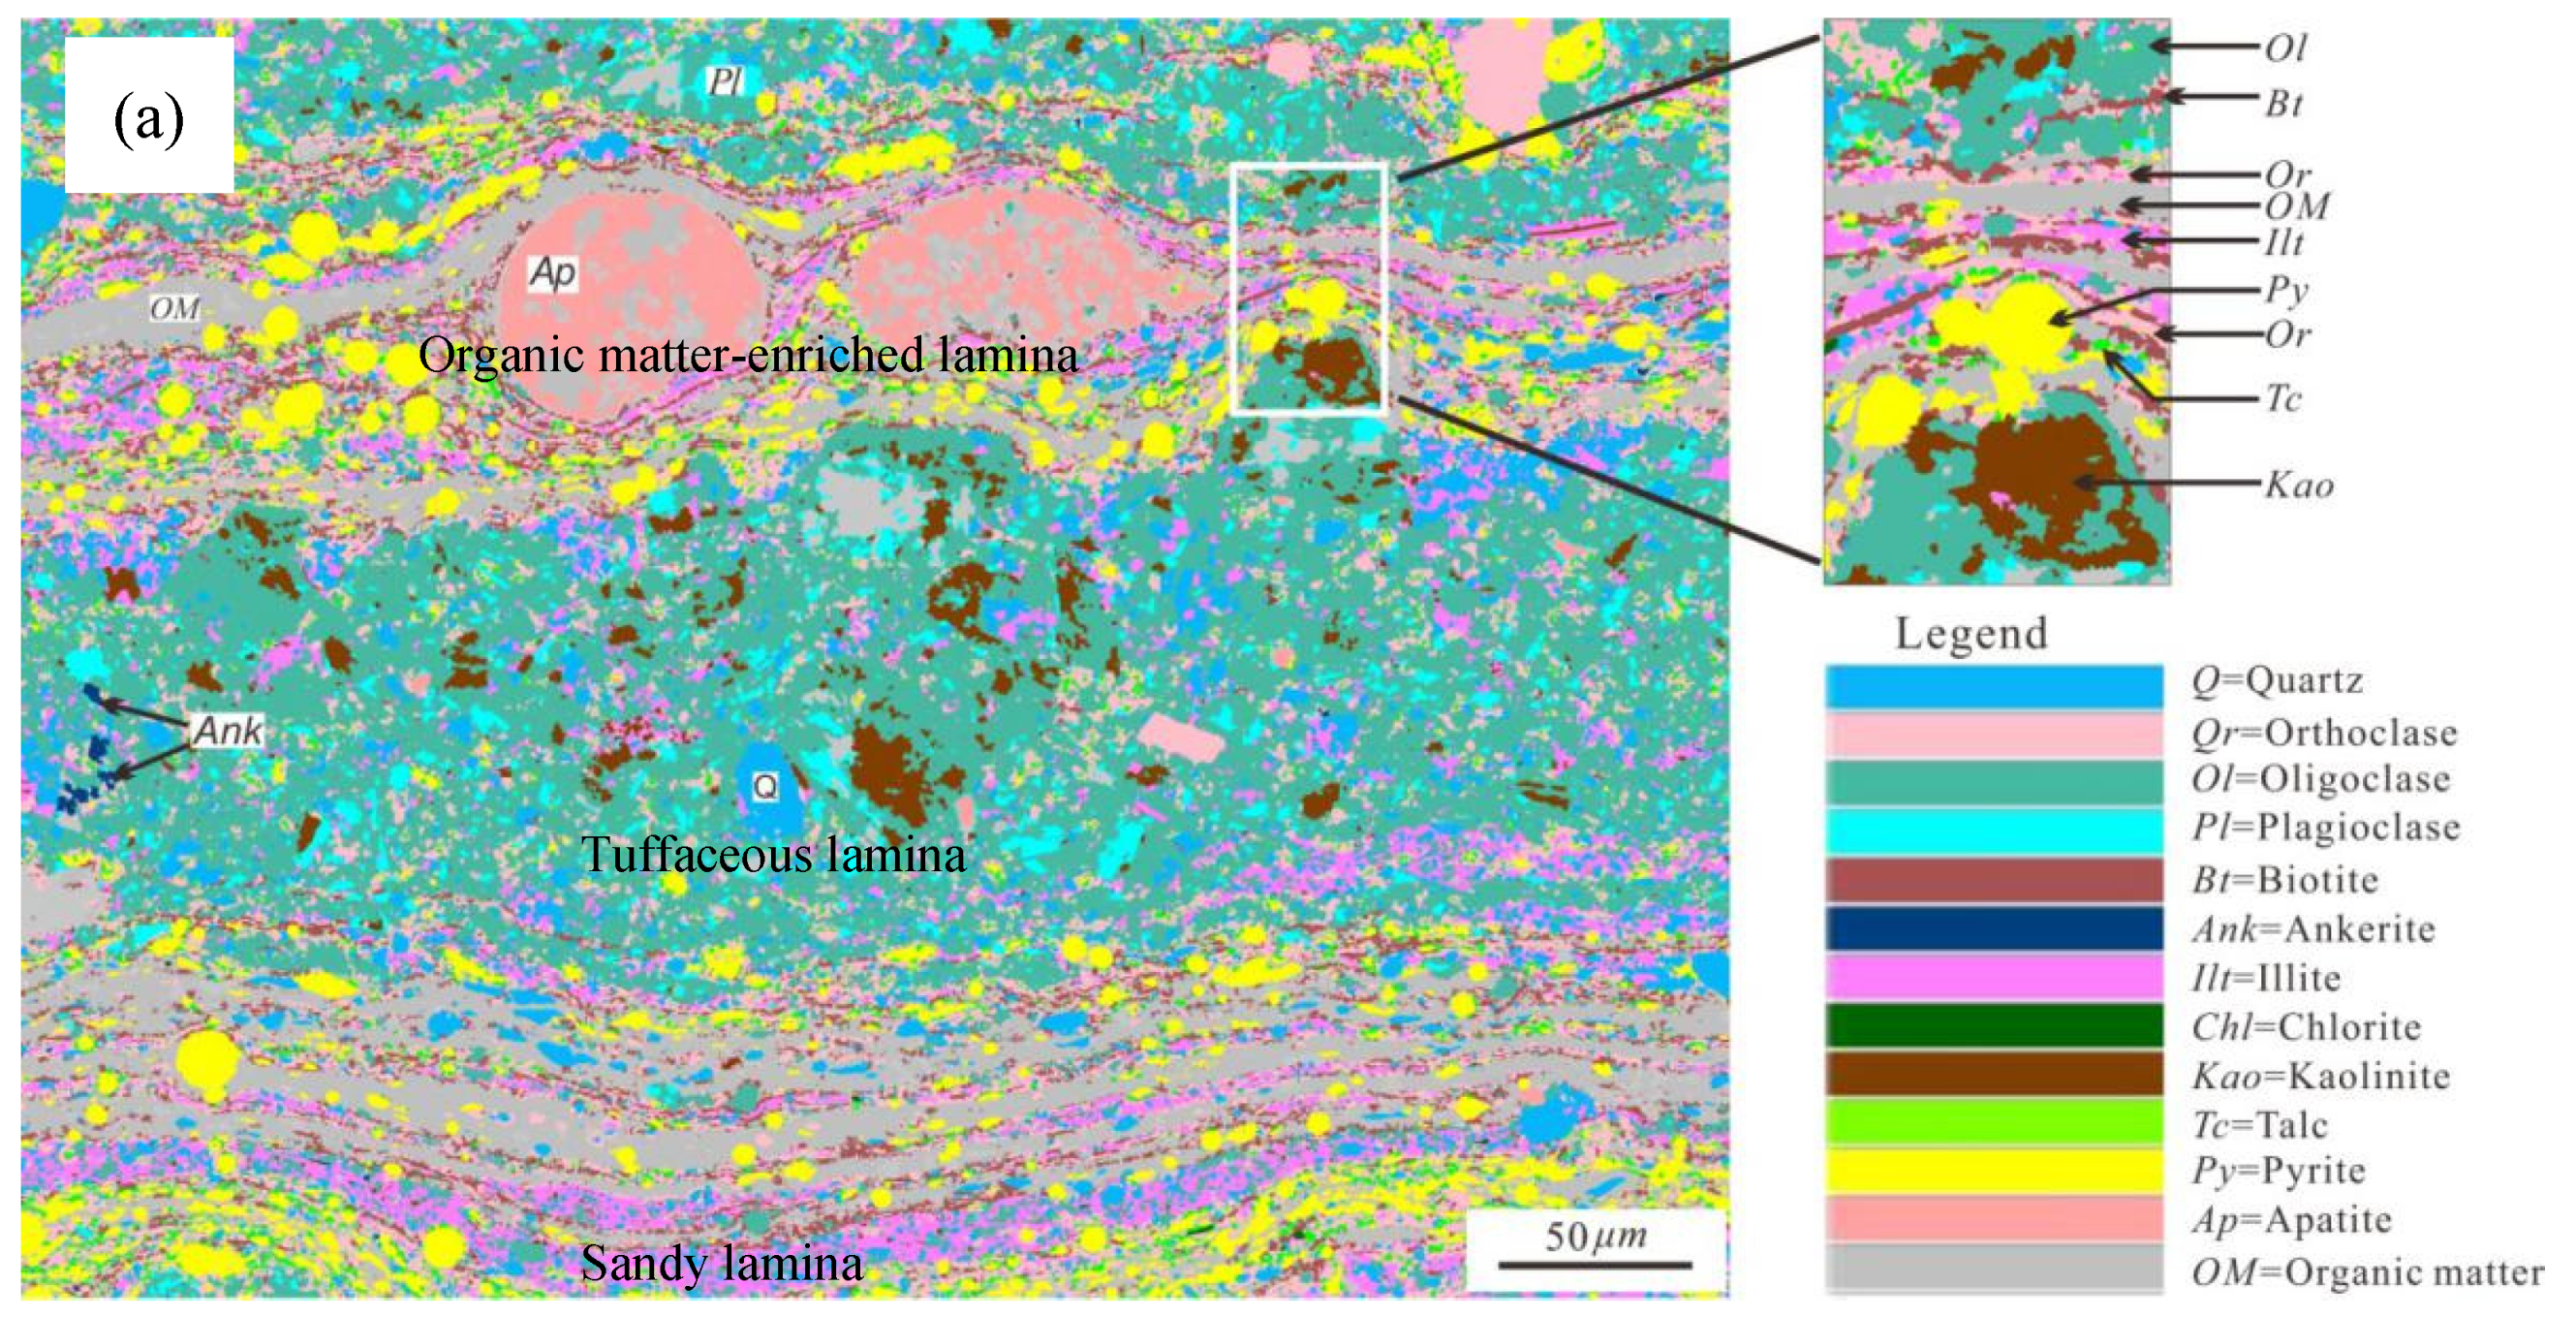
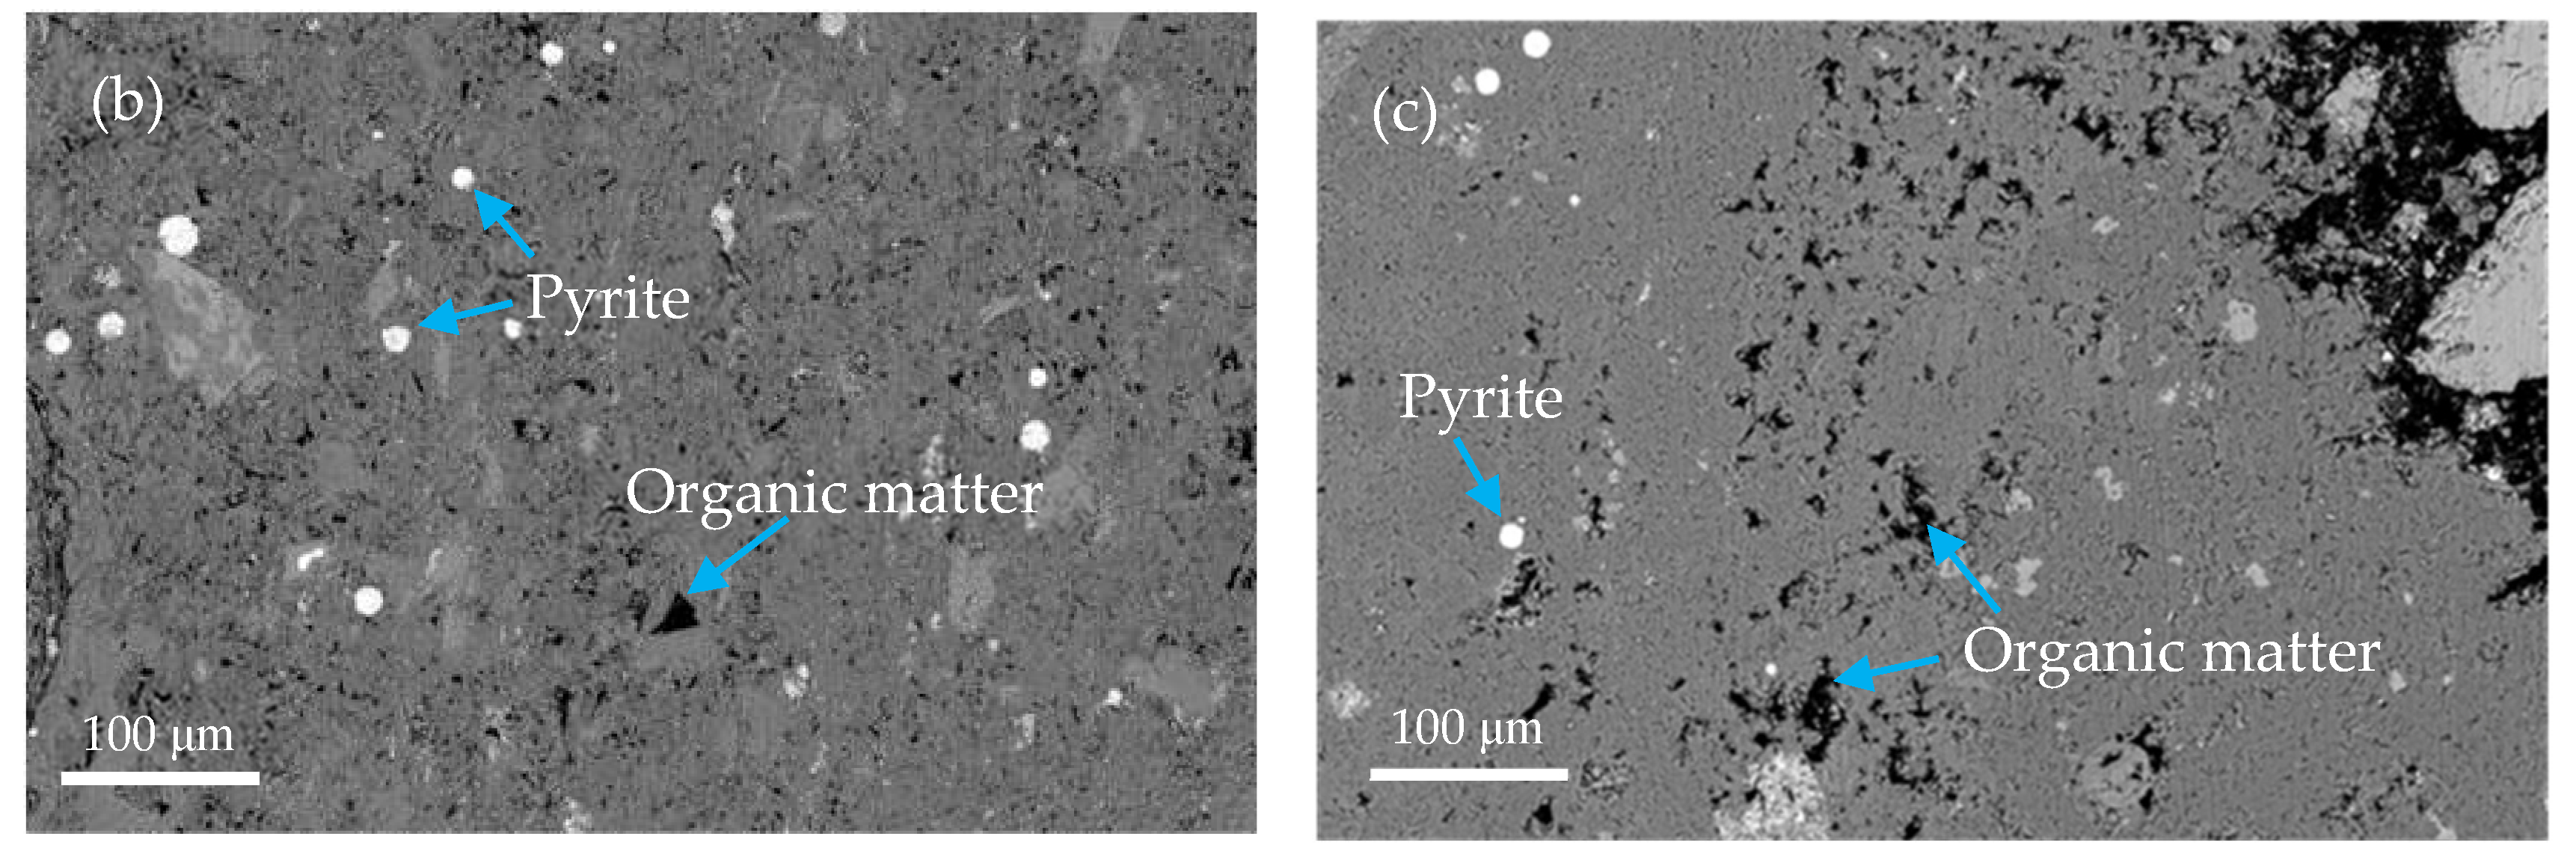
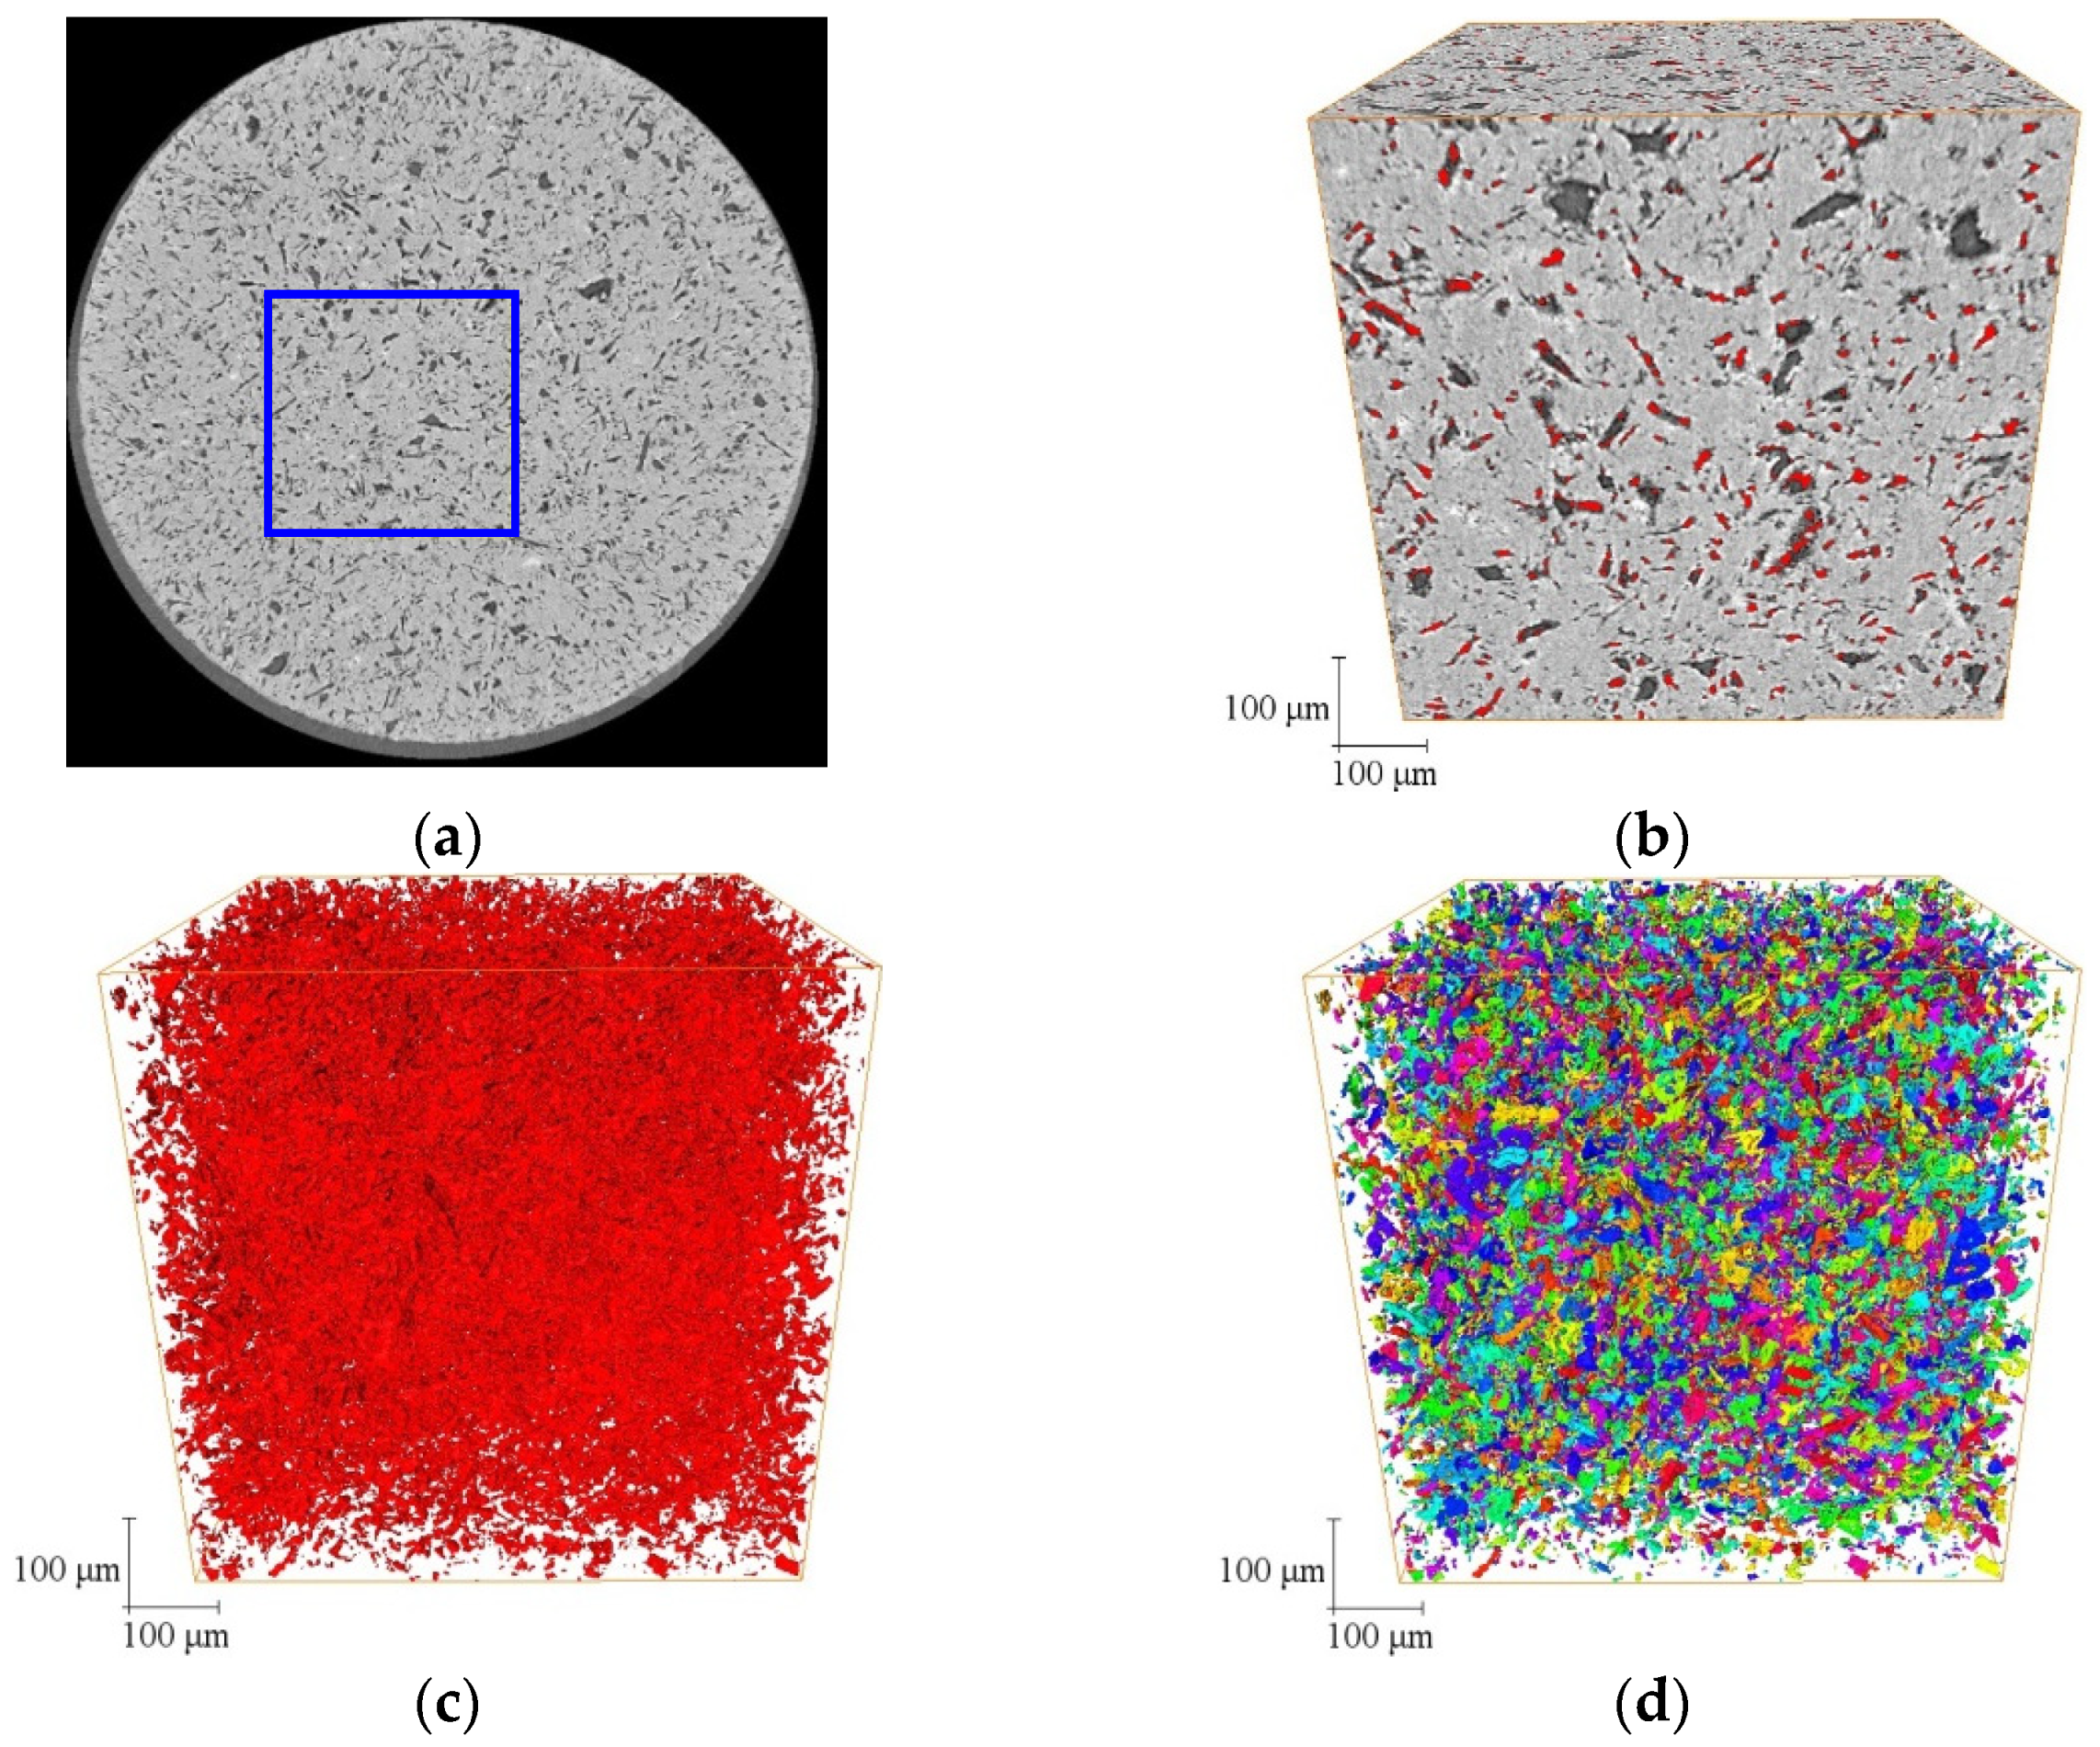
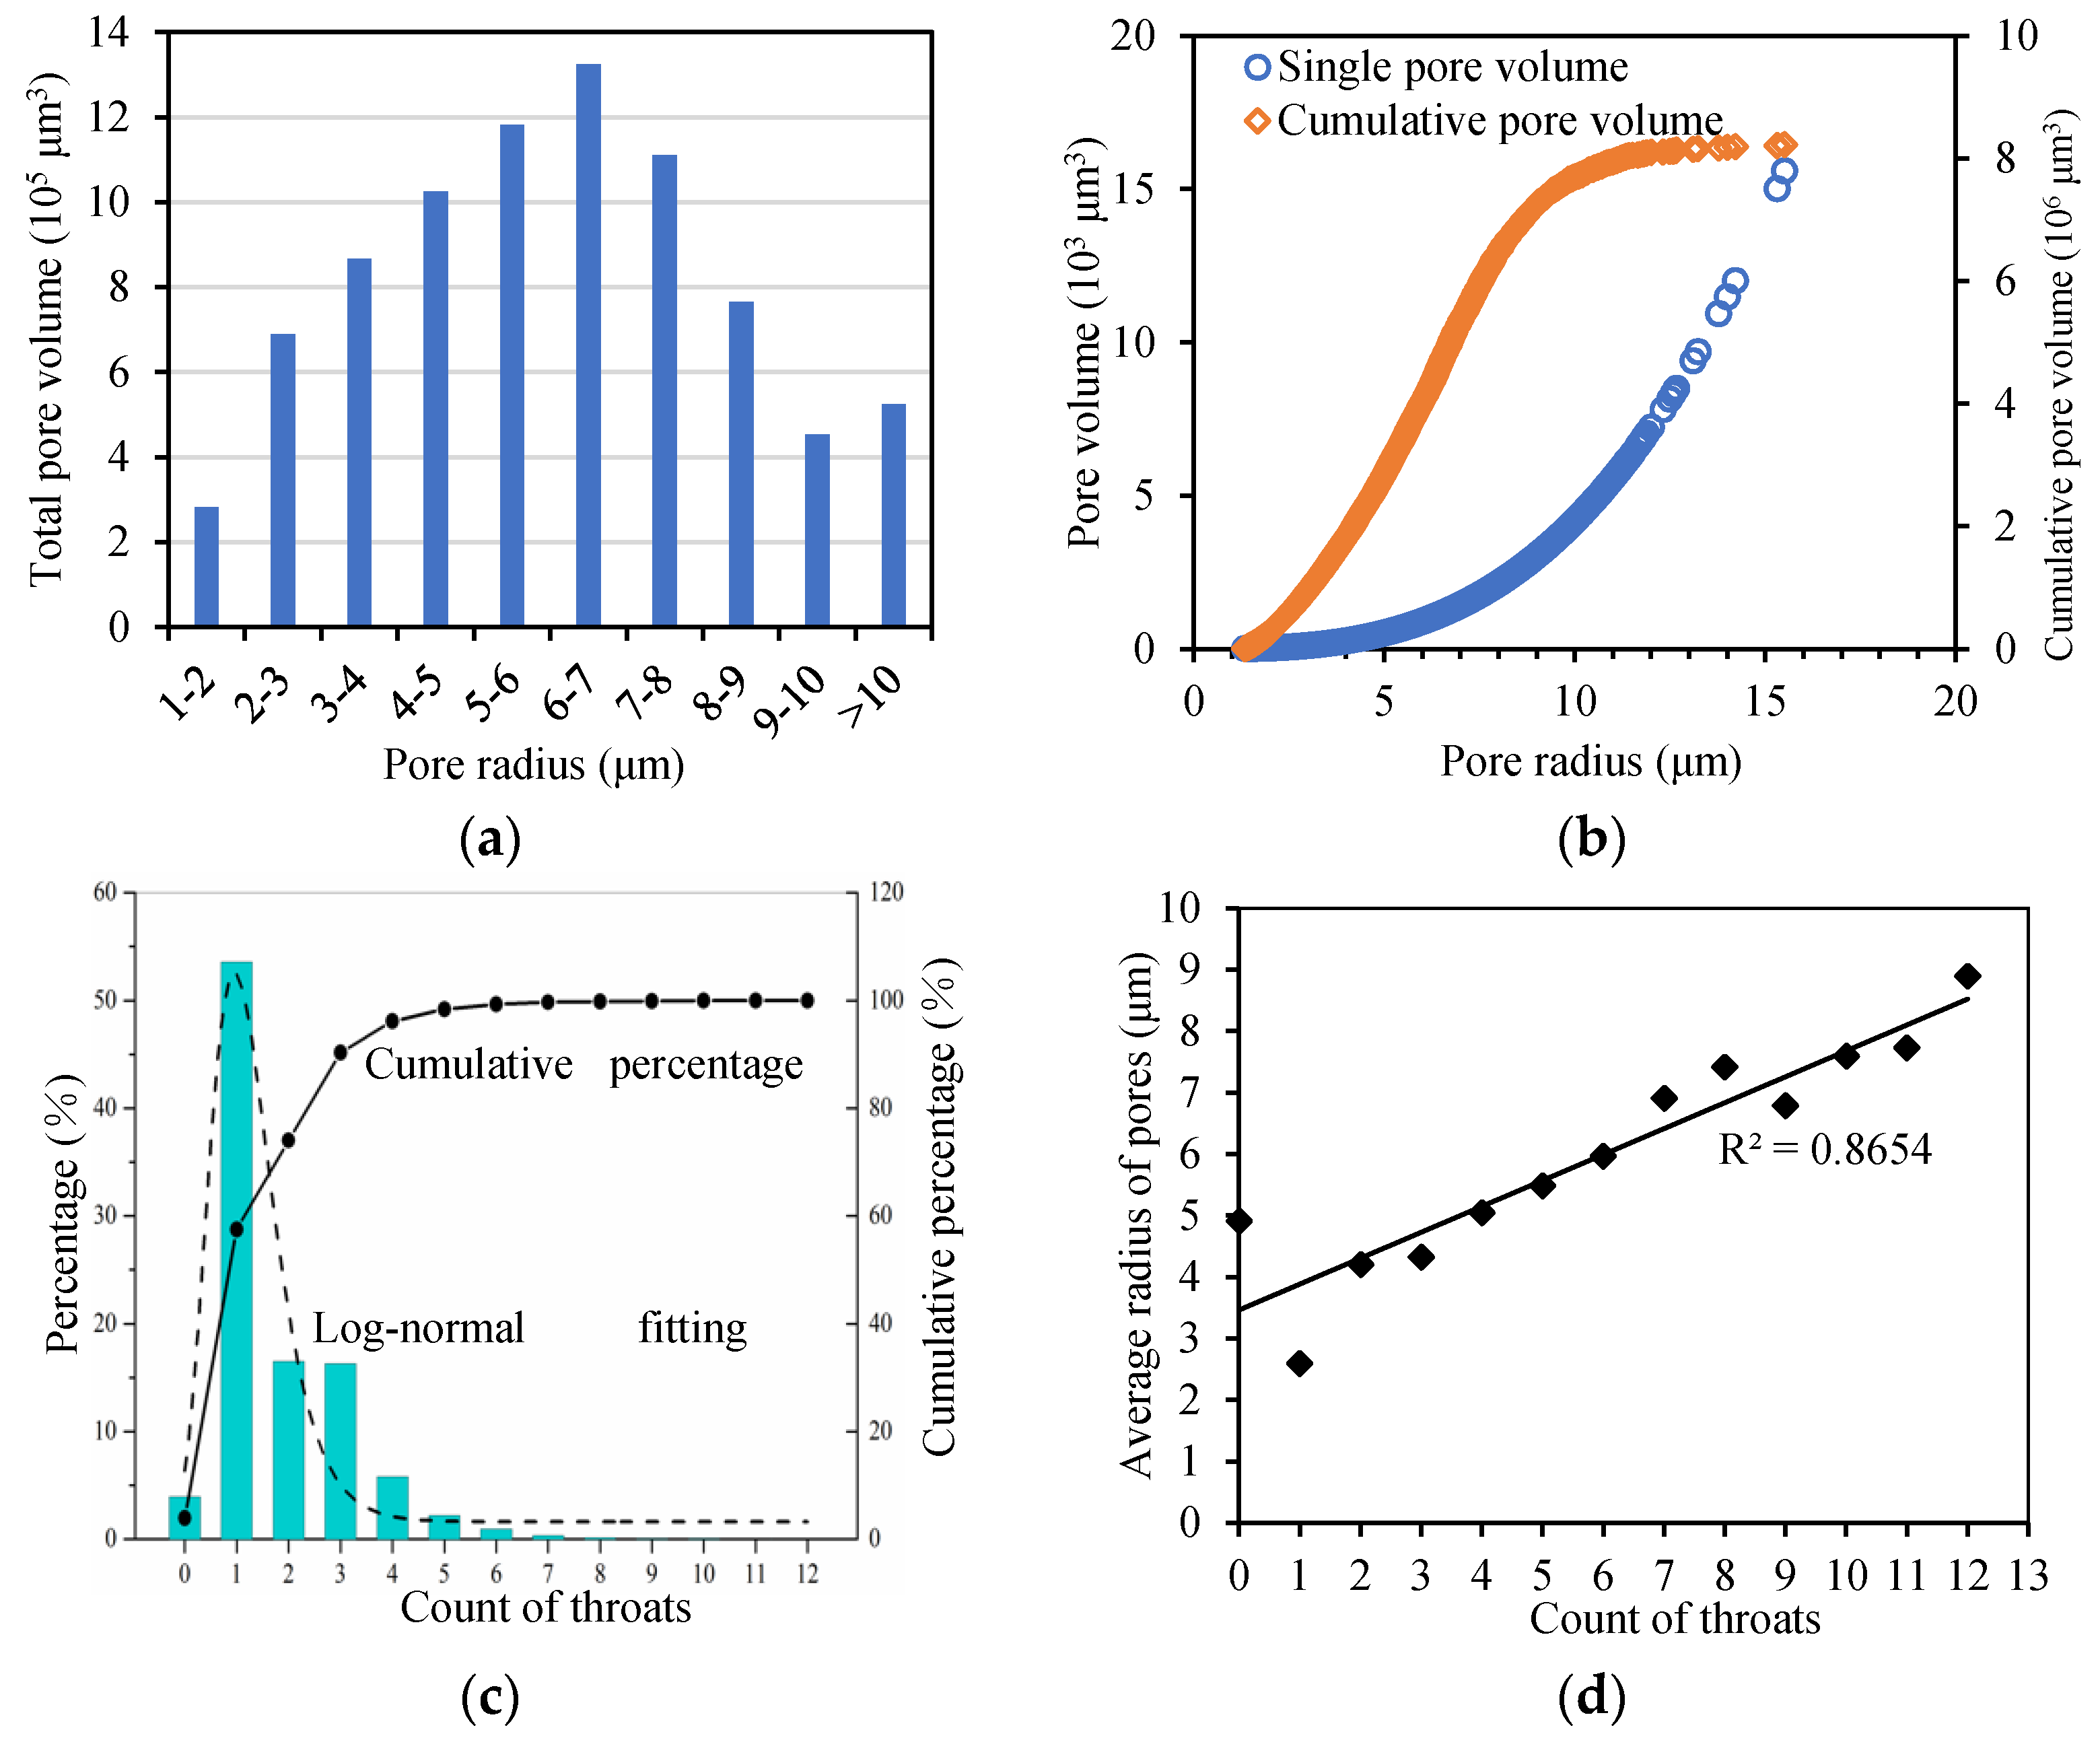
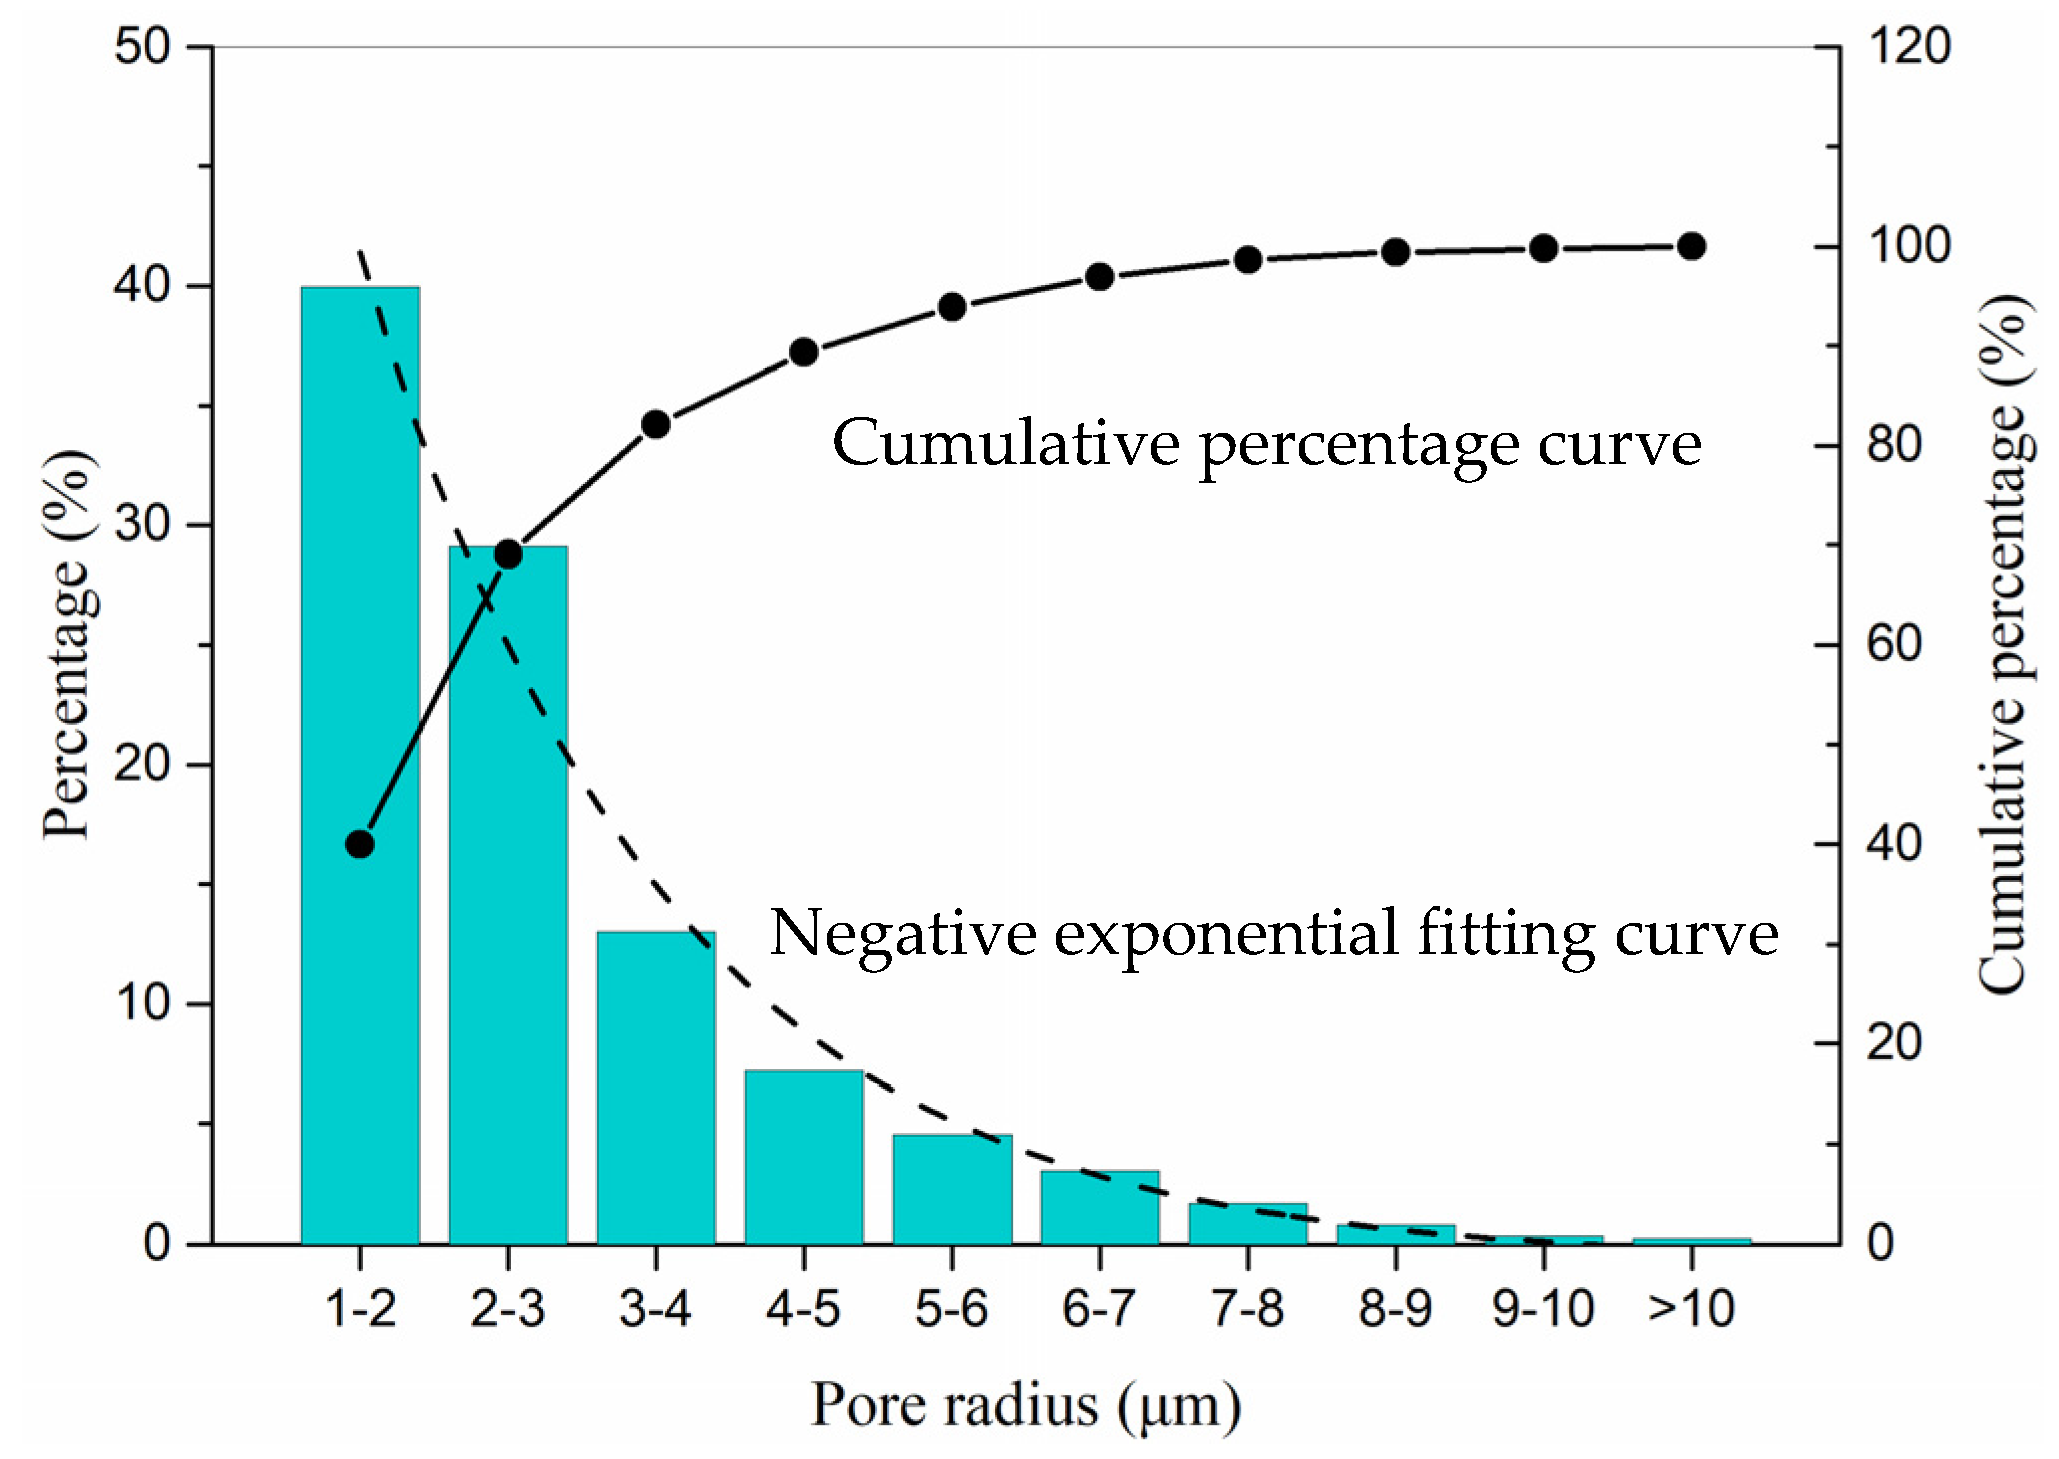
4.1. Micro-Scale Pores

To build a 3D pore network model using the micro-CT scanner, a series of steps including micro-CT scanning, image denoising, binarization, and 3D image reconstruction [11] were conducted. The grey level of the center area being scanned is different from other regions; this may influence the segmentation result if not removed. Therefore, a cube with a side of 600 μm from the central area was selected as the research object to reduce errors, as shown in Figure 4a,b. The micro-scale pore network model (cube-shaped, with an edge length of 600 μm) was established using the Avizo 7 software (Figure 4c). The pores and their connectivity were determined through attribute extraction. In Figure 4d, a uniform color represents inter-connected pore bodies. Figure 4d indicates that the pores are connected through small and narrow pore throats. From the micro-scale view, the distributions of pores seem to be homogeneous.
As shown in Figure 5, the number of pores for a given pore size dramatically decreases as the pore size increases. The pore radius ranges from 1 to 15 μm, with an average of 2.8 μm. Pores with sizes of 1–5 μm occupy approximately 90% of all the pores. When the radius is greater than 6 μm, the number decreases to less than 3% for every radius interval. The Kolmogorov–Smirnov (KS) goodness-of-fit test was conducted and the results show that the pore size follows a negative exponential distribution, which indicates a heterogeneous distribution. The histogram of the total pore volumes of the sample shares a peak at the average radius values of 6–7 μm (Figure 6a). Pores less than 9 μm occupy more than 88% of the total pore volume. Although the number of pores with radii less than 3 μm accounts for approximately 70% of the total pores in the sample, their contribution to the pore volume is only about 8%. The pore volumes vs. pore radii mainly display a power–law relationship (Figure 6b), showing that larger pores can provide larger volumes for gas storage.
Pore throats play a more critical role than pore sizes for permeability [34]. Therefore, it is necessary to study the pore throat features. Figure 6c shows that more than 55% of pores only have no more than one throat (i.e., isolated pores). The distribution of pore throats is inhomogeneous, following a log-normal distribution. A linear relationship between the size of pores and the number of pore throats was obtained (Figure 6d), suggesting that larger pores tend to have better connectivity than smaller pores.

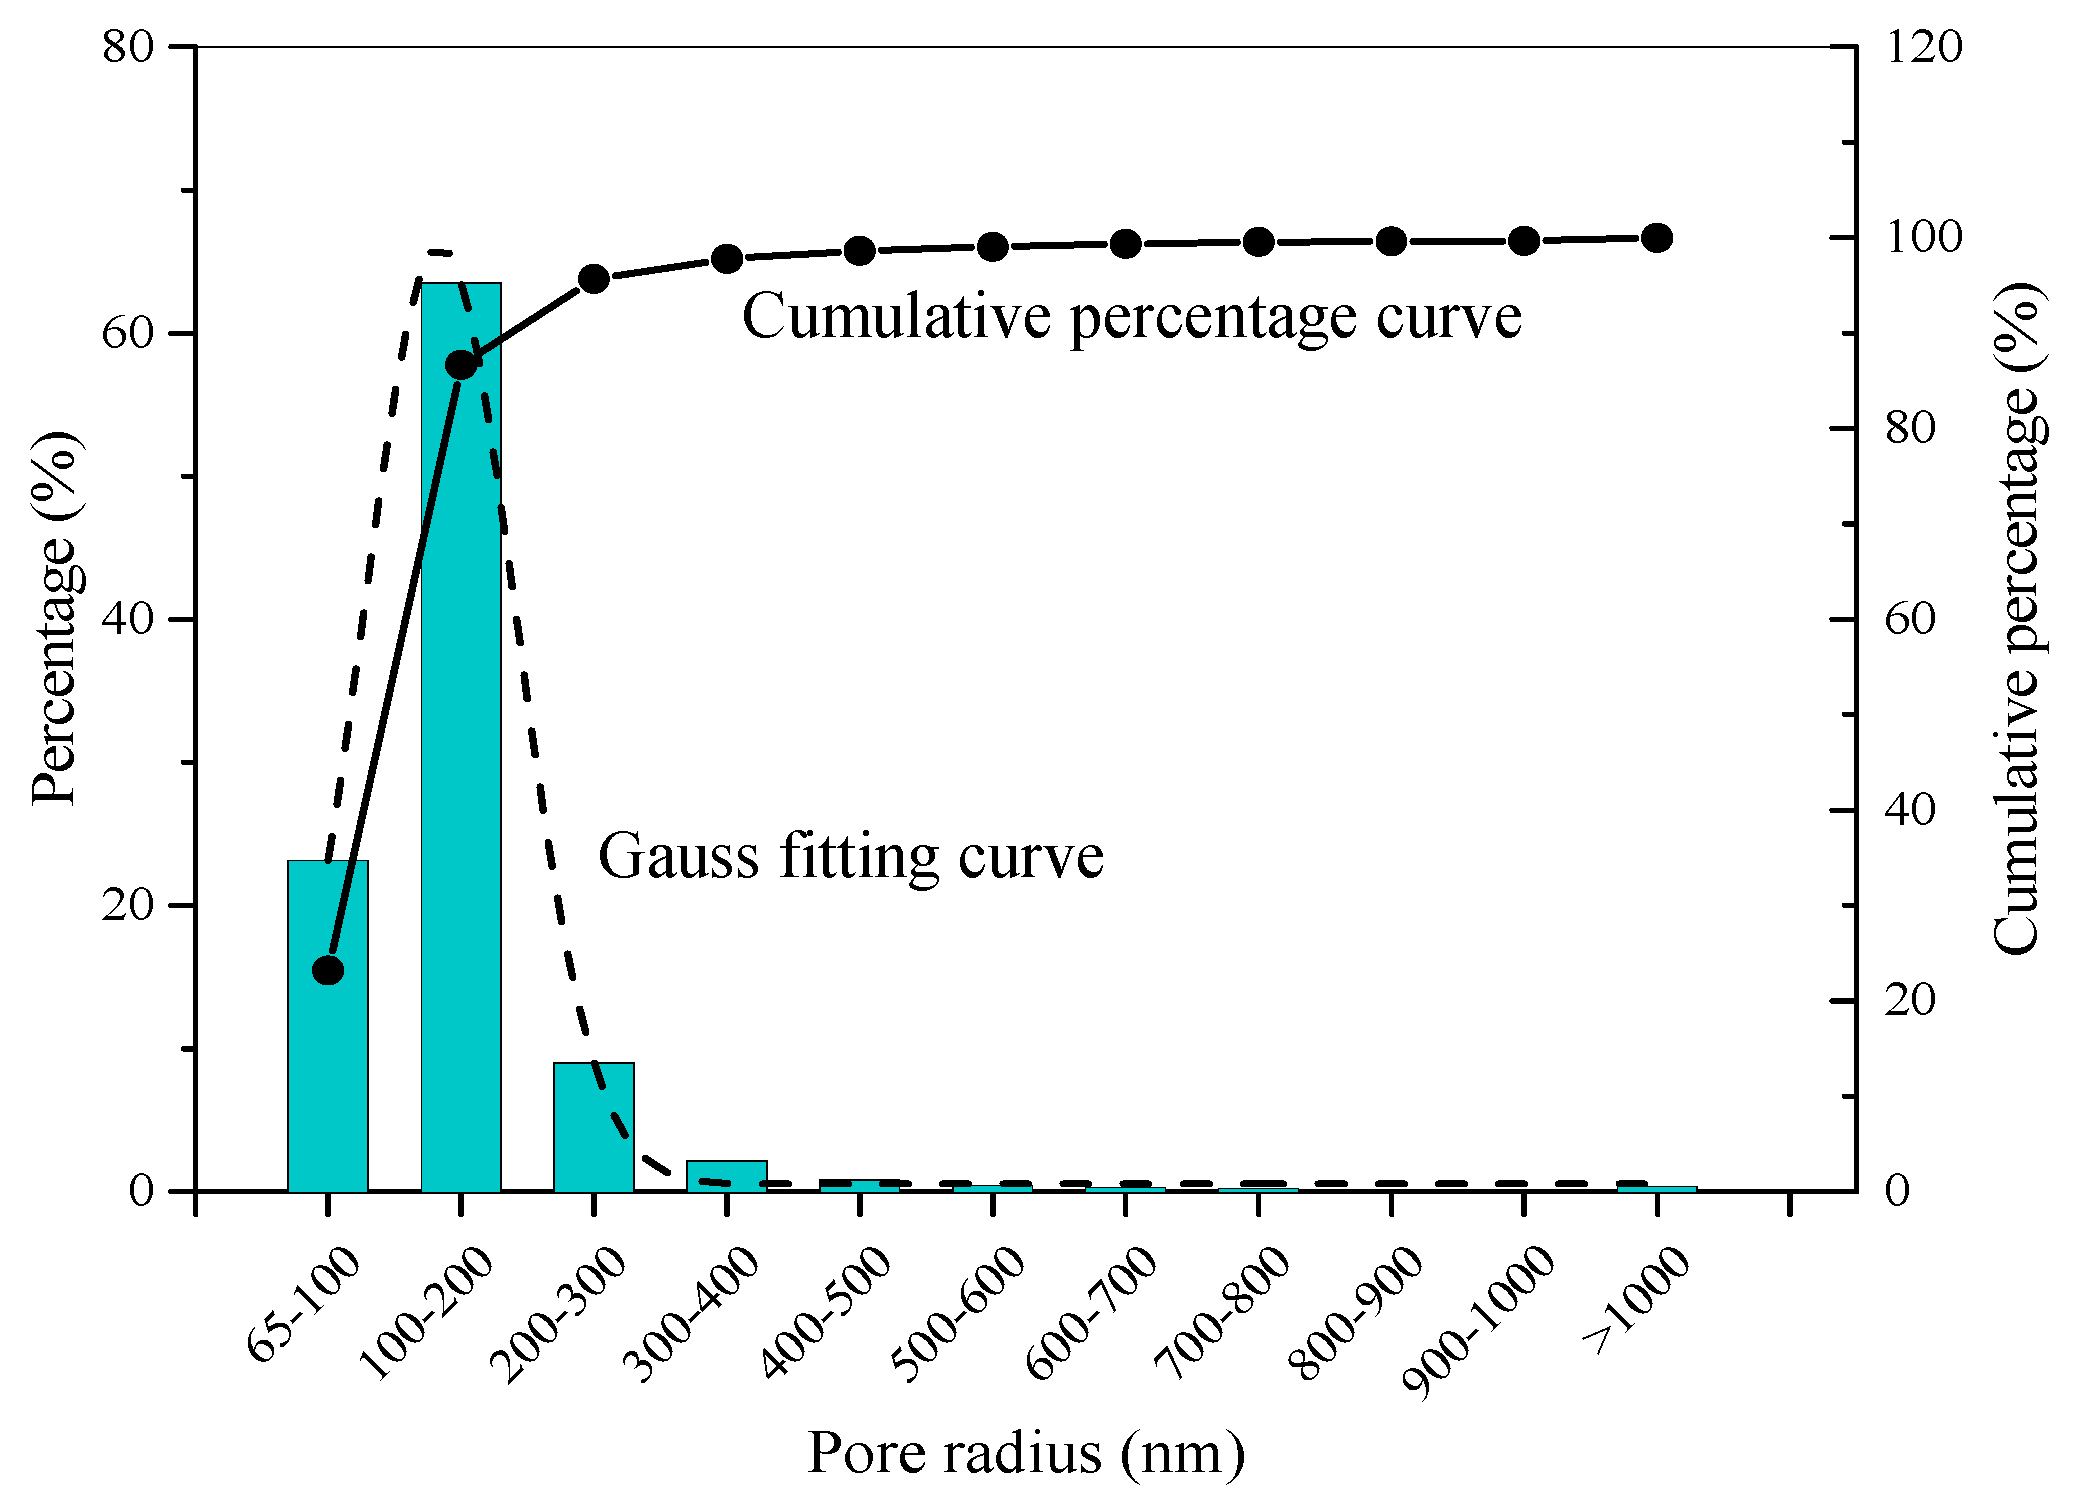
4.2. Nano-Scale Pores

The process of establishing a pore network model using the nano-CT is the same as that using the micro-CT (Figure 7). The edge length of the nano-scale 3D cube pore network model is 30 μm. The nano-CT images (Figure 7c) show that nanopores dominate in the Chang 7 shale, although a small number of micro-scale pores was observed. However, the micro-scale pores constitute most of the pore volumes in the shale (Figure 7c). The pores have great differences in size and the distribution of pores has strong heterogeneity. Figure 7c also shows that the common shapes of the nanopores are irregular ellipsoids, whereas the shapes of the micropores are complex, such as cloud-shaped or grape-shaped forms. Most of the nanopores are isolated (closed pores) and larger pores are better connected than smaller pores, as shown in Figure 7d.
The pore size follows a Gauss distribution (Figure 8). The pore radius ranges from 86 to 2679 nm, with an average of 152 nm, yet it has a rather concentrated distribution within 300 nm (95%). Pores with radii smaller than 300 nm have an absolute predominance in amount, but their contribution to the total pore volume is scarce (12.90% of the total volume). Although the pores with an equivalent radius larger than 1000 nm only account for 0.36% of the total pores, they contribute 68.38% of the total pore volume, as shown in Figure 9a. Therefore, the nano-scale pores constitute most of the pore amount in the shale, whereas the micro-scale pores constitute most of the pore volume. Compared with pore distributions at the micro-scale in Figure 6b, Figure 9b shows that as magnification increases, the proportion of the smaller pore radius is increasing accordingly. This is because much more pores with a small pore radius can be observed. This phenomenon indicates that micron-pores are widely distributed in the shale reservoir.
A connectivity analysis for the pores was conducted. More than 70% of pores are isolated pores (Figure 9c), indicating that pore bodies formed in the shale reservoir have poor connectivity. This may account for the poor permeability and the strong heterogeneity in the shale. In general, the pore structure is complex, and the distribution of throats is inhomogeneous, following a log-normal distribution. Again, a linear relationship between pore sizes and the count of pore throats was obtained (Figure 9d), suggesting that larger pores tend to have better connectivity than smaller pores. Most of the isolated sphere nano-pores act as storage space for shale gas due to their poor connectivity, whereas micro-pores form the main pathways through connecting with other large pores.

5. Conclusions

Pores in shale are important properties for gas storage and migration. This paper presents an application of Micro-CT and Nano-CT to characterize the 3D pore network of the Chang 7 shale. Based on multi-scale CT imaging, pores and their connectivity of the Chang 7 shale were obtained. A statistical test was conducted to find the distribution forms of pore sizes and pore throats. Besides this, the relationship between pore size and pore throat distribution was analyzed.
The results show that the nano-scale pores constitute most of the pore amount in the shale, whereas the micro-scale pores constitute most of the pore volume. The pores have great differences in size and the distribution of the pores has strong heterogeneity. The common shapes of nanopores are irregular ellipsoids, whereas the shapes of the micro-scale pores are complex, such as cloud-shaped or grape-shaped forms. The results also show that most of the micro-scale pores and nano-scale pores are isolated, indicating that pore bodies formed in the shale reservoir have poor connectivity. Linear relationships between pore sizes and the count of pore throats at two different scales were both obtained, suggesting that larger pores tend to have better connectivity than smaller pores. The characterization of pore structure in the Chang 7 shale could be beneficial for pore network modeling and shale gas development in the Yanchang Formation, Ordos Basin, China.
This research provides opportunities to improve the understanding of the full characteristics of pore systems in the continental shale of the Yanchang Formation, Ordos Basin, China. The findings could be used for pore network modeling and multiphase transport property determination in shale gas reservoirs, which play a vital role in shale gas exploration. Future work will be conducted to study the porosity type and their associated mineral phases based on plenty of shale samples. Besides, other methods, such as FIB-SEM and mercury intrusion porosimetry (MIP), will be used for comparative studies.

Author Contributions

Conceptualization, Z.Z.; methodology, Y.L.; software, Y.L.; validation, S.W.; formal analysis, Z.Z.; investigation, S.W. and P.Y.; resources, Y.S.; data curation, S.W. and P.Y.; writing—original draft preparation, Y.L. and Z.Z.; writing—review and editing, Y.L. and Z.Z.; visualization, S.W.; supervision, Z.Z.; project administration, Y.S.; funding acquisition, Y.L. and Y.S. All authors have read and agreed to the published version of the manuscript.

Funding

This work was financially supported by the National Natural Science Foundation of China (NSFC), grant number 42077258 and the Strategic Priority Research Program of the Chinese Academy of Sciences, grant number XDB10030100.

Informed Consent Statement

Not applicable.

Conflicts of Interest

The authors declare no conflict of interest.

References

  1. Zhao, J.; Mountney, N.P.; Liu, C.; Qu, H.; Lin, J. Outcrop architecture of a fluvio-lacustrine succession: Upper Triassic Yanchang Formation, Ordos Basin, China. Mar. Petrol. Geol. 2015, 68, 394–413. [Google Scholar] [CrossRef]
  2. Xi, K.; Cao, Y.; Liu, K.; Wu, S.; Yuan, G.; Zhu, R.; Kashif, M.; Zhao, Y. Diagenesis of tight sandstone reservoirs in the Upper Triassic Yanchang Formation, southwestern Ordos Basin, China. Mar. Petrol. Geol. 2019, 99, 548–562. [Google Scholar] [CrossRef]
  3. Slatt, R.M.; O’Brien, N.R. Pore types in the barnett and woodford gas shales: Contribution to understanding gas storage and migration pathways in finegrained rocks. AAPG Bull. 2011, 95, 2017–2030. [Google Scholar] [CrossRef]
  4. Tiwari, P.; Deo, M.; Lin, C.L.; Miller, J.D. Characterization of oil shale pore structure before and after pyrolysis by using X-ray micro CT. Fuel 2013, 107, 547–554. [Google Scholar] [CrossRef]
  5. Zhou, S.; Yan, G.; Xue, H.; Guo, W.; Li, X. 2D and 3D nanopore characterization of gas shale in Longmaxi formation based on FIB-SEM. Mar. Petrol. Geol. 2016, 73, 174–180. [Google Scholar] [CrossRef]
  6. Kim, C.; Jang, H.; Lee, Y.; Lee, J. Diffusion characteristics of nanoscale gas flow in shale matrix from Haenam basin, Korea. Environ. Earth Sci. 2016, 75, 350. [Google Scholar] [CrossRef]
  7. Basu, S.; Verchovsky, A.B.; Bogush, A.; Jones, A.P.; Jourdan, A.L. Stability of Organic Carbon Components in Shale: Implications for Carbon Cycle. Front. Earth Sci. 2019, 7, 297. [Google Scholar] [CrossRef] [Green Version]
  8. Gundogar, A.S.; Ross, C.M.; Akin, S.; Kovscek, A.R. Multiscale pore structure characterization of middle east carbonates. J. Petrol. Sci Eng. 2016, 146, 570–583. [Google Scholar] [CrossRef]
  9. Dong, T.; Harris, N.B.; Ayranci, K.; Twemlow, C.E.; Nassichuk, B.R. The impact of composition on pore throat size and permeability in high maturity shales: Middle and Upper Devonian Horn River Group, northeastern British Columbia, Canada. Mar. Petrol. Geol. 2017, 81, 220–236. [Google Scholar] [CrossRef]
  10. Guo, X.; Shen, Y.; He, S. Quantitative pore characterization and the relationship between pore distributions and organic matter in shale based on Nano-CT image analysis: A case study for a lacustrine shale reservoir in the Triassic Chang 7 member, Ordos Basin, China. J. Nat. Gas Sci. Eng. 2015, 27, 1630–1640. [Google Scholar] [CrossRef]
  11. Liu, S.; Sang, S.; Wang, G.; Ma, J.; Wang, X.; Wang, W.; Du, Y.; Wang, T. FIB-SEM and X-ray CT characterization of interconnected pores in high-rank coal formed from regional metamorphism. J. Petrol. Sci. Eng. 2017, 148, 21–31. [Google Scholar] [CrossRef] [Green Version]
  12. Tang, X.; Jiang, Z.; Jiang, S.; Li, Z. Heterogeneous nanoporosity of the Silurian Longmaxi Formation shale gas reservoir in the Sichuan Basin using the QEMSCAN, FIB-SEM, and nano-CT methods. Mar. Petrol. Geol. 2016, 78, 99–109. [Google Scholar] [CrossRef]
  13. Zhang, J.; Li, X.; Wei, Q.; Gao, W.; Liang, W.; Wang, Z.; Wang, F. Quantitative characterization of pore-fracture system of organic-rich marine-continental shale reservoirs: A case study of the Upper Permian Longtan Formation, Southern Sichuan Basin, China. Fuel 2017, 200, 272–281. [Google Scholar] [CrossRef]
  14. Ma, Y.; Pan, Z.; Zhong, N.; Connell, L.D.; Down, D.I.; Lin, W.; Zhang, Y. Experimental study of anisotropic gas permeability and its relationship with fracture structure of Longmaxi Shales, Sichuan Basin, China. Fuel 2016, 180, 106–115. [Google Scholar] [CrossRef]
  15. Wang, Y.; Pu, J.; Wang, L.; Wang, J.; Jiang, Z.; Song, Y.F.; Wang, C.C.; Wang, Y.; Jin, C. Characterization of typical 3D pore networks of Jiulaodong formation shale using nano-transmission X-ray microscopy. Fuel 2016, 170, 84–91. [Google Scholar] [CrossRef]
  16. Gaboreau, S.; Robinet, J.C.; Prêt, D. Optimization of pore-network characterization of a compacted clay material by TEM and FIB/SEM imaging. Microporous Mesoporous Mater. 2016, 224, 116–128. [Google Scholar] [CrossRef]
  17. Gou, Q.; Xu, S.; Hao, F.; Yang, F.; Zhang, B.; Shu, Z.; Zhang, A.; Wang, Y.; Lu, Y.; Cheng, X.; et al. Full-scale pores and micro-fractures characterization using FE-SEM, gas adsorption, nano-CT and micro-CT: A case study of the Silurian Longmaxi Formation shale in the Fuling area, Sichuan Basin, China. Fuel 2019, 253, 167–179. [Google Scholar] [CrossRef]
  18. Zhao, Q.; Zhang, J.; Liu, J. Status of Chinese shale gas revolution and development proposal. Drill. Eng. 2019, 46, 1–9. [Google Scholar]
  19. Pan, S.; Horsfield, B.; Zou, C.; Yang, Z.; Gao, D. Statistical analysis as a tool for assisting geochemical interpretation of the Upper Triassic Yanchang Formation, Ordos Basin, Central China. Int. J. Coal Geol. 2017, 173, 51–64. [Google Scholar] [CrossRef] [Green Version]
  20. Jiang, F.; Chen, D.; Wang, Z.; Xu, Z.; Chen, J.; Liu, L.; Huyan, Y.; Liu, Y. Pore characteristic analysis of a lacustrine shale: A case study in the Ordos Basin, NW China. Mar. Petrol. Geol. 2016, 73, 554–571. [Google Scholar] [CrossRef]
  21. Li, P.; Zheng, M.; Bi, H.; Wu, S.; Wang, X. Pore throat structure and fractal characteristics of tight oil sandstone: A case study in the Ordos Basin, China. J. Petrol. Sci. Eng. 2017, 149, 665–674. [Google Scholar] [CrossRef]
  22. Ma, L.; Slater, T.; Dowey, P.J.; Yue, S.; Rutter, E.H.; Taylor, K.G.; Lee, P.D. Hierarchical integration of porosity in shales. Sci. Rep. 2018, 8, 11683. [Google Scholar] [CrossRef] [PubMed]
  23. Liu, Y.; Dong, X.; Chen, Z.; Hou, Y.; Luo, Q.; Chen, Y. A novel experimental investigation on the occurrence state of fluids in microscale pores of tight reservoirs. J. Petrol. Sci. Eng. 2021, 196, 107656. [Google Scholar] [CrossRef]
  24. Ji, L.; He, C.; Zhang, M.; Wu, Y.; Li, X. Bicyclic alkanes in source rocks of the Triassic Yanchang Formation in the Ordos Basin and their inconsistency in oil-source correlation. Mar. Petrol. Geol. 2016, 72, 359–373. [Google Scholar] [CrossRef]
  25. Yang, W.; Liu, G.; Feng, Y. Geochemical significance of 17α(H)-diahopane and its application in oil-source correlation of Yanchang formation in Longdong area, Ordos basin, China. Mar. Petrol. Geol. 2016, 71, 238–249. [Google Scholar] [CrossRef]
  26. Li, L.; Huang, B.; Tan, Y.; Deng, X.; Li, Y.Y.; Zheng, H. Geometric Heterogeneity of Continental Shale in the Yanchang Formation, Southern Ordos Basin, China. Sci. Rep. 2017, 7, 6006. [Google Scholar] [CrossRef] [PubMed] [Green Version]
  27. Li, Y.Y.; Shang, Y.J.; Yang, P. Modeling fracture connectivity in naturally fractured reservoirs: A case study in the Yanchang Formation, Ordos Basin, China. Fuel 2018, 211, 789–796. [Google Scholar] [CrossRef]
  28. Liu, G.; Huang, Z.; Chen, F.; Jiang, Z.; Gao, X.; Li, T.; Chen, L.; Xia, L.; Han, W. Reservoir characterization of Chang 7 member shale: A case study of lacustrine shale in the Yanchang Formation, Ordos Basin, China. J. Nat. Gas Sci. Eng. 2016, 34, 458–471. [Google Scholar] [CrossRef]
  29. Zhang, W.Z.; Hua, Y.; Yang, Y.H. Petrology and element geochemistry and development environment of Yanchang Formation Chang-7 high quality source rocks in Ordos Basin. Geochimica 2008, 37, 59–64. [Google Scholar]
  30. Zhang, T.W.; Ellis, G.S.; Rupple, S.C.; Milliken, K.; Yang, R. Effect of organic matter type and thermal maturity on methane adsorption in shale-gas systems. Org. Geochem. 2012, 47, 120–131. [Google Scholar] [CrossRef]
  31. Li, Y.; Li, G.; Luo, H.; Zhang, W. Study on the technology of improving the mechanical drilling speed of horizontal wells for terrestrial shale gas. Drill. Eng. 2020, 47, 9–15. [Google Scholar]
  32. Basu, S.; Jones, A.; Mahzari, P. Best Practices for Shale Core Handling: Transportation, Sampling and Storage for Conduction of Analyses. J. Mar. Sci. Eng. 2020, 8, 136. [Google Scholar] [CrossRef] [Green Version]
  33. Bai, B.; Zhu, R.; Wu, S.; Yang, W.; Gelb, J.; Gu, A.; Zhang, X.; Su, L. Multi-scale method of Nano(Micro)-CT study on microscopic pore structure of tight sandstone of Yanchang Formation, Ordos Basin. Petrol. Explor. Dev. 2013, 40, 354–358. [Google Scholar] [CrossRef]
  34. Nelson, P.H. Pore-throat sizes in sandstones, tight sandstones, and shales. AAPG Bull. 2009, 93, 329–340. [Google Scholar] [CrossRef]
Figure 1. (a) Tectonic map of the Ordos Basin [26,27]; (b) lithological and electronic characteristics of the Yanchang Formation in the YK01 well [26].
Energies 14 05282 g001
Figure 2. Mineral distribution of the Chang 7-2 shale sample. (a) BSE image [26]; (b) SEM image showing pyrite and organic matter uniformly distributed in the sandy layer; (c) SEM image showing a small quantity of pyrite and a good deal of organic matter distributed in the tuffaceous layer.
Energies 14 05282 g002aEnergies 14 05282 g002b
Figure 3. Samples for (a) micro-CT and (b) nano-CT scanning.
Energies 14 05282 g003
Figure 4. Pore extraction steps using the micro-CT. (a) 2D slice; (b) 3D reconstruction of pore im age; (c) pore distribution; (d) connectivity of the pores. In (d), each color signals a pore not connected to the others.
Energies 14 05282 g004
Figure 5. Pore quantity distribution at the micro–scale.
Energies 14 05282 g005
Figure 6. Characteristics of micro–scale pores. (a) total pore volume distributions; (b) single pore volume distributions and cumulative pore volume distributions; (c) pore throat distribution; (d) relationship between the size of pores and the number of pore throats.
Energies 14 05282 g006
Figure 7. Pore extraction steps using the nano–CT. (a) 2D slice; (b) 3D reconstruction of pore image; (c) pore distribution; (d) connectivity of the pores. In (d), each color signals a pore not connected to the others.
Energies 14 05282 g007
Figure 8. Pore quantity distribution at the nano–scale.
Energies 14 05282 g008
Figure 9. Characteristics of nano-scale pores. (a) total pore volume distributions; (b) single pore volume distributions and cumulative pore volume distributions; (c) pore throat distribution; (d) relationship between the size of pores and the number of pore throats.
Energies 14 05282 g009
Table 1. Mineralogical composition analysis of the Chang 7 shale [20].
Sample IDDepth (m)Toc (wt. %)Mineral Composition (wt. %)
Ill.Kln.Chl.Qtz.Fel.Cal.Dol.Py.Sd.
11270.61.02203037240000
21271.00.52101333132112
31378.52.124073412204
41450.25.5290173515002
51450.63.933510311901600
61451.14.82510162711 5
71453.44.3259133212 5
81443.82.126 17267 16
91445.54.1329112720
101446.77.225 242615 5
111449.54.826 123116 16
121451.05.229109221255111
131518.64.625 252916
141625.211.432 1626165 7
151212.54.829 132827 23
161621.53.7212428203 28
171392.59.724 627133 27
181399.44.722 725172 13
TOC: Total Organic Carbon; Ill.: Illite; Kln.: Kaolinite; Chl.: Chlorite; Qtz.: Quartz; Fel.: Feldspar; Cal.: Calcite; Dol.: Dolomite; Py.: Pyrite; Sd.: Siderite.
Publisher’s Note: MDPI stays neutral with regard to jurisdictional claims in published maps and institutional affiliations.

