Article

Elliptic Array Luminescent Solar Concentrators for Combined Power Generation and Microalgae Growth

Department of Mechanical Engineering, Lassonde School of Engineering, York University, Toronto, ON M3J 1P3, Canada
*
Author to whom correspondence should be addressed.
Energies 2021, 14(17), 5229; https://doi.org/10.3390/en14175229
Submission received: 9 July 2021 / Revised: 17 August 2021 / Accepted: 19 August 2021 / Published: 24 August 2021
(This article belongs to the Special Issue Challenge and Research Trends of Solar Concentrators)

Abstract

:
The full utilization of broadband solar irradiance is becoming increasingly useful for applications such as long-term space missions, wherein power generation from external sources and regenerative life support systems are essential. Luminescent solar concentrators (LSCs) can be designed to separate sunlight into photosynthetically active radiation (PAR) and non-PAR to simultaneously provide for algae cultivation and electric power generation. However, the efficiency of LSCs suffers from high emission losses. In this work, we show that by shaping the LSC in the form of an elliptic array, rather than the conventional planar configuration, emission losses can be drastically reduced to the point that they are almost eliminated. Numerical results, considering the combined effects of emission, transmission and surface scattering losses show the optical efficiency of the elliptic array LSC is 63%, whereas, in comparison, the optical efficiency for conventional planar LSCs is 47.2%. Further, results from numerical simulations show that elliptic array luminescent solar concentrators can convert non-PAR and green-PAR to electric power with a conversion efficiency of ~17% for AM1.5 and 17.6% for AM0, while transmitting PAR to an underlying photobioreactor to support algae cultivation.

1. Introduction

The progression of human space exploration endeavors depends on extending the duration of crew missions [1,2,3]. These ambitious missions will require regenerative environmental control and life support systems (ECLSS). Further, it will not always be possible to bring an energy source that can supply the power required for the duration of the mission and onboard energy conversion systems that utilize the energy sources available in space will be needed. Regarding ECLSS for long-term space missions, microalgae cultivation has been investigated as a promising solution owing to its potential to regenerate O2 from CO2, high growth-rates and ability to close the carbon loop by providing a source of food [4,5,6]. Indeed, in the Photobioreactor at the Life Support Rack (PBR@LSR) experiment, an advanced microalgae photobioreactor (PBR) utilizes concentrated CO2 from a life support rack onboard the International Space Station [7]. Onboard power generation for spacecrafts operating in the inner solar system is often achieved using photovoltaic (PV) solar panels to convert sunlight into electricity. In this work we are interested in the potential use of luminescent solar concentrators (LSCs) that focus sunlight onto PV cells located at their sidewalls for space applications. We are particularly interested in LSCs because, in addition to concentrating sunlight, they can also function as a solar spectrum splitter that separates photosynthetically active radiation (PAR) from non-PAR. Our objective is to design an LSC that splits the solar radiation to simultaneously provide for electric power generation using non-PAR and green-PAR, and microalgae cultivation using PAR, respectively. The ability to provide multiple functions is highly valuable for mass and volume conservation on spacecrafts. Further, using LSCs for PV operation in space can offer additional benefits. For example, small PV cells are located at the edges of the LSC where they can be shielded from harmful radiation [8], and it has been predicted that specific power values greater than 1 kW/kg can be achieved by using LSCs in space [9]. However, the efficiency of LSCs suffers from emission losses, whereby a large fraction of light emitted from the dye within the LSC panel exits the structure rather than being directed toward the edges of the LSC via total internal reflection (TIR). LSCs have a planar configuration, although in this work we investigate the ability of using other structures to achieve TIR over a broad range of angles to minimize emission losses. We show that emission losses can be drastically reduced by structuring the LSC in the form of an elliptic array rather than a planar configuration. In this paper, we design and numerically evaluate the performance of elliptic-array LSCs that can operate in tandem with a PBR and use solar energy to simultaneously generate electric power and provide for microalgae cultivation.

2. Background

Significant research efforts have been undertaken to explore innovative spectral photon management strategies that optimize algae growth conditions and biofuel cultivation systems [10,11,12,13,14,15]. For example, Sun et al. [16] enhanced microalgae production by embedding hollow light guides in a flat-plate PBR made of PMMA. The hollow light guides also induced turbulent flow, promoting microalgae suspension mixing, and the photosynthetic efficiency of microalgae growth in the PBR was increased by 12.52%. Ooms et al. [17] demonstrated wavelength specific scattering from plasmonic nano-patterned surfaces as a means of addressing the challenge of photon management in PBRs. Modular PBRs were constructed with different reflective substrates including arrays of plasmonic nanodisks, broadband reflectors and untreated glass, and a power efficiency enhancement of 52% was achieved with the plasmonic nanodisk arrays as compared to the case wherein a broadband reflector was used. Furthermore, a 6.5% cyanobacterium growth rate increase was achieved by using a plasmonic substrate in comparison to using a photobioreactor equipped with untreated glass.
As another spectral photon management strategy for optimizing algae-based biofuel cultivation systems, LSCs are one of the most economical and practical options to harvest solar energy because they have the dual-advantage of (1) concentrating light onto a smaller area (resulting in greater geometrical gain) and (2) splitting the solar irradiance into different spectral regions such that it can be used to simultaneously provide power for multiple applications. An LSC is typically comprised of a transparent panel that hosts luminophore molecules. These luminophores, such as quantum dots or organic dyes, absorb incident solar radiation and use this energy to isotropically emit radiation with a longer wavelength. If the photons are emitted within the critical angle, they will be directed, via TIR, toward PV cells located at the edges of the transparent panel. The incident solar radiation outside the spectral region absorbed by the fluorophores may pass through the panel. This technology can be used in a vast range of applications including greenhouse panels, semi-transparent windows that generate electricity or heat [18] and skylights because the transparency, shape, size and color of the panel are easily controlled [19].
The luminophore embedded within the LSCs can be designed to split the solar spectrum into its PAR and non-PAR components and concentrate the non-PAR onto PV cells located at the LSC sidewalls. Over the course of millions of years, photosynthetic organisms have adopted photo-protection mechanisms to naturally regulate energy flow and minimize energy fluctuations within their photocells [20]. Most photosynthetic organisms are highly reflective toward green light, which has the maximum photon flux in the solar radiation spectrum, to avoid overheating. Instead, light harvesting antennas within photosynthetic organisms are often highly absorbing in the spectral vicinity of blue and red light [21]. However, due to several deficiencies and considerable loss mechanisms, the power conversion efficiency of LSCs is still less than 10%. The main operating mechanisms and loss phenomena in LSC devices are described subsequently with reference to Figure 1 [22].
A main reason for low efficiencies in LSCs is transmission losses because a large amount of incident sunlight passes through the panel. Transmission losses occur because luminophore dyes absorb over a small spectral region compared to the spectrally broad solar irradiance. However, this feature makes it possible to use LSCs as semitransparent windows for numerous applications including greenhouses and building facades. Other loss mechanisms include surface reflection loss (which is ~4% for light incident from the normal direction), emission losses due to light being emitted at angles less than the critical angle for which TIR occurs, and emission losses due to surface roughness, which increases photon scattering out of the LSC, and internal absorption losses, which includes the absorption of light by the host matrix waveguide material and the re-absorption of emitted photons by other dye molecules. Many efforts have been applied to reduce the aforementioned losses in LSCs. The methods of reducing surface losses include fabricating selective mirrors, Bragg reflectors, or plasmonic structures at the LSC surfaces, and aligning the luminophores within the LSC to control the path of the emitted light.
Efforts to reduce internal losses caused by re-absorption include studies on novel organic fluorescent dyes, quantum dots and inorganic phosphors [23]. Correia et al. [24] provided a comprehensive overview about the potentials of lanthanide-based organic-inorganic luminescent dyes in order to increase the performance of LSCs. Meinardi et al. [25] designed and fabricated CdSe/CdS quantum dots that utilize a large Stokes shift to eliminate re-absorption losses in large-area LSCs and optical efficiencies exceeding 10% with a concentration factor of 4.4 were achieved. Buffa et al. [26] developed dye-doped polysiloxane rubber waveguides for LSC systems and evaluated the potential of enhancing fluorophore fluorescence efficiency in the presence of different concentrations of Au nanoparticles. Unlike the more common waveguide hosts (e.g., PMMA), polysiloxane rubber is flexible, which enables applications in tents, fabrics, sleeping bags or other such devices that can be rolled up, folded or otherwise deformed. The first transparent near-infrared (NIR)-absorbing LSC with high transparency was demonstrated by Zhao et al. [27]. In this study, they developed luminophore blends of cyanine and cyanine salts and synthesized cyanine salt-host blends with quantum efficiencies greater than 20% accompanied with spectrally selective NIR harvesting. Debije et al. [28] increased the energy output of LSC waveguides by adding white scattering layers to the bottom side of LSCs separated from the waveguide by an air gap. Cambié et al. [29] developed a Monte Carlo ray tracing algorithm to simulate photon paths within LSC-based photomicroreactors and experimentally validated their results. Chou et al. [30] fabricated a flexible waveguiding LSC that exhibits high optical efficiencies and great mechanical flexibility. In this research, a certified power conversion efficiency (PCE) of 5.57%, with a projected PCE as high as approximately 18% was reported. A significant amount of research has also been performed to investigate the performance of LSCs for agrivoltaics, algae cultivation, basil growth and greenhouse applications [11,31,32,33,34,35,36]. For example, Detweiler et al. [11] fabricated a wavelength selective LSC panel that harnesses the green light portion of the solar irradiance, most of which is not used for algae growth. The LSC panel contains Lumogen Red 305 dye that absorbs and emits green (~580 nm peak) and red light (~620 nm peak), respectively. The fluorescently emitted red light was either used to enhance algal growth, or waveguided and captured by PV cells to be converted into electricity. The results revealed that the microalgae growth rates under the LSC panels were equivalent to the growth rates under the full solar radiation spectrum.
Based on Snell’s law, all the photons emitted from luminescent dyes within an LSC that impinge on the surface of the LSC panel at an angle smaller than the critical angle will be emitted to the surrounding medium (loss four in Figure 1b), which is one of the main loss mechanisms in LSCs. The measurements reveal that the accumulated emission losses, considering secondary absorption and emission events and scattering due to surface roughness can reach 50–70% [37]. In this context, all the strategies for reducing surface losses are based on the following two main processes: integrating selective mirrors and aligning the luminophores to directionally control the emission of light [38,39]. However, topology-based strategies wherein the shape of the host medium is altered and optimized to reduce emission losses have yet to be explored. This work evaluates the benefits of shaping the medium hosting the dye in an elliptic-based, rather than planar-based, configuration to minimize the absorption and surface (including scattering and cone zone) losses for LSCs. The performance of these novel elliptic-based LSCs is investigated and compared to conventional LSCs for the dual application of simultaneously providing power for algae and PV electricity production systems.

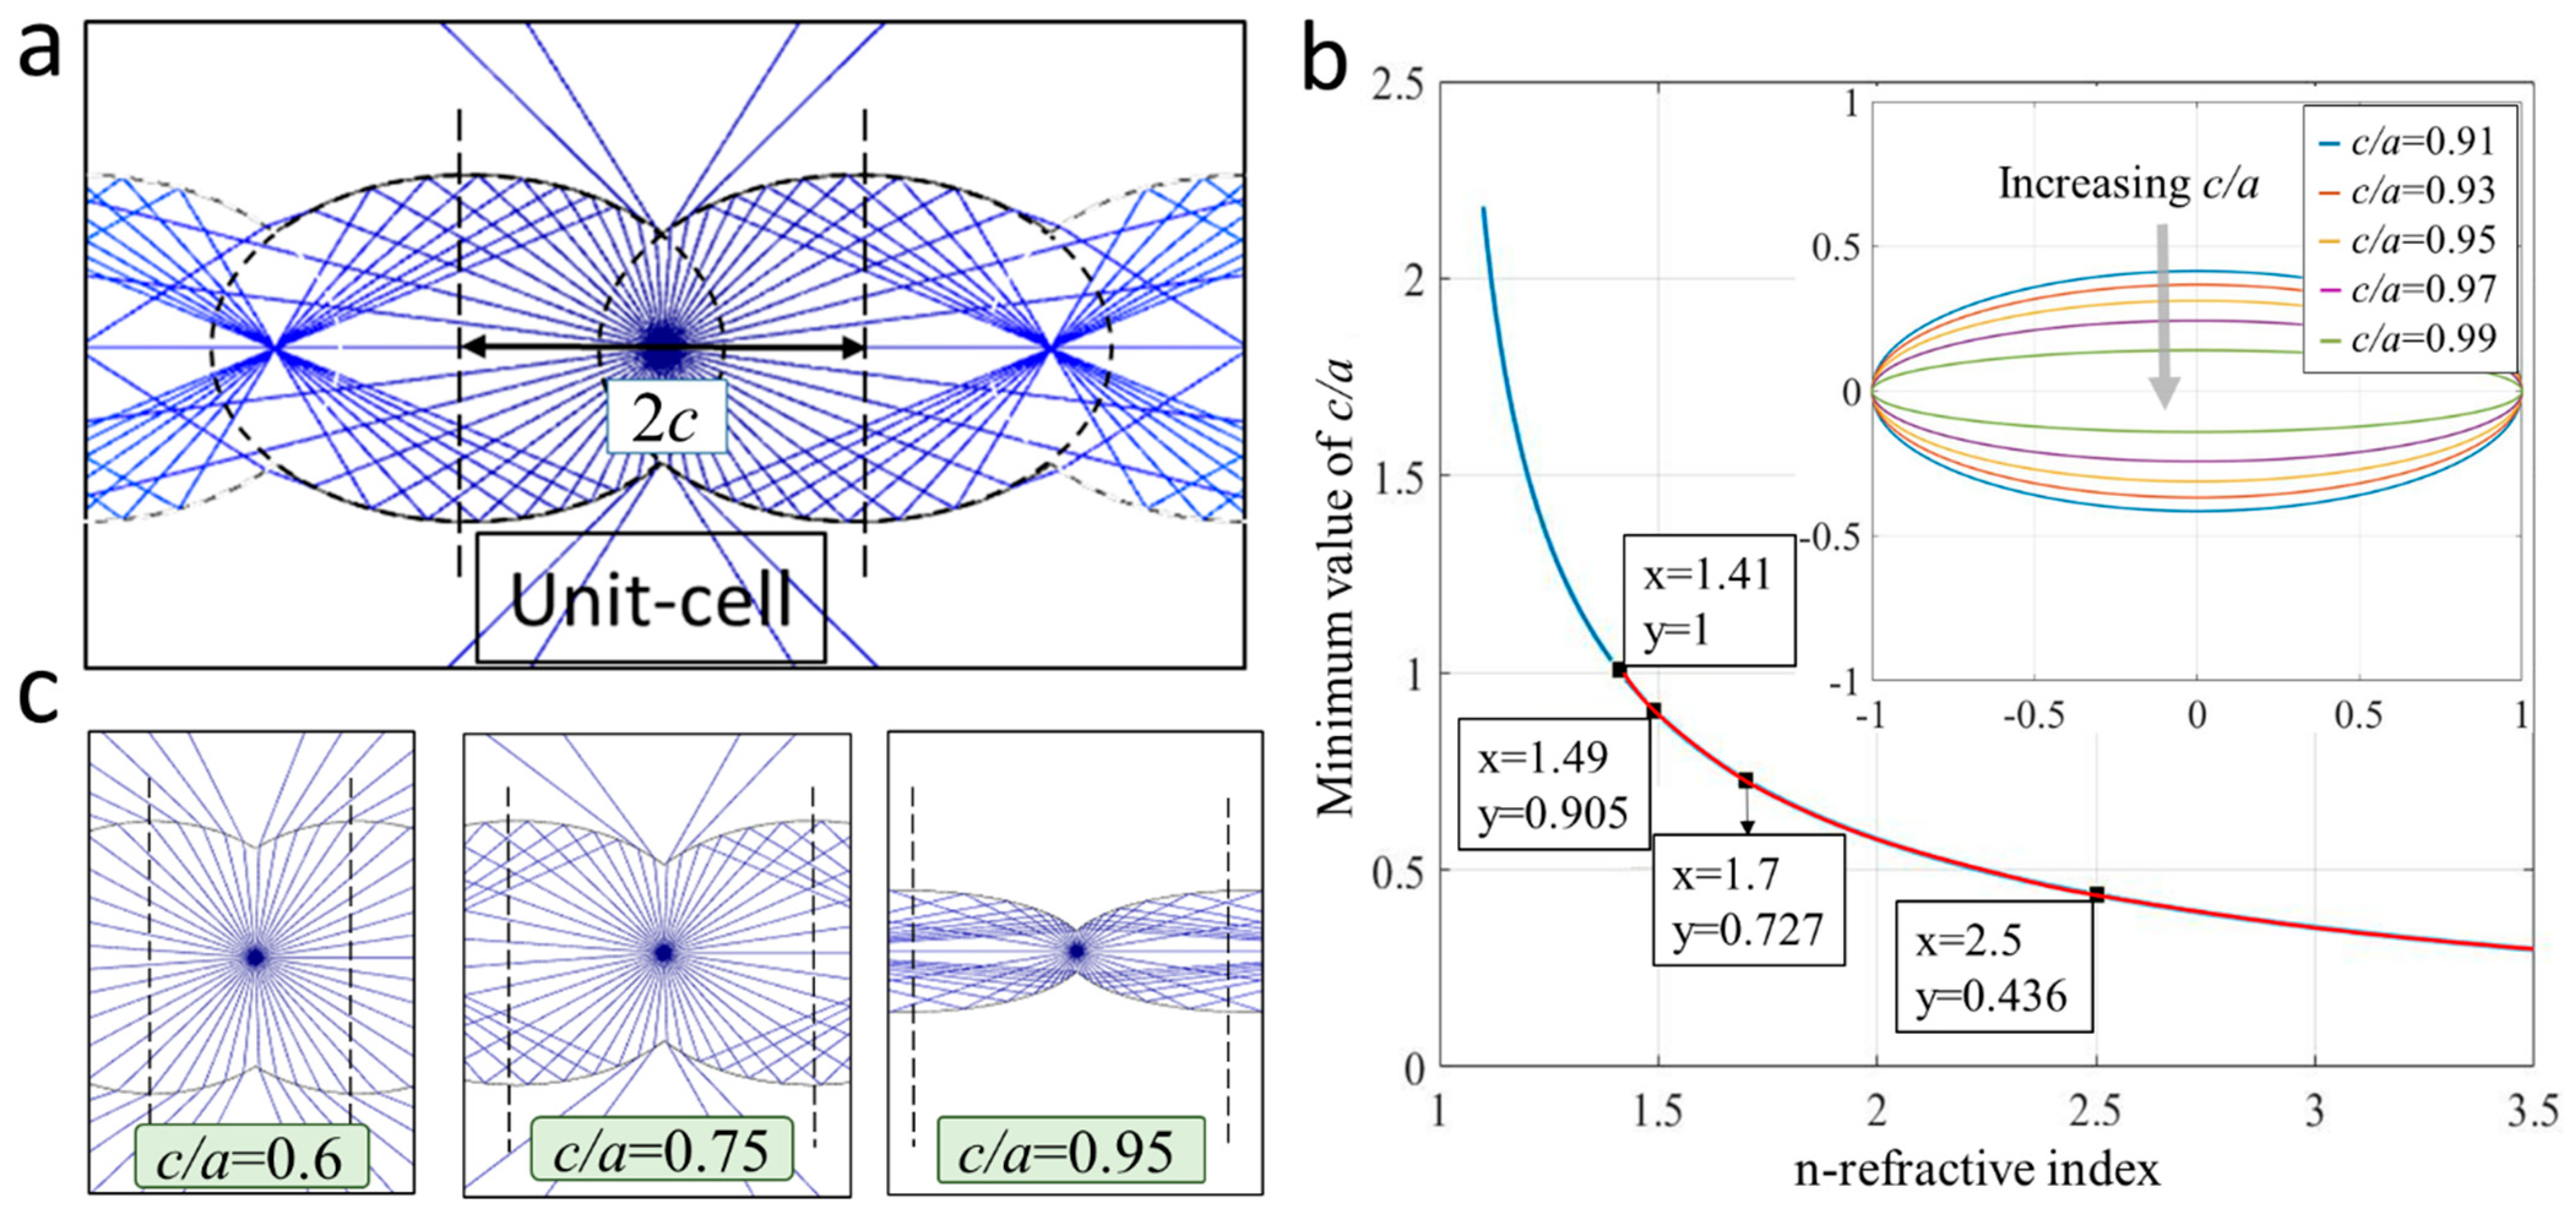
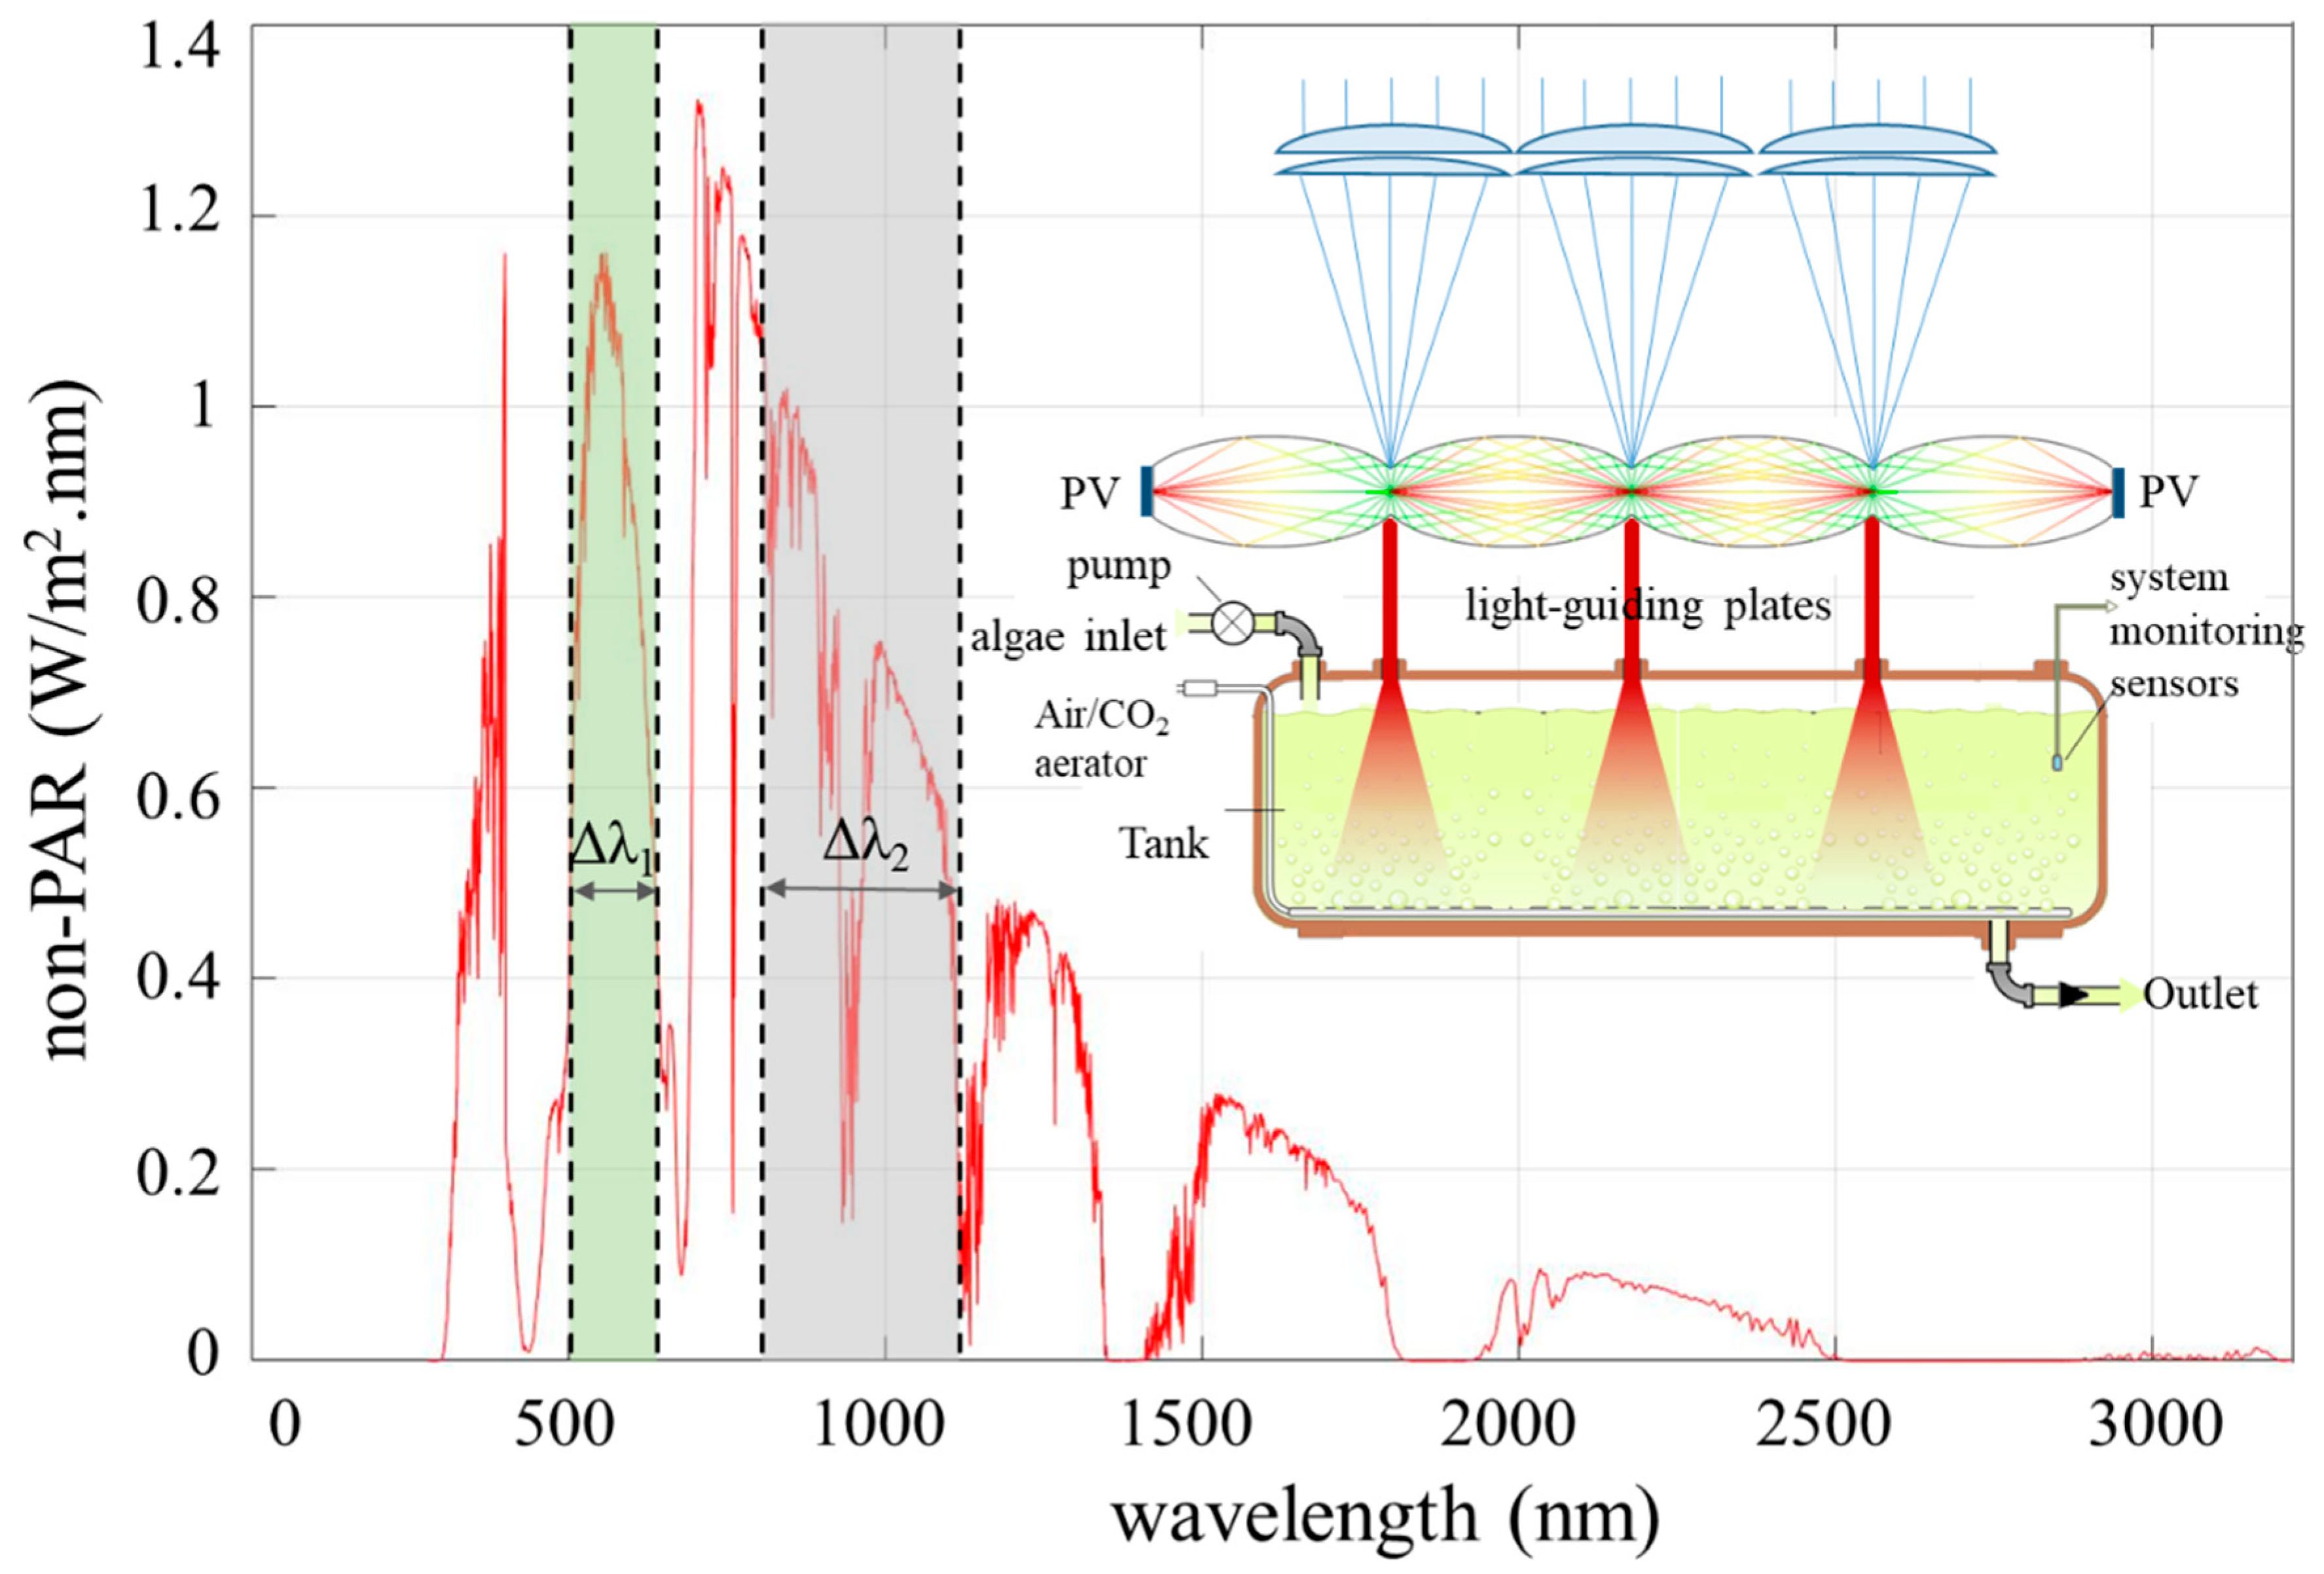
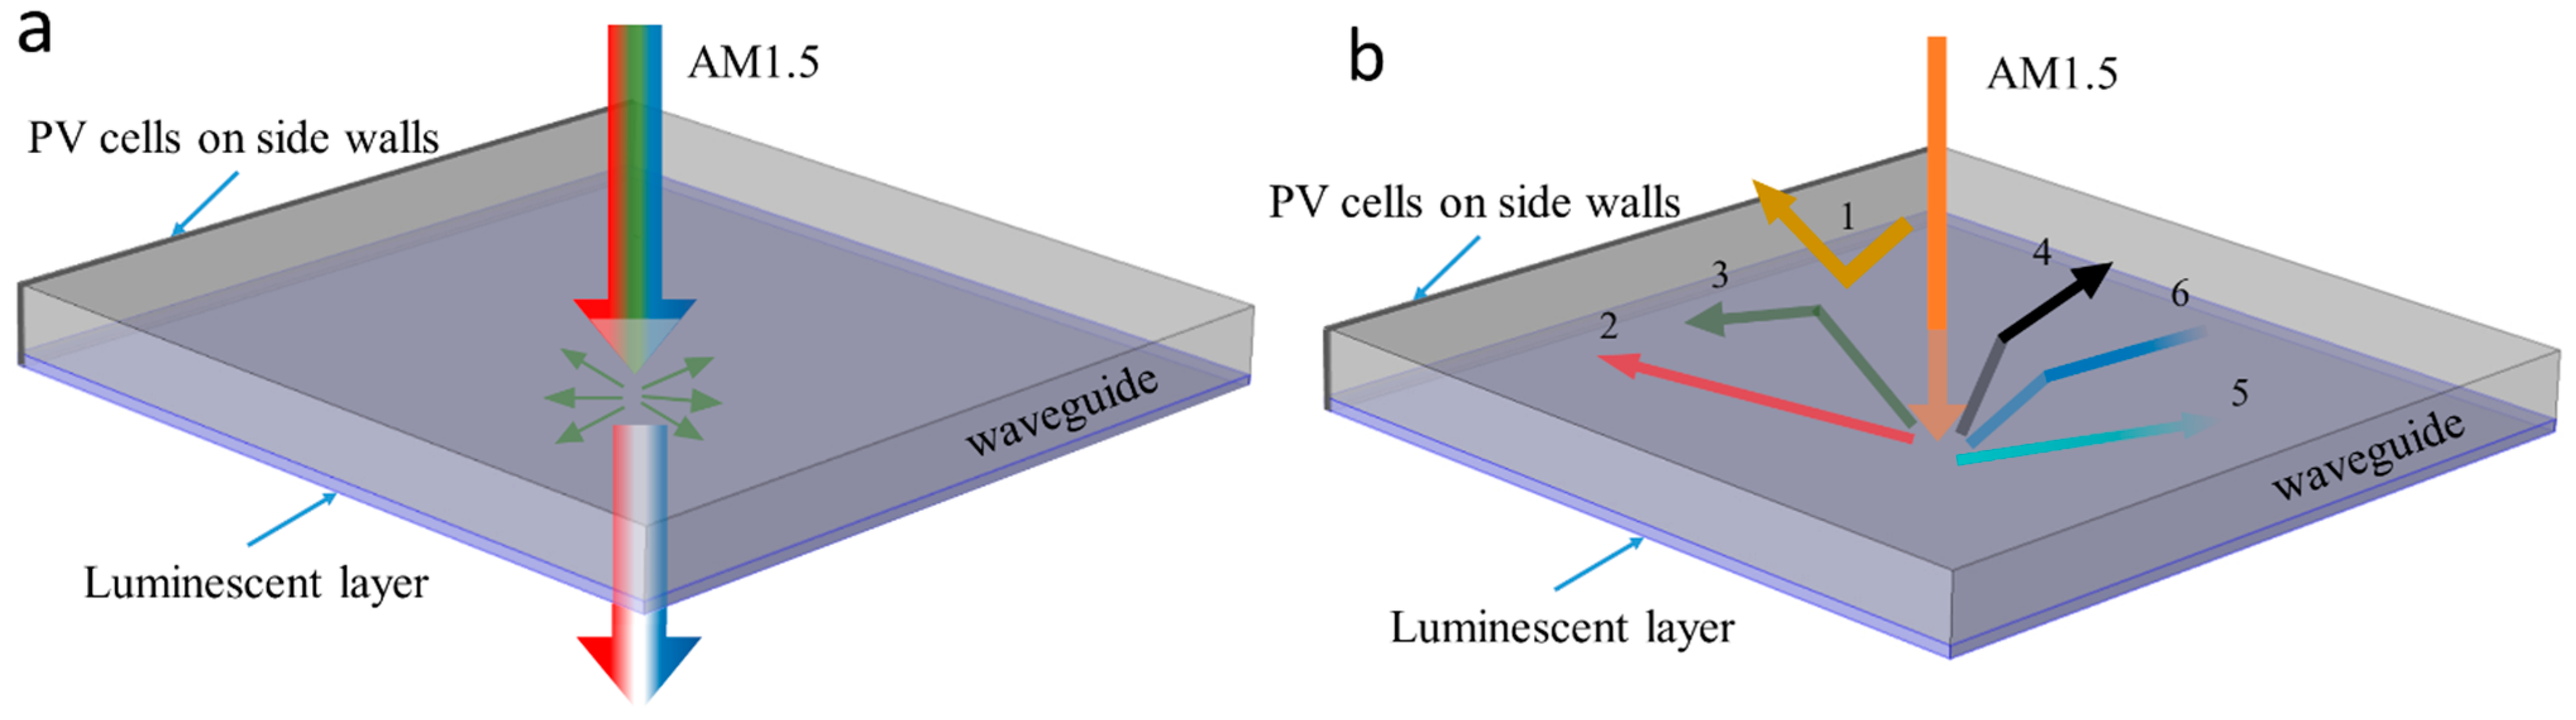
3. Description of the Elliptic Array Solar Spectrum Splitter and Simulation Methods

In this study, we present a novel spectral-splitting solar concentrator (SSS) that has an elliptical configuration that partitions the solar irradiance into photosynthetically inactive radiation (non-PAR) and green PAR, which is typically not strongly absorbed by microalgae, to power PV cells and blue and red PAR to be utilized in microalgae cultivators.
An ellipse has two focal points, and any ray emitted from one of its focal points that is specularly reflected from its surface will be directed toward its second focal point (Figure S1 in the Supplementary Material, Section A). In the proposed SSS, we make use of this ability of an ellipse to transfer light rays emitted from one of its focal points to its second focal point to design an LSC panel with minimal optical losses. The shared focal point in the proposed SSS is occupied with the concentrated luminescent dye that absorbs green PAR or non-PAR and re-emits radiation at an equal intensity in all directions. The light radiated from the luminescent dye is directed toward the focal points of the adjacent unit cells.
This phenomenon, whereby the light emitted from one focal point is refocused at the focal points of the adjacent unit cells, is achieved by designing the curvature of the ellipses such that the radiation emitted at their shared focal point undergoes TIR at their curved sidewalls. If the medium internal to the SSS has an index of refraction equal to n1 and the medium external to the structure is air (nair = 1) then, according to Snell’s law, the radiation emitted from the focal point of the overlapped ellipses will undergo TIR at the surface when the following Equation (1) is satisfied:
c a > tan ( sin 1 ( 1 n 1 ) )
The minimum value of c/a for which the radiation emitted from the focal point of the ellipse will undergo TIR at the ellipse surface is plotted as a function of n1 (the medium internal to the ellipse) in Figure 2b for the case in which the external medium is air. For example, if the ellipse was made from glass (nglass = 1.49), polymer (n high refractive index polymers = 1.7) or titanium dioxide (n TiO2 = 2.5), the minimum values of c/a that would satisfy the TIR condition defined by Equation (1) would be 0.905, 0.727 or 0.436, respectively. Based on the definition of an ellipse c/a < 1, which implies that the refractive index of the medium internal to the ellipse must be 1.41 or greater, as indicated by the red line in Figure 2, to satisfy the TIR condition if the medium external to the ellipse is air. The inset at the top right in Figure 2b shows five different shapes of ellipses over the range of 0.905 < c/a < 1. The TIR condition defined by Equation (1) for the case in which the internal medium is glass is illustrated in Figure 2c, which shows that the radiation emitted from the shared focal point of two overlapping ellipses escapes the SSS structure for values of c/a < 0.905; conversely, all the rays emitted from the focal point undergo TIR at the surfaces of the glass-based ellipse for the case in which c/a ≥ 0.905.
Herein, we use the ellipse-based unit cell shown in Figure 2 in the design of a spectral-splitting solar concentrating panel that transmits blue and red PAR, such that it can be used for algae cultivation while absorbing green PAR and non-PAR incident from the solar irradiance to generate electric power. A cross-section of this panel, in the “X–Y” plane, is shown in Figure 3a, and the shape of this panel is realized in three-dimensions by translating this cross-section in the “Z” direction, as shown in Figure 3b. For conciseness, we refer to this panel as an elliptic array solar spectrum splitter (EASSS). Additionally, shown in Figure 3b is an array of Petzval lenses that focuses the incident solar irradiance onto the focal lines within the EASSS. The concentrated light beams coming from the Petzval lens array are incident onto an array of linear receivers (negative lenses) residing on the upper surface of the EASSS, which facilitate the coupling of the incident light onto the focal lines. The incident green PAR and non-PAR is absorbed by luminophores concentrated along the focal lines within the EASSS, while the blue and red PAR is transmitted and leaves the EASSS through a linear exit port located beneath the focal line. The radiation from the luminophores, emitted with equal intensity in all directions, is confined within the EASSS via TIR and is directed toward the PV cells embedded at the side walls of the EASSS. In this case, luminescent dye absorbs the spectral region from ~500–600 nm and from ~740–1100 nm and re-emits photons at wavelengths matched to the single junction PVs at the EASSS side walls. For example, Lumogen Red 305, one of the most commonly used dyes in LSCs, which has an absorption peak of ~580 nm and an emission peak of ~620 nm, and CY (a cyanine derivative), with absorption spectra peaks at 742 nm and NIR emission peaks at 772 nm, can be utilized. InGaP (Ebandgap = 1.82 eV), single junction Si (Ebandgap = 1.1 eV) and GaSb (Ebandgap = 0.67 eV) solar cells can be used as PV cells at the panel sidewalls to harvest different ranges of the non-PAR spectrum. The part of the incoming beam that is not absorbed by the luminescent dye can be used to cultivate algae in a photobioreactor located beneath the EASSS [40,41,42,43,44,45,46,47].
In conventional flat-panel LSCs, the light emitted within a broad cone does not undergo TIR at the panel surface and emission losses are ~25%. In the EASSS, TIR occurs for all the light emitted from the focal line with the exception of the light that is emitted onto the receiver or the exit port. As discussed subsequently with reference to Figure 3, the expected emission losses from the EASSS are just a few percent. The surface scattering losses can be estimated using the equation (1 − D)N, where D is the surface scattering coefficient and N is the number of ray collisions with the surface of the EASSS. Moreover, the internal absorption losses can be determined using the expression e−αL, where α is the absorption coefficient of the internal medium the EASSS is comprised of, and L is the trajectory path length of the rays through this internal medium.
In the literature, Monte Carlo ray-tracing methods have been used to model LSCs [46,47,48]. Herein, we numerically model the path length, emission losses and optical efficiency for the light emitted from the focal line inside the EASSS using COMSOL Multiphysics software (version 5.4) ray optics and heat transfer modules supplemented with MATLAB for analytical analysis. The number of rays emitted from each point source was a minimum of 106, and the mesh sizes are normalized to the focal distance. The non-dimensional mesh size does not exceed 0.01, and the maximum relative tolerance for convergence is 10−5.
The analysis is performed as follows: Firstly, an EASSS structure without entrance ports (receivers) or exit ports is considered. Specifically, surface scattering losses, in terms of the number of surface scattering events, N, within the EASSS is modeled and analyzed in 2D and compared with that of the conventional flat-panel LSC. Then, the absorption losses, in terms of the mean light-ray path length, are determined for the EASSS and flat-panel LSC. Subsequently, the effect of structure thickness on the absorption and surface scattering losses are investigated. Afterward, the receivers and exit ports are introduced on the upper and lower sides of the EASSS, respectively. The effect of altering the structure of the receiver on the performance of the EASSS is considered and discussed thereafter. In practice, all the luminescent dye required to absorb the incident non-PAR spectra would occupy a finite volume and could not lie precisely on the focal lines within the EASSS. In this regard, the effects of the finite volume occupied by the dye and the sensitivity of the performance of the EASSS with respect to the displacement of the dye from the focal line are investigated. Furthermore, considering the highly concentrated solar irradiation on the narrow receivers, thermal analysis of the EASSS is carried out. Finally, the optical and power conversion efficiency for a sample case of an EASSS working in conjunction with a photo-bioreactor is analyzed and discussed.

4. Results

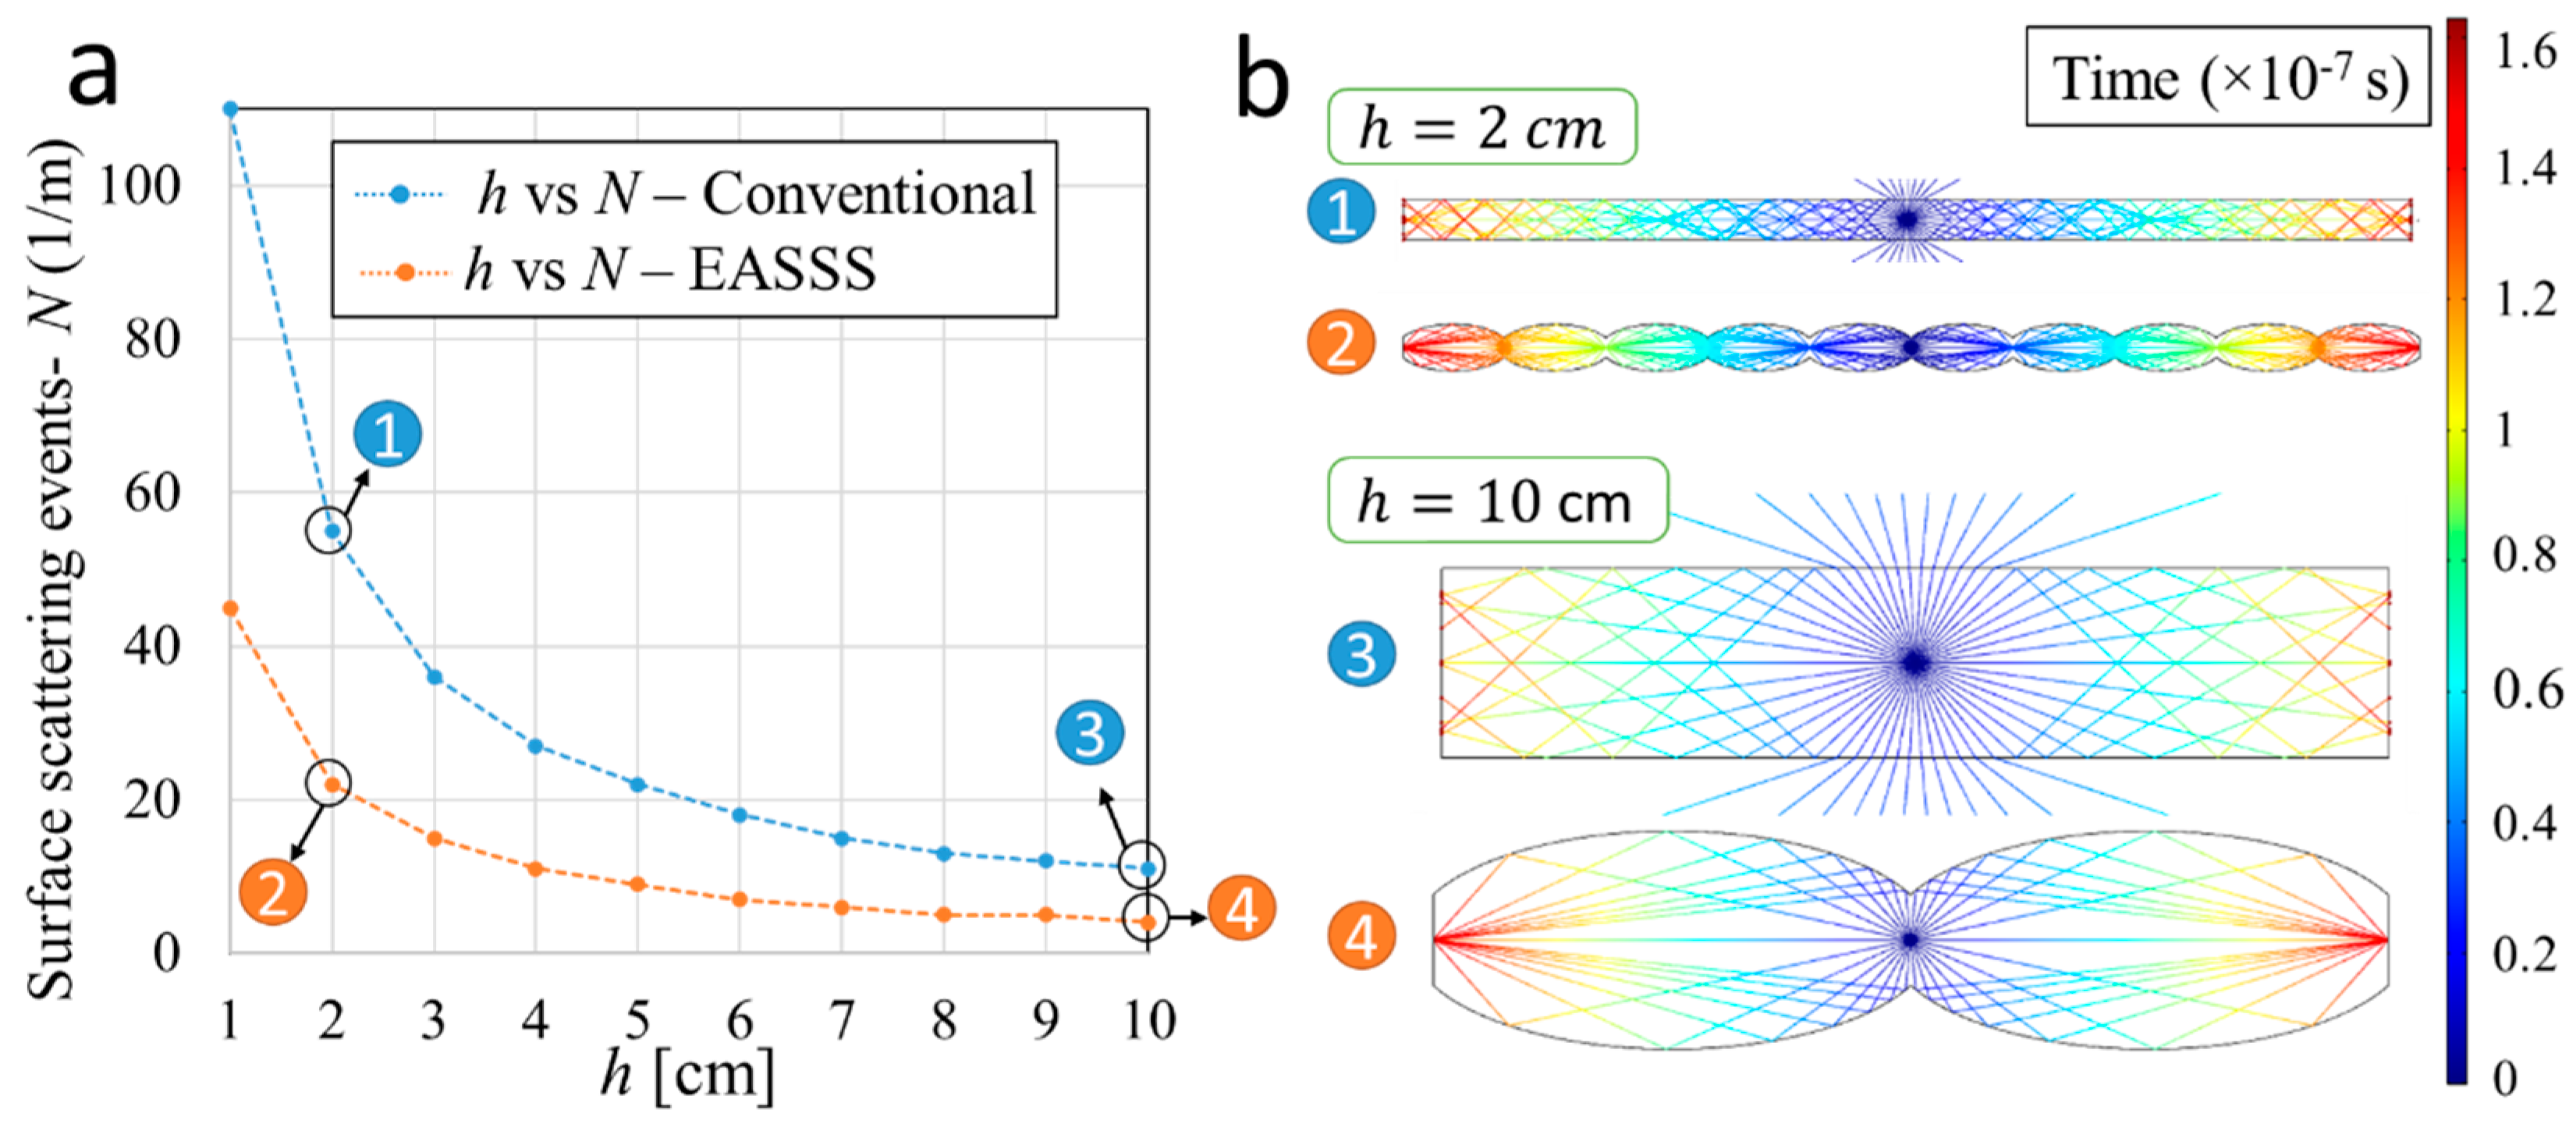
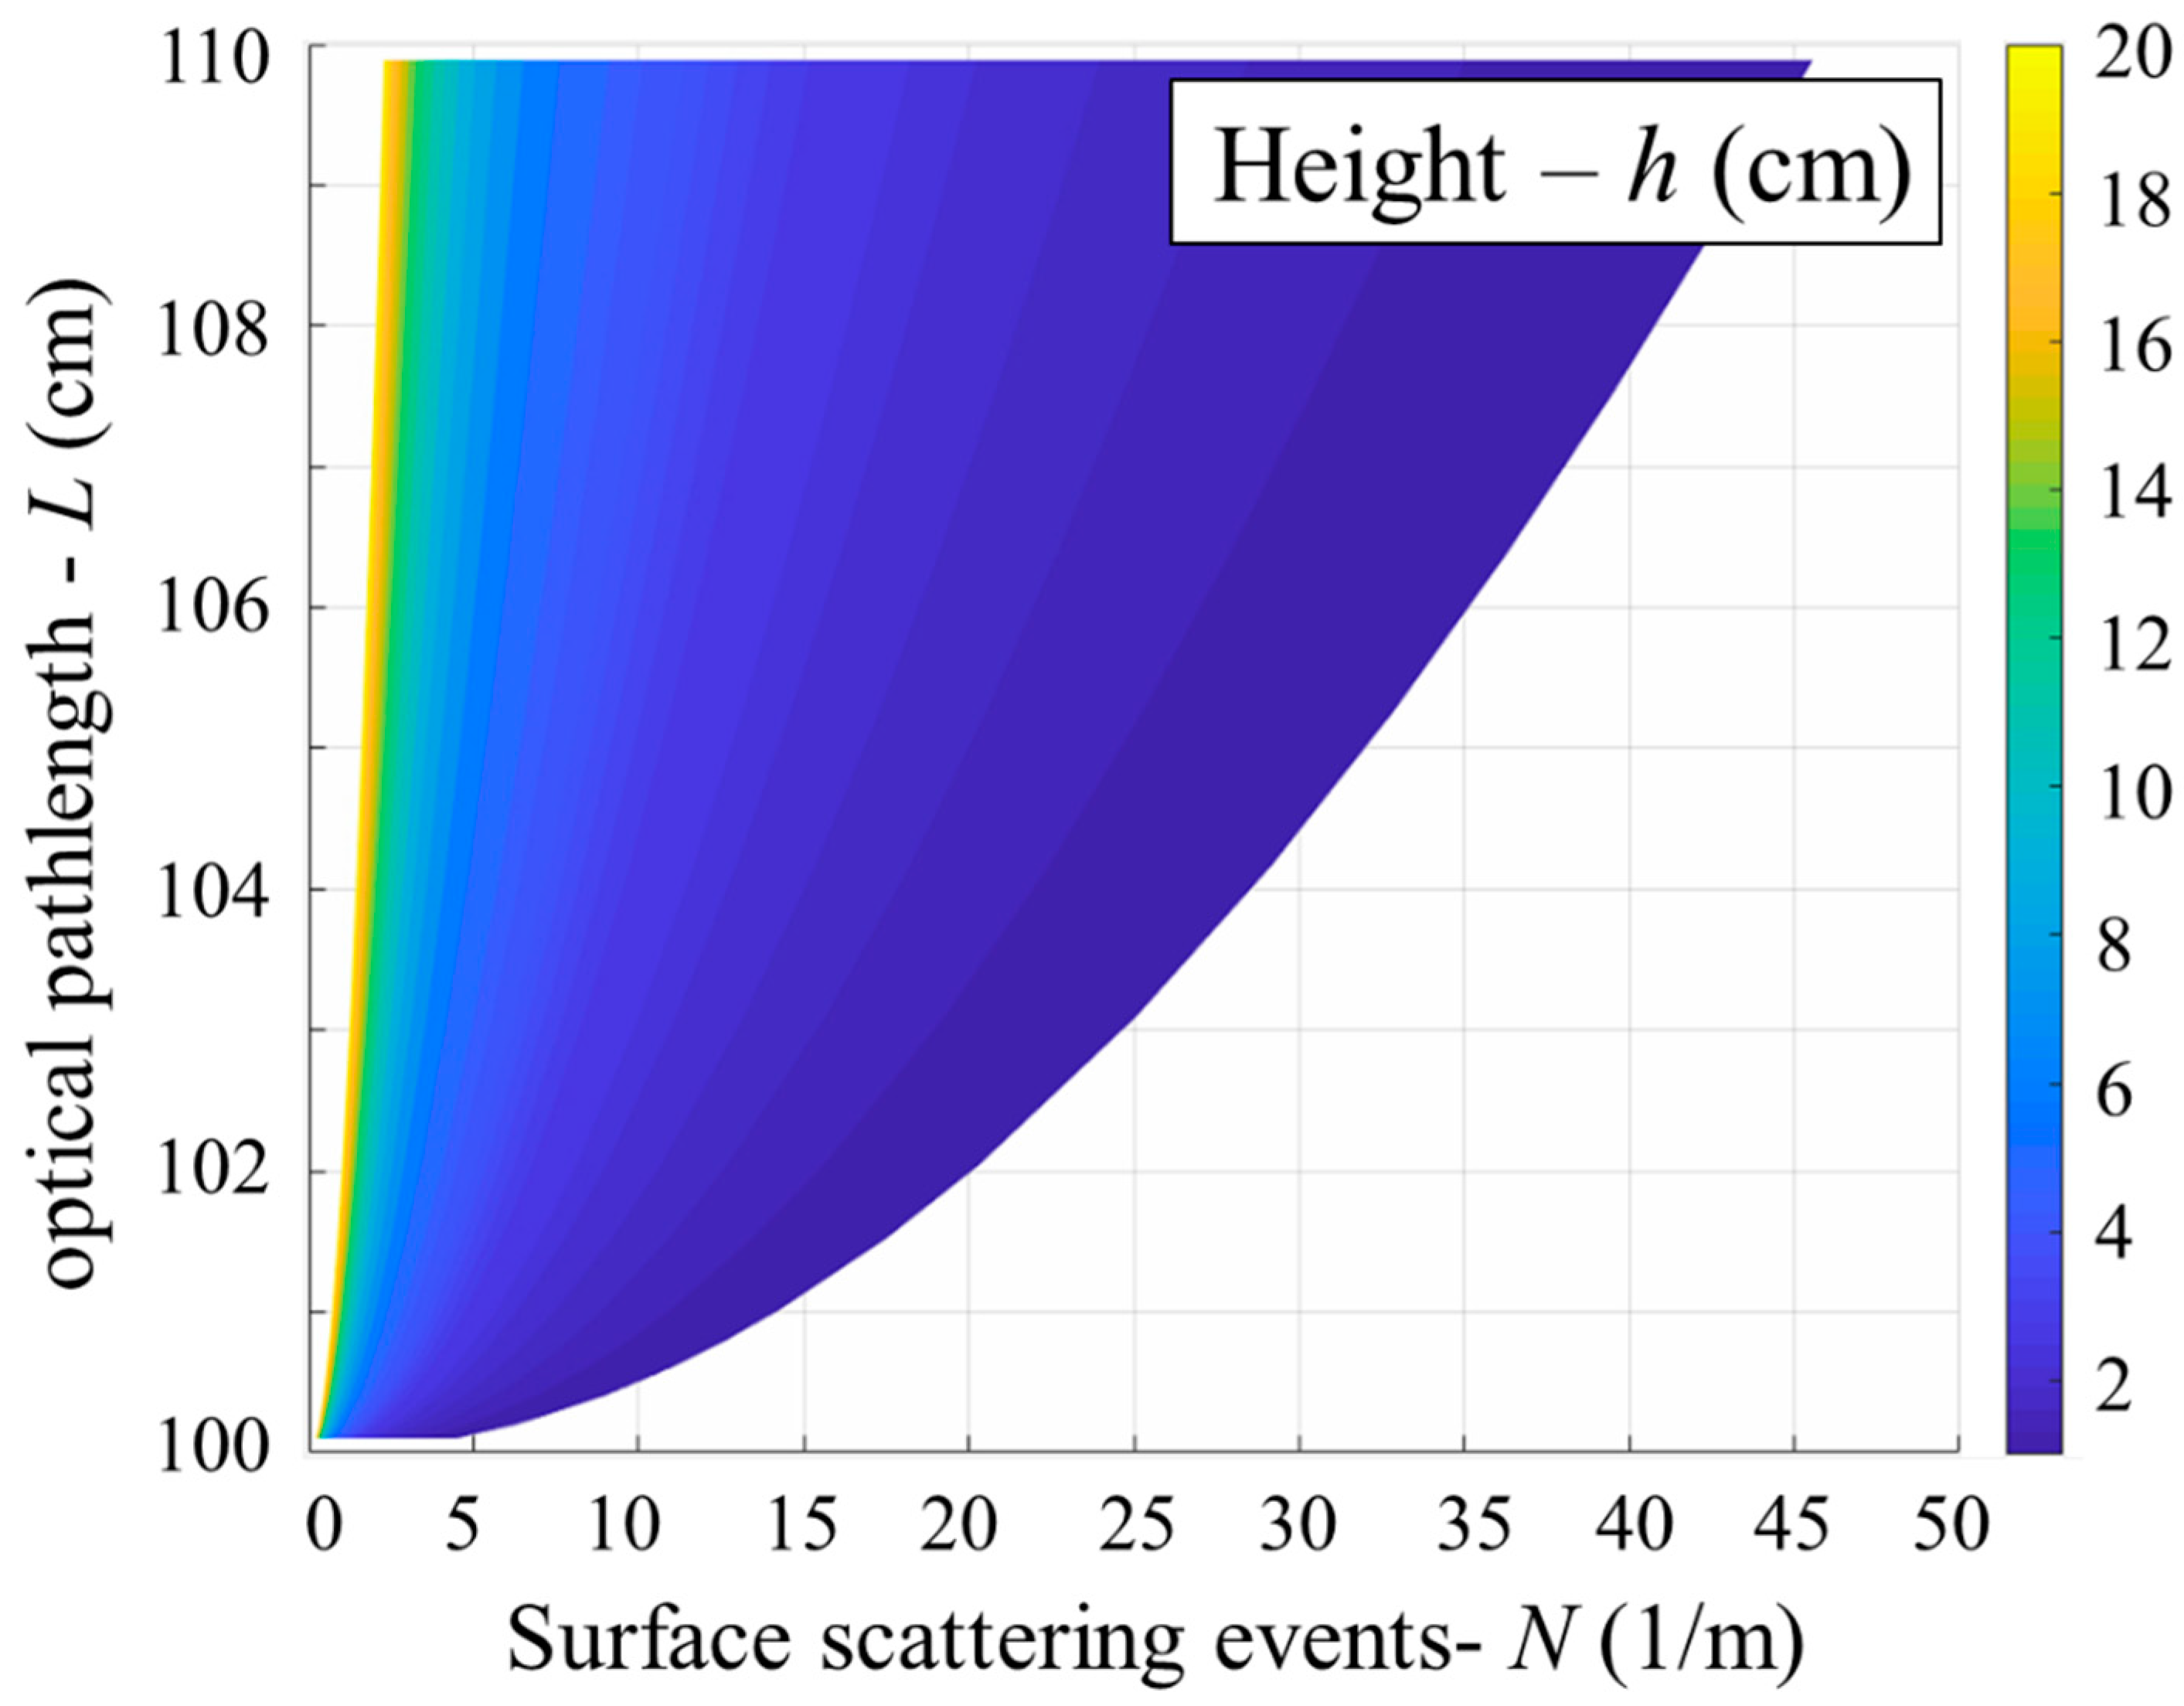
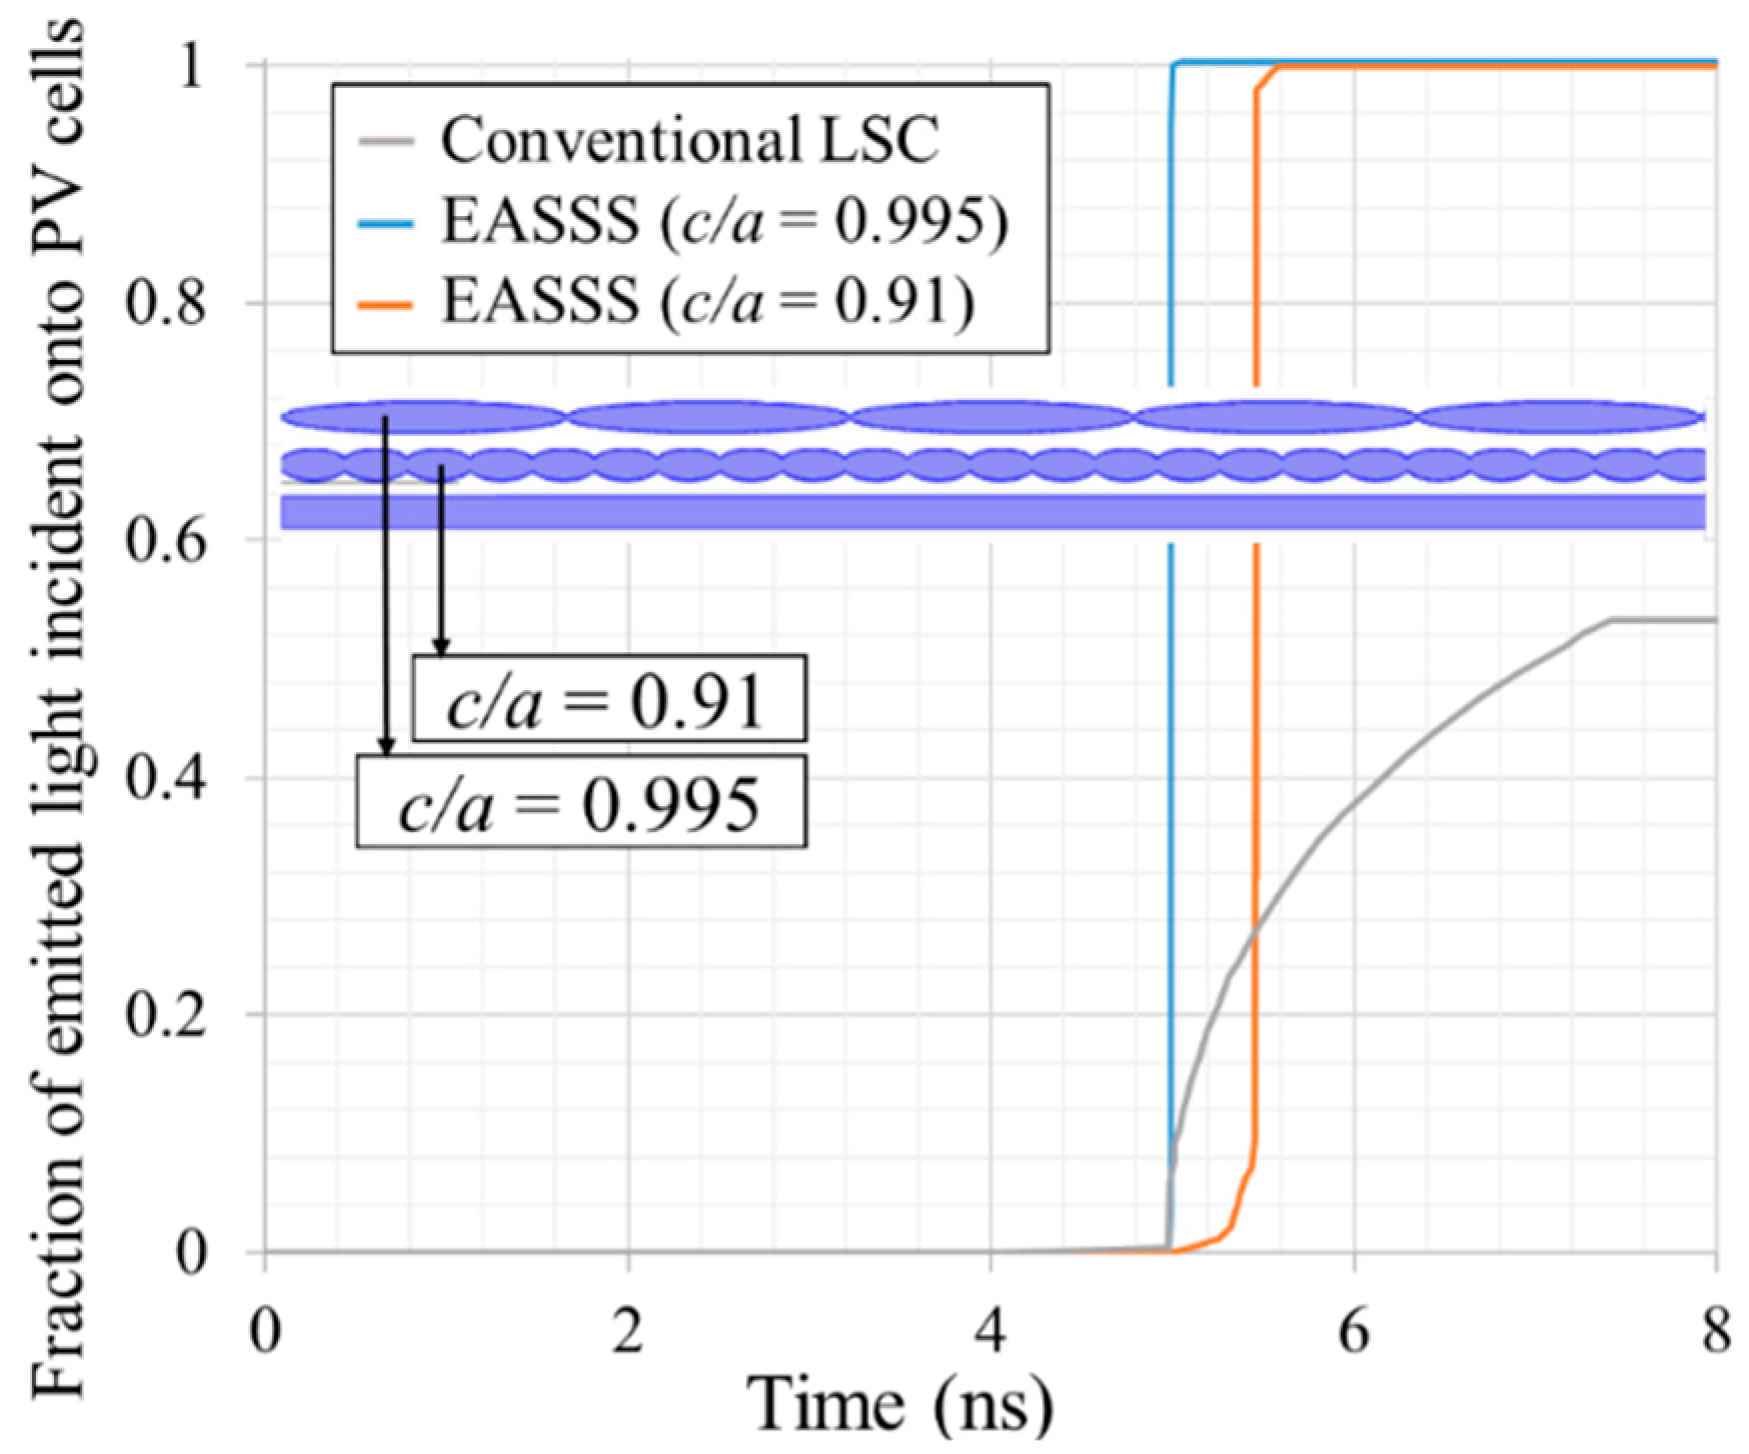
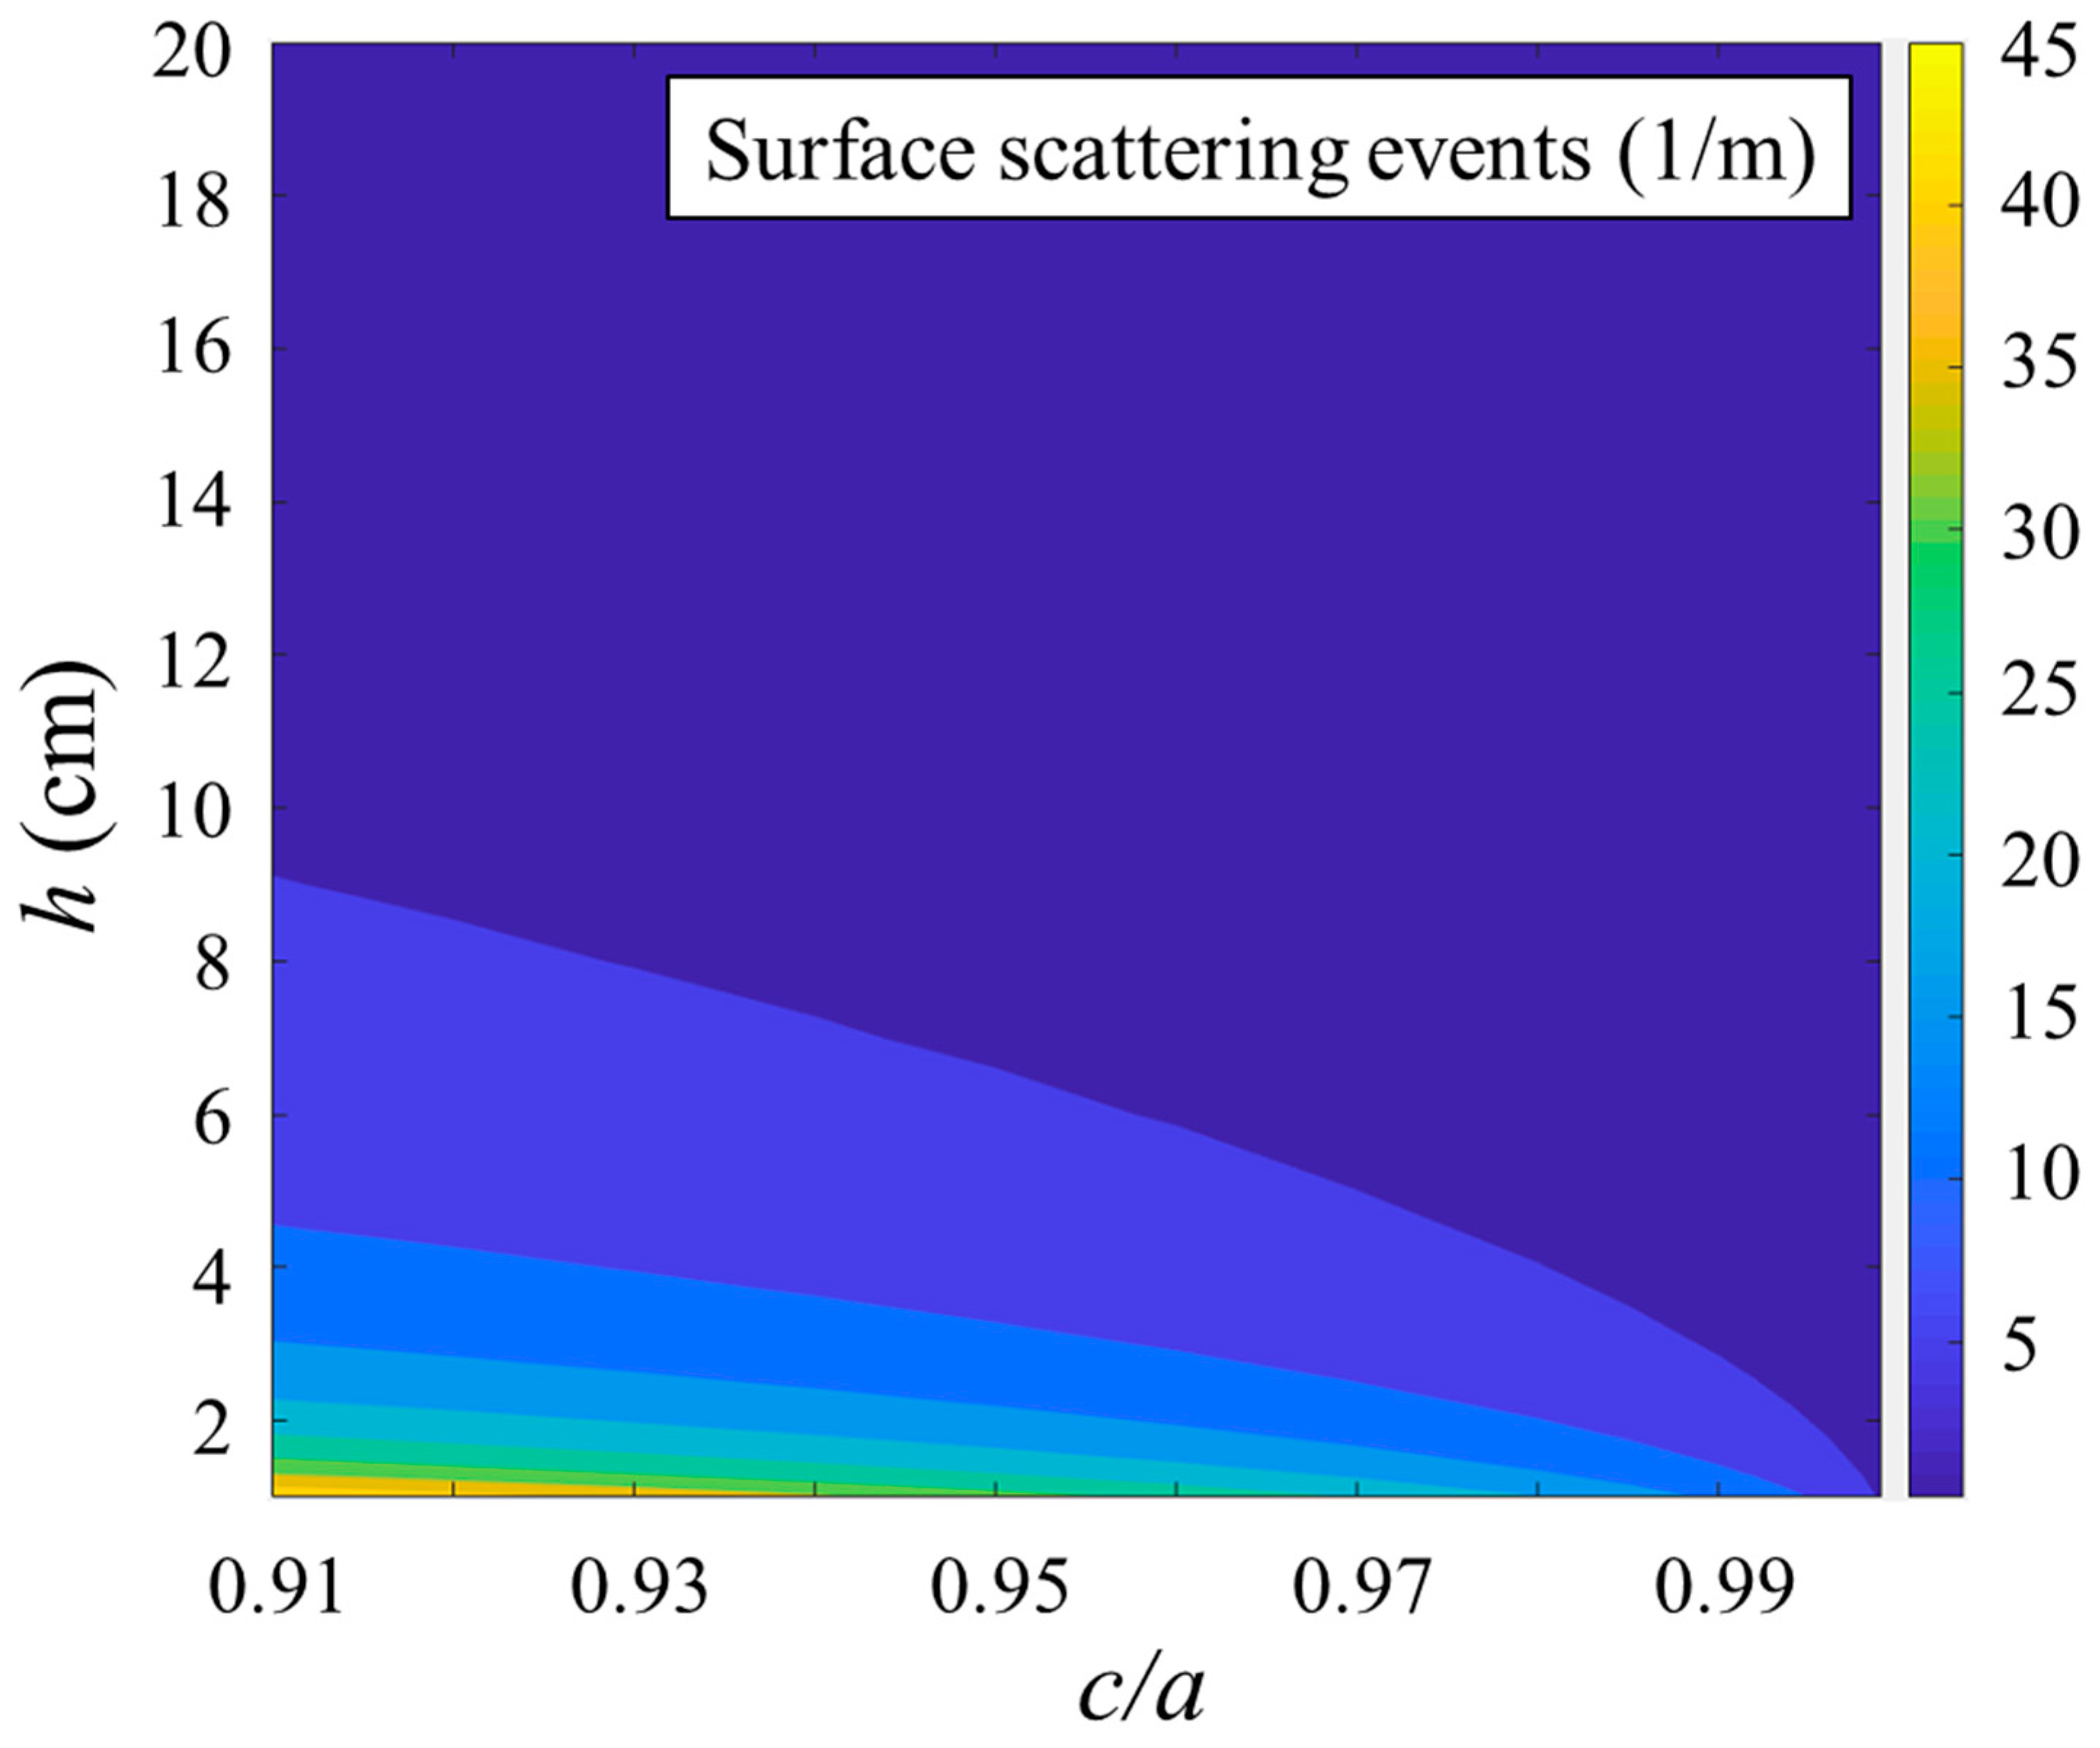
4.1. Surface Scattering Losses in the EASSS

The number of scattering events per meter width in the x-direction is plotted as a function of the height (2b = h) and c/a ratio of the EASSS in Figure 4. For a constant height of the EASSS structure, as c/a increases the number of unit cells (focal lines) per meter within the EASSS panel decreases and, therefore, the number of surface collisions decreases, which lowers the surface scattering losses. In general, as c/a and h increase, surface scattering losses decrease.
The number of surface scattering events per meter in the x-direction is plotted as a function of LSC height for an EASSS with c/a = 0.91 and a conventional flat-panel LSC in Figure 5a. Figure 5b shows comparisons of the trajectory of the light emitted from a point source located at the center of the EASSS to the trajectory of the light emitted from the center of a conventional LSC panel. When the panel height is 2 cm, the number of surface scattering events in the EASSS and conventional LSC panels are N = 22/m and N = 55/m, respectively. When the panel height is increased to 10 cm, the number of surface scattering events in the EASSS and conventional LSC panels is N = 4 m−1 and N = 11 m−1, respectively. Thus, the number of surface scattering events in the EASSS is typically less than half that in the convectional LSC, which helps to minimize surface scattering losses.

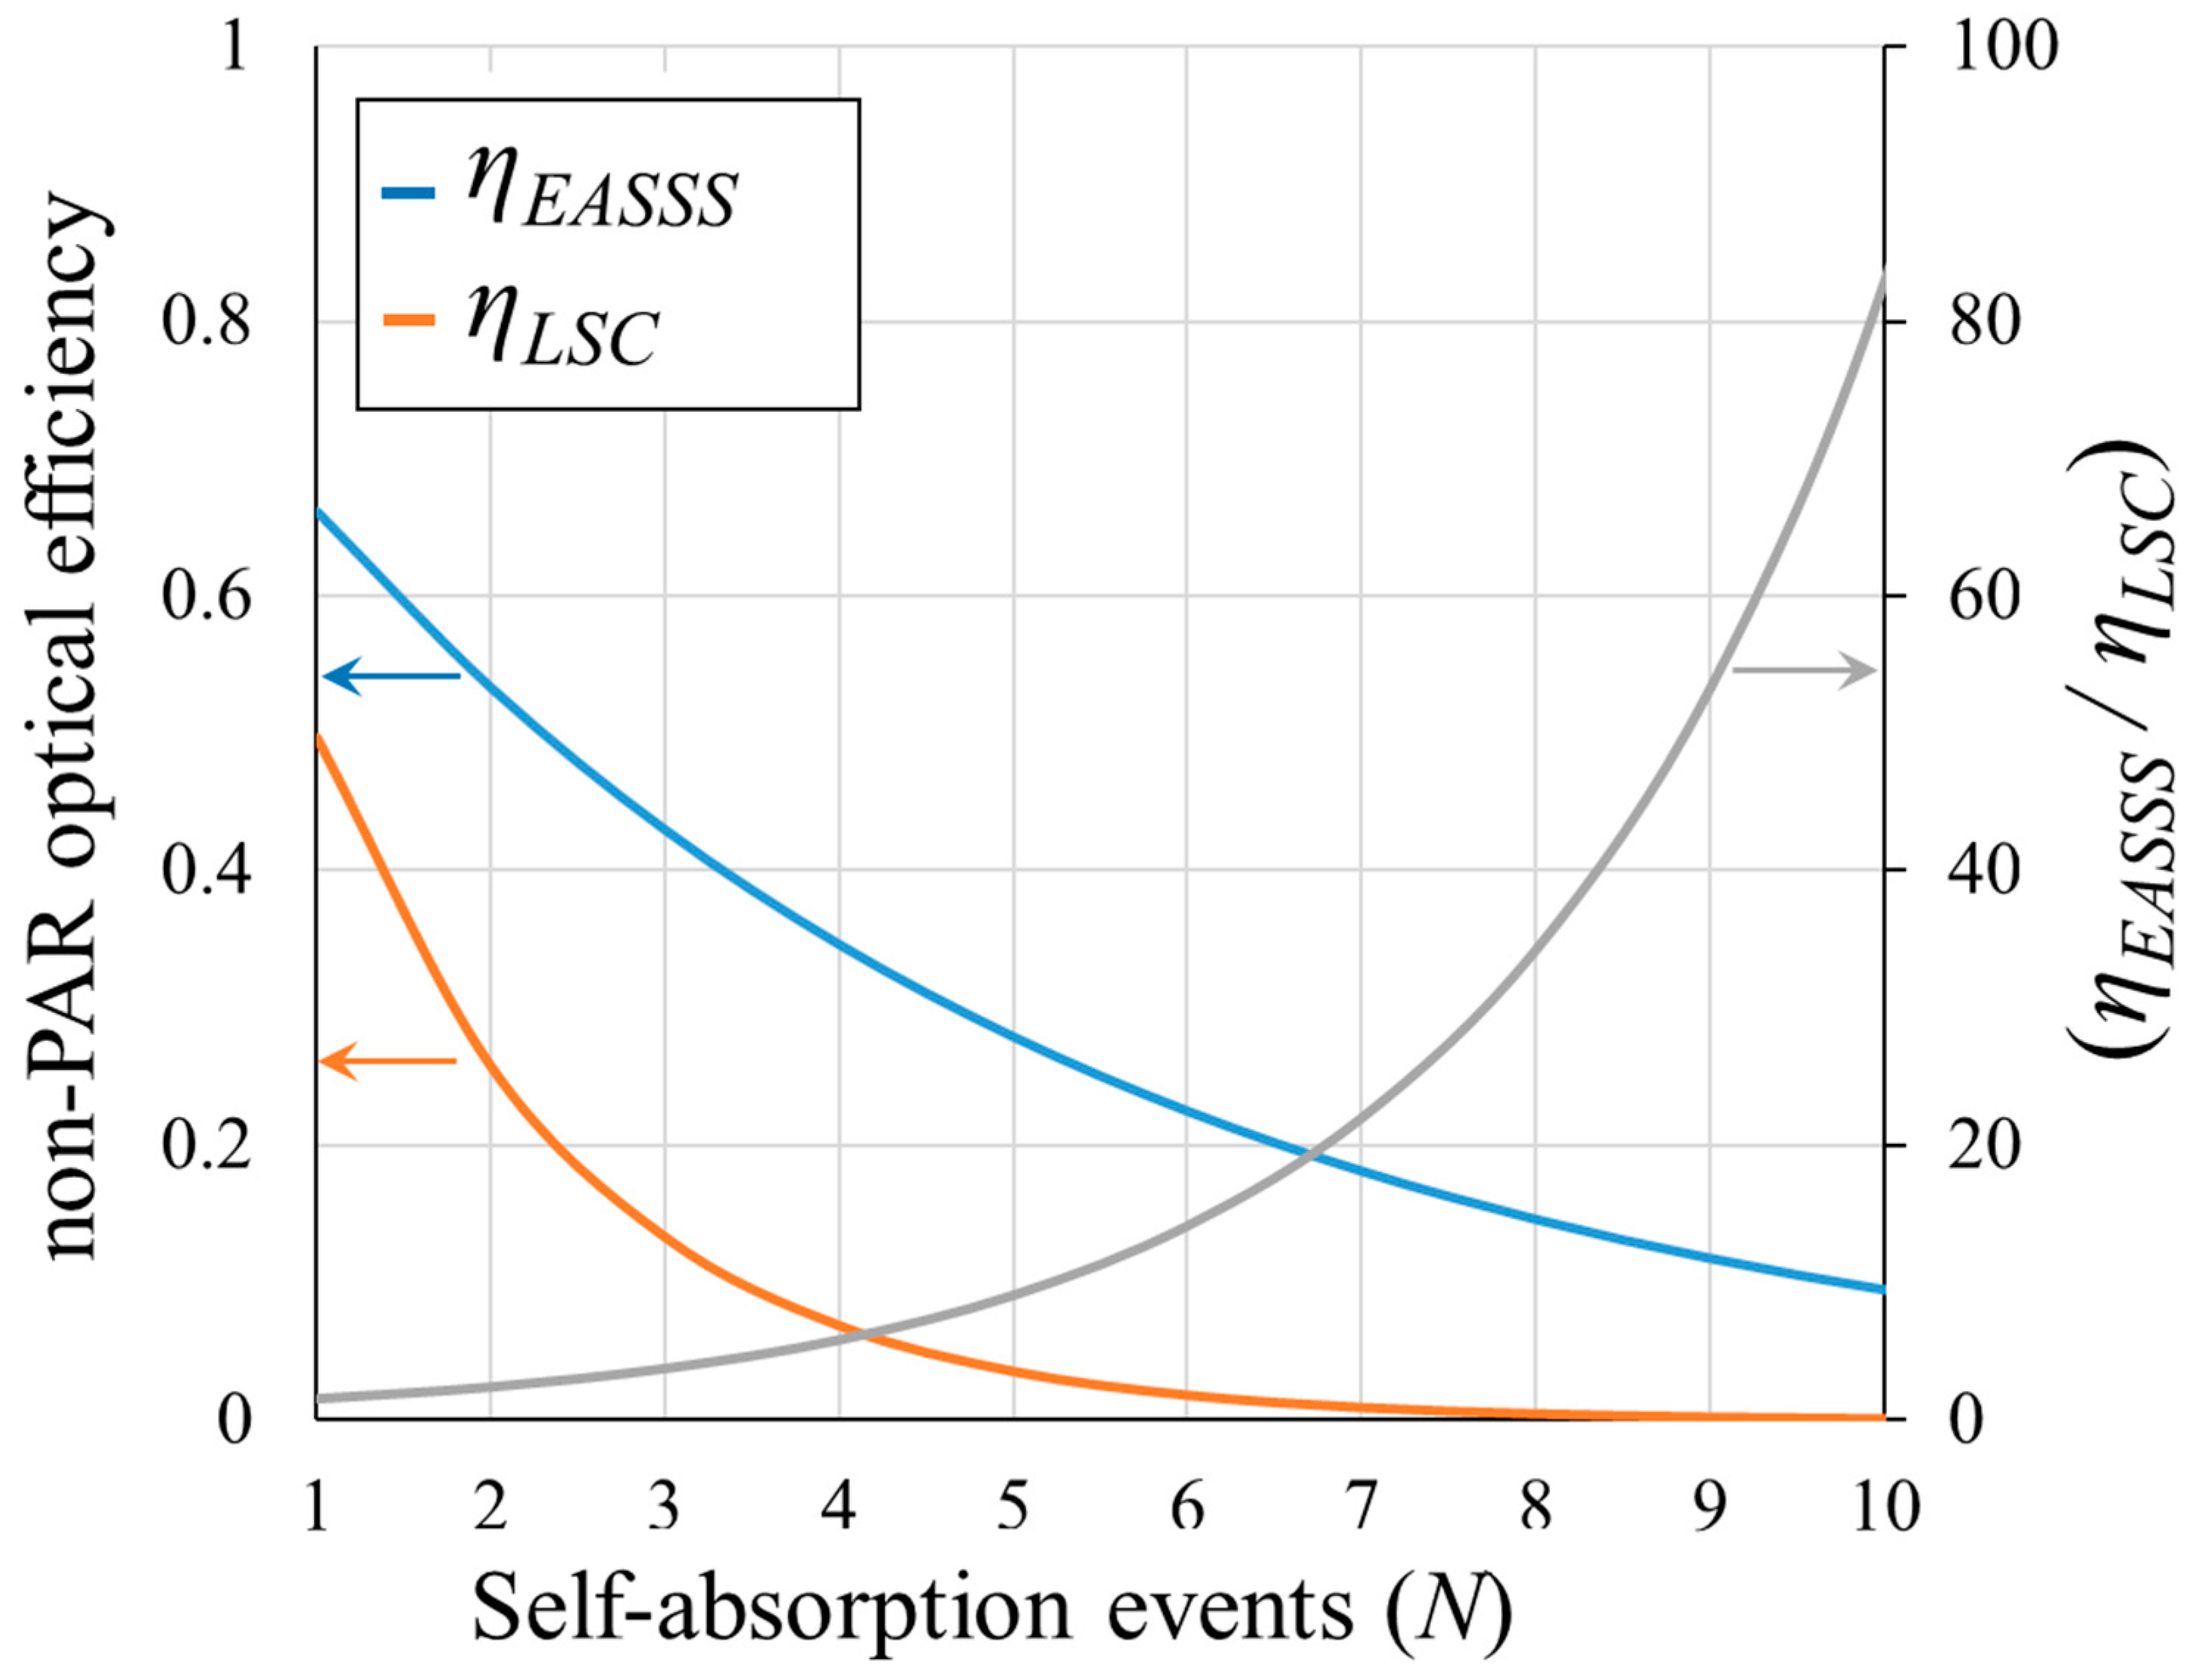
4.2. Absorption Losses in the EASSS

It can be noted that absorption losses are independent of structure height, h, because, for a constant value of c/a, as h increases the optical path length remains invariable. On the other hand, as c/a increases, the curvature of the EASSS surfaces increase and the light emitted from the focal lines is more strongly directed toward the EASSS sidewalls, resulting in a decrease in the optical path length.
The optical path length of radiation emitted from the center of a panel to its sidewalls is shown in Figure 6a for the EASSS and the conventional LSC panels for a height of h = 2 cm and a width of 2 m. For a point source located in the middle of a conventional LSC, the emission at the critical angle (C.A) (~42° when the index of refraction of the LSC is 1.49) and C.A/2 results in optical path lengths of 150 and 110 cm, respectively. For the EASSS, however, the optical path length is independent of the emission angle. Furthermore, the optical path length ranges from 110 cm (for c/a = 0.905) to 100 cm (for c/a = 0.999). As can be seen in Figure 6b, the number of unit cells (focal lines) in the EASSS increases as c/a decreases, resulting in a longer optical path length for an EASSS with a fixed height and width of 2 cm and 2 m, respectively.
The optical path length and number of surface scattering events are plotted as a function of the height of the EASSS panel, h, in Figure 7. As h decreases, the number of surface scattering events increases, thereby increasing the expected surface losses (c/a = 0.91).

4.3. Transmission Losses in the EASSS

Figure 8 shows the fraction of radiation emitted from luminophores at the centers of the EASSS and conventional LSC panels that are incident onto PV cells located at the panel sidewalls as a function of time. In this figure, two EASSSs with c/a = 0.995 and c/a = 0.91, and a conventional LSC, are considered, each having a height of h = 2 cm. The distance between the luminophore at the center of the panels and the PV cells at the panel sidewalls is assumed to be one meter. As can be seen in Figure 8, for the EASSS, the emitted photons from luminescent dyes reach the solar cells sooner, because they have a shorter distance to travel, in comparison to the conventional LSC. The shorter distance and duration for photons propagating in the EASSS, as compared to the conventional LSC, translates to a reduction in transmission (ηTransmission), self-absorption (ηSelf-abs), surface roughness (ηRoughness) and emission (ηEmission) losses, which will be discussed subsequently.

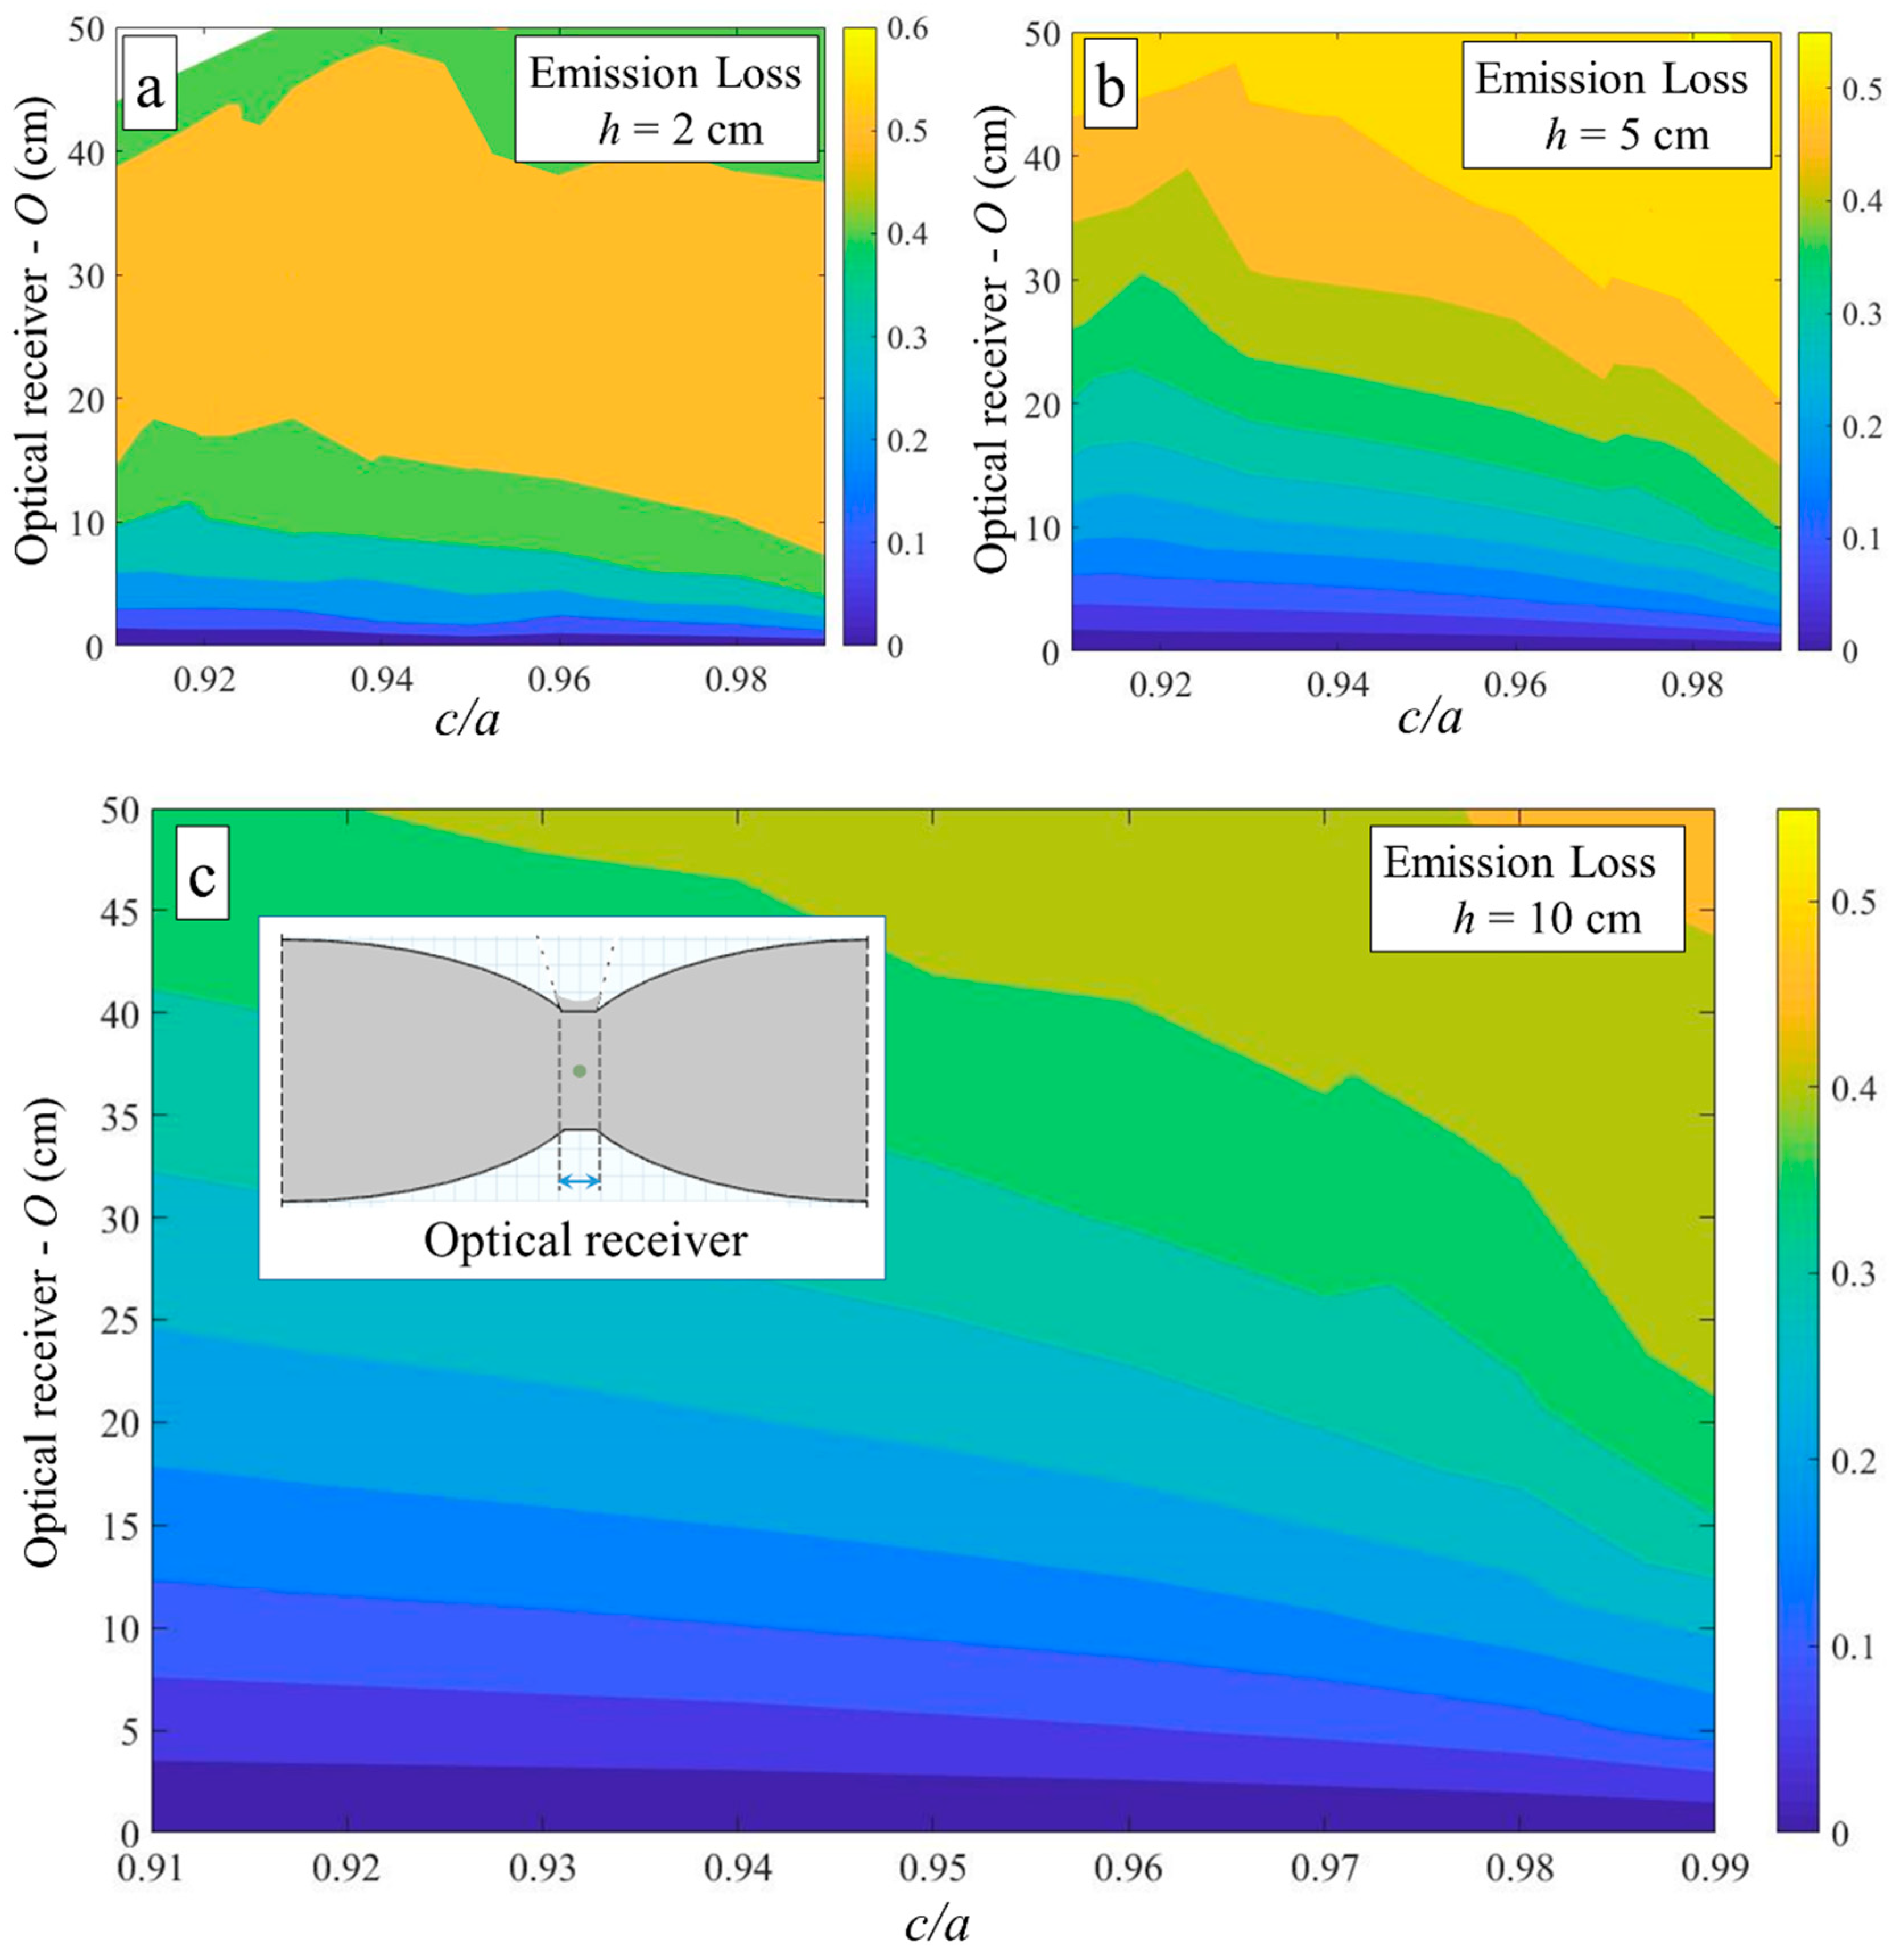
4.4. Optical Receiver Design

As mentioned previously, a linear array of Petzval lenses is used to collimate the solar irradiation into the EASSS along the focal lines where the luminescent dyes are concentrated. The Petzval lens configuration is composed of two positive lens groups separated by an air gap. To enable the incoming concentrated blue and red PAR to efficiently exit the underside of the EASSS, a negative lens element is placed on top of the entrance port on the upper side of the EASSS, as shown in Figure 3c. The entrance port introduces emission losses, which are discussed subsequently.

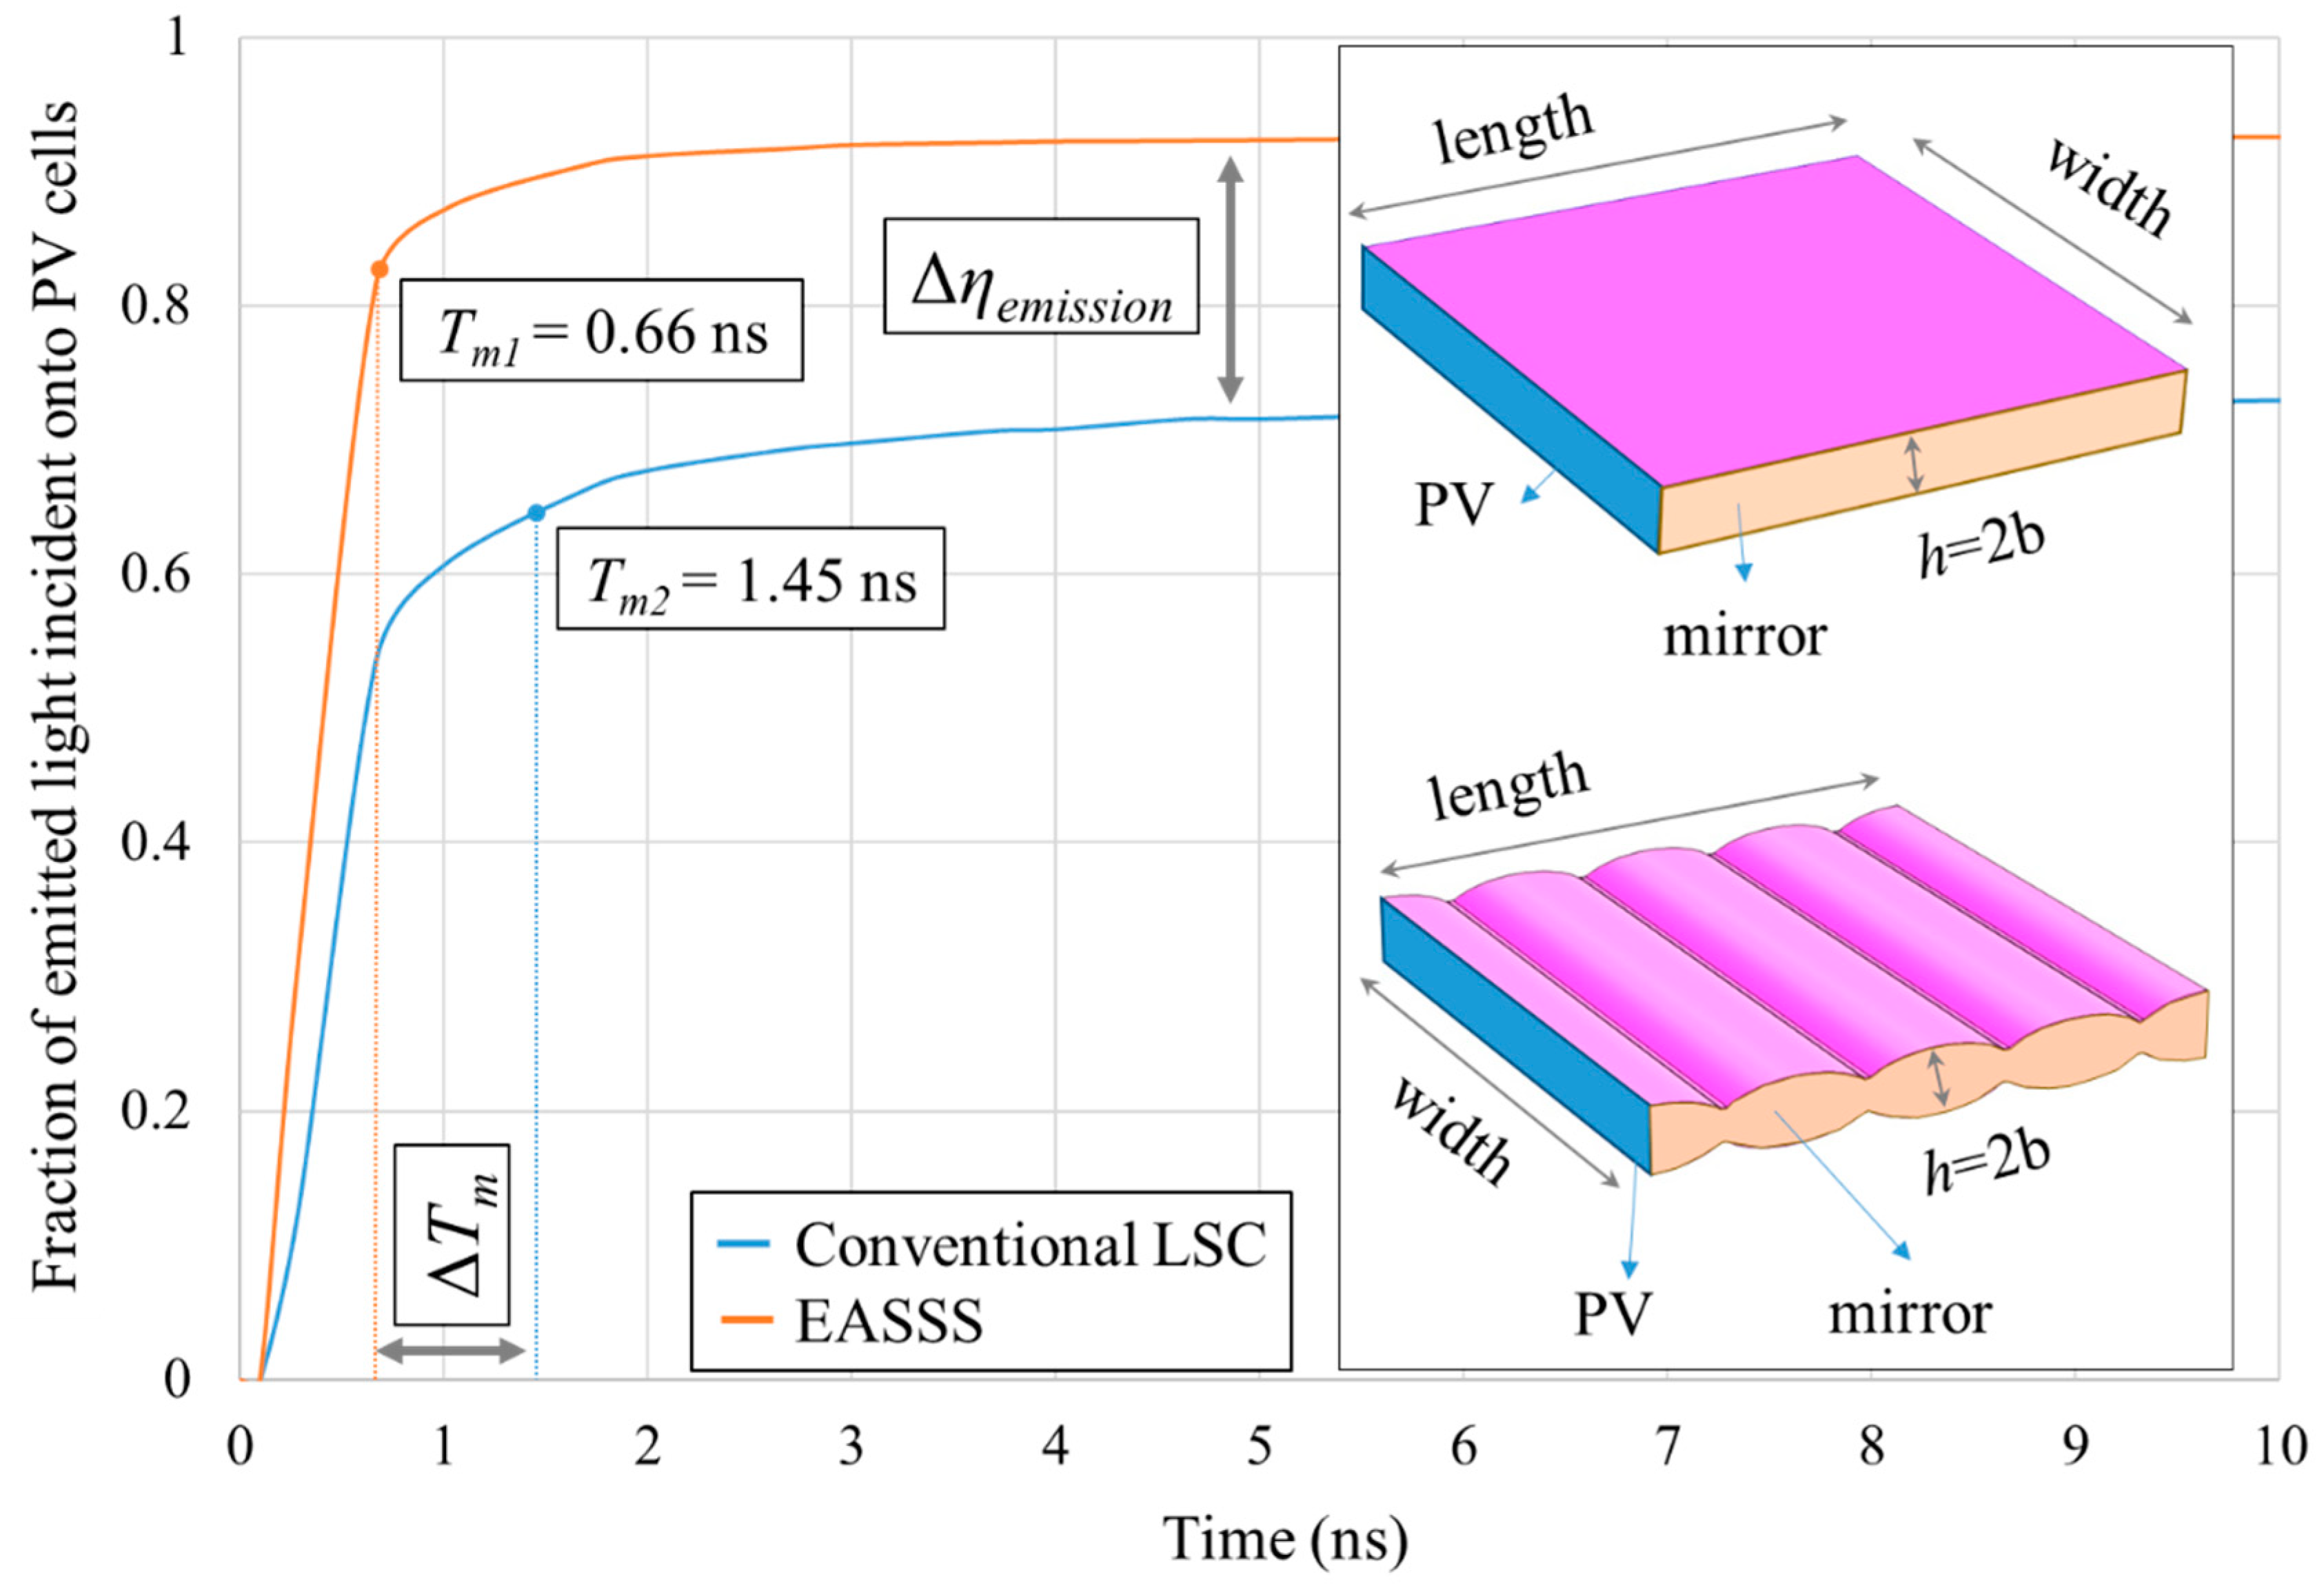
4.4.1. Emission Losses as a Function of the Optical Receiver Design

It is clear that increasing the width of the optical receiver port (O), as shown in Figure 9c, results in higher emission losses. For constant values of O and h, as c/a increases, p = b2/a decreases and emission losses increase. From the perspective of structure thickness (h), for constant values of O and c/a, as h increases, p increases and emission losses decrease. The emission losses are shown as a function of O and c/a for three different values of h = 2, 5 and 10 cm in Figure 9a–c, respectively.

4.4.2. Emission Losses as a Function of the Volume Occupied by the Luminescent Dye in the Vicinity of the EASSS Focal Line

The results presented in all the previous sections were calculated in 2D under the assumption that the luminescent dye is located precisely along the focal line of the overlapped ellipses. In practice, the dye molecules will occupy a limited volume, the size of which depends on the amount of dye required to absorb the incident green PAR and non-PAR solar photon flux. Figure 10a,b show the percentage of radiation emitted from the focal line that is lost through the upper and bottom entrance and exit ports as a function of the in-plane (X–Z plane shown in Figure 2b) and out-of-plane (Y–Z plane shown in Figure 3b) displacement of the luminescent dye from the focal line for two sample EASSS configurations with c = 5 cm and h = 2 and h = 4 cm, respectively.
As an example, based on the assumptions and analysis regarding dye concentration and absorption that we reported in a previous work [49], it was concluded that the required volume of Lumogen R305 dye in the EASSS with parameter values of c/a = 0.91, c = 1.25 cm and O = 0.1 cm and an area of 10 × 10 cm2 to absorb all the incident light over the spectral range of 575~620 nm, requires ~1.57 × 10⁻³ mm3 for each unit cell. This required volume creates negligible focal line-offset losses (less than ~1%).

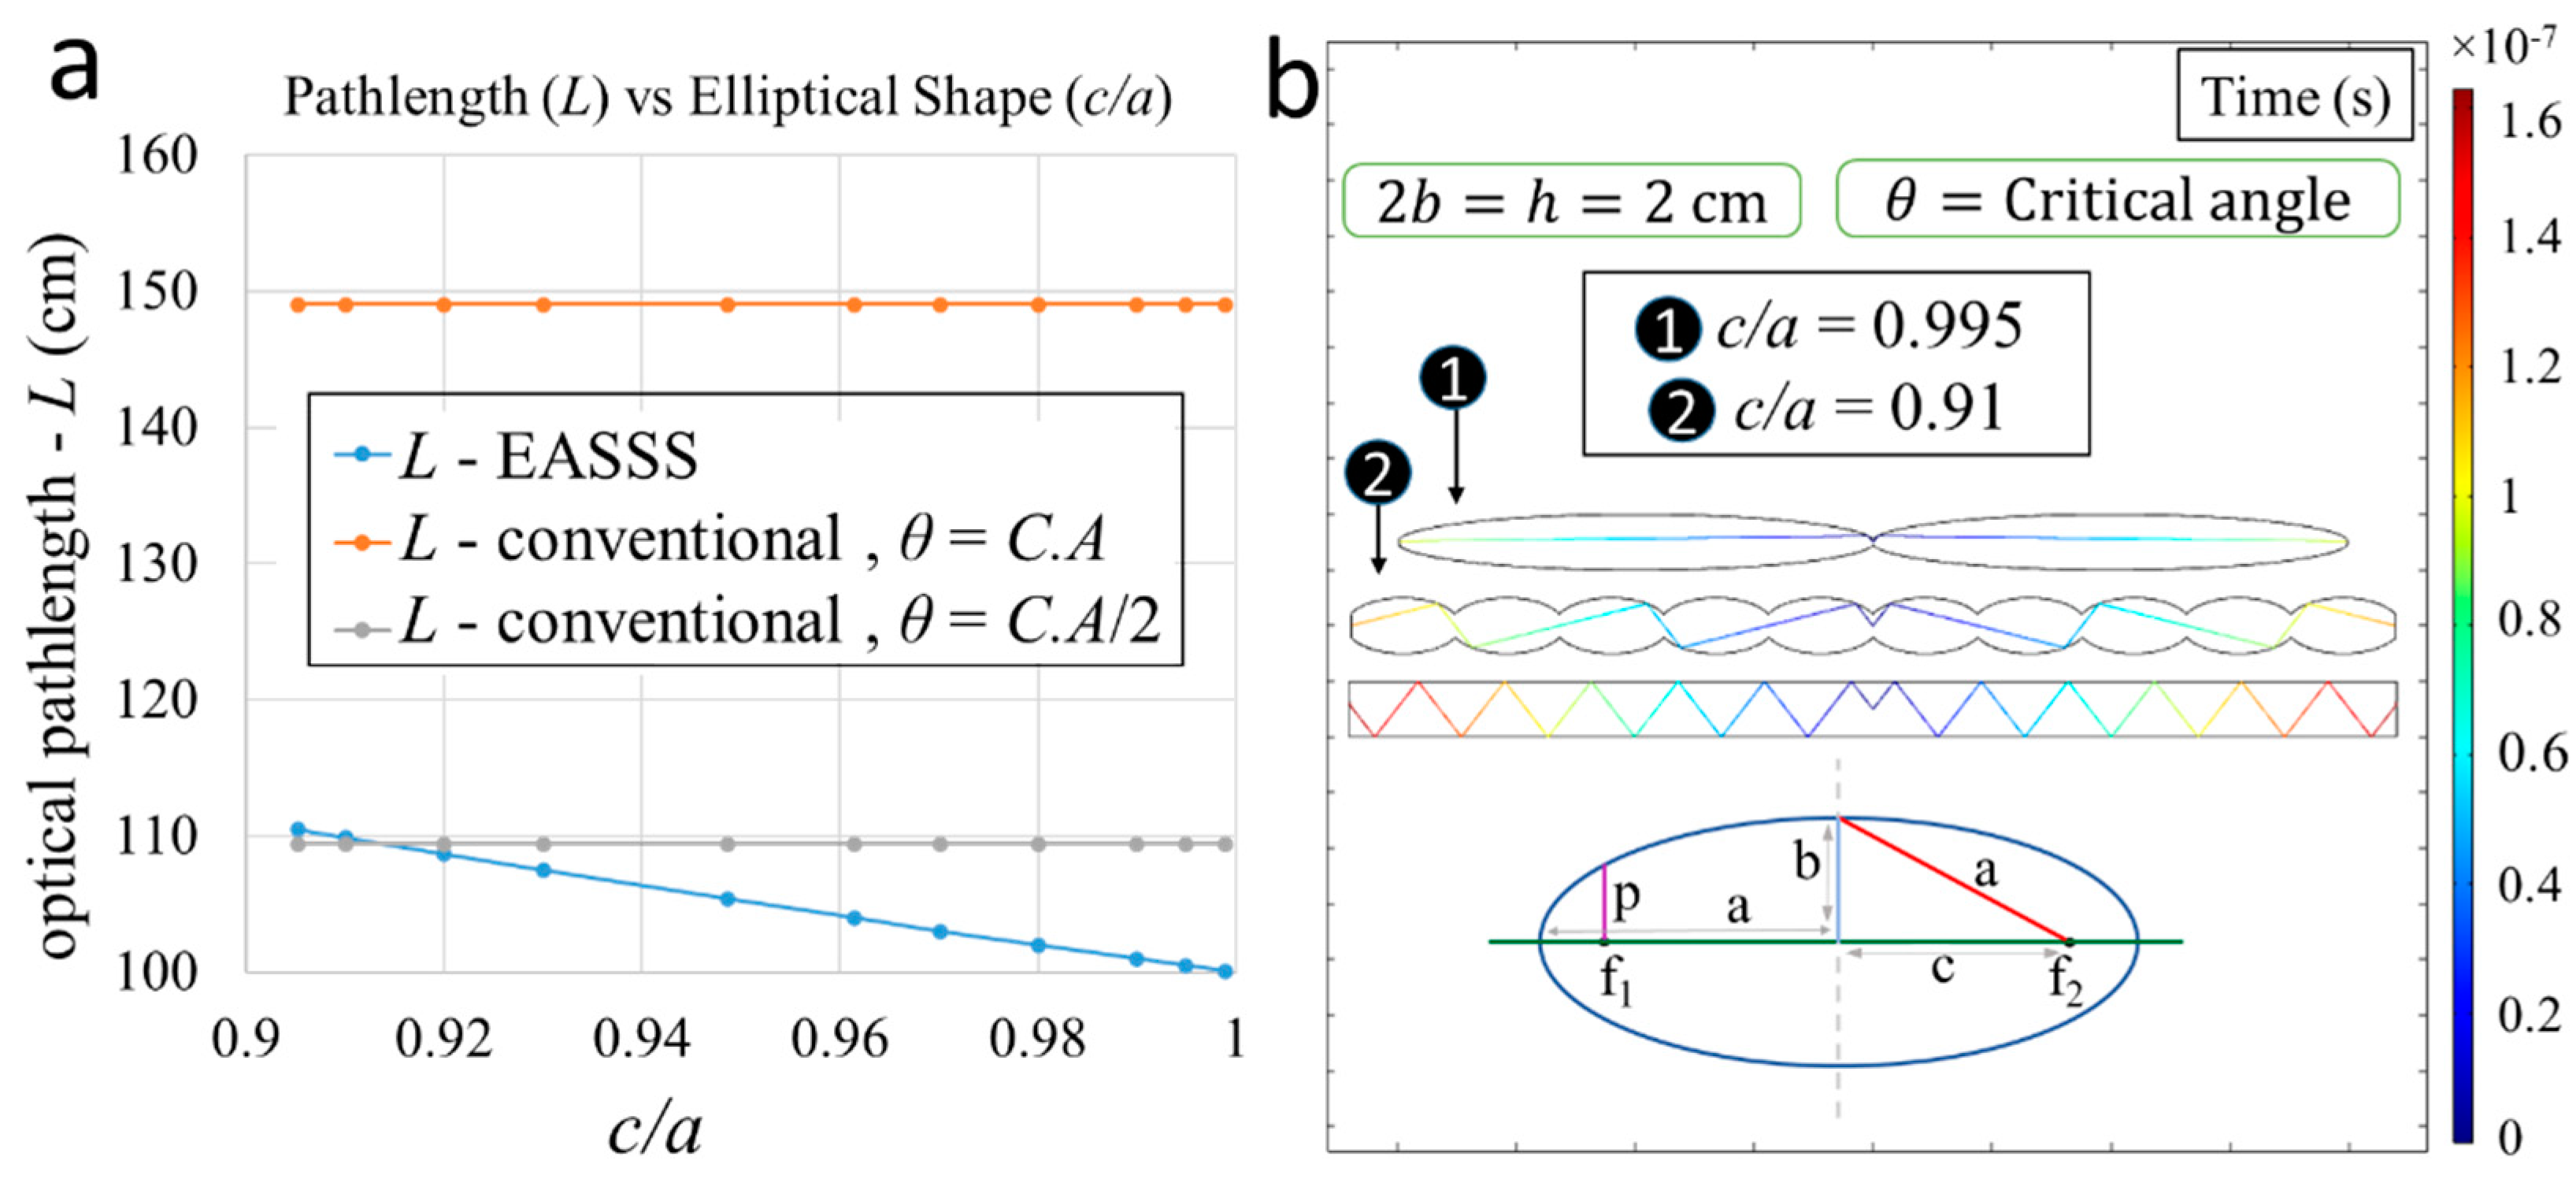
4.5. Performance Comparison: EASSS vs. Conventional LSC Panels

In this section we compare a conventional LSC and an EASSS panel with parameter values of c/a = 0.91, c = 1.25 cm and O = 0.1 cm. The area of both panels is assumed to be 10 cm × 10 cm, and the height (h = 2b) of both panels is assumed to be identical.
The fraction of radiation emitted from a point source located at the center of the panel that is incident onto PV cells located at the panel sidewalls is plotted as a function of time in Figure 11 for the conventional LSC and EASSS panels. Two sidewalls have PV cells and the other two sidewalls are coated by a specular reflector (mirror). The use of sidewall mirrors is discussed in more details in Ref. [50]. At a steady state, the emission losses for the EASSS and conventional LSC panels are 7.4 and 25.8%, respectively, resulting in a 24.8% improvement in emission efficiency. The mean traveling time for photons to propagate from the center of the EASSS and conventional LSC panels to the sidewalls is Tm1 = 0.66 ns and Tm2 = 1.45 ns, respectively. The difference between the mean propagation time for the two panels is related to the differences in transmission efficiency, ηTransmission (here, transmission efficiency refers to losses that occur for light propagating within the host of the LSC toward its sidewalls). For example, assuming the same intensity of incident light on the EASSS and conventional LSC panels, and that the host material has an index of refraction and mean absorption coefficient of n = 1.49 and αmean = 3 × 10⁻³ cm−1, respectively [48], the Optical Density (OD) can be determined for a light emitted from the center of the EASSS or a planar LSC using the following equation:
OD = log 10 ( I 0 I )
where I0 = the intensity of light at the center of the LSC and I = the intensity after the light has propagated to the sidewalls of the LSC. The ratio of the optical density for the EASSS and planar LSCs is ODEASSS/ODLSC = 0.45, which implies that the transmission losses through the EASSS panel are significantly less than that for the conventional LSC panel.
The total efficiency of the EASSS can be calculated using the concentration factor, C, which is the intensity of the radiation incident onto the rectangular PV cells embedded on two sidewalls, Φ2, divided by the intensity of the radiation incident onto the Petzvel lens concentrator, Φ1: C = Φ2/Φ1. In other words, the concentration factor can be re-written as C = G.ηgreen/non-PAR-opt, where G is the geometrical gain factor and ηgreen/non-PAR-opt is the optical efficiency of the EASSS for the green PAR and non-PAR spectrum, which is given as follows:
ηgreen/non-PAR-opt = ηFresnel·ηgreen/non-PAR-Abs·ηPLQY·ηStokes·ηEmission·ηRoughness·ηTransmission·ηself-abs
where ηFresnel depicts the Fresnel law-based efficiency with which incident light is coupled into the EASSS, instead of being reflected from the boundary surfaces. Taking into consideration the two negative Petzvel lenses, incident light will pass through five surfaces prior to entering the EASSS. If the EASSS and two negative Petzvel lenses are made from PMMA (n = 1.49), and for normal incidence, then ηFresnel ≅ 0.965 ≅ 82%. ηgreen/non-PAR-Abs is the efficiency with which the luminophores absorbs the green PAR and non-PAR. Here, we assume that a sufficient amount of luminescent material such as Lumogen Red 305 is embedded in the EASSS (~33 ppm) such that 100% of the green PAR in the spectral region from ~500 to ~600 nm is absorbed [51]. ηPLQY represents the photoluminescence quantum yield (PLQY) efficiency described as the ratio between the number of photons emitted and absorbed by the luminescent dye in the green PAR and non-PAR range. It is assumed that ηPLQY = 0.95 for LR 305 luminescent dye [52]. ηStokes shows the energy lost through molecular vibrations and heat generation during the absorption (~580 nm peak) and emission (~620 nm peak) event, which is assumed to be ηStokes = 95% for Lumogen Red 305 [52]. However, in this study, we set ηStokes = 1 because we are investigating the fraction of incident green PAR photons in the spectral region in the vicinity of 500–600 nm that are absorbed by Lumogen Red 305 and, eventually, directed toward the rectangular PV cells located at the two sidewalls of the EASSS. That is, all the photons incident onto the c-Si PV cell with energy greater than its bandgap, which is ~1.1 eV (λbg ~1.1 µm), independent of the Stokes shift, contribute to the output current. ηEmission is the efficiency with which the LSC panels “trap” the light, thus preventing the photons emitted from the luminophores from escaping the panel. As discussed previously with reference to Figure 11, the emission losses for an EASSS with parameters c/a = 0.91, c = 1.25 and O = 0.1, are 7.4%, and, in this case, ηEmission = 92.6%. In comparison, the ηEmission for a planar LSC with an index of refraction of 1.49 is ~74%, which is only valid for a perfectly smooth interface. Surface roughness creates parasitic surface losses and reduces the efficiency of total internal reflection and, therefore, an additional factor, ηRoughness, is introduced in Equation (3). These surface scattering losses increase with increasing surface roughness. In practice, surface scattering losses are highly dependent on the quality of fabrication and in an LSC panel can be described using the expression (1 − D)N, where D is the probability that a photon is scattered out of the LSC due to surface roughness each time it is incident onto the LSC surface and N is the number of collisions with the LSC surface [53]. In this study, for the specific case wherein c/a = 0.91, c = 1.25 cm and O = 0.1 cm of the EASSS, it is further assumed that D = 0.03, which results in ηRoughness = 93%. ηTransmission is the efficiency with which photons generated from the luminescent dye are transported through the LSC without being absorbed by the host material due to the concentrations of attenuating species in the material sample. The transmission efficiency is governed by the following Lambert–Beer law:
I o u t I i n = e α l
where α is the absorption coefficient of the material the panel is comprised of (PMMA in this study). The absorption coefficient is assumed to be α = 5 × 10⁻³ cm−1 for λ = 620 nm [48] and, therefore, the transmission efficiency is ηTransmission = 93.6%. ηself-abs is the efficiency with which the re-emitted light can be transported through the EASSS panel without being absorbed by other luminophores. Self-absorption is a consequence of the spectral overlap between the emission and absorption spectra of the luminescent dye [54,55]
It should be noted that, self-absorption losses decrease significantly as the Stokes shift increases. However, the total probability of the self-absorption for a photon emitted from a dye is a function of L, the total transport optical path length through the whole medium occupied with luminescent dyes. P0(L) is the overall probability that an emitted photon will reach the edge of the waveguide without undergoing self-absorption. P0(L) can be used to calculate the self-absorption losses [55,56] as follows:
η self-abs = P 0 ( L ) 1 ( 1 P 0 ( L ) ) η P L Q Y · η E m i s s i o n    
where ηPLQY is the photoluminescent quantum yield and ηEmission is the transmission (trapping) efficiency. ηPLQY = 0.95% and ηEmission = 93% in this study. Therefore, we neglect self-absorption for the proposed LSC in this work.
Considering all the loss mechanisms and efficiencies as described by Equation (5), the green PAR optical efficiency and concentration factor for the EASSS panel considered in this section are ηgreen/non-PAR-opt = 61.5% and C = 2.77, respectively.
It should be mentioned that the self-absorption losses can be the dominant loss mechanism in most cases when luminescent dyes have a lower quantum yield and/or a smaller Stokes shift. For every re-absorption event, the photon energy can be dissipated again through one of the above-mentioned loss channels. Consequently, for an irradiance input energy flux of Φin, the output flux Φout decreases after an average re-absorption number of N1 per photon to [54] the following:
Φout = Φin·ηFresnel·ηgreen/non-PAR-Abs·(ηPLQY·ηStokes·ηEmission·ηRoughness·ηTransmission)N
This equation shows that losses increase exponentially as the number of re-absorption events increases. As an example, Figure 12 shows ηgreen/non-PAR-opt for both a conventional LSC and the EASSS panel with c/a = 0.91, c = 1.25 cm and O = 0.1 cm, and their efficiency ratio (ηEASSS/ηLSC), as a function of self-absorption events, N. As can be seen, as the number of self-absorption events increases, optical efficiencies exponentially decrease and these decreases occur to a much greater extent for the conventional LSC panel as compared to the EASSS panel.
The mean travelling time, distance and surface scattering events for the photons emitted from the luminophores within the conventional LSC and EASSS panels are provided in Table 1, along with the various efficiency factors and the concentration factor for the two LSC panels.

4.6. Thermal Analysis

It is well-known that the quantum efficiency of luminescent dyes degrades as the operating temperature increases [57]. In this study, COMSOL Multiphysics software was utilized to evaluate any potential deleterious thermal effects on the performance of the luminescent dyes throughout the EASSS under the same illumination conditions, as mentioned in the previous sections. In this thermal analysis, the attenuation coefficient and heat transfer coefficient are assumed to be αmean = 3 × 10⁻³ cm−1 and h = 10 W/m2·K, respectively.
The EASSS considered in the previous section, with c/a = 0.91, c = 1.25 cm and O = 0.1 cm, is comprised of a Petzval lens array concentrating solar radiation from a planar area of 100 cm2 onto four receiver ports that have a width of O = 1 mm. The results (explained in the Supplementary Materials, Section B) reveal that the temperature increases by less than 2 degrees throughout the EASSS and the effects of increased temperature on the performance of the EASSS during operation are assumed to be negligible.

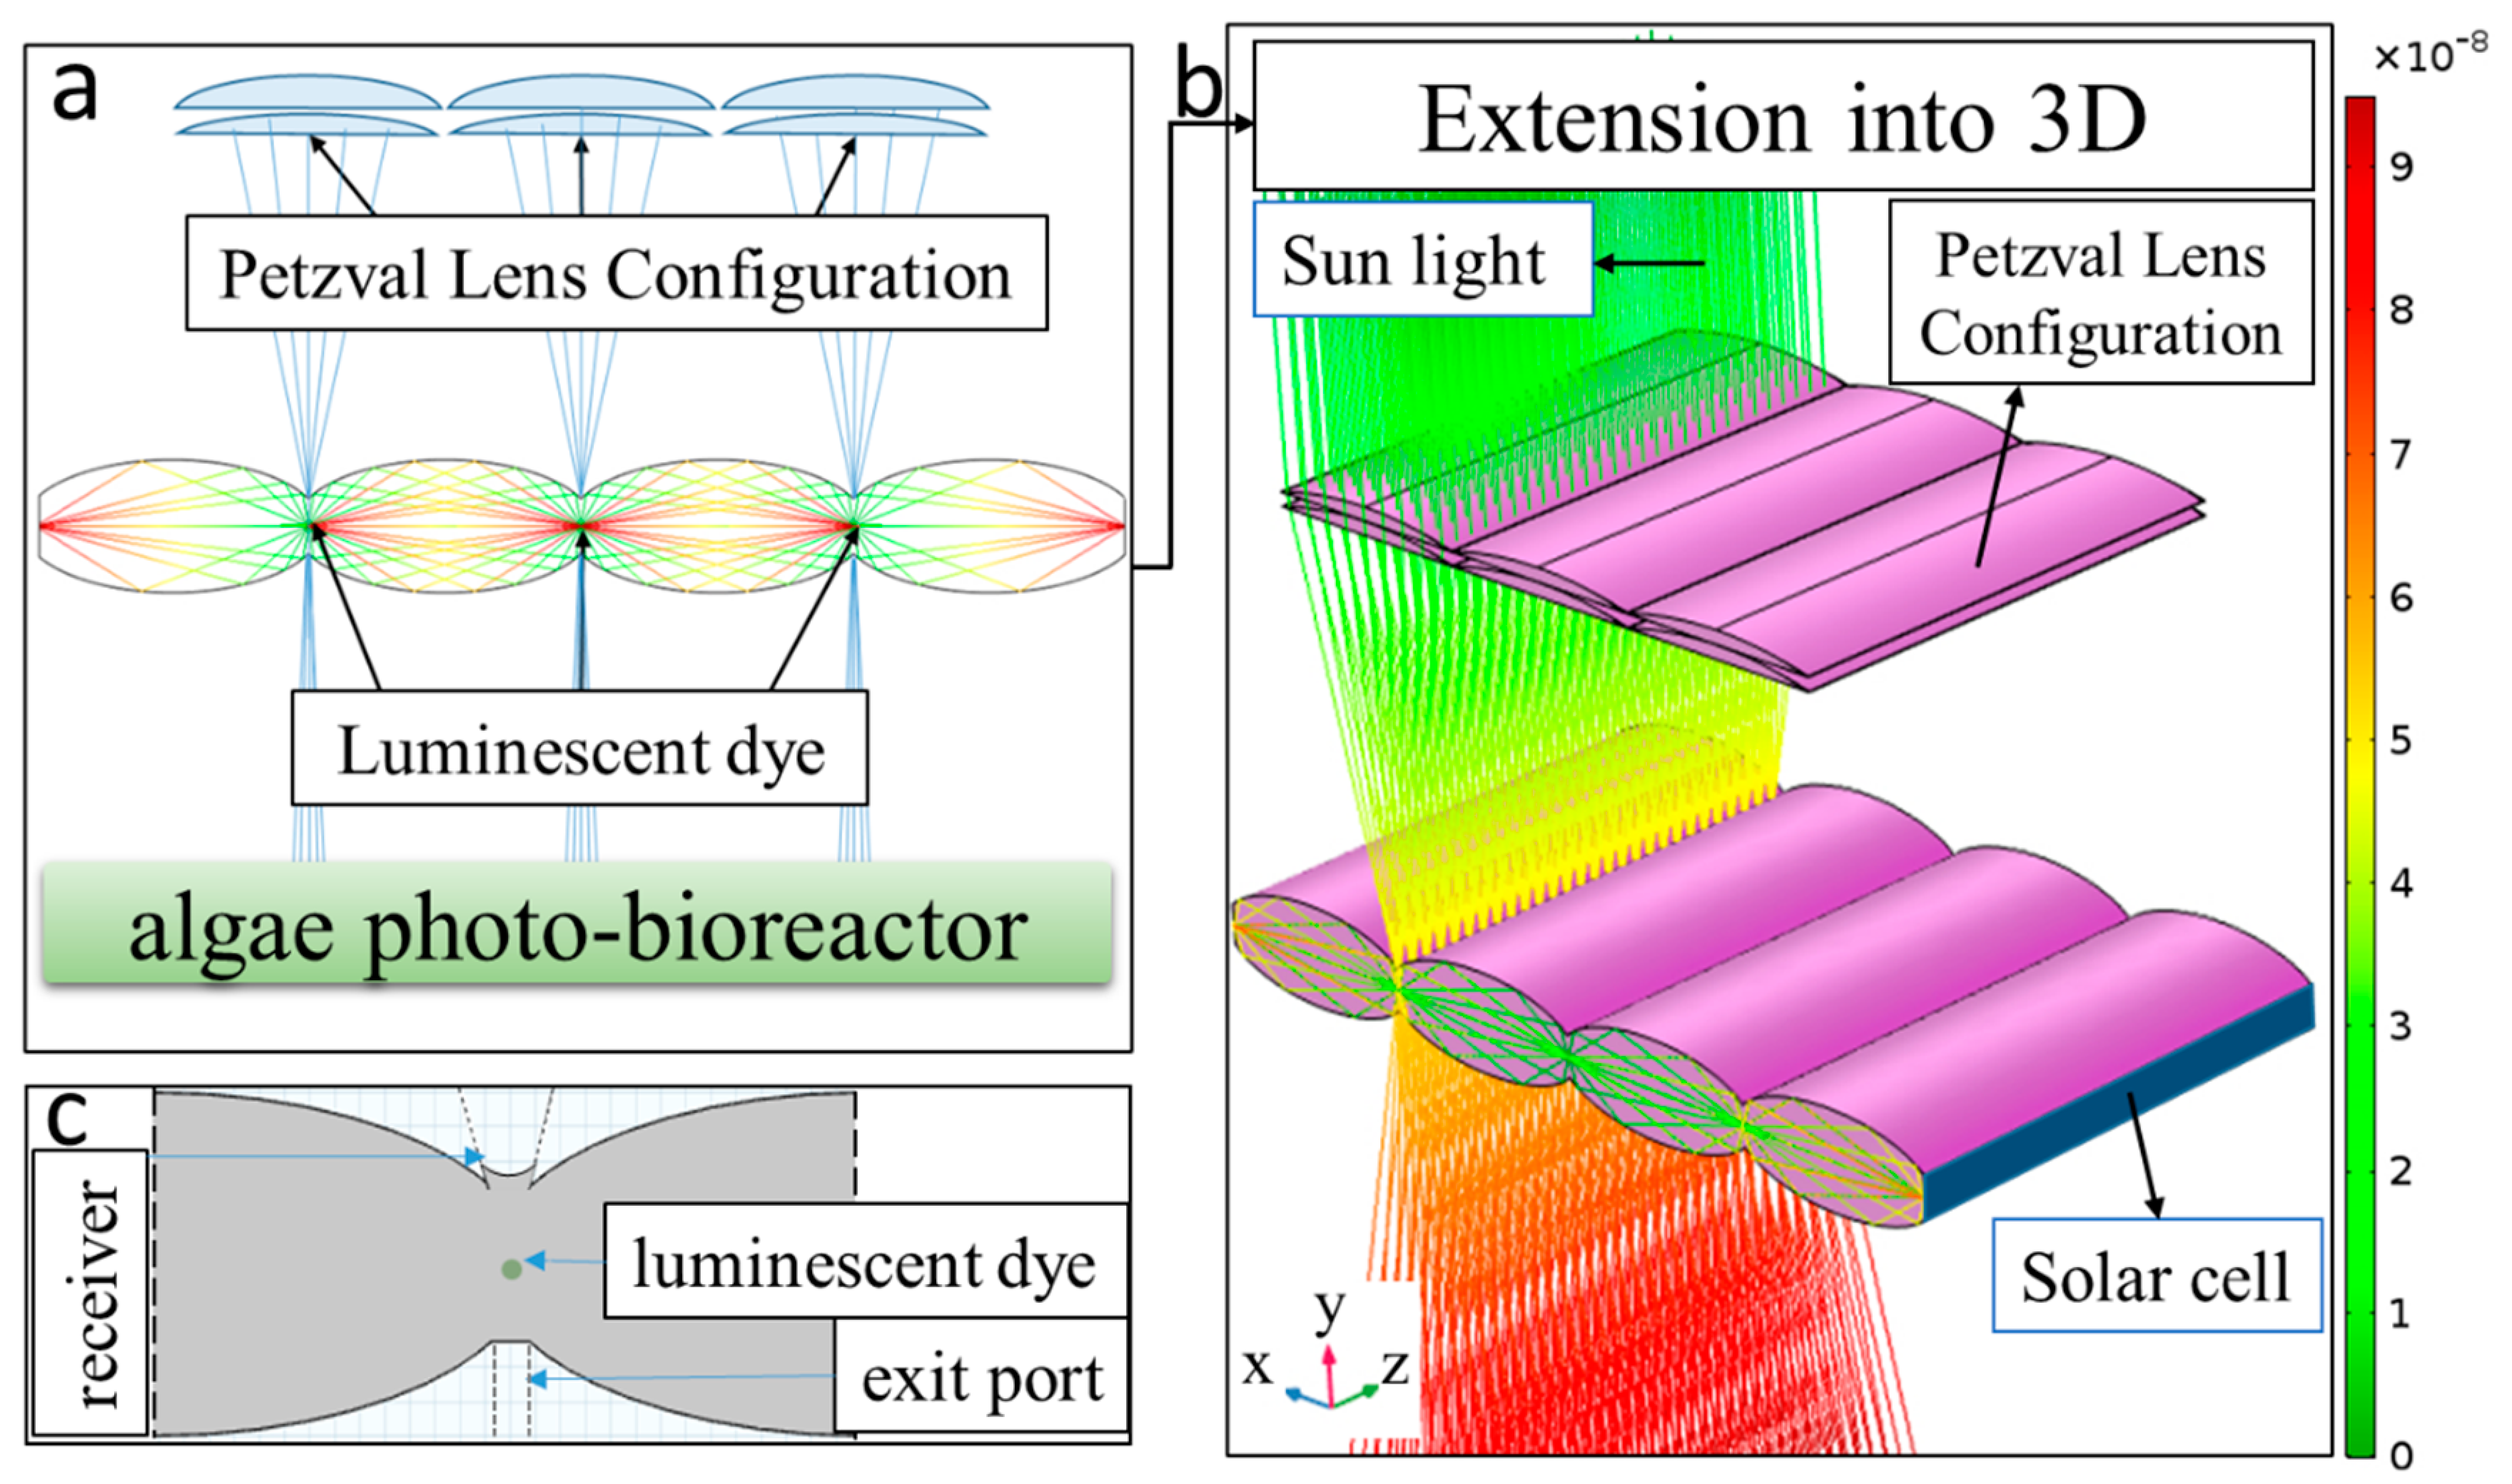
4.7. Tandem Elliptic Array LSC-PBR for Combined Power and Algae Production

The inset in Figure 13 illustrates the concept of an EASSS operating in tandem with a PBR. In this example, sunlight is incident onto the topside of a Petzval lens array that directs light to the focal lines of the EASSS. The dye located along these focal lines can absorb the green PAR and non-PAR in the spectral regions from 500~600 nm (ΔW1 = 152 W/m2) and 740~1100 nm (ΔW2 = 282 W/m2), respectively, as shown as the shaded regions in Figure 13. The light emitted from the dye undergoes TIR and is directed toward the crystalline silicon PV cells located at the sidewalls of the EASSS.
In this example, it is considered that the green PAR and non-PAR spectral regions from 500~600 nm (ΔW1 = 152 W/m2) and 740~1100 nm (ΔW2 = 282 W/m2), respectively, can be absorbed in an EASSS and converted to electricity in the c-Si based PV cells at the edges of the EASSS. The Petzval lens array and upper surface area of the PBR shown in Figure 13 are assumed to have an area of A = 10 × 10 cm2. It is also assumed that the optical efficiency of the EASSS is ηgreen/non-PAR-opt = 61.5% for both the ΔW1 and ΔW2 spectral regions, and the photon flux incident onto the c-Si PV cell at the top side of the EASSS for these spectral regions are ΦΔW1 = 4.163 × 1016 cm−2·s−1 and ΦΔW2 = 1.263 × 1017 cm−2·s−1, respectively, which is consistent with receiving solar radiation at an intensity of 1000 W/m2 (e.g., one sun).
It is assumed the PV cells have an External Quantum Efficiency (EQE) of EQE*ΔW*1 ≅ 100% and EQE*ΔW*2 ≅ 85%, for light that was absorbed by the dye in spectral regions ΔW1 and ΔW2, and reemitted in spectral regions ΔW*1 and ΔW*2, respectively [58,59,60]. Under these assumptions, the short circuit current (ISC), open circuit voltage (VOC) and the maximum output power (Pmax) generated by the PV cell are calculated using the following Equations (7)–(9), respectively [61]:
I sc = A · q · η green/non-PAR-opt · ( Δ W 1 Φ Δ W 1 ( λ ) · E Q E Δ W * 1 * ( λ ) · d λ + Δ W 2 Φ Δ W 2 ( λ ) · E Q E * Δ W * 2 ( λ ) · d λ )
V oc = n k T q   ln   ( I s c I 0 + 1 )
Pmax = Isc·Voc·FF
where n = 1 is the ideality factor, k is Boltzmann’s constant, T = 300 K is the cell temperature, I0 = 10−10 A is the dark saturation current, q is the charge of an electron and FF is the fill factor that can be expressed as a function of open-circuit voltage (Voc) as follows [61]:
FF = v o c l n   ( v o c + 0.72 ) v o c + 1
where
v o c = V o c q k B T
is a normalized voltage. Equation (10) is assumed as an appropriate approximation of the FF when v o c > 10. Based on Equation (9), out of a total of 4.34 W of green PAR and non-PAR incident in the ΔW1 and ΔW2 solar spectral regions, 0.735 W can be converted to electric power for the surface area of 10 cm × 10 cm, representing a total green/non-PAR to an electric power conversion efficiency of 16.94% (where Isc = 1.466 A, Voc = 0.605 V and FF = 0.8285).
Notably, this analysis was performed for the AM1.5 spectrum, whereas in space applications, sunlight has an AM0 spectrum. For the solar irradiance of AM0, which is assumed to have an intensity of 1356 W/m2, by considering the same green/non-PAR optical efficiency of ηgreen/non-PAR-opt = 61.5%, the conversion efficiency becomes 17.6% (Isc = 2.066 A, Voc = 0.61 V, FF = 0.8295). It means the EASSS can generate 1.45 W out of the total 5.94 W available in ΔW1 and ΔW2 for the surface area of 10 cm × 10 cm. On the other hand, the amount of electric power generated (and amount of PAR available for algae cultivation) strongly depends on the distance from the sun. For example, the maximum solar irradiance on Mars is ~590 W/m2, compared to a maximum of ~1050 W/m2 on Earth’s surface, and thus, it is expected that the total power (and light available for algae cultivation) that could be generated in the vicinity of Mars would be about half of that generated on Earth.
It should also be noted that the lenses within the Petzval lens array must track the sun, which will require a tracking system. Furthermore, the fabrication methods and stability of the materials used in the EASSS would have to be tested for duration, temperature, vacuum conditions and radiation exposure. In this context, the Petzval lens array could provide shielding for the EASSS. Additionally, with regard to comparing the weights of the EASSS and standard LSC, for a case sample of c = 5 cm and b = 2 cm, the EASSS is 13.2% lighter. The density of the host material (PMMA) is ρ = 1190 Kg/m3. Detailed analysis about this weight comparison is provided in the Supplementary Materials, Section C.

5. Conclusions

In this work, a new LSC in the form of an elliptic array solar spectrum splitter (EASSS) is presented. Numerical simulations were carried out to compare the performance of the elliptic array LSC to that of a conventional planar LSC. A distinct advantage of the elliptic array LSC is that it can be designed to achieve TIR over a broad range of emission angles, which drastically reduces emission losses. Furthermore, in comparison to a planar LSC, the number of surface scattering events for photons propagating within the EASSS LSC is significantly less than that of a planar LSC, thereby reducing scattering losses. Additionally, the path length traversed by the light travelling from the center to the edge of an EASSS is substantially less than the path length for light moving from the center of a planar LSC to its edge. The shorter path length for light in the EASSS reduces absorption losses, wherein a portion of light emitted from the dye is absorbed in the LSC host material as it travels toward the PV cells located at the edges. Moreover, considering the combined effects of emission, transmission and surface scattering losses, numerical results show the optical efficiency of the elliptic array LSC is 63%, whereas, in comparison, the optical efficiency for conventional planar LSC of the same size is 47.2%. It should be noted that an array of Petzval lenses that track the sun to focus light onto focal lines within the EASSS is required, which increases system cost and complexity. Nevertheless, the EASSS can provide the dual function of partitioning solar irradiance into blue and red PAR and green PAR and non-PAR components to simultaneously provide for algae growth and power generation. The ability to optimally use the broadband solar irradiance for these purposes has potential applications for extended duration space missions wherein power generation and regenerative environmental control and life support systems that include algae growth are of high value. In this context, the results from numerical simulations show that elliptic array luminescent solar concentrators can convert green PAR and non-PAR to electric power with a conversion efficiency of ~17% when the solar irradiance is AM1.5 and 17.6% for AM0 (solar irradiance just outside the atmosphere) while transmitting the remainder of the PAR and non-PAR to an underlying photobioreactor to support algae cultivation.

Supplementary Materials

The following are available online at https://www.mdpi.com/article/10.3390/en14175229/s1, Figure S1: (a) Cross-section of an ellipsoid as a closed loop curve and; (b) the geometrical parameters for an ellipse. A light ray is emitted from f1 at t = 0 ns. The trajectory of this emitted ray changes color in accordance with the colored vertical bar on the right, and after 25 ns the light ray has reached f2, Figure S2: Temperature distribution within an EASSS unit cell for an incoming solar irradiance of 1000 W/m2 (h = 2 cm and c = 5 cm), Figure S3: Temperature profile for the case study (h = 2 cm and c = 5 cm) of the EASSS along the (a) Top surface of the EASSS shown in the inset with blue line, and (b) Horizontal middle line shown in the inset with red line. Table S1: Mechanical and optical properties of the EASSS for thermal analysis.

Author Contributions

Conceptualization, N.T. and P.G.O.; methodology, N.T. and P.G.O.; software, N.T.; validation, N.T.; formal analysis, N.T.; investigation, N.T.; resources, P.G.O.; data curation, N.T.; writing—original draft preparation, N.T.; writing—review and editing, N.T. and P.G.O.; visualization, N.T.; supervision, P.G.O.; project administration, P.G.O.; funding acquisition, P.G.O. All authors have read and agreed to the published version of the manuscript.

Funding

This research was funded by the Natural Sciences and Engineering Research Council of Canada (NSERC, RGPIN-2017-05987).

Institutional Review Board Statement

Not applicable.

Informed Consent Statement

Not applicable.

Data Availability Statement

Not applicable.

Conflicts of Interest

The authors declare no conflict of interest.

References

  1. International Space Exploration Coordination Group. The Global Exploration Roadmap; ISECG: Pasadena, CA, USA, 2018. [Google Scholar]
  2. NASA. NASA’s Journey to Mars: Pioneering Next Steps in Space Exploration; Government Printing Office: Washington, DC, USA, 2015. [Google Scholar]
  3. ESA. Exploring Together, ESA Space Exploration Strategy; ESA: Noordwijk, The Netherlands, 2015. [Google Scholar]
  4. Helisch, H.; Keppler, J.; Detrell, G.; Belz, S.; Ewald, R.; Fasoulas, S.; Heyer, A.G. High density long-term cultivation of chlorella vulgaris SAG 211-12 in a novel microgravity-capable membrane raceway photobioreactor for future bioregenerative life support in SPACE. Life Sci. Space Res. 2020, 24, 91–107. [Google Scholar] [CrossRef]
  5. Revellame, E.D.; Aguda, R.; Chistoserdov, A.; Fortela, D.L.; Hernandez, R.A.; Zappi, M.E. Microalgae cultivation for space exploration: Assessing the potential for a new generation of waste to human life-support system for long duration space travel and planetary human habitation. Algal Res. 2021, 55, 102258. [Google Scholar] [CrossRef]
  6. Hendrickx, L.; De Wever, H.; Hermans, V.; Mastroleo, F.; Morin, N.; Wilmotte, A.; Janssen, P.; Mergeay, M. Microbial ecology of the closed artificial ecosystem MELiSSA (Micro-Ecological Life Support System Alternative): Reinventing and compartmentizing the Earth’s food and oxygen regeneration system for long-haul space exploration missions. Res. Microbil. 2006, 157, 77–86. [Google Scholar] [CrossRef]
  7. Helisch, H.; Belz, S.; Keppler, J.; Detrell, G.; Henn, N.; Fasoulas, S.; Ewald, R.; Angerer, O. Non-axenic microalgae cultivation in space—Challenges for the membrane μgPBR of the ISS experiment PBR@LSR. In Proceedings of the 48th International Conference on Environmental Systems, Alburquerque, NM, USA, 8–12 July 2018. [Google Scholar]
  8. Sanders, M.H.; Sedwick, R.J. Thermal design and performance of a LSC for space power generation. J. Spacecr. Rocket. 2019, 56, 1831–1837. [Google Scholar] [CrossRef]
  9. Needell, D.R.; Bauser, H.; Phelan, M.; Bukowsky, C.R.; Ilic, O.; Kelzenberg, M.D.; Atwater, H.A. Ultralight Luminescent Solar Concentrators for Space Solar Power Systems. In Proceedings of the 2019 IEEE 46th Photovoltaic Specialists Conference (PVSC), Chicago, IL, USA, 16–21 June 2019; pp. 2798–2801. [Google Scholar]
  10. Mohsenpour, S.F.; Richards, B.S.; Willoughby, N. Spectral conversion of light for enhanced microalgae growth rates and photosynthetic pigment production. Bioresour. Technol. 2012, 125, 75–81. [Google Scholar] [CrossRef]
  11. Detweiler, A.M.; Mioni, C.E.; Hellier, K.L.; Allen, J.J.; Carter, S.A.; Bebout, B.M.; Fleming, E.E.; Corrado, C.; Prufert-Bebout, L.E. Evaluation of wavelength selective photovoltaic panels on microalgae growth and photosynthetic efficiency. Algal Res. 2015, 9, 170–177. [Google Scholar] [CrossRef]
  12. Lamnatou, C.; Chemisana, D. Solar radiation manipulations and their role in greenhouse claddings: Fluorescent solar concentrators, photoselective and other materials. Renew. Sustain. Energy Rev. 2013, 27, 175–190. [Google Scholar] [CrossRef]
  13. Corrado, C.; Leow, S.W.; Osborn, M.; Chan, E.; Balaban, B.; Carter, S.A. Optimization of gain and energy conversion efficiency using front-facing photovoltaic cell luminescent solar concentrator design. Sol. Energy Mater. Sol. Cells 2013, 111, 74–81. [Google Scholar] [CrossRef]
  14. Wondraczek, L.; Batentschuk, M.; Schmidt, M.A.; Borchardt, R.; Scheiner, S.; Seemann, B.; Schweizer, P.; Brabec, C.J. Solar spectral conversion for improving the photosynthetic activity in algae reactors. Nat. Commun. 2013, 4, 2047. [Google Scholar] [CrossRef]
  15. Ooms, M.D.; Dinh, C.T.; Sargent, E.H.; Sinton, D. Photon management for augmented photosynthesis. Nat. Commun. 2016, 7, 12699. [Google Scholar] [CrossRef]
  16. Yahui, S.; Huang, Y.; Liao, Q.; Fu, Q.; Zhu, X. Enhancement of microalgae production by embedding hollow light guides to a flat-plate photobioreactor. Bioresour. Technol. 2016, 207, 31–38. [Google Scholar]
  17. Ooms, M.D.; Jeyaram, Y.; Sinton, D. Wavelength-selective plasmonics for enhanced cultivation of microalgae. Appl. Phys. Lett. 2015, 106, 063902. [Google Scholar] [CrossRef]
  18. Daigle, Q.; O’Brien, P.G. Heat generated using Luminescent Solar Concentrators for Building Energy Applications. Energies 2020, 13, 5574. [Google Scholar] [CrossRef]
  19. Papakonstantinou, I.; Portnoi, M.; Debije, M.G. The Hidden Potential of Luminescent Solar Concentrators. Adv. Energy Mater. 2020, 11, 2002883. [Google Scholar] [CrossRef]
  20. Arp, T.B.; Barlas, Y.; Aji, V.; Gabor, N.M. Natural Regulation of Energy Flow in a Green Quantum Photocell. Nano Lett. 2016, 16, 7461–7466. [Google Scholar] [CrossRef] [PubMed] [Green Version]
  21. Whitmarsh, J. The photosynthetic process. In Concepts in Photobiology: Photosynthesis and Photomorphogenesis; Singhal, G.S., Renger, G., Sopory, S.K., Irrgang, K.-D., Govindjee, Eds.; Narosa Publishers and Kluwer Academic: New Delhi, India, 1999; pp. 11–51. [Google Scholar]
  22. Wang, X.; Zhiming, M.W. (Eds.) High Efficiency Solar Cells: Physics, Materials, and Devices; Springer Series in Materials Science; Springer Science & Business Media: Berlin/Heidelberg, Germany, 2014. [Google Scholar]
  23. Debije, M.G.; Verbunt, P.P. Thirty years of luminescent solar concentrator research: Solar energy for the built environment. Adv. Energy Mater. 2021, 2, 12–35. [Google Scholar] [CrossRef]
  24. Correia, S.F.; de Zea Bermudez, V.; Ribeiro, S.J.L.; André, P.S.; Ferreira, R.A.S.; Carlos, L.D. Luminescent solar concentrators: Challenges for lanthanide-based organic–inorganic hybrid materials. J. Mater. Chem. A 2014, 2, 5580–5596. [Google Scholar] [CrossRef]
  25. Meinardi, F.; Colombo, A.; Velizhanin, K.A.; Simonutti, R.; Lorenzon, M.; Beverina, L.; Viswanatha, R.; Klimov, V.I.; Brovelli, S. Large-area luminescent solar concentrators based on ‘Stokes-shift-engineered’ nanocrystals in a mass-polymerized PMMA matrix. Nat. Photonics 2014, 8, 392–399. [Google Scholar] [CrossRef]
  26. Buffa, M.; Debije, M.G. Dye-doped polysiloxane rubbers for luminescent solar concentrator systems. In High-Efficiency Solar Cells; Springer: Cham, Switzerland, 2014; pp. 247–266. [Google Scholar]
  27. Zhao, Y.; Meek, G.A.; Levine, B.G.; Lunt, R.R. Near-Infrared Harvesting Transparent Luminescent Solar Concentrators. Adv. Opt. Mater. 2014, 2, 606–611. [Google Scholar] [CrossRef]
  28. Debije, M.G.; Teunissen, J.P.; Kastelijn, M.J.; Verbunt, P.P.C.; Bastiaansen, C.W.M. The effect of a scattering layer on the edge output of a luminescent solar concentrator. Sol. Energy Mater. Sol. Cells 2009, 93, 1345–1350. [Google Scholar] [CrossRef]
  29. Cambié, D.; Zhao, F.; Hessel, V.; Debije, M.G.; Noël, T. Every photon counts: Understanding and optimizing photon paths in luminescent solar concentrator-based photomicroreactors (LSC-PMs). React. Chem. Eng. 2017, 2, 561–566. [Google Scholar] [CrossRef] [Green Version]
  30. Chou, C.H.; Chuang, J.K.; Chen, F.C. High-performance flexible waveguiding photovoltaics. Sci. Rep. 2013, 3, 2244. [Google Scholar] [CrossRef] [PubMed]
  31. Toledo, C.; Scognamiglio, A. Agrivoltaic Systems Design and Assessment: A Critical Review, and a Descriptive Model towards a Sustainable Landscape Vision (Three-Dimensional Agrivoltaic Patterns). Sustainability 2021, 12, 6871. [Google Scholar] [CrossRef]
  32. Corrado, C.; Leow, S.W.; Osborn, M.; Carbone, I.; Hellier, K.; Short, M.; Alers, G.; Carter, S.A. Power generation study of luminescent solar concentrator greenhouse. J. Renew. Sustain. Energy 2016, 8, 043502. [Google Scholar] [CrossRef] [Green Version]
  33. Loik, M.E.; Carter, S.A.; Alers, G.; Wade, C.E.; Shugar, D.; Corrado, C.; Jokerst, D.; Kitayama, C. Wavelength-selective solar photovoltaic systems: Powering greenhouses for plant growth at the food-energy-water nexus. Earth’s Future 2017, 10, 1044–1053. [Google Scholar] [CrossRef]
  34. Bernardoni, P.; Vincenzi, D.; Mangherini, G.; Boschetti, M.; Andreoli, A.; Gjestila, M.; Samà, C.; Gila, L.; Palmery, S.; Tonezzer, M.; et al. Improved Healthy Growth of Basil Seedlings under LSC Filtered Illumination. In Proceedings of the 37th European Photovoltaic Solar Energy Conference and Exhibition, Munich, Germany, 7–11 September 2020; pp. 1767–1771. [Google Scholar]
  35. Talebzadeh, N.; O’Brien, P.G. Selective Solar Concentrators for Biofuel Production and Photovoltaic Applications. In Proceedings of the International Conference of Energy Harvesting, Storage, and Transfer (EHST’17), Toronto, ON, Canada, 21–23 August 2017. [Google Scholar]
  36. Daigle, Q.; Talebzadeh, N.; O’Brien, P.G.; Rauf, I.A. Spectral Splitting Luminescent Solar Concentrator Panels for Agrivoltaic Applications. In Proceedings of the 3rd International Conference of Energy Harvesting, Storage, and Transfer (EHST’19), Ottawa, ON, Canada, 18–19 June 2019; Volume 3, pp. 132–133. [Google Scholar]
  37. Debije, M.G.; Verbunt, P.P.C.; Rowan, B.C.; Richards, B.S.; Hoeks, T.L. Measured surface loss from luminescent solar concentrator waveguides. Appl. Opt. 2008, 47, 6763–6768. [Google Scholar] [CrossRef]
  38. Verbunt, P.P.C.; Tsoi, S.; Debije, M.G.; Boer, D.J.; Bastiaansen, C.W.M.; Lin, C.W.; de Boer, D.K.G. Increased efficiency of luminescent solar concentrators after application of organic wavelength selective mirrors. Opt. Express 2012, 20, A655–A668. [Google Scholar] [CrossRef] [PubMed] [Green Version]
  39. Mulder, C.L.; Reusswig, P.D.; Beyler, A.P.; Kim, H.; Rotschild, C.; Baldo, M.A. Dye alignment in luminescent solar concentrators: II. Horizontal alignment for energy harvesting in linear polarizers. Opt. Express 2010, 18, A91–A99. [Google Scholar] [CrossRef]
  40. Erickson, D.; Sinton, D.; Psaltis, D. Optofluidics for energy applications. Nat. Photonics 2011, 5, 583–590. [Google Scholar] [CrossRef]
  41. Hincapie, E.; Stuart, B.J. Design, construction, and validation of an internally lit air-lift photobioreactor for growing algae. Front. Energy Res. 2015, 2, 65. [Google Scholar] [CrossRef] [Green Version]
  42. Xue, S.; Zhang, Q.; Wu, X.; Yan, C.; Cong, W. A novel photobioreactor structure using optical fibers as inner light source to fulfill flashing light effects of microalgae. Bioresour. Technol. 2013, 138, 141–147. [Google Scholar] [CrossRef]
  43. Sinton, D. Energy: The microfluidic frontier. Lab Chip 2014, 17, 3127–3134. [Google Scholar] [CrossRef]
  44. Pierobon, S.C.; Riordon, J.; Nguyen, B.; Sinton, D. Breathable waveguides for combined light and CO2 delivery to microalgae. Bioresour. Technol. 2016, 209, 391–396. [Google Scholar] [CrossRef] [PubMed]
  45. Lanzarini-Lopes, M.; Delgado, A.G.; Guo, Y.; Dahlen, P.; Westerhoff, P. Optical fiber-mediated photosynthesis for enhanced subsurface oxygen delivery. Chemosphere 2018, 195, 742–748. [Google Scholar] [CrossRef]
  46. Sun, Y.; Huang, Y.; Liao, Q.; Xia, A.; Fu, Q.; Zhu, X.; Fu, J. Boosting Nannochloropsis oculata growth and lipid accumulation in a lab-scale open raceway pond characterized by improved light distributions employing built-in planar waveguide modules. Bioresour. Technol. 2018, 249, 880–889. [Google Scholar] [CrossRef]
  47. Huang, J.; Kang, S.; Wan, M.; Li, Y.; Qu, X.; Feng, F.; Wang, J.; Wang, W.; Shen, G.; Li, W. Numerical and experimental study on the performance of flat-plate photobioreactors with different inner structures for microalgae cultivation. J. Appl. Phycol. 2015, 27, 49–58. [Google Scholar] [CrossRef]
  48. Meinardi, F.; Bruni, F.; Brovelli, S. Luminescent solar concentrators for building-integrated photovoltaics. Nat. Rev. Mater. 2017, 2, 17072. [Google Scholar] [CrossRef]
  49. Talebzadeh, N.; Rostami, M.; O’Brien, P.G. Elliptic paraboloid-based solar spectrum splitters for self-powered photobioreactors. Renew. Energy 2021, 163, 1773–1785. [Google Scholar] [CrossRef]
  50. Bernardoni, P.; Mangherini, G.; Gjestila, M.; Andreoli, A.; Vincenzi, D. Performance Optimization of Luminescent Solar Concentrators under Several Shading Conditions. Energies 2021, 14, 816. [Google Scholar] [CrossRef]
  51. Krumer, Z.; van Sark, W.G.; Schropp, R.E.; de Mello Donegá, C. Compensation of self-absorption losses in luminescent solar concentrators by increasing luminophore concentration. Sol. Energy Mater. Sol. Cells 2017, 167, 133–139. [Google Scholar] [CrossRef]
  52. Krumer, Z. Self Absorption in Luminescent Solar Concentrators. Ph.D. Thesis, Utrecht University, Utrecht, The Netherlands, 2014. [Google Scholar]
  53. Soleimani, N.; Knabe, S.; Bauer, G.H.; Markvart, T.; Muskens, O.L. Role of light scattering in the performance of fluorescent solar collectors. J. Photonics Energy 2012, 2, 021801. [Google Scholar] [CrossRef]
  54. Krumer, Z.; Pera, S.J.; van Dijk-Moes, R.J.A.; Zhao, Y.; de Brouwer, A.F.; Groeneveld, E.; van Sark, W.G.J.H.M.; Schropp, R.E.I.; de Mello Donegá, C. Tackling self-absorption in luminescent solar concentrators with type-II colloidal quantum dots. Sol. Energy Mater. Sol. Cells 2013, 111, 57–65. [Google Scholar] [CrossRef] [Green Version]
  55. Wilson, L.R.; Richards, B.S. Measurement method for photoluminescent quantum yields of fluorescent organic dyes in polymethyl methacrylate for luminescent solar concentrators. Appl. Opt. 2009, 2, 212–220. [Google Scholar] [CrossRef]
  56. Sansregret, J.; Drake, J.M.; Thomas, W.R.; Lesiecki, M.L. Light transport in planar luminescent solar concentrators: The role of DCM self-absorption. Appl. Opt. 1983, 22, 573–577. [Google Scholar] [CrossRef] [PubMed]
  57. Rico, F.J.M.; Jaque, F.; Cussó, F. Thermal damage in luminescent solar concentrators (LSC) for photovoltaic systems. J. Power Sources 1981, 6, 383–388. [Google Scholar] [CrossRef]
  58. Osterwald, C.R.; Campanelli, T.M.; Moriarty, T.; Emery, K.A.; Williams, R. Temperature-dependent spectral mismatch corrections. IEEE J. Photovolt. 2015, 5, 1692–1697. [Google Scholar] [CrossRef]
  59. Barugkin, C.; Allen, T.; Chong, T.K.; White, T.P.; Weber, K.J.; Catchpole, K.R. Light trapping efficiency comparison of Si solar cell textures using spectral photoluminescence. Opt. Express 2015, 23, A391–A400. [Google Scholar] [CrossRef] [Green Version]
  60. Chander, S.; Purohit, A.; Nehra, A.; Nehra, S.P.; Dhaka, M.S. A study on spectral response and external quantum efficiency of mono-crystalline silicon solar cell. Int. J. Renew. Energy Resour. 2015, 5, 41–44. [Google Scholar]
  61. Kippelen, B.; Bredas, J.L. Organic photovoltaics. Energy Environ. Sci. 2009, 2, 251–261. [Google Scholar] [CrossRef]
Figure 1. (a) Mechanism of an LSC as a solar spectrum splitter and solar concentrator and, (b) Operation and loss mechanisms in an LSC: (1) Fresnel reflection loss, (2 and 3) Light guiding of photons emitted outside the escape cone via TIR to PV cells at the sidewalls of the planar waveguide, (4) Emission losses of photons emitted within the escape cone, (5) Internal absorption losses, (6) Surface scattering losses at the waveguide/air boundary.
Energies 14 05229 g001
Figure 2. (a) A unit cell that hosts concentrated luminescent dye at the shared focal point of two ellipses. The width of the unit cell is 2C. (b) The minimum value of c/a for which TIR will occur for radiation emitted from the focal point plotted as a function of the refractive index of the medium internal to the ellipse (assuming the medium external to the ellipse is air) and (c) propagation behavior of radiation emitted from a point source located at the shared focal point of overlapping ellipses for the cases in which the index of refraction of the internal medium is n = 1.49 and the ellipse parameters are c/a = 0.6, c/a = 0.75 and c/a = 0.95.
Energies 14 05229 g002
Figure 3. (a) The proposed configuration of Elliptic Array Solar Spectrum Splitter (EASSS) in 2D; (b) extension of the EASSS into 3D and; (c) The concept of receiver to couple the incoming concentrated light from Petzvel lens to the luminescent dye area and send out through the exit port.
Energies 14 05229 g003
Figure 4. Number of surface scattering events per meter, within an EASSS panel plotted as a function of h and c/a.
Energies 14 05229 g004
Figure 5. (a) A comparison of surface scattering loss events on a per-meter basis for light propagating along the planar direction (the x-direction) of an EASSS and a conventional flat-panel LSC for a constant value of c/a = 0.91; and (b) The trajectory of light emitted from the center of a conventional LSC panel and EASSS for two cases wherein the height of the panels is h = 2 and h = 10 cm.
Energies 14 05229 g005
Figure 6. (a) Optical path lengths of radiation emitted from the center of the EASSS and conventional LSC panels for a structure with a width of 2 m. For the conventional LSC, the path lengths for emission at the critical angle for which TIR occurs (θ = C.A.) and for emission at half the critical angle are considered; and (b) Geometrical illustration of the ray propagation in conventional LSC and EASSS with c/a = 0.91 and 0.995 for h = 2 cm.
Energies 14 05229 g006
Figure 7. The relationship between the EASSS thickness (h) and the optical path length and the number of surface scattering events for light emitted from the focal lines within the EASSS.
Energies 14 05229 g007
Figure 8. Radiation emitted from the center of the EASSS and conventional LSC panels incident onto the PV cells at the panel sidewalls plotted as a function of ray travelling time for h = 2 cm.
Energies 14 05229 g008
Figure 9. Emission losses as a function of c/a and the width of the optical receiver port (O) for (a) h = 2 cm, (b) h = 5 cm and (c) h = 10 cm.
Energies 14 05229 g009
Figure 10. The percentage of emission loss as a function of in-plane and out-of-plane displacement due to the volume distribution of luminescent dye along the focal line for c = 5 cm, O = 1 mm, and (a) h = 4 and (b) h = 2 cm.
Energies 14 05229 g010
Figure 11. Fraction of photons emitted within the EASSS and conventional LSC panels incident onto PV cells located at the panel sidewalls as a function of time.
Energies 14 05229 g011
Figure 12. Optical efficiencies for both a conventional LSC and the EASSS panel with c/a = 0.91, c = 1.25 cm and O = 0.1 cm, and their efficiency ratio (ηEASSS/ηLSC) as a function of self-absorption events (N).
Energies 14 05229 g012
Figure 13. Green PAR and non-PAR from sunlight (ΔW1 = 500~600 nm and ΔW2 = 740~1100 nm) can be absorbed in an EASSS in a tandem configuration with a PBR (inset). Blue and red PAR is transmitted through the EASSS and used to support algae cultivation in the PBR.
Energies 14 05229 g013
Table 1. Performance parameters for the EASSS and conventional planar LSC panels.
Solar ConcentratorMean Photon Traveling Time (ns)Average Traveling Distance (cm)Scattering Quantity (Times/Photon)ηEmission (%)ηTransmission (%)ηRoughness (%)ηgreen/non-PAR-opt (%)Concentration Factor
EASSS0.6613.292.3892.693.693632.77
LSC1.4529.116.927486.458147.22.07
Publisher’s Note: MDPI stays neutral with regard to jurisdictional claims in published maps and institutional affiliations.

