Article

Energy Efficiency and Carbon Emission Impact on Competitiveness in the European Energy Intensive Industries

1
Lithuanian Energy Institute, Breslaujos St. 3, LT-44403 Kaunas, Lithuania
2
School of Economics and Business, Kaunas University of Technology, K. Donelaičio 73, LT-44029 Kaunas, Lithuania
*
Author to whom correspondence should be addressed.
Energies 2021, 14(15), 4700; https://doi.org/10.3390/en14154700
Submission received: 17 June 2021 / Revised: 19 July 2021 / Accepted: 29 July 2021 / Published: 3 August 2021
(This article belongs to the Section C: Energy Economics and Policy)

Abstract

:
Climate change and efforts to mitigate it have given rise to an interest in the relationship between industry competitiveness, energy efficiency, and carbon emissions. A better understanding of this relationship can be essential for economic and environmental decision-makers. This paper presents empirical research evaluating industry competitiveness through the factors of energy efficiency and carbon emission in Europe’s most energy-intensive industries. The designed industry competitiveness measure index consists of seven components, grouped into three equally weighted sub-indexes: export performance, energy, and environmental. The export performance of the industry is described by the industry export growth rate, the share of the industry’s export, and the effects on the industry’s competitiveness of changes in a country’s export. The energy intensity of the industry and energy prices are integrated into the energy sub-index. The environmental sub-index consists of the industry’s emissions intensity, and the ratio of freely allocated allowances and verified emissions indicators. The findings indicate that countries with the highest index value also have a positive energy intensity and carbon emission indicator value. The average index value of each industry gradually reduces to zero, and the standard deviation of the index value shows a diminishing trend throughout all sectors, which implies that competitiveness in all sectors is increasing and that all countries are nearing the industry average. The ANOVA results show that: (1) the competitiveness index value was statistically significantly different in the investigated countries; (2) the competitiveness index value was statistically non-significantly different in the investigated industries; (3) there was a significant effect of the interaction between country and industry on the competitiveness index value. These results suggest that the country itself and industry/country interaction significantly affect the competitiveness index. However, it should be mentioned that industry per se does not substantially affect the competitiveness index score.

1. Introduction

Setting ambitious environmental targets has been a hallmark of European Union (EU) policy for decades. The EU Framework Strategy for a Resilient Energy Union with a Forward-Looking Climate Change Policy [1] has three goals: (1) make the EU significantly less CO2-intensive by 2030; (2) make economic development sustainable and climate-neutral; (3) keep energy prices affordable for end-consumers. In 2019, the new European Commission announced its long-term strategy—“A European Green Deal” [2]. The Commission’s vision is to decouple the EU’s growth from energy use and transform the economy towards zero net greenhouse gas emissions by 2050, which means that no more CO2 escapes into the air from industry, transport, agriculture, or housing than nature can bind out of the air again [3].
To make this vision a reality and keep the EU’s industry competitive, the EU plans to invest in environmentally friendly technologies, support innovative sectors, reduce the energy sector’s dependence on fossil fuels, and improve energy efficiency, among other measures.
With the increase in efforts to mitigate climate change, the relevance of the link between industrial energy efficiency and competitiveness has also grown [4]. The industry competitiveness question is on the top of the political agenda in many countries, and has been analyzed by many researchers (e.g., [5,6,7]). Furthermore, a recent court decision [8] stated that the state’s duty also includes the obligation to protect life, health, and property from climate change. A better understanding of the competitiveness, energy efficiency, and carbon emission relationship would be essential for political, economic, and environmental decision-makers [9]. Neuhoff et al. [10] stated that EU competitiveness is based on innovative and research-intensive products, and not on high energy consumption and low costs. Many industrial companies in Europe have low energy costs, except in a few highly energy-intensive sectors. To not suppress the competitiveness of EU industries, some exceptions in the regulation (e.g., large electricity consumers pay lower grid fees, and they also receive some tax and apportionment exceptions) have been made [10].
After summarizing the most recent scientific research and assessments of competitiveness, we conclude that the energy aspects are not being widely used. This paper aims to outline the impacts of energy efficiency and carbon emission on the industry competitiveness index and test this index on European energy-intensive industries. The results of the empirical tests fill a research gap linked to energy efficiency and carbon emissions’ impact on competitiveness in different European energy-intensive industries, offering other perspectives on the nature of this impact.
The structure of this paper is as follows: Section 1 presents a short introduction; Section 2 provides a literature review of competitiveness, climate change, and energy efficiency; Section 3 describes the research data and methodology; Section 4 presents the index calculation and ANOVA results; Section 5 summarizes the conclusions and indicates the future research aspects.

2. Literature Review

Despite the fact that, every year, researchers pay increasing attention to different aspects of competitiveness, some facets are still not widely discussed. The scientific literature examines the concept of competitiveness [11,12], identifies the factors determining competitiveness [13,14], and analyzes the impact of these factors on overall competitiveness [15,16].
There is no consensus on the definition of competitiveness [17], but in general, it is agreed that the concept of competitiveness is complex. As stated by many researchers, the nature of competitiveness involves trying to be better than other market participants in specific, comparable parameters [15]. Gries and Hentschel [18] distinguish two main features of competitive industries: selling and earning profit. Other researchers [9] share a similar opinion and have stated that international trade and export is closely related to industry competitiveness. Kaušylienė et al. [19], when analyzing competitiveness in the agricultural sector, indicated that the key indicators of competitiveness are output prices, product quality, labor productivity, changes in exports, and production. Some researchers studying competitiveness emphasize the issue of sustainable economic development and competitiveness [20]. Capobianco-Uriarte et al. [21] performed a bibliometric study on competitiveness for the 1983–2017 period and concluded that competitiveness and environmental aspects are increasingly being addressed in the scientific literature. One of the first attempts to combine environmental factors and competitiveness was proposed by the European Commission and has since been incorporated into other research [17,22,23].
As Matuzevičiūtė et al. [24] stated, the scientific literature focuses mainly on the competitiveness of companies, groups of companies (clusters), regions, countries, or groups of countries. However, the competitiveness of individual industries is still not widely explored. In this paper, industrial competitiveness is understood as the ability of domestic industries to profitably sell, and increase and maintain sales of, their sustainably produced products on local and export markets.
The strategic vision of the European Commission for Climate Change and Energy Policy is to achieve carbon neutrality by 2050, increase energy security, and simultaneously achieve the long-term competitiveness of European industry. The determination of policy leaders to mitigate climate change [2] has led scientists [25,26,27,28] to assess the impact of environmental aspects on industrial competitiveness. As shown by several scientists, the best way to achieve the EU’s long-term climate and energy goal is to increase energy efficiency and stimulate the modernization of energy efficiency technology [29,30]. As Andrei et al. [31] mentioned, it will be hard to maintain long-term industry competitiveness and achieve decarbonization without improving energy efficiency in cost-effective ways.
Several researchers [32,33,34] have empirically investigated the relationship between income and carbon emissions, but their conclusions are different and sometimes contradictory. To promote the decarbonization of the economy, the European Commission introduced the European Emission Trading System (ETS) in 2005 [35]. This system has become one of the mainstays of EU environmental policy [36]. It established a new tradable commodity—emission allowances (the right to emit a ton of greenhouse gas (GHG) emission (mainly CO2)). ETS works as follows: for every ton of CO2 released into the atmosphere, polluters require an allowance. Every participant in the system has a certain amount of freely allocated emission allowances. Every year, the amount allowable of emissions decreases, but every participant can buy or sell allowances according to their needs. Given that the amount of freely allocated emission allowances shrinks with time, the EU Commission expects that allowances will become more expensive, and companies will be forced to switch to a less carbon-intensive energy source or invest in energy-efficient technologies [35]. Thus far, industry, power plants, and airlines have been involved in the EU’s ETS. Some studies have focused on the impact of the ETS on EU industries and concluded that the price of allowances impacts industry competitiveness [36,37]. Bassi et al. [38] concluded (and other researchers agreed [39,40]) that the carbon price could significantly impact the global competitiveness of energy-intensive industries, as well as industry structure, if this price is higher in one country or region. Many researchers have analyzed the link between the company or industry competitiveness and the emission trading system [36,37,41,42], but a generalized view of competition and a comparison of EU countries is missing. Khastar et al. [39] also concluded that by introducing a carbon tax, governments can not only address greenhouse gas emission mitigation, but can also pursue other political goals, i.e., a higher tax income, the stimulation of renewable energy deployment, and increases in efficiency. Although this topic remains to be analyzed thoroughly, the tightening of environmental regulations will likely impact industry competitiveness in the future.
As stated by de Macedo the framework for analyzing the interconnectivity of energy efficiency, environmental improvement, and sustainable industrial development remains incomplete [43].
Several researchers [44,45,46,47] have stated that competitiveness assessment is a multifaceted, complex process requiring an appropriate assessment methodology and indicator system. In practice, competitiveness analysis models explore and compare several statistical indicators, and combine them into a competitiveness assessment index [16,48,49]. In 2019, the founders of the Competitiveness Industrial Performance index added a new carbon emission dimension to their index. They expect that this supplementation will enable the index to better reflect industry’s negative environmental impact [26]. Myung et al. [50] proposed a conceptual model of company competitiveness measurement in relation to climate change. The proposed model can help practitioners to proactively solve climate change issues. Global Reporting Initiative guidelines are often used to judge climate change competitiveness [51]. The empirical results from the Mexican industry have also shown that optimized energy use increases competitiveness [52]. However, after reviewing the most popular competitiveness indexes, we noted that the dimensions of energy and emissions are not widely used. This was the main motivation to build an industry competitiveness measure index focusing on industry export performance, carbon emission, and energy efficiency, and to test this index on the European Union’s high-energy-intensity industries.

3. Data and Methodology

3.1. Data

This paper relies on data from Eurostat, the European Union Emissions Trading System; the United Nations’ (UN) Comtrade, and the International Energy Agency’s (IEA) energy efficiency indicators database, for the period between 2009 and 2018. The International Standard Industrial Classification (ISIC) was used to synchronize, compare, and filter the data between all databases. The ISIC correspondence table, devised by the UN, was used to match the data from the different databases with different classifications. Only EU countries that are members of the IEA were analyzed in this paper (i.e., Austria (AT), Belgium (BE), Czech Republic (CZ), Denmark (DK), Finland (FI), France (FR), Germany (DE), Greece (GR), Hungary (HU), Ireland (IE), Italy (IT), Lithuania (LT), the Netherlands (NL), Poland (PL), Portugal (PT), Slovakia (SK), Spain (ES), Sweden (SE), the United Kingdom (UK)).
According to IEA classification, the basic metal (ISIC 24), non-metallic mineral (ISIC 23), chemical and chemical product (ISIC 20–21), paper pulp, and printing industries (ISIC 17–18) are the primary high-energy-intensity industries. These industries are analyzed in this paper.
If some data were missing, then the average value of all the available data was used. All statistical calculations and hypothesis testing were performed using the R programming language (version 4.1.0) and MS Excel 2016. The significance level (P) for all statistical estimations was set as <0.05.

3.2. Methodology

The industry competitiveness measure index we designed consists of seven components, grouped into three equally weighted sub-indexes: export performance, energy, and environmental. Figure 1 shows the structure of the index.
The idea of an equally weighted measure index is derived from a heuristic. As Gigerenzer and Todd [53] stated, the performance of equally weighted models (unit weight models) is often almost as good as that of multiple regression, especially when the ratio of alternatives is equal to or less than 10. Besides this, recent empirical studies showed that equally weighted indexes and portfolios are more robust and produce significantly better average outputs than other weighted portfolios [54,55,56]. Marewski et al. [57] stated that unifying the weights makes analysis models both simple and robust enough for predicting complex events.
All indicators are briefly described below. The export performance sub-index includes three equally weighted indicators:
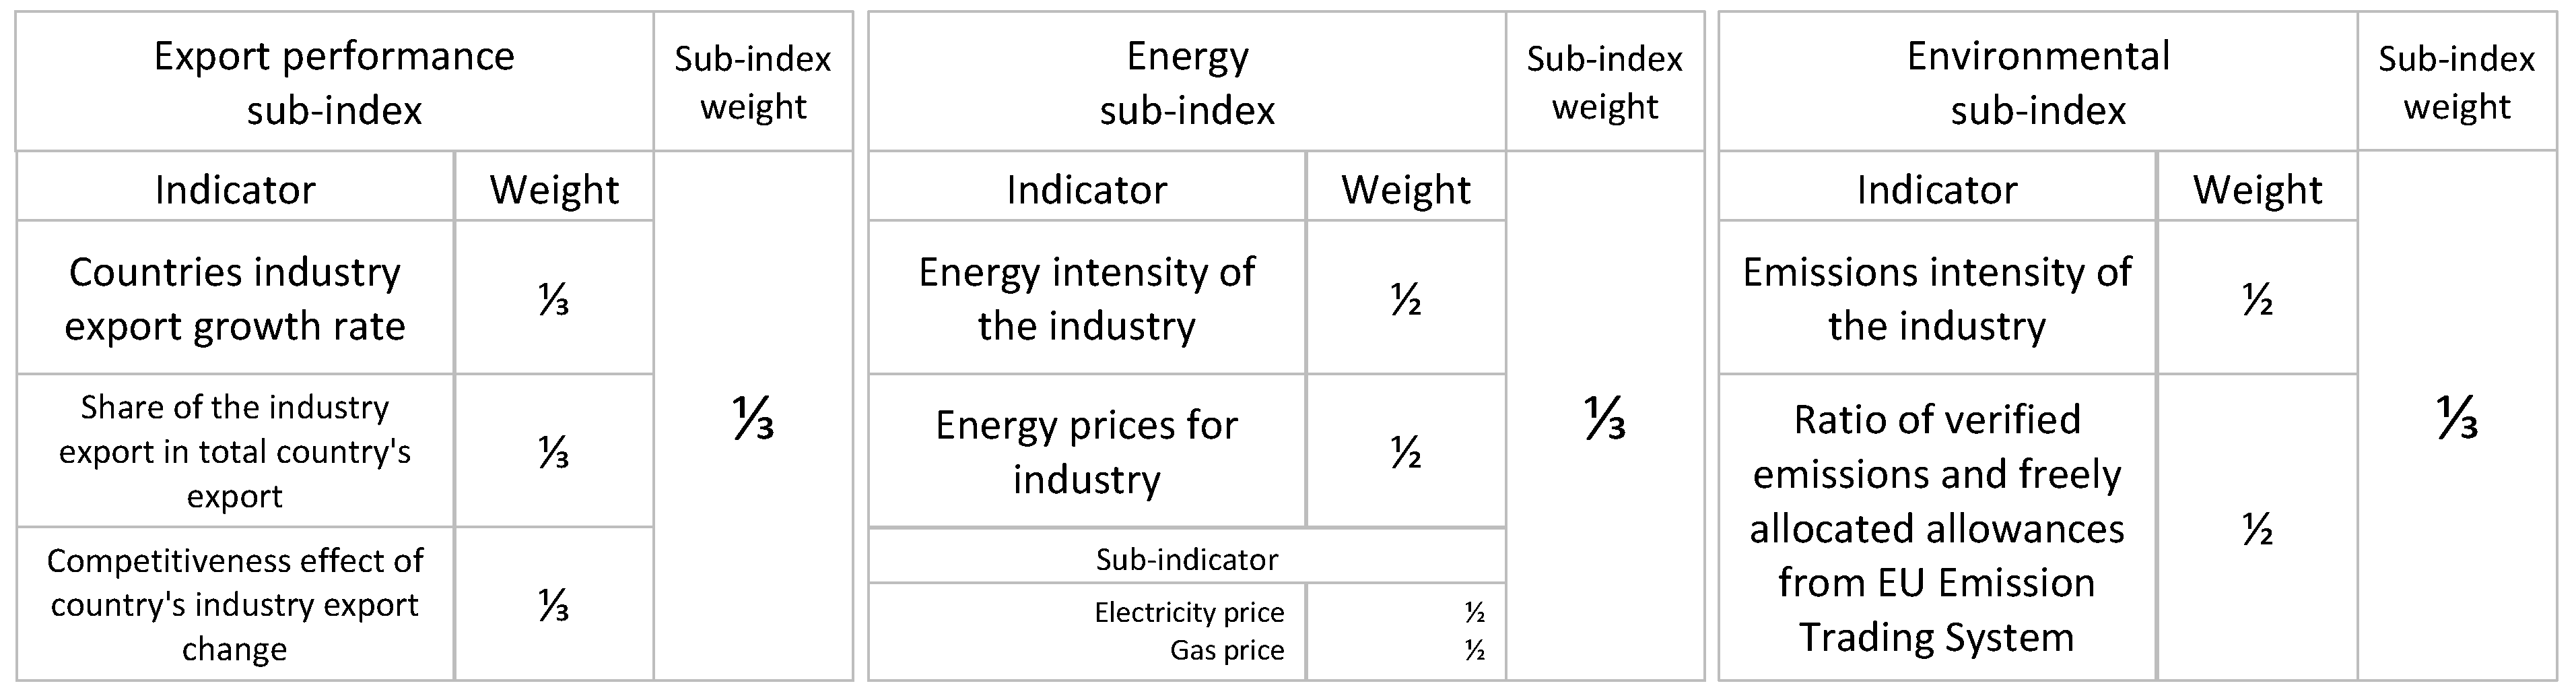
  • The industry export growth rate (1). The industry export and its growth rate are amongst the primary indicators of an industry’s competitiveness. Many researchers used export performance to analyze the competitiveness of countries or industries or integrated it into a competitiveness index calculation [9,44,58,59].
X g = X t X t 1 1 ,
where Xg—industry export growth rate, Xt—industry export in period t, and Xt−1—industry export in period t − 1.
2.
The share of the industry’s export in the entire country’s export (2) shows the importance of a particular industry in the country’s economy. Many researchers used a country’s export share in different ways [60,61]; however, the link between energy efficiency and a country’s export share has not been analyzed sufficiently.
X s = X t X ,
where Xs—share of the industry export, Xt—industry export in period t, and X’—country’s export in period t.
3.
The competitiveness effect of change in a country’s industry export. Tyszynski [62] suggested a method to compartmentalize the difference in a country’s export into four components: world growth, commodity, regional market, and competitiveness effects. This method is known as constant market share analysis and has undergone some modifications. Due to its simple calculation method and the data availability, many researchers have used constant market share decomposition in different countries and different industries [9,63,64,65]. For this paper, we used this methodology (3) as described by Leamer and Stern [66] and as used in ECB papers [67], including only the calculation of the effect of competitiveness on the index.
C E = i p ( g i p g i ) X i p t ,
where CE—competitiveness effect, X—industry export, t—period, i—commodity, p—export market, gip, gi—the export growth rate in the commodity and market.
The energy sub-index consists of two equally weighted indicators:
  • The energy intensity shows the efficiency of energy use in the economy, industry, or company. Scientists [68,69,70,71] and statisticians [72,73] use the energy intensity indicator to measure energy efficiency. Energy intensity (4) is the ratio between consumed energy and value added in the industry.
I e = E i V A i ,
where Ie—energy intensity in the industry, Ei—the energy used in the industry, VAi—value added in the industry.
Many researchers have looked into the relationship between energy intensity and economic development in different countries and industries, and at various points [74,75,76]. The International Energy Agency [77] argues that energy intensity is the most critical indicator of the energy efficiency trend. The latest empirical research shows [78,79,80] that the GDP growth rate is more significant than the energy consumption of the economy. Martinez et al. [81] stated that the main reason for this is the service sector, which generates greater added value and consumes less energy as a production industry. Neuhoff et al. [10] drew similar conclusions regarding EU industries. Besides this, the use of modern technologies and updated processes in energy-intensive industries reduces energy consumption.
2.
Some researchers argue that an industry’s energy prices (5) are one of the main elements of its competitiveness [82]. Empirical studies show that the causal relationship between energy prices and economic growth is not neutral [83]. Crespo [84] stated that a high energy cost negatively impacts the export potential of European companies. Crespo also concluded that a growth in energy efficiency did not offset the increase in energy prices. The findings regarding energy cost and export potential in the EU manufacturing sector correspond to the results for the US manufacturing sector [38]. For index calculation, the electricity and gas prices for manufacturing companies are used as follows:
P i = 1 2 p e + 1 2 p g ,
where Pi—energy price for industry; pe—electricity price for industry customers, recalculated to a standard score; pg—gas price for industry customers, recalculated to a standard score.
The environmental sub-index consists of the following two equally weighted indicators:
  • The industry’s emissions intensity (6) is calculated as the ratio of industry carbon emission per year to industry value added. Omri et al. [80] found a bidirectional causality between economic growth and CO2 emission. The industry sector is one of the primary sources of carbon emissions worldwide, accounting for roughly 20% of total emissions in 2018. The largest share of this comes from energy-intensive industries [77]. As Worrell et al. [30] stated, and as also discussed by the IEA, various technologies can mitigate industrial GHG emissions; however, in the short term, an increase in energy efficiency is the most essential and cost-effective option.
I m = C M i V A i ,
where Im—emissions intensity in the industry, CMi—the industry’s carbon emissions, and VAi—value added in the industry.
2.
The ratio of freely allocated allowances and verified emissions (7) from the EU Emission Trading System is calculated as follows:
E U E T S R = F A A V E ,
where EUETSR—the ratio of freely allocated allowances and verified emissions, FAA—freely allocated allowances, and VE—verified emissions.
The preliminary analysis showed that there are some rows in the available data set in which the freely allocated allowances or verified emission value are zero. For this reason, if the value of the FAA is greater than zero and the VE value is zero, then the EUETSR is set to ten, but if the values of FAA and VE are equal to zero, then the EUETSR is also set to zero.
The standard score of each indicator for each year has been calculated. Each calculated indicator can obtain values from −∞ to +∞, with a mean of zero. An index score of zero represents the theoretical average score for a particular year and industry. The country with the highest positive index score is the most competitive in the specific year and industry.
Furthermore, after calculating the index scores, the results are analyzed via analysis of variance (ANOVA). Researchers [85,86,87,88,89] and many others have used the ANOVA method in their competitiveness research. Sergi et al. [85] investigated the relationship between selected factors of the Global Competitiveness Index and the Logistics Performance Index, and for the implementation of their research in Africa, Asia, and the EU, the ANOVA method was used. Their study results highlight that a range of factors might affect logistic sector performance in terms of both geography and stage of development. Acquaah and Yasai-Ardekani [86] used the ANOVA method to investigate the effects of cost-leadership and differentiation strategies on firm competitiveness. The findings highlight that companies implementing a coherent competitive strategy perform better than companies deploying other strategies. Kisel’áková et al. [89] used regression models to assess the interaction among competitiveness, business environment and human development, and sustainable growth. The ANOVA method was used to assess the adequacy of the regression models. The results of the study revealed that the business environment and human resources have an impact on global macroeconomic competitiveness. In what follows, a two-way ANOVA will be conducted to detect any statistically significant differences between the countries and industries indices. The following ANOVA hypotheses will be tested: H1—the competitiveness index means grouped by industry are the same; H2—the competitiveness index means grouped by country are the same; H3—there is no interaction between industries and countries. Post hoc comparison will not be implemented.

4. Results of the Research

This paper presents our developed index that evaluates industry competitiveness as regards energy efficiency and carbon emission. Based on three sub-indexes (i.e., export performance, energy, and environment), this paper proposes an industry competitiveness evaluation system focusing on energy efficiency and carbon emissions. The index includes seven equally weighted indicators, which are relatively easy to calculate and interpret. The main descriptive statistic of each index value is presented in Table 1. Attention should be paid to the average index value for each country.
The quantitatively expressed competitiveness estimates for the period of 2009 to 2018 were also calculated for each country. The competitiveness index results for the basic metal (ISIC 24), non-metallic mineral (ISIC 23), chemical and chemical product (ISIC 20–21), paper pulp, and printing (ISIC 17–18) industries for each country in the period 2009–2018 are shown in Table 2, Table 3, Table 4 and Table 5, and consist of 760 observations.
In the following section, we present our calculated competitiveness index results of the basic metal industry (ISIC 24) in each EU country. Table 2 below shows the index scores computed during the analyzed period of 2009 to 2018.
The EU’s basic metal industry’s competitiveness index between 2009 and 2018 varies in the range [−1.51; 1.21], with a mean of −0.02 and a standard deviation of 0.46. The mean varied between −0.05 and 0.00, while the standard deviation varied between 0.40 and 0.53, depending on the year, and both tended to decrease. The Pearson’s correlation coefficient was calculated between the basic metal industry’s export value and the lag one of the competitiveness index value. A weak correlation between industry’s export and index value was found (r = 0.15, p = 0.03).
The industry competitiveness index results for the basic metal industry in the analyzed countries show that the basic metal industries of Portugal, the United Kingdom, Lithuania, Austria, Italy, Spain, and Germany were the most competitive during the analyzed period (six or more positive index scores between 2009 and 2018). The only two countries with all negative index scores were the Czech Republic and Ireland. The lowest score (−1.51 in 2009) in the basic metal industry was measured in Ireland, and the highest (1.21 in 2018) was in Sweden. In the last assessed year, the country with the highest (1.21) index score was Sweden, and that with the lowest (−0.83) index score was the Czech Republic.
The highest serial correlation of the index values was found for Poland, the Czech Republic, and Denmark (the autocorrelation coefficients are 0.79, 0.67 and 0.65, respectively). The slopes of index value for these countries are negative and significant (Poland—β0 = −0.06, p = 0.000, add. R2 = 0.77; Denmark—β0 = −0.10, p = 0.01, add. R2 = 0.52; the Czech Republic—β0 = −0.05, p = 0.01, add. R2 = 0.52), which implies that the index value of these countries declined over the research period.
A deeper look into the industry competitiveness index results for Portugal’s basic metal industry (all positive index scores and highest (0.48) average value) shows that the score changed from 0.66 in 2009 to 0.38 in 2018, and manifested a non-significant decreasing trend (slope β0 = −0.02, p = 0.06, add. R2 = 0.12). The energy intensity and carbon emission indicators for Portugal were always positive and between 0.09 and 0.19, but the industry export growth and competitiveness effect indicators reduced from 0.19 and 0.23 to −0.10 and −0.13, respectively. This represents the most significant drop in the basic metal industry group.
Ireland’s (all negative index values and lowest (−0.80) average index value) basic metal industry’s competitiveness index changed from −1.51 in 2009 to −0.46 in 2018. This is a non-statistically significant positive trend (slope β0 = 0.08, p = 0.08).
In the text below, some main observations regarding competitiveness in the EU’s non-metallic minerals industry (ISIC 23) between 2009 and 2018 are discussed. Table 3 presents all the calculated index scores for this industry.
The EU’s non-metallic minerals industry’s competitiveness index between 2009 and 2018 varied in the range of −1.63 and 1.01, with a mean of −0.02 and a standard deviation of 0.39. Depending on the year, the mean of the calculated index values in this industry varied between −0.06 and 0.00, and the standard deviation varied between 0.28 and 0.55, with a decreasing trend. The Pearson’s correlation coefficient was calculated between the non-metallic minerals industry’s export value and the lag one of the competitiveness index value. A weak correlation between industry’s export and index value was found (r = 0.14, p = 0.04).
The industry competitiveness index results for the non-metallic minerals industry in the analyzed countries show that the industries of Austria, Lithuania, Hungary, the United Kingdom, Germany, Portugal, Poland, and Italy were the most competitive during the analyzed period (at least eight positive index scores between 2009 and 2018). The non-metallic minerals industries of the Czech Republic, Belgium, Denmark, France, and Greece all show the lowest competitiveness index scores (all negative index scores). The lowest index value between 2009 and 2018 was held by Greece (−1.63 in 2010), and the highest by Italy (1.01 in 2017); Greece also showed the lowest average index value (−0.60). The highest average index value was shown by Hungary (0.50). In 2018, the country with the highest (0.56) index score was Finland, and that with the lowest (−0.75) index score was Denmark.
The highest serial correlation of index values was displayed by Hungary and Portugal (first-order autocorrelation coefficients of 0.71 and 0.59, respectively). The slope of the index value for Hungary is negative (β0 = −0.06, p = 0.01, add. R2 = 0.54), and the slope of the index value for Portugal is positive (β0 = 0.04, p = 0.03, add. R2 = 0.38).
Hungary’s non-metallic minerals industry showed all positive competitiveness index scores, which changed from 0.67 in 2009 to 0.20 in 2018. The average value of Hungary’s competitiveness index was 0.50, and this was the highest average value among all countries in this industry. Hungary’s energy intensity and carbon emission indicators were always positive, between 0.08 and 0.20, but the industry’s electricity and gas price indicators dropped from 0.10 and 0.18 to −0.12 and −0.19, respectively.
Lithuania and Austria’s non-metallic minerals industries also had all positive competitiveness index scores. However, their average values (0.38 and 0.20, respectively) were lower, their serial correlations were very weak, and their slopes are non-significant (β0 = −0.03, p = 0.29 and β0 = −0.01, p = 0.66, respectively).
In the subsequent section, the results of the competitiveness index for the chemical and chemical products industries (ISIC 20–21) of the EU countries are discussed. Table 4 shows the index scores for the analyzed period of 2009 to 2018.
The competitiveness index of the EU’s chemical and chemical products industries between 2009 and 2018 varied in the range of −1.29 and 1.35, with a mean of −0.02 and a standard deviation of 0.47. Depending on the year, the average of the calculated index values in this industry varied between −0.06 and 0.00, and the standard deviation varied between 0.40 and 0.57, with a decreasing trend. The Pearson’s correlation coefficient was calculated between the chemical and chemical products industries export value and the lag one of the competitiveness index value. A weak correlation between an industry’s export and index value was found (r = 0.15, p = 0.04).
The industry competitiveness index results for the chemicals and chemical products industries in the analyzed countries show that the industries of Ireland, the United Kingdom, France, Spain, Hungary, and Italy were the most competitive during the analyzed period (more than eight positive index scores between 2009 and 2018). The chemicals and chemical products industries of the Czech Republic and the Netherland displayed the lowest competitiveness index scores (all negative index scores). The lowest index value between 2009 and 2018 was reached by the Netherlands (−1.29 in 2015), and the highest by Ireland (1.35 in 2018); both countries also had the lowest and highest average index values (the Netherlands −0.87; Ireland 0.79). In 2018, the country with the lowest (−0.94) index score was Slovakia.
The highest serial correlation of the index values was achieved by Greece, Hungary, and Slovakia (first-order autocorrelation coefficients of 0.66, 0.62, and 0.62, respectively). The slopes of index values for Slovakia and Hungary are negative (Slovakia—β0 = −0.14, p = 0.001, add. R2 = 0.73; Hungary—β0 = −0.05, p = 0.001, add. R2 = 0.73), which implies that the index values of these countries declined over the research period. The slope of the index value for Greece is positive (β0 = 0.17, p = 0.02, add. R2 = 0.66), which implies that the index value of this country increased over the research period.
A closer look at the industry competitiveness index results for Ireland’s chemicals and chemical products industry (all positive, and with the highest average (0.79) index score) shows an increase from 1.06 in 2009 to 1.35 in 2018, and this was always one of the best scores in this industry. Ireland’s average score was also the highest among all other industries. However, the serial correlation was very weak (0.16), and the slope is non-significant (β0 = 0.04, p = 0.25). The energy and carbon emission intensities, and the share of industry export indicators, were always positive, between 0.18 and 0.40. After 2013, the industry’s export growth rate and its effect on competitiveness changed from negative to positive. However, the freely allocated allowances and verified emissions indicators were always negative, and the energy prices for the industry were also relatively high.
France and the United Kingdom’s chemicals and chemical products industries’ competitiveness values during the research period were above the EU average (all positive index scores), but their average values (0.19 and 0.43, respectively) and serial correlations were low, and their slopes are non-significant (β0 = 0.01, p = 0.40 and β0 = −0.003, p = 0.85, respectively).
The results from the last studied industry (i.e., EU paper pulp and printing industry (ISIC 17–18)) are described in the section below, and are shown in Table 5.
The competitiveness index of the EU’s paper pulp and printing industry between 2009 and 2018 varied in the range of −1.09 and 1.08, with a mean of −0.02 and a standard deviation of 0.37. Depending on the year, the average calculated index value varied between −0.07 and 0.00, and the standard deviation varied between 0.30 and 0.46, with a decreasing trend. The Pearson’s correlation coefficient was calculated between the paper pulp and printing industry’s export value and the lag one of the competitiveness index value. A weak correlation between an industry’s export and index value was found (r = 0.32, p < 0.001).
The competitiveness index results show that the paper pulp and printing industries of Lithuania, the United Kingdom, Hungary, Poland, and Spain were the most competitive during the analyzed period (more than eight positive index scores between 2009 and 2018). Austria, Finland, and Germany’s paper pulp and printing industries achieved the lowest competitiveness index scores (all negative index scores). The lowest index value between 2009 and 2018 was shown by Finland (−1.09 in 2009) and the highest by Lithuania (1.08 in 2010); both countries also had the lowest and highest average index values (Finland—−0.68, and Lithuania—0.58). In 2018, the country with the highest (0.56) index score was Denmark, and that with the lowest (−0.60) was Belgium.
Lithuanian had all positive scores and the highest average (0.58) value of competitiveness for its paper pulp and printing industry, but its score decreased from 0.49 in 2009 to 0.26 in 2018; the first-order autocorrelation coefficient was low (0.23), and the slope is negative and non-significant (β0 = −0.08, p = 0.06). The energy intensity, carbon emission, and ratio of freely allocated allowances and verified emissions indicators were always positive, between 0.01 and 0.46. However, the industry’s electricity price indicator was negative, and changed from −0.01 in 2009 to −0.04 in 2018.
The highest serial correlation of index values was found for Greece and Denmark (first-order autocorrelation coefficients of 0.71 and 0.68, respectively). The slopes of index values for both the countries are positive and significant (Greece—β0 = 0.13, p = 0.03, add. R2 = 0.42; Denmark—β0 = 0.11, p = 0.001, add. R2 = 0.70), which implies that the index values of these countries decreased over the research period.
A two-way ANOVA was used to evaluate the effect of industry and country on the competitiveness index score. The ANOVA assumption check flagged 17 outliers (seven in ISIC 17–18, two in ISIC 20–21, three in ISIC23, and five in ISIC24), but the index values are normally distributed between the industries. Table 6 shows the results of the computation.
The ANOVA results are as follows: (1) the competitiveness index value was statistically significantly different between the investigated countries; (2) the competitiveness index value was statistically non-significantly different between investigated industries; (3) there is a significant interaction between country and industry in terms of the competitiveness index value. The detailed findings can be summarized as follows: the simple main effect analysis showed that there were no differences between industries as regards the index score (F(3, 684) = 0.00, p = 0.99), but there was a significant effect of country on the competitiveness index score (F(18, 684) = 23.28, p < 0.001). Therefore, we failed to reject the H1 hypothesis, but we rejected the H2 hypothesis. We also found a statistically significant interaction between the effects of country and industry on the competitiveness index score (F(54, 684) = 8.74, p < 0.001); consequently, we rejected the H3 hypothesis. Post hoc comparison was not implemented.
These results suggest that the country alone, and industry/country interaction, significantly affect the value of the competitiveness index. However, it should be mentioned that the industry per se does not substantially affect the competitiveness index score.

5. Conclusions and Discussion

To conclude, this article presents an evaluation of industry competitiveness via the effects of energy efficiency and carbon emission. Based on three sub-indexes (i.e., export performance, energy, and environment), this paper has proposed an industry competitiveness evaluation system focusing on energy efficiency and carbon emissions. The presented industry competitiveness evaluation index was tested on the EU basic metal (ISIC 24), non-metallic mineral (ISIC 23), chemical and chemical product (ISIC 20–21), paper pulp, and printing (ISIC 17–18) industries.
Portugal’s basic metal industry achieved the best industry competitiveness index results (all positive index scores and highest (0.48) average value). Its index value varied from 0.90 in 2009 to 0.15 in 2018, and showed a non-significant decreasing trend. Its energy intensity and carbon emission indicators were always positive (above industry average), but the value of industry export growth and its effect on competitiveness indicators was reduced. The country with the highest serial correlation within this industry was Poland (0.79).
Within the non-metallic minerals industry, Hungary achieved the best industry competitiveness index results (all positive index scores and highest (0.50) average value). However, its index score changed from 0.67 in 2009 to 0.20 in 2018, and showed a significant decreasing trend. Its energy intensity and carbon emission indicators were always positive (above industry average), but its industry electricity and gas price indicators decreased over time. The country with the highest serial correlation within this industry was also Hungary (0.71).
As regards the chemical and chemical products industry, Ireland achieved the best industry competitiveness index results (all positive and highest average (0.79) index score), displaying a non-significant increase in the index from 1.06 in 2009 to 1.35 in 2018. Ireland’s average score was also the highest among all other industries. Its energy intensity and carbon emission intensity indicators were always positive (above industry average), but its freely allocated allowances and verified emissions indicators were always negative (below industry average). The country with the highest serial correlation within this industry was Greece (0.66).
Lithuania’s index results were the best in the EU paper pulp and printing industry (all positive and highest average (0.58) index score), showing a non-significant decreasing trend, from 0.49 in 2009 to 0.26 in 2018. The energy intensity, carbon emissions, and ratio of freely allocated allowances and verified emissions indicators were always positive (above industry average). However, its industry electricity price indicator remained mostly negative. The country with the highest serial correlation within this industry was Greece (0.71).
The average index value within each industry eventually dropped to zero, and the standard deviation of the index value showed a diminishing trend through all sectors, which implies that the competitiveness in all sectors was increasing and that all countries were approaching the industry average.
The findings indicate that the countries with the highest index value will also have a positive energy intensity and carbon emission indicator. Still, the causal assumption of this statement should be checked in future research.
It must be stated that the countries with the highest average index value and highest positive index score are not the same as the countries with the highest serial correlation, except for the case of Hungary in the non-metallic minerals industry. This linkage should be investigated further in the future.
The ANOVA results show that (1) the competitiveness index value was statistically significantly different between the investigated countries; (2) the competitiveness index value was statistically non-significantly different between the investigated industries; (3) there is a significant interaction between the effects of country and industry on the competitiveness index value. These results suggest that the country alone, and the industry/country interaction, significantly affect the value of the competitiveness index. However, it should be mentioned that industry per se does not substantially affect the competitiveness index score.
There are many limitations to this paper. First, the countries’ macroeconomic development is not integrated into the index structure. Second, the limited number of countries, and their placement in only one region, limits the applicability of the results. There may be factors specific to other countries that impact industry competitiveness outside of Europe. Third, the authors had no intention to identify the causes of competitiveness.
In the future, this study could be expanded by adding more indicators to the sub-index structure, evaluating additional indicators’ usefulness, and concentrating on the search for the main drivers.

Author Contributions

Conceptualization, A.Z. and V.P.; methodology, A.Z.; investigation, A.Z. and V.P.; resources, A.Z.; writing—original draft preparation, A.Z. and V.P.; writing—review and editing, A.Z. and V.P.; visualization, A.Z.; supervision, V.P. All errors and omissions are the responsibility of the authors. All authors have read and agreed to the published version of the manuscript.

Funding

This research received no external funding.

Institutional Review Board Statement

Not applicable.

Informed Consent Statement

Not applicable.

Data Availability Statement

Data are contained within the article.

Conflicts of Interest

The authors declare no conflict of interest.

References

  1. European Commission. A Framework Strategy for a Resilient Energy Union with a Forward-Looking Climate Change Policy. Available online: https://eur-lex.europa.eu/legal-content/EN/ALL/?uri=CELEX:52015DC0080 (accessed on 6 May 2021).
  2. European Commission. Communication from the Commission—The European Green Deal. Available online: https://eur-lex.europa.eu/legal-content/EN/TXT/?qid=1588580774040&uri=CELEX:52019DC0640 (accessed on 4 May 2020).
  3. Masson-Delmotte, V.; Zhai, P.; Pörtner, H.-O.; Roberts, D.; Skea, J.; Shukla, P.R.; Pirani, A.; Moufouma-Okia, W.; Péan, C.; Pidcock, R.; et al. Summary for Policymakers. In Global Warming of 1.5 °C. An IPCC Special Report on the Impacts of Global Warming of 1.5 °C above Pre-Industrial Levels and Related Global Greenhouse Gas Emission Pathways, in the Context of Strengthening the Global Response to the Threat of Climate Change; Sustainable Development, and Efforts to Eradicate Poverty: Geneva, Switzerland, 2018. [Google Scholar]
  4. Pachauri, R.K.; Allen, M.R.; Barros, V.R.; Broome, J.; Cramer, W.; Christ, R.; Church, J.A.; Clarke, L.; Dahe, Q.; Dasgupta, P.; et al. Climate Change 2014: Synthesis Report. Contribution of Working Groups I, II and III to the Fifth Assessment Report of the Intergovernmental Panel on Climate; Pachauri, R.K., Meyer, L., Eds.; IPCC: Geneva, Switzerland, 2014. [Google Scholar]
  5. Su, H.; Hou, F.; Yang, Y.; Han, Z.; Liu, C. An Assessment of the International Competitiveness of China’s Forest Products Industry. For. Policy Econ. 2020, 119, 102256. [Google Scholar] [CrossRef]
  6. Bravi, L.; Murmura, F. Industry 4.0 Enabling Technologies as a Tool for the Development of a Competitive Strategy in Italian Manufacturing Companies. J. Eng. Technol. Manag. 2021, 60, 101629. [Google Scholar] [CrossRef]
  7. Alsaleh, M.; Abdul-Rahim, A.S. Do Global Competitiveness Factors Effects the Industry Sustainability Practices? Evidence from European Hydropower Industry. J. Clean. Prod. 2021, 310, 127492. [Google Scholar] [CrossRef]
  8. BverfG. Beschluss Des. Ersten Senats Vom 24.03.2021, -1 BvR 2656/18-, Rn. 1–270. 2021. Available online: https://www.bverfg.de/e/rs20210324_1bvr265618.html (accessed on 1 June 2021).
  9. Athanasoglou, P.; Backinezos, C.; Georgiou, E. Export Performance, Competitiveness and Commodity Composition. RePec Work. Pap. 2010, 48. [Google Scholar]
  10. Neuhoff, K.; Acworth, W.; Dechezleprêtre, A.; Sartor, O.; Sato, M.; Schopp, A. Energie-Und Klimapolitik: Europa Ist Nicht Allein. DIW Wochenber. 2014, 81, 91–108. [Google Scholar]
  11. Porter, M.E. The Competitive Advantage of Nations. Harv. Bus. Rev. 1990, 68, 73–93. [Google Scholar]
  12. Safdar, I. Industry Competition and Fundamental Analysis. J. Account. Lit. 2016, 37, 36–54. [Google Scholar] [CrossRef]
  13. Bruneckienė, J. Šalies Regionų Konkurencingumo Vertinimas Įvairiais Metodais: Rezultatų Analizė Ir Vertinimas. Econ. Manag. 2010, 15, 25–31. [Google Scholar]
  14. Hatzichronoglou, T. Globalisation and Competitiveness: Relevant Indicators. OECD Sci. 1996, 61. [Google Scholar] [CrossRef]
  15. Bhawsar, P.; Chattopadhyay, U. Evaluation of Cluster Competitiveness: Review, Framework and the Methodology. Compet. Forum 2015, 13, 75. [Google Scholar]
  16. Schwab, K. The Global Competitiveness Report 2019; World Economic Forum: Geneva, Switzerland, 2019; ISBN 978-2-940631-02-5. [Google Scholar]
  17. Mulatu, A. On the Concept of “competitiveness” and Its Usefulness for Policy. Struct. Chang. Econ. Dyn. 2016, 36, 50–62. [Google Scholar] [CrossRef]
  18. Gries, T.; Hentschel, C. Internationale Wettbewerbsfähigkeit—Was Ist Das? Wirtschaftsdienst 1994, 74, 416–422. [Google Scholar]
  19. Kaušylienė, A.; Žoštautienė, V.; Šakickienė, A. Lietuvos Žemės Ūkio Konsultavimo Tarnybos Vaidmuo Didinant Žemdirbių Konkurencingumą. Verslum. Ugdym. Ir Konkurencingumo Stud. 2013, 10, 141–174. [Google Scholar]
  20. dos Santos, S.F.; Brandi, H.S. A Canonical Correlation Analysis of the Relationship between Sustainability and Competitiveness. Clean Technol. Environ. Policy 2014, 16, 1735–1746. [Google Scholar] [CrossRef]
  21. de las Capobianco-Uriarte, M.M.; del Casado-Belmonte, M.P.; Marín-Carrillo, G.M.; Terán-Yépez, E. A Bibliometric Analysis of International Competitiveness (1983–2017). Sustainability 2019, 11, 1877. [Google Scholar] [CrossRef] [Green Version]
  22. European Commission; Competitiveness Advisory Group. Enhancing European Competitiveness: 2nd Report to the President of the Commission; Office for Official Publications of the European Communities: Luxembourg, 1995. [Google Scholar]
  23. European Commission. The Competitiveness of European Industry: 1999 Report; Office for Official Publications of the European Communities: Luxembourg, 1999. [Google Scholar]
  24. Matuzevičiūtė, K.; Vaitekūnaitė, A.; Butkus, M. Europos Sąjungos Šalių Konkurencingumo Ir Jį Lemiančių Veiksnių Vertinimas. Ekon. Ir Vadyb. Aktualijos Ir Perspekt. 2015, 37, 38–53. [Google Scholar]
  25. Bosma, N.; Hill, S.; Ionescu-Somers, A.; Kelley, D.; Levie, J.; Tarnawa, A. Global Entrepreneurship Monitor 2019/2020 Global Report; Global Entrepreneurship Research Association: London, UK, 2020; ISBN 978-1-9160178-3-2. [Google Scholar]
  26. Correa, N.; Nice, T.; Upadhyay, S. Competitive Industrial Performance Report 2018; United Nations Industrial Development Organization (UNIDO): Vienna, Austria, 2019. [Google Scholar]
  27. Semieniuk, G.; Taylor, L.; Rezai, A.; Foley, D.K. Plausible Energy Demand Patterns in a Growing Global Economy with Climate Policy. Nat. Clim. Chang. 2021, 11, 313–318. [Google Scholar] [CrossRef]
  28. Stoever, J.; Weche, J.P. Environmental Regulation and Sustainable Competitiveness: Evaluating the Role of Firm-Level Green Investments in the Context of the Porter Hypothesis. Environ. Resour. Econ. 2018, 70, 429–455. [Google Scholar] [CrossRef] [Green Version]
  29. Malinauskaite, J.; Jouhara, H.; Egilegor, B.; Al-Mansour, F.; Ahmad, L.; Pusnik, M. Energy Efficiency in the Industrial Sector in the EU, Slovenia, and Spain. Energy 2020, 208, 118398. [Google Scholar] [CrossRef]
  30. Worrell, E.; Bernstein, L.; Roy, J.; Price, L.; Harnisch, J. Industrial Energy Efficiency and Climate Change Mitigation. Energy Effic. 2009, 2, 109–123. [Google Scholar] [CrossRef] [Green Version]
  31. Andrei, M.; Thollander, P.; Pierre, I.; Gindroz, B.; Rohdin, P. Decarbonization of Industry: Guidelines towards a Harmonized Energy Efficiency Policy Program Impact Evaluation Methodology. Energy Rep. 2021, 7, 1385–1395. [Google Scholar] [CrossRef]
  32. Kasman, A.; Duman, Y.S. CO2 Emissions, Economic Growth, Energy Consumption, Trade and Urbanization in New EU Member and Candidate Countries: A Panel Data Analysis. Econ. Model. 2015, 44, 97–103. [Google Scholar] [CrossRef]
  33. Li, L.; Hong, X.; Peng, K. A Spatial Panel Analysis of Carbon Emissions, Economic Growth and High-Technology Industry in China. Struct. Chang. Econ. Dyn. 2019, 49, 83–92. [Google Scholar] [CrossRef]
  34. Soytas, U.; Sari, R. Energy Consumption, Economic Growth, and Carbon Emissions: Challenges Faced by an EU Candidate Member. Ecol. Econ. 2009, 68, 1667–1675. [Google Scholar] [CrossRef]
  35. Rickels, W.; Görlich, D.; Oberst, G.; Rickels, W.; Görlich, D.; Oberst, G. Explaining European Emission Allowance Price Dynamics: Evidence from Phase II. Kiel Work. Pap. 2010, 1650, 1–24. [Google Scholar] [CrossRef] [Green Version]
  36. Zapletal, F. On Influence of Emissions Trading on Efficiency of the EU National Steel Sectors. Carbon Manag. 2021, 12, 249–264. [Google Scholar] [CrossRef]
  37. Demailly, D.; Quirion, P. European Emission Trading Scheme and Competitiveness: A Case Study on the Iron and Steel Industry. Energy Econ. 2008, 30, 2009–2027. [Google Scholar] [CrossRef] [Green Version]
  38. Bassi, A.M.; Yudken, J.S.; Ruth, M. Climate Policy Impacts on the Competitiveness of Energy-Intensive Manufacturing Sectors. Energy Policy 2009, 37, 3052–3060. [Google Scholar] [CrossRef]
  39. Khastar, M.; Aslani, A.; Nejati, M.; Bekhrad, K.; Naaranoja, M. Evaluation of the Carbon Tax Effects on the Structure of Finnish Industries: A Computable General Equilibrium Analysis. Sustain. Energy Technol. Assess. 2020, 37, 100611. [Google Scholar] [CrossRef]
  40. Alshammari, Y.M. Scenario Analysis for Energy Transition in the Chemical Industry: An Industrial Case Study in Saudi Arabia. Energy Policy 2021, 150, 112128. [Google Scholar] [CrossRef]
  41. Larsson, M.; Wang, C.; Dahl, J. Development of a Method for Analysing Energy, Environmental and Economic Efficiency for an Integrated Steel Plant. Appl. Therm. Eng. 2006, 26, 1353–1361. [Google Scholar] [CrossRef]
  42. Oda, J.; Akimoto, K.; Tomoda, T.; Nagashima, M.; Wada, K.; Sano, F. International Comparisons of Energy Efficiency in Power, Steel, and Cement Industries. Energy Policy 2012, 44, 118–129. [Google Scholar] [CrossRef]
  43. Celani de Macedo, A.; Cantore, N.; Barbier, L.; Matteini, M.; Pasqualetto, G. The Impact of Industrial Energy Efficiency on Economic and Social Indicators. SSRN Electron. J. 2020. [Google Scholar] [CrossRef]
  44. Bruneckienė, J.; Paltanavičienė, D. Measurement of Export Competitiveness of the Baltic States by Composite Index. Eng. Econ. 2012, 23, 50–62. [Google Scholar] [CrossRef]
  45. Elenurm, T. International Competitiveness and Organizational Change Drivers Anticipated by Estonian Managers in the Context of European Integration. Balt. J. Manag. 2007, 2, 305–318. [Google Scholar] [CrossRef]
  46. Rugman, A.M.; Oh, C.H.; Lim, D.S.K. The Regional and Global Competitiveness of Multinational Firms. J. Acad. Mark. Sci. 2012, 40, 218–235. [Google Scholar] [CrossRef]
  47. Seyoum, B. Revealed Comparative Advantage and Competitiveness in Services: A Study with Special Emphasis on Developing Countries. J. Econ. Stud. 2007, 34, 376–388. [Google Scholar] [CrossRef] [Green Version]
  48. Balzaravičienė, S.; Pilinkienė, V. Comparison and Review of Competitiveness Indexes: Towards the EU Policy. Econ. Manag. 2012, 17, 103–106. [Google Scholar] [CrossRef] [Green Version]
  49. Głód, G.; Flak, O. Factors of Competitiveness in Polish Companies in the Silesian Region in 2014–2016. Oeconomia Copernic. 2017, 8, 601–619. [Google Scholar] [CrossRef] [Green Version]
  50. Myung, J.K.; An, H.T.; Lee, S.Y. Corporate Competitiveness Index of Climate Change: A Balanced Scorecard Approach. Sustainability 2019, 11, 1445. [Google Scholar] [CrossRef] [Green Version]
  51. Global Reporting Initiative. Available online: http://www.globalreporting.org (accessed on 20 May 2021).
  52. Munguia, N.; Vargas-Betancourt, N.; Esquer, J.; Giannetti, B.F.; Liu, G.; Velazquez, L.E. Driving Competitive Advantage through Energy Efficiency in Mexican Maquiladoras. J. Clean. Prod. 2018, 172, 3379–3386. [Google Scholar] [CrossRef]
  53. Gigerenzer, G.; Todd, P.M. Simple Heuristics That Make Us Smart; Oxford University Press: New York, NY, USA, 1999. [Google Scholar]
  54. DeMiguel, V.; Garlappi, L.; Uppal, R. Optimal Versus Naive Diversification: How Inefficient Is the 1/N Portfolio Strategy? Rev. Financ. Stud. 2009, 22, 1915–1953. [Google Scholar] [CrossRef] [Green Version]
  55. Malladi, R.; Fabozzi, F.J. Equal-Weighted Strategy: Why It Outperforms Value-Weighted Strategies? Theory and Evidence. J. Asset Manag. 2017, 18, 188–208. [Google Scholar] [CrossRef]
  56. Plyakha, Y.; Uppal, R.; Vilkov, G. Why Do Equal-Weighted Portfolios Outperform Value-Weighted Portfolios? SSRN Electron. J. 2012. [Google Scholar] [CrossRef]
  57. Marewski, J.N.; Gaissmaier, W.; Gigerenzer, G. Good Judgments Do Not Require Complex Cognition. Cogn. Process. 2010, 11, 103–121. [Google Scholar] [CrossRef] [Green Version]
  58. Krisiukėnienė, D.; Pilinkienė, V. Export Competitiveness Analysis of Creative Industries in the European Union. Econ. Cult. 2020, 17, 28–37. [Google Scholar] [CrossRef]
  59. Ruzekova, V.; Kittova, Z.; Steinhauser, D. Export Performance as a Measurement of Competitiveness. J. Compet. 2020, 12, 145–160. [Google Scholar] [CrossRef]
  60. Fetscherin, M.; Alon, I.; Johnson, J.P. Assessing the Export Competitiveness of Chinese Industries. Asian Bus. Manag. 2010, 9, 401–424. [Google Scholar] [CrossRef]
  61. Ioannidis, E.; Schreyer, P. Technology and Non-Technology Determinants of Export Share Growth. OECD Econ. Stud. 1997, 28, 1. [Google Scholar]
  62. Tyszynski, H. World Trade in Manufactured Commodities, 1899–1950. Manch. Sch. 1951, 19, 272–304. [Google Scholar] [CrossRef]
  63. Grebliauskas, A.; Stonys, M. Lietuvos Pramonės Eksporto Konkurencingumo Vertinimas. Taikom. Ekon. Sist. Tyrim. 2012, 6, 49–72. [Google Scholar] [CrossRef] [Green Version]
  64. Juswanto, W.; Mulyanti, P. Indonesia’s Manufactured Exports: A Constant Market Shares Analysis. Citeseer 2003, 6, 97–106. [Google Scholar]
  65. Skriner, E. Competitiveness and Specialisation of the Austrian Export Sector-A Constant-Market-Shares Analysis. FIW Work. Pap. 2009, 32. [Google Scholar]
  66. Leamer, E.E.; Stern, R.M. Quantitative International Economics; Allen & Bacon: Boston, MA, USA, 1970. [Google Scholar]
  67. di Mauro, F.; Anderton, R.; Ernst, E.; Maurin, L.; Pokutova, S.; Melyn, W.; Lecat, R.; Cassidy, M. Competitiveness and the Export Performance of the Euro Area; European Central Bank—Occasional paper Series: Frankfurt, Germany, 2005; pp. 1–100. [Google Scholar]
  68. Choi, B.; Park, W.; Yu, B.K. Energy Intensity and Firm Growth. Energy Econ. 2017, 65, 399–410. [Google Scholar] [CrossRef]
  69. Gamtessa, S.F. The Effects of Energy Price on Energy Intensity: Evidence from Canadian Manufacturing Sector. Energy Effic. 2017, 10, 183–197. [Google Scholar] [CrossRef]
  70. Stenqvist, C.; Nilsson, L.J. Energy Efficiency in Energy-Intensive Industries-an Evaluation of the Swedish Voluntary Agreement PFE. Energy Effic. 2012, 5, 225–241. [Google Scholar] [CrossRef] [Green Version]
  71. Sue Wing, I. Explaining the Declining Energy Intensity of the U.S. Economy. Resour. Energy Econ. 2008, 30, 21–49. [Google Scholar] [CrossRef] [Green Version]
  72. Eurostat Glossary: Energy Intensity. Available online: https://ec.europa.eu/eurostat/statistics-explained/index.php?title=Glossary:Energy_intensity (accessed on 1 June 2021).
  73. IEA. World Energy Balances 2019; OECD: Paris, France, 2019. [Google Scholar]
  74. IEA. Capturing the Multiple Benefits of Energy Efficiency; OECD: Paris, France, 2014. [Google Scholar]
  75. Liu, Y.; Wang, K. Energy Efficiency of China’s Industry Sector: An Adjusted Network DEA (Data Envelopment Analysis)-Based Decomposition Analysis. Energy 2015, 93, 1328–1337. [Google Scholar] [CrossRef]
  76. Williams, R.; McKane, A. Global Overview-the Systems Approach to Energy Efficiency in Industry. Wiley Interdiscip. Rev. Energy Environ. 2013, 2, 363–373. [Google Scholar] [CrossRef]
  77. IEA. Energy Efficiency Indicators; OECD: Paris, France, 2020. [Google Scholar]
  78. Magazzino, C. Energy Consumption and GDP in Italy: Cointegration and Causality Analysis. Environ. Dev. Sustain. 2015, 17, 137–153. [Google Scholar] [CrossRef]
  79. Magazzino, C. The Relationship between Real GDP, CO2 Emissions, and Energy Use in the GCC Countries: A Time Series Approach. Cogent Econ. Financ. 2016, 4, 1152729. [Google Scholar] [CrossRef]
  80. Omri, A.; Daly, S.; Rault, C.; Chaibi, A. Financial Development, Environmental Quality, Trade and Economic Growth: What Causes What in MENA Countries. Energy Econ. 2015, 48, 242–252. [Google Scholar] [CrossRef] [Green Version]
  81. Martínez, D.M.; Ebenhack, B.W.; Wagner, T.P. Energy Efficiency: Concepts and Calculations; Elsevier: Amsterdam, The Netherlands, 2019; ISBN 9780128121115. [Google Scholar]
  82. Riker, D.A. Energy Costs and Export Performance; International Trade Administration, Office of Competition and Economic Analysis: Washington, IL, USA, 2012.
  83. Asafu-Adjaye, J. The Relationship between Energy Consumption, Energy Prices and Economic Growth: Time Series Evidence from Asian Developing Countries. Energy Econ. 2000, 22, 615–625. [Google Scholar] [CrossRef] [Green Version]
  84. Crespo, D.C. European Competitiveness Report 2014—Helping Firms Grow; Publications Office of the European Union: Luxembourg, 2014; ISBN 978-92-79-38767-8. [Google Scholar]
  85. Sergi, B.S.; D’Aleo, V.; Konecka, S.; Szopik-Depczyńska, K.; Dembińska, I.; Ioppolo, G. Competitiveness and the Logistics Performance Index: The ANOVA Method Application for Africa, Asia, and the EU Regions. Sustain. Cities Soc. 2021, 69, 102845. [Google Scholar] [CrossRef]
  86. Acquaah, M.; Yasai-Ardekani, M. Does the Implementation of a Combination Competitive Strategy Yield Incremental Performance Benefits? A New Perspective from a Transition Economy in Sub-Saharan Africa. J. Bus. Res. 2008, 61, 346–354. [Google Scholar] [CrossRef]
  87. Wright, P.; Kroll, M.; Pray, B.; Lado, A. Strategic Orientations, Competitive Advantage, and Business Performance. J. Bus. Res. 1995, 33, 143–151. [Google Scholar] [CrossRef]
  88. Ding, L.; Lam, H.K.S.; Cheng, T.C.E.; Zhou, H. The Contagion and Competitive Effects across National Borders: Evidence from the 2016 Kumamoto Earthquakes. Int. J. Prod. Econ. 2021, 235, 108115. [Google Scholar] [CrossRef]
  89. Kiseľáková, D.; Šofranková, B.; Gombár, M.; Čabinová, V.; Onuferová, E. Competitiveness and Its Impact on Sustainability, Business Environment, and Human Development of EU (28) Countries in Terms of Global Multi-Criteria Indices. Sustainability 2019, 11, 3365. [Google Scholar] [CrossRef]
Figure 1. Industry competitiveness index of energy efficiency and carbon emission.
Energies 14 04700 g001
Table 1. Average, median, and standard deviation index values in 2009–2018. Source: own processing.
CountryBasic Metal IndustryNon-Metallic Minerals IndustryChemicals and Chemical Products IndustryPaper Pulp and Printing Industry
MeanMedianStd. Dev.MeanMedianStd. Dev.MeanMedianStd. Dev.MeanMedianStd. Dev.
CZ−0.47−0.460.30−0.35−0.350.15−0.59−0.520.16−0.31−0.360.20
SK−0.67−0.680.38−0.32−0.220.33−0.21−0.200.48−0.18−0.130.22
LT0.330.260.230.380.390.280.080.020.350.580.460.37
PT0.480.400.200.140.220.180.070.010.450.020.010.21
PL−0.07−0.010.210.170.160.27−0.28−0.300.210.160.210.14
HU0.140.100.270.500.570.220.150.110.170.360.290.38
AT0.170.180.130.200.200.130.160.270.30−0.27−0.270.07
BE−0.01−0.060.13−0.37−0.350.240.040.000.21−0.11−0.100.29
DK0.12−0.010.38−0.45−0.330.30−0.16−0.150.150.04−0.030.39
FI−0.10−0.190.480.140.180.22−0.47−0.460.39−0.68−0.700.24
FR−0.16−0.170.14−0.18−0.160.100.190.220.09−0.02−0.050.09
DE0.120.070.210.110.120.110.050.020.13−0.21−0.220.11
GR0.150.330.58−0.60−0.430.50−0.150.020.63−0.030.190.58
IR−0.80−0.770.40−0.31−0.300.230.790.760.330.170.180.38
IT0.190.250.320.150.140.400.100.170.29−0.050.000.21
NL−0.45−0.430.240.130.050.25−0.87−0.870.20−0.14−0.180.18
ES0.200.190.170.140.050.270.200.210.130.120.140.18
SE0.18−0.050.61−0.04−0.010.260.110.070.37−0.07−0.030.14
UK0.300.360.280.210.260.190.430.480.150.260.250.13
Table 2. EU basic metal industry (ISIC 24) competitiveness measure index, 2009–2018. Source: own processing.
Country2009201020112012201320142015201620172018
CZ−0.43−0.29−0.05−0.01−0.41−0.56−0.68−0.49−0.93−0.83
SK0.05−0.41−1.04−0.30−1.09−1.03−0.96−0.52−0.67−0.68
LT0.290.050.730.530.170.230.230.480.550.07
PT0.660.350.680.820.300.360.200.650.430.38
PL0.140.060.100.12−0.120.04−0.07−0.22−0.29−0.48
HU−0.110.07−0.130.130.33−0.11−0.080.470.620.21
AT0.450.270.160.22−0.010.190.130.190.030.08
BE0.29−0.08−0.01−0.120.09−0.140.08−0.05−0.11−0.09
DK0.440.430.800.44−0.23−0.13−0.01−0.32−0.26−0.01
FI−0.840.51−0.69−0.27−0.23−0.32−0.150.120.470.44
FR0.14−0.25−0.27−0.20−0.16−0.12−0.07−0.12−0.17−0.39
DE0.610.080.05−0.090.180.310.070.14−0.04−0.06
GR−0.17−0.76−0.22−0.700.370.590.820.280.580.70
IR−1.51−0.73−0.85−1.18−0.81−0.48−0.39−1.26−0.39−0.46
IT−0.09−0.580.200.370.280.470.220.530.190.28
NL−0.26−0.36−0.44−0.53−0.390.04−0.56−0.42−0.79−0.74
ES0.120.07−0.030.170.200.510.330.400.220.01
SE−0.34−0.170.08−0.331.17−0.300.62−0.320.191.21
UK−0.440.560.250.280.350.470.280.450.390.37
Table 3. EU non-metallic minerals industry (ISIC 23) competitiveness measure index, 2009–2018. Source: own processing.
Country2009201020112012201320142015201620172018
CZ−0.37−0.19−0.06−0.33−0.47−0.23−0.34−0.52−0.46−0.50
SK−0.11−0.240.010.16−0.62−0.68−0.75−0.12−0.66−0.19
LT0.180.920.560.500.330.010.170.580.450.06
PT0.03−0.17−0.140.210.310.230.250.260.130.28
PL−0.340.160.16−0.190.320.380.430.140.090.50
HU0.670.630.510.650.780.650.400.410.100.20
AT0.160.390.180.050.220.420.040.090.210.21
BE−0.04−0.20−0.35−0.56−0.06−0.81−0.60−0.39−0.35−0.34
DK−0.28−0.89−0.30−0.59−0.85−0.11−0.26−0.08−0.36−0.75
FI−0.040.220.220.240.270.15−0.23−0.060.100.56
FR−0.19−0.09−0.29−0.30−0.34−0.13−0.05−0.14−0.09−0.18
DE0.220.170.11−0.130.140.240.110.080.010.14
GR−0.19−1.63−1.35−0.63−0.25−0.41−0.16−0.35−0.57−0.45
IR−0.61−0.32−0.530.02−0.44−0.250.09−0.29−0.52−0.20
IT−0.38−0.440.060.180.310.180.100.091.010.38
NL0.45−0.010.58−0.120.16−0.080.080.36−0.130.03
ES0.13−0.04−0.17−0.010.43−0.020.240.120.74−0.02
SE−0.370.13−0.29−0.14−0.360.420.21−0.010.020.00
UK0.070.400.440.350.130.030.26−0.150.280.26
Table 4. EU chemicals and chemical products industry (ISIC 20–21) competitiveness measure index, 2009–2018. Source: own processing.
Country2009201020112012201320142015201620172018
CZ−0.53−0.43−0.46−0.73−0.74−0.42−0.82−0.78−0.51−0.44
SK0.250.220.41−0.420.13−0.08−0.32−0.41−0.93−0.94
LT−0.460.310.590.63−0.170.140.02−0.190.03−0.06
PT−0.58−0.29−0.07−0.460.490.720.250.670.04−0.02
PL−0.64−0.10−0.24−0.33−0.26−0.35−0.170.11−0.43−0.44
HU0.430.350.230.320.07−0.030.160.000.06−0.06
AT0.440.340.370.56−0.110.21−0.11−0.230.39−0.22
BE0.26−0.03−0.07−0.010.37−0.340.010.02−0.110.26
DK−0.02−0.48−0.07−0.14−0.020.01−0.22−0.16−0.33−0.19
FI−1.080.19−0.54−0.58−0.38−1.01−0.66−0.37−0.22−0.08
FR0.290.080.080.250.080.110.270.310.240.20
DE0.26−0.13−0.04−0.030.000.060.000.110.260.04
GR−0.75−0.78−1.13−0.640.420.21−0.170.510.290.56
IR1.060.540.700.380.340.841.150.680.811.35
IT−0.30−0.530.150.380.290.200.050.370.190.15
NL−0.79−0.89−0.74−0.60−0.97−1.02−1.29−0.91−0.65−0.86
ES0.220.20−0.100.130.300.170.320.330.270.19
SE0.34−0.15−0.130.17−0.320.400.91−0.250.110.03
UK0.590.380.380.460.490.190.620.190.500.53
Table 5. EU paper pulp and printing industry (ISIC 17–18) competitiveness measure index, 2009–2018. Source: own processing.
Country2009201020112012201320142015201620172018
CZ−0.65−0.360.08−0.36−0.41−0.37−0.08−0.34−0.17−0.40
SK−0.16−0.47−0.410.08−0.09−0.310.13−0.01−0.46−0.06
LT0.491.081.011.050.280.830.130.240.440.26
PT0.180.24−0.09−0.150.29−0.050.18−0.05−0.380.07
PL0.200.240.230.290.250.05−0.03−0.040.040.35
HU0.910.270.140.710.190.320.850.490.00−0.27
AT−0.18−0.25−0.16−0.33−0.36−0.21−0.32−0.34−0.30−0.22
BE0.00−0.09−0.120.060.42−0.51−0.12−0.220.03−0.60
DK−0.28−0.54−0.02−0.03−0.30−0.01−0.080.350.710.56
FI−1.09−0.70−0.80−0.77−0.58−0.70−0.60−0.84−0.53−0.15
FR0.12−0.010.12−0.06−0.14−0.07−0.04−0.070.01−0.06
DE−0.02−0.11−0.16−0.32−0.34−0.12−0.34−0.23−0.26−0.21
GR−0.24−0.85−1.00−0.470.340.670.400.250.530.13
IR−0.330.230.08−0.340.290.280.120.97−0.060.46
IT−0.24−0.550.060.060.160.10−0.04−0.09−0.030.03
NL0.16−0.080.00−0.28−0.39−0.12−0.26−0.240.07−0.26
ES0.010.400.300.020.17−0.21−0.080.110.220.20
SE0.060.04−0.34−0.04−0.230.060.03−0.09−0.18−0.02
UK0.030.280.380.220.460.370.150.150.320.21
Table 6. ANOVA results using index value as the criterion. Source: own processing.
PredictorSum of SquaresdfMean SquareFp
(Intercept)0.2610.263.080.080
Industry0.0030.000.000.999
Country35.89181.9923.280.000
Industry * Country40.41540.758.740.000
Error58.606840.09
Publisher’s Note: MDPI stays neutral with regard to jurisdictional claims in published maps and institutional affiliations.

