Article

Fabrication of a Sensitive and Stable NiO Uric Acid Biosensor Using Ag Nanowires and Reduced Graphene Oxide

1
Graduate School of Electronic Engineering, National Yunlin University of Science and Technology, Douliou 64002, Taiwan
2
Graduate School of Chemical and Materials Engineering, National Yunlin University of Science and Technology, Douliou 64002, Taiwan
*
Author to whom correspondence should be addressed.
Energies 2021, 14(15), 4696; https://doi.org/10.3390/en14154696
Submission received: 8 June 2021 / Revised: 28 July 2021 / Accepted: 29 July 2021 / Published: 3 August 2021

Abstract

:
How to detect uric acid is an important issue. For the purpose of preparing a potentiometric uric acid biosensor, this research used nickel oxide (NiO) as the sensing film to deposit it onto the substrate by radio frequency sputtering, then modified it with reduced graphene oxide (rGO) and silver (Ag) nanowires. Reduced graphene oxide (rGO) not only has excellent electrical conductivity, but also can make the surface of the film have a larger surface area, while AgNWs have also been proven to improve catalytic activity; hence, these two materials were chosen as sensor modifiers. Finally, the stability and the various characteristics of the uric acid biosensor were investigated using a voltage–time (V–T) system. The results showed that the AgNW–uricase/rGO/NiO uric acid biosensor has average sensitivity with 4.66 mV/(mg/L). In addition, the sensor has good stability.

1. Introduction

Biosensors are an analysis system or device composed of biosensing components, including an enzyme [1] and an antibody [2]. The device then converts chemical changes in the biological substances it comes into contact with—such as glucose [3], chloride ion concentrations [4], or uric acid [5]—into an electronic or optical signal. Ordinarily, there must also be some form of signal-amplifying device to enable measurement. According to the way in which the biosensor converts a signal, they can be divided into various types: potentiometric [6], amperometric [7], etc. This study proposes a potentiometric biosensor that relies on physical adsorption to immobilize an enzyme on the NiO-based sensor in order to measure uric acid concentrations in a solution. For the process of purine metabolism in the human body, the metabolite uric acid is produced. If human body is in an abnormal state—such as abnormal metabolism, gout, high blood sugar, or other symptoms—it may cause the body’s uric acid concentration to reach a high level. This result causes irreversible damage to the human body. Therefore, in order to prevent and diagnose uric acid early, the development of a sensor that can effectively detect uric acid from human urine or human blood is an important objective. In this research, in order to improve the performance of the sensor, we propose a potentiometric enzymatic biosensor that relies on physical adsorption to immobilize an enzyme on the NiO sensor in order to measure uric acid concentrations in a solution, and use modifiers to enhance the performance of the sensor.
NiO is nontoxic, and there are few studies on using NiO as a sensing film in the field of biosensors. NiO shows good research potential as a sensing film; it has good catalytic activity and is suitable for catalyzing the object under test. Among the many metal oxides, one of the important reasons why we chose NiO as the sensing film is that it has a very high isoelectric point (IEP = 10.7) [8]. The relatively strong electrostatic effect can make the modification, enzyme, and sensing film have a better and tighter combination [9]. Therefore, NiO has great advantages in sensors based on multiple structures. In addition, NiO has the characteristics of high stability, high electron transfer ability, and excellent oxygen ion conductivity in solutions with different pH values [10]. Therefore, in this study, we chose this film as the sensing film of this enzymatic sensor.
Silver nanomaterials have good electrocatalytic ability, and can also enhance the absorption of an enzyme, and promote electron transfer between any immobilized proteins and electrode surfaces [11]. However, the unique AgNWs are widely used to improve the performance of electrochemical biosensors.
Graphene is a unique material with high electron mobility, the lowest resistivity at room temperature, and a high surface area. In recent years, graphene has seen much application in the fields of sensors and energy, having been specially applied to surface plasmon resonance (SPR), and as a biomarker for proteins [12,13]. Based on the above, we figured out a way to take what we need that combined the advantages of the AgNWs and the rGO to create a biosensor. However, the strong π–π interactions of the graphene were due to van der Waals forces, which usually cause problems with regard to how to separate these layers, posing a considerable challenge [14]. Studies have pointed out that after GO is reduced to rGO, the remaining functional groups can enhance electrochemical activity, and because of the high density of edge planar defect sites [15,16], rGO can provide more active sites. On the other hand, the application of rGO has been proven to effectively enhance the redox reaction, and has good catalytic activity for uric acid sensors [17]. After this material is added to the sensor, the performance of the sensor can be effectively enhanced.

2. Materials and Methods

Nickel oxide (NiO), with a target of 99.95% purity, was bought from Shihsin Technology Corporation Limited (Taiwan), and was used as the material for the sensing film. The uricase was bought from Sigma-Aldrich Corporation Limited (United States). Uric acid was obtained from Sigma-Aldrich Corporation Limited (United States). Graphene oxide (GO) was bought from Uni-Onward Corporation Limited (Taiwan). Silver paste was bought from Yuan-Hong Instrument Corporation Limited (Taiwan), and was used as the conductive wire and reference electrode. Epoxy thermosetting polymer (product no. JA643) was obtained from Yuan-Hong Instrument Corporation Limited (Taiwan). Deionized water (DI) was used for preparation of aqueous solutions (resistivity = 18.4 MΩ cm−1).

2.1. Fabrication of the NiO Sensor

NiO exists in diversified oxidation states such as nickel trioxide (Ni2O3), nickelous oxide (NiO), etc. In practice, the NiO was often non-stoichiometric, which means that the Ni:O ratio was not exactly 1:1. In this study, the chemical composition of the NiO was 73.51 wt% nickel, and 24.49 wt% oxygen, as shown in Figure 1. In this study, the element ratio of Ni to O was similar to the study of NiO by Adinaveen et al. [18]. According to this reference, XRD analysis of the prepared NiO confirmed that the EDS based on this ratio was NiO, not Ni3O. Therefore, it can be determined that the thin film deposited by the R. F. sputtering system was NiO. The sensing area of the sensor was defined as 2.5 × 2.5 mm2. Thus, we used a radio frequency (RF) sputtering system to deposit the NiO film onto a flexible polyethylene terephthalate (PET) substrate. Furthermore, we established the best RF sputtering parameters for the NiO, which were 3 mtorr of the deposition pressure at 50 W power for 50 min. Finally, the NiO sensor was completed. Figure 2 shows the field emission scanning electron microscope (FE-SEM) images of the cross-section of the NiO film, which had a thickness of about 133.1 nm. According to the XRD pattern in Figure 3, it can be seen that the crystal plane growth directions of (111), (200), and (222) corresponded to the angles of 38.81°, 43.61°, and 79.73°, respectively. After comparison with the with standard cards (JCPDS, No. 04-0835), the angle position of the XRD pattern of the deposited NiO film is consistent with the value of the standard card, which can be verified, and has a face-centered cubic (FCC) crystalline structure [19,20]. On the other hand, the XPS full spectrum analysis was as shown in Figure 4a. In Figure 4b, the XPS pattern shows the main peak of the Ni 2p3/2 at 853.6 eV and 859.8 eV, and the main peak of the Ni 2p1/2 at 871.8 eV and 878.2 eV. Droueta et al. [21] pointed out that, between 859 eV and 860 eV, the binding energy corresponded to Ni2+, and the peak at this position is called the satellite line [22]. The peaks of the Ni 2p1 were at2 871 eV to 878 eV. In Figure 4c, the main peak of O1s is at 528.4 eV and 530.0 eV. The existence of adsorbed hydroxyl groups or O2− vacancies confirms a combination of Ni and O bonding, and the results are shown in Figure 4 [23]. According to the XPS pattern of the NiO, the ratio of the Ni to O in NiO film is about 50.97 wt% to 49.03 wt%. After simplification, the ratio of the Ni to O is approximately 1:1.03, which confirmed the ratio of the nickel tooxygen in NiO.

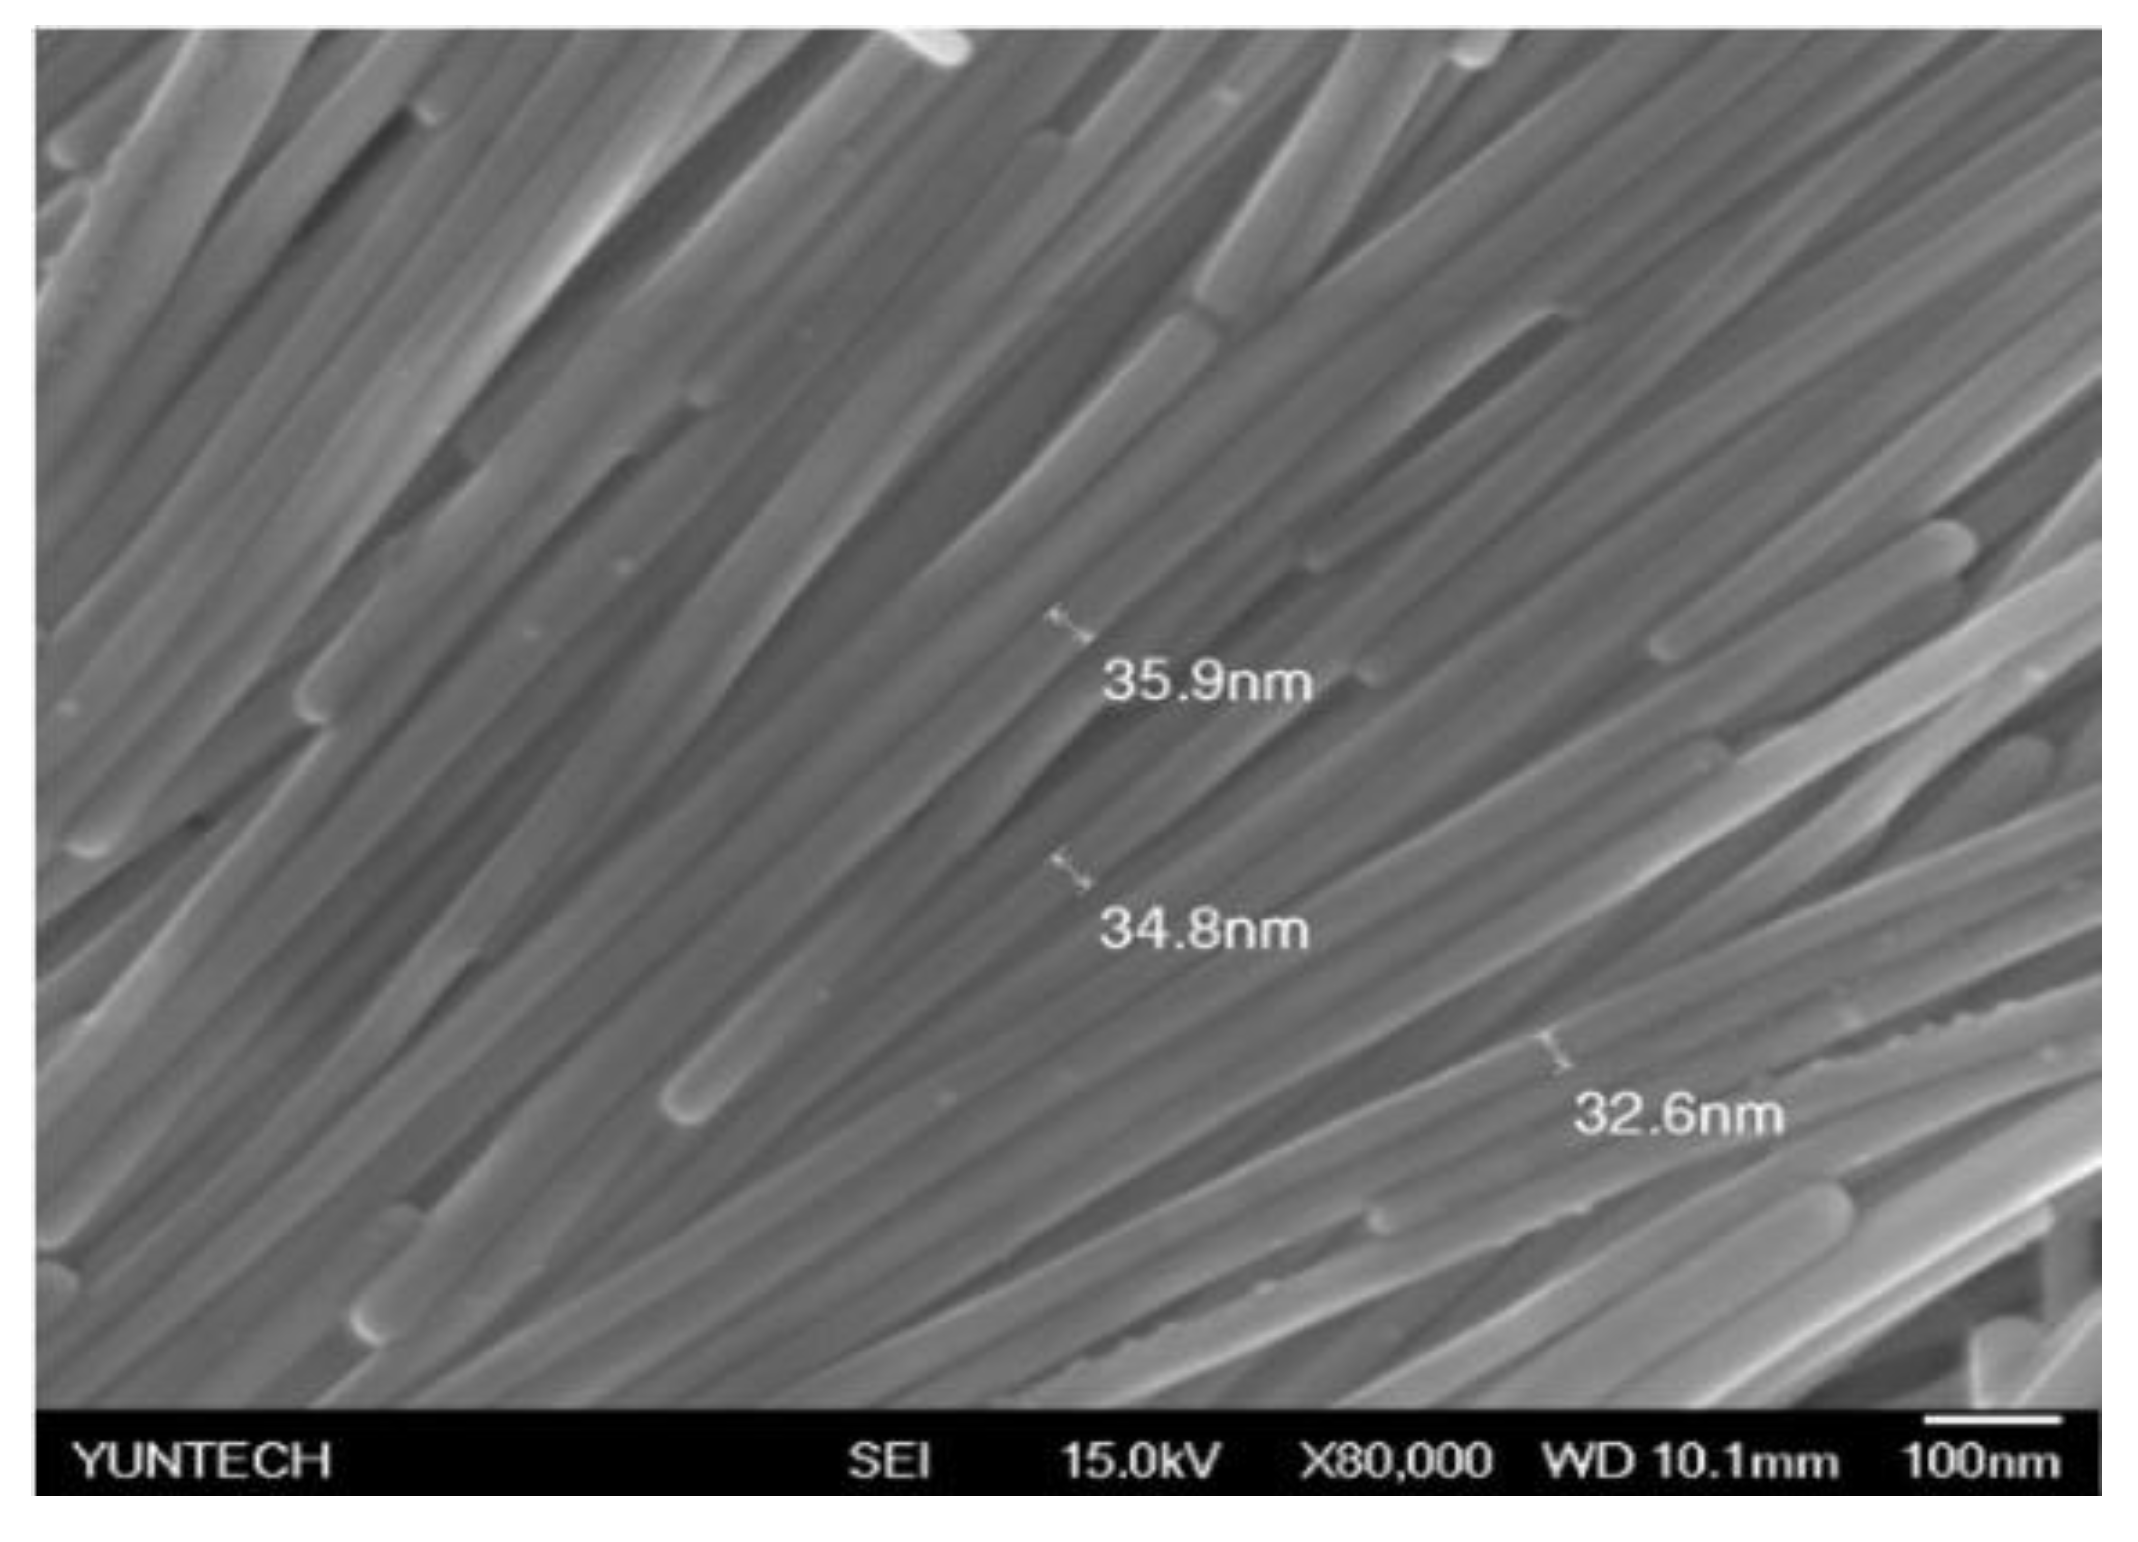
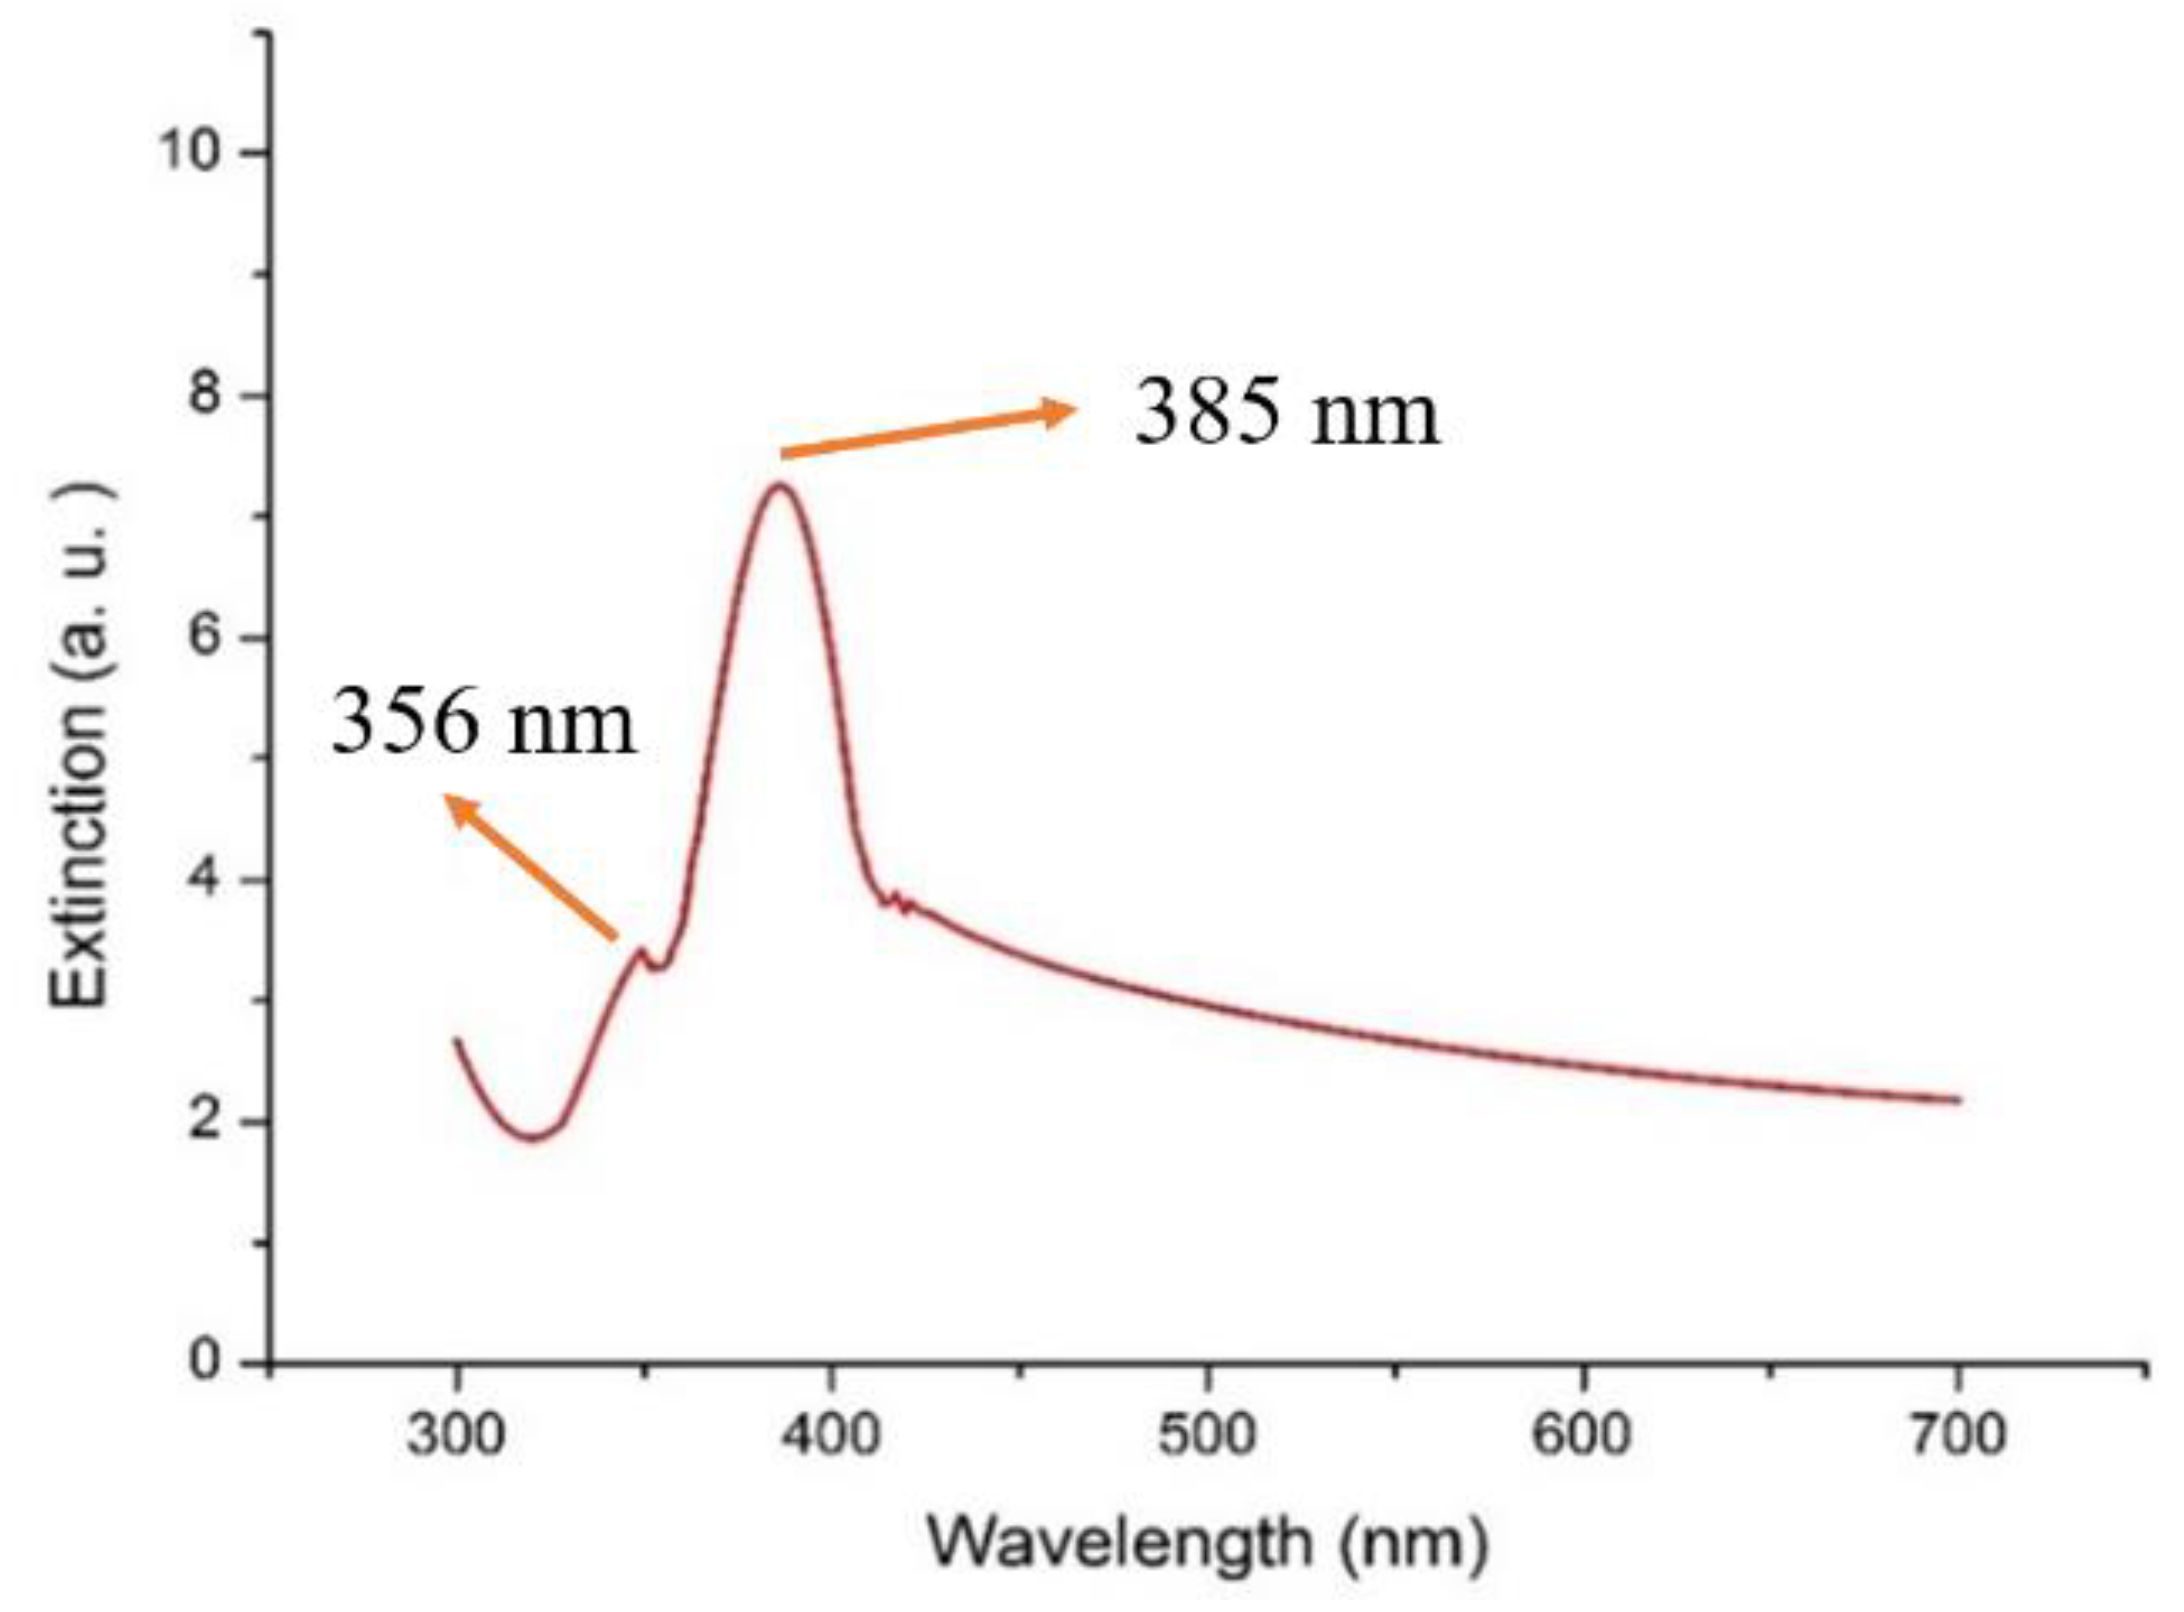
2.2. Preparation of the AgNWs Solution

There are many methods of producing the AgNWs; we used a general method. The AgNWs were produced using the polyol method, as follows [24]:
1. First, 0.5 g polyvinylpyrrolidone (PVP) powder and 0.375 mg sodium chloride (NaCl) crystal were added to 20 mL ethylene glycol (EG), forming a PVP–EG solution, which was heated to 180 °C and stirred until completely dissolved using a magnetic stirrer hotplate;
2. Next, 0.109 g of silver nitrate (AgNO3) crystal was added to 5 mL of the EG and stirred for 10 min, which was marked as Ag–EG solution;
3. Ag–EG solution was titrated to PVP–EG solution at a rate of 0.8 mL/min for 4 min. Next, it was continuously heated and stirred for 20 min. Thus, the AgNW solution was completed;
4. The AgNW solution was cleaned with deionized (DI) water and centrifuged for 10 min, before being washed repeatedly until it turned clear.
Finally, the AgNWs were successfully produced by the polyol method. In order to confirm the existence of the AgNWs, we used FE-SEM and the UV–Vis spectrum to establish the features of the material. Ag nanostructures, due to their different shapes and sizes, exhibit different wavelengths on the surface plasmon resonance (SPR) band. We measured the Ag nanowire solutions by using the UV–Vis spectrum. Figure 5 shows the morphology of the AgNWs. Figure 6 shows the optical extinction spectra of the Ag colloid solutions using PVP (molecular weight: 1,300,000). According to the experimental results, the AgNWs show two resonance peaks at 356 nm and 385 nm, which are the optical characteristics of the AgNWs [25].

2.3. Characteristics of the GO and rGO

Because the PET substrate cannot sustain high temperatures, this experiment used a low-temperature reduction method to reduce the GO to rGO. The sensing area of the NiO film-based sensor was titrated with the 3 μL, 0.3 wt% GO solution, and the sensor was placed in an oven at 125 °C for 12 h to dry out entirely [26]. Figure 7a shows the Raman spectrum of the GO, and we discovered the 2D, G, and D peaks of the rGO, as shown in Figure 7. The 2D band represented the stacking order by graphene; the G band was a characteristic feature of the graphitic layers, and corresponded to the tangential vibration of the carbon atoms; and the D band was related to the disorders of carbon or defects in the graphene structures [27]. Although both of the Raman spectra obtained from the GO and rGO specimens showed similarity in form, the position and intensity of different Raman bands were changed after the reduction processes, with the distinctions in the reduced features being based on a different reduction method [28]. Figure 8 shows the different surface morphology of the GO and rGO via SEM images. We can clearly see that the GO of the restoration step has fewer stacks, which means that the GO was successfully reduced to rGO.

2.4. Modified Electrode Based on NiO Film

To begin with, 2 μL of rGO solution was titrated onto the sensing area of the sensor, and then the sensor was dried for 6 h at room temperature. Secondly, 2 μL of uricase solution was titrated onto the sensing area of the rGO/NiO based-film, and was dried at 4 °C for 8 h in a fridge. Then, 1 μL of polydimethylsiloxane (PDMS) solution was titrated onto the uricase–rGO/NiO film [29]. The PDMS was a diffusion-limiting film, and it could inhibit the permeation of the hydrogen peroxide [30]. Furthermore, 1 μL of Nafion was titrated onto the uricase–rGO/NiO film, and the sensor was placed in the fridge at 4 °C for 6 h to dry out completely. The Nafion film could serve as a protective layer on the electrode’s surface and promote the transfer of electrons [31]. Finally, the uric acid biosensor was successfully completed. However, while fabrication of the AgNW–uricase/rGO/NiO biosensor was largely in accordance with that of the uricase–rGO/NiO film, the difference was that 2 μL of the AgNWs was deposited onto an rGO layer. Both rGO and AgNWs are nanomaterials; as such, they have similar advantages—those nanomaterials can effectively increase the surface area and optimize the electron transport ability. However, rGO has the characteristic of increasing the catalytic activity. Using the rGO can ensure that the enzymatic sensor has a higher sensitivity [32,33].

3. Results

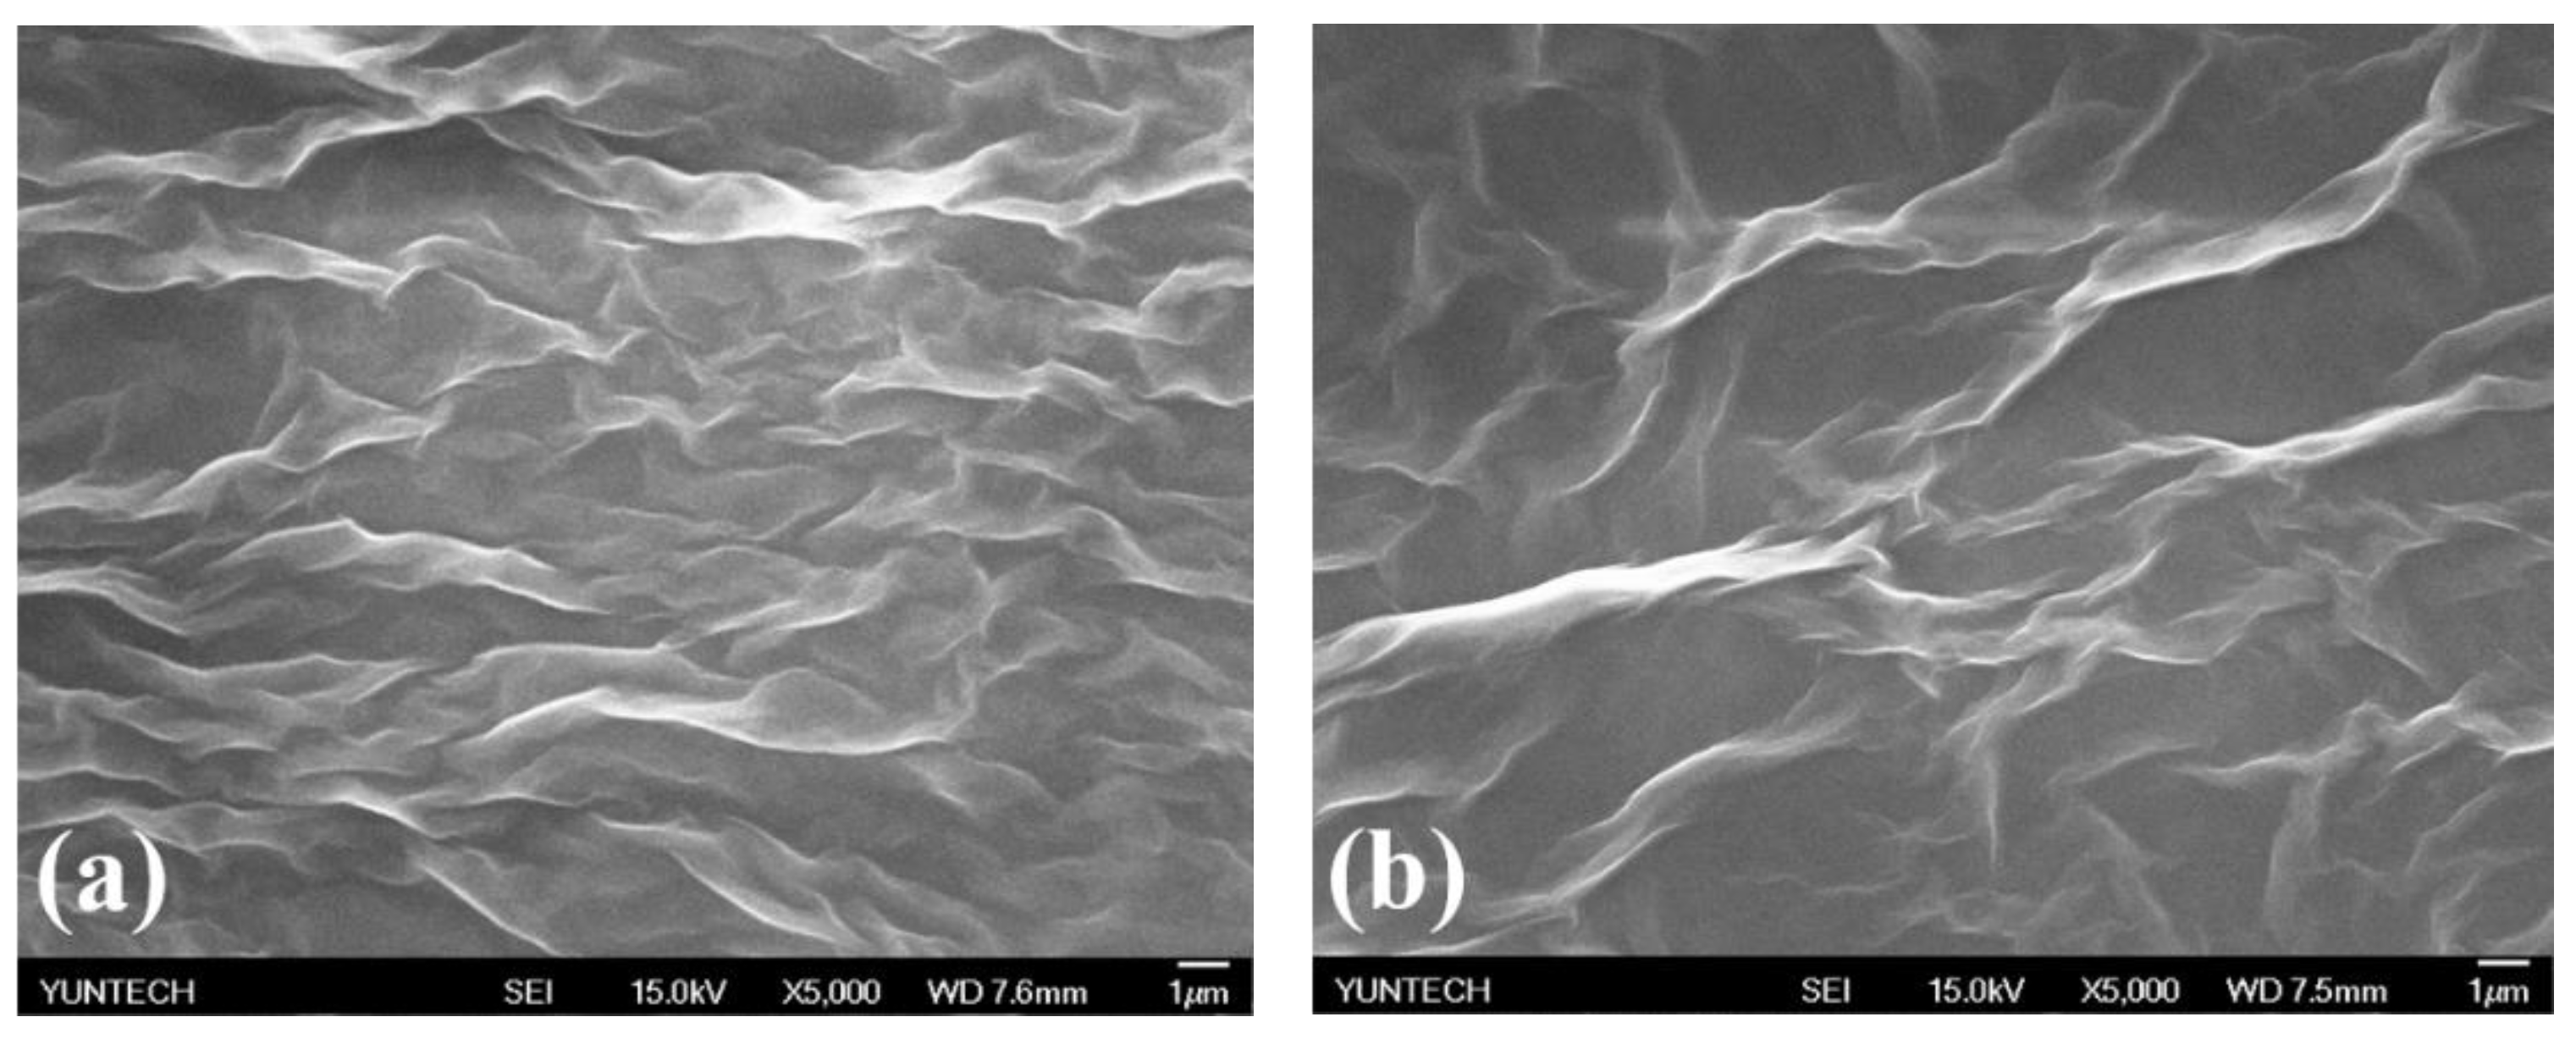
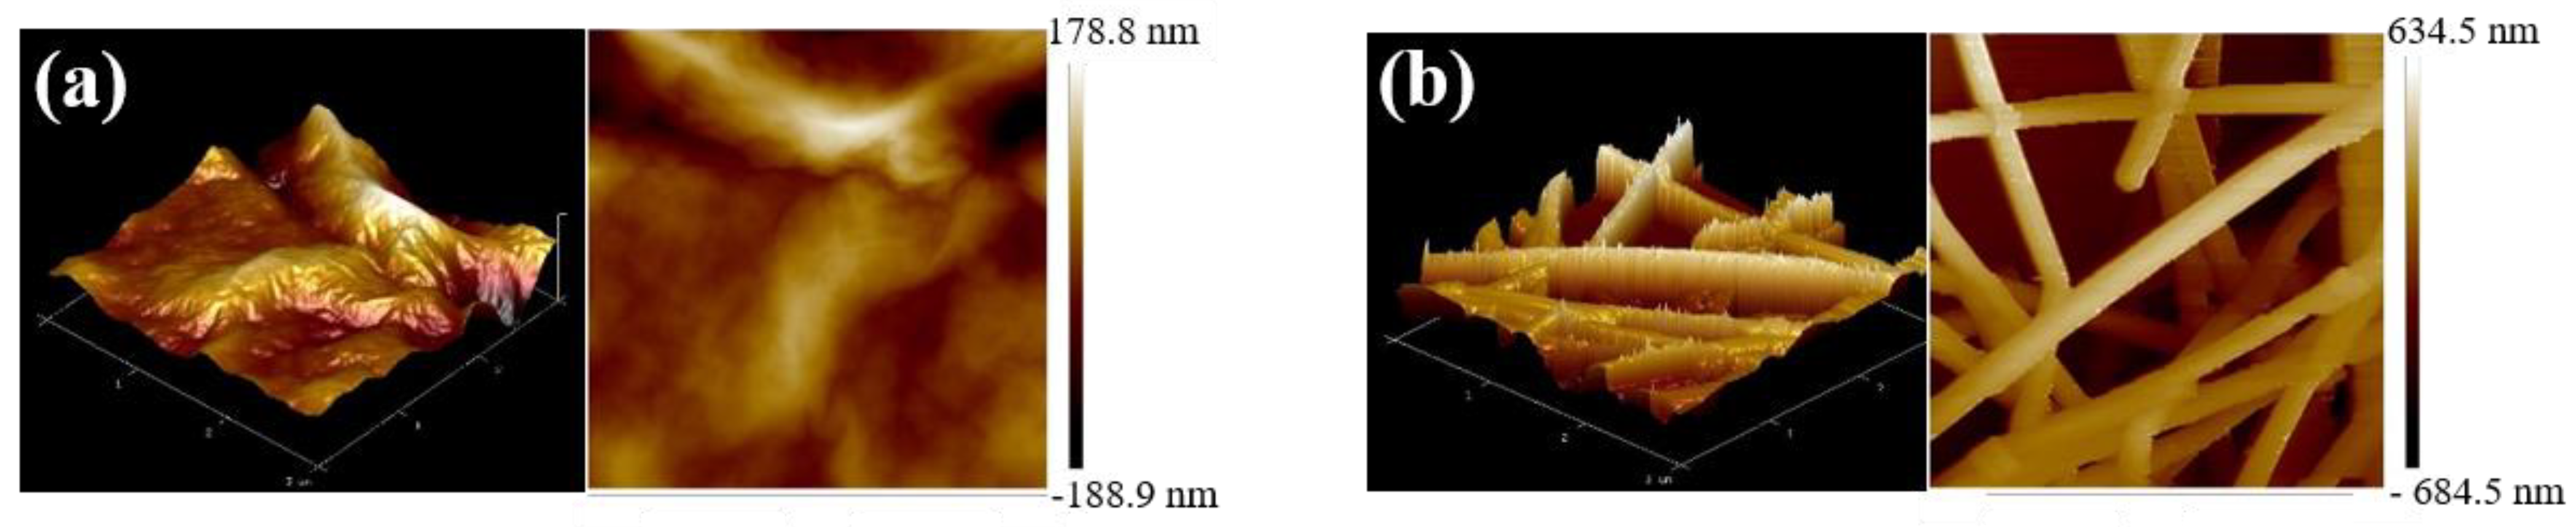
3.1. Roughness Analysis of the Sensing Films

To investigate the roughness of the surface of the films, we used a scanning probe microscope (SPM) and an atomic force microscope (AFM) to analyze the film [34] (scanning area: 3 µm × 3 µm). Figure 9a,b shows the high-resolution image and 3D model for the rGO/NiO and AgNW/rGO/NiO film, respectively. Due to the films stacking layer by layer in this study, the roughness of the surface was very important, as it could determine how many enzymes would attach to the sensing film. For the roughness average (Ra) and root mean square of the roughness (Rq), these two conditions are very important to analyze, as shown in Table 1. Ra represents the roughness of surfaces, while Rq describes the standard deviation of the contour heights, and permits the surface roughness to be confirmed by statistical methods [35]. Ra for the rGO/NiO and the AgNW/rGO/NiO was 33.6 nm and 203.0 nm, respectively; Rq for the rGO/NiO and the AgNW/rGO/NiO was 44.8 nm and 234.0 nm, respectively. The results showed that Ra and Rq significantly increased because of the surface being covered with AgNWs, which improved the roughness and specific surface area, thus enhancing the adsorptive capacity of the enzymes. These results show that the AgNWs not only increased the roughness, but also increased the adsorptive capacity of the enzymes.

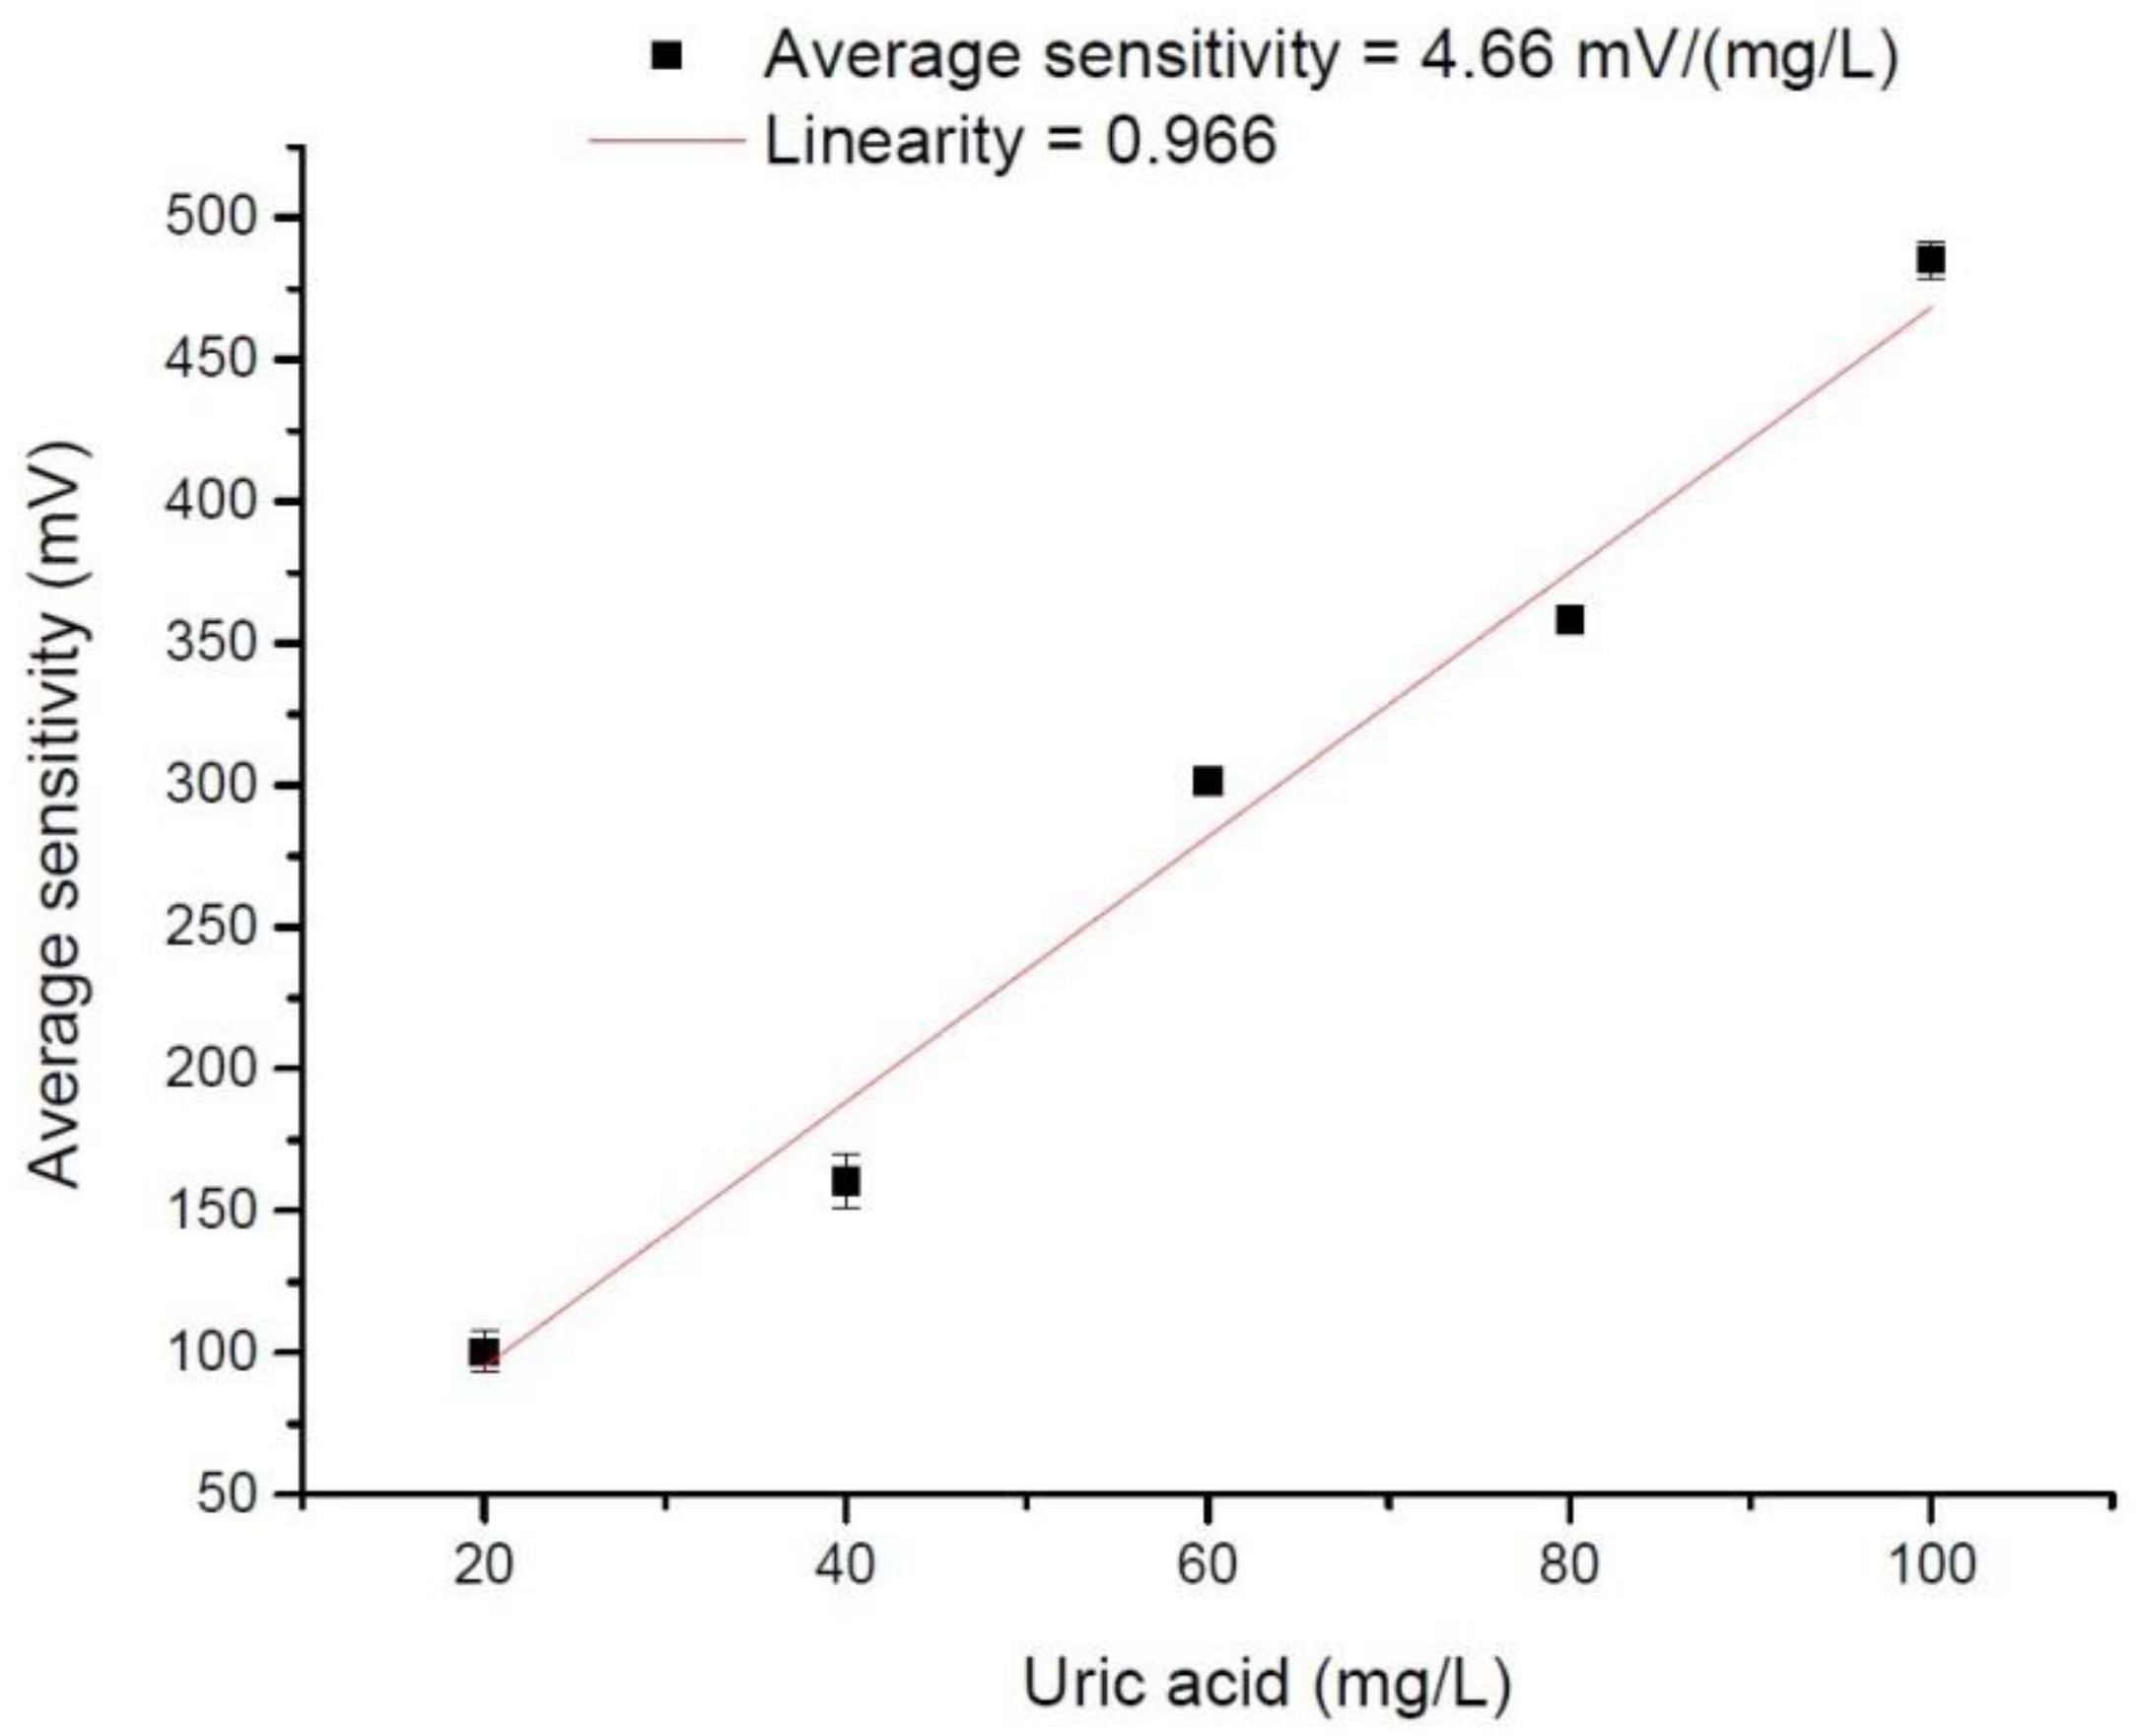
3.2. Sensing Performance of Uricase/rGO/NiO and AgNW–Uricase/rGO/NiO Uric Acid Biosensors

The sensing performances of the uricase/rGO/NiO and AgNW–uricase/rGO/NiO uric acid biosensors are measured by the voltage–time (V–T) system, which is as shown in Figure S1. The linearity and average sensitivity of the uric acid biosensor for each sample were measured 10 times. Figure 10 shows the average sensitivity for the uricase/rGO/NiO-based sensor, which was 3.01 mV/(mg/L). Figure 11 shows the average sensitivity for the AgNW–uricase/rGO/NiO-based sensor, which was 4.66 mV/(mg/L). The response voltage of the AgNW–uricase/rGO/NiO film remained constant at 20–40 mg/L in Figure 11; however, at 20–40 mg/L, some difference could still be recognized under the multiple measurements. Therefore, we could integrate the data from the response voltage and multiple measurements to recognize the concentration of 20 mg/L or 40 mg/L. After the electrode was modified by AgNWs, which had high surface area and good electrical conductivity, the impedance could be decreased, and the electron transfer ability improved. Studies have pointed out that although AgNWs may emit Ag+ [36], which has potential toxic effects on the human body, this is not associated with acute toxicity to human cells. Only long-term exposure to AgNWs will have an impact on cell viability [37]. In this study, the uric acid biosensor we prepared was not an invasive sensor. When using the sensor, a solution with uric acid is dropped onto the sensor to detect the uric acid concentration. The sensor does not easily come into contact with the human body, so it has little effect on the sensor. The reason why AgNWs were chosen is because they can improve the catalytic activity and make the sensor more efficient. AgNWs have also been proven to enhance the catalysis of H2O2, and the use of the silver nanowires and rGO to modify the sensor at the same time has been proven to produce a synergistic effect and a better redox reaction. AgNWs and rGO are mutually exclusive. There will be covalent bonds between them, which can reduce the phenomenon of random attachment of the AgNWs, thereby creating a porous structure and a continuous conductive path stacked by AgNWs, and promoting the reaction with the molecules of the analyte [38].

3.3. Interference Effect of the Uric Acid Biosensor

To investigate the stability of the biosensor, some widespread interfering substances in human blood might cause the biosensor to become unstable, which should be examined—for example, glucose, lactate (LA), urea, dopamine (DA), and ascorbic acid (AA). The above-selected concentrations of the substances can be found in normal human blood. In this study, we prepared the concentrations of interfering substances in human blood, as shown in Figure 12. In this experiment, the main discussion was the selectivity of the sensor, and we used urease as a modifier. Therefore, when the sensor is in contact with various interfering substances, studies have pointed out that uricase catalyzes UA into hydrogen peroxide, and the analyte only reacts electrochemically with UA [39]. This phenomenon occurs because urease has excellent selectivity for UA. As shown in Figure 12, these substances were added to the test solutions, which have no significant variation for the NiO uric acid biosensor. However, when uric acid is added to the test solutions, the response voltage clearly shows a high improvement. Thus, the NiO uric acid biosensor has an outstanding anti-interference capability.

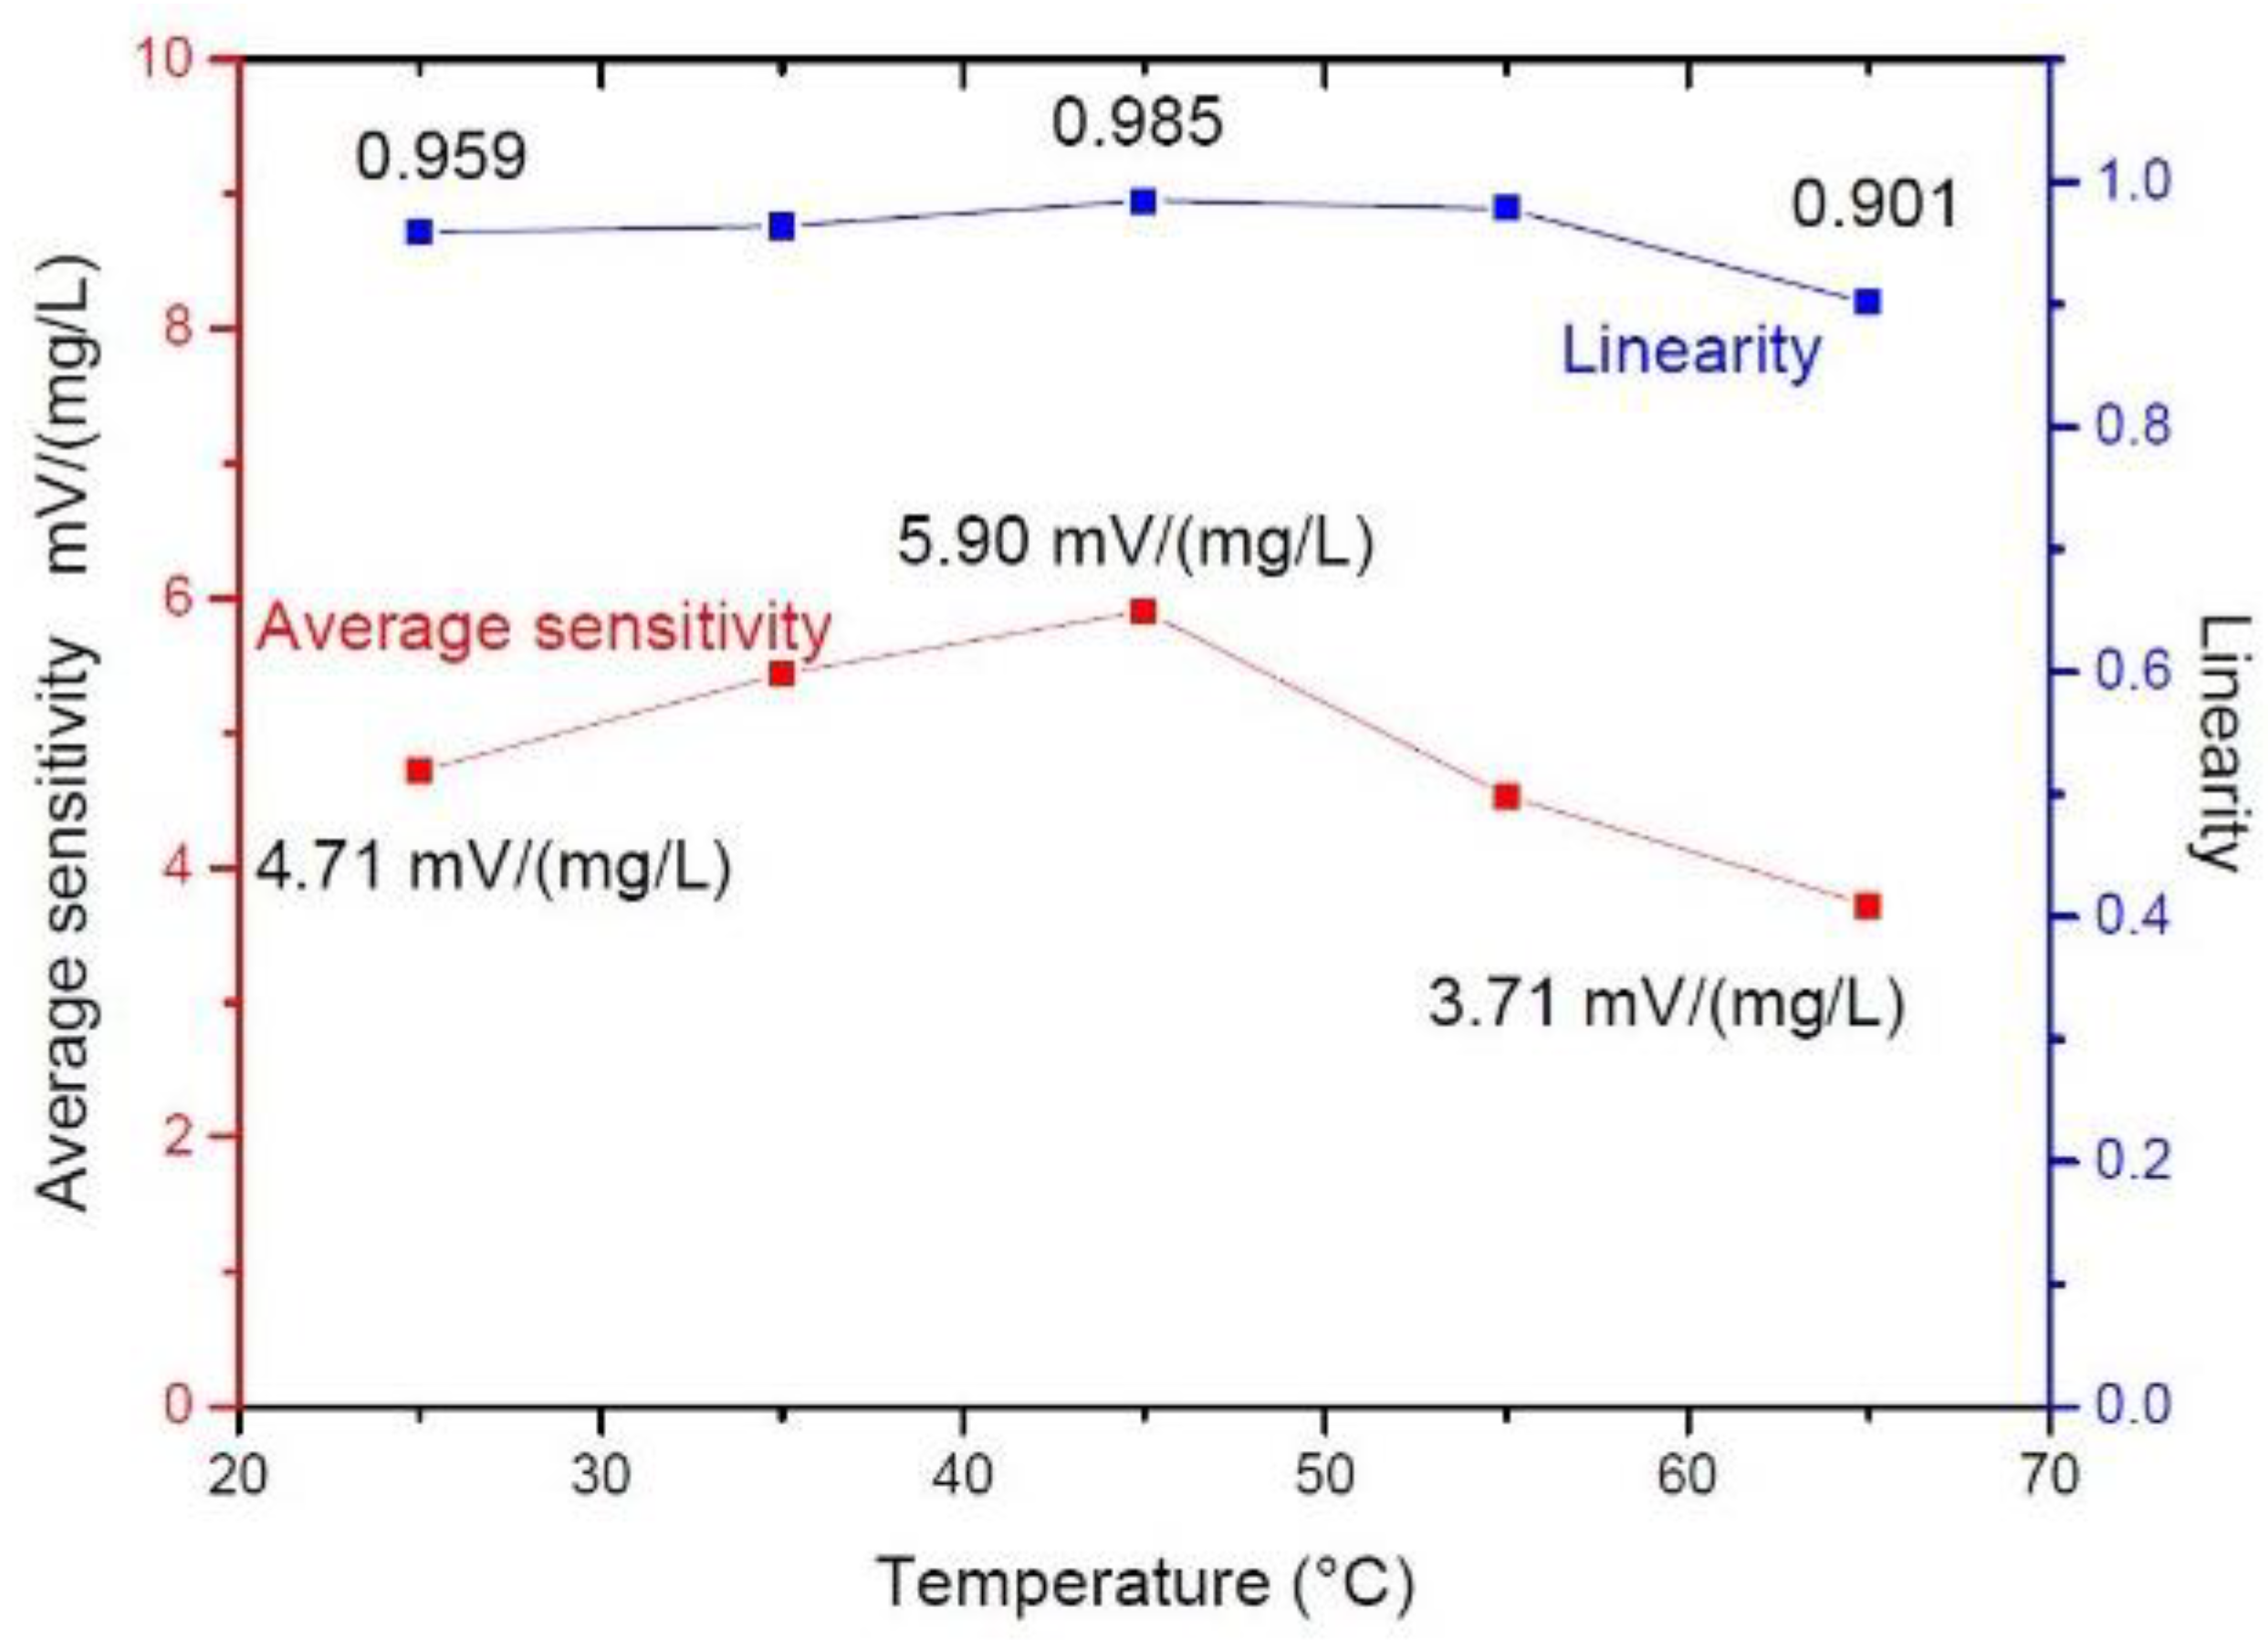
3.4. Temperature Effect of the Uric Acid Biosensor

The potentiometric uric acid biosensor deduces its sensing mechanism according to the Nernst equation [40]. Thus, in this study, we investigated the effect of temperature, which was determined via Equation (1), so as to establish the temperature variety of the sensitivity:
E = E 0 ± ( RT nF ) ln a 1
where E is the film potential, E0 is the standard potential for a1 = 1 M, R is the general gas constant, T is the absolute temperature in degrees Kelvin, n is the total number of charges on the ion, F is the Faraday constant, and a1 is the activity of the analyte [41]. After uric acid was subjected to enzymatic catalyzation by uricase, the allantoin and hydrogen peroxide were generated by the enzymatic reaction shown below in Equation (2):
Uric   acid + 2 H 2 O + O 2   Uricase   allantoin + CO 2 + H 2 O 2
The mechanism of the potentiometric biosensor is to measure the accumulation of charge potential on the working electrodes and compare it with the reference electrodes [42]. Hence, the uric acid biosensor was measured through the change in concentration of the hydrogen peroxide. However, uric acid was oxidized as easily as hydrogen peroxide, so that the hydrogen peroxide was converted to oxygen and H+ by the redox reaction [43], as shown below in Equation (3):
H 2 O 2       2 H + + O 2 + 2 e
Therefore, the H+ concentration of this reaction will also change under very small changes in film conditions; accordingly the potential response voltages were produced to achieve the detection of the uric acid. The temperature effect of the uric acid biosensor is shown in Figure 13. The operating temperature of the uric acid biosensor is in the range of 5–65 °C. When at 45 °C, the uric acid biosensor displayed high linearity and high average sensitivity—0.985 and 59.00 mV/(mg/L), respectively—due to uricase having the best biological activity for the range [44,45]. Table 2 showed the average sensitivity and linearity of the AgNW–uricase/rGO/NiO uric acid biosensor in the temperature range of 25–65 °C.

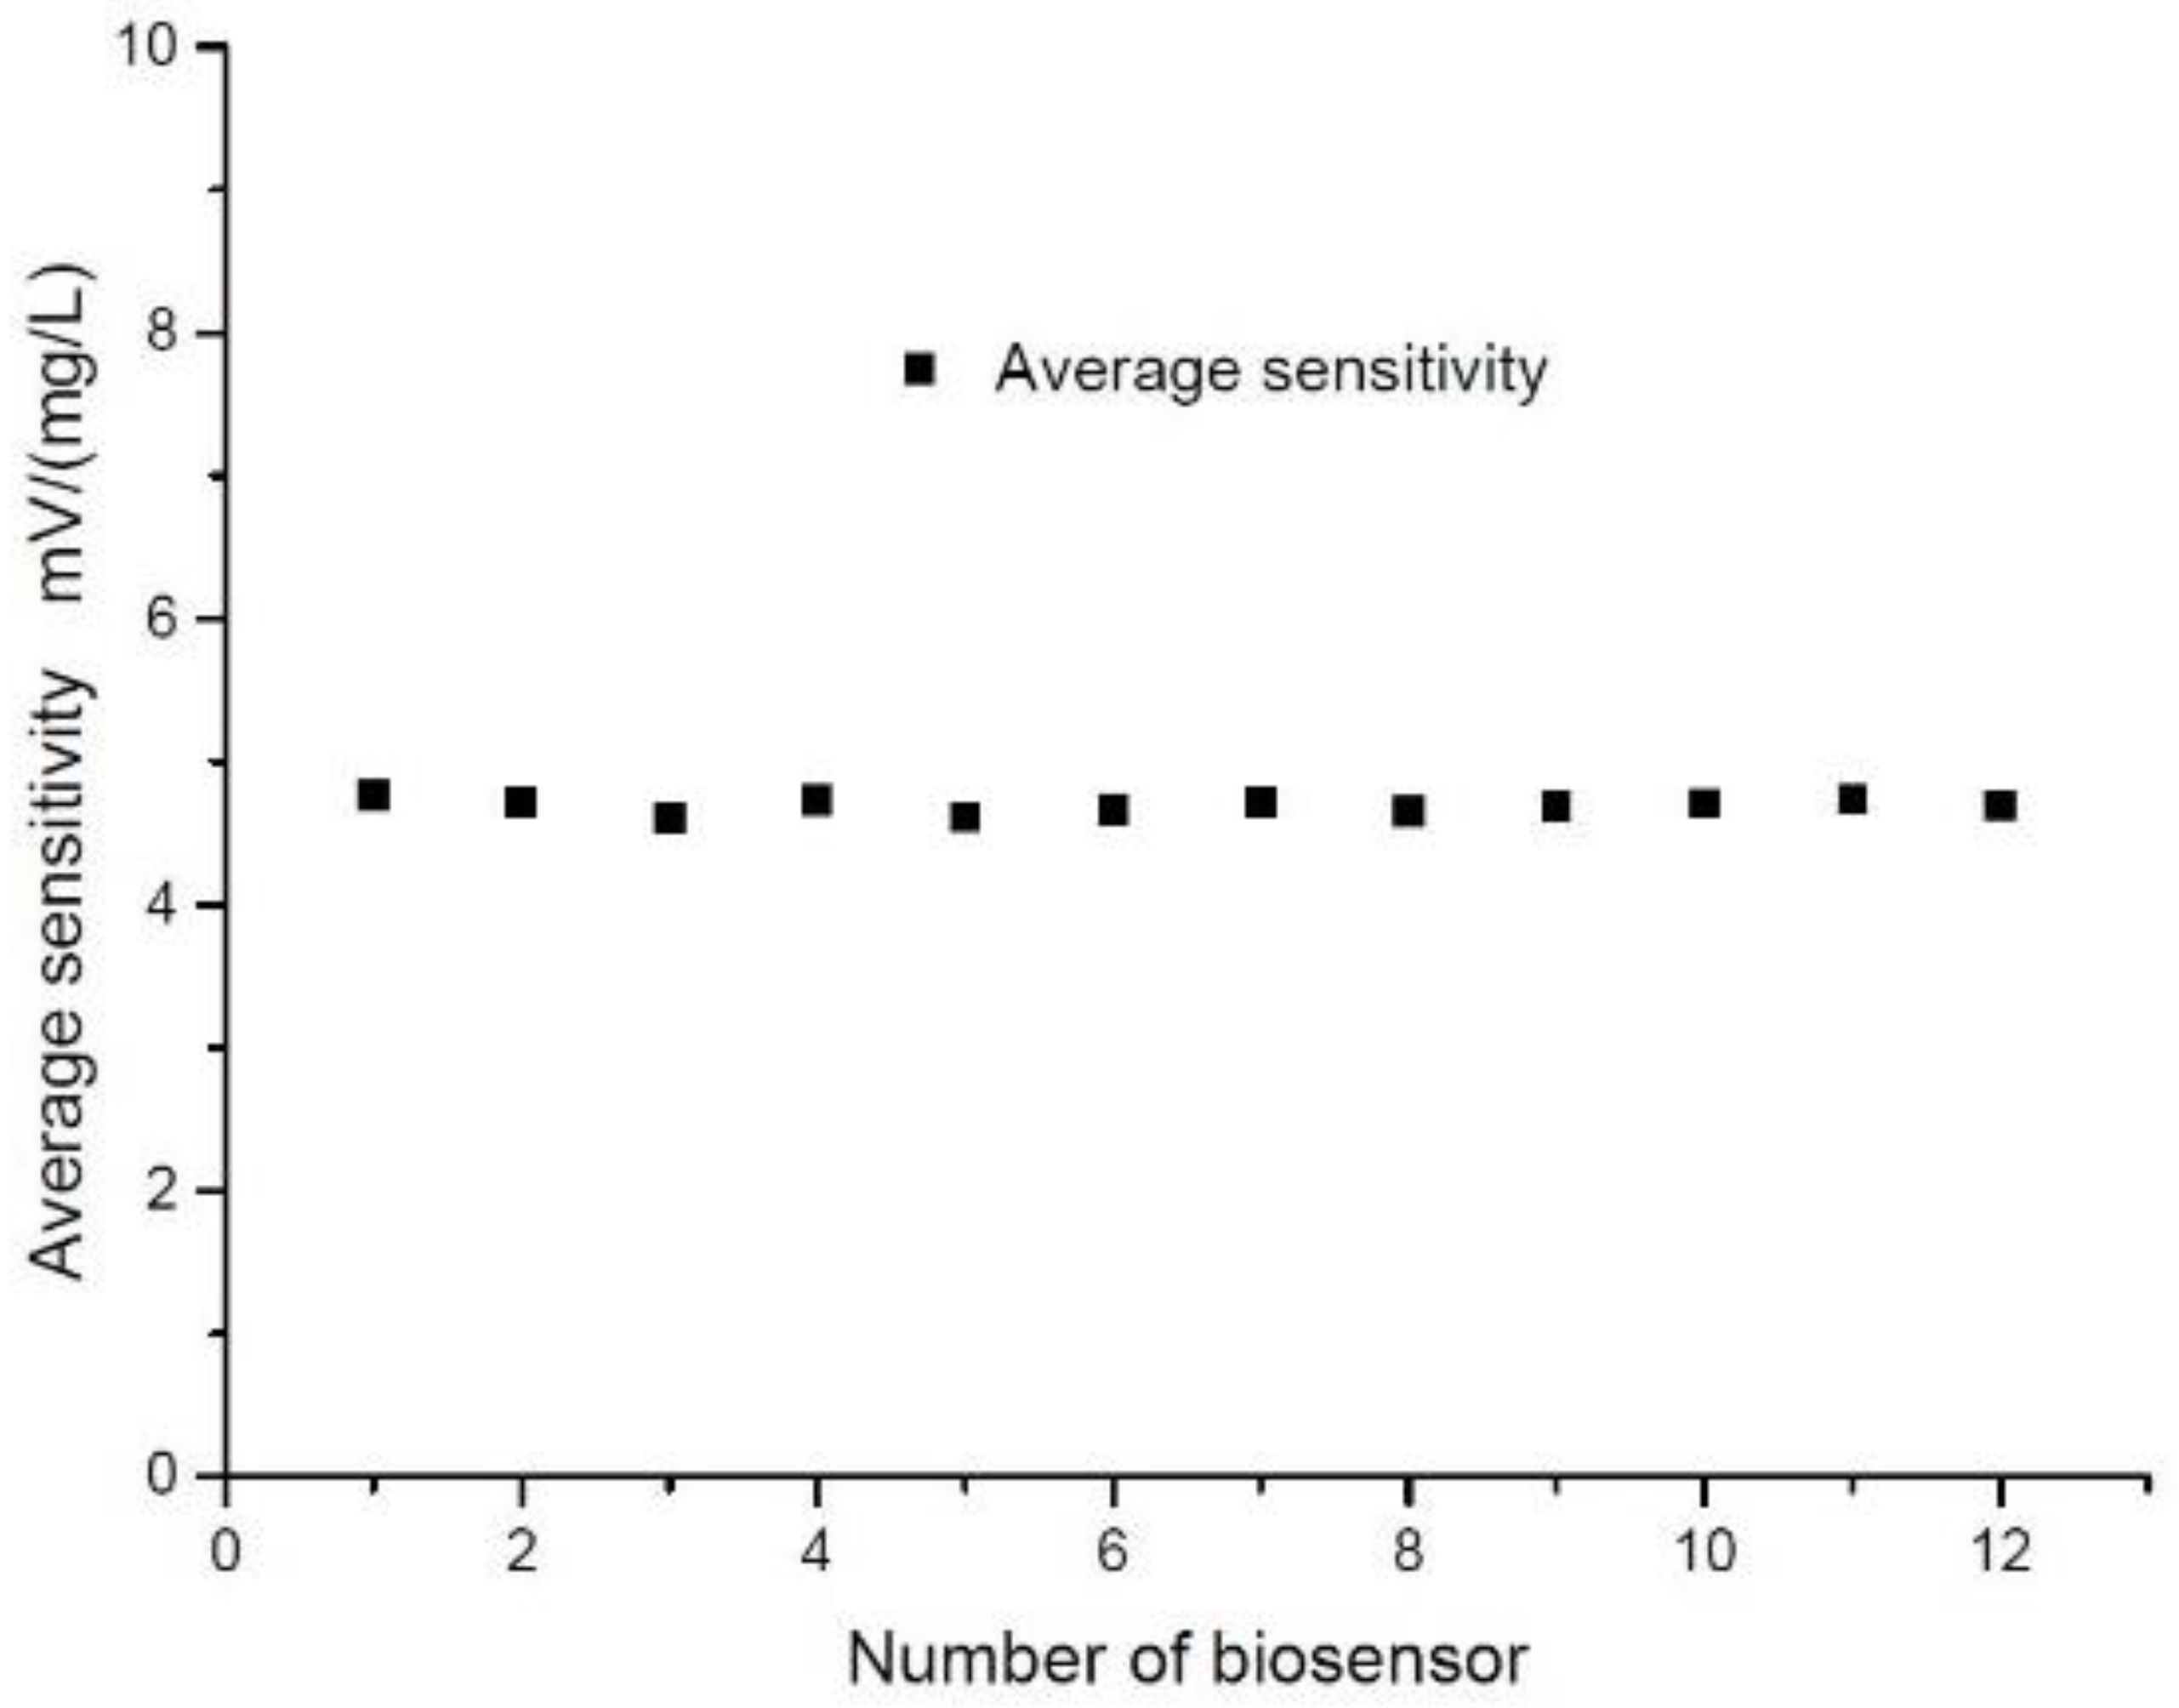
3.5. Stability of the Uric Acid Biosensor

For the purpose of investigating the stability of the uric acid biosensor, we carried out a reproducibility test in this study. Figure 14 and Table 3 show the detailed average sensitivity of the uric acid biosensor based on AgNW–uricase/rGO/NiO films. In this work, the reproducibility test measured the average sensitivity of each biosensor—from a total of 12 biosensors—which was 4.68 mV/(mg/L), and the standard deviation (RSD) was ±0.04 mV/(mg/L). It can be seen that the uric acid biosensor based on AgNW–uricase/rGO/NiO films showed the highest reproducibility in this study, likely because the silver materials have a high specific surface area and suitable materials for covalent bonding with enzymes [46].

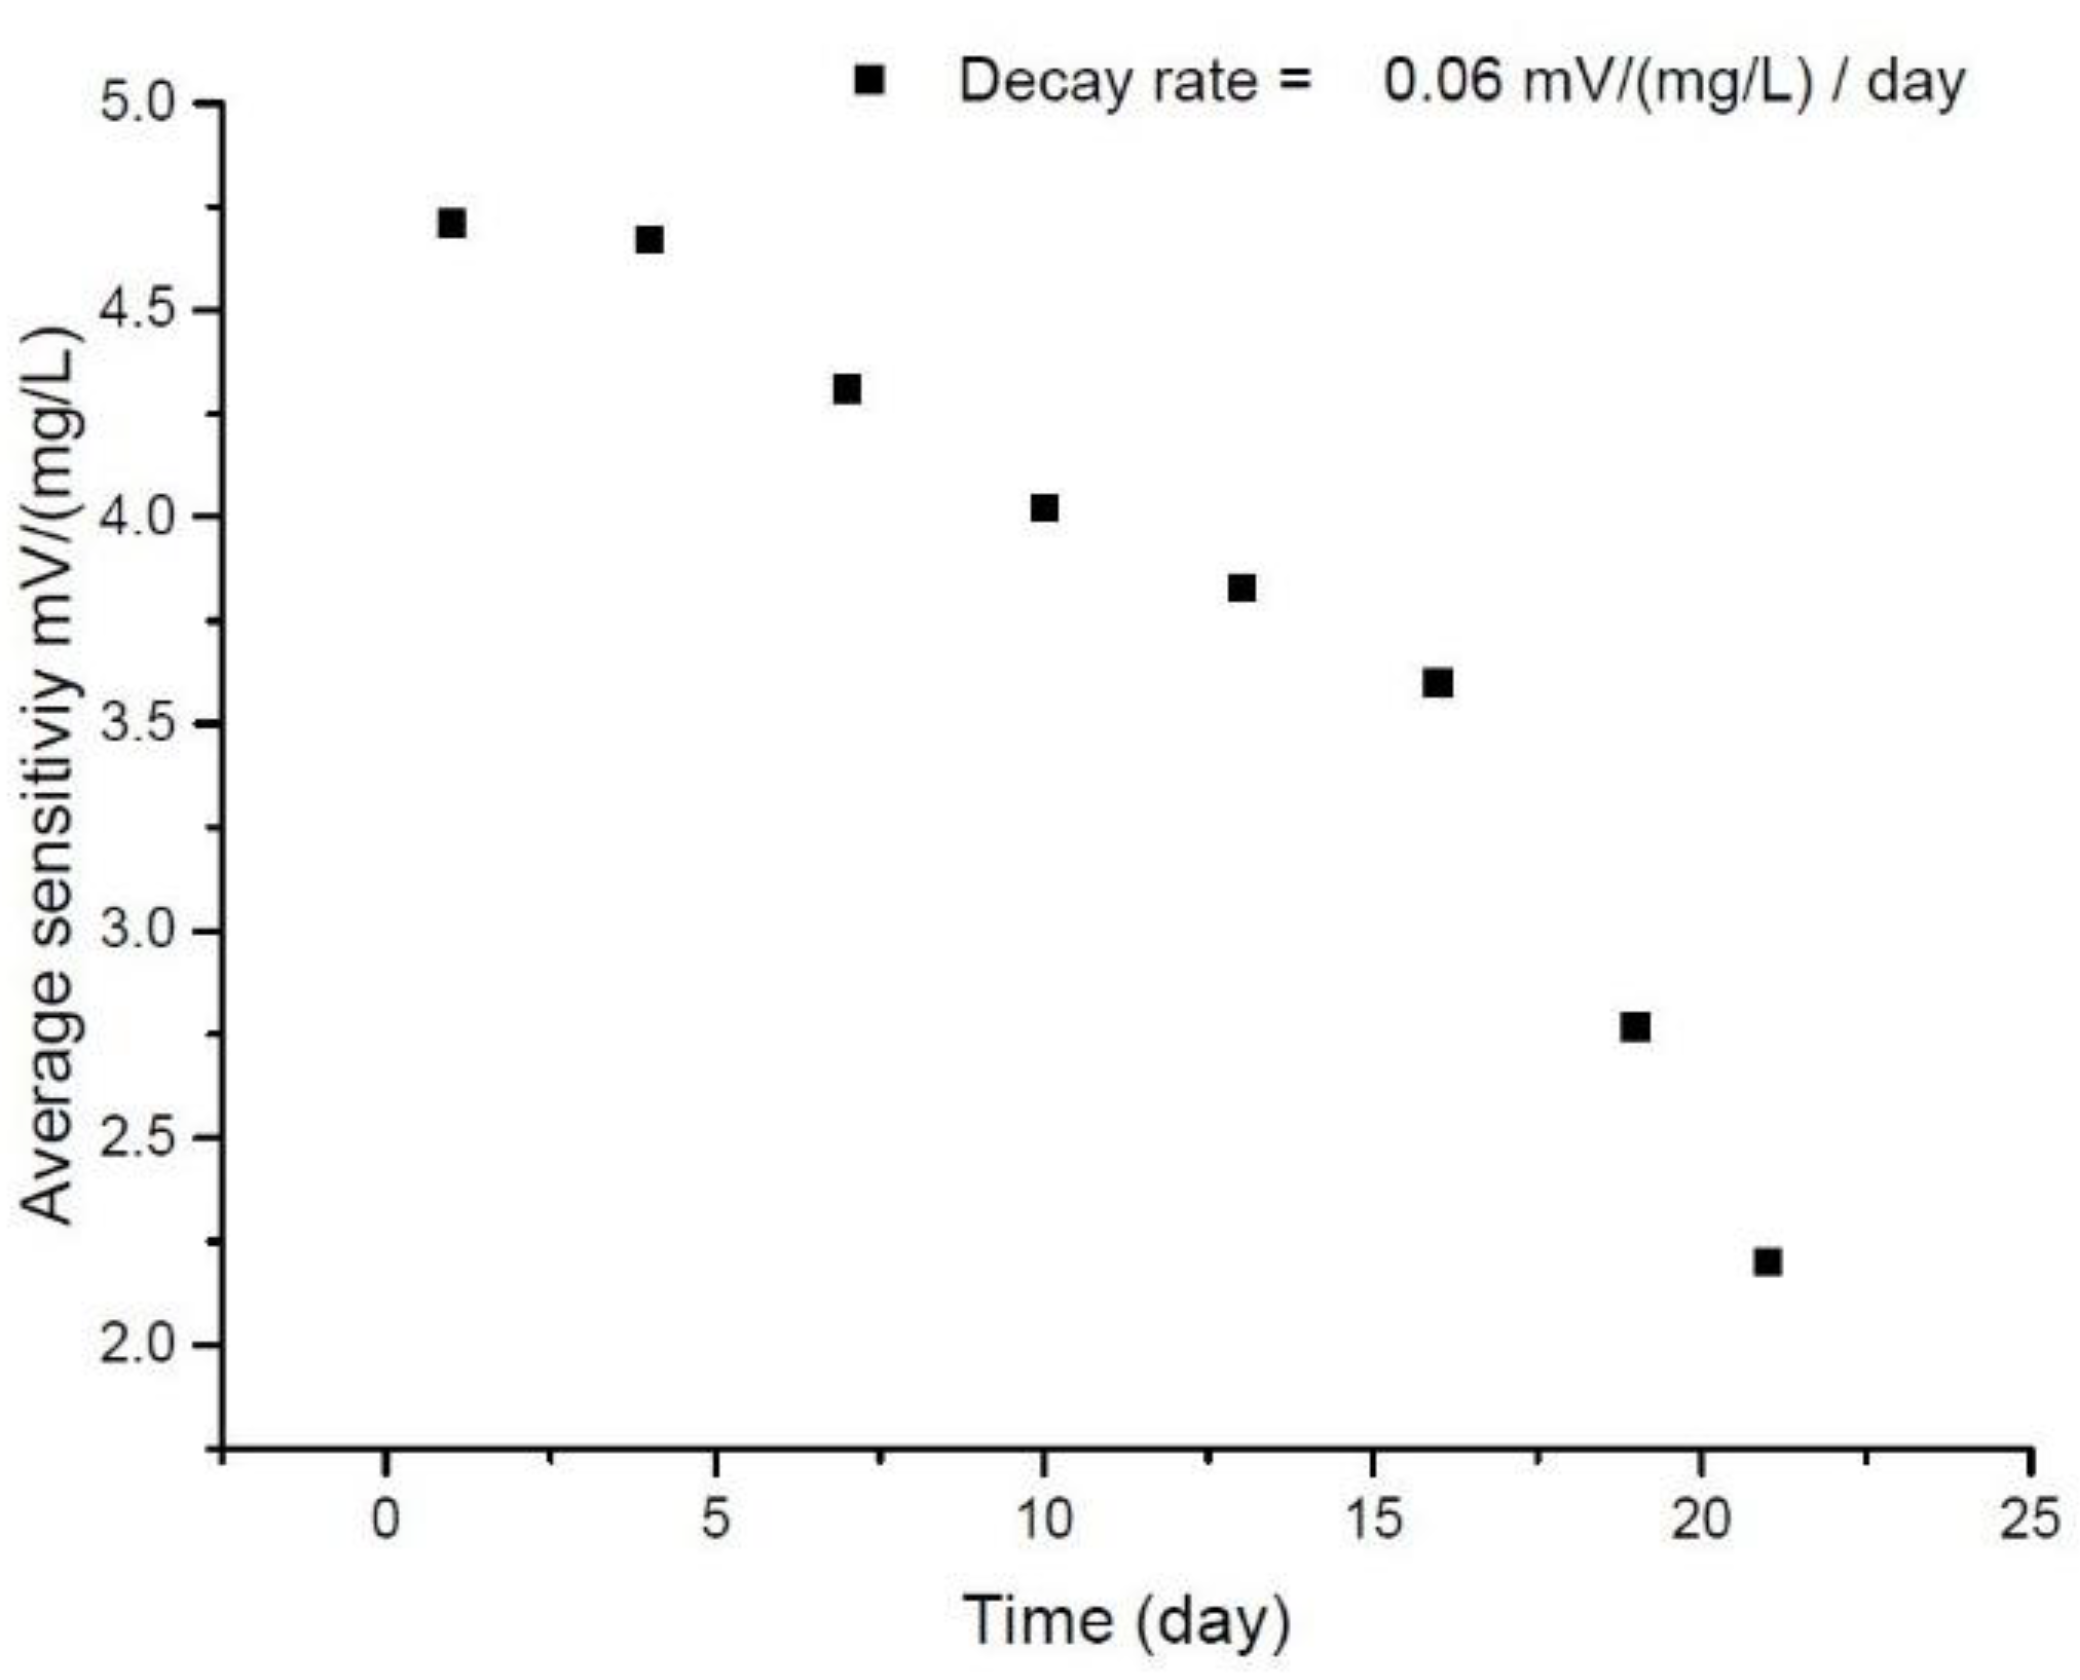
3.6. Lifetime of the AgNW–Uricase/rGO/NiO Uric Acid Biosensor

In order to verify the long-term stability of the sensor, we also studied its life cycle. When the average sensitivity of the sensor drops below 90 % [47], we define this time interval as the lifetime of the sensor. To confirm the change in the average sensitivity of the sensor during this time, we measured the average sensitivity of the sensor every three days. At other times, there were no measurements. We stored the sensor at 4 °C, and measured it every 3 days. The decay rate can be calculated from the response–voltage curve in Figure 15; its value is 0.06 mV/(mg/L), and the lifetime of the sensor is approximately 8 days. The average sensitivity of the sensor, which depends on the different storage time, is shown in Table 4. The immobilization of enzymes may change the activity, specificity, or selectivity of the sensor. In many cases, when measuring immobilized enzymes, a decrease in enzyme properties can be observed. The reason for this is the interaction between the carrier and the enzyme, which leads to the deformation of the enzyme which, in turn, affects the activity of the immobilized enzyme [48]. Therefore, we can observe a significant decrease in the average sensitivity.

3.7. Detection Limit of the AgNW–Uricase/rGO/NiO Uric Acid Biosensor

The LOD is calculated by Equation (4), as shown below:
C LOD = 3 σ S 0 + c
where σ is the standard deviation of immersion in pure PBS solution, S0 is the sensing degree of the sensor, and C is the response voltage corresponding to the sensor immersed in pure PBS. The AgNW–uricase/rGO/NiO uric acid biosensor has an LOD of 0.68 (mg/L); we found that the sensor based on this structure had a smaller detection limit than other uric acid sensors, which means that the it could be expected to accurately detect low concentrations of uric acid.

3.8. Discussion

Table 5 summarizes the reported comparisons of the various types of biosensor. In Table 5, all of the sensors are potentiometric sensors. Kuo et al. [49] researched a low-power instrumentation amplifier, which they used to measure the data of a uric acid sensor. Chou et al. [50] researched a uric acid biosensor modified by magnetic beads and graphene; in this study, compared with previous research on potentiometric sensors, the sensor with the AgNW–uricase/rGO/NiO structure showed better average sensitivity. Since little research has studied potentiometric uric acid biosensors, we selected some uric acid sensors using composite nanomaterials for comparison. Jindal et al. [51] studied the electron transfer efficiency of p-type CuO microclusters (μCs) to modify a ZnO uric acid biosensor. Mohammed et al. [52] studied a sensor modified with Fe3O4, rGO, and Ag nanoparticles, which showed excellent stability and reproducibility. Verma et al. [53] studied a sensor based on Au–rGO nanocomposite thin films, which can enhance the performance of the sensor based on synergy. Comparing the different uric acid biosensors, we can observe that the sensor in this study has a lower detection limit and can detect lower concentrations of uric acid; due to the addition of nanomaterials, the sensing characteristics were improved. In conclusion, the novelty in this work was to make feasible a potentiometric sensor modified by AgNWs with rGO. According to the results of our research, such a sensor can also be developed in the direction of integrating a microfluidic system. For example, Gagliano et al. [54] used a drive pump, optical monitoring, and LabVIEW software to realize a control system that can control two kinds of microfluidic system. The sensor can reduce the number of reagents used by the microfluidic system, so as to achieve a convenient and accurate experimental process. Therefore, the development of a microfluidic system contributes to the improvement of the efficiency of the experiment.

4. Conclusions

Uric acid biosensors were analyzed for various basic properties, including the temperature effect, reducibility, and interference. Moreover, we used SEM and AFM to analyze the characteristics of the materials. The results show that temperature from 25 to 45 °C was a suitable range to maintain the stability of the enzyme activity in this study, which exhibited a linearity of 0.985 and a high average sensitivity of 5.90 mV/(mg/L) at 45 °C, while in the test of stability, the interference and the reducibility showed the sensor to be stable. We prepared interference solutions to examine the AgNW–uricase/rGO/NiO uric acid biosensor in this work, and observed no signals of interference. For investigating the reducibility of the biosensor, the average sensitivity of 12 measurements was 4.68 mV/(mg/L), and the RSD was ± 0.04 mV/(mg/L). Finally, the sensor showed a lifetime of 8 days, and its linearity and average sensitivity were 0.966 and 4.66 mV/(mg/L), respectively. The LOD of the sensor was 0.68 mg/L. In conclusion, the stability test showed that the NiO uric acid biosensor was successfully modified by the AgNW–uricase/rGO film.

Supplementary Materials

The following are available online at https://www.mdpi.com/article/10.3390/en14154696/s1, Figure S1: The V–T measurement of this research (a).

Author Contributions

Conceptualization, J.-C.C.; and T.-Y.L.; Data curation, T.-Y.L.; Formal analysis, Y.-H.H.; Methodology, J.-C.C., T.-Y.L., Y.-H.N., C.-H.L., P.-Y.K., S.-H.L., Y.-H.H., K.-T.L.; Writing—original draft preparation, T.-Y.L.; Writing—review and editing, J.-C.C., Y.-H.N., C.-H.L., P.-Y.K., S.-H.L., Y.-H.H., and K.-T.L. All authors have read and agreed to the published version of the manuscript.

Funding

This research was funded by the Ministry of Science and Technology, Taiwan, Republic of China, under the Contract MOST 109-2221-E-224-013, and MOST 110-2221-E-224-051.

Conflicts of Interest

The authors declare no conflict of interest.

References

  1. Lu, Y.; Yang, M.; Qu, F.; Shen, G.; Yu, R. Enzyme-functionalized gold nanowires for the fabrication of biosensors. Bioelectrochemistry 2007, 71, 211–216. [Google Scholar] [CrossRef]
  2. Sharma, S.; Byrne, H.; O’Kennedy, R.J. Antibodies and antibody-derived analytical biosensors. Essays Biochem. 2016, 60, 9–18. [Google Scholar] [CrossRef]
  3. Wang, L.; Gao, X.; Jin, L.; Wu, Q.; Chen, Z.; Lin, X. Amperometric glucose biosensor based on silver nanowires and glucose oxidase. Sens. Actuators B Chem. 2013, 176, 9–14. [Google Scholar] [CrossRef]
  4. Bujes-Garrido, J.; Arcos-Martínez, M.J. Disposable sensor for electrochemical determination of chloride ions. Talanta 2016, 155, 153–157. [Google Scholar] [CrossRef]
  5. Arslan, F.; Yaşar, A.; Kılıç, E.; Kilic, E. An Amperometric Biosensor for Xanthine Determination Prepared from Xanthine Oxidase Immobilized in Polypyrrole Film. Artif. Cells Blood Substit. Biotechnol. 2006, 34, 113–128. [Google Scholar] [CrossRef]
  6. Ho, M.H. Potentiometric biosensor based on immobilized enzyme membrane and fluoride detection. Sens. Actuators 1988, 15, 445–450. [Google Scholar] [CrossRef]
  7. Song, M.-J.; Hwang, S.W.; Whang, D. Amperometric hydrogen peroxide biosensor based on a modified gold electrode with silver nanowires. J. Appl. Electrochem. 2010, 40, 2099–2105. [Google Scholar] [CrossRef]
  8. Tyagi, M.; Tomar, M.; Gupta, V. Enhanced electron transfer properties of NiO thin film for the efficient detection of urea. Mater. Sci. Eng. B 2019, 240, 147–155. [Google Scholar] [CrossRef]
  9. Tyagi, M.; Tomar, M.; Gupta, V. NiO nanoparticle-based urea biosensor. Biosens. Bioelectron. 2013, 41, 110–115. [Google Scholar] [CrossRef]
  10. Javar, H.A.; Garkani-Nejad, Z.; Noudeh, G.D.; Mahmoudi-Moghaddam, H. Development of a new electrochemical DNA biosensor based on Eu3+−doped NiO for determination of amsacrine as an anti-cancer drug: Electrochemical, spectroscopic and docking studies. Anal. Chim. Acta 2020, 1133, 48–57. [Google Scholar] [CrossRef]
  11. Wanekaya, A.K.; Chen, W.; Myung, N.V.; Mulchandani, A. Nanowire-Based Electrochemical Biosensors. Electroanalysis 2006, 18, 533–550. [Google Scholar] [CrossRef]
  12. Ng, S.P.; Qiu, G.; Ding, N.; Lu, X.; Wu, C.-M.L. Label-free detection of 3-nitro-l-tyrosine with nickel-doped graphene localized surface plasmon resonance biosensor. Biosens. Bioelectron. 2017, 89, 468–476. [Google Scholar] [CrossRef]
  13. Wang, Q.; Wang, B.-T. Surface plasmon resonance biosensor based on graphene oxide/silver coated polymer cladding silica fiber. Sens. Actuators B Chem. 2018, 275, 332–338. [Google Scholar] [CrossRef]
  14. Berger, C.; Song, Z.; Li, T.; Li, X.; Ogbazghi, A.Y.; Feng, R.; Dai, Z.; Marchenkov, A.N.; Conrad, E.H.; First, P.N.; et al. Ultrathin Epitaxial Graphite: 2D Electron Gas Properties and a Route toward Graphene-based Nanoelectronics. J. Phys. Chem. B 2004, 108, 19912–19916. [Google Scholar] [CrossRef] [Green Version]
  15. Lee, C.-S.; Yu, S.H.; Kim, T.H. One-Step Electrochemical Fabrication of Reduced Graphene Oxide/Gold Nanoparticles Nanocomposite-Modified Electrode for Simultaneous Detection of Dopamine, Ascorbic Acid, and Uric Acid. Nanomaterials 2017, 8, 17. [Google Scholar] [CrossRef] [Green Version]
  16. Zhao, Q.; Faraj, Y.; Liu, L.-Y.; Wang, W.; Xie, R.; Liu, Z.; Ju, X.-J.; Wei, J.; Chu, L.-Y. Simultaneous determination of dopamine, uric acid and estriol in maternal urine samples based on the synergetic effect of reduced graphene oxide, silver nanowires and silver nanoparticles in their ternary 3D nanocomposite. Microchem. J. 2020, 158, 105185. [Google Scholar] [CrossRef]
  17. Rowley-Neale, S.J.; Randviir, E.P.; Abo-Dena, A.S.; Banks, C.E. An overview of recent applications of reduced graphene oxide as a basis of electroanalytical sensing platforms. Appl. Mater. Today 2018, 10, 218–226. [Google Scholar] [CrossRef]
  18. Adinaveen, T.; Karnan, T.; Selvakumar, S.A.S. Photocatalytic and optical properties of NiO added Nephelium lappaceum L. peel extract: An attempt to convert waste to a valuable product. Heliyon 2019, 5, e01751. [Google Scholar] [CrossRef] [Green Version]
  19. Parsaee, Z. Synthesis of novel amperometric urea-sensor using hybrid synthesized NiO-NPs/GO modified GCE in aqueous solution of cetrimonium bromide. Ultrason. Sonochem. 2018, 44, 120–128. [Google Scholar] [CrossRef]
  20. Qiao, H.; Wei, Z.; Yang, H.; Zhu, L.; Yan, X. Preparation and Characterization of NiO Nanoparticles by Anodic Arc Plasma Method. J. Nanomater. 2009, 2009, 1–5. [Google Scholar] [CrossRef] [Green Version]
  21. Drouet, C.; Laberty, C.; Fierro, J.; Alphonse, P.; Rousset, A. X-ray photoelectron spectroscopic study of non-stoichiometric nickel and nickel–copper spinel manganites. Int. J. Inorg. Mater. 2000, 2, 419–426. [Google Scholar] [CrossRef] [Green Version]
  22. Prietoa, P.; Nistora, V.; Nouneh, K.; Oyama, M.; Lefdild, M.A.; Díaza, R. XPS study of silver, nickel and bimetallic silver–nickel nanoparticles prepared by seed-mediated growth. Appl. Surf. Sci. 2012, 258, 8807–8813. [Google Scholar] [CrossRef]
  23. Patil, R.; Chang, C.-P.; Devan, R.; Liou, Y.; Ma, Y.-R. Impact of Nanosize on Supercapacitance: Study of 1D Nanorods and 2D Thin-Films of Nickel Oxide. ACS Appl. Mater. Interfaces 2016, 8, 9872–9880. [Google Scholar] [CrossRef] [PubMed]
  24. Song, Y.-J.; Wang, M.; Zhang, X.-Y.; Wu, J.-Y.; Zhang, T. Investigation on the role of the molecular weight of polyvinyl pyrrolidone in the shape control of high-yield silver nanospheres and nanowires. Nanoscale Res. Lett. 2014, 9, 17. [Google Scholar] [CrossRef] [PubMed] [Green Version]
  25. Sun, Y.; Yin, Y.; Mayers, B.T.; Herricks, T.; Xia, Y. Uniform Silver Nanowires Synthesis by Reducing AgNO3 with Ethylene Glycol in the Presence of Seeds and Poly(Vinyl Pyrrolidone). Chem. Mater. 2002, 14, 4736–4745. [Google Scholar] [CrossRef]
  26. Lima, A.; Mendonça, J.; Duarte, M.; Stavale, F.; Legnani, C.; De Carvalho, G.; Maciel, I.; Sato, F.; Fragneaud, B.; Quirino, W. Reduced graphene oxide prepared at low temperature thermal treatment as transparent conductors for organic electronic applications. Org. Electron. 2017, 49, 165–173. [Google Scholar] [CrossRef]
  27. Zhao, N.; Cheng, X.-N.; Yang, J.; Yang, M.-X.; Zheng, S.-H.; Zhou, Y.-Z. Experimental study on the preparation, characterization and conductivity improvement of reduced graphene-oxide papers. J. Phys. Chem. Solids 2014, 75, 1141–1146. [Google Scholar] [CrossRef]
  28. Pei, S.; Cheng, H.-M. The reduction of graphene oxide. Carbon 2012, 50, 3210–3228. [Google Scholar] [CrossRef]
  29. Mross, S.; Furst, P.; Pierrat, S.; Zimmermann, T.; Vogt, H.; Kraft, M. Enzyme Sensor With Polydimethylsiloxane Membrane and CMOS Potentiostat for Wide-Range Glucose Measurements. IEEE Sens. J. 2015, 15, 7096–7104. [Google Scholar] [CrossRef]
  30. Mizutani, F.; Yabuki, S.; Sawaguchi, T.; Hirata, Y.; Sato, Y.; Iijima, S. Use of a siloxane polymer for the preparation of amperometric sensors: O2 and NO sensors and enzyme sensors. Sens. Actuators B Chem. 2001, 76, 489–493. [Google Scholar] [CrossRef]
  31. Rathee, K.; Dhull, V.; Dhull, R.; Singh, S. Biosensors based on electrochemical lactate detection: A comprehensive review. Biochem. Biophys. Rep. 2016, 5, 35–54. [Google Scholar] [CrossRef] [Green Version]
  32. Du, J.; Yue, R.; Ren, F.; Yao, Z.; Jiang, F.; Yang, P.; Du, Y. Novel graphene flowers modified carbon fibers for simultaneous determination of ascorbic acid, dopamine and uric acid. Biosens. Bioelectron. 2014, 53, 220–224. [Google Scholar] [CrossRef] [PubMed]
  33. Wang, C.; Du, J.; Wang, H.; Zou, C.; Jiang, F.; Yang, P.; Du, Y. A facile electrochemical sensor based on reduced graphene oxide and Au nanoplates modified glassy carbon electrode for simultaneous detection of ascorbic acid, dopamine and uric acid. Sens. Actuators B Chem. 2014, 204, 302–309. [Google Scholar] [CrossRef]
  34. Hoo, C.M.; Starostin, N.; West, P.; Mecartney, M.L. A comparison of atomic force microscopy (AFM) and dynamic light scattering (DLS) methods to characterize nanoparticle size distributions. J. Nanoparticle Res. 2008, 10, 89–96. [Google Scholar] [CrossRef]
  35. da Cruz, F.S.; Paula, F.D.S.; Franco, D.; dos Santos, W.T.P.; Ferreira, L.F. Electrochemical detection of uric acid using graphite screen-printed electrodes modified with Prussian blue/poly(4-aminosalicylic acid)/Uricase. J. Electroanal. Chem. 2017, 806, 172–179. [Google Scholar] [CrossRef]
  36. Li, Y.; Wang, W.-X. Uptake, intracellular dissolution, and cytotoxicity of silver nanowires in cell models. Chemosphere 2021, 281, 130762. [Google Scholar] [CrossRef]
  37. De Mori, A.; Jones, R.S.; Cretella, M.; Cerri, G.; Draheim, R.R.; Barbu, E.; Tozzi, G.; Roldo, M. Evaluation of Antibacterial and Cytotoxicity Properties of Silver Nanowires and Their Composites with Carbon Nanotubes for Biomedical Applications. Int. J. Mol. Sci. 2020, 21, 2303. [Google Scholar] [CrossRef] [Green Version]
  38. Li, S.-M.; Wang, Y.-S.; Hsiao, S.-T.; Liao, W.-H.; Lin, C.-W.; Yang, S.-Y.; Tien, H.-W.; Ma, C.-C.M.; Hu, C.-C. Fabrication of a silver nanowire-reduced graphene oxide-based electrochemical biosensor and its enhanced sensitivity in the simultaneous determination of ascorbic acid, dopamine, and uric acid. J. Mater. Chem. C 2015, 3, 9444–9453. [Google Scholar] [CrossRef]
  39. Gomes, S.; Numata, K.; Leonor, I.B.; Mano, J.F.; Reis, R.L.; Kaplan, D.L. AFM Study of Morphology and Mechanical Properties of a Chimeric Spider Silk and Bone Sialoprotein Protein for Bone Regeneration. Biomacromolecules 2011, 12, 1675–1685. [Google Scholar] [CrossRef] [Green Version]
  40. Nakazawa, H.; Otake, R.; Futagawa, M.; Dasai, F.; Ishida, M.; Sawada, K. High-Sensitivity Charge-Transfer-Type pH Sensor With Quasi-Signal Removal Structure. IEEE Trans. Electron Devices 2013, 61, 136–140. [Google Scholar] [CrossRef]
  41. Grieshaber, D.; MacKenzie, R.; Vörös, J.; Reimhult, E. Electrochemical Biosensors—Sensor Principles and Architectures. Sensors 2008, 8, 1400–1458. [Google Scholar] [CrossRef] [PubMed]
  42. Honeychurch, K. Printed Thick-Film Biosensors; Woodhead Publishing: Sawston, UK, 2012; pp. 366–409. [Google Scholar] [CrossRef]
  43. Kudo, H.; Takagi, T. Electrochemical Biosensor for Simplified Determination of Salivary Uric Acid. Sens. Mater. 2018, 1187–1195. [Google Scholar] [CrossRef]
  44. Aly, M.; Tork, S.; Al-Garni, S.; Allam, R. Production and characterization of uricase from Streptomyces exfoliatus UR10 isolated from farm wastes. Turk. J. Biol. 2013, 37, 520–529. [Google Scholar] [CrossRef]
  45. Arslan, F. An Amperometric Biosensor for Uric Acid Determination Prepared from Uricase Immobilized in Polyaniline-Polypyrrole Film. Sensors 2008, 8, 5492–5500. [Google Scholar] [CrossRef] [Green Version]
  46. Ahmad, M.; Sun, H.; Hussain, M.; Karim, S.; Nisar, A.; Khan, M. Development of Silver Nanowires Based Highly Sensitive Amperometric Glucose Biosensor. Electroanalysis 2015, 27, 1498–1506. [Google Scholar] [CrossRef]
  47. Thévenot, D.R.; Toth, K.; Durst, R.; Wilson, G.S. Electrochemical biosensors: Recommended definitions and classification. Biosens. Bioelectron. 2001, 16, 121–131. [Google Scholar] [CrossRef]
  48. Rodrigues, R.; Ortiz, C.; Berenguer-Murcia, Á.; Torres, R.T.R.; Fernández-Lafuente, R. Modifying enzyme activity and selectivity by immobilization. Chem. Soc. Rev. 2013, 42, 6290–6307. [Google Scholar] [CrossRef] [PubMed]
  49. Kuo, P.-Y.; Chen, Y.-Y. A Novel Low Unity-Gain Frequency and Low Power Consumption Instrumentation Amplifier Design for RuO₂ Uric Acid Biosensor Measurement. IEEE Trans. Instrum. Meas. 2021, 70, 1–9. [Google Scholar] [CrossRef]
  50. Chou, J.-C.; Lai, T.-Y.; Lin, S.-H.; Kuo, P.-Y.; Lai, C.-H.; Nien, Y.-H.; Su, T.-Y. Characteristics and Stability of a Flexible Arrayed Uric Acid Biosensor Based on NiO Film Modified by Graphene and Magnetic Beads. IEEE Sens. J. 2020, 21, 7218–7225. [Google Scholar] [CrossRef]
  51. Jindal, K.; Tomar, M.; Gupta, V. A novel low-powered uric acid biosensor based on arrayed p-n junction heterostructures of ZnO thin film and CuO microclusters. Sens. Actuators B Chem. 2017, 253, 566–575. [Google Scholar] [CrossRef]
  52. Mohammed, O.A.M.A.; Saleh, K.A.; Al-Shammaree, S.A.W. Fabrication and evaluation of uric acid biosensor using nano-composites. Mater. Today Proc. 2021. [Google Scholar] [CrossRef]
  53. Verma, S.; Choudhary, J.; Singh, K.P.; Chandra, P.; Singh, S.P. Uricase grafted nanoconducting matrix based electrochemical biosensor for ultrafast uric acid detection in human serum samples. Int. J. Biol. Macromol. 2019, 130, 333–341. [Google Scholar] [CrossRef] [PubMed]
  54. Gagliano, S.; Cairone, F.; Amenta, A.; Bucolo, M. A Real Time Feed Forward Control of Slug Flow in Microchannels †. Energies 2019, 12, 2556. [Google Scholar] [CrossRef] [Green Version]
Figure 1. EDS spectrum of the NiO film on the Si substrate.
Energies 14 04696 g001
Figure 2. FE-SEM (a) top view and (b) cross-section images of the NiO film on the silicon substrate.
Energies 14 04696 g002
Figure 3. XRD pattern of the NiO film.
Energies 14 04696 g003
Figure 4. XPS analyses of the NiO film: (a) full spectrum; (b) Ni 2p; and (c) O1s.
Energies 14 04696 g004
Figure 5. FE-SEM image of the AgNWs.
Energies 14 04696 g005
Figure 6. UV–Vis extinction spectra of the optical characteristics of the AgNW solution.
Energies 14 04696 g006
Figure 7. Raman spectroscopy characterization of the (a) GO and (b) rGO.
Energies 14 04696 g007
Figure 8. FE-SEM image of (a) the GO sheets and (b) the rGO sheets at 5000× magnification.
Energies 14 04696 g008
Figure 9. AFM images of (a) the rGO/NiO, and (b) the AgNW/rGO/NiO.
Energies 14 04696 g009
Figure 10. Uricase–rGO/NiO uric acid biosensor under a uric acid concentration range of 20–100 mg/L.
Energies 14 04696 g010
Figure 11. AgNW–uricase/rGO/NiO uric acid biosensor under an uric acid concentration range of 20–100 mg/L.
Energies 14 04696 g011
Figure 12. AgNW–uricase/rGO/NiO uric acid biosensor under the presence of the interfering substances.
Energies 14 04696 g012
Figure 13. Temperature effects of the AgNW–uricase/rGO/NiO uric acid biosensor in the temperature range of 25–65 °C.
Energies 14 04696 g013
Figure 14. Reproducibility of the AgNW–uricase/rGO/NiO uric acid biosensor.
Energies 14 04696 g014
Figure 15. Lifetime of the AgNW–uricase/rGO/NiO uric acid biosensor.
Energies 14 04696 g015
Table 1. Ra and Rq of the rGO/NiO and the AgNW/rGO/NiO films.
FilmsRoughness
Ra (nm)Rq (nm)
rGO/NiO33.644.8
AgNWs/rGO/NiO203.0234.0
Table 2. Average sensitivity and linearity of the uric acid biosensor based on AgNW–uricase/rGO/NiO film in the temperature range of 25–65 °C.
Temperature (°C)Average Sensitivity mV/(mg/L)Linearity
254.710.959
355.430.964
455.900.985
554.530.978
653.710.901
Table 3. Average sensitivity for each AgNW–uricase/rGO/NiO uric acid biosensor.
NumberAverage Sensitivity
mV/(mg/L)
14.76
24.71
34.60
44.73
54.61
64.66
74.71
84.65
94.68
104.70
114.73
124.69
Table 4. Average sensitivity of the uric acid biosensor, dependent on storage time.
DayAverage Sensitivity
mV/(mg/L)
Relative Average Sensitivity (%)
14.71100.00
44.6799.15
74.3191.51
104.0285.35
133.8381.32
163.6076.43
192.7758.81
212.2046.70
Table 5. Comparisons of the characteristics for the different sensing films.
Sensing
Film
Linear RangeAverage
Sensitivity
TypeLifetime
(days)
LOD
(mg/L)
Reference
RuO20.1–0.5 mM
(20–100 mg/L)
0.715
mV/(mg/L)
PotentiometricN/AN/A[49] 2021
MBs–uricase/rGO/NiO0.1–0.5 mM
(20–100 mg/L)
3.828
mV/(mg/L)
150.574[50] 2021
Uricase/CuO/ZnO arrayed p–n junction heterostructure0.05–1.00 mM
(9–180 mg/L)
174.000
(μA mM−1 cm−2)
Amperometric~5 months0.980[51] 2017
Uricase/Au-rGO/ITO50–800 μM
(0.18–1440 mg/L)
86.62 ± 0.19
(μM mM−1)
~6 months1.130[52] 2019
Uricase/Fe3O4/rGO/Ag /ITO10–800 μM
(0.18–1440 mg/L)
0.076
(μA mM−1 cm−2)
N/A0.932[53] 2021
AgNW–uricase/rGO/NiO0.1–0.5 Mm
(20–100 mg/L)
4.660
mV/(mg/L)
Potentiometric80.680This work
Publisher’s Note: MDPI stays neutral with regard to jurisdictional claims in published maps and institutional affiliations.

