Article

Power-to-Green Methanol via CO2 Hydrogenation—A Concept Study including Oxyfuel Fluidized Bed Combustion of Biomass

1
Institute of Chemical, Environmental and Bioscience Engineering, TU Wien, Getreidemarkt 9/166, 1060 Vienna, Austria
2
Department of Energy Engineering, Faculty of Mechanical Engineering, Czech Technical University in Prague, Technicka 4, 166 07 Prague, Czech Republic
*
Author to whom correspondence should be addressed.
Energies 2021, 14(15), 4638; https://doi.org/10.3390/en14154638
Submission received: 11 June 2021 / Revised: 9 July 2021 / Accepted: 19 July 2021 / Published: 30 July 2021
(This article belongs to the Section A5: Hydrogen Energy)

Abstract

:
A revolution of the global energy industry is without an alternative to solving the climate crisis. However, renewable energy sources typically show significant seasonal and daily fluctuations. This paper provides a system concept model of a decentralized power-to-green methanol plant consisting of a biomass heating plant with a thermal input of 20 MWth. (oxyfuel or air mode), a CO2 processing unit (DeOxo reactor or MEA absorption), an alkaline electrolyzer, a methanol synthesis unit, an air separation unit and a wind park. Applying oxyfuel combustion has the potential to directly utilize O2 generated by the electrolyzer, which was analyzed by varying critical model parameters. A major objective was to determine whether applying oxyfuel combustion has a positive impact on the plant’s power-to-liquid (PtL) efficiency rate. For cases utilizing more than 70% of CO2 generated by the combustion, the oxyfuel’s O2 demand is fully covered by the electrolyzer, making oxyfuel a viable option for large scale applications. Conventional air combustion is recommended for small wind parks and scenarios using surplus electricity. Maximum PtL efficiencies of ηPtL,Oxy = 51.91% and ηPtL,Air = 54.21% can be realized. Additionally, a case study for one year of operation has been conducted yielding an annual output of about 17,000 t/a methanol and 100 GWhth./a thermal energy for an input of 50,500 t/a woodchips and a wind park size of 36 MWp.

1. Introduction

The climate crisis poses a major threat to human civilization on a long-term basis. The global monthly average CO2 concentration in the atmosphere reached a level of 415 ppm in December 2020, with average growth rates of 2–3 ppm per year in the previous five years [1,2]. Combustion processes for power generation account for about 42% of global anthropogenic CO2 emissions, indicating the energy industry’s key role for mitigating global warming [3]. In 2019, the European Commission launched its Green Deal program, including the goal to become the first climate-neutral continent by 2050, as well as decoupling economic growth and resource usage [4].
To reach these ambitious targets, intersectional concepts, based on renewable energy sources, for the provision of power and heat need to be empowered and improved. Carbon capture and storage (CCS) and carbon capture and utilization (CCU) pose promising technologies in fighting the climate crisis. However, CCS goes hand in hand with several difficulties (e.g., safety issues and substantial efforts for the transportation of captured CO2). Additionally, CCS is illegal in numerous countries and therefore, a limited option for the mitigation of CO2 emissions. A variety of promising CCU technologies (e.g., power-to-gas (PtG), power-to-liquid (PtL), power-to-fuels (PtF) and power-to-chemicals (PtC)) are on the verge of becoming economically feasible within this decade. Significant advantages are the on-site usage of CO2 sources, as well as the development of new business cases to produce renewable fuels or chemicals. Crucial parameters defining the sustainability of CCU technologies are the CO2’s origin as well as the product’s (H2, CH4, methanol, Fischer-Tropsch products) scope of application. Possible CO2 capture systems (i.e., direct air capture (DAC), post combustion, pre combustion, oxyfuel combustion or industrial processes) are listed and explained in detail in the IPCC special report on carbon dioxide capture and storage [5]. In general, sources with a high concentration of CO2 are favored due to a smaller technological effort of CO2 capture.
In May 2018, 128 PtG projects were in progress or have been finished in Europe. A list of conducted projects as well as an overview of possible PtG process routes can be found in [6]. Three PtG demo sites for CO2 valorization to methane using different reactor technologies (i.e., a catalytic honeycomb reactor, a biological stirred bubble column reactor and a catalytic milli-structured reactor) are analyzed in [7]. Within the pan-European project MefCO2, a PtL pilot plant with an annual output of 500 t/a methanol was realized. Captured CO2 was valorized using a polymer electrolyte membrane electrolyzer powered with solar-generated electricity in Niederaußem, Germany [8]. Another successful example is the George Olah Plant, located in Iceland, a PtL plant at industrial scale, designed and constructed by the Icelandic company Carbon Recycling International (CRI). Over 4000 t/a methanol can be produced valorizing geothermal CO2 with H2 generated by an alkaline electrolyzer powered by Iceland’s 100% renewable grid electricity [9]. After winning the Nobel Prize in 1994, George Olah’s scientific focus shifted towards producing green fuels (e.g., methanol using captured CO2 as feedstock), making him a pioneer in PtL processes before the term came into existence [10]. The German start-up company, INERATEC, announced the construction of a PtF plant at industrial scale at Frankfurt, Germany, until 2022. A total of 3500 t/a Fischer-Tropsch products will be produced using a maximum of 10,000 t/a biogenic CO2 [11]. Research analyzing CO2 hydrogenation to methanol at lab-scale can be found in [12] (applying an In2O3/ZrO2 catalyst) and [13] (conventional Cu/ZnO/Al2O3 catalyst). Within the past years PtL technologies transitioned from a niche application at laboratory scale to a viable option for the process and energy industry regarding CCU technologies. Current projects aim at proofing the process’ feasibility at pilot scale obtaining reasonable efficiency rates. Major challenges within the following years will be the provision of cost-effective renewable H2 by electrolyzers surpassing a power input of several MW. Power-to-liquid processes have the potential to provide renewable eFuels as the intermediate power source until individual mobility is fully electrified. In the long run, eFuels could be applied as the power source for aviation and goods transport, requiring a high energy density.
Oxyfuel combustion was first proposed in 1982 to provide a CO2-rich gas stream for enhanced oil recovery applications, and experienced a technological renaissance in the early 2000s when being rediscovered as a suitable option for CCU processes. Oxyfuel combustion tackles the issue of low CO2 concentrations in flue gases obtained by conventional air combustion processes [14]. In oxyfuel combustion technologies, fuels are burned in a mixture of O2 with a technical purity of at least 95 vol% and recirculated flue gas. The recirculation of flue gas is mandatory, as the missing volume stream of the air’s N2 needs to be replaced. Furthermore, the combustor’s flame temperature can be controlled by adjusting the amount of recirculated flue gas. The main differences when comparing oxyfuel combustion with conventional air combustion are [14]:
  • O2 concentrations of about 30 vol% in the oxidant are required to obtain a comparable flame temperature;
  • Volume flow streams of emitted flue gas are reduced by about 80% since no N2 passes the combustor as inert gas;
  • Different combustion regimes are observed due to deviating physical properties of CO2 and N2. For example, the density of flue gas generated by an oxyfuel combustion process is larger due to a higher molar mass of CO2, concluding in a larger specific heat capacity as well.
The “Callide” oxyfuel project, successfully completed in 2015, can be considered a showcase regarding oxyfuel combustion at an industrial scale. A power plant located in the state of Queensland, Australia, with a thermal input of 24–29 MWth. (coal) was combined with a CCS project located in Victoria, Australia. Detailed scientifical results can be found in the project’s final report [15]. Another oxyfuel project launched by Vattenfall in 2006 at Schwarze Pumpe, Germany, aimed at retrofitting an existing coal power plant with a thermal input of 30 MWth. for CCS applications. However, Vattenfall cancelled the project in 2014 due to economic difficulties without publishing a final report. A detailed study on oxyfuel combustion of biomass in a 20 kWth fluidized bed combustor can be found in [16], analyzing effects of combustion environments (oxyfuel combustion vs. conventional air combustion) on fuel combustion, temperature profiles and CO and NOx emissions.
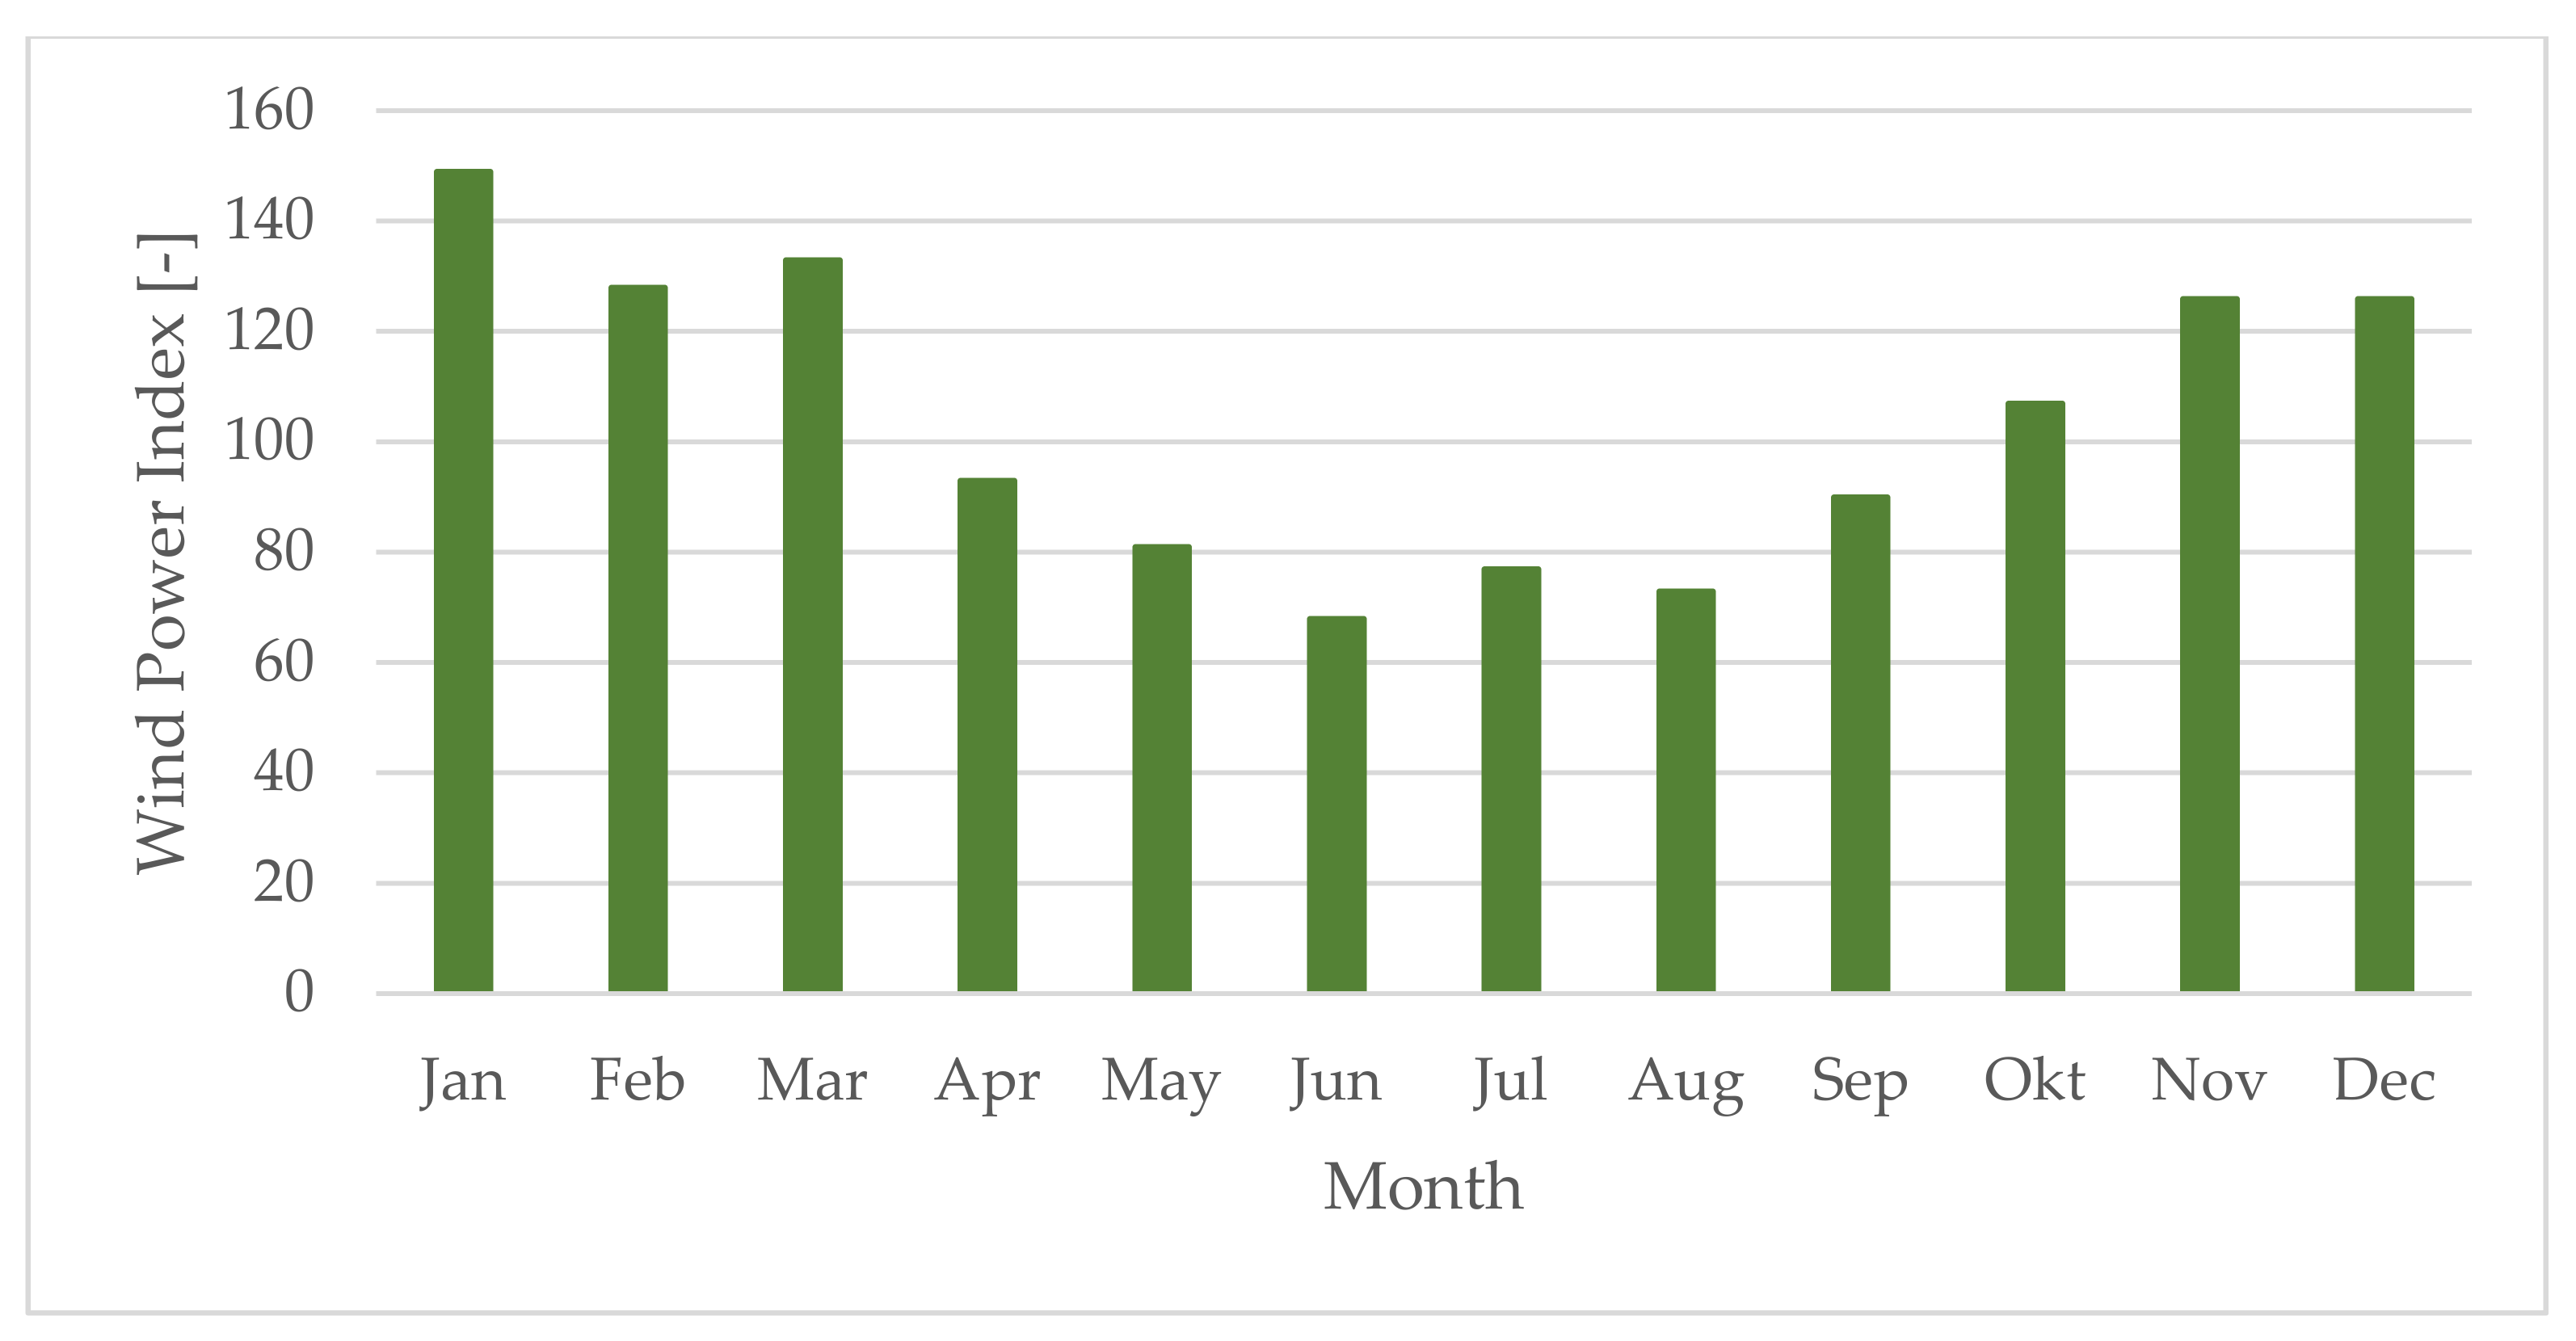
As stated previously, power-to-X technologies will play a significant role in fighting the climate crisis due to their potential to chemically store excess power generated by renewable energy carriers as H2, CH4, methanol or Fischer-Tropsch products. Renewable power sources (i.e., wind or solar) undergo daily and seasonal fluctuations leading to difficulties regarding the storage of surplus electricity. Generated energy carriers could also be integrated in grid-stabilizing systems, tackling another major disadvantage of renewable power sources.
Furthermore, hydrogenating CO2 comes with several process advantages compared to conventional methanol production by syngas [9,17]:
  • Fewer impurities can be found in the crude methanol;
  • The chemical reaction of CO2 and H2 is less complex and less exothermal compared to the synthesis based on CO and H2;
  • Boiling water reactors (BWRs) including a recirculation of unconverted gases can easily be applied instead of adiabatic reactors in series since less reaction heat needs to be transferred out of the catalyst bed, resulting in a larger economic feasibility of the process;
  • Milder process conditions are required;
  • The methanol selectivity of CO2 hydrogenation is larger compared to conventional methanol synthesis processes based on syngas as the reactor input.
The design and simulation, using Aspen Plus, of a plant producing methanol via CO2 hydrogenation can be found in [18]. CO2 generated by a thermal power plant using coal as fuel was hydrogenated with H2 produced by water electrolysis. The authors declared that O2, generated by the electrolyzer, had to be sold as a by-product and highlighted the possible potential of using it as feedstock for oxyfuel combustion processes without calculating detailed scenarios. A feasibility analysis of a plant producing renewable methanol by chemically storing wind power can be found in [19]. The production costs of H2, being the most significant model parameter, as well as the selling price of methanol were varied. Consequently, selling or using O2 generated by water splitting could be a major factor in improving the facility’s economic feasibility.
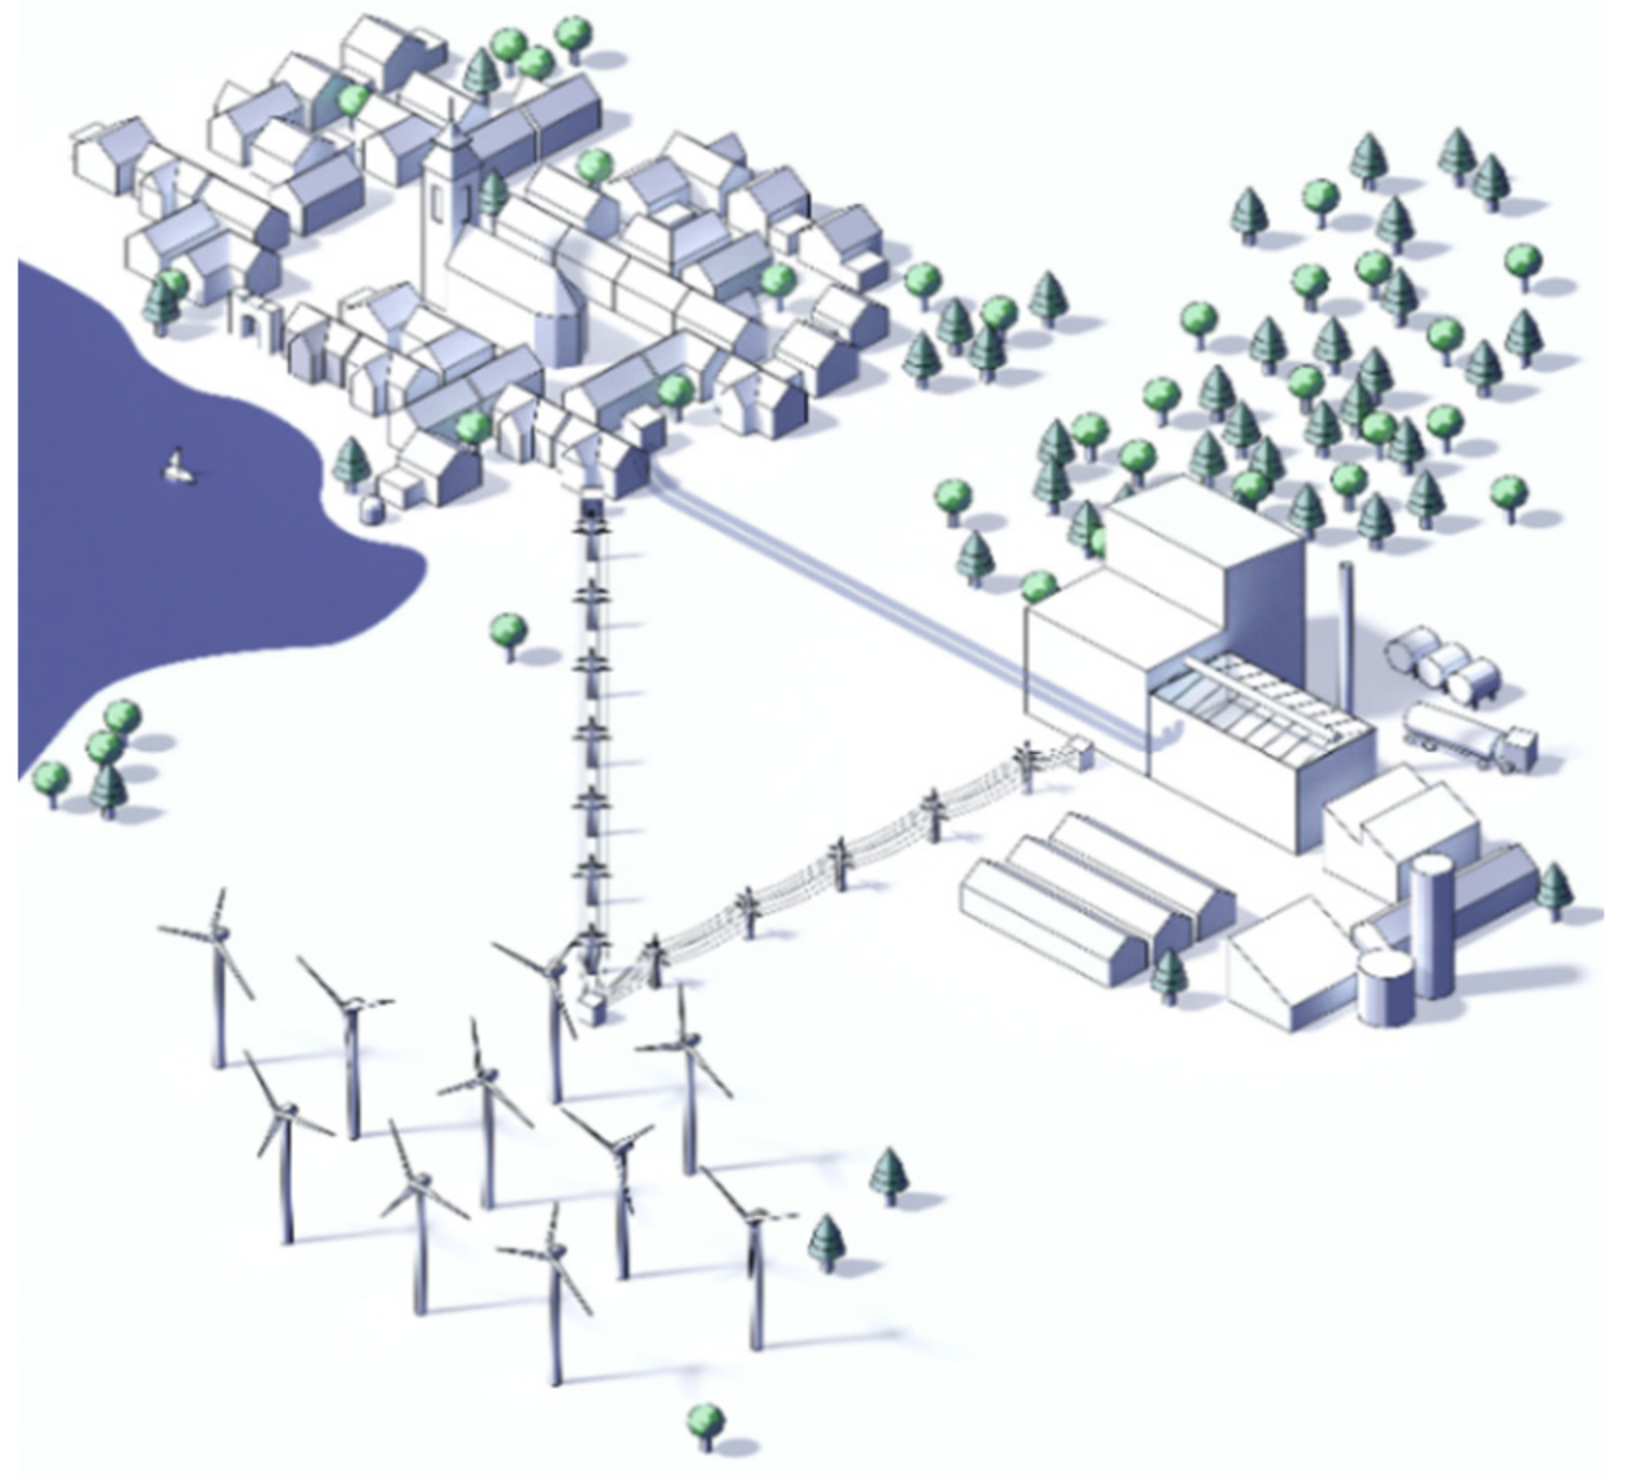
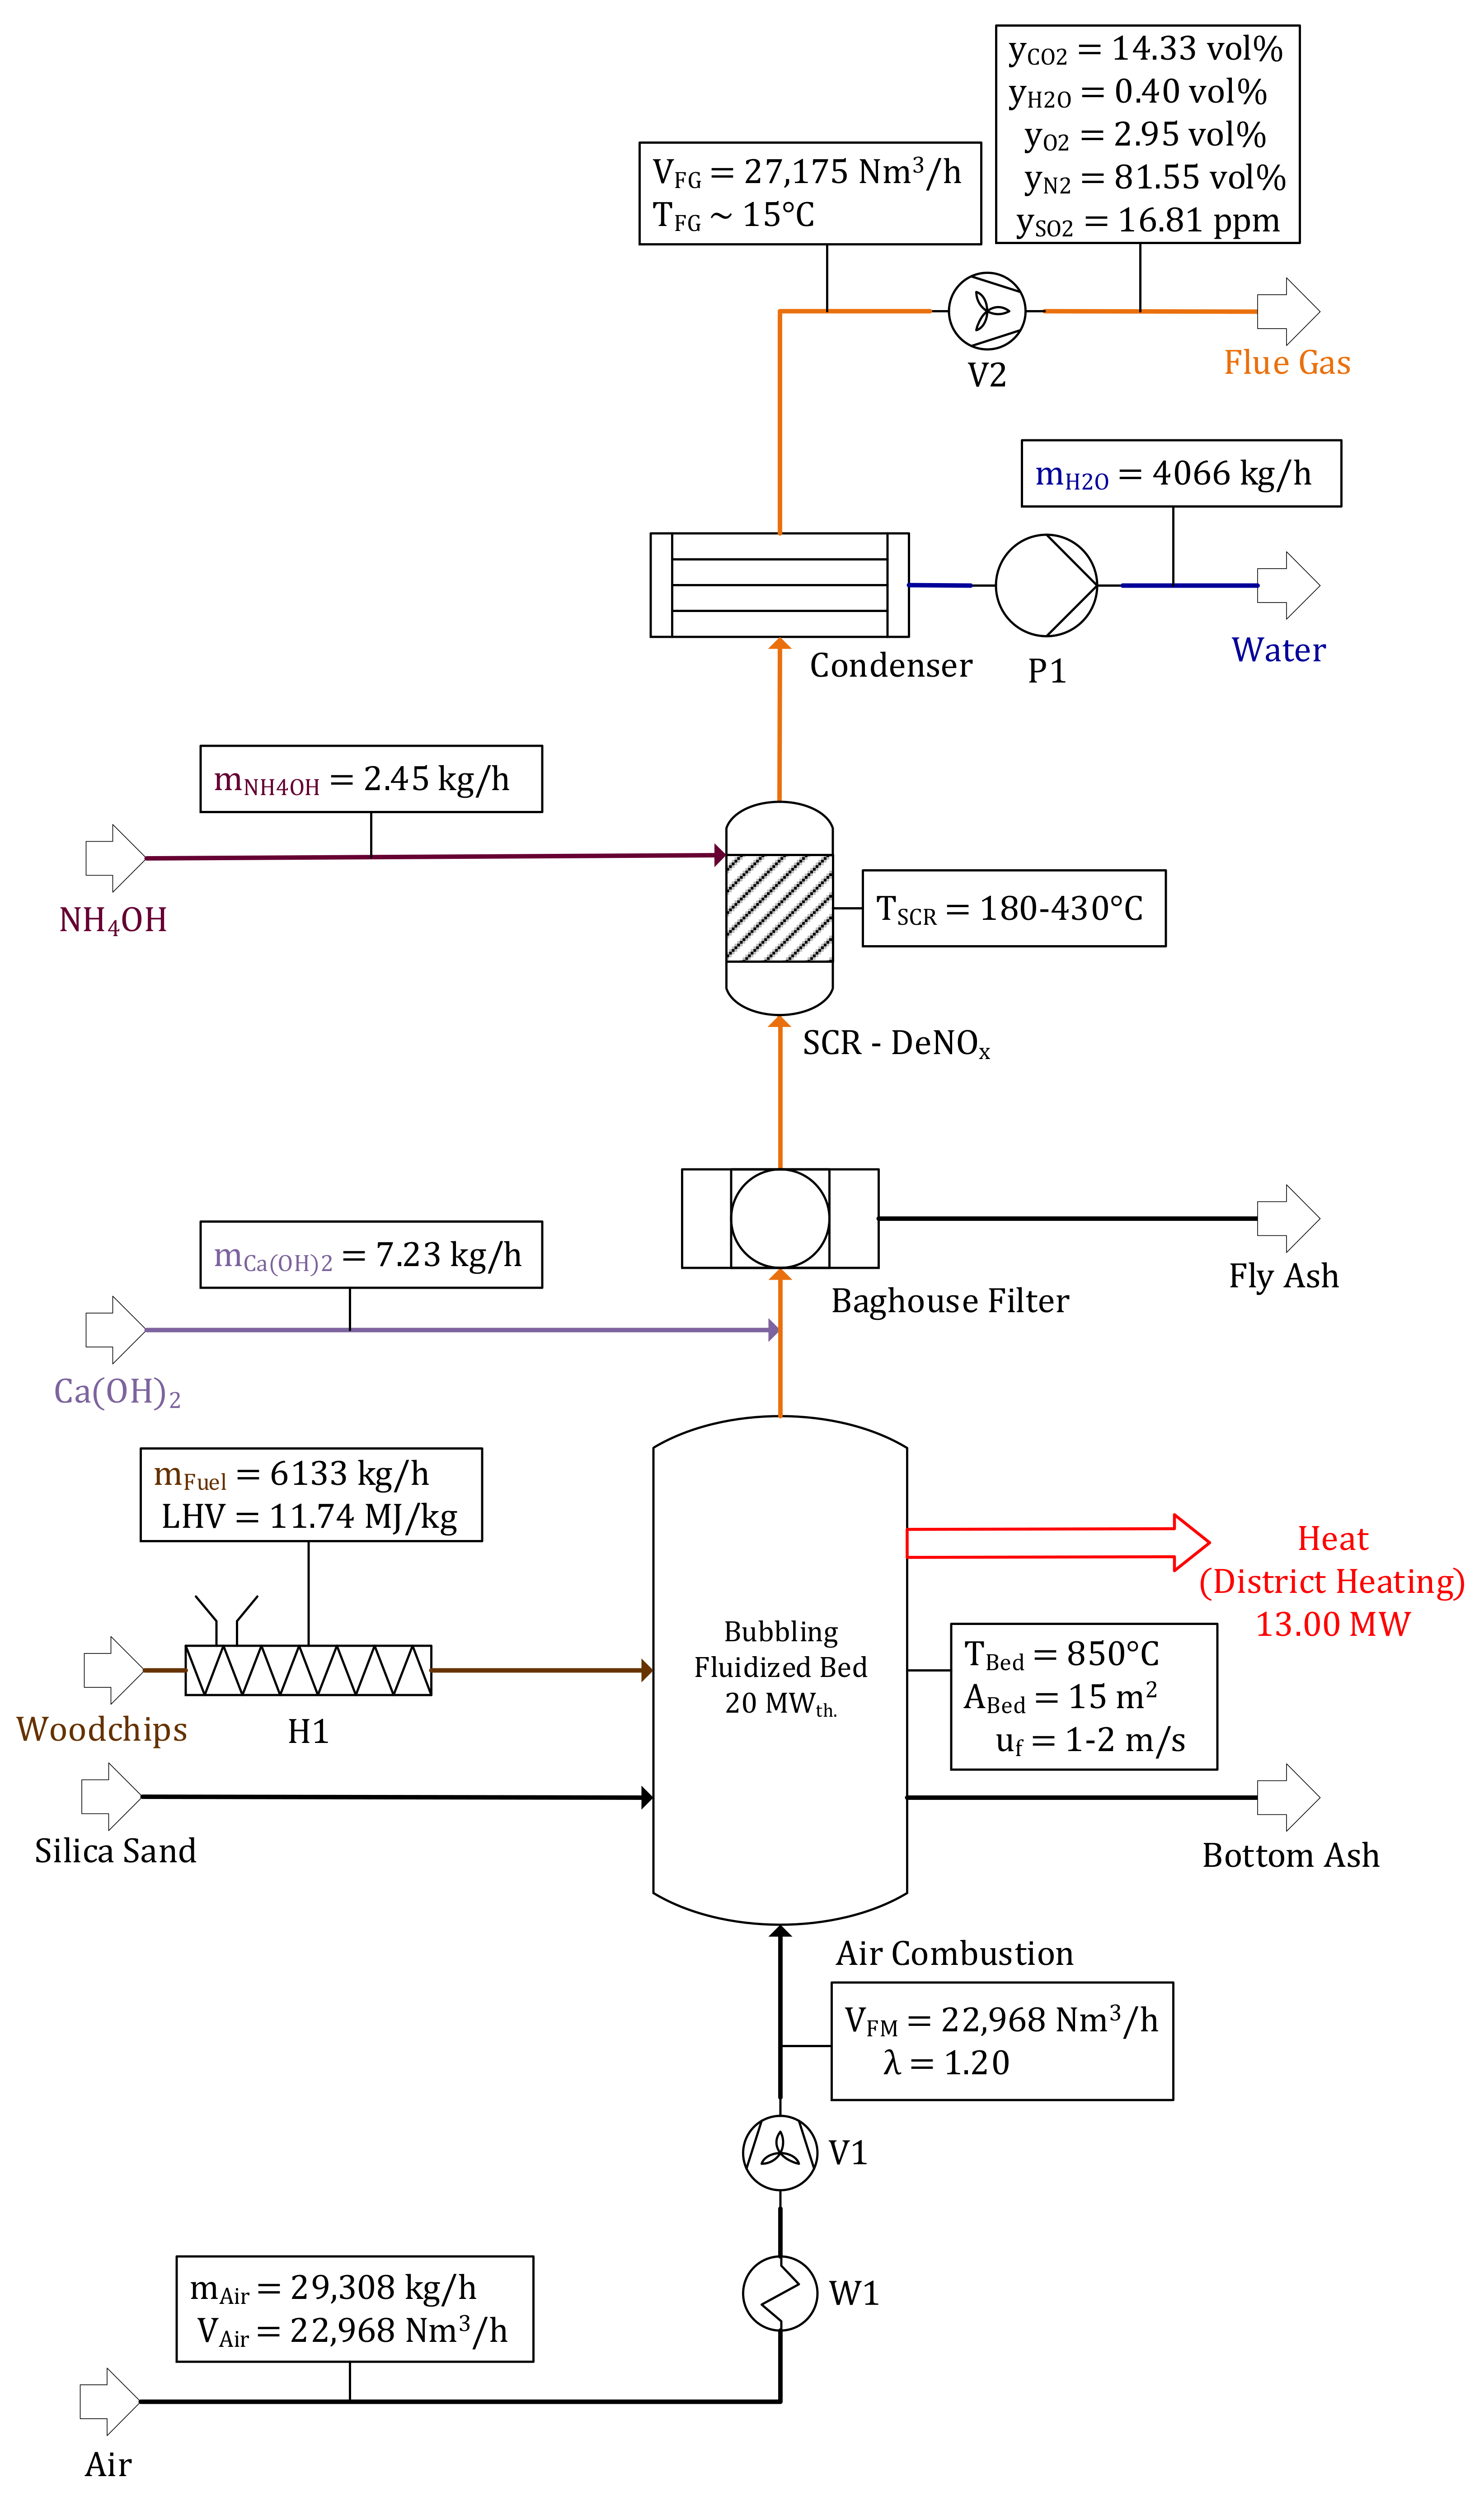
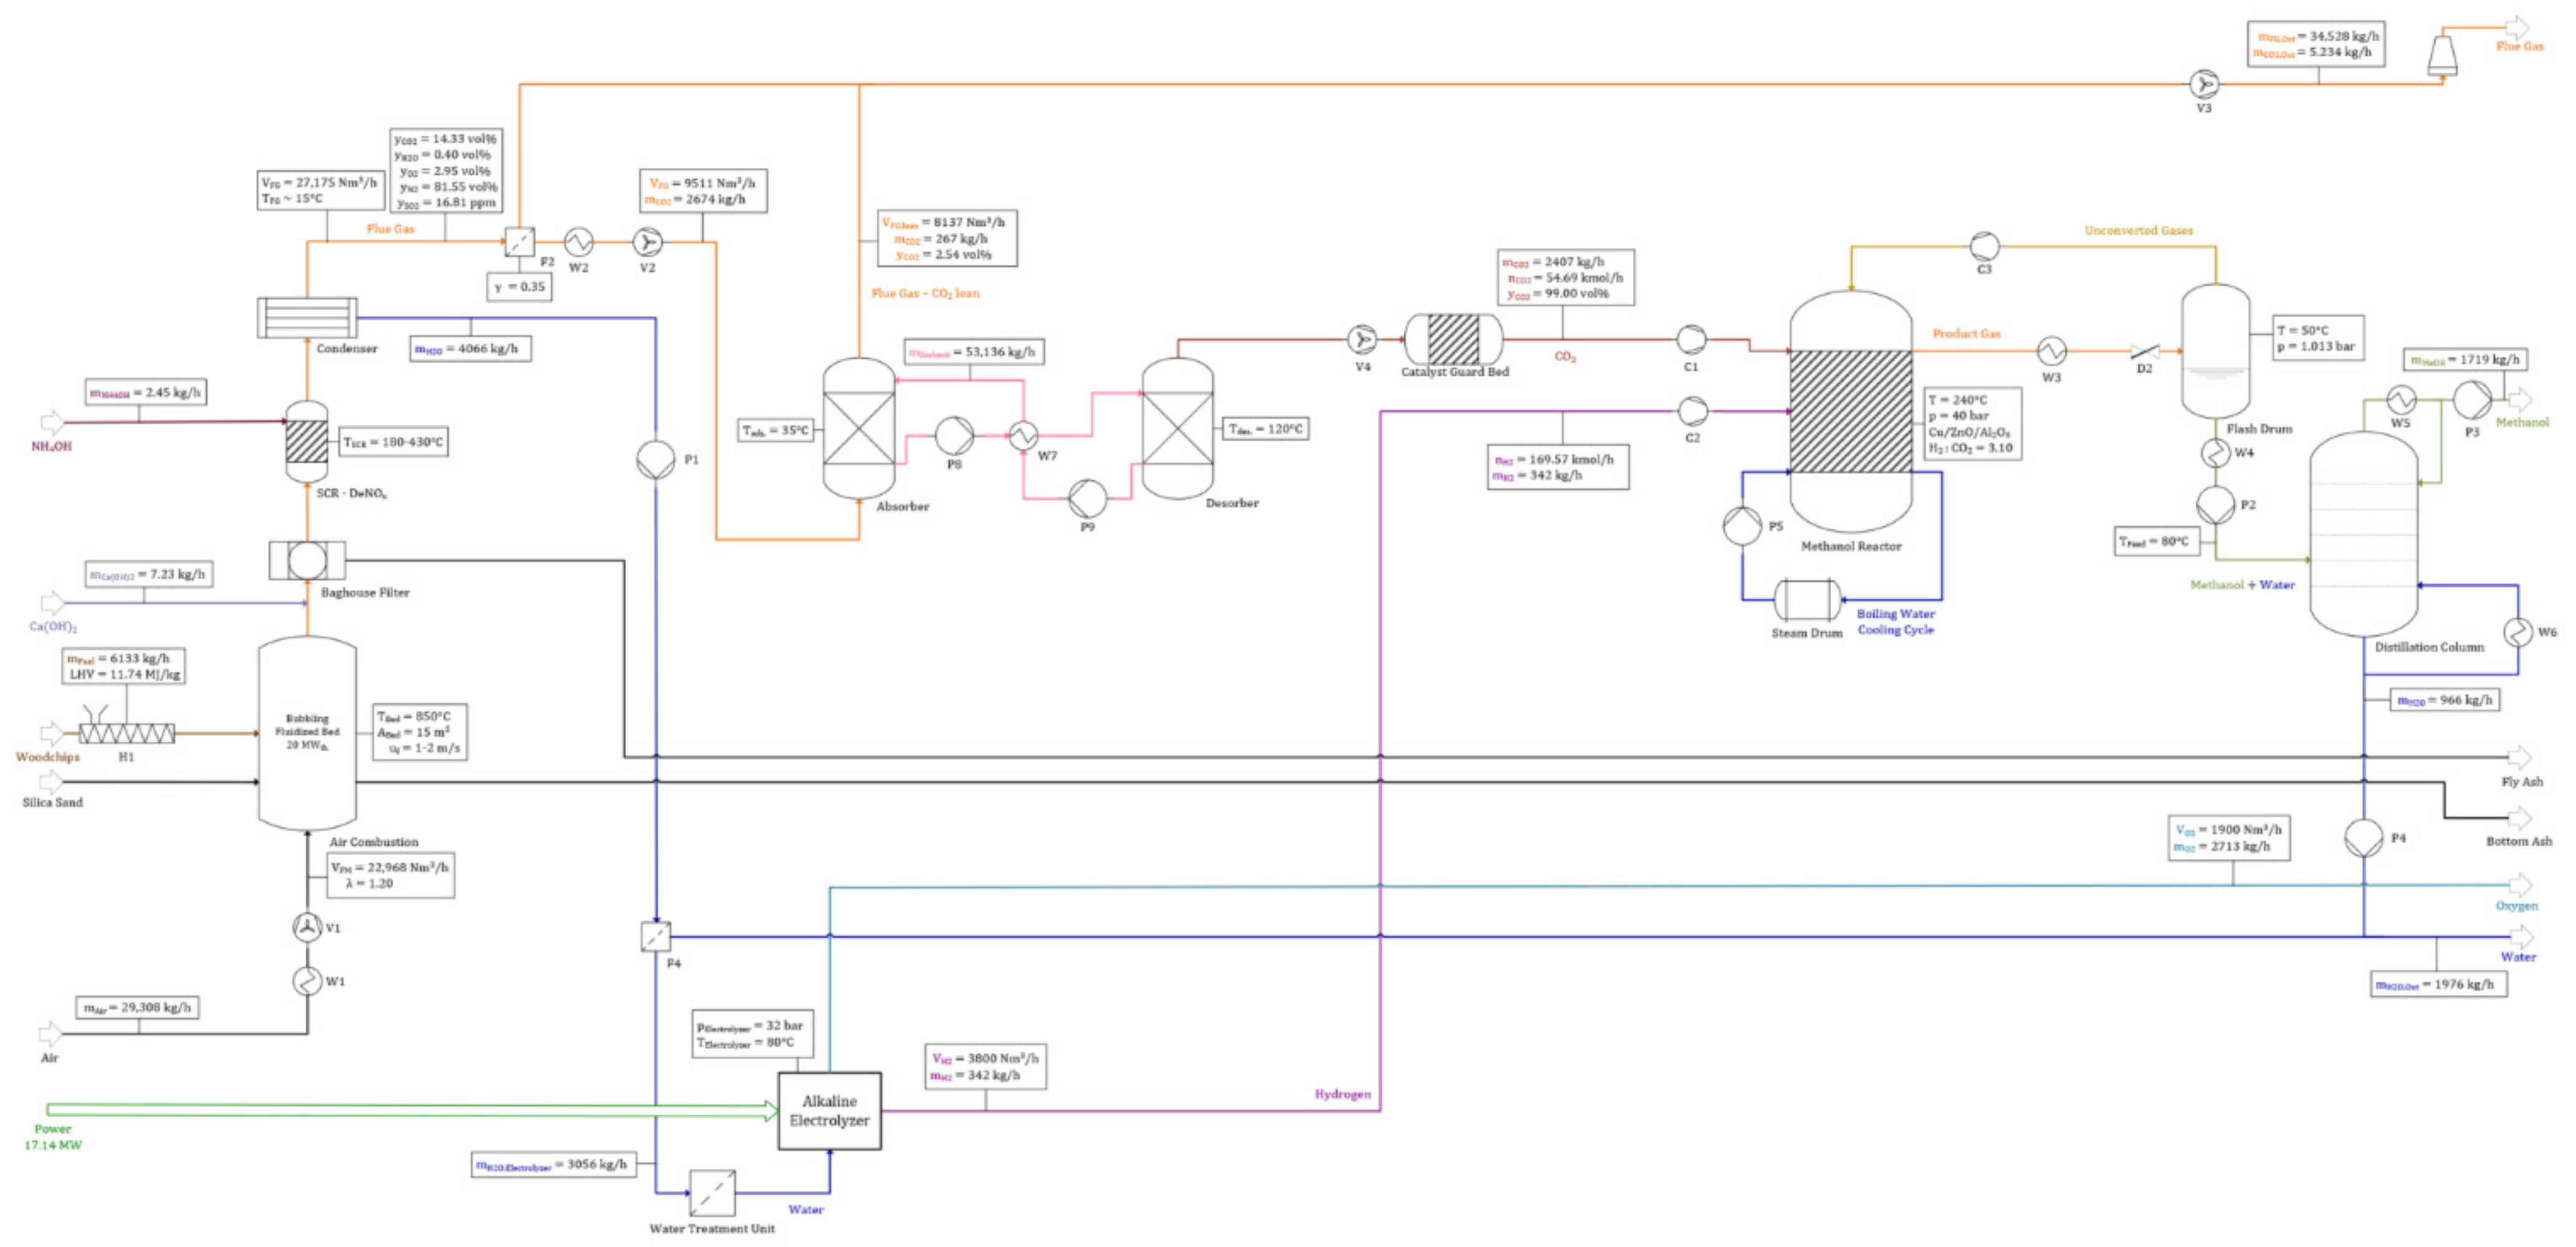
This article aims at finding and conceptualizing different process routes for a decentralized power-to-green methanol plant, with a thermal input of 20 MWth., using woodchips as fuel (Figure 1). As a result, the proposed concept has the potential to achieve a negative CO2 balance. A foundation for future research projects should be provided with the goal to increase the concept’s level of details. Furthermore, proposed process routes will be evaluated by comparing obtained power-to-liquid efficiency rates to values stated in reviewed literature. In comparison with previous studies, this paper includes the application of oxyfuel combustion in combination with methanol production (CO2 hydrogenation) by directly applying O2 (by-product of water splitting) to the oxyfuel combustor. Furthermore, a direct comparison of oxyfuel and air process routes in combination with CCU, regarding the efficiency rates of power-to-green methanol facilities, should answer the question whether oxyfuel process routes are a viable option for future PtL plants.
A specific hypothesis of this work is whether the replacement of conventional air by oxyfuel combustion enhances the performance of power-to-methanol plants using post combustion CO2 capture. The preferable combustion technology as well as the synergy between oxyfuel combustion and water electrolysis (generating O2 as byproduct) was determined for different assumed scenarios.

2. Materials and Methods

The main aspect of this work was to model several subprocesses (oxyfuel combustion in combination with a DeOxo reactor, air combustion including CO2 capture by absorption, methanol synthesis, alkaline electrolyzer). Combining them resulted in models of different process routes. Microsoft Visio (2016) was applied for process visualization (i.e., creating process flow charts). A list of auxiliary equipment for all subprocesses can be found in the Appendix A (Table A9).

2.1. Oxyfuel Combustion in a Bubbling Fluidized Bed Combustor (BFBC)

As described previously, oxyfuel combustion is defined as combustion reaction in a mixture of O2 with a technical purity of at least 95 vol% and recirculated flue gas. A standard combustion calculation was conducted.
Fuel-N and fuel-O were assumed to be released as N2 and O2, respectively. Gases were assumed to behave like ideal gases. Complete combustion was assumed for subsequent combustion calculations. A similar approach can be found in [20] for comparison.
Subsequent mass balances are based on assumed properties of woodchips stated in Table 1 (ultimate analysis) and Table 2 (proximate analysis). These parameters serve as a benchmark but can easily be adjusted to different scenarios or alternating fuels (e.g., bark or municipal waste). The fuel’s lower heating value (LHV) in MJ/kg was calculated with the equation after Boie. Small letters refer to the different mass participations of the fuel’s elemental components in kg/kg fuel.
LHV = 34.8∙c + 93.9∙h + 6.3∙n + 10.5∙s − 10.8∙o − 2.5∙w [MJ/kg].
The combustion reaction’s specific O2 demand per kg of combusted species, stated in the Appendix A (Table A1), was calculated with previously stated assumptions.
O2 is either provided by an air separation unit (ASU) or the alkaline electrolyzer. Excess of O2 in the oxidant α was defined as the ratio of actual volume flow stream of O2 related to the volume flow stream of O2 required for a stoichiometric combustion, as described in [20].
α = V ˙ O x . , O 2 , R e a l V ˙ O 2 , S t o i c h i o m e t r i c .
Since the recirculation of flue gas is mandatory for controlling the combustion temperature, O2 provided by the recycled flue gas needs to be considered as well. The excess of O2 in the fluidization medium, defined as sum of O2 provided by an ASU or alkaline electrolyzer plus recirculated flue gas, was defined by parameter β, being comparable to the air ratio λ for conventional air combustion calculations.
α = V ˙ F M , O 2 , R e a l V ˙ O 2 , S t o i c h i o m e t r i c = V ˙ O x . , O 2 , R e a l + V ˙ F G R , O 2 , R e a l V ˙ O 2 , S t o i c h i o m e t r i c .
A definition of the recirculation ratio r, the ratio of volume flow rate of recirculated flue gas related to the volume flow rate of generated flue gas, can be found in [21].
r = V ˙ F G R V ˙ F G .
Condenser modeling was done with the Antoine Equation (5) and water loading X of flue gas for specific temperatures (6). The assumed parameters A, B and C for water are listed in the Appendix A (Table A6). Parameters of water at the triple point (pTr. = 611.657 Pa) are stated in [22].
ln p S p T r . = A + B ϑ + C .
X = 0.622 · p S p p S .  
Assumed parameters regarding the BFBC’s design, based on benchmarks given in [23] for a thermal input of 20 MWth., are listed in the Appendix A (Table A7). BFBC is the best available technology for combusting fuels with high contents of volatiles (e.g., biomass) for small-scale decentralized applications [24].
To ensure the fluidization of bed material (e.g., silica sand and woodchips), a fluidization velocity uf of 1–2.5 m/s is recommended [25]. Mixing inside the reactor is increased significantly with increasing uf, leading to an improved combustion reaction regime. As a result, segregation of bed material is prevented and the bed’s heat transfer is improved [26].
The amount of utilized CO2 is a function of H2 provided by the alkaline electrolyzer, since H2 is required for CO2 hydrogenation inside the methanol reactor. In real applications, the generation of H2 will vary due to fluctuating power levels provided by a wind park. The share of utilized CO2 was defined by the allocation coefficient γ, describing the ratio of flue gas being transferred to downstream process steps and the total amount of flue gas generated. In case no H2 is generated by the electrolyzer, the total amount of generated flue gas is released into the atmosphere (γ = 0).
γ = V ˙ F G   t o   M e O H   s y n t h e s i s V ˙ F G ,   t o t a l .

2.2. Conventional Air Combustion in a BFBC

Comparing different process routes of a decentralized power-to-green methanol plant, processing CO2 generated by the combustion of woodchips, was the main goal of this work. Therefore, modeling a scenario using conventional air combustion technology based on assumptions listed in Section 2.1 was mandatory. The following differences were included:
  • Ambient air is used as fluidization medium instead of a mixture of O2 and recirculated flue gas;
  • Parameter β was replaced by λ (conventional air ratio);
Physical properties of air can be found in [22]. Components like H2O, CO2 and noble gases other than Argon were neglected.

2.3. Flue Gas Cleaning

A simplified flue gas cleaning model was introduced in the plant’s model. Desulfurization is realized by injecting Ca(OH)2 (i.e., slaked lime) into the gas stream prior to a baghouse filter unit, ensuring fly ash removal. SO2 and Ca(OH)2 react to CaSO3, subsequently collected by the baghouse filter, and water.
SO 2 + Ca OH 2 CaSO 3 + H 2 O .
The required mass flow rate of Ca(OH)2 for desulfurization was calculated stoichiometrically based on Equation (8) including an assumed excess of 50% Ca(OH)2. A desulfurization efficiency of 95% was assumed [27].
Removing NOx from the flue gas stream is achieved by using a SCR-DeNOx unit. NH4OH (i.e., ammonia water), with a concentration of 19–29 wt%, is inserted prior to a ceramic honeycomb catalyst at temperatures in the range of 453–703 K, resulting in the reduction of NOx to N2 and water [28].
4 NO + 4 NH 3 + O 2 4 N 2 + 6 H 2 O .
The flue gas’ NOx concentration was based on experimental data listed in [25]. Wooden pellets with a fuel-N content of 0.3 wt% (dry and ash free) were burned in a BFBC under lab conditions. NOx emissions are converted to the fuel-N content of the assumed woodchips stated in Section 2.1. The injected amount of NH4OH was assumed to be 50% larger than stoichiometrically required for the conversion of NOx according to Equation (9).

2.4. CO2 Processing

Before entering the methanol synthesis process, generated CO2 needs to be concentrated and processed. The applied technology depends on the upstream combustion technology (oxyfuel vs. air combustion). Flue gas produced by oxyfuel combustion processes is rich in CO2 after removing H2O in a condenser. Therefore, mainly excess O2 needs to be removed (inert N2 does not pose a problem in the downstream methanol synthesis process). When using conventional air combustion, CO2 needs to be captured and concentrated (e.g., realized by a monoethanolamine (MEA) absorption process). Both configurations require a catalyst protection unit, for example, a fixed bed reactor using ZnO or CuO as adsorbent to remove catalyst poisons (e.g., H2S and SO2) from the flue gas stream.

2.4.1. DeOxo Reactor

Removing excess O2 is necessary when using oxyfuel combustion technologies, since β will always exceed a value of 1. The following assumptions were made regarding the modeling of a DeOxo reactor:
  • Gases behave like ideal gases;
  • The amount of required H2 was calculated stoichiometrically;
  • H2O and N2 were considered inert gases and therefore, have no influence on the reactor’s performance;
  • Reactor pressure pDeOxo = 10 bar;
  • Heat required for the regeneration of activated alumina was not taken into account;
  • Reactor temperature TDeOxo = 323 K.
Equation (10) describes the reactor’s underlying chemical reaction. The catalyst bed must be cooled since the reaction is strongly exothermic. H2O is formed as product and needs to be separated by two adsorbent beds loaded with activated alumina. As noted previously, a catalyst guard unit must be installed in front of the DeOxo reactor.
H 2 + 1 2 O 2 H 2 O                     Δ H r 0 = 285.8 k J m o l .

2.4.2. CO2 Capture—MEA Absorption

CO2 capture based on absorption processes using aqueous MEA solutions obtain the highest technology readiness level (TRL) regarding carbon capture technologies [29] and are solely applicable at an industrial scale [30]. Detailed information regarding process parameters and reactor design can be found in [31]. Alternatively, CO2 capture processes can be realized using adsorption processes in fluidized bed reactors. Experimental data and data obtained from simulations can be found in [32,33,34,35,36,37].
The modeled CO2 capture system was required for process routes using conventional air combustion with flue gas CO2 concentrations below 20 vol%, including an absorber, a regenerator, conveyor units cycling the MEA solution and a heat exchanger improving the process’ heat integration. Main model input parameters were the amount of utilized flue gas as well as the flue gas’ composition. The first output stream, a purified CO2 stream, is transported to a downstream methanol synthesis unit. Off-gas, with a low concentration of CO2 leaving the regenerator, is added to non-utilized flue gas and emitted to the atmosphere. The following parameters have been assumed:
  • CO2 capture efficiency ηCapture = 0.9;
  • Energy demand Q C O 2 , M E A = 3.8 MJ/kg CO2 captured;
  • Absorber temperature TAbs. = 308 K;
  • Regenerator temperature TDes. = 393 K;
  • Pressure pAbs. = pDes. = pAtm.;
  • CO2 stream purity = 𝑦CO2 = 99 vol%.
Additionally, subsequent assumptions have been made:
  • Gases behave like ideal gases;
  • Stripping gas required for the desorption was not considered;
  • Examined species: CO2, H2O, O2, N2, SO2, Ar;
  • Non-CO2 gases had the same probability of getting dragged into the CO2-rich stream unintentionally.

2.5. Methanol Synthesis

The methanol synthesis is the facility’s core operation unit. Model input parameters were process streams given by the CO2 processing unit (DeOxo reactor or CO2 capture), as well as H2 generated by the alkaline electrolyzer. Methanol reaching a purity of 99.85 wt% (dry basis), as stated by the IMPCA [38], is obtained at the distillation column’s head. Water, a byproduct of CO2 hydrogenation, is obtained at the column’s bottom and recirculated to the electrolyzer surpassing a water treatment unit. Significant parameters of the methanol synthesis model were:
  • CO2 conversion rate ψ = 98.11% [39];
  • H2:CO2 ratio ω > 3.
Detailed information regarding the design and modeling of methanol synthesis units valorizing CO2 can be found in [3,8,9,17,40,41].
Methanol is synthesized in a single multi-tubular fixed-bed BWR with closed-loop configuration. The evaporation of boiling water ensures an isothermal operation by transferring reaction heat. Catalyst bed cooling is mandatory, since agglomeration of catalyst particles (a conventional Cu/ZnO/Al2O3 catalyst is applied for methanol synthesis) occurs as soon as a critical temperature level inside the reactor is exceeded [40]. The reactor’s input streams are CO2, H2 as well as unconverted gases (a mixture of CO2, CO and H2). The output stream consists of methanol, water and unconverted gases being conveyed to a downstream flash drum. The main chemical reactions occurring are the following:
CO 2 + 3 H 2 CH 3 OH + H 2 O                     Δ H r 298 K , 50 b a r = 40.9 k J m o l .
CO 2 +   H 2 CO + H 2 O                     Δ H r 298 K , 50 b a r = 42.0 k J m o l .
Low temperature and high pressure levels favor the conversion of CO2 following the principle of Le Chatelier. Regarding the temperature inside the reactor, a trade-off between thermodynamics (favored by low temperatures) and kinetics (favored by high temperatures) needs to be found. Furthermore, a critical temperature level must not be exceeded to avoid catalyst deactivation. Preventing the occurrence of the reverse water–gas shift reaction (12) is another key aspect for reactor design, since CO2 and H2 are reactants for the main reaction (11). A minimum H2:CO2 ratio of 3 must be ensured inside the reactor to prevent the formation of elemental C due to the Boudouard reaction [40]. The reactor was chosen to operate at a temperature of TMeOH = 513 K and a pressure of pMeOH = 40 bar.
Separating crude methanol from non-condensable gases is realized by a flash drum following the BWR. Product gas leaving the reactor is cooled to a temperature of TFD = 323 K by depressurization over a relief valve. Condensed H2O and methanol are pumped to a downstream distillation column, whereas non converted gases are recycled back to the reactor inlet including a compression step to pMeOH = 40 bar. The mass flow rate of recirculated gases was calculated with a mass balance over the methanol reactor at steady state (13). The mass flow rate of excess H2 was calculated by subtracting the required stoichiometric volume flow rate of H2 from the real volume flow rate of H2 going into the reactor (14), whereas the mass flow rate of unconverted CO2 was defined by the CO2 conversion rate ψ (15). Conversions regarding mass, volume and material balances were conducted with parameters listed in the Appendix A (Table A4).
m ˙ U n c . = m ˙ C O 2 , U n c . + m ˙ H 2 , E x c e s s .  
V ˙ H 2 , E x c e s s = V ˙ H 2 , M e O H 3 · V ˙ C O 2 , M e O H .
n ˙ C O 2 , U n c . = 1 ψ · n ˙ C O 2 .
Product separation is realized with a conventional distillation column including the following assumptions:
  • TFeed = 353 K;
  • THead = 337 K;
  • TBottom = 373 K;
  • Mass fraction of methanol in the feed m’Feed = 64 wt% (50 mol% methanol);
  • Mass fraction of methanol in the head m’Head = 99.85 wt% [38].

2.6. Alkaline Electrolyzer

The required mass flow rate of H2 depends on the amount of utilized CO2 defined by the allocation coefficient γ, the DeOxo reactor’s H2 demand for process routes including oxyfuel combustion, as well as the chosen H2:CO2 ratio ω. The electrolyzer’s power and water demands were defined by the mass flow rate of valorized CO2. In addition to H2, O2 is generated by water splitting, which can either be used as oxidant for process routes, including oxyfuel combustion, or be sold as by-product.
The underlying chemical reactions of water splitting for alkaline electrolysis cells, as well as further information regarding electrolytes, can be found in [42].
Conventional alkaline electrolyzers operate at pressure levels ranging from 1 to 30 bar and at temperatures below 353 K to prevent material degradation [43].
The following assumptions were made:
  • pElectrolyzer = 32 bar;
  • TElectrolyzer = 353 K;
  • Specific power demand of 4.45 kWh/Nm3 H2;
  • Specific water demand of 0.804 kg/Nm3 H2.

2.7. Energy Balance Model

2.7.1. Global Efficiency and Power-to-Liquid Efficiency

The plant’s global efficiency rate ηTot. includes chemical energy stored in produced methanol U ˙ M e O H and heat provided to adjacent villages via a district heating network Q ˙ D H (Outputs), as well as chemical energy stored in woodchips U ˙ Woodchips , the electrolyzer’s electricity demand PElectrolyzer and the ASU power input PASU (Inputs) (16). Chemical energy stored in woodchips and methanol was calculated with Equation (17).
η T o t . = U ˙ M e O H + Q ˙ D H U ˙ W o o d c h i p s + P E l e c t r o l y z e r + P A S U .
U ˙ Fuel / Product   =   m ˙ Fuel / Product · LHV Fuel / Product
The plant’s power-to-liquid efficiency is defined by Equation (18) [44].
P t L e f f i c i e n c y = F u e l   o u t p u t E l e c t r i c i t y   i n p u t .

2.7.2. Combined Heat and Power (CHP) Process

Since the plant needs to be able to cover its on-site demand, even if no wind is available, adding a steam turbine for power generation is mandatory. Generated electricity surpassing the plant’s on-site demand is used to power the alkaline electrolyzer. CHP output parameters undergo seasonal variations. In winter months the focus is to provide as much heat as possible for nearby villages, whereas the power output will be maximized in summer. The following maximum efficiencies, related to the thermal input into the BFBC, were assumed:
  • Maximum electric efficiency ηCHP,el.,max. = 25%;
  • Maximum thermal efficiency ηCHP,th.,max. = 65%.

2.7.3. Wind Park

Wind power should be prioritized over solar power due to the lower specific CO2-equivalent per kg H2 generated [40]. Manufacturers of commercial wind turbines generally list their products’ performance as rated power, and add graphs displaying the turbine’s annual energy production as the function of the average wind speed at hub height. Calculating real annual average power outputs of wind turbines can be done for annual average wind velocities of certain regions. A hyperlink to the Austrian Windatlas can be found in [45], indicating annual average wind velocities at a height of 100 m above ground level.
The following assumptions, regarding a wind park adjacent to the designed power-to-green methanol plant, were made:
  • Annual average wind velocity uWind = 7.5 m/s;
  • 12 wind turbines with a total rated power of PWind park = 36 MWp;
  • Annual average power level of PWind park = 17.14 MW at uWind = 7.5 m/s (47.6% of the rated power).

2.7.4. Fluidization of Fuel and Bed Material

To ensure the fluidization of fuel and bed material, a blower is required for overcoming the pressure difference caused by the bed itself, the distributor plate, a baghouse filter, a SCR-DeNOx unit and a condenser, as indicated in Equation (19). The pressure drop due to the fluidization of fuel and bed material was calculated with Equation (20). Typical properties of silica sand as bed material are listed in the Appendix A (Table A8).
Δ p B l o w e r = Δ p B e d + Δ p D i s . + Δ p B a g . + Δ p S C R + Δ p C o n .
Δ p B e d = 1 ε · ρ P ρ g · g · h B e d .
The following assumptions were made:
  • 80% of ΔpBFBC were caused by fuel and bed;
  • 20% of ΔpBFBC were caused by the distributor plate;
  • Pressure drop caused by the baghouse filter ΔpBag. = 2000 Pa;
  • Pressure drop caused by the SCR-DeNOx unit ΔpSCR = 500 Pa;
  • Pressure drop caused by the condenser ΔpCon. = 5000 Pa;
  • Blower efficiency ηBlower = 0.9.
Consequently, the required power could be calculated using Equation (21). A power reserve was added to ensure smooth operation for real applications.
P B l o w e r = V ˙ · Δ p B l o w e r η B l o w e r + P R e s e r v e .

2.7.5. Conveyor Units

A screw conveyor, fans and pumps were added to the model to estimate the plant’s on-site demand. Compared to major energy consuming units (i.e., compressors, alkaline electrolyzer and ASU), the power demand of conveyor units was almost negligible. Estimations, using conventional models to calculate parameters like the pipe friction factor ξ, the Reynolds number Re and the pressure drop per length unit Δp, were added. The screw conveyor’s power demand was set constant at a value of 0.7 kW for the assumed input of woodchips, based on an online tool calculating the power demand of bulk handling systems [46].

2.7.6. Compressors

Compressors are needed to realize required pressure levels inside the DeOxo (pDeOxo = 10 bar) and methanol synthesis reactor (pMeOH = 40 bar). The following assumptions were made:
  • Gases behave like ideal gases;
  • Isothermal change of states;
  • Compressor efficiency ηCompr. = 0.9;
  • The stream of unconverted, recirculated gases consists of 33.33 vol% of H2, CO and CO2, respectively.
The specific technical work for compressing gas streams was calculated by Equation (22). Consequently, the required power could be calculated by Equation (23). Values regarding specific gas constants of relevant species Ri can be found in the Appendix A (Table A5).
w t = R i · T · ln p 2 p 1 .
P C o m p r . = m ˙ i · w t η C o m p r . .

2.7.7. Air Separation Unit

For the implementation of process routes involving oxyfuel combustion, the addition of an ASU is mandatory, since plant operation must be independent from daily and seasonal wind fluctuations. If uWind falls below a threshold of 3–4 m/s, no power is generated by the wind park and hence no O2 is generated by the electrolyzer. As a result, the ASU should be connected to the local power grid to avoid plant downtime. For simplification purposes, only N2, O2 and Ar output streams were considered. Additionally, a specific energy consumption of 0.45 kWh/Nm3 O2 was assumed. Finding the required volume flow stream of O2 provided by the ASU was done with Equation (24).
V ˙ A S U , O 2 = V ˙ O x . , O 2 V ˙ E l e c t r o l y z e r , O 2 .

3. Results and Discussion

After modeling subprocesses and linking them together, several operating points were defined by varying critical model parameters (mainly the current wind velocity uwind and, consequently, the possible share of utilized CO2 γ). Mass, material, volume and energy balances were evaluated for defined operating points. Values assumed for the CHP process refer to an operation during winter months, aiming to maximize the output of heat transferred to a district heating network ( Q ˙ C H P = 13 MWth., PCHP = 3 MW). In this work the total amount of electricity generated by an adjacent wind park (rated power of PWind park = 36 MWp) and power generated by the CHP process was used for H2 production. Using only surplus electricity, not required by supplied villages, might pose a promising alternative process configuration. However, this case was not considered in this paper.

3.1. Oxyfuel Combustion

Parameters regarding oxyfuel combustion (α, β, r, TCon.) are constant for all operating points due to a constant thermal input of 20 MWth.. Figure 2 shows a detailed flow chart of the oxyfuel combustion model including mass and volume balances. A total input of 6133 kg/h woodchips (thermal load of 20 MWth.) with properties assumed in Section 2.1 and 6187 kg/h O2 is required. A recirculation ratio of r = 4 ensures a fluidization velocity of uf = 1–2 m/s (21,664 Nm3/h of fluidization medium). Since biomass requires a relatively high amount of O2 in the fluidization medium to avoid incomplete combustion, a value of α = 1.08 was chosen (β = 1.4). The volume flow rate of generated flue gas is V ˙ F G = 4333 Nm3/h, obtaining a CO2 concentration of 89.8 vol% at a temperature of 288 K. Main impurities are excess O2 (7.41 vol%), H2O (2.48 vol%) and N2 (0.31 vol%). A mass flow rate of 4066 kg/h condensed water is pumped to the alkaline electrolyzer after passing a water treatment unit. A total of 2.54 kg/h NH4OH and 7.23 kg/h Ca(OH)2 are required for the removal of NOx and SOx. A baghouse filter was added to the flowchart for dust removal without being analyzed in further detail.

3.2. Reference Operating Point—Oxyfuel Combustion

The “reference operating point” serves as a benchmark for process routes, including oxyfuel combustion, with all parameters set at average values. As aforementioned, the wind park consists of 12 windmills with a rated power of 3 MWp each. Parameter uWind was assumed to be 7.5 m/s at hub height corresponding to the Austrian Windatlas [45]. A total of 1637.4 kg/h methanol is produced utilizing 30% (about 2300 kg/h) of generated CO2 (γ = 0.3). Process indicators, including specific consumptions per kg methanol produced, can be found in Table 3. A total of 10.76 kWh of power is required per kg methanol produced. Key parameters for the reference operating point are listed in Table 4. To meet the BFBC’s total O2 demand of 6187 kg/h, 3437 kg/h O2 (55.55%) needs to be provided by an ASU (in addition to 2713 kg/h O2 (44.45%) provided by the electrolyzer), resulting in a power demand of PASU = 4.73 MW. The facility’s input and output streams can be found in the Appendix A (Table A2). The on-site demand of 0.72 MW is calculated in Table A3, listed in the Appendix A. A global power balance is listed in Table 5, showing a power input into the electrolyzer of PElectrolyzer = 17.14 MW, as well as a power input into the ASU of PASU = 4.73 MW.
Results regarding the subprocesses are visualized in the figures below. The mass and material balance of the DeOxo model, using parameters stated in Table 4, are illustrated in Figure 3. For γ = 0.3, a total of V ˙ F G = 1300 Nm3/h with a CO2 concentration of 𝑦CO2 = 89.8 vol% needs to be processed by the DeOxo reactor. Excess O2, with a material flow rate of n ˙ O 2 = 4.3 kmol/h (7.41%), is separated catalytically with H2 generated by the alkaline electrolyzer ( V ˙ H 2 = 193 Nm3/h). A total amount of 2292 kg/h CO2 with a purity of 99.66 vol% is provided for the downstream methanol synthesis process step.
A material and mass balance of the methanol synthesis for the reference operating point is shown in Figure 4. A total of 52.09 kmol/h of CO2, provided by the upstream DeOxo reactor, as well as recirculated unconverted gases are transferred into the reactor alongside 160.97 kmol/h H2 (resulting in a H2:CO2 ratio of ω = 3.09). The gas mixture containing CO2, CO, H2 and small impurities of N2 is compressed before passing the Cu/ZnO/Al2O3 catalyst bed inside the BWR’s tubes, at a temperature of TMeOH = 240 °C and a pressure of pMeOH = 40 bar. The reaction products, methanol and H2O, are then separated from non-condensable gases in a flash drum by depressurization to pAtm.. Subsequently, crude methanol is separated into methanol (1637 kg/h) and H2O (920 kg/h) in a multi-staged distillation column.
H2 required for CO2 purification in the DeOxo reactor and CO2 hydrogenation is generated by an alkaline electrolyzer. A total of 3056 kg/h of H2O and 17.14 MW power are required to produce V ˙ H 2 = 3800 Nm3/h and V ˙ O 2 = 1900 Nm3/h at process conditions of TElectrolyzer = 80 °C and pElectrolyzer = 32 bar. Figure 5 shows the alkaline electrolyzer’s balance for the reference operating point.

3.3. Air Combustion and Methanol Synthesis—Operating Point “Air”

Determining whether oxyfuel combustion or conventional air combustion should be prioritized to maximize the facility’s efficiency rates is a key aspect of this paper. The air combustion model is based on the oxyfuel model with some adaptions (i.e., using λ as the combustion parameter instead of α and applying a MEA absorption process for CO2 processing). Table 6 and Table 7 present process indicators as well as key parameters regarding the “Air” operating point. Compared to the reference operating point applying oxyfuel combustion, the specific power consumption of 9.829 kWhel./kg methanol is significantly lower since no additional H2 is required for flue gas processing. A global power balance is stated in Table 8. The plant’s on-site demand is calculated similarly, as explained previously for the “reference operating point”. The facility’s on-site demand of 0.8 MW is slightly higher compared to the reference operating point’s on-site demand of 0.72 MW, since more power is required for gas compression due to a higher CO2 utilization rate of γ = 0.35. This configuration obtains a methanol output of about m ˙ M e O H = 1719 kg/h.
Mass and volume balances of the air combustion model including flue gas treatment units can be found in Figure 6. Since air is used as fluidization medium, the amount and composition of emitted flue gas differ significantly in comparison with oxyfuel combustion. A volume flow rate of V ˙ F G = 27,175 Nm3/h with a CO2 concentration of only 14.33 vol% is either emitted to the atmosphere or processed in a downstream CO2 capture unit. 22,968 Nm3/h air are required to achieve an air ratio of λ = 1.2. A total of 4066 kg/h of condensed water is pumped to the electrolyzer surpassing a water treatment unit. The balance of MEA absorption cycle processing of 35% (γ = 0.35) of generated flue gas can be found in Figure 7, processing a volume flow rate of V ˙ F G = 9511 Nm3/h in the absorber at TAbs. = 308 K. CO2 is absorbed by a cycling MEA solution ( m ˙ M E A = 53,136 kg/h) and subsequently released in the desorber at TDes. = 393 K, demanding 2.54 MW thermal power for regeneration. A mass flow rate of purified CO2  m ˙ C O 2   = 2407 kg/h with a purity larger than 99 vol% is conveyed to the downstream methanol synthesis process step. Since small shares of CO2 and other components are not absorbed, V ˙ F G , L e a n = 8137 Nm3/h is emitted to the atmosphere with a CO2 concentration of 2.54 vol%.
After being purified, the CO2 stream is valorized to methanol, as explained in Section 2.5. The reactor’s input streams are n ˙ C O 2 = 54.69 kmol/h and n ˙ H 2 = 169.57 kmol/h, resulting in a H2:CO2 ratio of ω = 3.1. After being separated in a distillation column, a product stream of 1719 kg/h methanol and 966 kg/h H2O are acquired. Figure 8 shows the methanol synthesis’ balance.
Similar to the oxyfuel process route, H2 is provided by an alkaline electrolyzer powered by a wind park. Input parameters ( m ˙ H 2 O   = 3056 kg/h and PElectrolyzer = 17.14 MW) and output parameters ( V ˙ H 2   = 3800 Nm3/h and V ˙ O 2   = 1900 Nm3/h) are similar to the reference operating point described in Section 3.2.

3.4. Sensitivity Analysis

A sensitivity analysis was conducted to present how critical model parameters (e.g., α, γ, ω, uWind) affect the facility’s performance.

3.4.1. O2 Supply for Oxyfuel Process Routes

For process routes including oxyfuel combustion, a constant mass flow rate of m ˙ O 2 = 6187 kg/h must be provided to maintain the combustion reaction (α = 1.08, β = 1.4, m ˙ W o o d c h i p s = 6133 kg/h, thermal heat load = 20 MWth.,). The mass flow rate of O2 into the combustor, as well as the flue gas’ O2 concentration, are a function of α. Higher O2 concentrations lead to an increased H2 demand of the DeOxo reactor and hence results in the plant’s performance parameters’ decrease. Figure 9 shows how m ˙ O 2 (blue line) and y F G ,   O 2 (red line) are influenced by α. Small values of α conclude in a smaller power demand of ASU and CO2 purification; however, they will possibly lead to incomplete combustion regimes.
The provided volume flow rate of O2 is a mixture of O2 generated by an ASU and the electrolyzer as by-product of water splitting. Figure 10 displays the share of O2 provided for the oxyfuel combustion by an ASU and the alkaline electrolyzer, with a power input of PElectrolyzer = 17.14 MW, for the reference operating point (γ = 0.3, see Section 3.2). An O2 stream of 1925.84 Nm3/h is provided by the electrolyzer (44.45%), 2406.96 Nm3/h is provided by the ASU (55.55%) to meet the oxyfuel combustor’s total demand of 4332.8 Nm3/h as indicated by the green line. The “break-even point” of O2 supply is reached at PElectrolyzer = 38.56 MW. Consequently, oxyfuel process routes do not require an additional ASU if γ > 0.7, hence operating points surpassing an allocation coefficient of 0.7 produce excess O2 as by-product, making oxyfuel combustion a viable option for large-scale applications.

3.4.2. Methanol Production and Analyzed Operating Points

H2 production was identified as the facility’s bottleneck defining the output of methanol. The amount of H2 provided by the electrolyzer depends on the electrolyzer’s size (=const.), the wind park’s size (=const.) and the wind velocity (≠const.). Depending on these parameters, the allocation coefficient γ can reach values between 0 (no flue gas is processed to methanol) and 1 (the total amount of flue gas is processed to methanol). Besides operating points explained previously (reference operating point and operating point “Air”), additional operating points were analyzed by varying uWind, γ and PWind park, as displayed in Table 9. Operating point “Dead Calm” refers to a scenario with no power generated by the wind park due to uWind = 0 m/s, thus the electrolyzer is only powered with surplus electricity generated by the CHP process (PElectrolyzer = 2 MW). The maximum yield of methanol can be produced in combination with a wind park at a rated power of PWind park = 123 MWp and uWind = 7.5 m/s, as indicated by operating point “Max.MeOH”. Processing the whole amount of generated CO2 (γ = 1.0) would require a power input into the electrolyzer of about 60 MW. Therefore, this scenario is not realistic regarding the size of currently used electrolyzer units. At uWind = 4 m/s, the lowest possible wind velocity for wind turbines to operate economically feasible, a yield of 545.8 kg/h of methanol can be produced (γ = 0.1, PWind park = 36 MWp). A total of 3274.7 kg/h of methanol can be produced at wind velocities surpassing uWind = 12 m/s (γ = 0.6, PWind park = 36 MWp).
The mass flow rate of produced methanol (green line), as well as the required power input of the electrolyzer (red line) as a function of allocation coefficient γ, can be found in Figure 11.

3.4.3. H2 Demand

Producing renewable H2 is the determining factor when regarding the conceptualized power-to-green methanol plant’s power consumption. Stoichiometrically, a H2:CO2 ratio ω larger than 3 is mandatory. For real applications, ω is expected to be set at values ranging from 3 to 3.5. Increasing mass flow rates of H2 for methanol production as a function of ω are displayed in Figure 12. The electrolyzer’s required power input ranges from PElectrolyzer = 15.58 MW (ω = 3, m ˙ H 2 = 314.86 kg/h) to PElectrolyzer = 18.18 MW (ω = 3.5, m ˙ H 2 = 367.34 kg/h) for the reference operating point, as stated in Section 3.2 (γ = 0.3). The reader should keep in mind that these values only serve as benchmarks, since recirculated gases (H2, CO, and CO), which are not discussed in this concept, will have a significant impact on the reactor’s operating parameters for real application scenarios.

3.5. Global Efficiency and Power-to-Liquid Efficiency

Obtained efficiency rates for operating points presented in Section 3.4.2 are listed in Table 10. When analyzing process routes including oxyfuel combustion, ηTot.,Oxy increases with increasing γ, obtaining a maximum of ηTot.,Oxy = 57.04% (γ = 0.6) for the “Max. Wind” operating point. ηPtL,Oxy increases with increasing γ, obtaining a maximum of ηPtL,Oxy = 51.91% (γ = 1) for the operating point “Max MeOH”. Increasing the wind park’s size (γ↑); therefore, leads to increased efficiency rates, ηTot.,Oxy and ηPtL,Oxy, for oxyfuel process routes. This can be explained by the fact that no additional O2 needs to be provided by an ASU if γ > 0.7 (PElectrolyzer > 38.56 MW), as mentioned in Section 3.4.1, resulting in a significantly decreasing global power consumption. Therefore, power-to-green methanol plants based on oxyfuel combustion routes obtain significantly higher efficiency rates at a large scale.
Significant deviations can be found when comparing process routes, including oxyfuel combustion (reference operating point) to conventional air combustion (“Air”), obtaining comparable methanol product output streams ( m ˙ R e f e r e n c e = 1637.4 kg/h, m ˙ A i r = 1719.2 kg/h). The PtL efficiency of operating point “Air” ηPtL,Air = 54.21% is substantially higher than the PtL efficiency of the reference operating point ηPtL,Reference = 40.91%. Two reasons need to be highlighted: Firstly, the ASU’s high-power consumption, providing 44.45% of the combustion’s O2 demand, has a negative impact on ηPtL. Secondly, H2 needs to be provided for CO2 processing in the DeOxo reactor, resulting in a significant penalty on ηPtL.

3.6. Case Study for One Year of Operation

The power-to-green methanol plant’s expected annual input and output parameters are determined in this Section. Adjacent villages are supplied with heat generated by the CHP process via a district heating network. Electricity generated by the CHP process and the wind park is used for the generation of green H2 needed to produce methanol. It was assumed that electricity is solely used to power the alkaline electrolyzer. Alternatively, surplus electricity generated by the wind park may be stored chemically by producing green methanol. The following assumptions were made:
  • The CHP process output undergoes seasonal fluctuations obtaining a total efficiency of ηCHP,Tot. = 80% with respect to a thermal input of 20 MWth.;
  • Electricity generated by the CHP process is used to power the alkaline electrolyzer;
  • The plant’s on-site power demand was set at 0.72 MW, referring to the reference operating point analyzed in Section 3.2;
  • The plant is out of operation for three consecutive weeks in June for revision and maintenance work (8256 operating hours per year);
  • PWind park = 17.14 MW (annual average output—reference operating point);
  • Seasonal fluctuations of the wind park’s power generation in central Europe were based on Figure A1 in the Appendix A;
  • Power consumption of 10.32 kWh/kg methanol produced;
  • Power consumption of 4.415 kWh/year and household;
  • Heat demand of 1.8 kW/household in winter (central Europe).
CHP operation parameters for one year of operation are listed in Table 11, including an annual heat output of 99,528 MWhth. and an annual power output of 26,622 MWh. The power output will be maximized in summer since no heat needs to be transferred to a district heating network. The wind park’s monthly power generation over the year is listed in Table 12. A total of 150,382 MWh of power was expected to be generated by the wind park per year. The wind index indicates the wind park’s potential to generate power throughout the year for Central Europe, obtaining its maximum throughout winter months. Plant revision and maintenance was scheduled in June considering that the wind park’s power output is expected to be lowest during summer.
Table 13 provides a summary, based on the reference operating point presented in Section 3.2, of the expected annual input and output streams of the designed power-to-green methanol plant. For an annual input of 50,632 t/a woodchips, a total of 17,161 t/a methanol, equivalent to 177.11 GWh/a of power, can be produced. Additionally, 99.53 GWhth./a heat is provided to adjacent settlements via a district heating network.

4. Conclusions

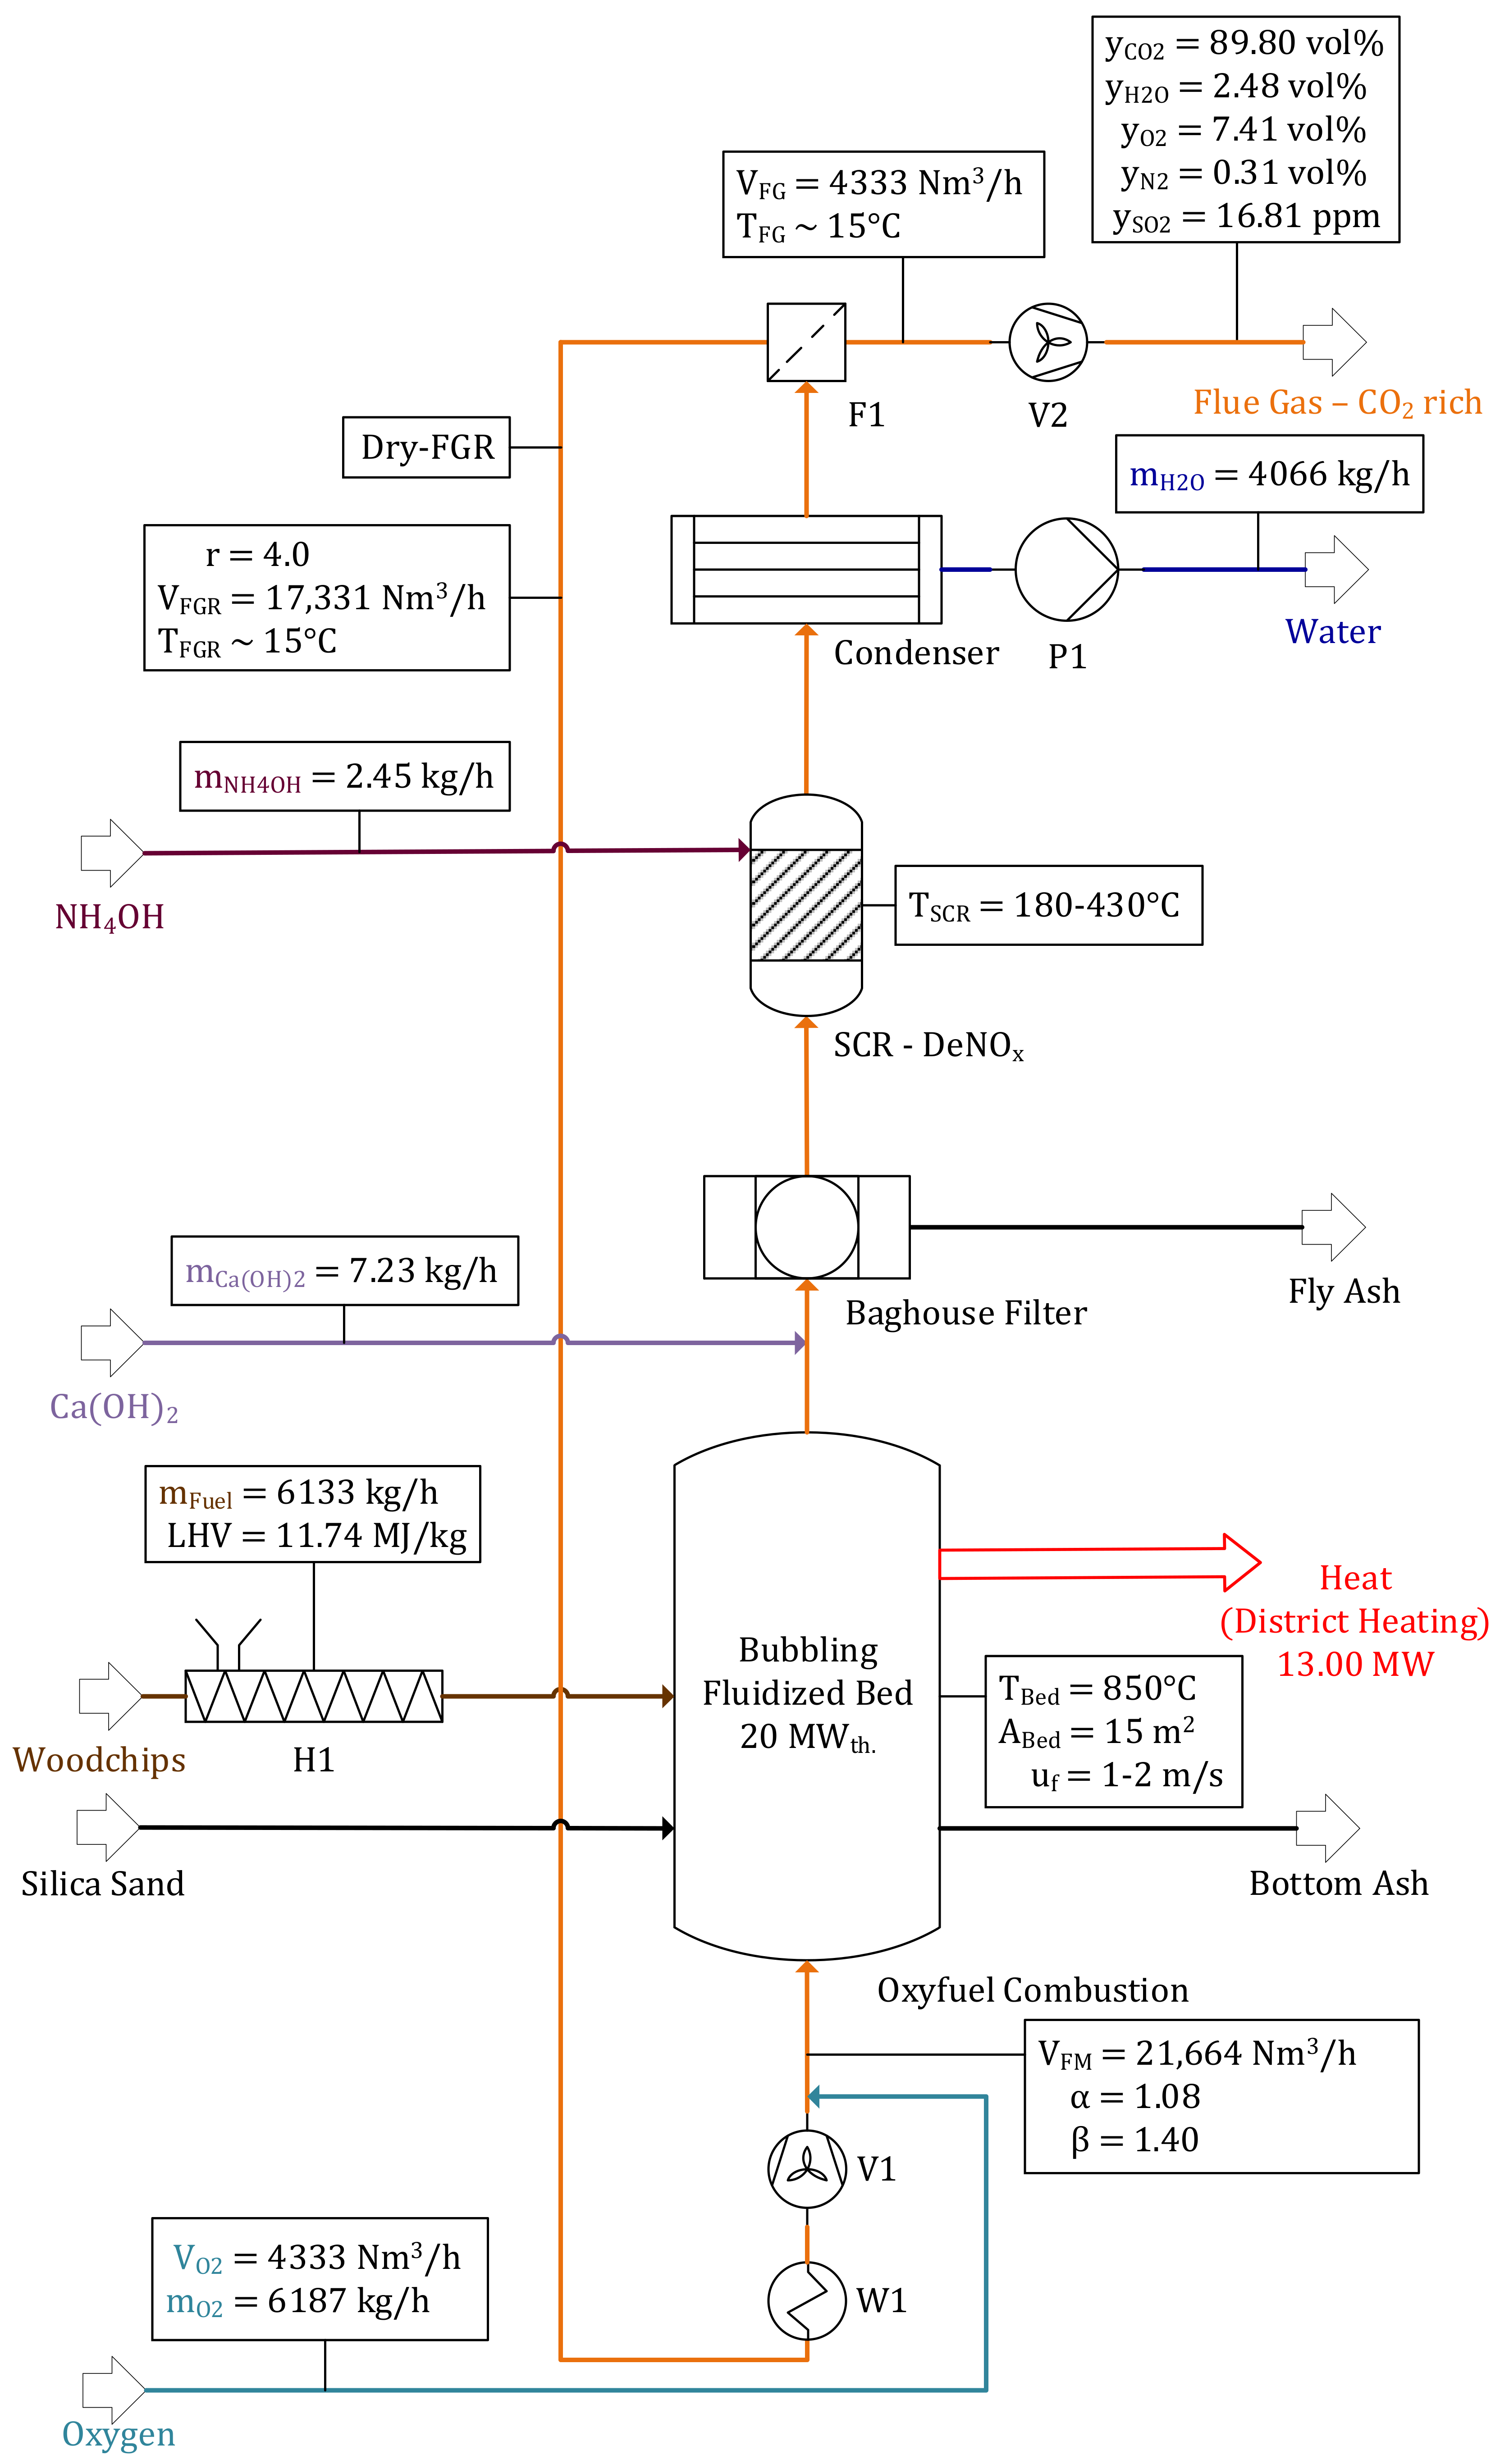
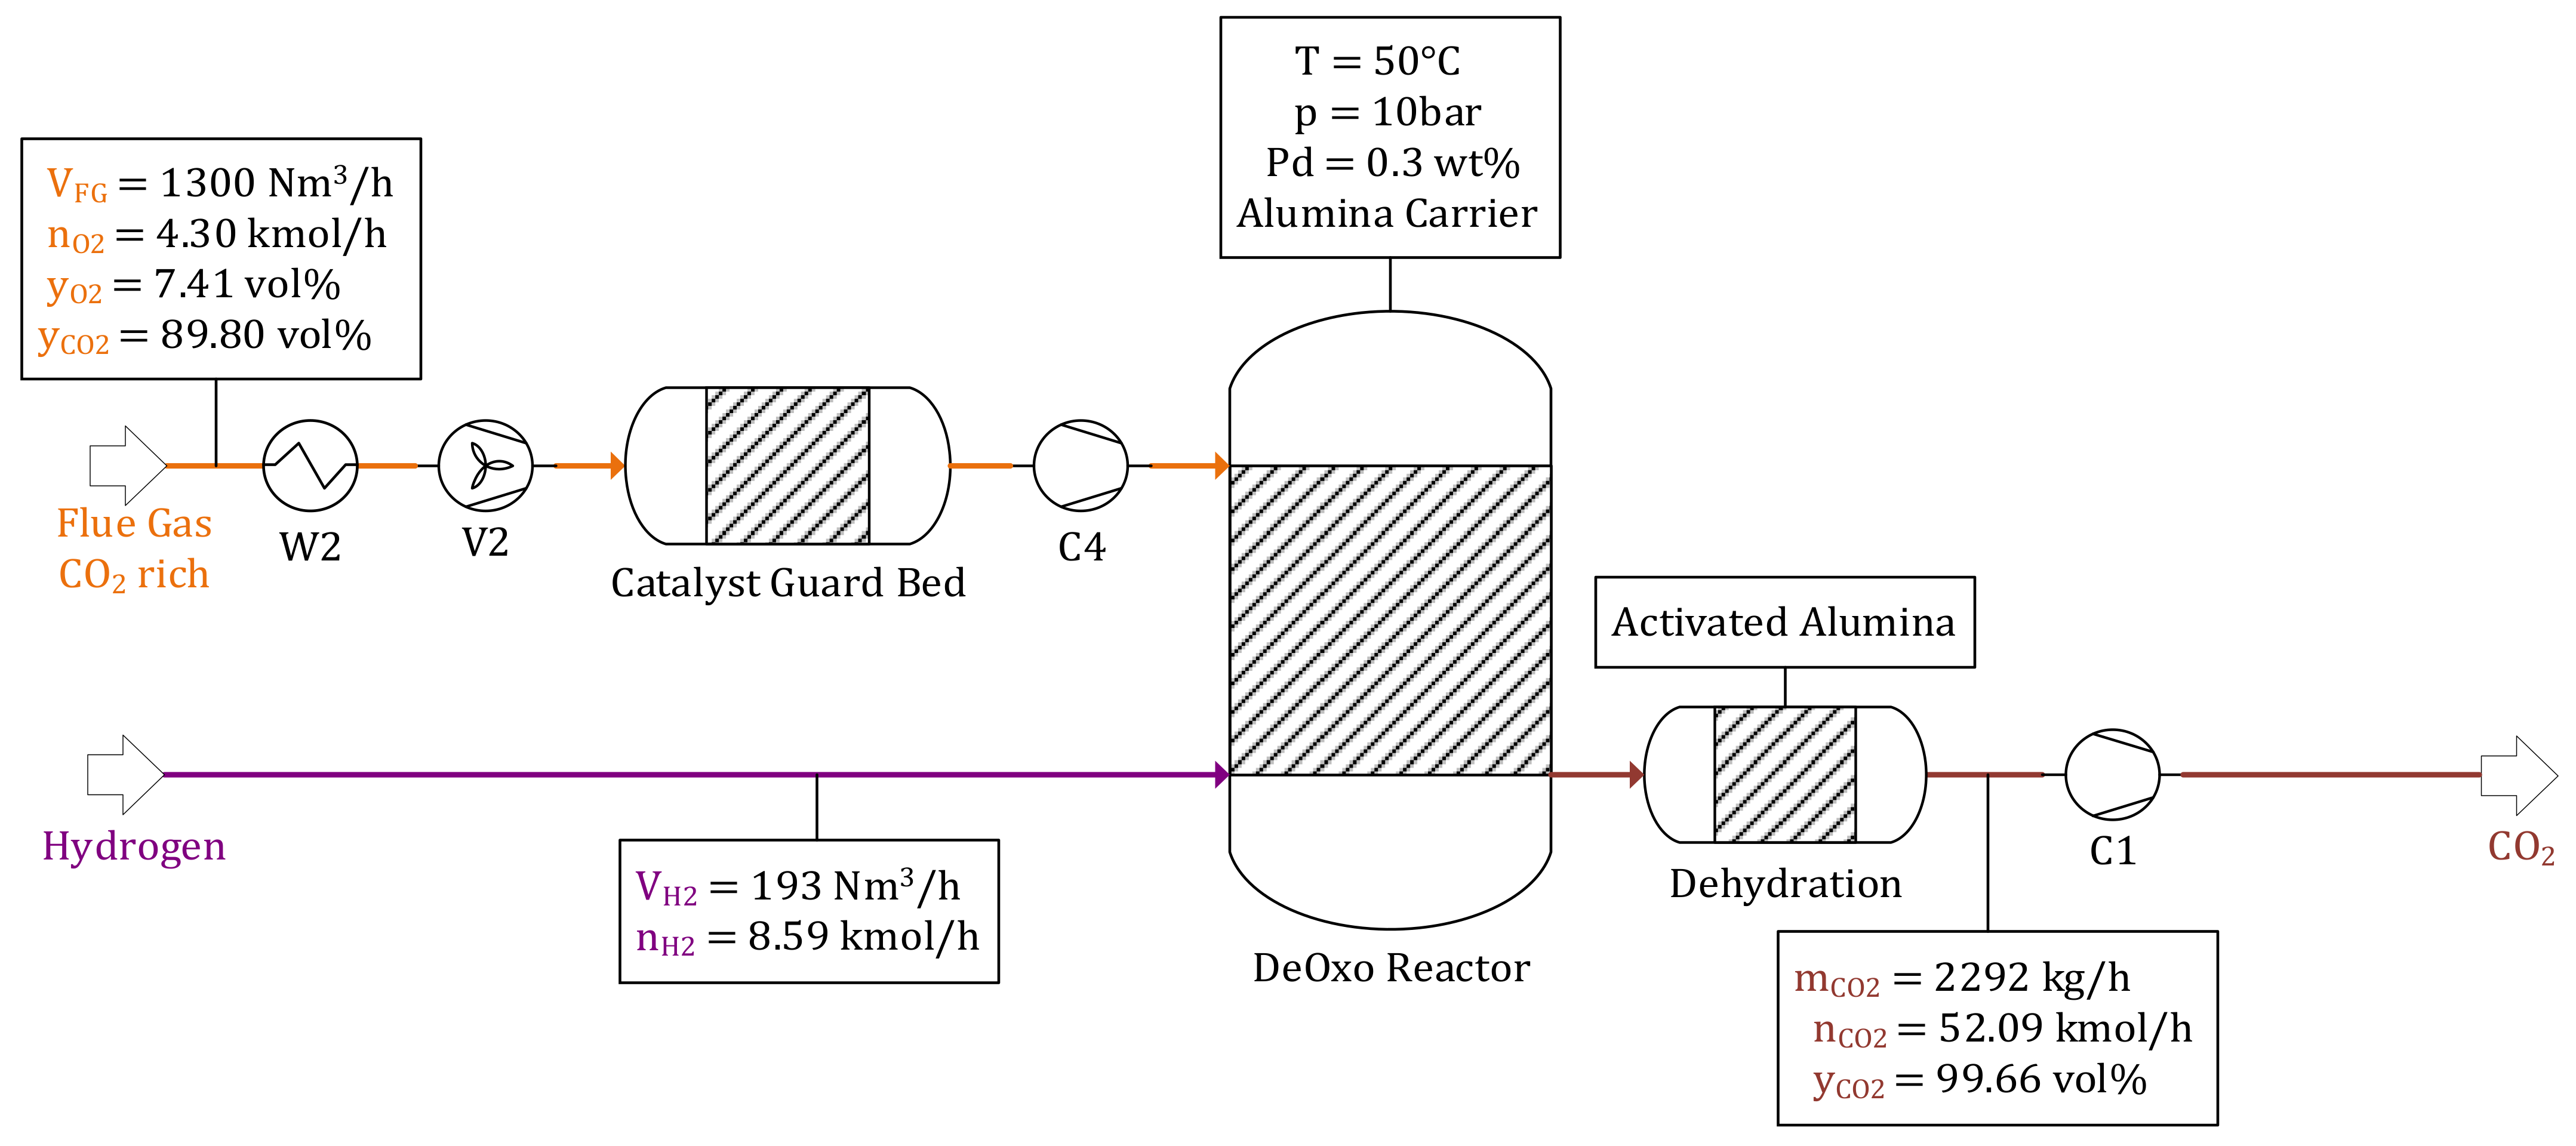
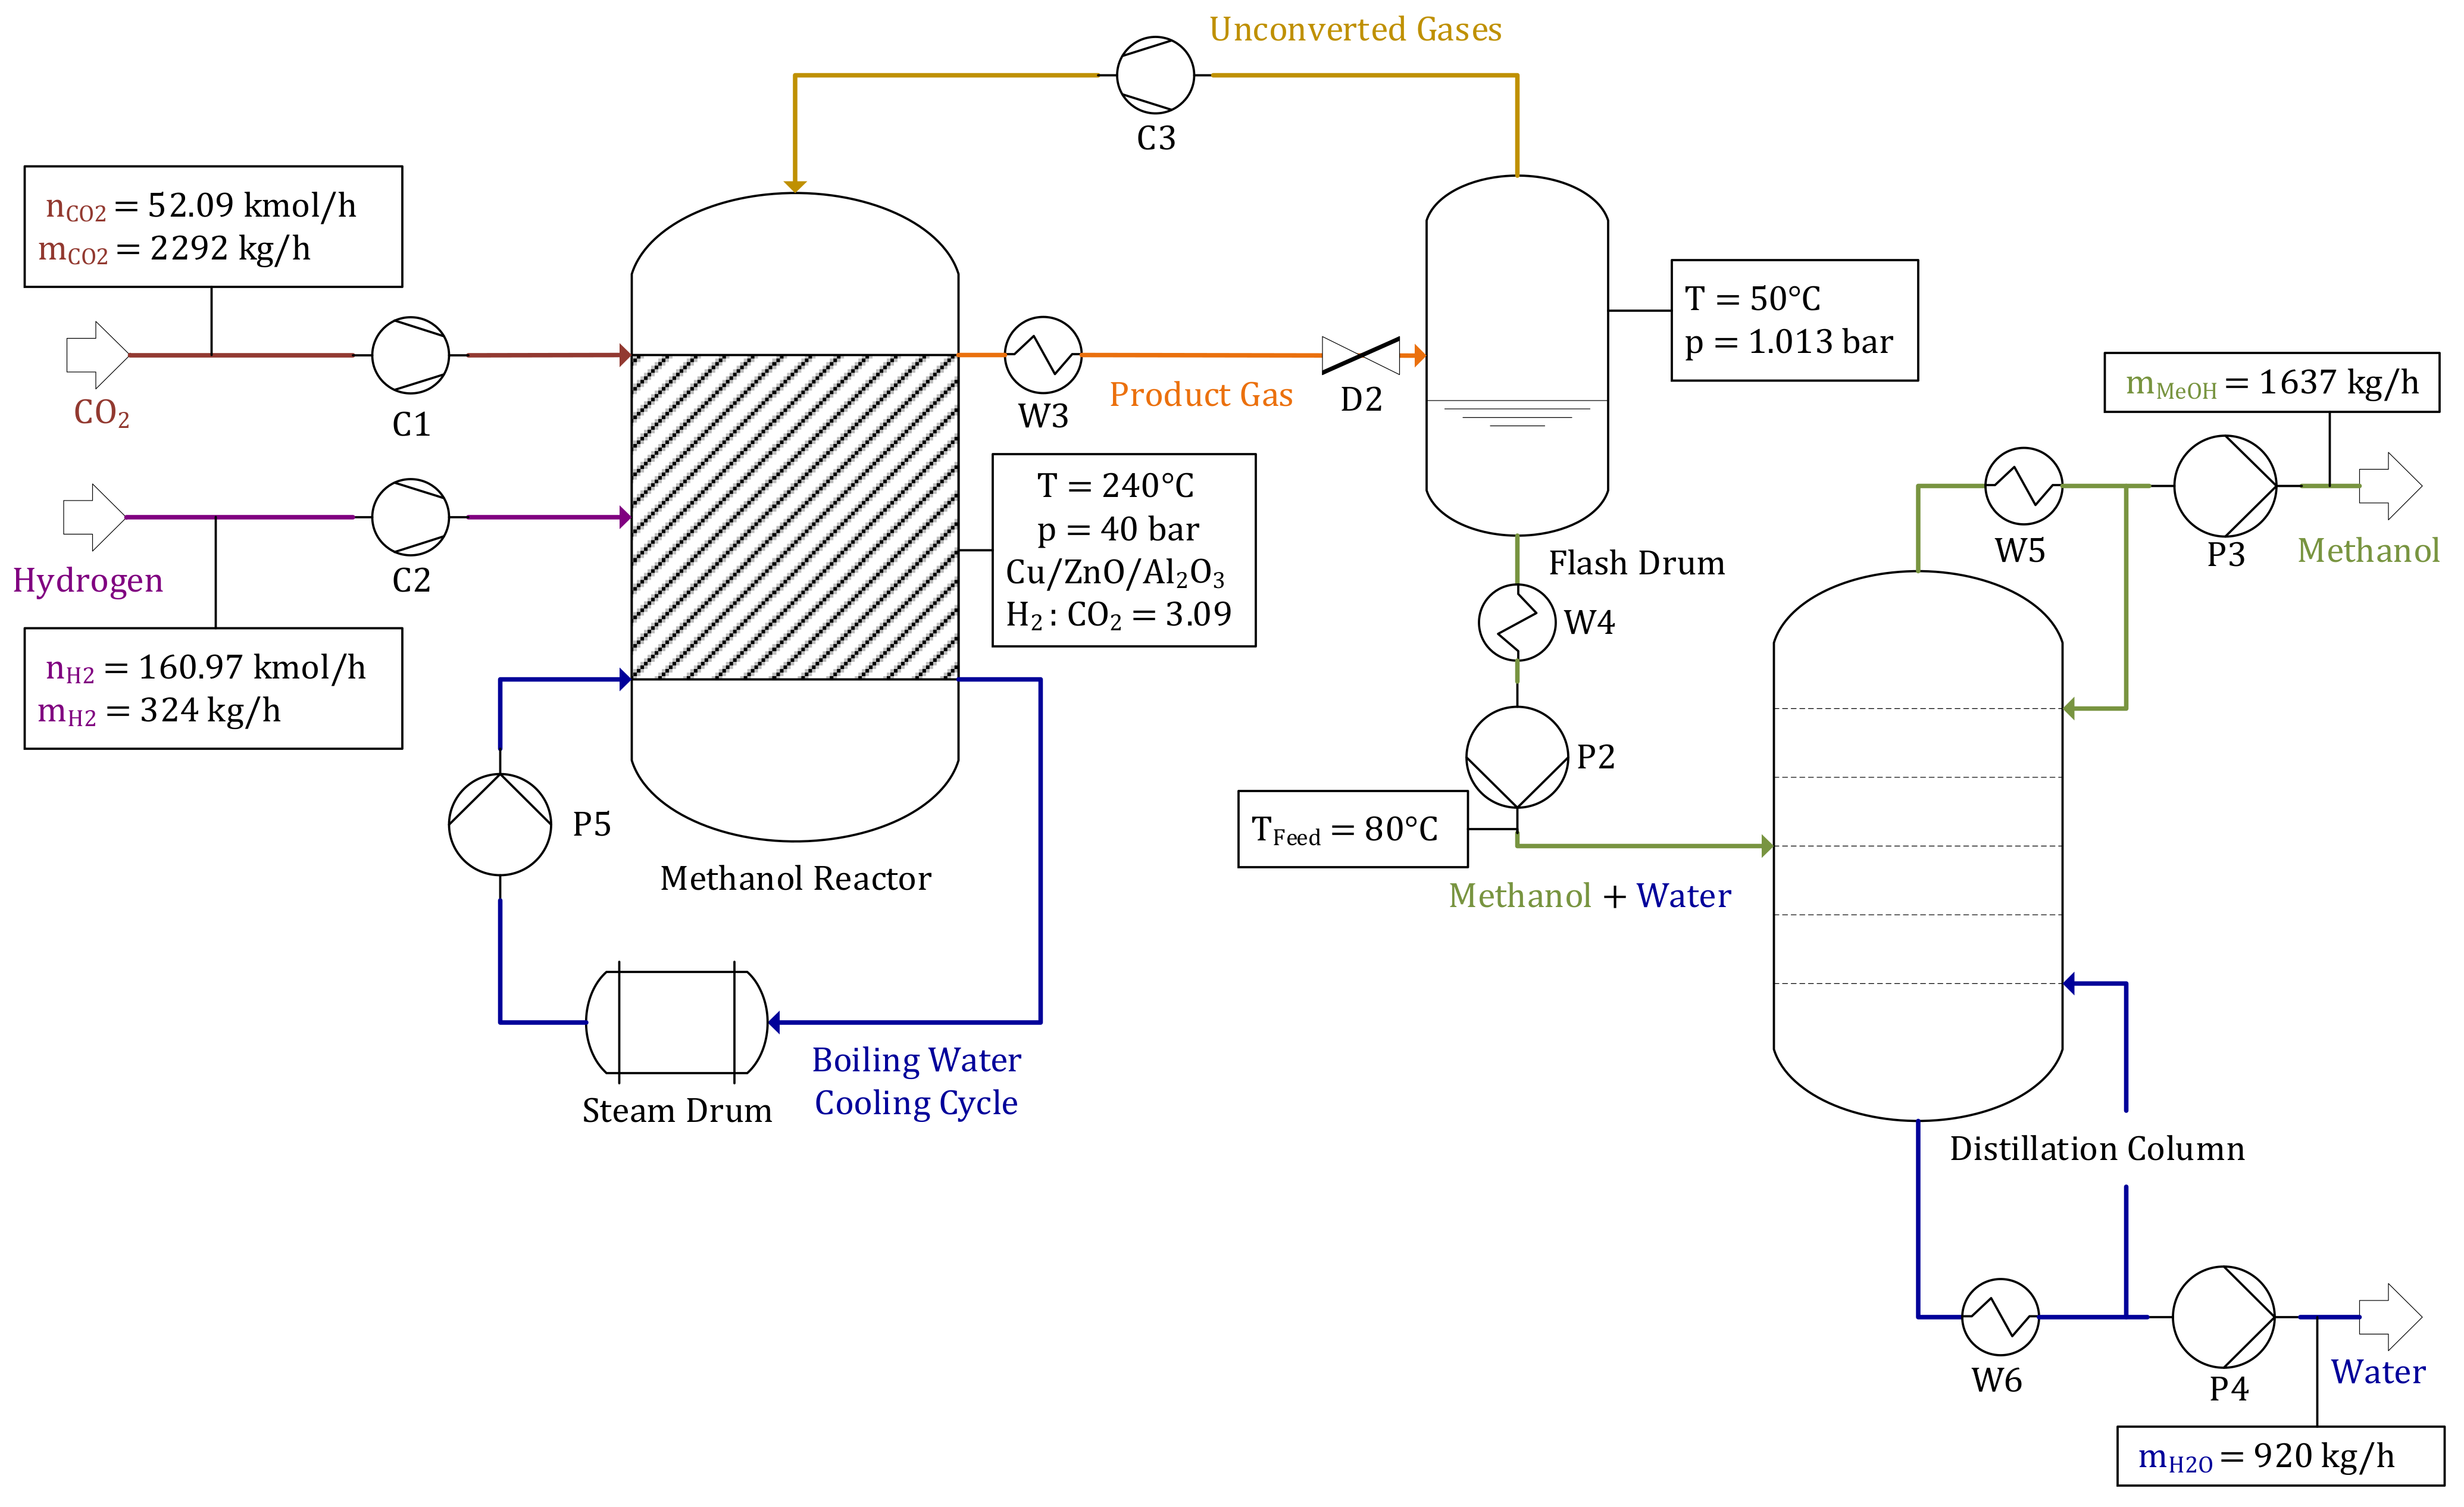
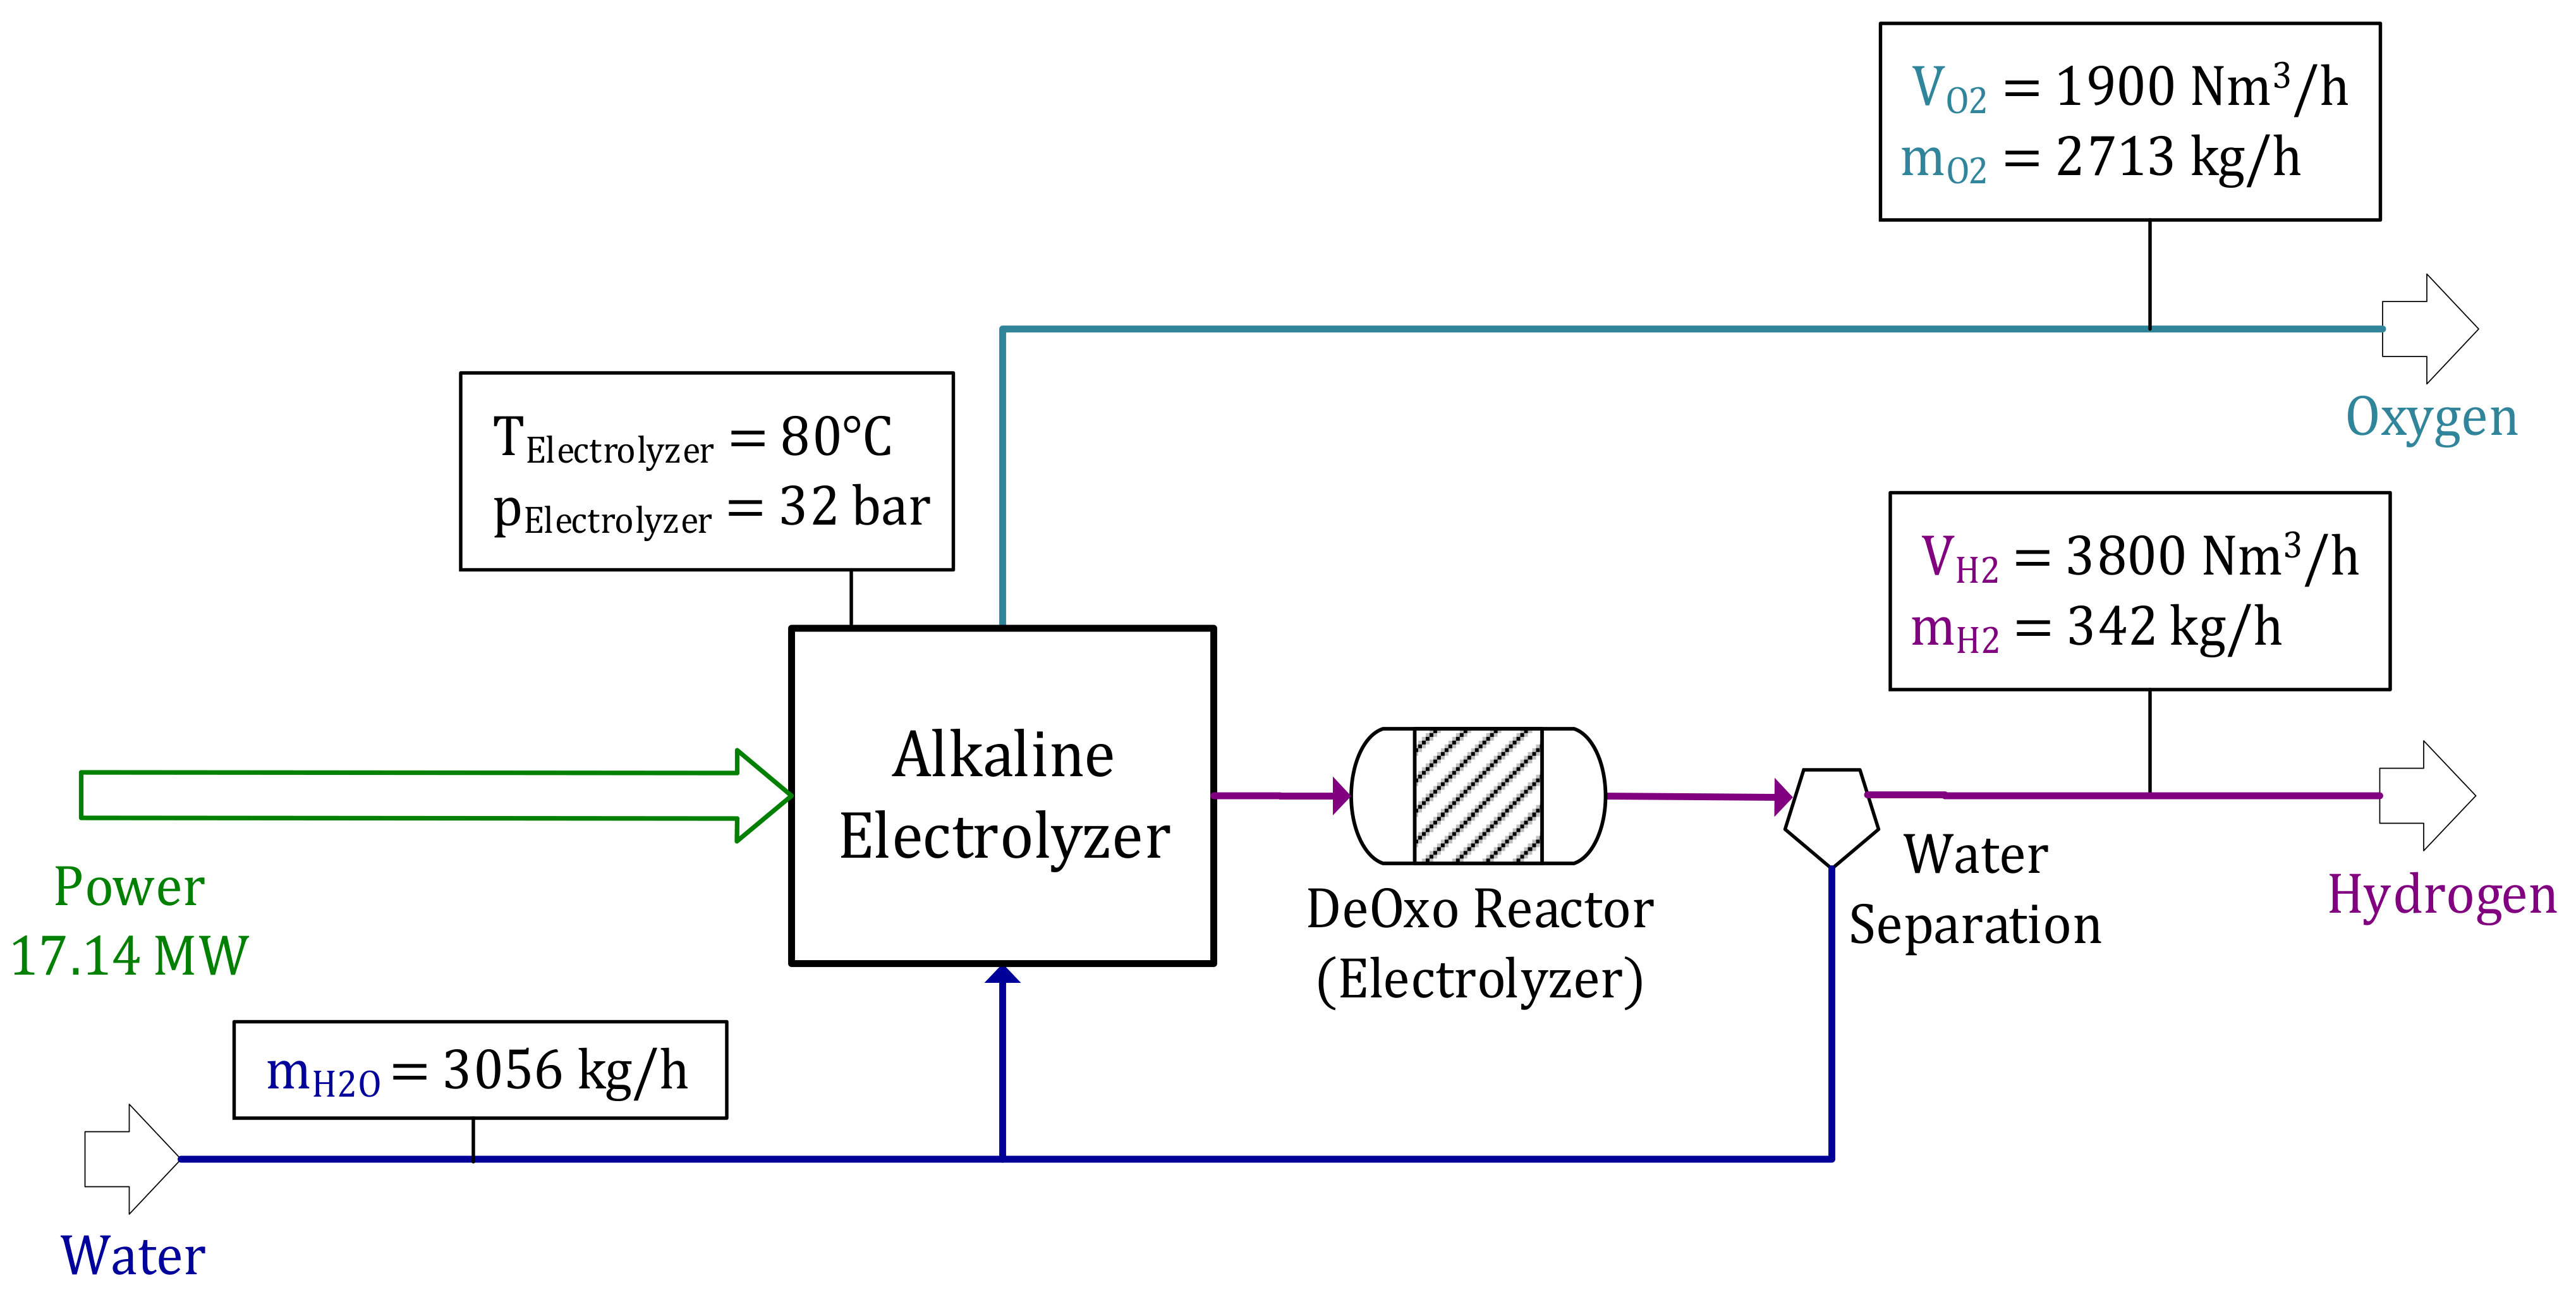
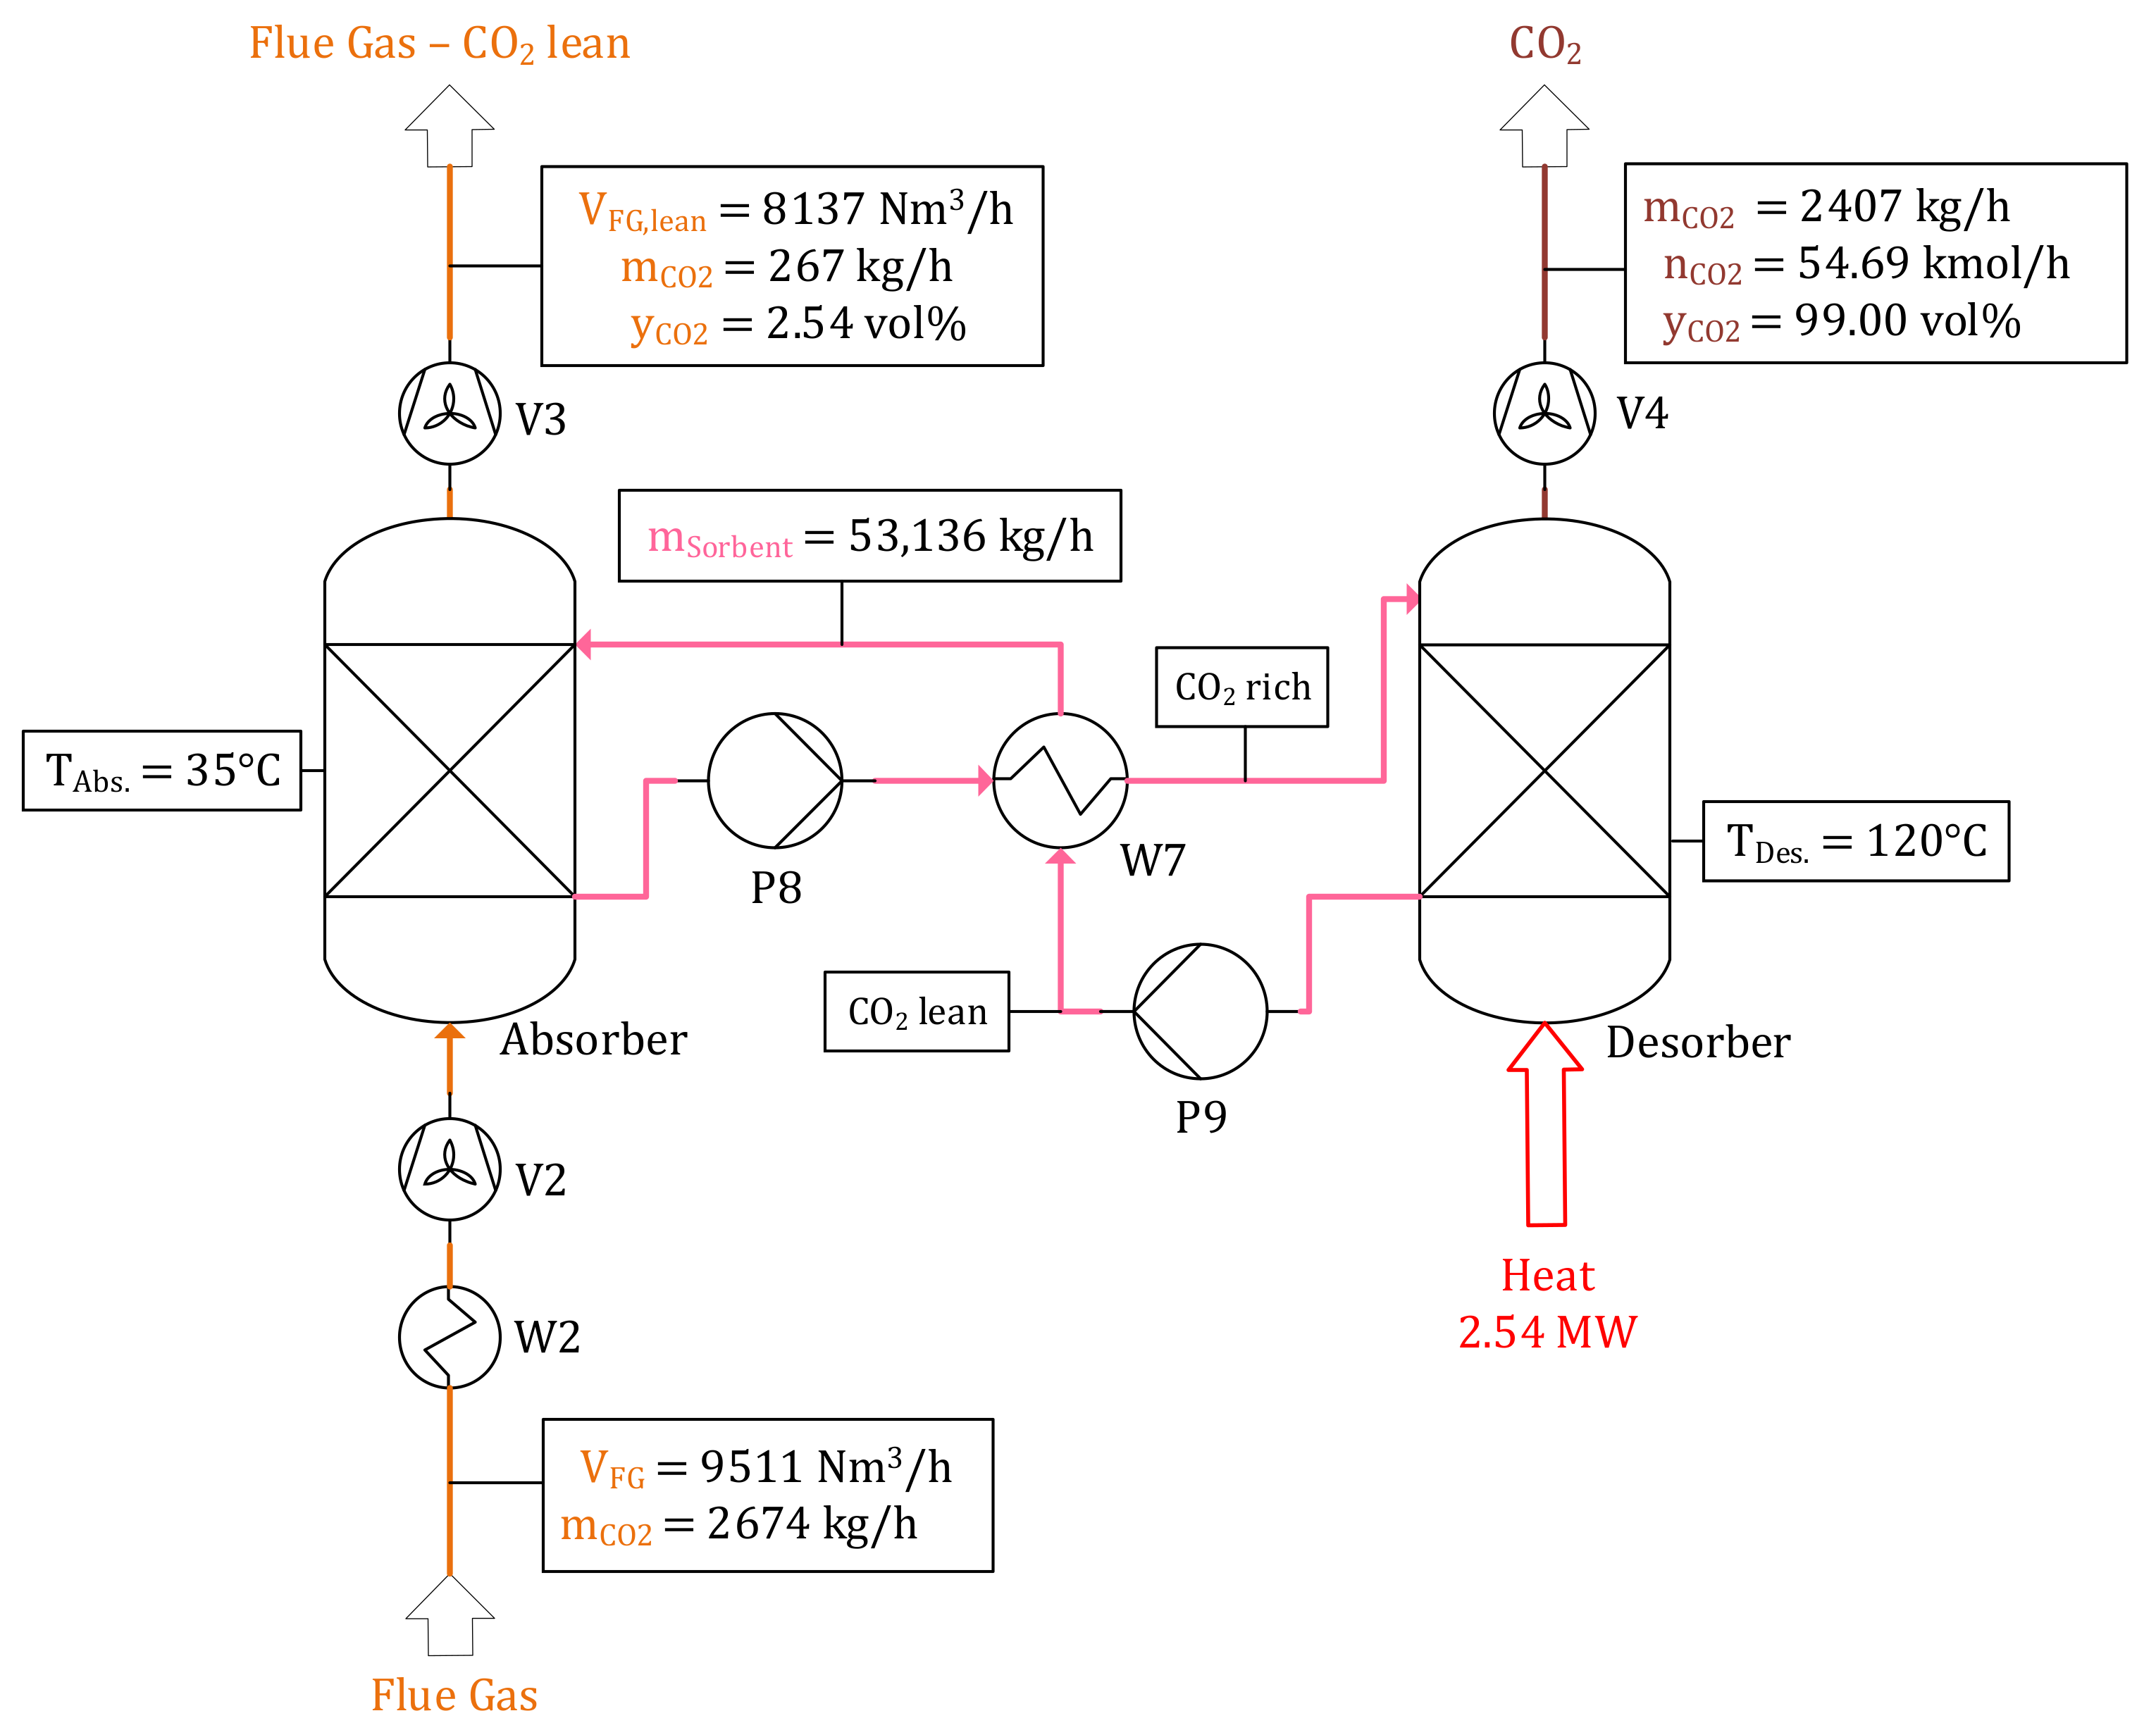
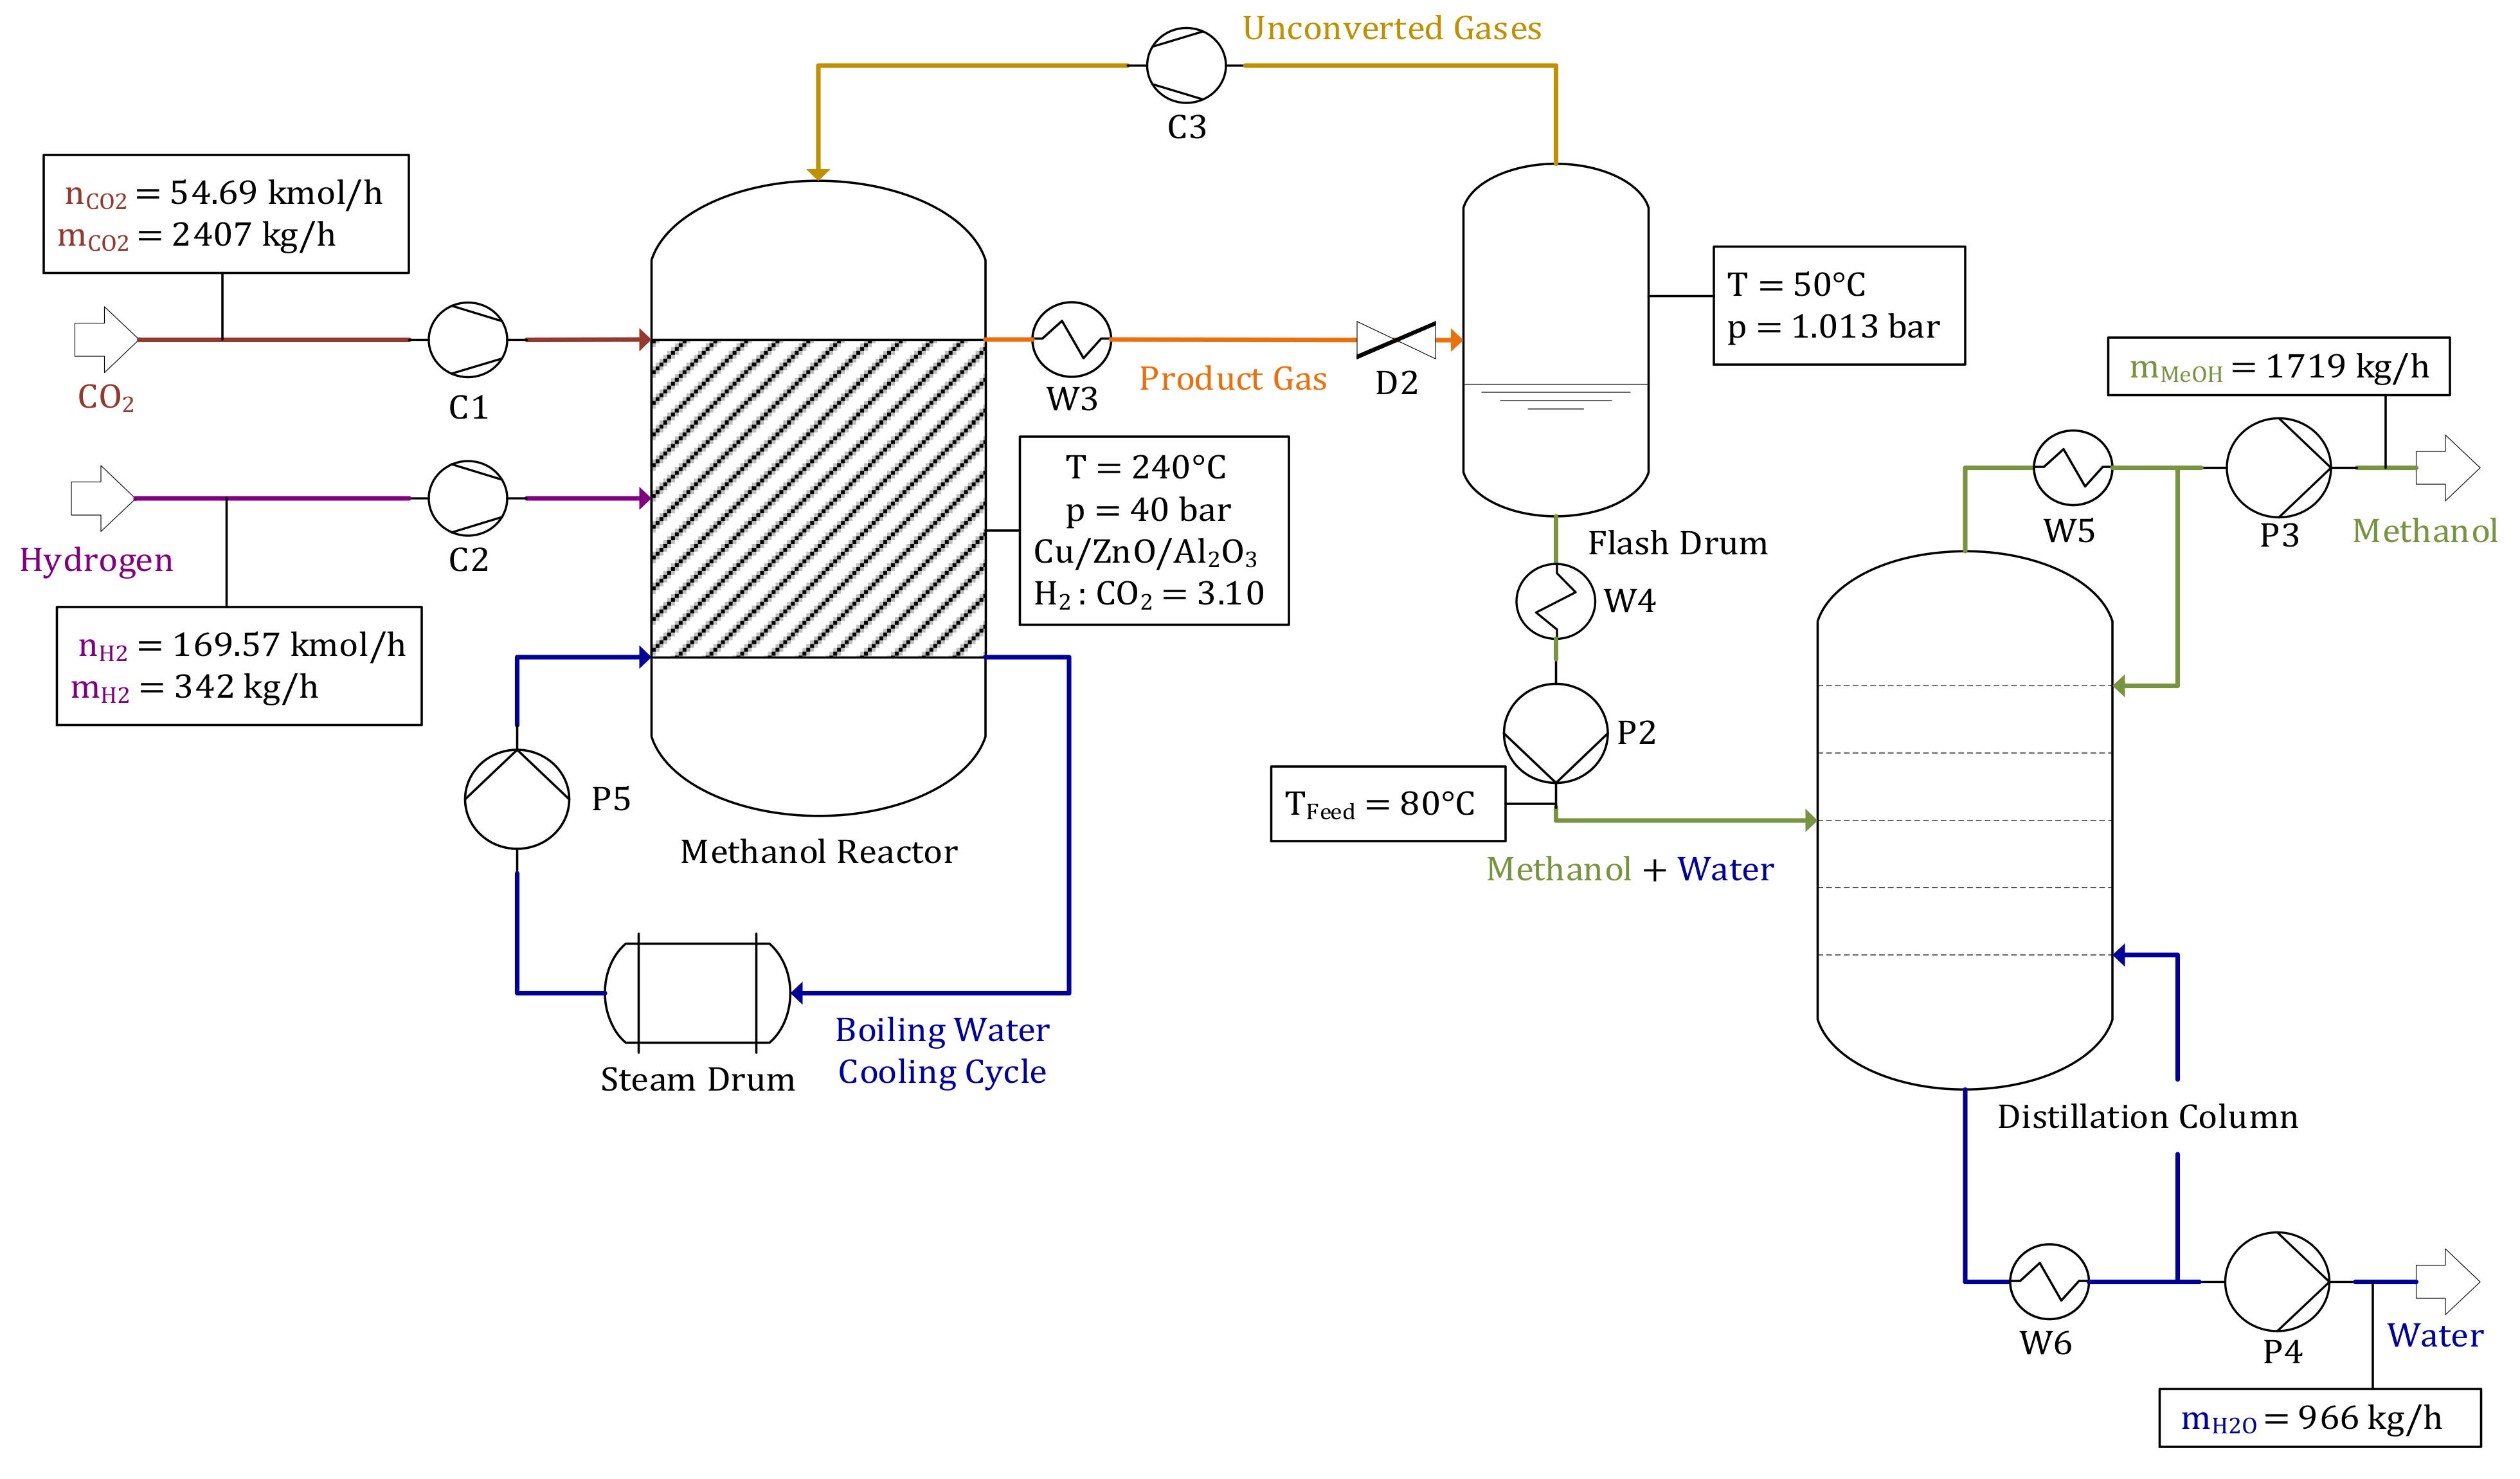
The main objective of this paper was to conceptualize and model a decentralized power-to-green methanol plant including oxyfuel combustion for CCU applications. A biomass heating plant, either operated as oxyfuel or conventional air combustor, including a CHP process with a thermal input of 20 MWth., provides adjacent villages with heat and functions as a CO2 source for a downstream methanol synthesis unit. Using woodchips as fuel comes with several advantages (e.g., the potential to achieve a negative CO2 balance, empowering local economies and being independent from imported fossil energy carriers). Processing the CO2 stream is either realized by a DeOxo reactor (for oxyfuel process routes) or a MEA temperature swing absorption cycle (for conventional air combustion process routes). Required H2 is produced by an alkaline electrolyzer powered with electricity generated by a nearby wind park. O2 as by-product can either be used as oxidant for the oxyfuel combustion or be sold when applying process routes based on air combustion. Methanol is produced by valorizing CO2 in a multi-tubular BWR including a closed gas loop configuration.
PtX technologies are on the verge of becoming key technologies within this decade, as they neutralize a major disadvantage of renewable energy carriers (i.e., the challenge of chemically storing surplus electricity due to seasonal and daily fluctuations). Furthermore, CO2 is captured and valorized to fuels or feedstocks for the chemical industry.
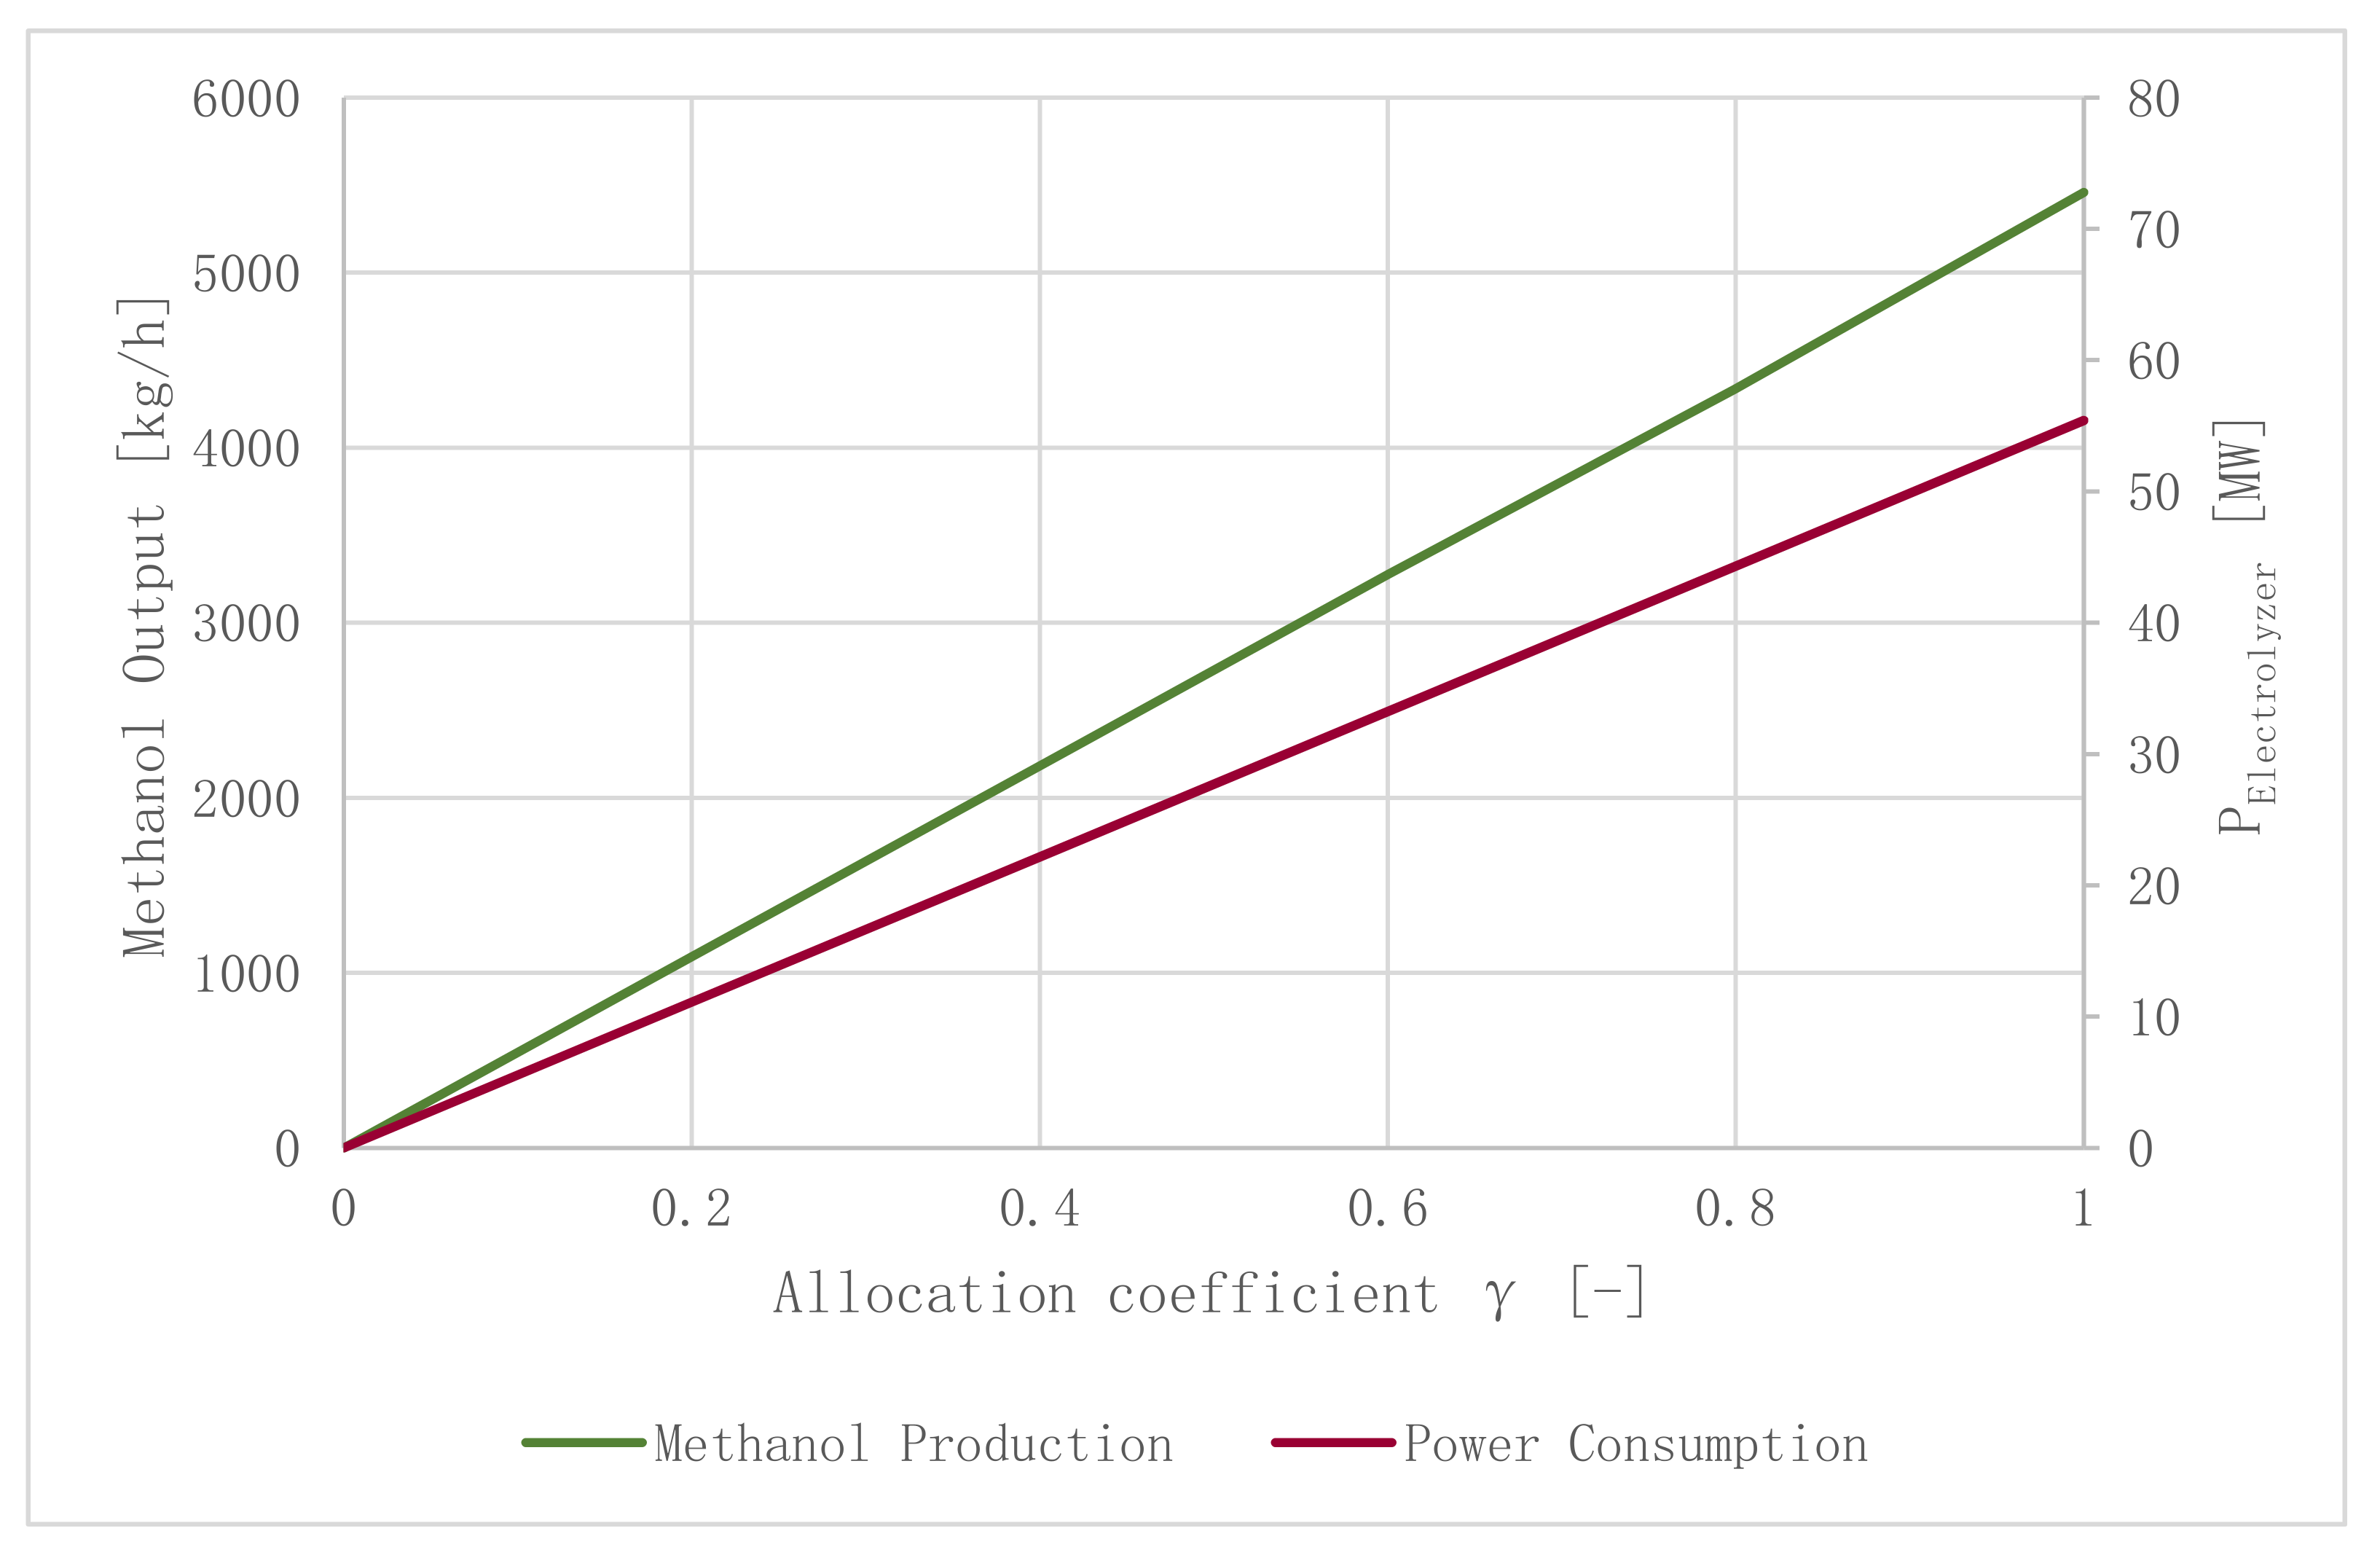
A variety of operating points have been defined by alternating critical process parameters (i.e., uWind, the wind park’s size and the allocation coefficient γ, as explained in Section 3.4.2). Input and output streams of defined operating points were analyzed.
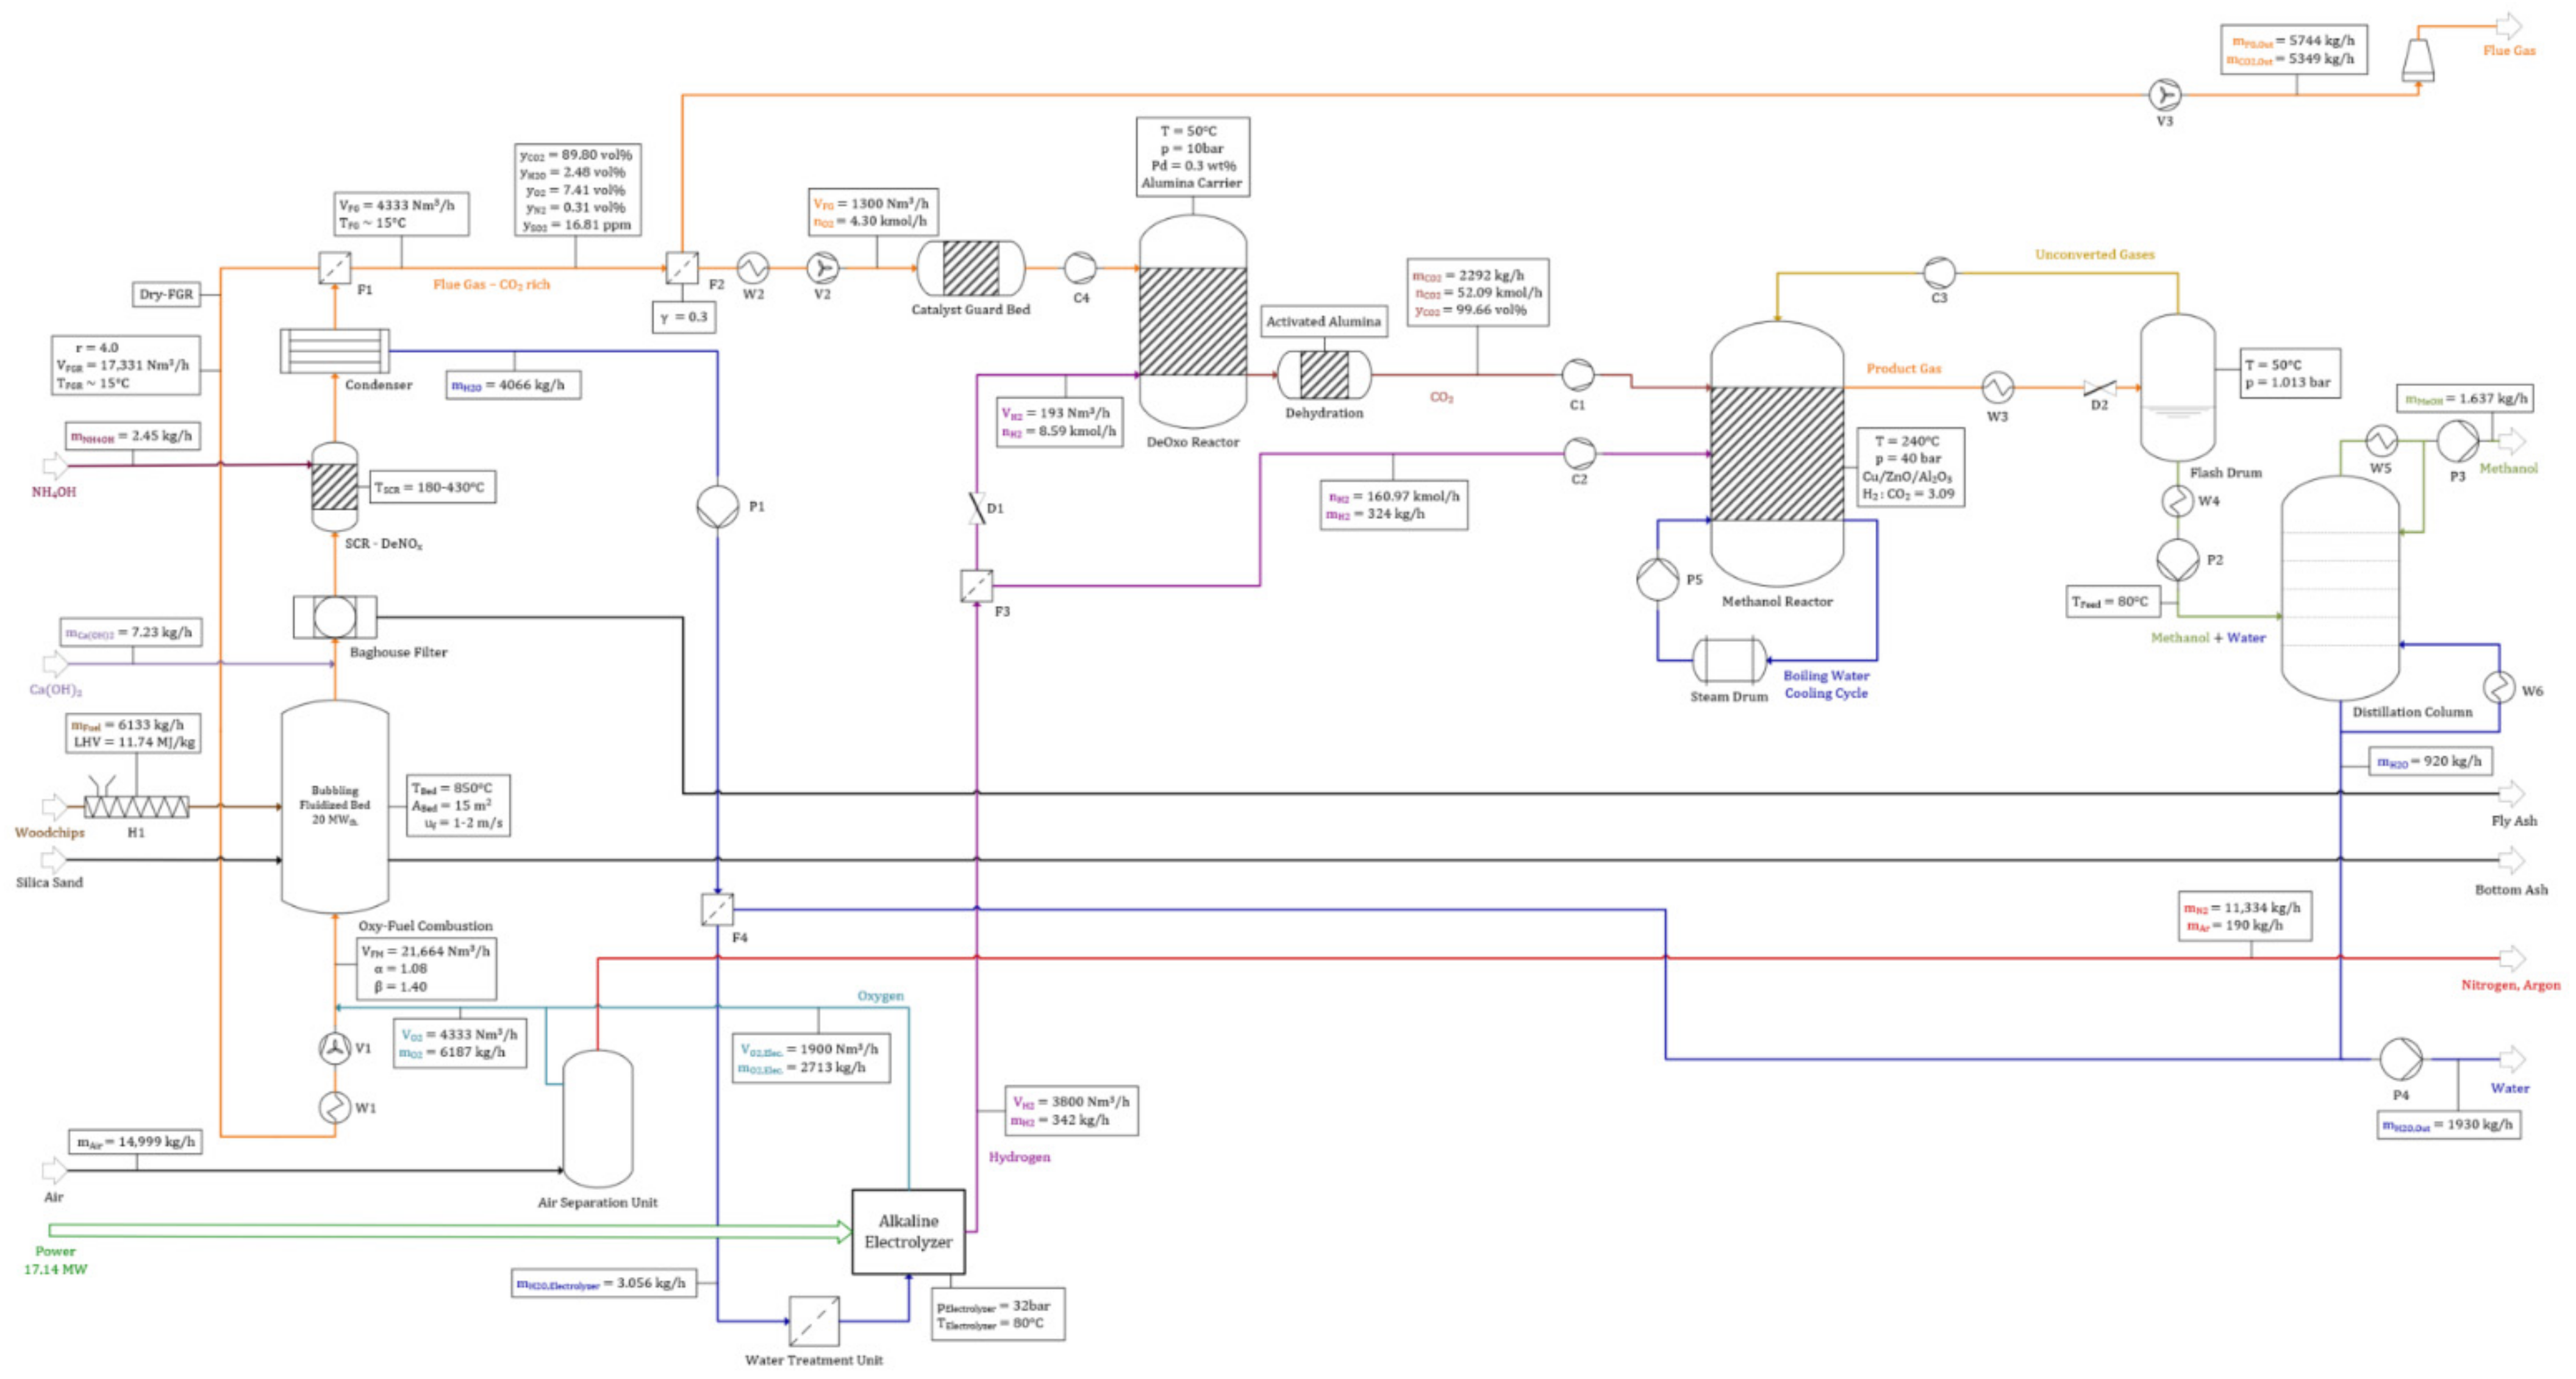
 Figure A2 and Figure A4, listed in the 
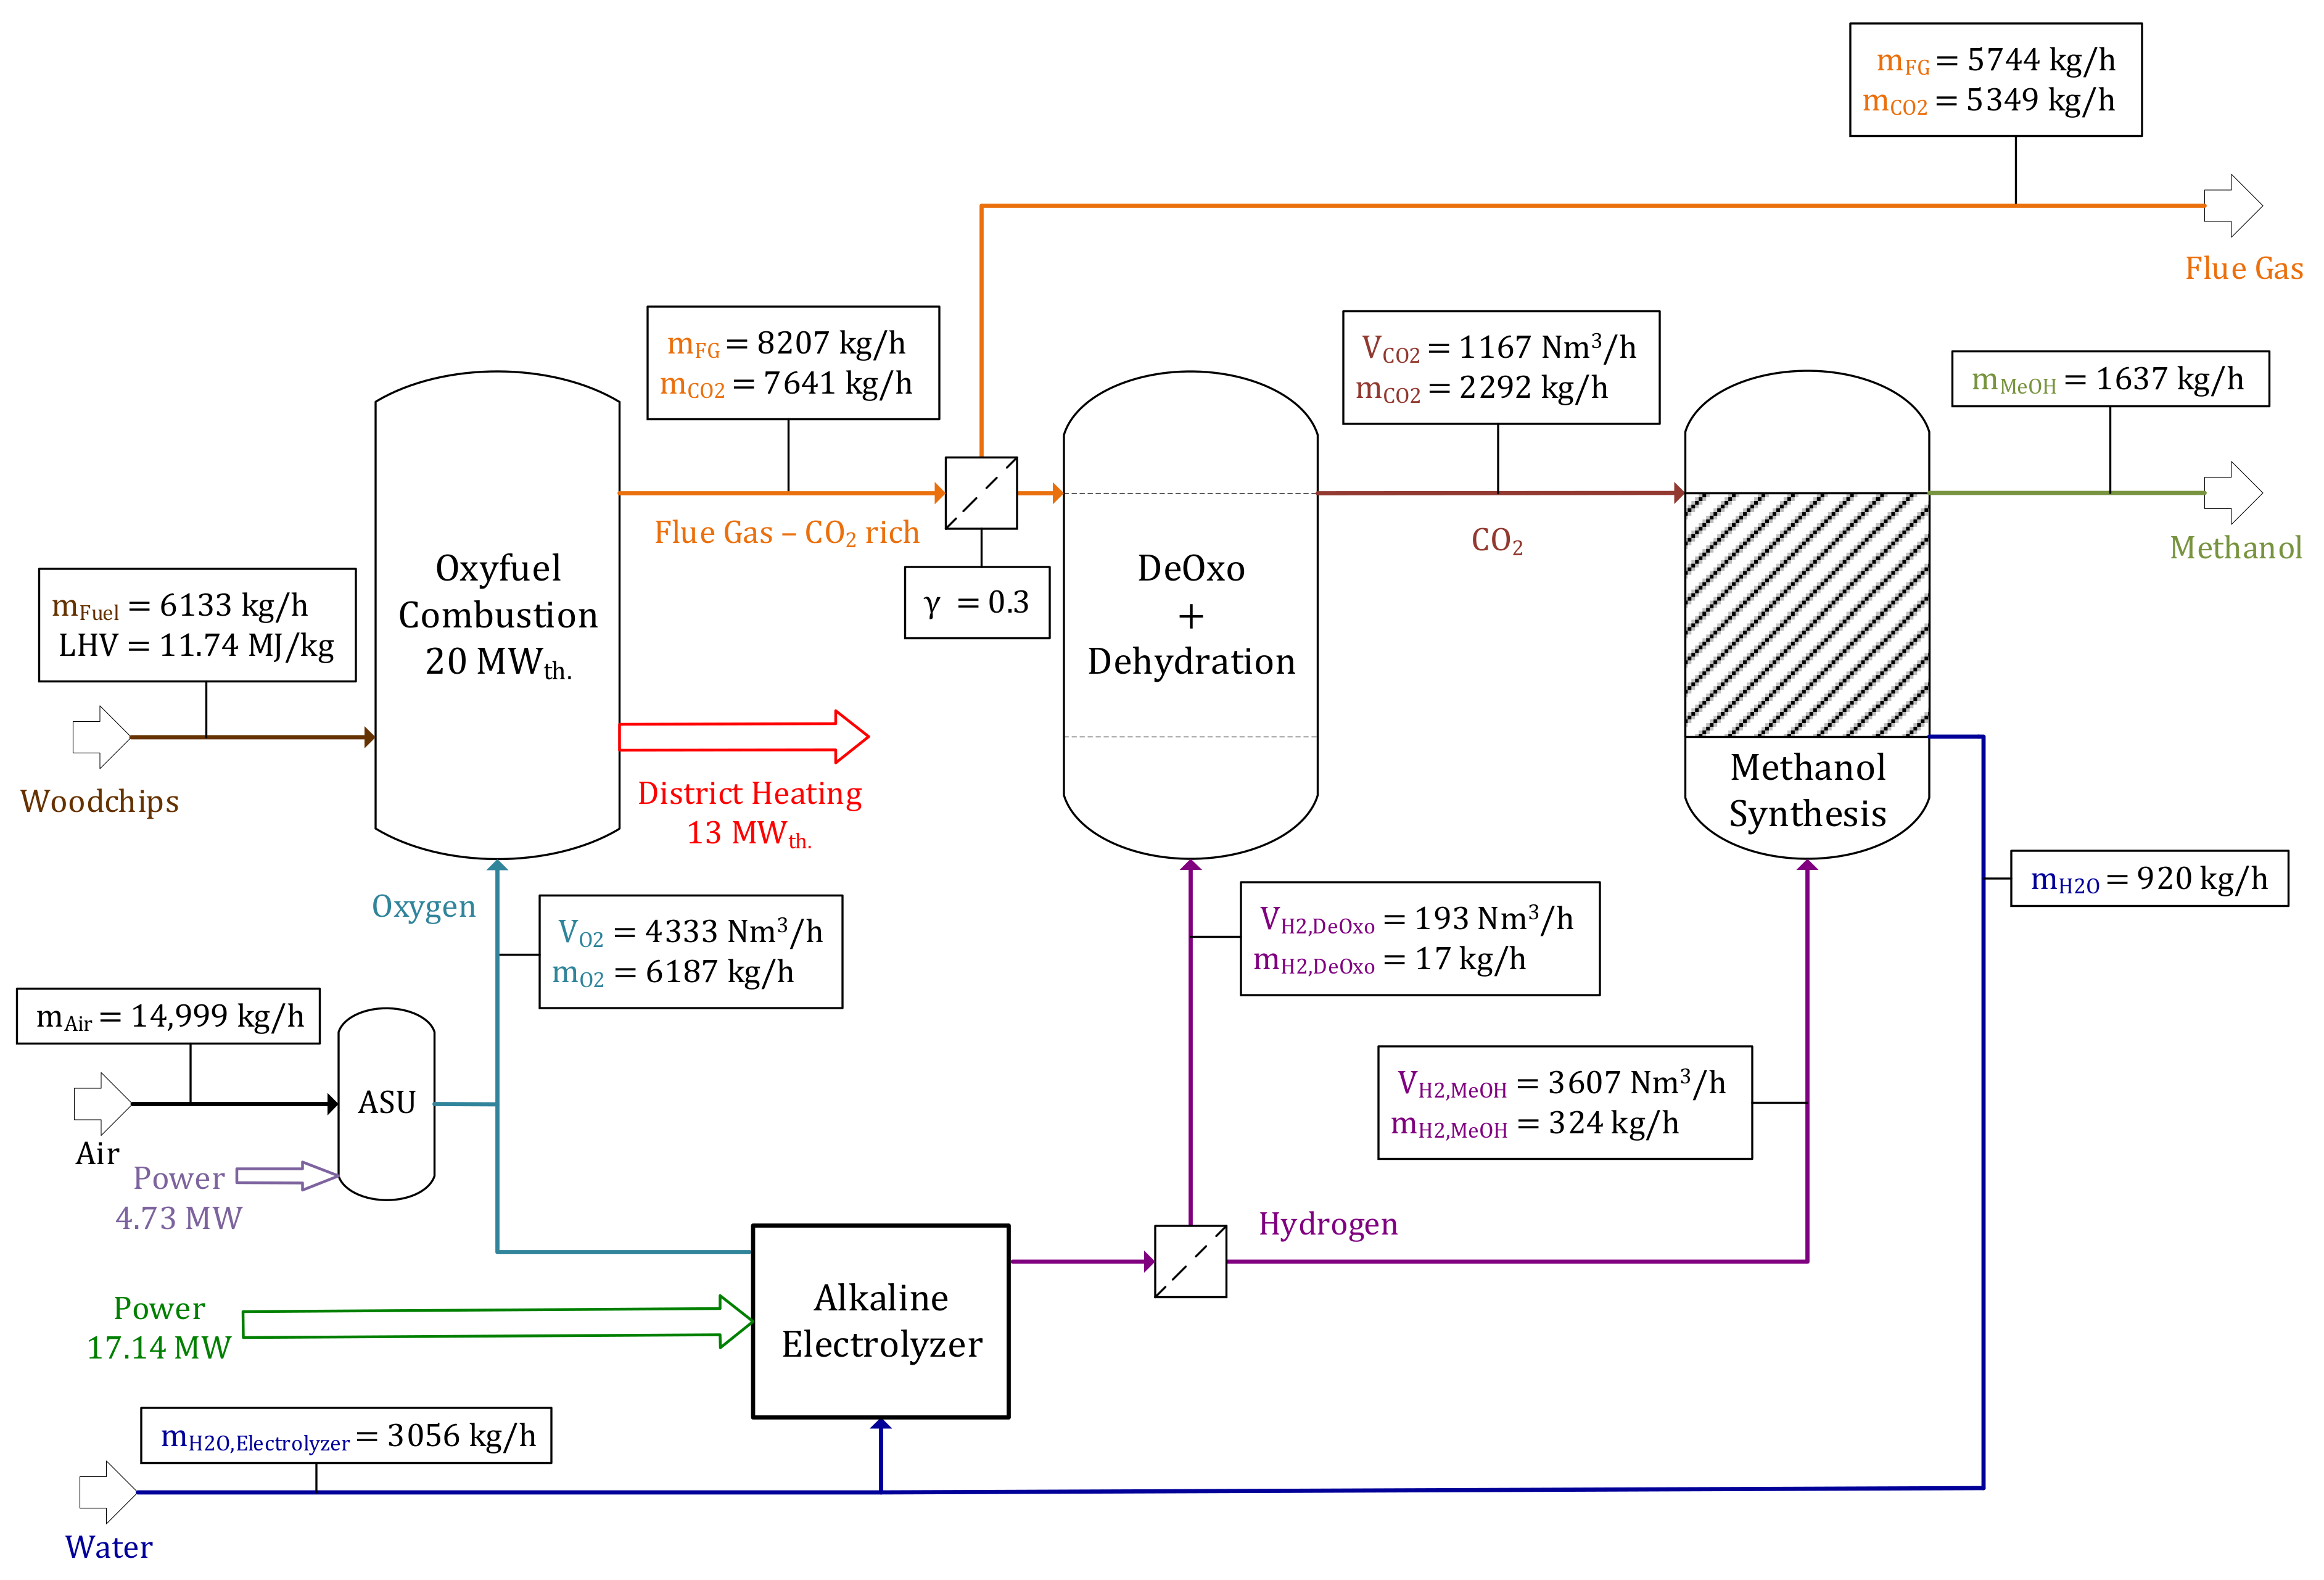
Appendix A, show a detailed as well as a simplified flow chart of the reference operating point’s balance, a process route including oxyfuel combustion and a DeOxo reactor for CO2 processing, with parameters set to values with the highest probability for real applications. A product output of 1637 kg/h methanol as well as 13 MWth. heat is realized for an input of 6133 kg/h woodchips, PElectrolyzer = 17.14 MW and 
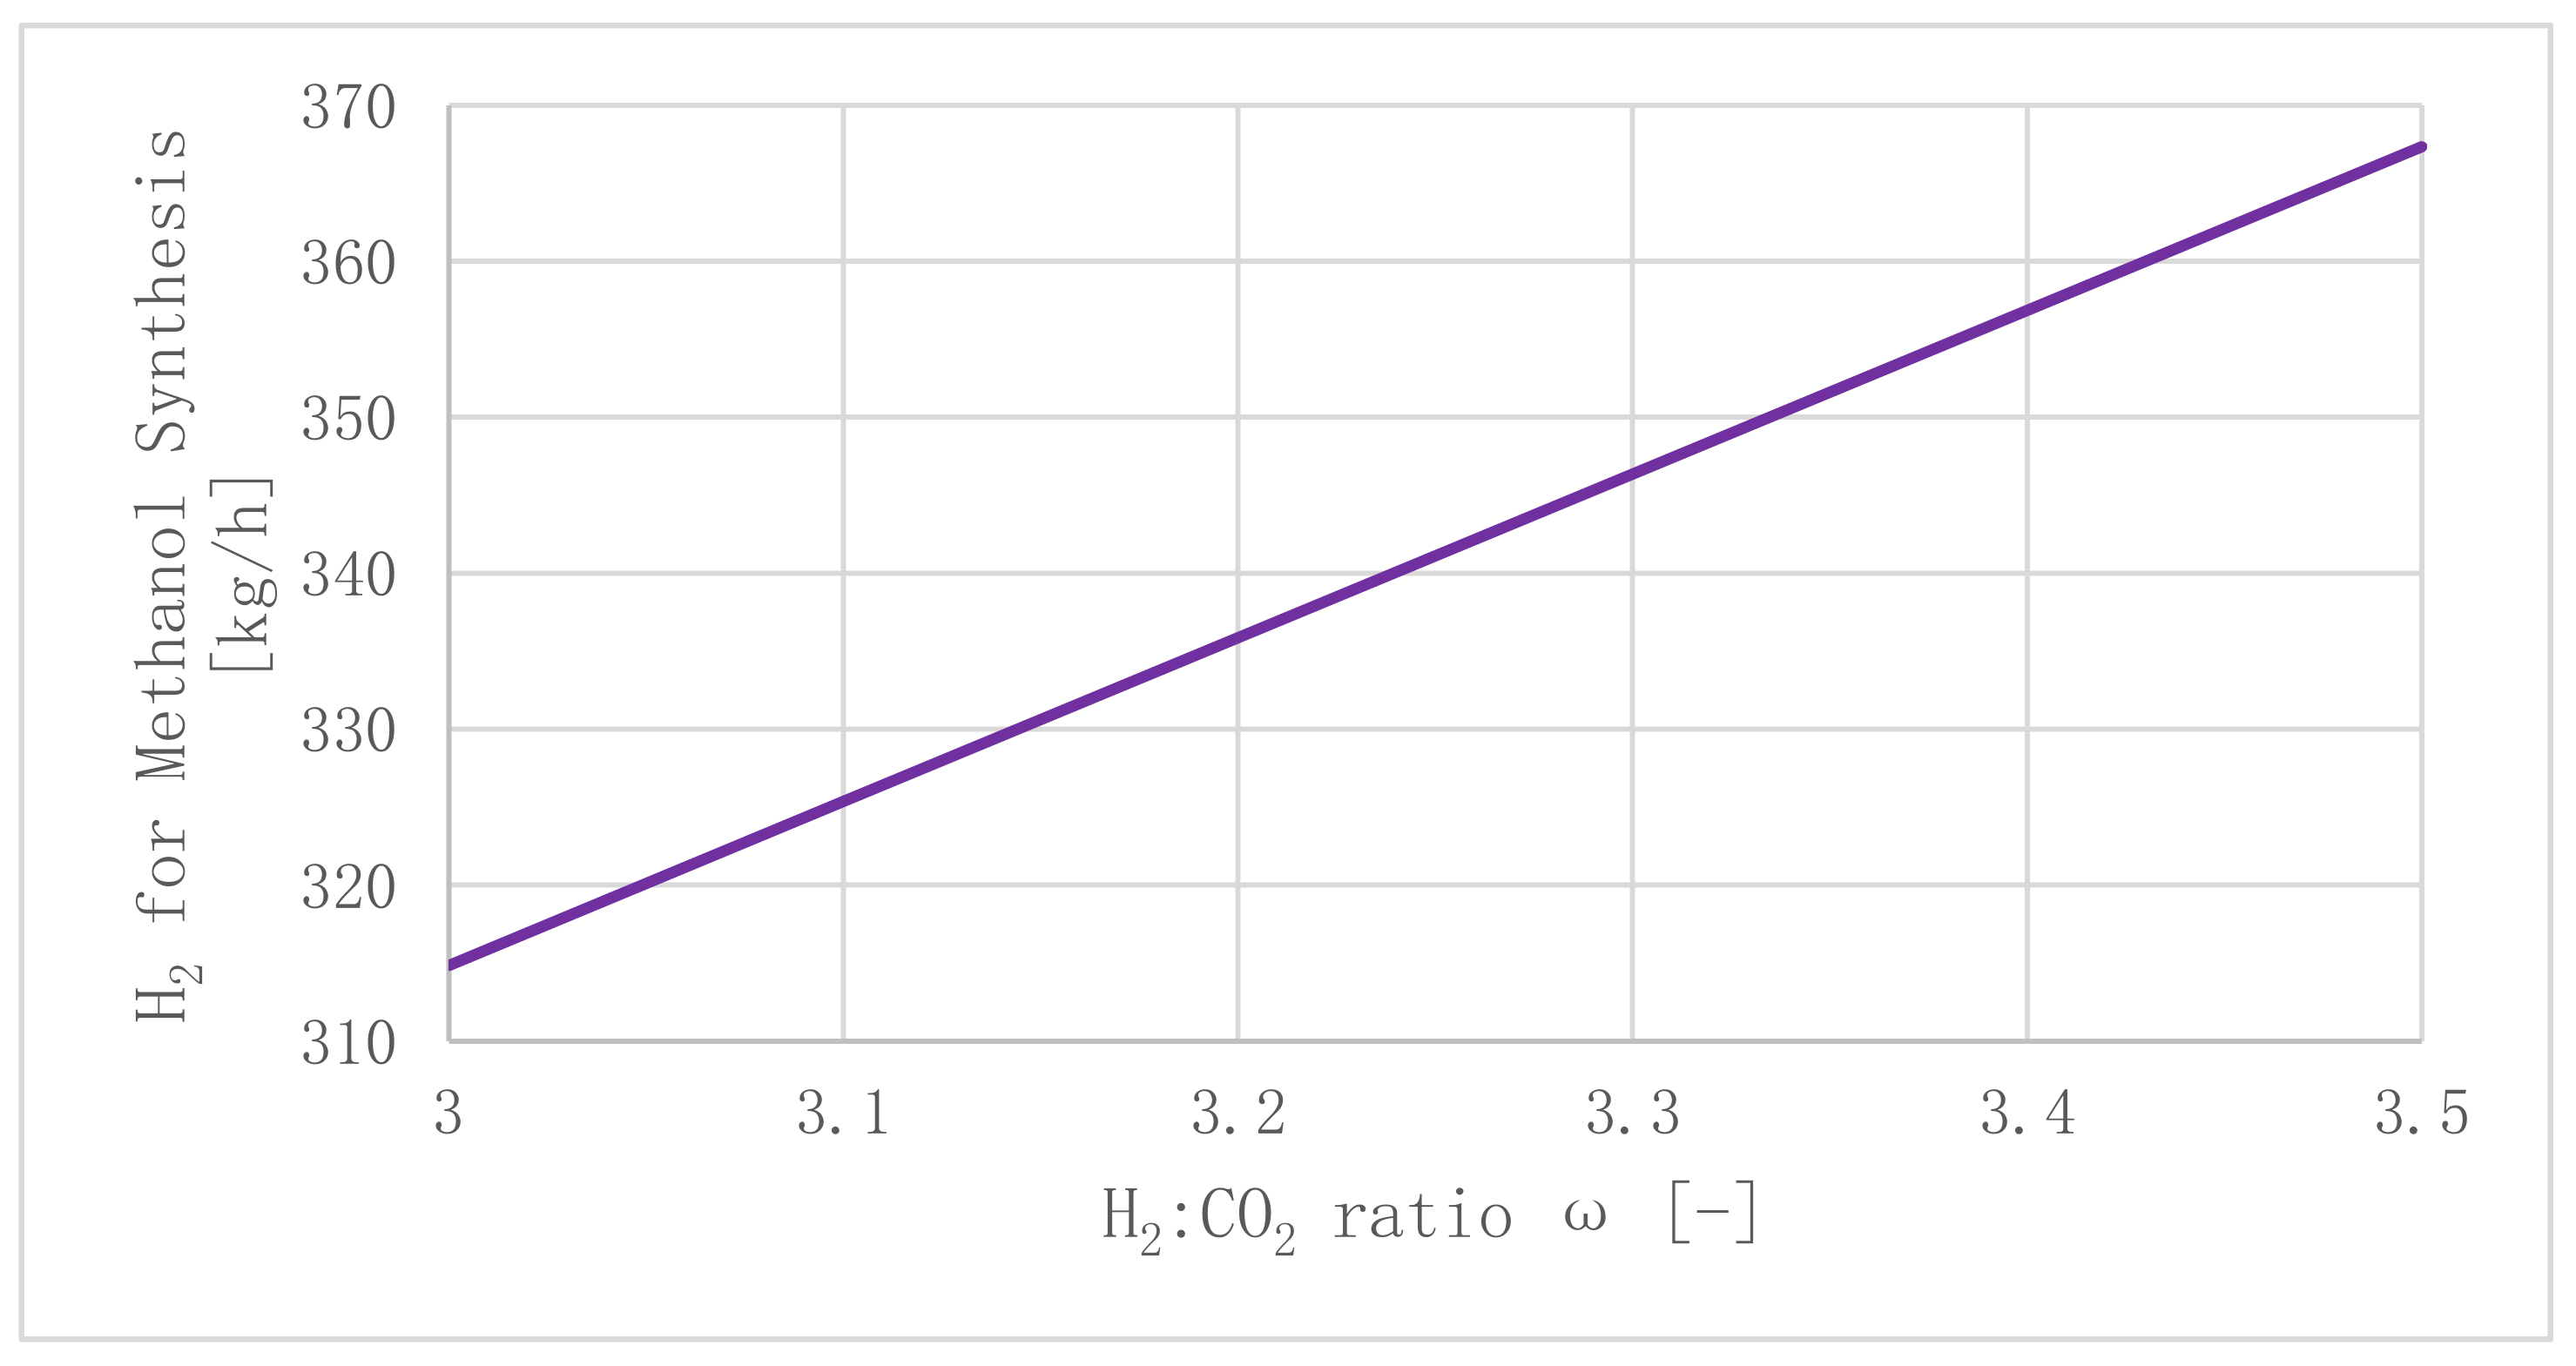
PASU = 4.73 MW. A total amount of H
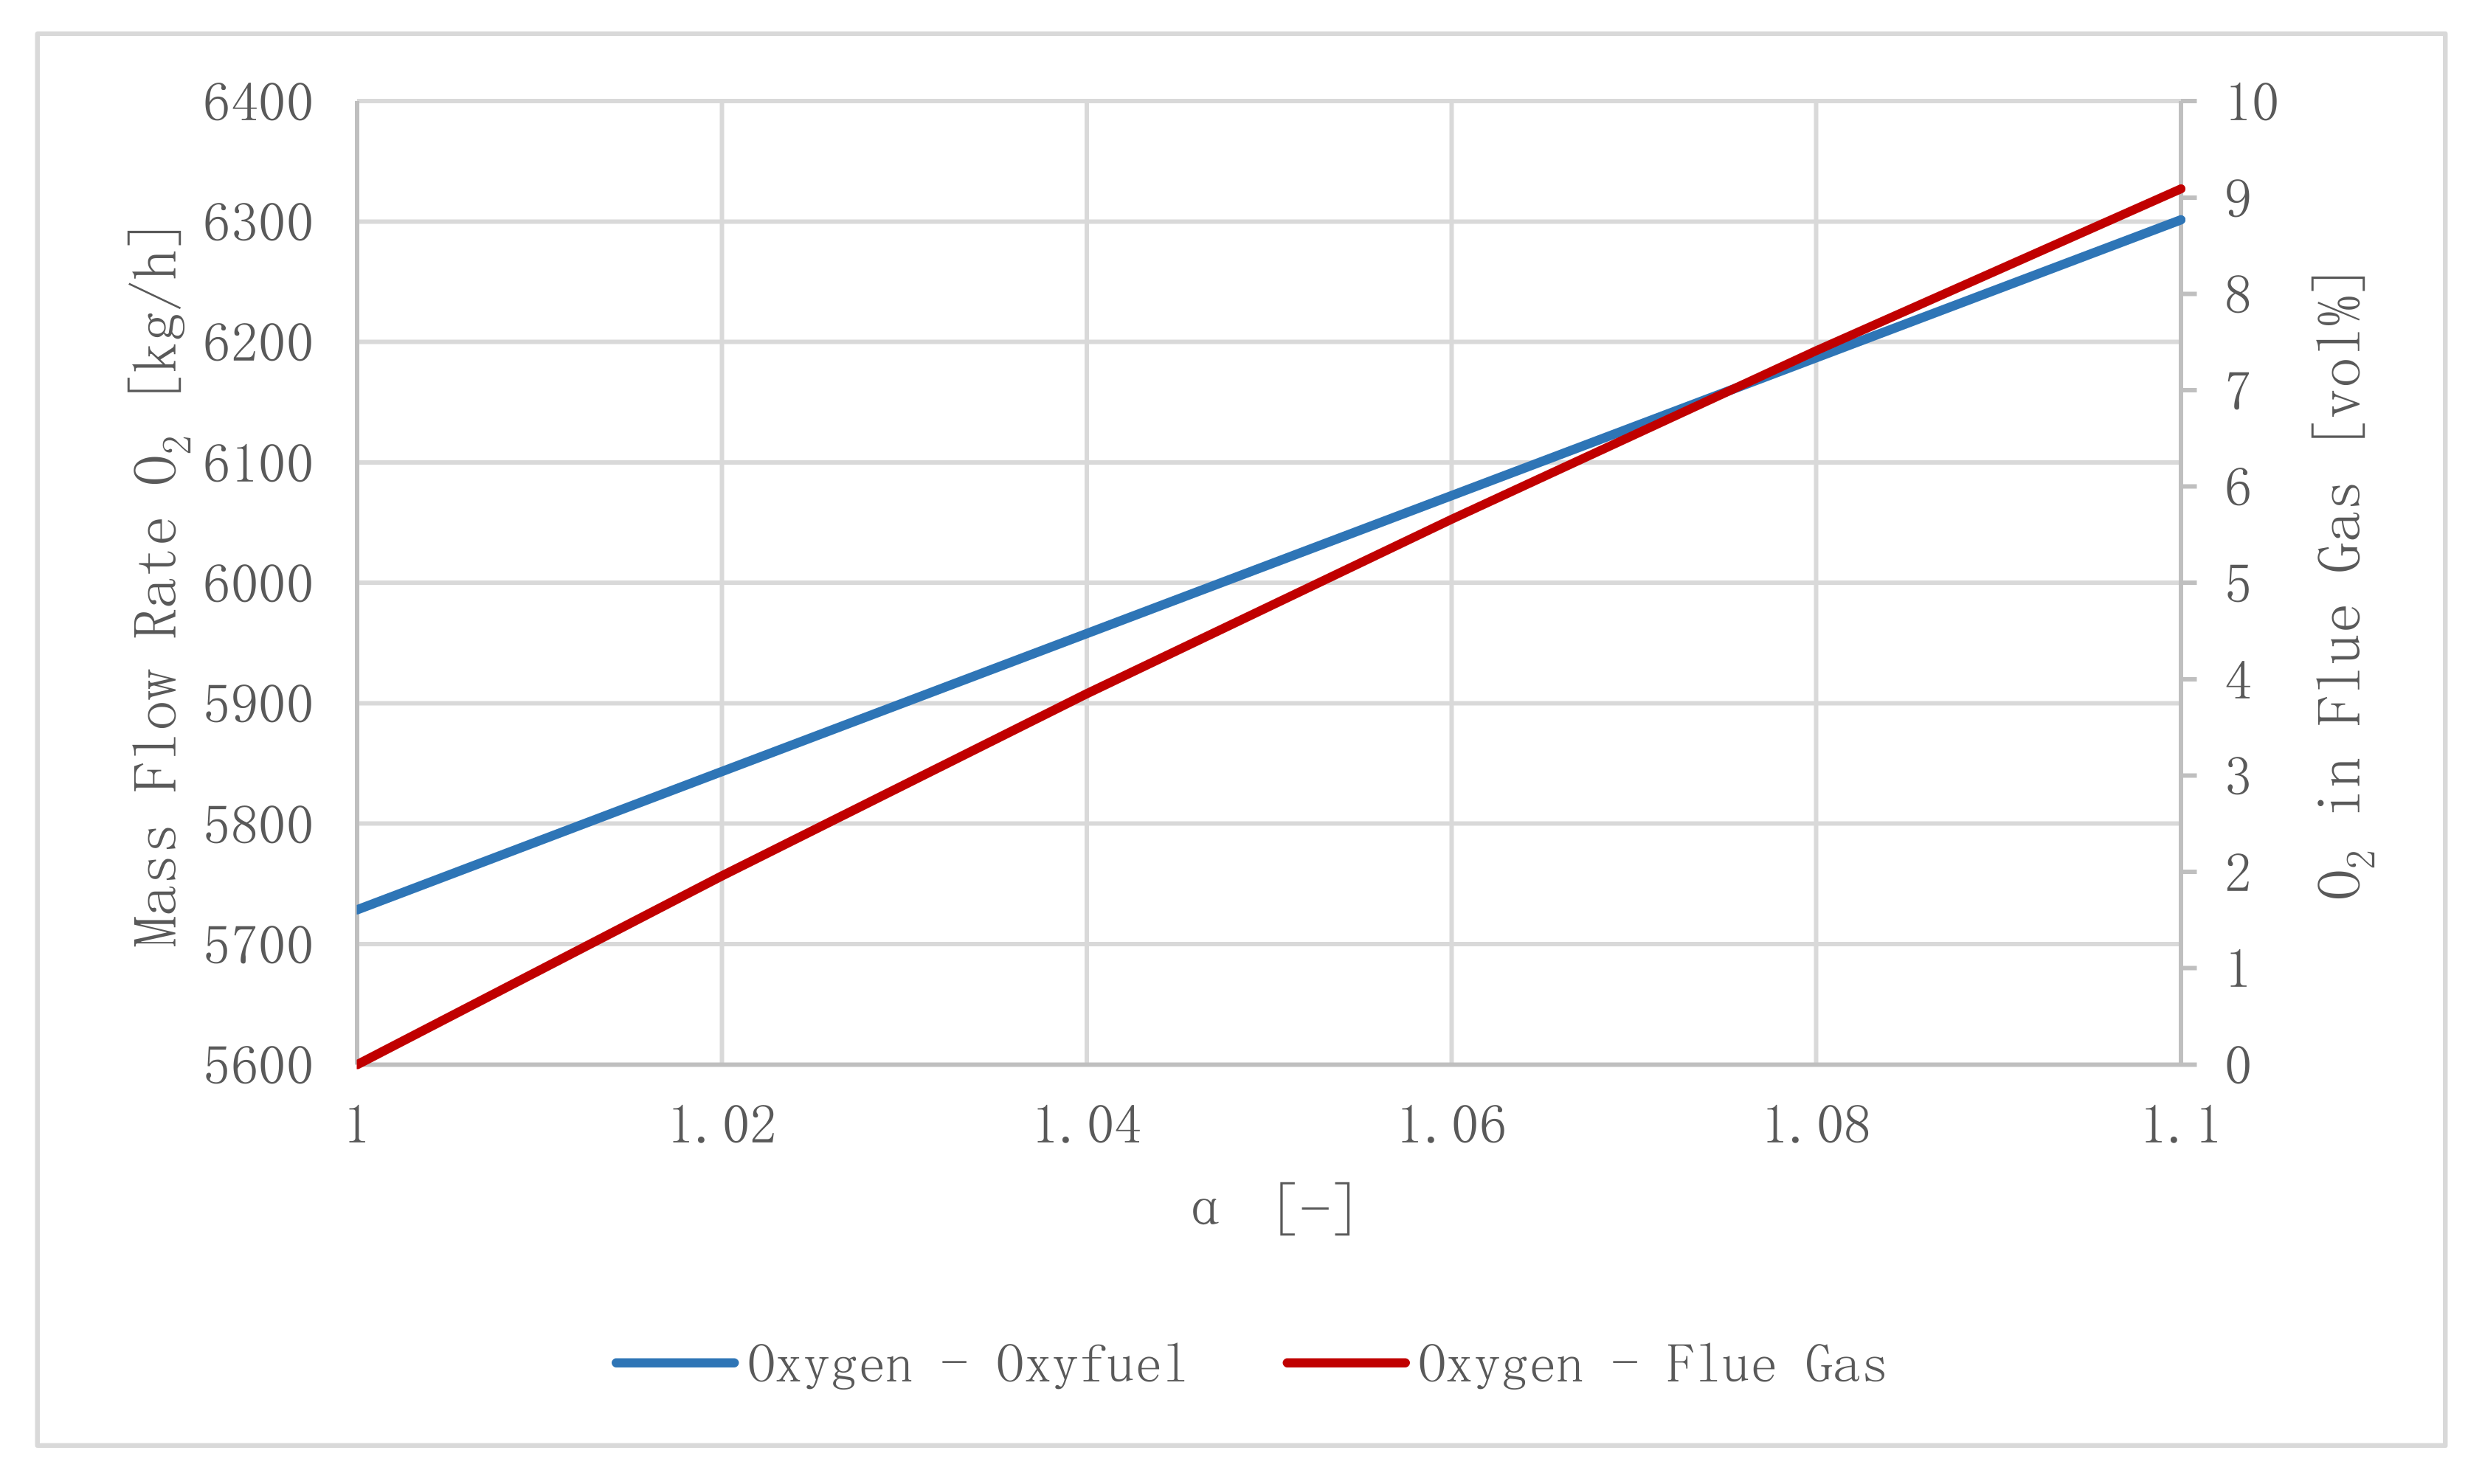
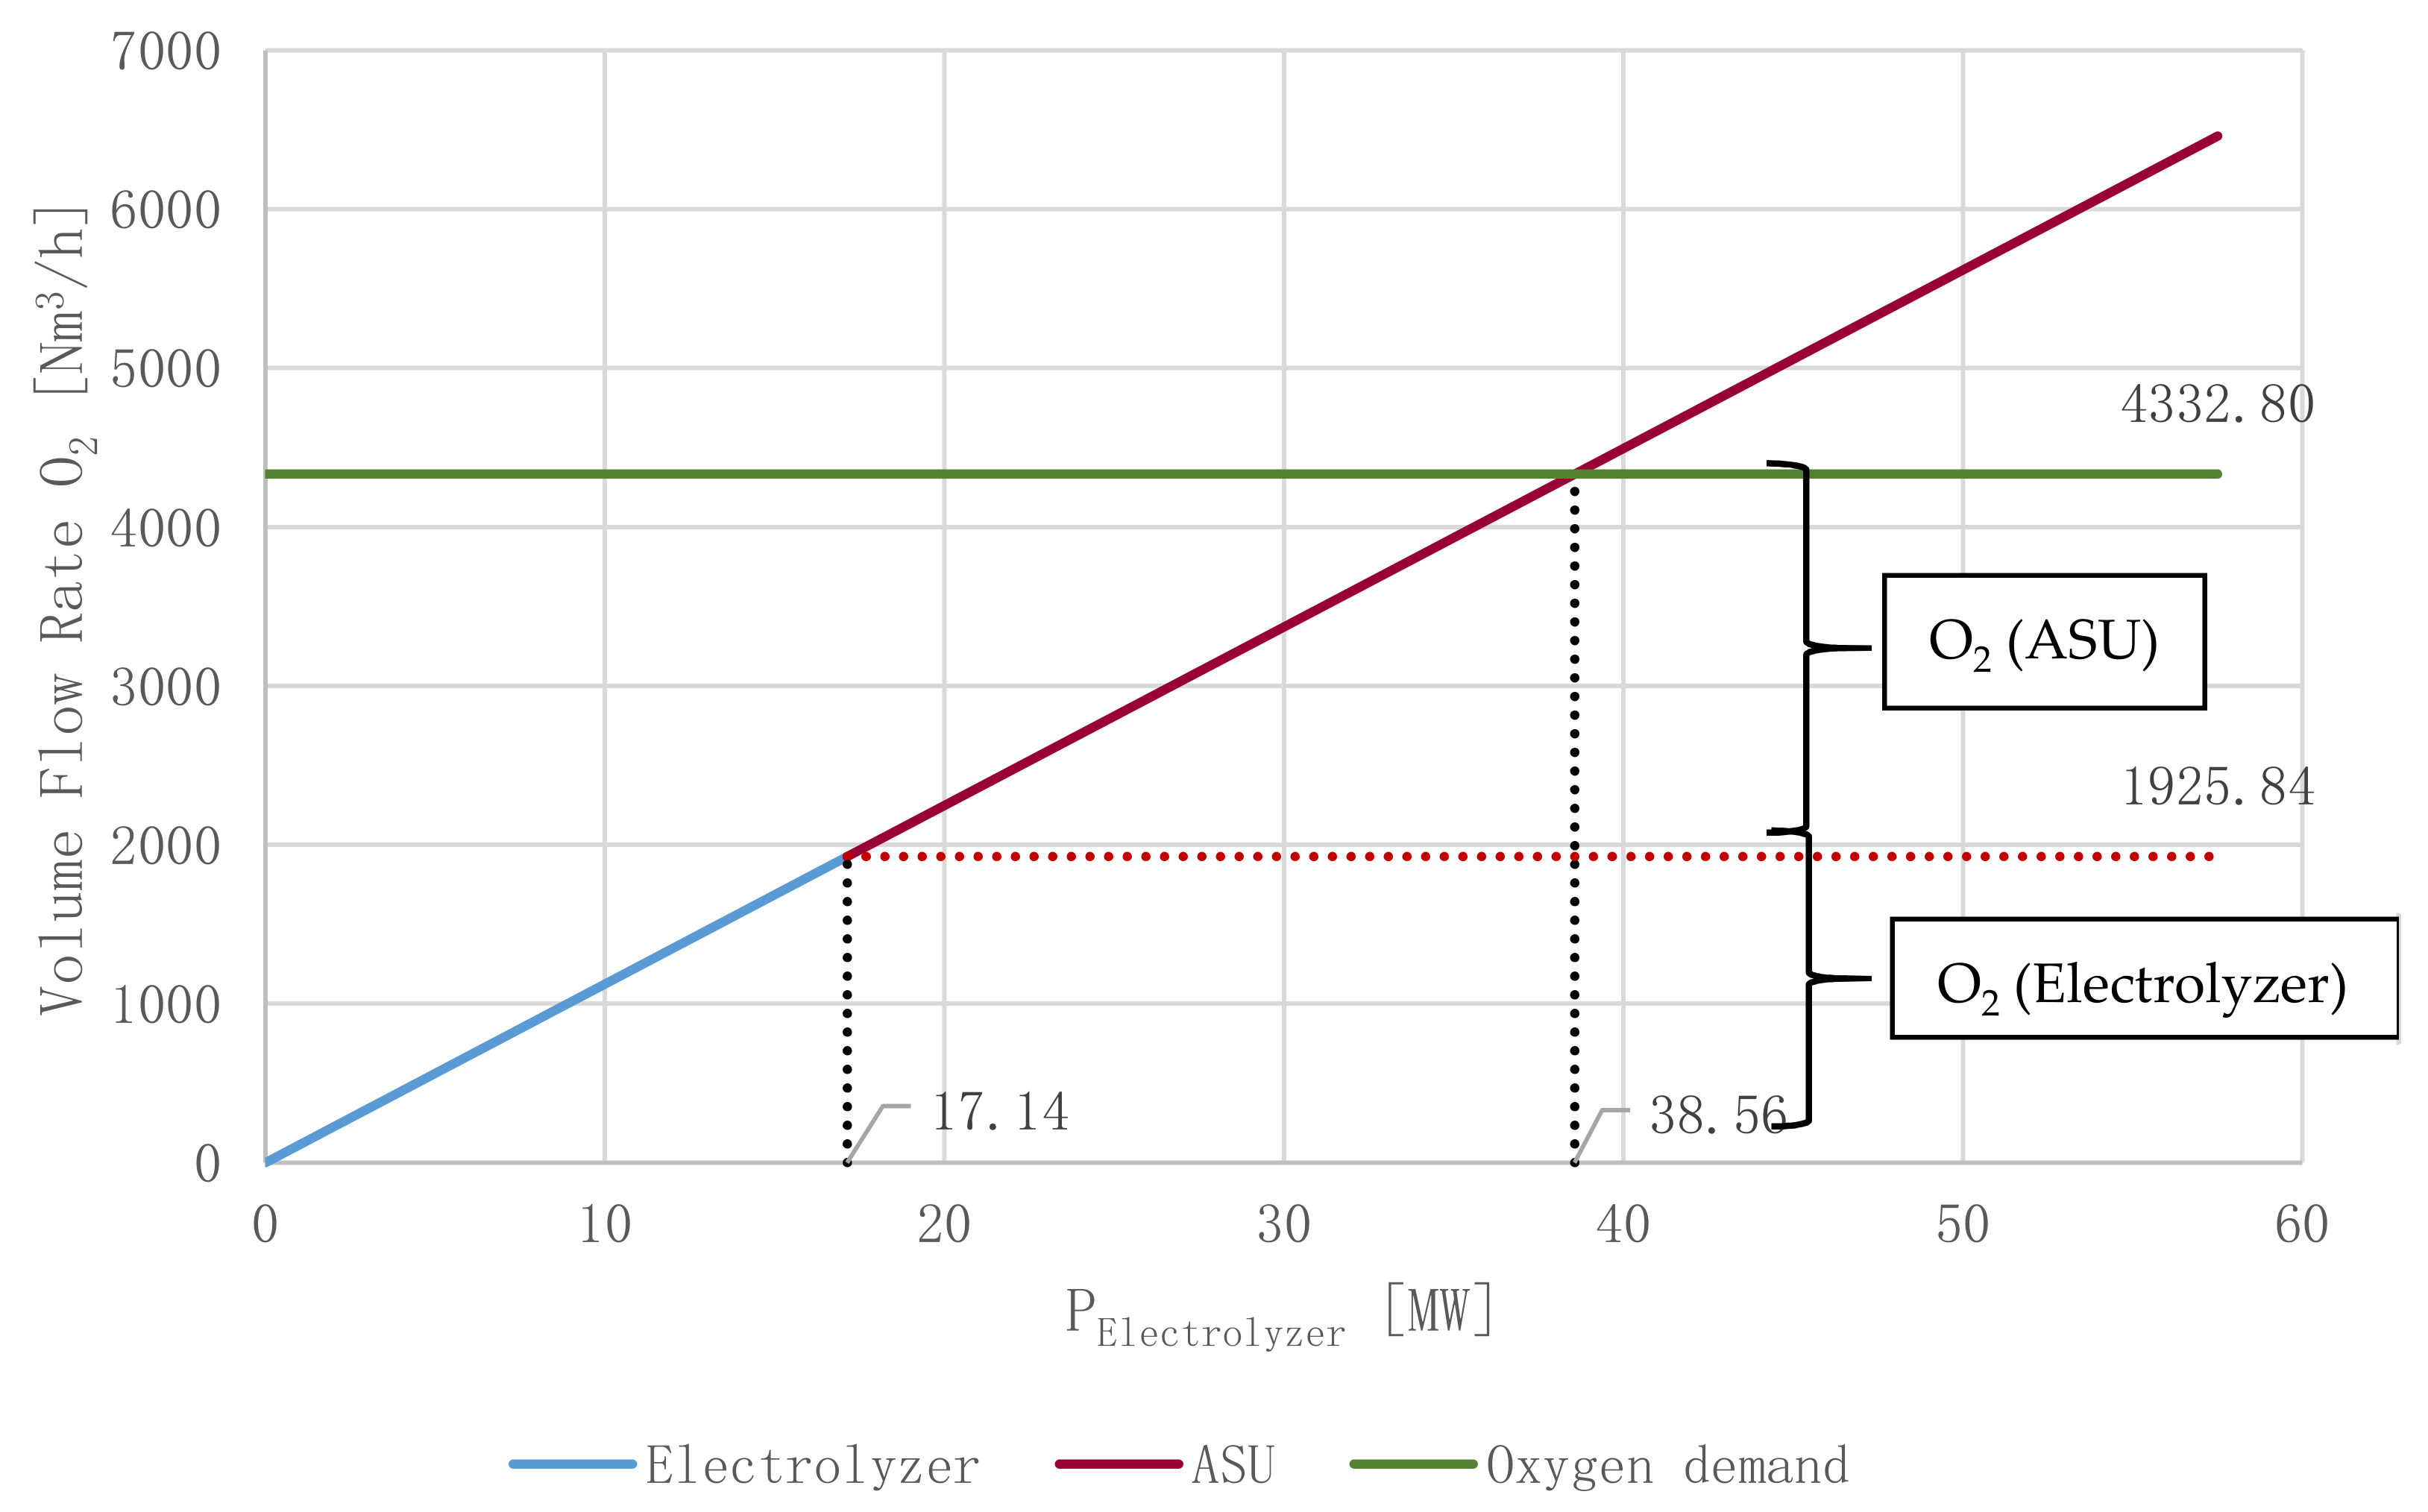
2 of 342 kg/h is required for the methanol synthesis unit (324 kg/h) and the DeOxo reactor (18 kg/h). Furthermore, 6187 kg/h of O2 is required for the oxyfuel combustion. For a CO2 utilization rate of γ = 0.3, 3474 kg/h O2 (55.55%) must be provided by an ASU (PASU = 4.73 MW). In this case, only 2713 kg/h O2 (44.45%) is provided by the electrolyzer at a power input of PElectrolyzer = 17.14 MW. If PElectrolyzer exceeds a value of 38.56 MW (γ = 0.7), no additional O
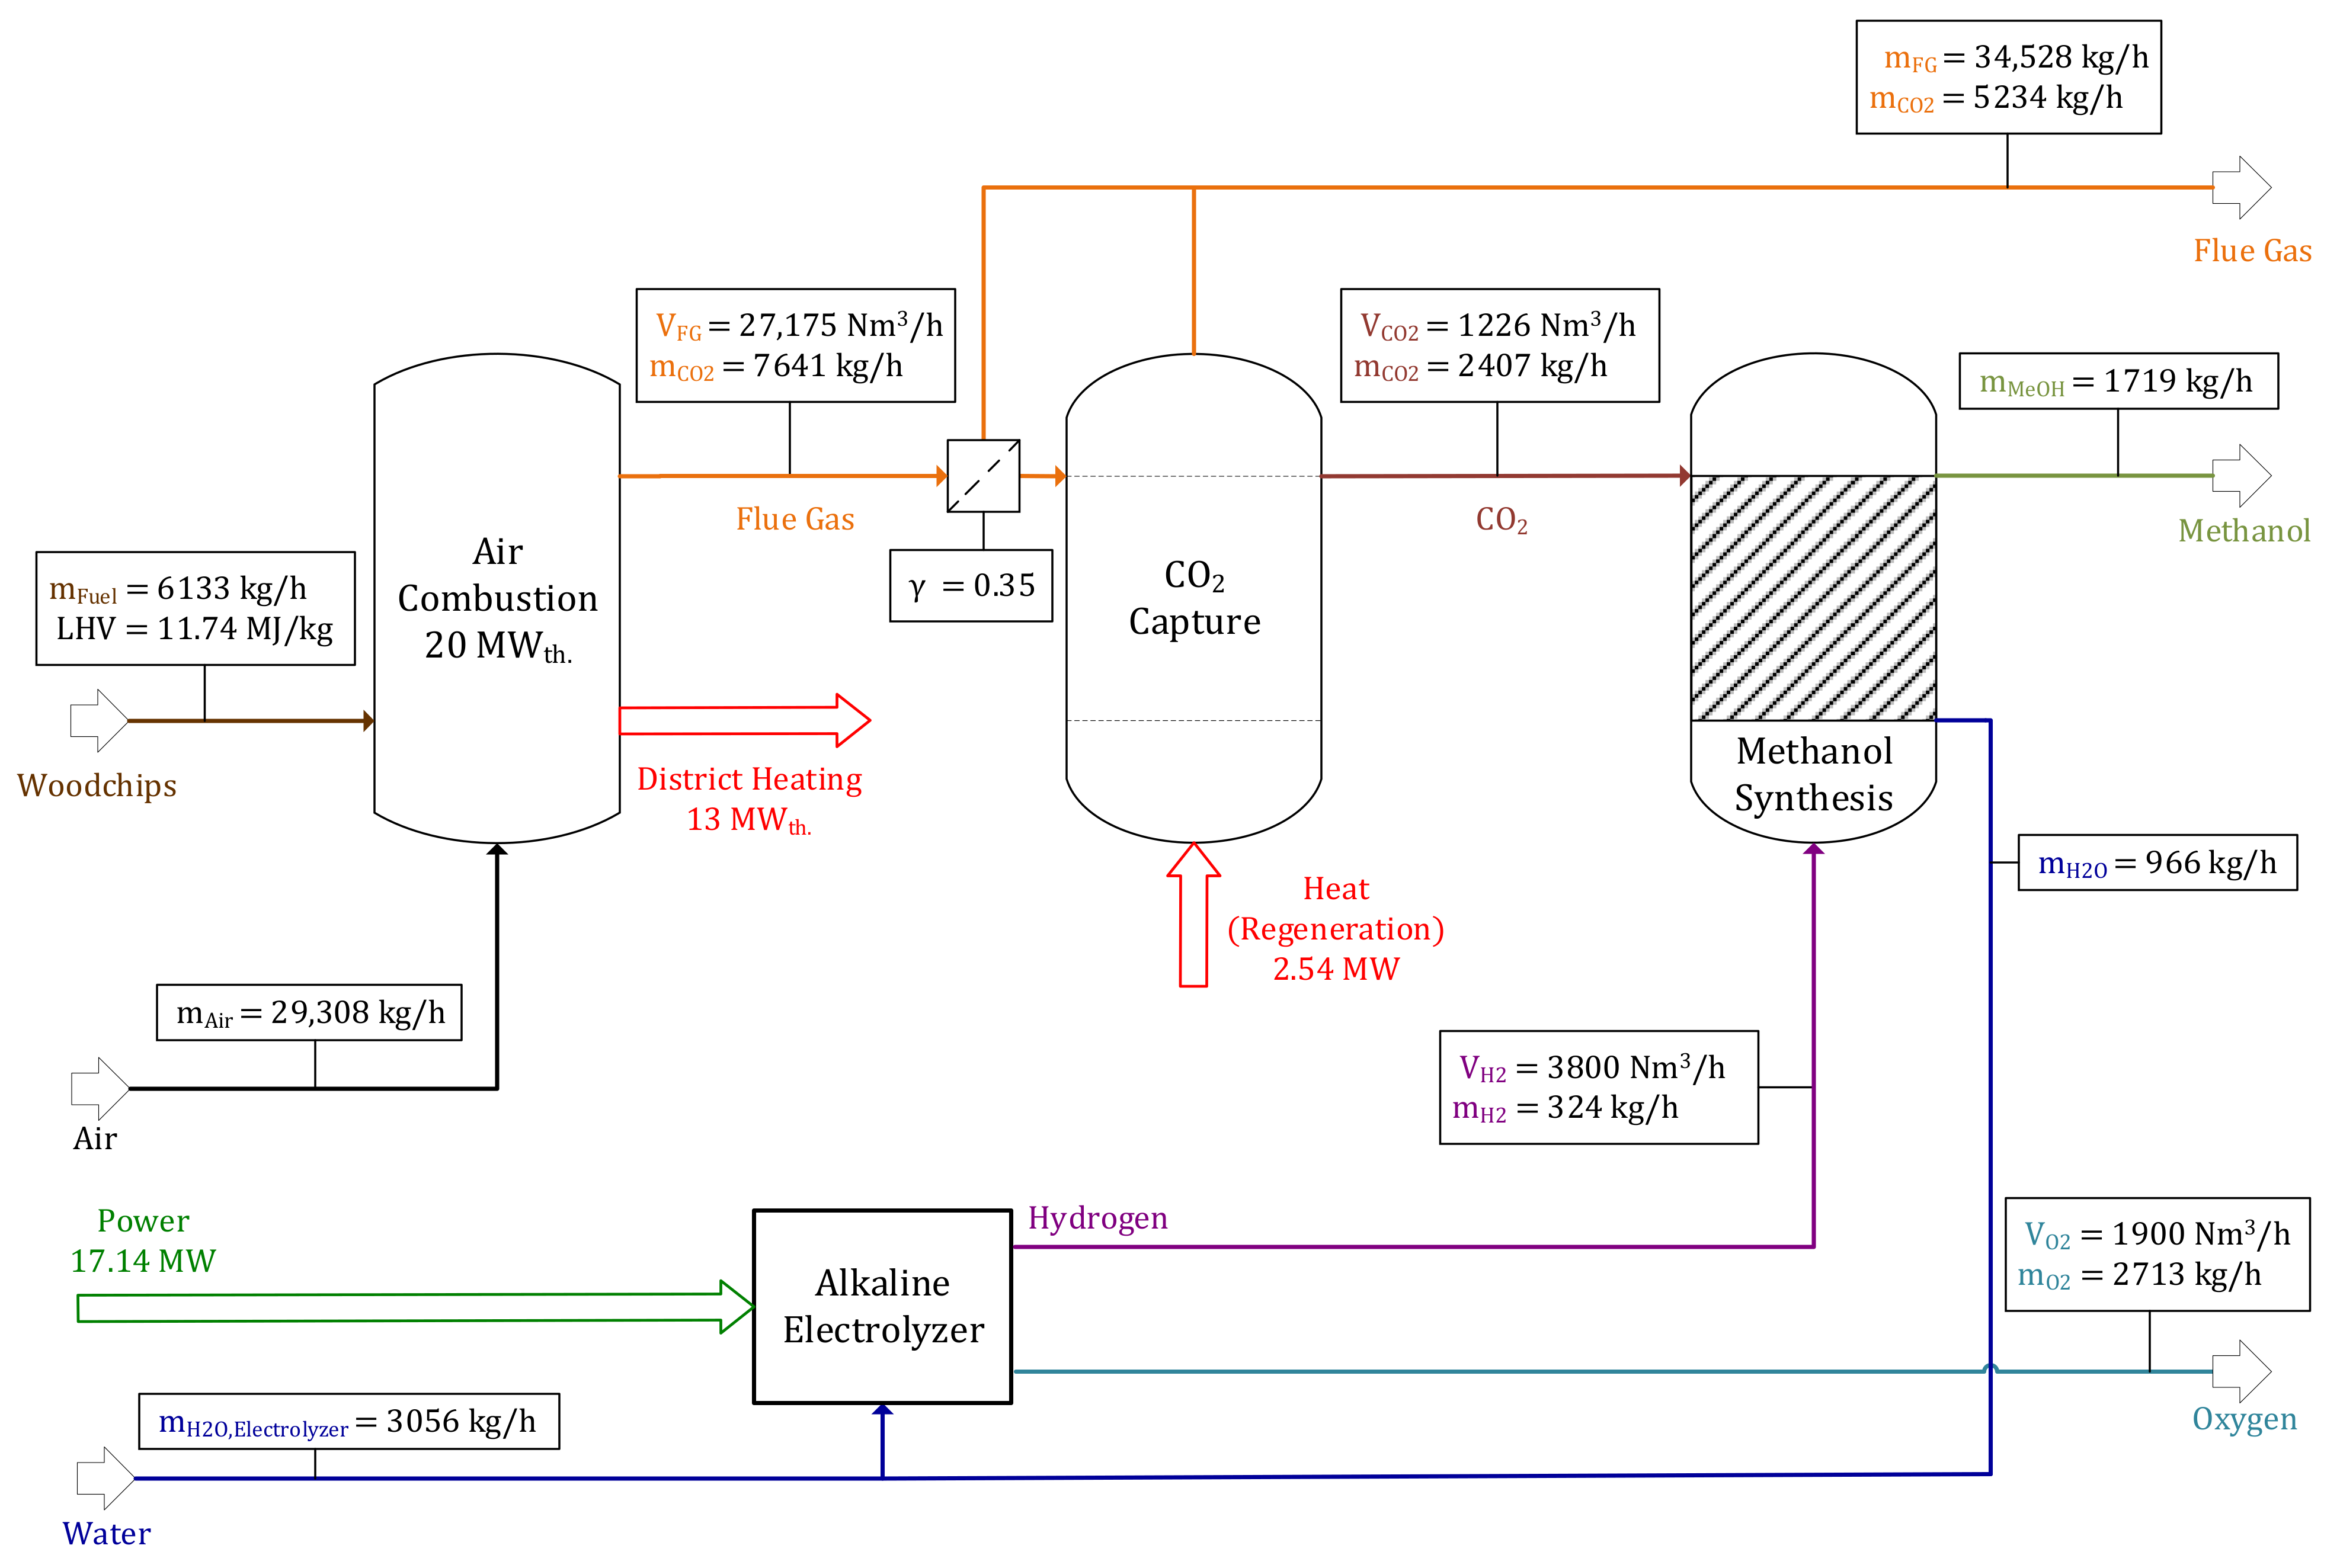
2 would be required by an ASU. Global flow charts of a comparable scenario using air combustion can be found in Figure A3 and Figure A5 in the Appendix A. In this scenario, 35% of generated flue gas (9511 Nm3/h with a CO2 concentration of 14.33 vol%) can be converted to methanol. A yield of 1719 kg/h of methanol can be obtained with a fuel input of 6133 kg/h woodchips. Additionally, no ASU is required to save 4.73 MW of power. It is noted that condensed water is pumped to the electrolyzer, which is not indicated in the simplified flow charts.
This paper also focuses on answering the question whether process routes including oxyfuel combustion should be preferred over air combustion, since O2 generated by the electrolyzer could be used as oxidant substituting an ASU. To evaluate this assumption, plant efficiency parameters were defined and analyzed. The plant’s power-to-liquid efficiency increases significantly with an increasing share of utilized CO2 (increasing γ) for oxyfuel combustion applications; nevertheless, it is constant for air combustion process routes (ηTot.,Air = 54.36%≠f(γ), ηPtL,Air = 54.21%≠f(γ)). The maximum efficiency rates for oxyfuel combustion process routes were ηTot.,Max.,Oxy = 57.04% (γ = 0.6) and ηPtL,Max.,Oxy = 51.91% (γ = 1.0), whereas the minimum efficiency rates are significantly lower at ηTot.,Min.,Oxy = 47.28% (γ = 0.1) and ηPtL,Min.,Oxy = 20.97% (γ = 0.1). This aspect is linked to the ASU’s high power consumption for operating points with low γ values. For plants utilizing less than 70% of the generated flue gas, air combustion process routes should be preferred, as they obtain a higher ηPtL,Air = 54.21% (γ = 0.35) compared to ηPtL,Oxy,Reference = 40.91 (γ = 0.3) for the reference operating point. However, oxyfuel applications have the potential to reach a higher ηTot. (ηTot.,Max. = 57.04%) in comparison to air combustion modes, since no additional heat is required for regenerating the MEA solution for CO2 processing.
The presented concept has the potential to work as a carbon sink if the methanol produced is utilized as feedstock in the chemical industry. Wooden biomass is used as fuel, while providing decentralized communities with heat generated by combusting local wood, hence empowering regional development. In case methanol is used as fuel, the proposed concept can be described as almost carbon neutral, as CO2 bound by wood is subsequently emitted to the atmosphere. Additionally, a business case for small-to-medium sized villages situated in regions obtaining a high wind potential is generated. For applications using surplus electricity, a process route including conventional air combustion in combination with a CO2 capture unit is highly recommended, since no additional ASU is required. This is also true for applications including small-scale wind parks. Oxyfuel combustion processes have a high potential in combination with water electrolysis, since generated O2 can be directly used as oxidant. However, this configuration is only reasonable if PElectrolyzer > 38.56 MW (for power plants with a thermal input of 20 MWth.), the threshold when the combustor’s O2 demand can be fully covered with O2 generated by the electrolyzer. Substituting O2 with an ASU always comes with a significant penalty on ηPtL and should consequently be avoided. As a result, oxyfuel process configurations are only recommended for large-scale investments, including wind parks with a rated power of PWind park > 100 MWp and large annual average uWind.
In addition, a case study analyzing the facility’s annual major input and output streams was conducted assuming process parameters of the reference operating point presented in Section 3.2. An annual output of 17,161 t/a methanol and 99.53 GWhth./a heat can be realized for an input of 50,632 t/a woodchips and 177.11 GWh/a power, generated by a local wind park and the CHP process.
Combining oxyfuel combustion with CCU technologies (e.g., the valorization of CO2 to methanol) is a promising system configuration for future PtL plants which use large-scale electrolyzers. Scaling up water electrolysis plants is going to be one of the major challenges for engineers in this decade. The combination of solid oxide electrolysis units and CCU technologies has the potential to significantly improve the efficiency rates of PtL plants by thermal process integration. Heat generated by the combustor (oxyfuel or air) and the methanol synthesis unit can be transferred to the SOEC (solid oxide electrolysis cell) unit, which results in the decrease of the required power for water splitting.
Future research should include the following aspects:
  • Basic and detail engineering for all unit operations as well as their interaction;
  • Implementation of heat integration by, for example, conducting a pinch analysis;
  • Finding new process routes (e.g., using photovoltaic modules as power source, using other CO2 sources like direct air capture, pre combustion or industrial processes). Exchanging the methanol synthesis unit with a Fischer-Tropsch synthesis or methanation unit are possible options if other products are preferred by possible customers. Additionally, process routes including SOEC units have the potential to significantly improve the facility’ efficiency rates;
  • Evaluating the facility’s potential for grid stabilization;
  • Developing a technology impact analysis as well as an LCA.
Detailed and simplified global flow charts of process routes applying oxyfuel and air combustion can be found in the Appendix A.

Author Contributions

Conceptualization, S.P. and F.W.; methodology, S.P. and F.W.; visualization, S.P.; writing—original draft preparation, S.P.; review, S.P., F.W. and J.H.; writing—editing, S.P.; validation, P.S. and J.H.; supervision, F.W. All authors have read and agreed to the published version of the manuscript.

Funding

The authors would like to thank the TU Wien Bibliothek for financial support through its Open Access Funding Program, the TU Wien Doctoral College ‘CO2 Refinery’, the Austrian Research Promotion Agency (FFG) and the Ministry BMK for the financial support of the project IEA-FBC (No. #876737).

Data Availability Statement

For further information regarding data presented in this paper, please contact the corresponding author. The findings of this paper are based on results obtained from the corresponding author’s master thesis ‘Power to Green Methanol—A Concept Study’.

Acknowledgments

Open Access Funding by TU Wien.

Conflicts of Interest

The authors declare no conflict of interest.

Abbreviations

ASUAir separation unit
BFBCBubbling fluidized bed combustor
BWRBoiling water reactor
CCSCarbon capture and storage
CCUCarbon capture and utilization
CHPCombined heat and power
CRICarbon Recycling International
DACDirect air capture
DHDistrict heating
FDFlash drum
FGFlue gas
FGRFlue gas recirculation
FMFluidization medium
IMPCAInternational Methanol Consumers and Producers Association
IPCCIntergovernmental Panel on Climate Change
LCALife cycle assessment
LHVLower heating value
MEAMonoethanolamine
MeOHMethanol
PtCPower-to-chemicals
PtFPower-to-fuels
PtGPower-to-gas
PtLPower-to-liquid
PtXPower-to-X
SCRSelective catalytic reduction
SOECSolid oxide electrolysis cell
TRLTechnology readiness level
Abs.Absorber
Atm.Atmospheric
Bag.Baghouse filter
Compr.Compressor
Con.Condenser
Des.Desorber
Dis.Distributor plate
el.Electric
fFluidization
gGas
iSpecies i
max.Maximum
Op.Operating conditions
Ox.Oxidant
sSaturated
svEquivalent diameter
th.Thermal
Tr.Triple point
Unc.Unconverted gases
Nomenclature
AArea [m2]
dDiameter [m]
hHeight [m]
VVolume [m3]
T, θTemperature [K,°C]
pPressure [Pa,bar]
XWater loading [kg/kg]
V ˙ Volume flow rate [m3/s]
m ˙ Mass flow rate [kg/s]
n ˙ Material flow rate [kmol/s]
m’Mass fraction [wt%]
yVolume fraction [vol%]
Q ˙ Rate of heat flow [W]
Q’Specific heat demand [MJ/kg]
QTot.Total heat demand [GWhth.]
LHVLower heating value [MJ/kg]
PPower [W]
PTot.Total electricity demand [GWh]
U ˙ Flow rate of chemical energy [J/s]
wtSpecific technical work [J/kg]
RUniversal gas constant [J/(mol∙K)]
RiSpecific gas constant of species i [J/(kg∙K)]
ΔHrReaction enthalpy [kJ/mol]
uVelocity [m/s]
rRecirculation ratio [-]
αExcess of oxygen in the oxidant [-]
βExcess of oxygen in the fluidization medium [-]
γAllocation coefficient [-]
εPorosity [-]
λAir ratio [-]
ρDensity [kg/m3]
μDynamic viscosity [Pa∙s]
ηEfficiency rate [%,-]
ψCO2 conversion [%]
ωH2:CO2 ratio [-]

Appendix A

Table A1. Specific O2 demand of the combustion reaction per species i.
SpeciesO2 Demand [Nm3/kg of Species i]
C1.8659
H5.5608
O−0.7003
S0.6988
Table A2. Input and output—reference operating point.
ParameterValue [kg/h]kg/kg Fuelkg/kg MeOH
Input m ˙ F u e l 6132.90-3.746
m ˙ H 2 341.680.0560.209
MeOH synthesis (H2)324.360.0530.198
DeOxo reactor (H2)17.310.0030.011
m ˙ O 2 (Oxyfuel)6186.951.0093.779
O2 from Electrolyzer2713.070.4421.657
O2 from ASU3473.830.5562.122
m ˙ C a O H 2 7.2260.0010.004
m ˙ N H 4 O H 2.4470.00040.001
m ˙ A i r 14,9992.4469.160
Output m ˙ M e O H 1637.400.267-
m ˙ N 2 11,334.451.8486.992
m ˙ A r 190.330.0310.116
m ˙ F G 5744.460.9373.508
m ˙ C O 2 5348.720.8723.267
m ˙ H 2 O (net value)1929.950.3151.179
CO2CO2 generated7461.031.2464.667
CO2 utilized2292.310.3741.400
CO2 emitted5348.720.8723.267
Table A3. On-site demand—reference operating point.
ProcessSymbolTypeSpecies[kg/s][Nm3/s]Power [kW]
OxyfuelOXY.1V1BlowerFM10.836.02500
OXY.2V2FanFG0.680.420.75
OXY.3V3FanFG1.600.841.5
OXY.4P1PumpH2O1.13-0.4
OXY.5H1Twin screwFuel1.70-0.7
SUM Oxyfuel503.35
DeOxoDeOxo.1V2FanFGSee OXY.2
DeOxo.2C4CompressorFG0.684-95.24
SUM DeOxo95.24
MethanolMeOH.1P2PumpMeOH + H2O0.71-0.4
MeOH.2P3PumpMeOH0.46-0.4
MeOH.3P4PumpH2O0.26-0.4
MeOH.4P5PumpH2O0.26-0.4
MeOH.5C1CompressorCO20.64-59.87
MeOH.6C2CompressorH20.09-32.55
MeOH.7C3CompressorRec. gases0.019-27.94
SUM Methanol121.96
ElectrolyzerELE.1P1PumpH2OSee OXY.4
SUM Electrolyzer0
Total on-site power demand720.55
Table A4. Molar masses of relevant species.
SpeciesMolar Mass [kg/kmol]
C12.01
H22.015
O232.00
S32.07
N228.01
H2O18.02
SO264.07
Table A5. Specific and universal gas constants.
SpeciesGas Constant [J/(mol∙K)]
RUniv.8.314
CO2188.91
H24126.05
CO296.82
Rec. Gases (H2, CO, CO2)1084.06
Table A6. Parameters for water—Antoine equation.
ParameterValue [-]
A17.2799
B4102.99
C237.431
Table A7. Assumed parameters of the BFBC.
ParameterValue [Unit]
Bed surface area ABed15 m2
Bed volume VBed15 m3
Bed height hBed1 m
Bed diameter dBed4.37 m
Bed temperature TBed850 °C
Table A8. Assumed properties of silica sand as bed material.
ParameterValue [Unit]
ρP2660 kg/m3
ρBulk1490 kg/m3
ε0.44
dP0.7 mm
dSV0.61 mm
Figure A1. Seasonal fluctuation of wind power [47].
Energies 14 04638 g0a1
Table A9. Machine list.
NameMachine
H1Twin screw conveyor
V1Blower
V2,V3Fans
W1Preheating heat exchanger
W2–7Heat exchangers
C1–4Multi-staged compressors
P1–8Rotary pumps
D1,D2Relief valves
F1,F2,F3,F4Distribution valves

Global Process Flow Charts

Figure A2. Reference operating point (Oxyfuel combustion)—simplified global flow chart.
Energies 14 04638 g0a2
Figure A3. Operating point “Air” (air combustion)—simplified global flow chart.
Energies 14 04638 g0a3
Figure A4. Reference operating point (oxyfuel combustion)—detailed global flow chart.
Energies 14 04638 g0a4
Figure A5. Operating point “Air” (air combustion)—detailed global flow chart.
Energies 14 04638 g0a5

References

  1. Trends in Atmospheric Carbon Dioxide. Available online: https://www.esrl.noaa.gov/gmd/ccgg/trends/global.html (accessed on 6 April 2021).
  2. Trends in Atmospheric Carbon Dioxide. Available online: https://www.esrl.noaa.gov/gmd/ccgg/trends/gl_gr.html (accessed on 6 April 2021).
  3. Meunier, N.; Chauvy, R.; Mouhoubi, S.; Thomas, D.; de Weireld, G. Alternative Production of Methanol from Industrial CO2. Renew. Energy 2020, 146, 1192–1203. [Google Scholar] [CrossRef]
  4. A European Green Deal—Striving to be the First Climate-Neutral Continent. Available online: https://ec.europa.eu/info/strategy/priorities-2019-2024/european-green-deal_en (accessed on 6 April 2021).
  5. Metz, B.; Intergovernmental Panel on Climate Change (Eds.) IPCC Special Report on Carbon Dioxide Capture and Storage; Cambridge University Press, for the Intergovernmental Panel on Climate Change: Cambridge, UK, 2005; ISBN 978-0-521-86643-9. [Google Scholar]
  6. Wulf, C.; Linßen, J.; Zapp, P. Review of Power-to-Gas Projects in Europe. Energy Procedia 2018, 155, 367–378. [Google Scholar] [CrossRef]
  7. Schlautmann, R.; Böhm, H.; Zauner, A.; Mörs, F.; Tichler, R.; Graf, F.; Kolb, T. Renewable Power-to-Gas: A Technical and Economic Evaluation of Three Demo Sites within the STORE&GO Project. Chem. Ing. Tech. 2021, 93, 568–579. [Google Scholar] [CrossRef]
  8. Bowker, M. Methanol Synthesis from CO2 Hydrogenation. ChemCatChem 2019, 11, 4238–4246. [Google Scholar] [CrossRef] [PubMed] [Green Version]
  9. Marlin, D.S.; Sarron, E.; Sigurbjörnsson, Ó. Process Advantages of Direct CO2 to Methanol Synthesis. Front. Chem. 2018, 6, 446. [Google Scholar] [CrossRef]
  10. Mathew, T. George Andrew Olah (1927–2017). Nature 2017, 544, 162. [Google Scholar] [CrossRef]
  11. Industrial Power-to-Liquid Pioneer Plant 2022 in Germany. Available online: https://ineratec.de/wp-content/uploads/2020/12/ineratec-pionieranlage-presseinformation.pdf (accessed on 2 April 2021).
  12. Schühle, P.; Reichenberger, S.; Marzun, G.; Albert, J. Slurry Phase Hydrogenation of CO2 to Methanol Using Supported In2O3 Catalysts as Promising Approach for Chemical Energy Storage. Chem. Ing. Tech. 2021, 93, 585–593. [Google Scholar] [CrossRef]
  13. Bukhtiyarova, M.; Lunkenbein, T.; Kähler, K.; Schlögl, R. Methanol Synthesis from Industrial CO2 Sources: A Contribution to Chemical Energy Conversion. Catal. Lett. 2017, 147, 416–427. [Google Scholar] [CrossRef] [Green Version]
  14. Wall, T.; Liu, Y.; Spero, C.; Elliott, L.; Khare, S.; Rathnam, R.; Zeenathal, F.; Moghtaderi, B.; Buhre, B.; Sheng, C.; et al. An Overview on Oxyfuel Coal Combustion—State of the Art Research and Technology Development. Chem. Eng. Res. Des. 2009, 87, 1003–1016. [Google Scholar] [CrossRef]
  15. Callide Oxyfuel Project—Final Results. Available online: https://www.globalccsinstitute.com/archive/hub/publications/202090/cop-finalresults-publicreport-march2018.pdf (accessed on 8 April 2021).
  16. Sher, F.; Pans, M.A.; Sun, C.; Snape, C.; Liu, H. Oxy-Fuel Combustion Study of Biomass Fuels in a 20 KWth Fluidized Bed Combustor. Fuel 2018, 215, 778–786. [Google Scholar] [CrossRef]
  17. Leonzio, G.; Zondervan, E.; Foscolo, P.U. Methanol Production by CO2 Hydrogenation: Analysis and Simulation of Reactor Performance. Int. J. Hydrog. Energy 2019, 44, 7915–7933. [Google Scholar] [CrossRef]
  18. Van-Dal, É.S.; Bouallou, C. Design and Simulation of a Methanol Production Plant from CO2 Hydrogenation. J. Clean. Prod. 2013, 57, 38–45. [Google Scholar] [CrossRef]
  19. Matzen, M.; Alhajji, M.; Demirel, Y. Chemical Storage of Wind Energy by Renewable Methanol Production: Feasibility Analysis Using a Multi-Criteria Decision Matrix. Energy 2015, 93, 343–353. [Google Scholar] [CrossRef] [Green Version]
  20. Skopec, P.; Hrdlička, J. Specific Features of the Oxyfuel Combustion Conditions in a Bubbling Fluidized BED. Acta Polytech. 2016, 56, 312–318. [Google Scholar] [CrossRef] [Green Version]
  21. Hrdlicka, J.; Skopec, P.; Opatril, J.; Dlouhy, T. Oxyfuel Combustion in a Bubbling Fluidized Bed Combustor. Energy Procedia 2016, 86, 116–123. [Google Scholar] [CrossRef] [Green Version]
  22. VDI e. V. (Ed.) VDI-Wärmeatlas; Springer: Berlin/Heidelberg, Germany, 2013; ISBN 978-3-642-19980-6. [Google Scholar]
  23. Vakkilainen, E.K. Steam Generation from Biomass: Construction and Design of Large Boilers; Butterworth-Heinemann: Oxford, UK, 2017; ISBN 978-0-12-804389-9. [Google Scholar]
  24. Anthony, E.J.; Hack, H. Oxy-fired fluidized bed combustion: Technology, prospects and new developments. In Fluidized Bed Technologies for Near-Zero Emission Combustion and Gasification; Elsevier: Amsterdam, The Netherlands, 2013; pp. 867–894. ISBN 978-0-85709-541-1. [Google Scholar]
  25. Vodička, M.; Hrdlička, J.; Skopec, P. Experimental Study of the NOX Reduction through the Staged Oxygen Supply in the Oxy-Fuel Combustion in a 30 KWth Bubbling Fluidized Bed. Fuel 2021, 286, 119343. [Google Scholar] [CrossRef]
  26. Cluet, B.; Mauviel, G.; Rogaume, Y.; Authier, O.; Delebarre, A. Segregation of Wood Particles in a Bubbling Fluidized Bed. Fuel Process. Technol. 2015, 133, 80–88. [Google Scholar] [CrossRef]
  27. Strauß, K. Kraftwerkstechnik; Springer: Berlin/Heidelberg, Germany, 2009; ISBN 978-3-642-01430-7. [Google Scholar]
  28. The EPA Air Pollution Control Manual. Available online: https://www3.epa.gov/ttncatc1/dir1/cs4-2ch2.pdf (accessed on 9 April 2021).
  29. Moioli, S.; Nagy, T.; Langé, S.; Pellegrini, L.A.; Mizsey, P. Simulation Model Evaluation of CO2 Capture by Aqueous MEA Scrubbing for Heat Requirement Analyses. Energy Procedia 2017, 114, 1558–1566. [Google Scholar] [CrossRef]
  30. Nouri, M.; Rahpaima, G.; Nejad, M.M.; Imani, M. Computational Simulation of CO2 Capture Process in a Fluidized-Bed Reactor. Comput. Chem. Eng. 2018, 108, 1–10. [Google Scholar] [CrossRef]
  31. Nakao, S.; Yogo, K.; Goto, K.; Kai, T.; Yamada, H. Advanced CO2 Capture Technologies: Absorption, Adsorption, and Membrane Separation Methods; Springer Briefs in Energy; Springer International Publishing: Cham, Switzerland, 2019; ISBN 978-3-030-18857-3. [Google Scholar]
  32. Pröll, T.; Schöny, G.; Sprachmann, G.; Hofbauer, H. Introduction and Evaluation of a Double Loop Staged Fluidized Bed System for Post-Combustion CO2 Capture Using Solid Sorbents in a Continuous Temperature Swing Adsorption Process. Chem. Eng. Sci. 2016, 141, 166–174. [Google Scholar] [CrossRef]
  33. Schöny, G.; Dietrich, F.; Fuchs, J.; Pröll, T.; Hofbauer, H. A Multi-Stage Fluidized Bed System for Continuous CO2 Capture by Means of Temperature Swing Adsorption—First Results from Bench Scale Experiments. Powder Technol. 2017, 316, 519–527. [Google Scholar] [CrossRef]
  34. Veneman, R.; Li, Z.S.; Hogendoorn, J.A.; Kersten, S.R.A.; Brilman, D.W.F. Continuous CO2 Capture in a Circulating Fluidized Bed Using Supported Amine Sorbents. Chem. Eng. J. 2012, 207–208, 18–26. [Google Scholar] [CrossRef]
  35. Cloete, S.; Giuffrida, A.; Romano, M.C.; Zaabout, A. The Swing Adsorption Reactor Cluster for Post-Combustion CO2 Capture from Cement Plants. J. Clean. Prod. 2019, 223, 692–703. [Google Scholar] [CrossRef]
  36. Das, D.; Behera, S.K.; Meikap, B.C. Removal of CO2 in a Multistage Fluidized Bed Reactor by Amine Impregnated Activated Carbon: Optimization Using Response Surface Methodology. Int. J. Coal Sci. Technol. 2019, 6, 445–458. [Google Scholar] [CrossRef] [Green Version]
  37. Kim, K.; Seo, H.; Kim, D.J.; Lee, C.; Min, D.Y.; Kim, H.M.; Park, Y.-K. Experimental Evaluation of CO2 Capture with an Amine Impregnated Sorbent in Dual Circulating Fluidized Bed Process. Int. J. Greenh. Gas. Control 2020, 101, 103141. [Google Scholar] [CrossRef]
  38. IMPCA Methanol Reference Specifications. Available online: http://www.methanol.org/wp-content/uploads/2016/07/IMPCA-Ref-Spec-08-December-2015.pdf (accessed on 12 April 2021).
  39. Carbon Recycling International: Commercial Scale CO2-to-methanol Plant in Norway. Available online: https://www.co2value.eu/wp-content/uploads/2019/09/2.-CRI.pdf (accessed on 12 April 2021).
  40. Roode-Gutzmer, Q.I.; Kaiser, D.; Bertau, M. Renewable Methanol Synthesis. ChemBioEng Rev. 2019, 6, 209–236. [Google Scholar] [CrossRef]
  41. Borisut, P.; Nuchitprasittichai, A. Methanol Production via CO2 Hydrogenation: Sensitivity Analysis and Simulation—Based Optimization. Front. Energy Res. 2019, 7, 81. [Google Scholar] [CrossRef] [Green Version]
  42. Coutanceau, C.; Baranton, S.; Audichon, T. Hydrogen Production from Water Electrolysis. In Hydrogen Electrochemical Production; Elsevier: Amsterdam, The Netherlands, 2018; pp. 17–62. ISBN 978-0-12-811250-2. [Google Scholar]
  43. Brauns, J.; Turek, T. Alkaline Water Electrolysis Powered by Renewable Energy: A Review. Processes 2020, 8, 248. [Google Scholar] [CrossRef] [Green Version]
  44. Power-to-Liquids Potentials and Perspectives for the Future Supply of Renewable Aviation Fuel. Available online: https://www.umweltbundesamt.de/en/publikationen/power-to-liquids-potentials-perspectives-for-the (accessed on 20 April 2021).
  45. Austrian Windatlas. Available online: http://ispacevm11.researchstudio.at/index_v.html (accessed on 15 April 2021).
  46. Jansen&Heuning Calculation Program. Available online: https://www.jh.nl/en/berekeningsprogramma/ (accessed on 16 April 2021).
  47. Seasonal Variation in Wind Energy. Available online: http://ele.aut.ac.ir/~wind/en/tour/grid/season.htm (accessed on 22 April 2021).
Figure 1. Power-to-green methanol plant.
Energies 14 04638 g001
Figure 2. Oxyfuel combustion with dry flue gas recirculation (FGR).
Energies 14 04638 g002
Figure 3. DeOxo reactor—reference operating point.
Energies 14 04638 g003
Figure 4. Methanol synthesis—reference operating point.
Energies 14 04638 g004
Figure 5. Alkaline electrolyzer—reference operating point.
Energies 14 04638 g005
Figure 6. Air combustion of woodchips in a BFBC.
Energies 14 04638 g006
Figure 7. CO2 capture by MEA absorption—operating point “Air”.
Energies 14 04638 g007
Figure 8. Methanol synthesis—operating point “Air”.
Energies 14 04638 g008
Figure 9. Influence of α on the oxyfuel combustion (α = 1.08, γ = 0.3, r = 4.0).
Energies 14 04638 g009
Figure 10. O2 supply for the oxyfuel combustion—reference operating point.
Energies 14 04638 g010
Figure 11. Methanol production and the electrolyzer’s electricity demand as a function of γ (α = 1.08, ω = 3.2).
Energies 14 04638 g011
Figure 12. Methanol synthesis H2 demand as a function of ω (γ = 0.3, m ˙ M e O H = 1637.36 kg/h).
Energies 14 04638 g012
Table 1. Assumed ultimate analysis of woodchips.
Ultimate Analysis—Woodchips (Dry and Ash Free) [wt%]
CHNSOSUM
5060.40.0543.55100
Table 2. Assumed proximate analysis of woodchips.
Proximate Analysis—Woodchips [wt%]
Water Content WAsh Content AVolatilesFixed Carbon
3028020
Table 3. Process indicators regarding the production of methanol—reference operating point.
Process
Indicators
kg/hkg/kg FuelkWhel. Consumed/kgkg/kg H2kg/kg O2kg/kg CO2
Methanol1637.40.26710.764.7920.2650.306
Table 4. Key parameters—reference operating point.
ParameterValue [Unit]
Thermal input20 MWth.
Woodchips input6133 kg/h
Water content30 wt%
α1.08
β1.40
FGRDry
r4.0
TCon.15 °C
γ0.3
CO2 conversion ψ98.11%
PWind park36 MWp
PElectrolyzer17.14 MW
uWind7.5 m/s
Table 5. Global power balance.
NamePower [MW]
Power generation (CHP)3.0
On-site demand−0.72
PElectrolyzer−17.14
PASU−4.73
Table 6. Process indicators regarding the production of methanol—operating point “Air”.
Process
Indicators
kg/hkg/kg FuelkWhel. Consumed/kgkg/kg H2kg/kg CO2
Methanol1719.230.2809.8295.0320.328
Table 7. Key parameters—operating point “Air”.
ParameterValue [Unit]
Thermal input20 MWth.
Woodchips input6133 kg/h
Water content30 wt%
λ1.2
TCon.15 °C
γ0.35
ηCapture0.9
Purity CO2 stream99 vol%
CO2 conversion ψ98.11%
PWind park36 MWp
PElectrolyzer17.14 MW
uWind7.5 m/s
Table 8. Global power balance—operating point “Air”.
NamePower [MW]
Power generation (CHP)3.0
On-site demand−0.80
PElectrolyzer−17.14
Table 9. Analyzed operating points.
Operating PointPWind park [MWp]uWind [m/s]γ [-] m ˙ M e O H   [ kg / h ]
Reference operating point367.50.31637.4
Max. output of methanol “Max. MeOH”1237.515457.9
Low wind velocity “Min Wind”3640.1545.8
Max. wind velocity “Max. Wind”36120.63274.7
Air combustion mode “Air”367.50.351719.2
Biomass heating plant “Dead Calm”3600.04196.5
Table 10. Efficiency rates for analyzed operating points (As defined in Section 2.7.1).
Operating PointηTot. [%]ηPtL [%]γ [-] m ˙ M e O H   [ kg / h ]
Low wind velocity “Min Wind”47.2820.970.1545.8
Reference operating point53.1940.190.31637.4
Max. wind velocity “Max. Wind”57.0451.100.63274.7
Max. output of methanol “Max. MeOH”56.0951.9115457.9
Air combustion mode “Air”54.3654.210.351719.2
Table 11. CHP process—annual output.
SeasonMonthsPCHP [MW] Q ˙ C H P   [ MW th . ] Op. Time [h]PTot. [MWh]QTot. [MWhth.]
WinterDec, Jan, Feb2.28132160492428,080
SpringMar, Apr, May3.28122208724226,496
SummerJun, Jul, Aug4.28111704 1729318,744
AutumnSep, Oct, Nov3.28122184716326,208
SUM---825626,62299,528
1 No operation for three weeks due to revision and maintenance work.
Table 12. Wind park—annual output.
MonthWind Index [-]PWind park [MW]Op. Time [h]PTot. [MWh]
Jan14925.5374418,894
Feb12821.9367214,737
Mar13322.7974416,956
Apr9315.9472011,477
May8113.8874410,327
Jun6811.65216 12516
Jul7713.197449813
Aug7312.517449307
Sep9015.4272011,102
Oct10718.3474413,645
Nov12621.5972015,545
Dec12621.5974416,063
SUM--8256150,382
1 No operation for three weeks due to revision and maintenance work.
Table 13. Annual input and output—one year of operation.
SeasonMonthsOperating Time [h]Fuel
Input [t]
Methanol
Output [t]
Power equ. [GWh]Heat Output [GWhth.]
WinterDec, Jan, Feb216013,247530254.7228.08
SpringMar, Apr, May220813,541445746.0026.50
SummerJun, Jul, Aug1704 110,450280328.9318.74
AutumnSep, Oct, Nov218413,394459947.4626.21
SUM-825650,63217,161177.1199.53
1 No operation for three weeks due to revision and maintenance work.
Publisher’s Note: MDPI stays neutral with regard to jurisdictional claims in published maps and institutional affiliations.

