Article

Experimental Study on Critical Membrane Water Content of Proton Exchange Membrane Fuel Cells for Cold Storage at −50 °C

1
Fuel Cell System and Engineering Laboratory, Key Laboratory of Fuel Cells & Hybrid Power Sources, Dalian Institute of Chemical Physics, Chinese Academy of Sciences, Dalian 116023, China
2
University of the Chinese Academy of Sciences, Beijing 100039, China
3
Electric Power Research Institute of State Grid Liaoning Electric Power Supply Co. Ltd., Shenyang 110055, China
*
Authors to whom correspondence should be addressed.
Energies 2021, 14(15), 4520; https://doi.org/10.3390/en14154520
Submission received: 4 June 2021 / Revised: 29 June 2021 / Accepted: 7 July 2021 / Published: 27 July 2021
(This article belongs to the Section D2: Electrochem: Batteries, Fuel Cells, Capacitors)

Abstract

:
Membrane water content is of vital importance to the freezing durability of proton exchange membrane fuel cells (PEMFCs). Excessive water freezing could cause irreversible degradation to the cell components and deteriorate the cell performance and lifetime. However, there are few studies on the critical membrane water content, a threshold beyond which freezing damage occurs, for cold storage of PEMFCs. In this work, we first proposed a method for measuring membrane water content using membrane resistance extracted from measured high frequency resistance (HFR) based on the finding that the non-membrane resistance part of the measured HFR is constant within the range of membrane water content of 2.98 to 14.0. Then, freeze/thaw cycles were performed from −50 °C to 30 °C with well controlled membrane water content. After 30 cycles, cells with a membrane water content of 8.2 and 7.7 exhibited no performance degradation, while those higher than 8.2 showed significant performance decay. Electrochemical tests revealed that electrochemical surface area (ECSA) reduction and charge transfer resistance increase are the main reasons for the degradation. These results indicate that the critical membrane water content for successful cold storage at −50 °C is 8.2.

Graphical Abstract

1. Introduction

Proton exchange membrane fuel cell (PEMFC) is an energy conversion device that converts chemical energy directly into electricity, which has attracted great attention in recent years due to its high efficiency and environmentally friendly features. PEMFC is considered a promising power source to replace the traditional combustion engine in automotive applications in the future for the merits of high power density and quick start-up [1,2,3]. However, except cost and durability, low temperature environmental adaptability is another urgent issue to be solved to make fuel cell vehicles commercially viable [4,5].
The sub-zero survivability issues originate in the freezing of water. On one hand, when the cell is exposed to a sub-freezing temperature, residual water in the membrane, the porous medium, and the interface between multilayer structures freezes spontaneously, which causes irreversible degradation to the cell components, such as pin holes and cracks formation [6,7], electrochemical active surface area (ECSA) reduction [8,9], interfacial delamination [10,11], pore structure destruction [12], and even hydrophobicity variation [13,14]. Great attention has been paid to investigate the freezing damage through repeated freeze/thaw cycles. On the other hand, when the fuel cell is started at sub-zero temperature, produced water freezes and ice accumulates, blocking gas transport pathways and covering three-phase boundaries, eventually leading to local fuel starvation [15,16] and start-up failure [17,18,19]. Thus, the residual membrane water content is critical to freezing tolerance and cold start performance of the cell [20]. Water in the Nafion membrane can be divided into three categories according to its bonding strength to SO 3 [21]. The first is tightly bounded to SO 3 , which is non-freezable as the temperature decreases. The second type of membrane water is loosely bounded water, which exhibits freezing point reduction. Another type of water with the most mobility is free water, which exists when membrane hydration is relatively high. Although the absorption, desorption, and freezing behaviors of water in perfluorosulfonic acid membranes have been extensively studied [22,23], the relationship between quantitative water content and freezing damage remain unknown.
Previous research has shown that a gas purge before shutdown is an effective way to alleviate frost damage and promote start-up performance [24]. Hou [25] used humidified reactant gas with different relative humidity (RH) to purge the cell. The results indicated that the cell purged with RH58.0% showed no performance loss after 20 freeze/thaw cycles, while the cell purged with RH64.9% became easily flooded at high current densities, which is attributed to the change in pore size distribution of the gas diffusion layer (GDL). Luo et al. [26] also reported performance degradation in a high current density region when the cell was not subjected to any purge, while these did not show any damage after a hot/cold purge. Gas purges are important to control and minimize residual water in a PEMFC. Sinha and Wang [27] developed a three-dimensional (3D) analytical model to describe the gas purge phenomena, and they classified the water removal process into four stages: through-plane drying, in-plane drying, vapor transport and equilibrium stage. Further, they elucidated the effect of purge conditions on purge effectiveness and indicated that purging with low relative humidity gas, high cell temperature, and high gas velocity is preferable. In order to make the residual water content more intuitive, high frequency resistance (HFR) was first introduced by Ge and Wang [28] as a direct indicator of purge effectiveness and membrane hydration. It is now commonly used as a reflection of membrane hydration and as a calculation basis of membrane water content. However, the measured HFR not only includes the membrane resistance, but also the electronic resistances, the CL resistances, and the contact resistances. Therefore, it is inaccurate to use HFR instead of membrane resistance to calculate membrane water content. Moreover, the HFR will continue to decrease until it reaches thermodynamic equilibrium within one or two hours after the purge is completed, which is called HFR relaxation [28]. Tajiri [29] suggested that the membrane water content, which is critical to the cold start performance of PEMFC, corresponds to the HFR after relaxation, rather than the HFR immediately after purging. Membrane water content can also be well controlled by an equilibrium purge [24,30,31]. During an equilibrium purge, partially humidified gas with a specific RH was used to purge the cell for an extended period of time (typically ≥3 h) and the membrane water content then reached equilibrium with the relative humidity of the gas. In view of the purge duration, equilibrium purges are only of practical significance in laboratory research.
This work intends to experimentally investigate the effect of membrane water content on PEMFC freeze/thaw durability, and much attention has been paid to find the critical water content for successful storage at −50 °C. The aim is to provide a criterion for gas purges during fuel cell shutdown to avoid performance degradation and reduce unnecessary energy consumption caused by excessive drying. To achieve this, firstly, we used HFR after relaxation as the direct reflection of membrane hydration after purge, and the membrane water content was accurately calculated using membrane resistance extracted from the measured HFR. Then, the freeze/thaw cycle from −50 °C to 30 °C was performed 30 times with well controlled membrane water content. After that, performance was evaluated before and after freeze/thaw cycles. Finally, the electrochemical and physical characterization were conducted to reveal the degradation mechanism caused by freezing.

2. Experimental Section

2.1. MEA Manufacturing and Fuel Cell Setup

The catalyst-coated membranes (CCMs) were manufactured in three steps [32]: the first step was to prepare the catalyst ink by mixing catalyst powder (Pt/C, 70 wt%, Johnson Matthey Catalysts, London, Britain), Nafion solution (Dupont, Wilmington, NC, USA), isopropyl alcohol (Aladdin, Shanghai, China), and deionized (DI) water. In the second step, the mixture was ultra-sonically mixed at room temperature for 1 h. At last, the resulting catalyst ink was sprayed onto the Nafion 211 membrane on a hot vacuum plate to accelerate the evaporation of the solvents and eliminate the swelling phenomenon. The Pt loading for the cathode and anode were 0.4 mg·cm−2 and 0.2 mg·cm−2, respectively. To prepare the MEA, homemade CCMs were sandwiched between two GDLs by hot pressing at 140 °C and kept at a pressure of 0.05 MPa for 2 min. The GDL consists of a backing layer (Toray TGP-H060, Tokyo, Japan) and microporous layer (Vulcan XC-72, Cabot, Shanghai, China), with PTFE content of 5% and 40%, respectively.
Experiments were conducted using single cells with an active area of 5 cm2. The single cell consists of a pair of metal endplates, a pair of graphite flow fields with parallel flow channels, and a membrane electrode assembly (MEA). The single cells were screwed with a torque of 1.5 N·m.
Before testing, each fresh fuel cell is fully activated to ensure the optimal performance. During activation, the cell was operated at 65 °C and at a back pressure of 0.5 bar with 100% humidified H2/air, and the H2/air flow rates were 0.1 SLPM and 0.8 SLPM, respectively. The cell was kept with constant discharge current density of 1000 mA·cm−2 for 5 h until the voltage become stable. Then, the polarization measurement was conducted by measuring the cell voltage while stepping the current density.

2.2. Equationuilibrium Purge

The primary purpose of an equilibrium purge is to evaporate liquid water in the GDL and catalyst layer (CL), and to achieve thermodynamic equilibrium between membrane hydration and the relative humidity of the purge gas. Thus, the membrane water content can be accurately controlled. During the equilibrium purge, humidified nitrogen with constant flow rate of 0.5 SLPM was fed to both the cathode and anode, cell temperature was maintained at 65 °C, and the different RH of nitrogen were derived from different purge gas dew points. An electrochemical workstation (Gamry Reference 5000E, Warminster, USA) was used to monitor the HFR of the cell during purging. The equilibrium purge was completed when the HFR of the cell reached a stabilized value.

2.3. Dry purge and Freeze/Thaw Cycles

Dry purge was applied to remove water in the fuel cell. It consists of three steps in this experiment: (1) initial conditioning, (2) purge, and (3) relaxation. In the first step, the cell was operated at a constant discharge current density of 1000 mA·cm−2 for 30 min with 100% humidified H2 and air at 65 °C. The purge process was sensitive to the initial condition of the cell. This step was to ensure that the membrane is identically fully hydrated, and to guarantee good consistency and repeatability of the experiment. In the second step, the cell was purged at 65 °C with 1 L·min−1 dry nitrogen for both anode and cathode. The HFR of the cell during purging was monitored at a frequency of 10 kHz. Once the purge was completed, the cell was sealed immediately, and the temperature of the cell was maintained at a constant to monitor the HFR change. During this step, the HFR continued to decrease until it reached an equilibrium state, which is attributed to water distribution rebalancing inside the cell [28]. Once stable, the HFR value after relaxation is the true reflection of the equilibrium state inside the cell. At the end of these steps, five cells (cell-1, cell-2, cell-3, cell-4, and cell-5), with different final values of HFR as well as membrane water content, were obtained. After a dry purge, a freeze/thaw cycle was conducted 30 times between −50 °C and 30 °C in an environment chamber. Each cycle took 2 h of cooling and 1 h of heating. The polarization curve was measured, and the dry purge was conducted every 5 cycles. Electrochemical characterization and postmortem analyses were measured before and after freeze/thaw cycles. In order to eliminate the effect of the dry purge, the performance of cell-6 without freezing before and after the dry purge was also tested.

2.4. Electrochemical Measurements

Electrochemical impedance spectra (EIS) were conducted to measure the internal resistance of the fuel cell. A Nyquist plot was obtained from EIS measurement to show the ohmic resistance, charge transfer resistance, and mass transfer resistance of the cell. The perturbation amplitude for the sinusoidal signal is 10 mV over the frequency range of 100 kHz to 0.3 Hz. Before measurement, the cell was stabilized at 1000 mA·cm−1 for 15 min.
Cyclic voltammetry (CV) was employed to determine the ECSA of Pt catalyst. When the ECSA of the cathode was measured, fully humidified hydrogen and nitrogen were supplied to the cathode and anode with flow rates of 50 and 150 mL·min−1, respectively. The cathode functioned as the working electrode and the anode functioned as the reference and counter electrode. Cell potential was scanned from 0.05 V to 1.2 V with a scanning rate of 50 mV·s−1. For CV measurements, more than 10 cycles were performed until the H-desorption peak was stable.

2.5. Morphology and Pore Structure Analysis

Scanning electron microscopy (JEOL JSM-7800F, Tokyo, Japan) was applied to detect the surface and cross-sectional morphology of the MEAs before and after freeze/thaw cycles.
The porosity of the MEA was measured by the mercury intrusion porosimeter (Auto Pore IV 9500, Norcross, USA). The mercury contact angle was 130° and the intrusion pressure was from 0.9 × 10⁴ psia to 3.0 × 10⁴ psia.

3. Results and Discussion

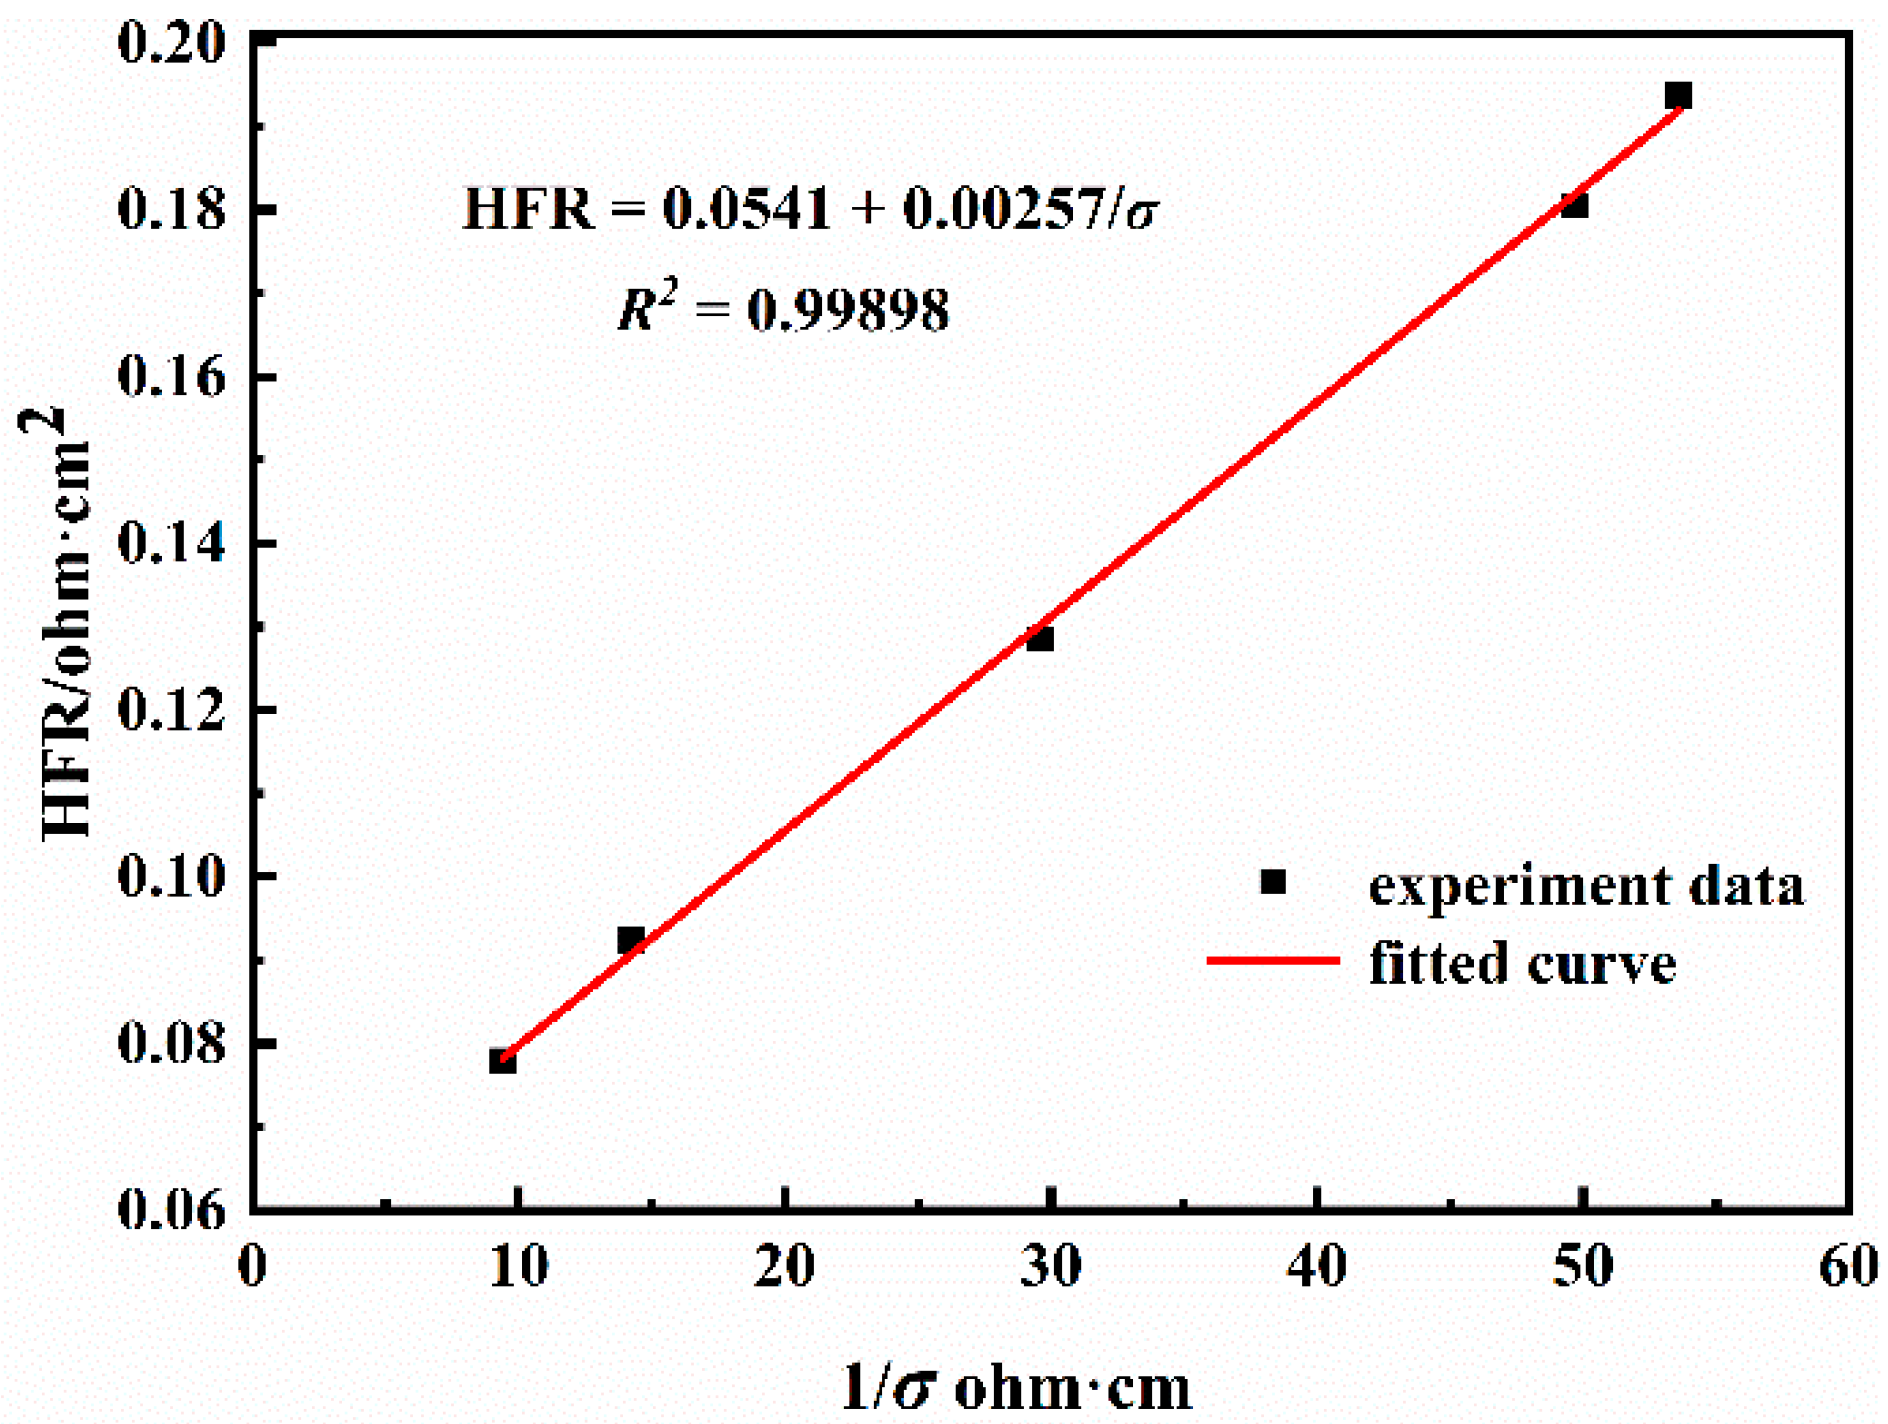
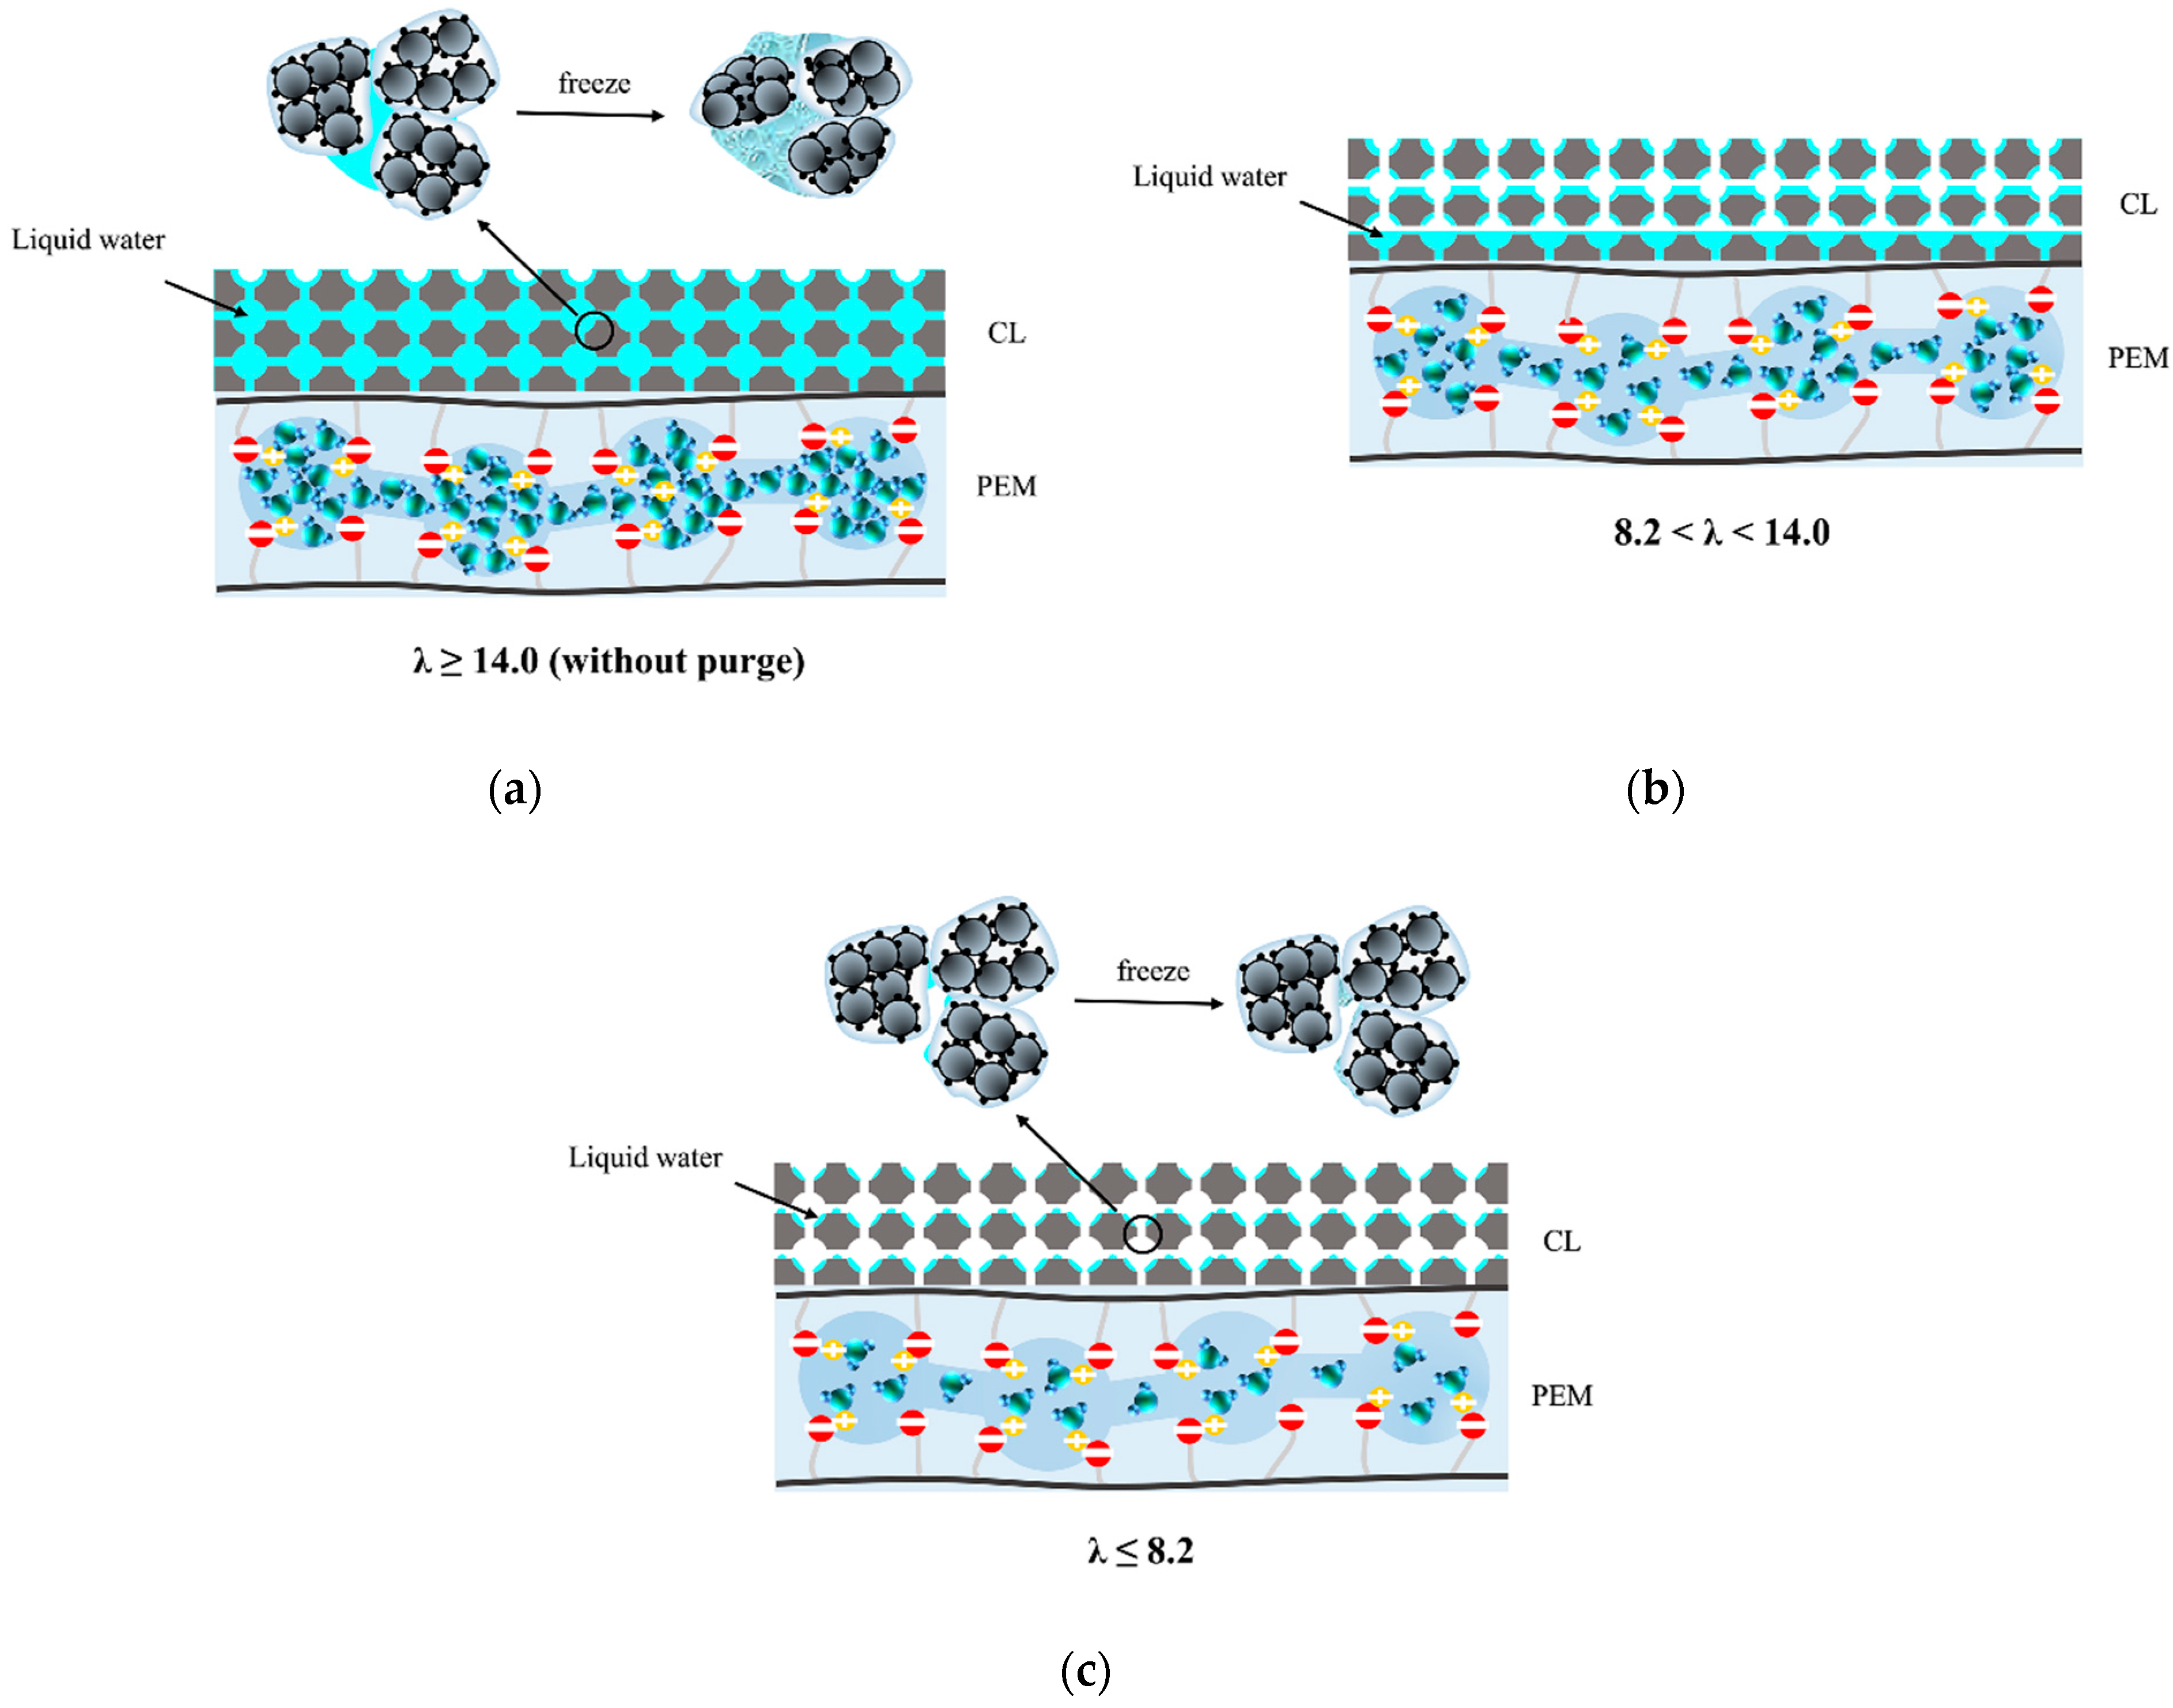
3.1. Calculation of Membrane Water Content

As mentioned before, the equilibrium purge is conducted in this experiment to initialize the hydration of various membranes. By fixing the cell temperature at 65 °C while changing the gas dew point, nitrogen gas with different values of relative humidity could be obtained. The process of establishing an equilibrium generally took more than 2 h, which is consistent with Tajiri’s report [24]. The final point of HFR increased with the decrease in relative humidity of the purge gas. At this point, most of the continuous liquid water in the porous structures and flow channels was removed, and the membrane was equilibrated with the relative humidity of nitrogen gas. Under this condition, the polymer electrolyte membrane water content can be easily determined from Springer’s empirical expression below [22]:
λ = 0.043 + 17.81 α 39.85 α 2 + 36.0 α 3   for   0 < α 1 λ = 14 + 1.4 α 1   for   0 < α 1
where λ is the membrane water content, which is given as the number of water molecules per sulfonic acid group, and α is water vapor activity of the purge gas.
The proton conduction of perfluorinated sulfonic acid (PFSA) membranes is highly coupled with membrane water content. Springer [22] examined the dependency of proton conductivity of Nafion membranes as a function of membrane water content and temperature. The results indicated that the proton conductivity of Nafion membranes is linearly related to λ and non-linearly related to temperature:
σ =   0.005139 λ 0.00326 exp 1268 1 303 1 273 + T
where σ is the proton conductivity of the membrane and T is the cell temperature. All experimental conditions and results for the equilibrium purge are summarized in Table 1.
As mentioned before, the measured HFR consists of membrane resistance, electronic resistances, CL resistances, and contact resistances, as shown below:
HFR = R m + R s
where R s is defined as the sum of electronic resistance, CL resistances, and contact resistances. Membrane resistance, R m , can be calculated from proton conductivity obtained by equilibrium purge.
R m = L σ
where L is the thickness of the membrane. Note that all resistances here are area specific resistances. Thus, Equation (3) can be rewritten as:
HFR = L σ + R s
Figure 1 is a plot of measured HFR versus the reciprocal of proton conductivity in the range of membrane water content of 2.98 to 14.00. The fitting curve coincides well with the experimental data with a linear correlation coefficient up to 0.998. The following fitting of HFR as a function of σ is obtained.
HFR = 0.00257 σ + 0.0541
By comparing Equation (5) and Equation (6), we can easily find that the R s of the cell is constant within the range of membrane water content of 2.98 to 14.00, the value is estimated as 0.0541 Ω·cm2. The fitted slope, namely the membrane thickness, is 25.7 μm, which is 0.7 μm bigger than the actual thickness of Nafion 211 that we used in the experiment. This can be explained by the fact that Nafion solution is an important component in the catalytic layer, and this part of Nafion can be regarded as part of the membrane with a certain equivalent thickness. However, the HFR exhibits a substantial increase with a membrane water content below 2.98 because the ultra-low water content below 2.98 brings great uncertainty to the behavior of the ionomer [29] and increases the CL resistances.
Therefore, we can extract the membrane resistance, which is difficult to measure experimentally, from the measured HFR when the membrane water content is within the range of 2.98 to 14.00. Based on this method, membrane water content can be accurately calculated using the following equation:
λ = L exp 1268 1 273 + T 1 303 HFR R s + 0.00326 / 0.005139

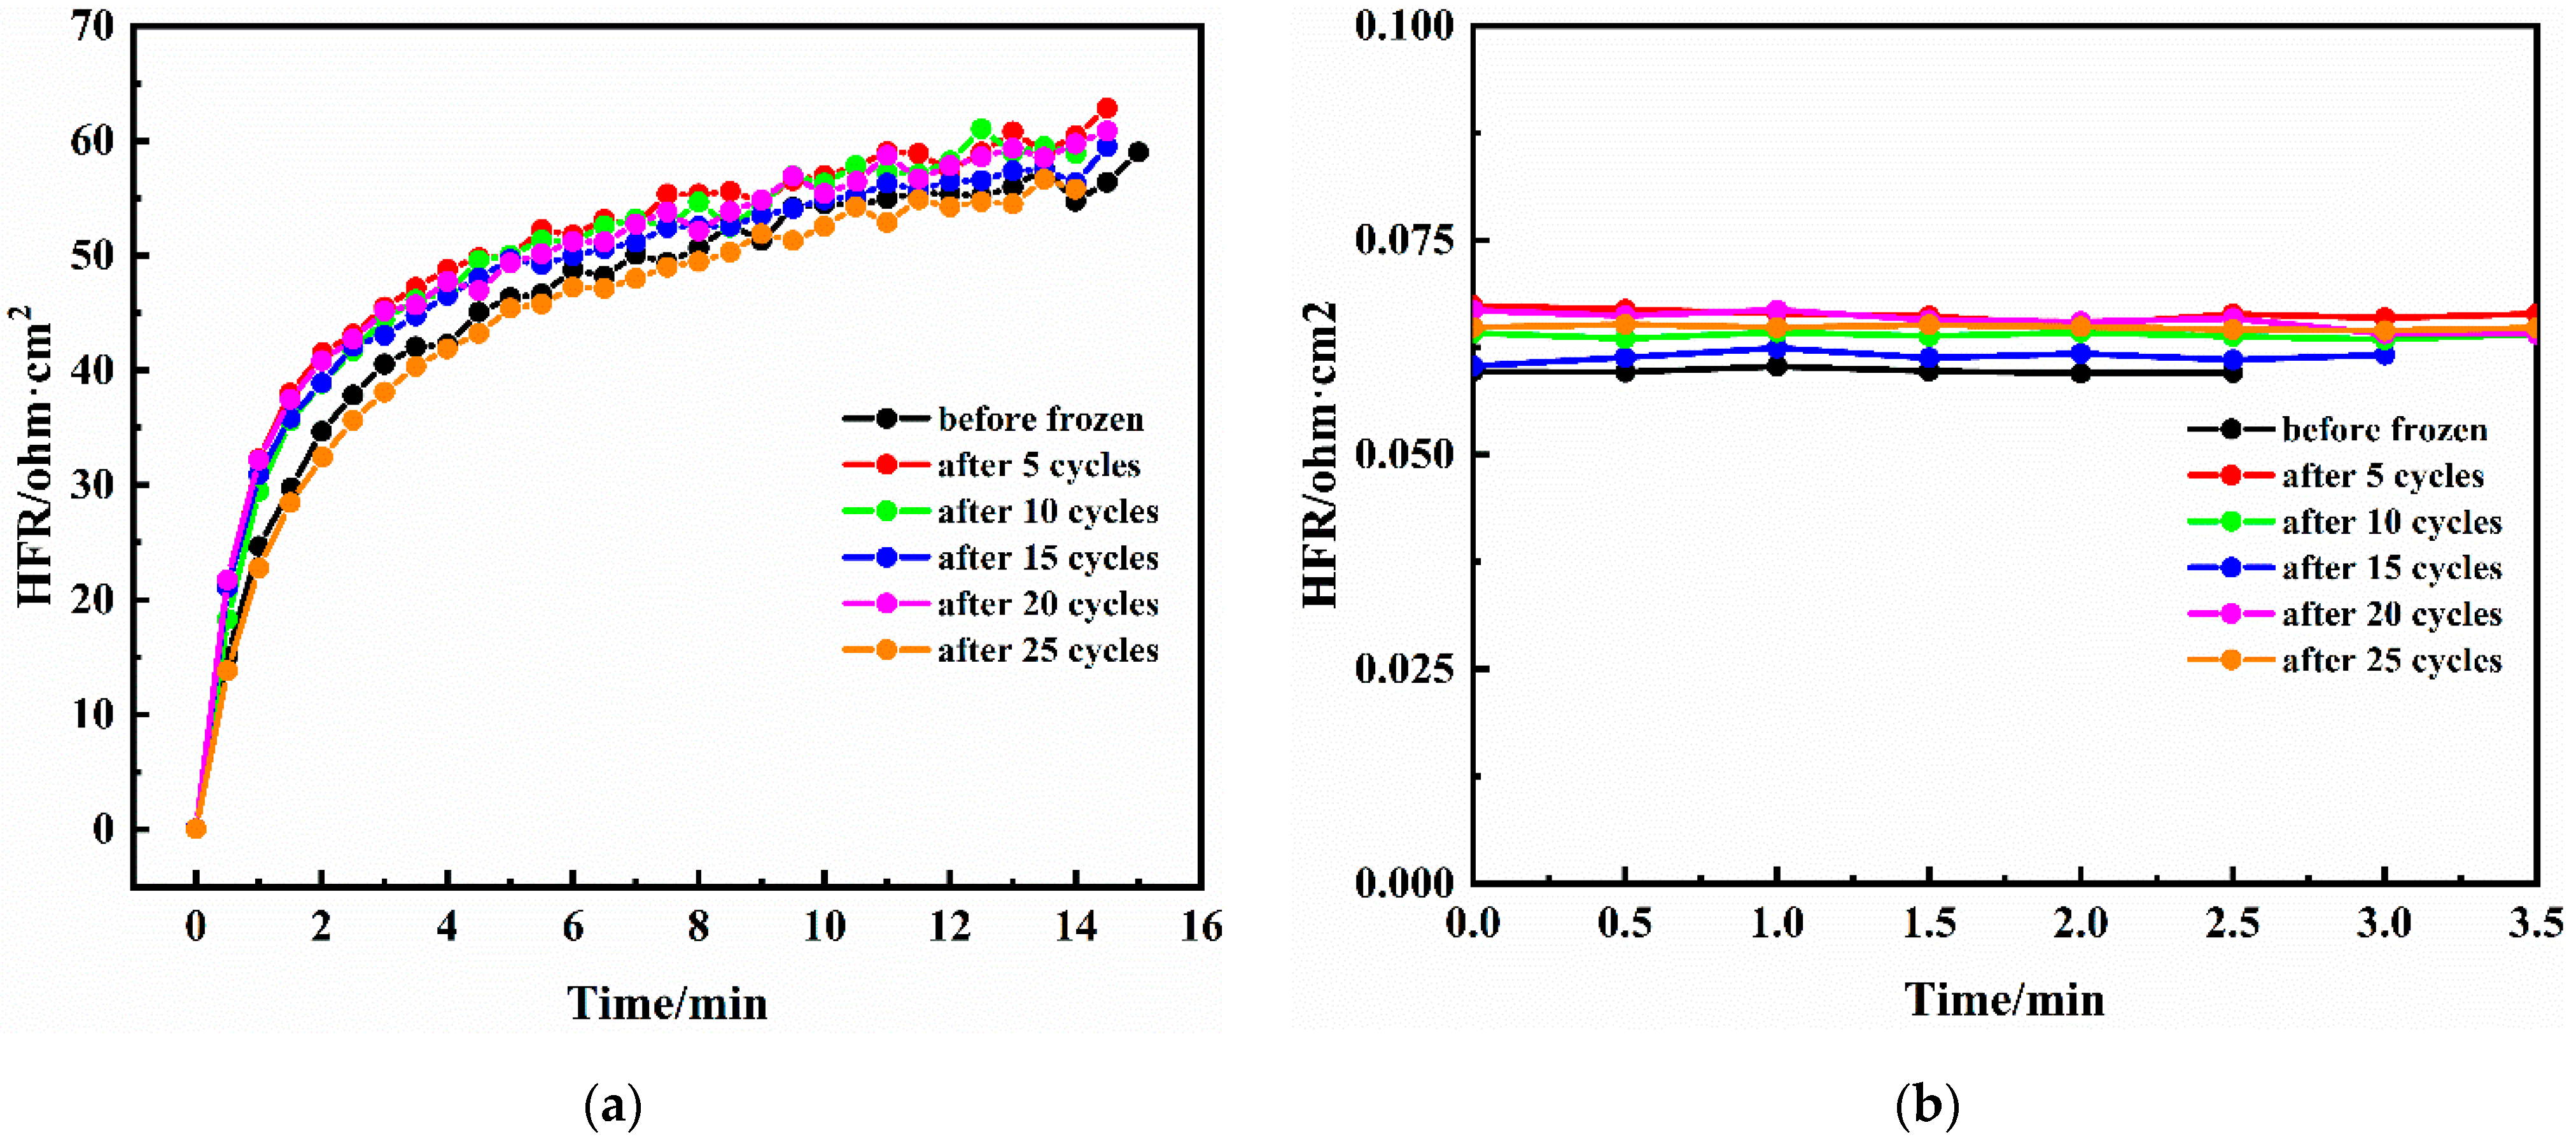
3.2. Dry Purge and HFR Relaxation

Dry nitrogen is commonly used as a purge gas in scientific research. Figure 2 schematically depicts the general characteristics of a dry purge and a relaxation process. It is evident that excellent repeatability is achieved by the fact that purge curves and relaxation curves coincide perfectly. As can be seen from Figure 2a, the purge process can be divided into two distinct periods: a faster HFR rise period, followed by a slower increase period until equilibrium. In the first stage (0–2 min), the HFR rises substantially, which is attributed to the evaporation front quickly penetrating through the GDL and propagating into the CL. Water in the CL and near the membrane surface is removed rapidly. With the penetration of the dry front and the decrease in membrane water content, the evaporation rate decreases gradually, and finally, the membrane water content reaches equilibrium with the RH of the purge gas. The purging characteristics are slightly different from that of Tajiri’s [29] and Sinha’s [27], as the flow rate of purge gas is relatively high, and the measurement interval of HFR is relatively long, so that the slow increase at the beginning of purging is not detected in our experiments.
After the purge was completed, the cell was sealed immediately, and the temperature was maintained at 65 °C, while the HFR gradually decreased to a constant value (as shown in Supplementary Materials, Figure S3) due to water redistribution inside the cell. The final HFR reached a stabilized value, as shown in Figure 2b. The HFR after relaxation is important, as it reflects the true membrane water content, but not the HFR during purging. Therefore, we propose to use the HFR after relaxation as the direct indicator of membrane water content. Hence, by introducing the HFR after relaxation into Equation (7), the exact membrane water content can be calculated. It should be mentioned that membrane water content at saturation is different depending on whether the membrane is immersed in liquid water (varies from λ = 16.8 to 22.0) or exposed to water vapor (λ = 14.0 at 30 °C with saturated water vapor) [22,23]. As for the membrane inside the cell under working conditions, the membrane is exposed to saturated reactant gases and can simultaneously absorb the liquid water produced in the cathode CL. For a conservative estimation, we set the saturated membrane water content under normal operating conditions as 14.0. Therefore, the initial membrane water content of cell-1 without purging is set as 14.0. Five cells with different membrane water content are summarized in Table 2.

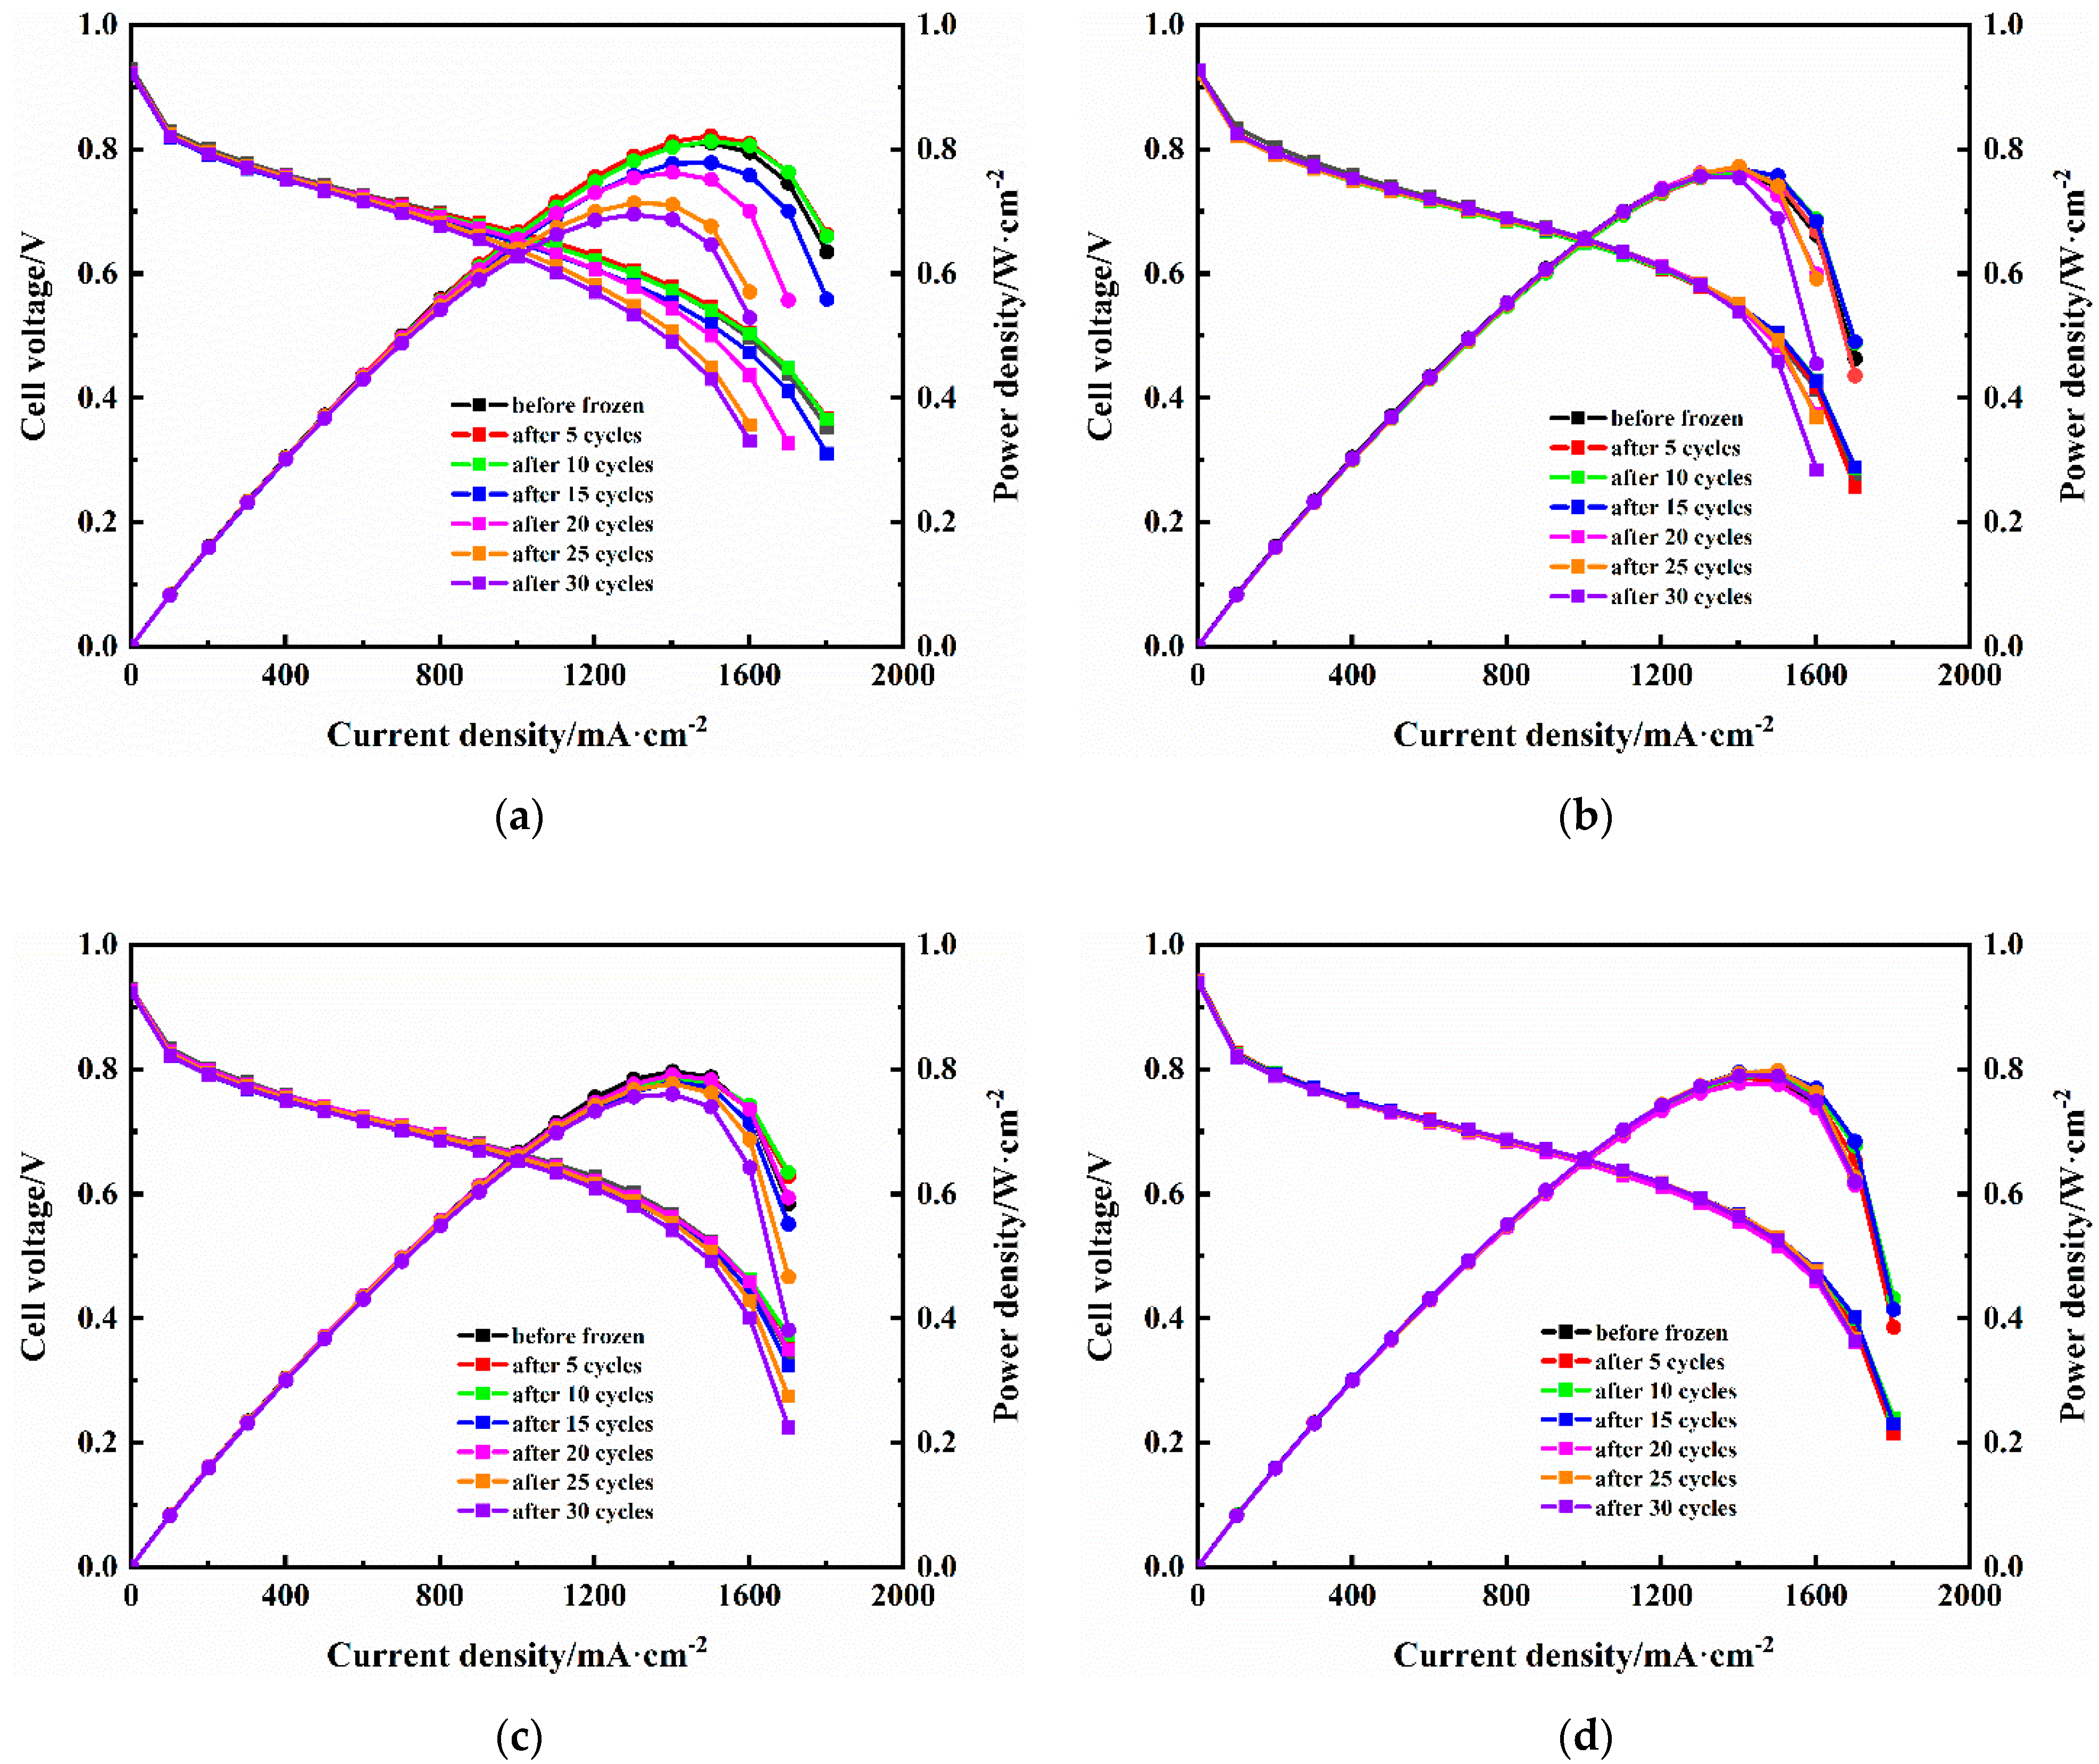
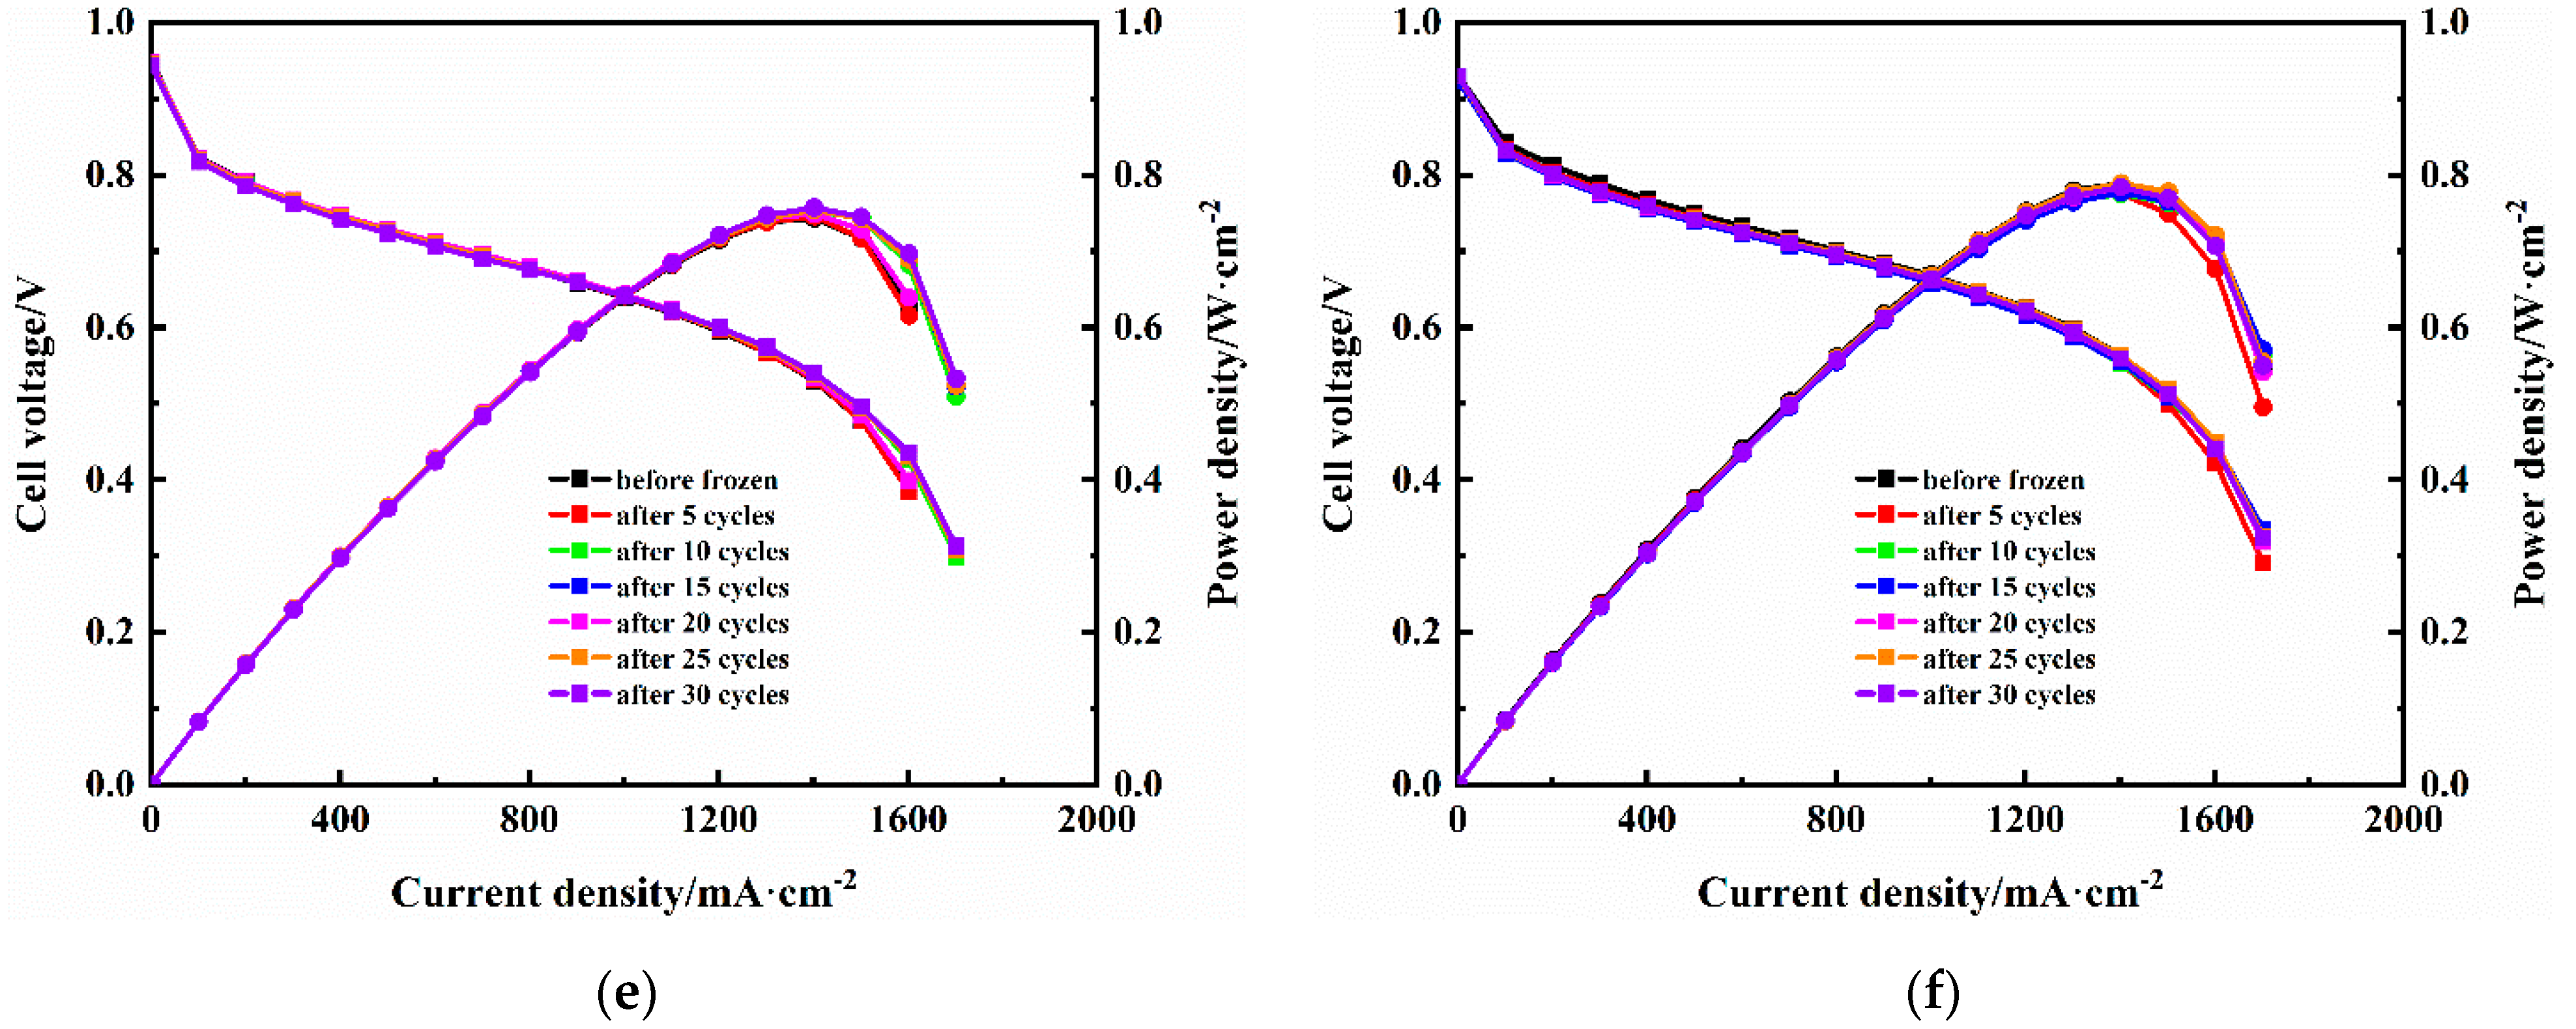
3.3. Fuel Cell Performance after Freeze/Thaw Cycles

To examine the effects of membrane water content on freezing degradation of PEMFC, five cells with different residual membrane water content were cycled from −50 °C to 30 °C for 30 cycles. The cell performance was evaluated by polarization curves and power density curves every five cycles, as plotted in Figure 3. Severe performance decay can be found with the initial membrane content of 14.0 (cell-1) over the entire current density range (from 0 to 1.8 A·cm−2), as shown in Figure 3a. The maximum power density was reduced from 0.810 W·cm−2 to 0.695 W·cm−2 after 30 freeze/thaw cycles. The upper limit current density was reduced from 1.8 A·cm−2 to 1.6 A·cm−2. The open circuit voltage (OCV) of cell-1 displays in Figure 4a also decreased slightly. In the case of cell-2 and cell-3, with the initial membrane water content of 12.0 and 10.7, respectively, performance had no significant change in the current density range below 1.2 A·cm−2. However, irreversible performance decay was detected in the high current density range (higher than 1.2 A·cm−2). The polarization curves fluctuate frequently in high current densities. The upper limit current density was reduced from 1.7 A·cm−2 to 1.6 A·cm−2 for cell-2 (membrane water content of 12.0), and even through the upper limit current density of cell-3 (membrane water content of 10.7) showed no reduction, the output voltage at 1.7 A·cm−2 was reduced from 0.343 V to 0.239 V after 30 freeze/thaw cycles. Cell-6—without freezing—showed no performance change, which demonstrates that the purging treatment does no harm to the cell and the degradation was caused only by freezing.
Further reducing the initial membrane water content to 8.2 (cell-4) and 7.7 (cell-5), as displayed in Figure 3d,e, no performance degradation was observed for cell-4 and cell-5 after 30 cycles. The OCV of cell-4 remained unchanged at 0.94 V, as shown in Figure 4b, which suggests no destruction occurred to the polymer electrolyte membrane. The results of this experiment indicate that a membrane water content of 8.2 is relatively safe for cold storage at −50 °C. Ding et al. [33] believed that the average membrane water content for the optimal purge protocol is 7.8, which is important and should be considered in the cold start strategy design, considering the purge effectiveness and energy consumption. This value is very close to our experimental results, and, to a certain extent, proves the reliability of our experimental results. Furthermore, Jiao et al. [34] presented an empirical correlation to calculate the maximum saturation of non-frozen water based on the experimental work of Thompson, and the limit amount of non-frozen water content at −50 °C is around 4.8, which, in turn, indicates that the maximum amount of freezable water allowed in the membrane at −50 °C is around 3.4. As a result, an effective purge for successful storage at −50 °C requires purging the content of freezable water below 3.4.

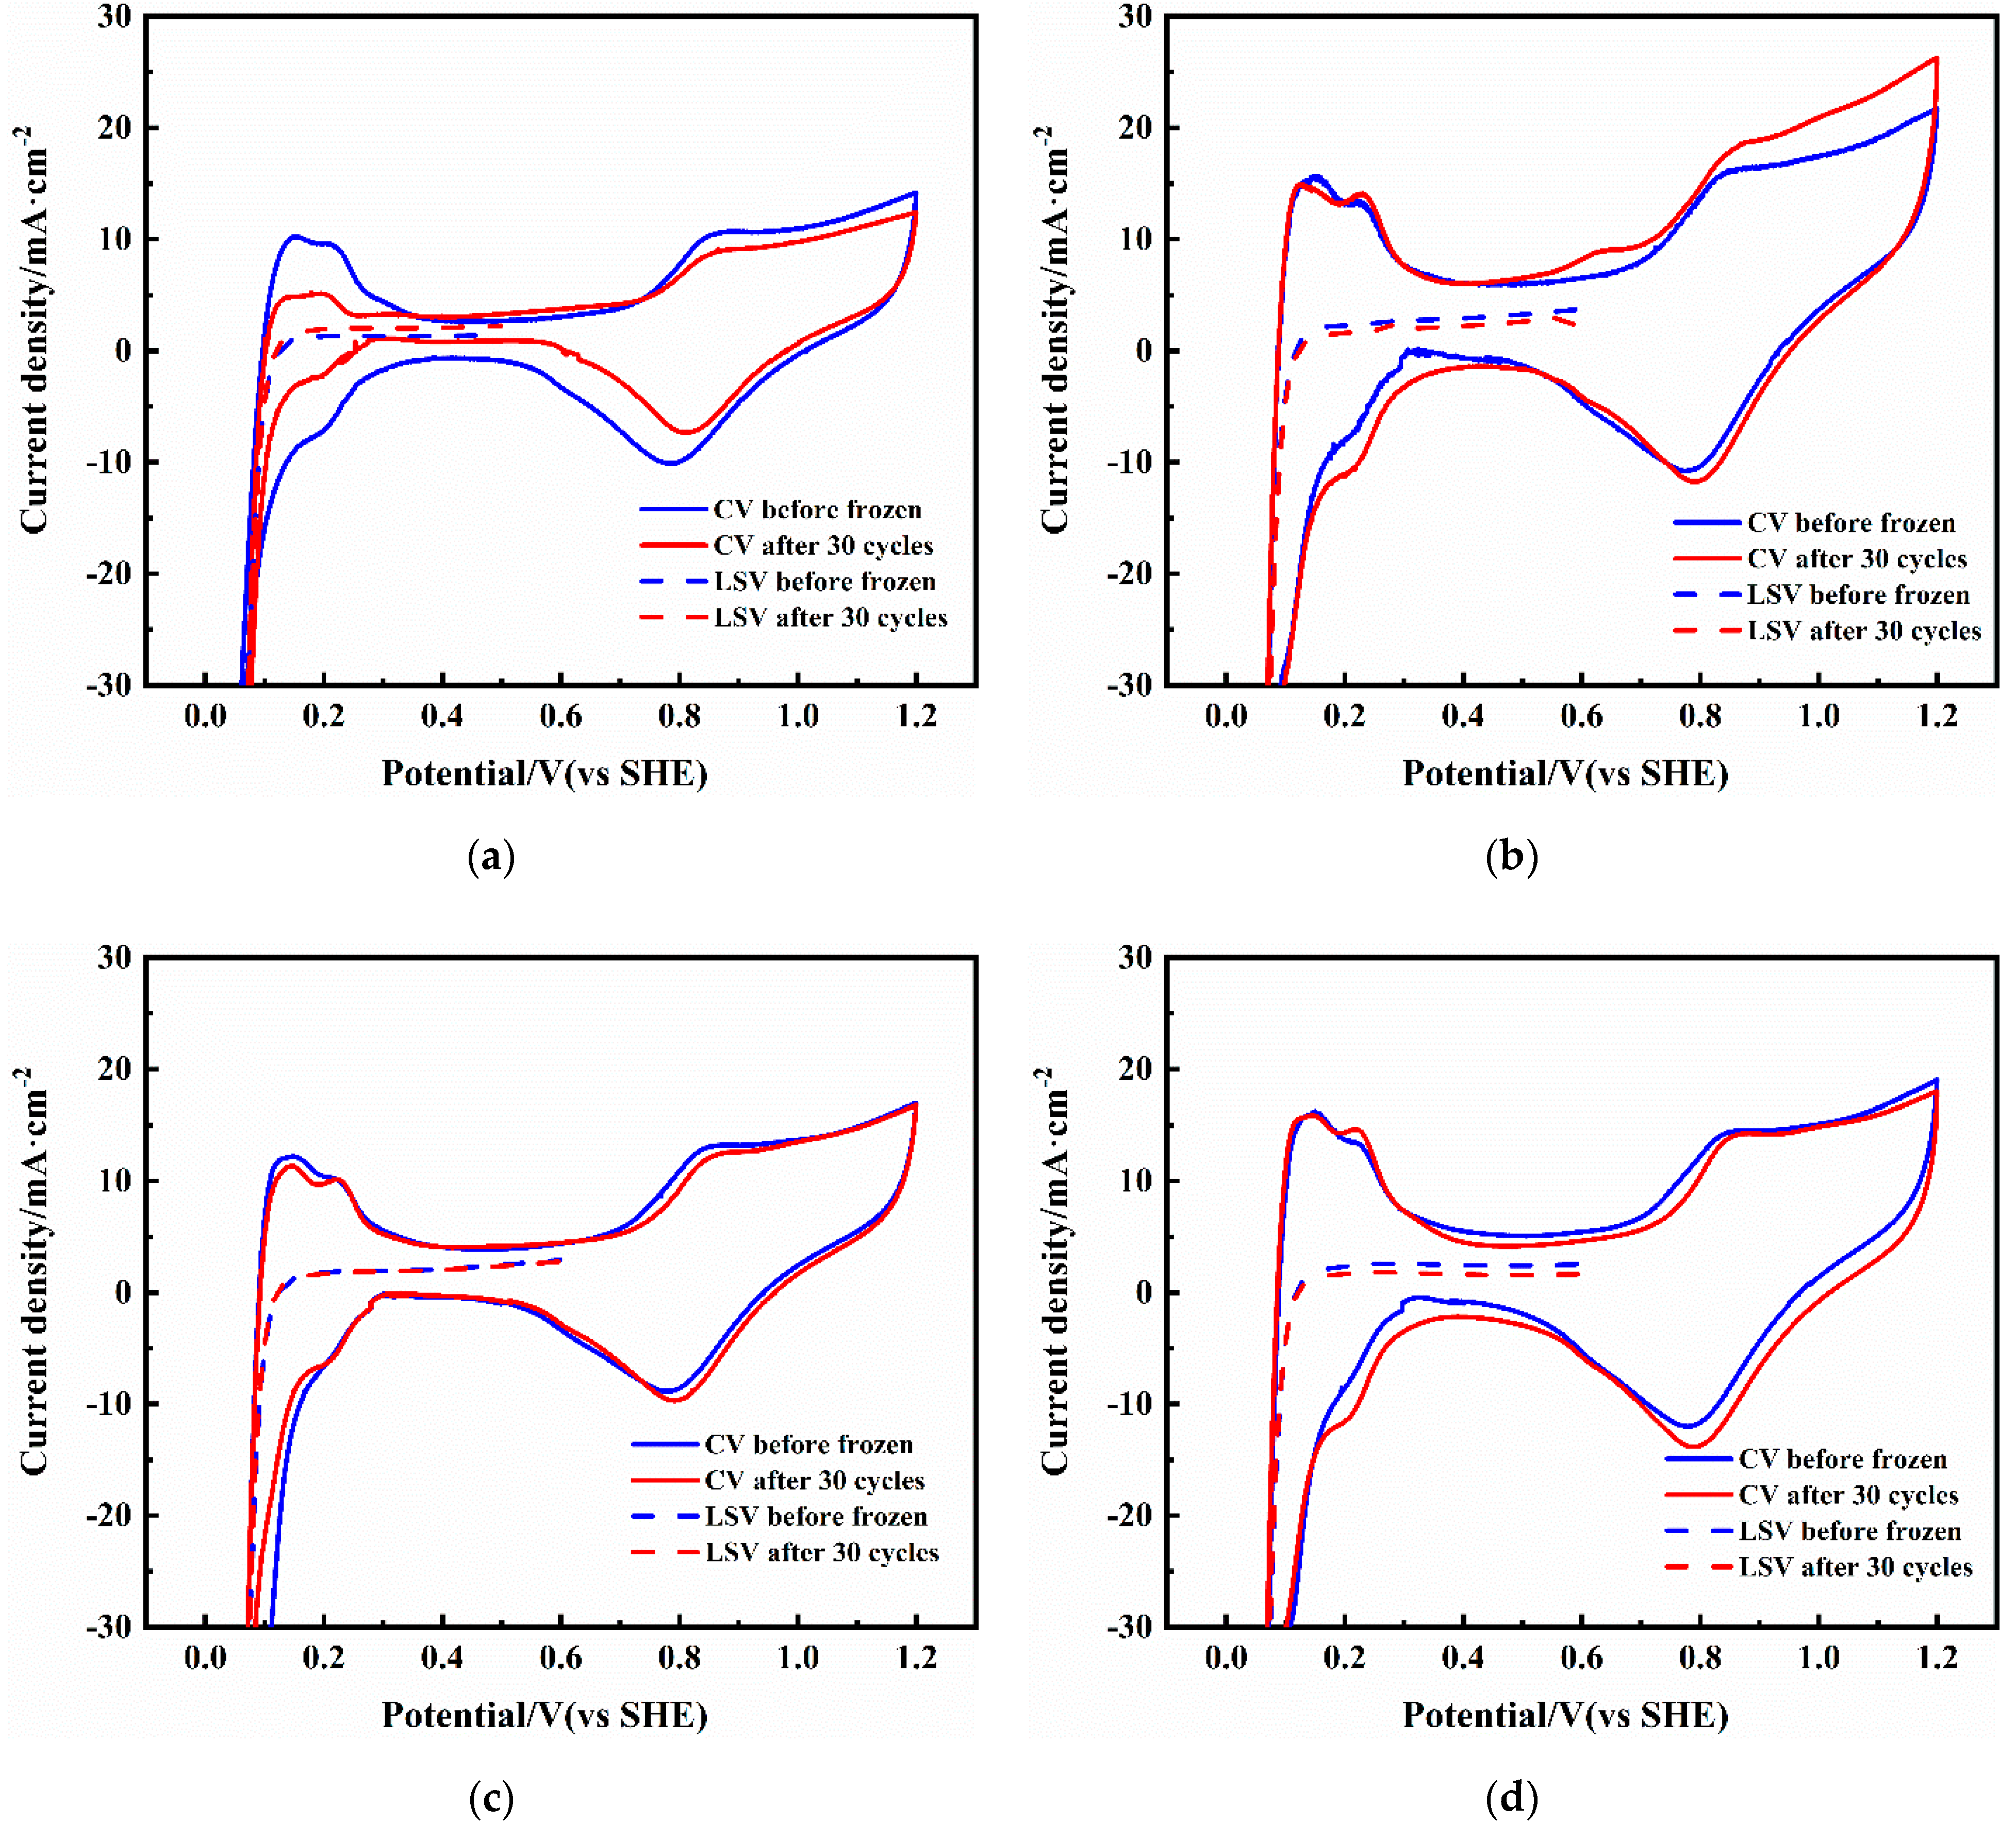
3.4. Electrochemical Active Surface Area and Hydrogen Crossover

Cyclic voltammetry (CV) and linear sweep voltammetry (LSV) measurements were carried out before and after freeze/thaw operations to measure the ECSA of Pt catalysts and hydrogen crossover currents. The ECSA of Pt catalysts is one of the most important properties affecting the overall performance of the cell, which is estimated based on the charge of hydrogen desorption peak in the CV curves. The hydrogen desorption peak area and the ECSA are calculated from the data in Figure 5 and summarized in Table 3. The ECSA of cell-1 (membrane water content of 14.0) after 30 freeze/thaw cycles decreased from 26.09 m2·g−1 to 5.10 m2·g−1, with a reduction rate of −0.7 m2·g−1·cycle−1. The severe reduction in ECSA is one of the main reasons for the polarization degradation in Figure 3a. A similar conclusion was made by Luo et al. [26], who attributed the performance degradation in low current density regions to the reduction in ECSA. For the cells with an initial membrane water content of 12.0 (cell-2) and 10.7 (cell-3), the ECSA showed a smaller reduction, mainly due to the fact that the remaining water content in the catalytic layer was low after purging, and it did not cause catastrophic damage within a limited number of cycles. At the same time, it can also be seen from the polarization curve in Figure 3 that the performance degradation mainly occurs in the high current density region, which is in the mass transfer polarization region. Thus, the slight ECSA degradation for cell-2 and cell-3 is reasonable. Cell-4, with the initial membrane water content of 8.2, did not show any reduction in ECSA: the ECSA of cell-4 increased from 38.76 m2·g-1 to 40.49 m2·g−1 and the increment is within the range of the errors permitted [25], which indicates that lowering the membrane water content to 8.2 (cell-4) is helpful in eliminating freezing damage to the CL. The schematic diagram shown in Figure 6 is to further explain the relationship between membrane water content and performance degradation. For cell-1—without purging—liquid water almost fills the pores in the catalyst layer, and the membrane is saturated, as shown in Figure 6a. The structure of the catalyst layer was destroyed after several freeze/thaw cycles with repeated ice formation and melting. Due to repeated volume change during freeze/thaw cycles, Pt particles detachment and aggregation may occur, which are the main reasons for the ECSA reduction. When a gas purge is applied to remove liquid water from the cell, gas will remove water directly from the membrane, while the overall saturation in the catalyst layer remains high when purging with high flow rate [35]. Therefore, when the membrane water content is within the range of 8.2 to 14.0, continuous liquid water still remains in the catalyst layer but with lower saturation, as shown in Figure 6b, which eventually results in relative slight degradation after repeated freeze/thaw cycles. As described in Figure 6c, when further reducing the membrane water content to 8.2, there exists only scattered moisture trapped in pores and the ionomer of the catalyst layer. Given the low moisture content in the catalyst layer, the volume expansion caused by icing can be borne by its inherent pores, thus the catalyst layer will not be damaged and the ECSA will be preserved.
The hydrogen crossover current density is also displayed in Figure 5a–d. The hydrogen crossover current density for cell-1 (membrane water content of 14.0) increases slightly from 1.33 mA·cm−2 to 2.06 mA·cm−2. The results imply that minor changes in the polymer electrolyte membrane have occurred due to repeated freeze/thaw cycles, leading to the increase in hydrogen crossover. However, the increase is not significant. The slight increase in hydrogen crossover also correlates well with the reduction in OCV in Figure 4a. The hydrogen crossover current does not increase for the other cells, which indicates that liquid water in the interface of the membrane and CL is removed by dry purge, and the structure of the membrane is well preserved.

3.5. Electrochemical Impedance Spectra

In order to investigate the degradation mechanism of the cell experienced freeze/thaw cycles, electrochemical impedance is measured to evaluate the resistance characteristics and transport features. The Nyquist plot based on the ac impedance is measured at 1 A·cm−2, as is shown in Figure 7. Generally, the Nyquist plot with one single semicircle, as displayed in Figure 7, includes two characteristic regions: the highest frequency intercept,   R Ω , which mainly consists of membrane resistance and contact resistance, and the high frequency arc, which is responsible for the charge transfer resistance ( R c t ) and a double layer capacitance in the cathode catalyst layer. The absence of the low frequency arc indicates that the mass transport limitation is not a controlling step at the given current density. Therefore, a simple equivalent circuit consists of R c t connected with a constant phase element (CPE) in parallel, and R Ω in series [36] is applied to fit the Nyquist curves, as depicted in Figure 7a. The fitting data are listed in Table 4.
From Table 4, R Ω of cell-1 (membrane water content of 14.0) increases from 52.35 mΩ·cm2 to 77.30 mΩ·cm2 at 1 A·cm−2. This may be due to the freezing of the water in the interfacial gap and the deterioration of the interfacial coupling characteristics, resulting in the increase in contact resistance between the GDL and CL. The charge transfer resistance nearly doubled at 1 A·cm2 for cell-1. This can be attributed to the reduction in ECSA and the change in microstructure of catalyst layer. The volume expansion caused by freezing is beyond endurance in the pores of the catalyst layer, thus the catalyst particles are squeezed, resulting in the detachment and aggravation of Pt particles. Moreover, since ionomer is usually used as binder and proton conductor in the catalyst layer, repeated icing/melting may change the structure and shape of ionomer, which will definitely worsen the charge transfer process. Additionally, Hou [25] pointed out that charge transfer resistance is greatly affected by the residual water content, and the repeated volume expansion inside the CL changed the pore structure of the CL, making the CL vulnerable to flooding. Another point worthy of attention is that the degradation trend of cell-2 and cell-3 is indistinguishable in the EIS data under 1000 mA·cm2, which is attributed to the fact that the cell showed significant degradation only in the high current density region (higher than 1200 mA·cm2, as shown in Figure 3) and the electrochemical reaction can be maintained at the same speed at 1000 mA·cm−2. Moreover, the charge transfer resistance for cell-3 and cell-4 even reduced at 1 A·cm−2. Two reasons are considered. First, the ECSA of cell-4 is increased and, according to Ref. [37], the freezing of residual water in the CL more or less changes the pore structure of the agglomerates where even the water content is relatively low, exposing more active sites and connecting proton transport channels. Second, since the EIS measurements are conducted after a long period of activation (5 h), more residual water increases the charge transfer resistance in the first test. In summary, the degradation of cell performance for cell-1 is mainly ascribed to the increase in charge transfer resistance, and purging the cell membrane water content to 8.2 is effective in eliminating freezing damage after 30 freeze/thaw cycles.

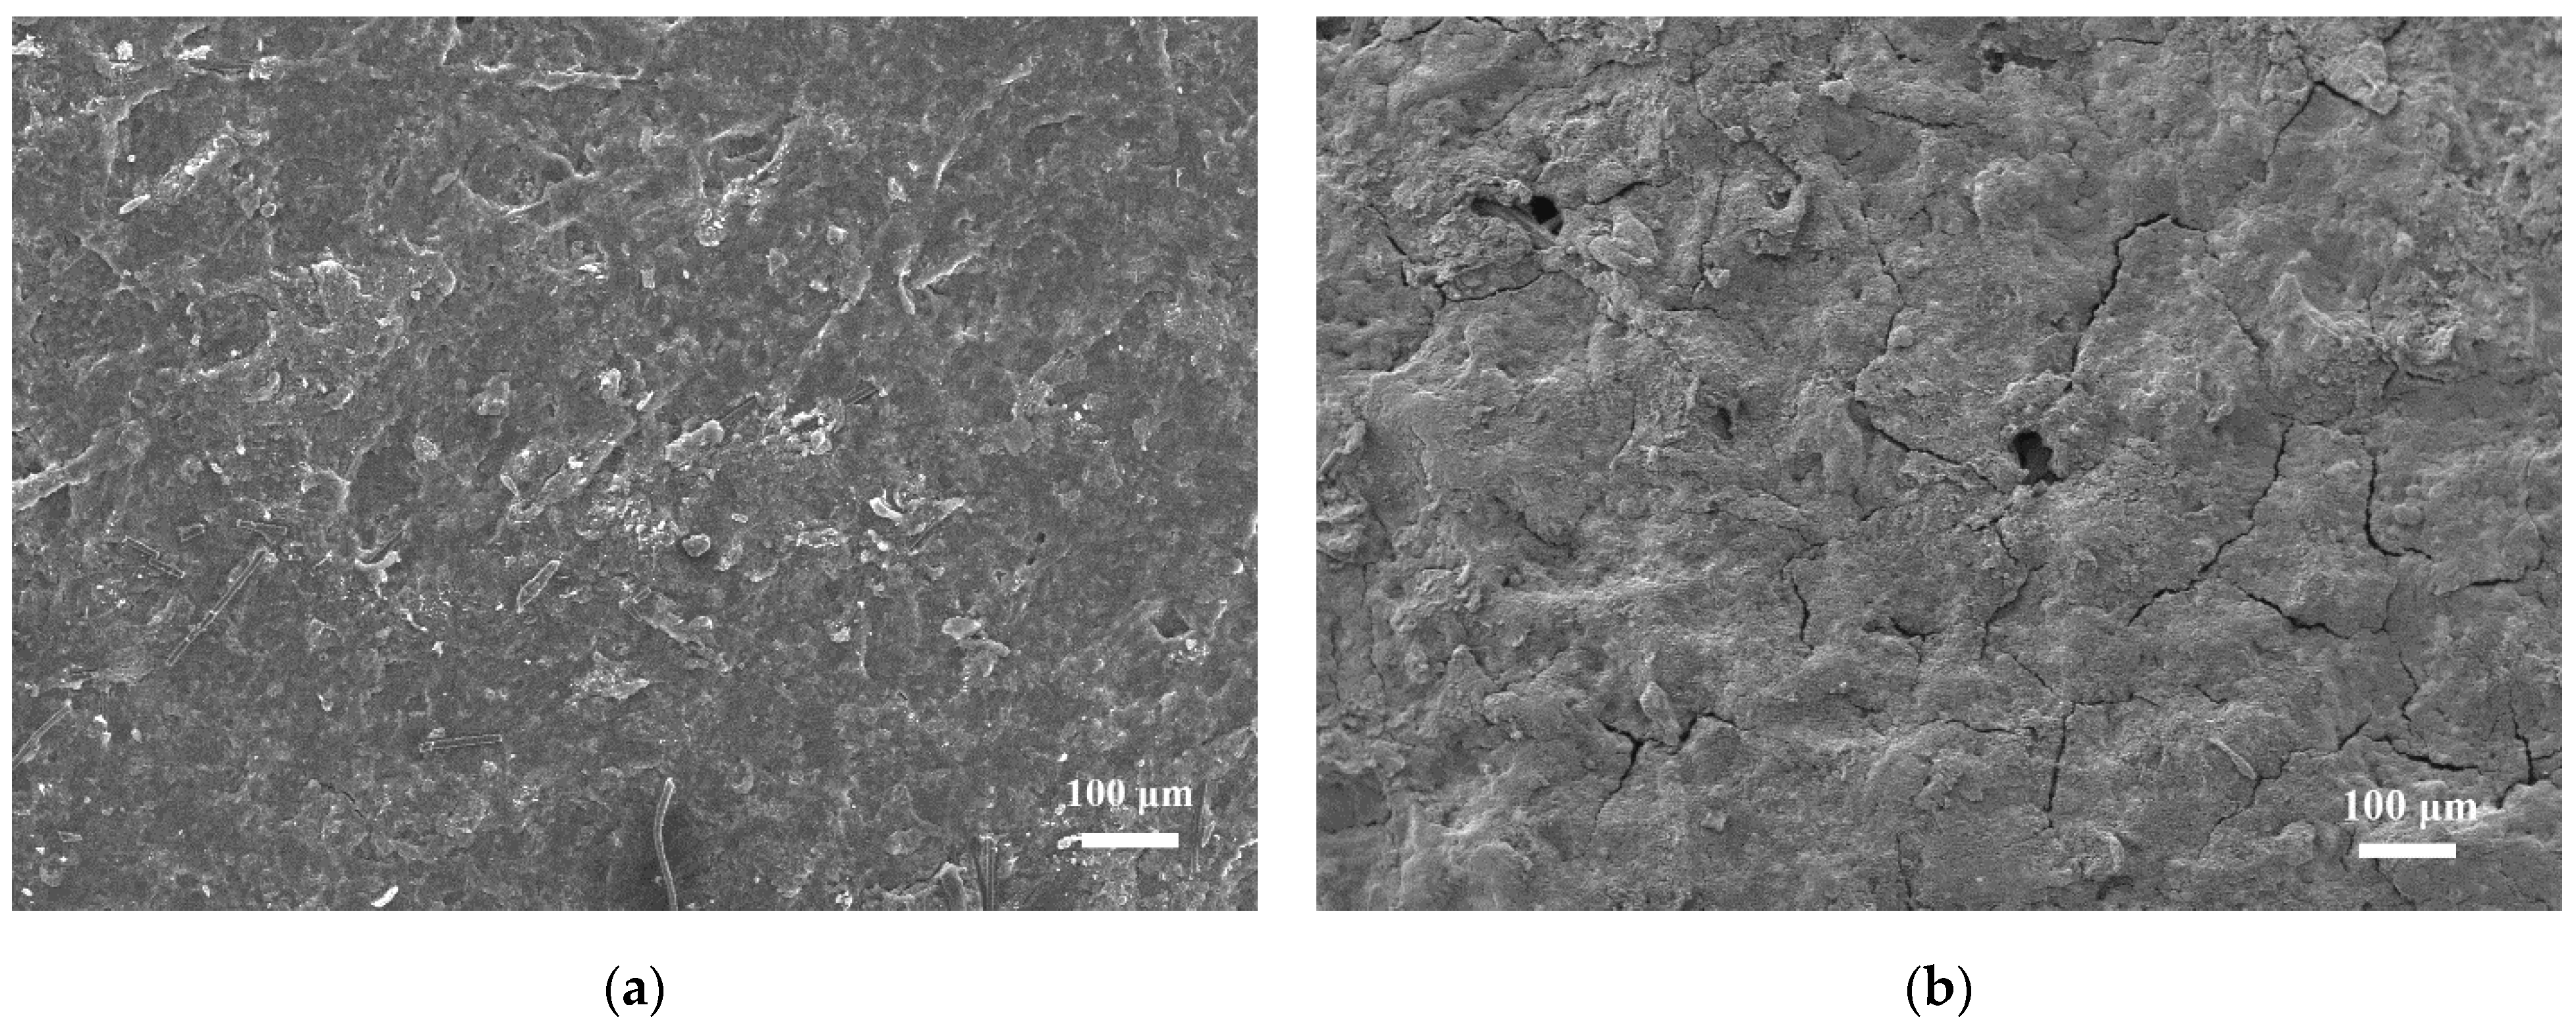
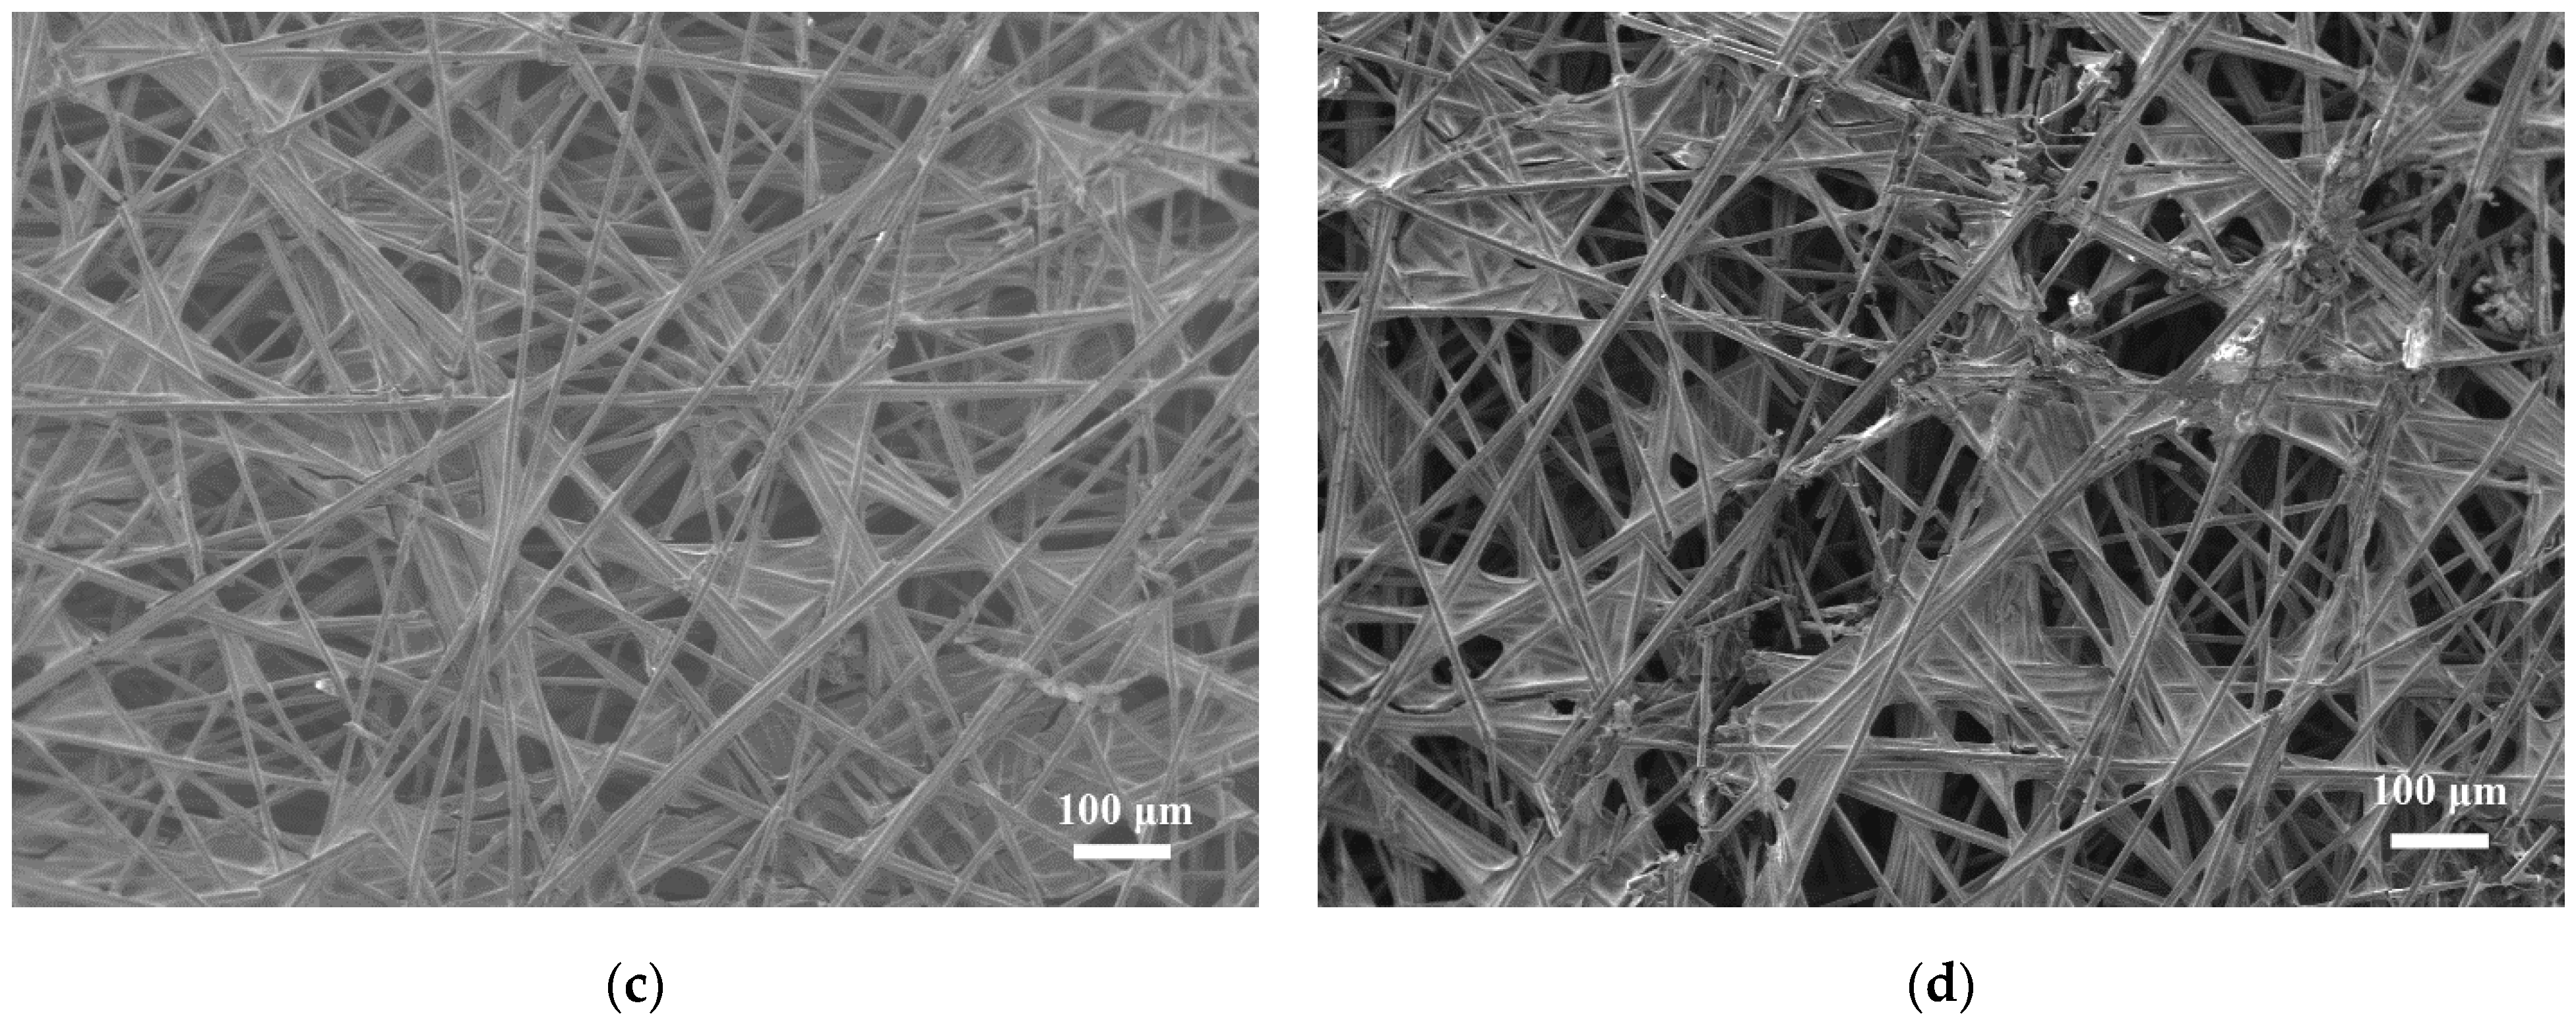
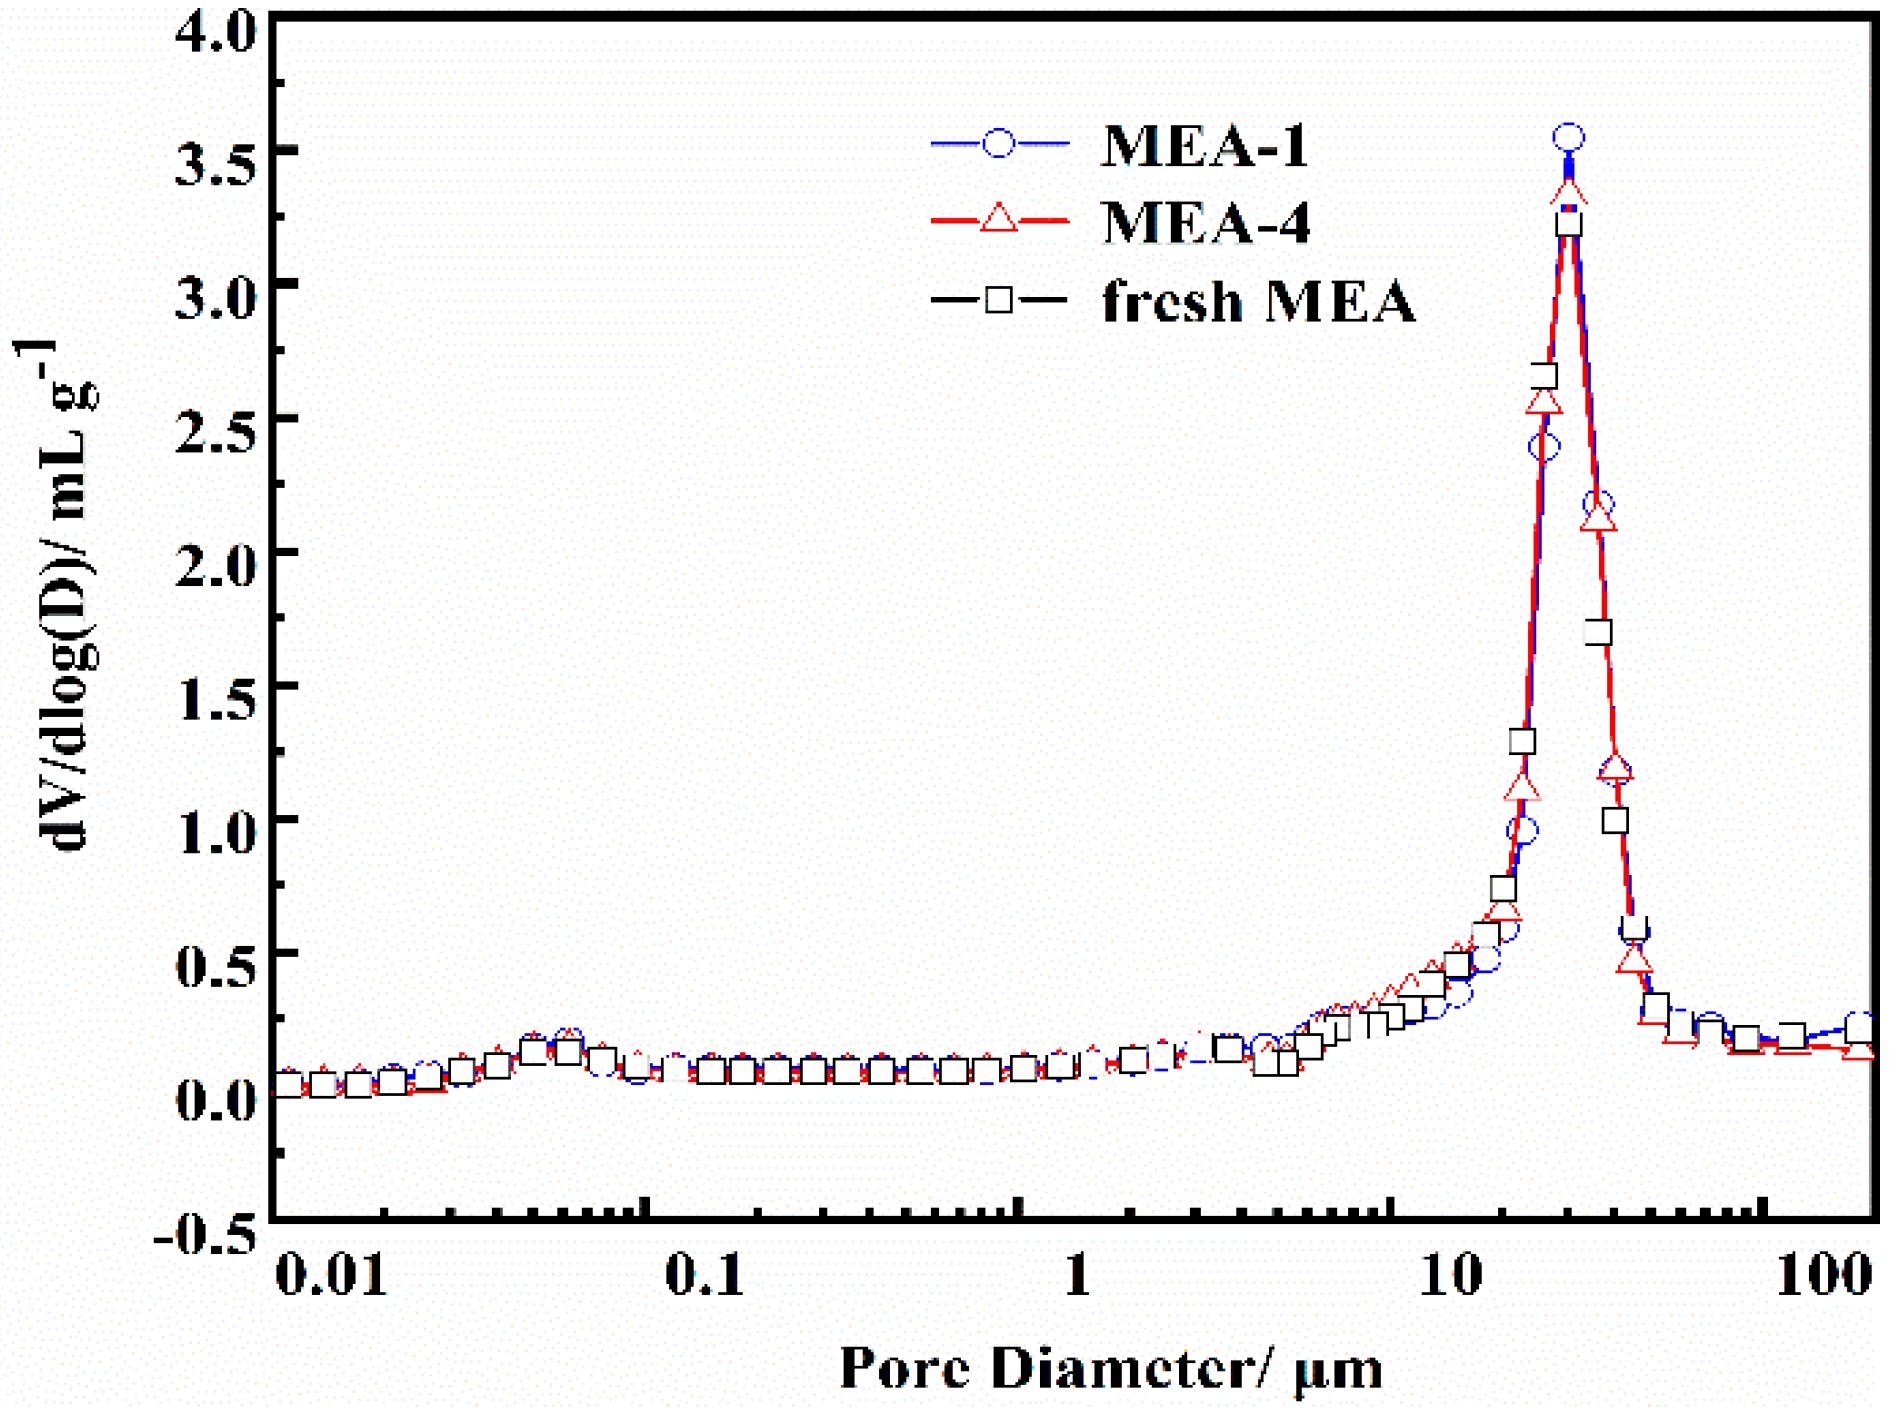
3.6. Morphology and Porosity

SEM and mercury porosimeter were applied as postmortem analyses to diagnose the morphology and pore structure of the cell after freezing. Devastating damage was detected after F–T cycles, as shown in Figure 8. In the case of cell-1, as displayed in Figure 8b,d, extensive cracks at the surface of MPL and massive of fracture of carbon fibers at the surface of the GDL are observed, while small cracks appear on the CL surface, as depicted in Figure 9b. It is believed that the formation of cracks is attributed to the volume expansion due to water freezing. Figure 9d indicates that there is no delamination between the CL and membrane for cell-1 even though no purge treatment is applied. As for the case of cell-4, no physical damage is found on the surfaces of the CL, MPL, and GDL, which also demonstrates that the freezing damage is eliminated by lowering the membrane water content to 8.2.
Pore size distribution was obtained using a mercury intrusion porosimeter. The pore size distribution is plotted in Figure 10. The results indicate that there is no distinct difference between fresh MEA, MEA−1 and MEA−4. The pore volume in this measurement is the sum of pores in the GDL, MPL, CL, membrane, and the interfacial gaps. Therefore, pore structure change may be masked. However, existing studies [6,12,13] have shown that freezing can change the porous structure of the membrane electrode, resulting in a decrease in the proportion of micropores and an increase in the proportion of macropores. In addition, freeze/thaw cycles could reduce the hydrophobicity of the microporous layer and the carbon-paper supporting layer. These damages caused by freezing will definitely make the fuel cell more prone to flooding under high density conditions, which justifies our experimental results. Unfortunately, it is impossible to completely separate the electrode layer by layer from a complete cell, especially a cell that has been hot-pressed and tested, which makes it impossible for us to measure the hydrophobicity and pore structure change in the catalyst layer, microporous layer, and GDL separately. Therefore, further research should pay more attention to the individual porosity and hydrophobicity changes of the porous structure.

4. Conclusions

The effect of membrane water content on PEMFC freeze/thaw durability from −50 °C to 30 °C was investigated. To accurately calculate the membrane water content, an equilibrium purge was performed, and it was found that the non-membrane resistance part of the measure HFR was constant in the range of membrane water content of 2.98 to 14.0. Then, a dry purge was applied to remove liquid water inside the cell. The HFR after relaxation was used as the direct indicator of the membrane water content, as the HFR after relaxation truly reflects the equilibrium state of water distribution in the membrane. The electrochemical performance was tested before and after freeze/thaw cycles. Cell-1 with the highest initial membrane water content of 14.0 was found to have severe performance degradation over the entire current density range. Cell-2 (membrane water content of 12.0) and cell-3 (membrane water content of 10.7) showed performance decay only in the high current density region. Electrochemical performance tests revealed that ECSA reduction, contact resistance, and charge transfer resistance increase were the main reasons for the performance degradation. Morphology characterization also revealed that cracks and deformation of the cell components occurred due to repeated freeze/thaw cycles. Cell-4 and cell-5 with the initial membrane water content of 8.2 and 7.7, respectively, showed no performance degradation after 30 freeze/thaw cycles. As a result, the critical membrane water content, a threshold beyond which freezing damage occurs, for successful cold storage at −50 °C, is 8.2.

Supplementary Materials

The following are available online at https://www.mdpi.com/article/10.3390/en14154520/s1, Figure S1: Time evolution of HFR during equilibrium purge. Figure S2: Time evolution of cell temperature during cooling process. Figure S3: The characteristic curve of HFR during dry purge and relaxation. Figure S4: The HFR values after equilibrium purge with 100% humidified Nitrogen. Figure S5: The HFR of cell-2: (a) during dry purge and (b) after relaxation. Figure S6: The HFR of cell-3: (a) during dry purge and (b) after relaxation. Figure S7: The HFR of cell-5: (a) during dry purge and (b) after relaxation.

Author Contributions

Conceptualization, X.Y.; methodology, X.Y.; software, X.Y.; validation, X.Y. and J.S.; formal analysis, X.Y. and S.S.; investigation, X.Y.; resources, X.Y. and G.J.; data curation, X.Y.; writing—original draft preparation, X.Y., H.Y., and S.S.; writing—review and editing, X.Y., S.S., and J.S.; visualization, X.Y.; supervision, Z.S. and S.S.; project administration, Z.S., S.S., F.D., and Y.Y.; funding acquisition, Z.S., S.S., F.D., and Y.Y. All authors have read and agreed to the published version of the manuscript.

Funding

This research was supported by the National Key Research and Development Program of China (Grant Nos. 2018YFE0105200) and the Science and Technology Support Project of State Grid Corporation of China (Grant Nos. SGLNDK00KJJS1900037).

Institutional Review Board Statement

Not applicable.

Informed Consent Statement

Not applicable.

Data Availability Statement

Not applicable.

Conflicts of Interest

The authors declare no conflict of interest.

References

  1. Debe, M.K. Electrocatalyst approaches and challenges for automotive fuel cells. Nature 2012, 486, 43–51. [Google Scholar] [CrossRef] [PubMed]
  2. Wang, Y.; Diza, D.F.R.; Chen, K.S.; Wang, Z.; Adroher, X.C. Materials, technological status, and fundamentals of PEM fuel cells—A review. Mater. Today 2019, 32, 178–203. [Google Scholar] [CrossRef]
  3. Wang, Z.; Chang, H.; Shu, S.; Wang, Y.; Tang, H. A Review on Cold Start of Proton Exchange Membrane Fuel Cells. Energies 2014, 7, 3179–3203. [Google Scholar]
  4. Luo, Y.; Jiao, K. Cold start of proton exchange membrane fuel cell. Prog. Energy Combust. Sci. 2018, 64, 29–61. [Google Scholar] [CrossRef]
  5. Alaswad, A.; Omran, A.; Sodre, J.R.; Wilberforce, T.; Pignatelli, G.; Dassisti, M.; Baroutaji, A.; Olabi, A.G. Technical and Commercial Challenges of Proton-Exchange Membrane (PEM) Fuel Cells. Energies 2021, 14, 144. [Google Scholar] [CrossRef]
  6. Ozdan, A.; Shahgldi, S.; Li, X.G.; Hamdullahpur, F. The impact of ionomer type on the morphological and microstructure degradations of proton exchange membrane fuel cell electrodes under freeze-thaw cycles. Appl. Energy 2019, 238, 1048–1059. [Google Scholar] [CrossRef]
  7. Lee, S.Y.; Kim, H.J.; Cho, E.A.; Lee, K.S.; Lim, T.H.; Hwang, I.C.; Jiang, J.H. Performance degradation and microstructure changes in freeze–thaw cycling for PEMFC MEAs with various initial microstructures. Int. J. Hydrogen Energy 2010, 35, 12888–12896. [Google Scholar] [CrossRef]
  8. Sabawa, J.P.; Bandarenka, A.S. Investigation of degradation mechanisms in PEM fuel cells caused by low-temperature cycles. Int. J. Hydrogen Energy 2021, 46, 15951–15964. [Google Scholar] [CrossRef]
  9. Lim, S.J.; Park, G.G.; Park, J.S.; Sohn, Y.J.; Yim, S.D.; Yang, T.H.; Hong, B.K.; Kim, C.S. Investigation of freeze/thaw durability in polymer electrolyte fuel cells. Int. J. Hydrogen Energy 2010, 35, 13111–13117. [Google Scholar] [CrossRef]
  10. Kim, S.; Mench, M.M. Physical Degradation of Membrane Electrode Assemblies undergoing Freeze/Thaw Cycling: Micro-Structure Effects. J. Power Sources 2007, 174, 206–220. [Google Scholar] [CrossRef]
  11. Kim, S.; Ahn, B.K.; Mench, M.M. Physical degradation of membrane electrode assemblies undergoing freeze/thaw cycling: Diffusion media effects. J. Power Sources 2008, 179, 140–146. [Google Scholar] [CrossRef]
  12. Ozdan, A.; Shahgldi, S.; Zhao, J.; Li, X.G.; Hamdullahpur, F. Degradations in porous components of a proton exchange membrane fuel cell under freeze-thaw cycles: Morphology and microstructure effects. Int. J. Hydrogen Energy 2020, 45, 3618–3631. [Google Scholar] [CrossRef]
  13. Ozdan, A.; Shahgldi, S.; Li, X.G.; Hamdullahpur, F. Degradations in the surface wettability and gas permeability characteristics of proton exchange membrane fuel cell electrodes under freeze-thaw cycles: Effects of ionomer type. Int. J. Hydrogen Energy 2020, 45, 29892–29903. [Google Scholar] [CrossRef]
  14. Song, K.Y.; Kim, H.T. Effect of air purging and dry operation on durability of PEMFC under freeze/thaw cycles. Int. J. Hydrogenen Energy 2011, 36, 12417–12426. [Google Scholar] [CrossRef]
  15. Pinton, E.; Fourneron, Y.; Rosini, S.; Antoni, L. Experimental and theoretical investigations on a proton exchange membrane fuel cell starting up at subzero temperatures. J. Power Sources 2009, 186, 80–88. [Google Scholar] [CrossRef]
  16. Sabawa, J.P.; Bandarenka, A.S. Degradation Mechanisms in Polymer Electrolyte Membrane Fuel Cells Caused by Freeze-Cycles: Investigation Using Electrochemical Impedance Spectroscopy. Electrochim. Acta 2019, 311, 21–29. [Google Scholar] [CrossRef]
  17. Hou, S.; Jiao, K.; Park, J.W. On the water transport behavior and phase transition mechanisms in cold start operation of PEM fuel cell. Appl. Energy 2019, 233–234, 776–788. [Google Scholar]
  18. Luo, Y.; Guo, Q.; Du, Q.; Yin, Y.; Jiao, K. Analysis of cold start processes in proton exchange membrane fuel cell stacks. J. Power Sources 2013, 224, 99–114. [Google Scholar] [CrossRef]
  19. Jiao, K.; Alaefour, I.E.; Karimi, G.; Li, X. Cold start characteristics of proton exchange membrane fuel cells. Int. J. Hydrogen Energy 2011, 36, 11832–11845. [Google Scholar] [CrossRef]
  20. Yao, L.; Ma, F.; Peng, J.; Zhang, J.; Zhang, Y.; Shi, J. Analysis of the Failure Modes in the Polymer Electrolyte Fuel Cell Cold-Start Process—Anode Dehydration or Cathode Pore Blockage. Energies 2020, 13, 256. [Google Scholar] [CrossRef]
  21. Jiao, K.; Li, X. Water transport in polymer electrolyte membrane fuel cells. Prog. Energy Combust. Sci. 2011, 37, 221–291. [Google Scholar] [CrossRef]
  22. Hinatsu, J.T.; Mizuhata, M.; Takenaka, H. Water uptake of perfluorosulfonic acid membranes from liquid water and water vapor. J. Electrochem. Soc. 1994, 141, 1493–1498. [Google Scholar] [CrossRef]
  23. Springer, T.E.; Zawodzinski, T.A.; Gottesfeld, S. Polymer Electrolyte Fuel Cell Model. J. Electrochem. Soc. 1991, 138, 2334–2342. [Google Scholar] [CrossRef]
  24. Tajiri, K.; Tabuchi, Y.; Kagami, F.; Takahashi, S.; Yoshizawa, K.; Wang, C.-Y. Effects of operating and design parameters on PEFC cold start. J. Power Sources 2007, 165, 279–286. [Google Scholar] [CrossRef]
  25. Hou, J.; Yu, H.; Zhang, S.; Sun, S.; Wang, H.; Yi, B.; Ming, P. Analysis of PEMFC freeze degradation at −20 °C after gas purging. J. Power Sources 2006, 162, 513–520. [Google Scholar] [CrossRef]
  26. Luo, M.; Huang, C.; Liu, W.; Luo, Z.; Pan, M. Degradation behaviors of polymer electrolyte membrane fuel cell under freeze/thaw cycles. Int. J. Hydrogen Energy 2010, 35, 2986–2993. [Google Scholar] [CrossRef]
  27. Sinha, P.K.; Wang, C.-Y. Two-phase modeling of gas purge in a polymer electrolyte fuel cell. J. Power Sources 2008, 183, 609–618. [Google Scholar] [CrossRef]
  28. Ge, S.; Wang, C.-Y. Characteristics of subzero startup and water/ice formation on the catalyst layer in a polymer electrolyte fuel cell. Electrochim. Acta 2007, 52, 4825–4835. [Google Scholar] [CrossRef]
  29. Tajiri, K.; Wang, C.-Y.; Tabuchi, Y. Water removal from a PEFC during gas purge. Electrochim. Acta 2008, 53, 6337–6343. [Google Scholar] [CrossRef]
  30. Lee, S.-Y.; Kim, S.-U.; Kim, H.-J.; Jang, J.H.; Oh, I.-H.; Cho, E.A.; Hong, S.A.; Ko, J.; Lim, T.W.; Lee, K.Y.; et al. Water removal characteristics of proton exchange membrane fuel cells using a dry gas purging method. J. Power Sources 2008, 180, 784–790. [Google Scholar] [CrossRef]
  31. Tajiri, K.; Tabuchi, Y.; Wang, C.-Y. Isothermal cold start of polymer electrolyte fuel cells. J. Electrochem. Soc. 2007, 154, B147–B152. [Google Scholar] [CrossRef]
  32. Song, W.; Yu, H.M.; Hao, L.X.; Yi, B.L.; Shao, Z.G. Effect of catalytic ink on sub-freezing endurance of PEMFCs. Int. J. Hydrogen Energy 2010, 35, 11129–11137. [Google Scholar] [CrossRef]
  33. Ding, J.; Mu, Y.T.; Zhai, S.; Tao, W.Q. Numerical study of gas purge in polymer electrolyte membrane fuel cell. Int. J. Heat Mass Transf. 2016, 103, 744–752. [Google Scholar] [CrossRef]
  34. Jiao, K.; Li, X. Effects of various operating and initial conditions on cold start performance of polymer electrolyte membrane fuel cells. Int. J. Hydrogen Energy 2009, 34, 8171–8184. [Google Scholar] [CrossRef]
  35. Cho, K.T.; Mench, M.M. Fundamental characterization of evaporative water removal from fuel cell diffusion media. Int. J. Hydrogen Energy 2010, 195, 3858–3869. [Google Scholar] [CrossRef]
  36. Ciureanu, M.; Roberge, R. Electrochemical Impedance Study of PEM Fuel Cells. Experimental Diagnostics and Modeling of Air Cathodes. J. Phys. Chem. B 2001, 105, 3531–3539. [Google Scholar] [CrossRef]
  37. Hou, J.; Song, W.; Yu, H.; Fu, Y.; Shao, Z.; Yi, B. Electrochemical impedance investigation of proton exchange membrane fuel cells experienced subzero temperature. J. Power Sources 2007, 171, 610–616. [Google Scholar] [CrossRef]
Figure 1. Measured HFR plotted against proton conductivity of the membrane.
Energies 14 04520 g001
Figure 2. The HFR of cell-4: (a) during dry purge, and (b) after relaxation.
Energies 14 04520 g002
Figure 3. Effect of freeze/thaw cycles on performance of the five cells with different initial membrane water content: (a) λ = 14.0 (cell-1); (b) λ = 12.0 (cell-2); (c) λ = 10.7 (cell-3); (d) λ = 8.2 (cell-4); (e) λ = 7.7 (cell-5); and (f) cell-6 without freezing.
Energies 14 04520 g003aEnergies 14 04520 g003b
Figure 4. Effect of freeze/thaw cycles on the open circuit voltage of the two cells: (a) cell-1; (b) cell-4.
Energies 14 04520 g004
Figure 5. CV and LSV of single cells before and after 30 freeze/thaw cycles with different initial membrane water content: (a) Cell-1 with λ = 14; (b) Cell-2 with λ = 12.0; (c) Cell-3 with λ = 10.0; (d) Cell-4 with λ = 8.2.
Energies 14 04520 g005
Figure 6. Schematic description of water distribution in membrane and catalyst layer: (a) λ ≥ 14.0; (b) 8.2 < λ < 14.0; (c) λ ≤ 8.2.
Energies 14 04520 g006
Figure 7. Impedance spectra of single cells before and after 30 freeze/thaw cycles with different initial membrane water content: (a) cell-1 with λ = 14; (b) cell-2 with λ = 12.0; (c) cell-3 with λ = 10.0; (d) cell-4 with λ = 8.2.
Energies 14 04520 g007
Figure 8. Surface SEM images after 30 freeze/thaw cycles for: (a) MPL of cell-4; (b) MPL of cell-1; (c) GDL of cell-4 and (d) GDL of cell-1.
Energies 14 04520 g008aEnergies 14 04520 g008b
Figure 9. Surface and cross-sectional SEM images after 30 freeze/thaw cycles for: (a) CL of cell-4; (b) CL of cell-1; (c) cross-section of fresh MEA; and (d) cross-section of cell-1.
Energies 14 04520 g009
Figure 10. Pore size distribution of the fresh MEA, MEA−1, and MEA−4.
Energies 14 04520 g010
Table 1. Experimental conditions and results for equilibrium purge.
Case
No.
Gas Dew
Point (°C)
Cell Temperature (°C)Relative Humidity (%)Membrane Water ContentProton Conductivity ((ohm·cm)−1)Final HFR (ohm·cm2)
12165101.400.00612.4996
24065302.580.01550.3942
34665402.840.01750.2618
44865452.980.01870.1937
55065503.170.02010.1805
65765704.890.03380.1285
762.565909.470.07020.0924
8656510014.000.10610.0779
Table 2. Membrane water content after HFR relaxation.
Cell No.Dry PurgeRelaxed HFR
( m Ω · c m 2 )
R s
( m Ω · c m 2 )
Membrane Water Content
1No--14.0
2Yes46.919.212.0
3Yes50.119.710.7
4Yes63.421.98.2
5Yes65.020.57.7
Table 3. The ECSA before and after freeze/thaw cycles.
Freeze/Thaw
Cycles
Cell-1Cell-2Cell-3Cell-4
ECSA(m2·g−1)ECSA(m2·g−1)ECSA(m2·g−1)ECSA(m2·g−1)
026.0933.8128.3938.76
305.1032.2824.5740.49
Table 4. The EIS fitting data at 1 A·cm−2 before and after freeze/thaw cycles.
Freeze/Thaw
Cycles
Cell-1Cell-2Cell-3Cell-4
R Ω  
m Ω c m 2
R c t  
m Ω c m 2
R Ω  
m Ω c m 2
R c t  
m Ω c m 2
R Ω  
m Ω c m 2
R c t  
m Ω c m 2
R Ω  
m Ω c m 2
R c t  
m Ω c m 2
052.35250.7546.96297.4547.54275.6544.89272.05
3077.30446.5546.10292.5546.45221.1042.80223.90
Publisher’s Note: MDPI stays neutral with regard to jurisdictional claims in published maps and institutional affiliations.

