Article

Numerical Study of Hydrocarbon Charge Reduction Methods in HVAC Heat Exchangers

1
Department of Energy and Process Engineering, NTNU Norwegian University of Science and Technology, Kolbjørn Hejes vei 1D, 7491 Trondheim, Norway
2
SINTEF Energy Research, Kolbjørn Hejes vei 1, 7491 Trondheim, Norway
3
Fraunhofer Institute for Solar Energy Systems ISE, Heidenhofstr. 2, 79110 Freiburg, Germany
*
Author to whom correspondence should be addressed.
Energies 2021, 14(15), 4480; https://doi.org/10.3390/en14154480
Submission received: 21 June 2021 / Revised: 17 July 2021 / Accepted: 19 July 2021 / Published: 24 July 2021
(This article belongs to the Special Issue Heat Transfer, Refrigeration and Heat Pumps)

Abstract

:
Required refrigerant charge in heat pump systems with propane is analyzed. Two systems are compared: the first a direct heat pump, with fin-and-tube heat exchangers, and the second an indirect system, with plate heat exchangers with an additional brine-to-air heat exchanger. Each system was considered to be able to work reversibly, with 5 k W design cooling capacity in summer and 8 k W design heating capacity in winter. Two separately developed simulation codes were used to calculate the required refrigerant charge and the efficiency of each of the systems. The charge was reduced by the use of microfinned tubes up to 22% in direct system reduced using microfinned tubes compared to the smooth tube. For the indirect system using specially designed plate heat exchangers with the minimum internal volume, their charge was reduced by up to 66% compared to normal plate heat exchangers.

1. Introduction

The impact of refrigeration, air conditioning and heat pump (RACHP) systems on the environment has led to efforts to limit the use of different working fluids with initiatives and regulations such as the European F-gas regulation [1]. The current generation of working fluids has an exceptionally high global warming potential (GWP) and the progress toward a more sustainable and environmentally friendly RACHP industry requires a broad shift to working fluids with low GWP and zero ozone depletion potential (ODP). Additionally, systems working with more environmentally friendly refrigerants need to be more energy-efficient to reduce the indirect impact with lower primary energy usage. Hydrocarbons, such as Propane (R290), isobutane (R600a), and propylene (R1270) have long been used as working fluids in various applications. For example, isobutane (R600a) is the most used refrigerant in domestic refrigeration and freezer units, especially in Europe [2]. Hydrocarbons offer favorable saturation curves befitting different use cases while enjoying low GWP and zero ODP; thus, they are considered to replace several groups of working fluids by 2030 [3]. However, the use of hydrocarbons in refrigeration systems has been long limited by flammability concerns. While risk analysis has been performed on these systems showing that with careful installation, reaching the lower flammability limit is improbable [4], concerns remain. Studies have shown that the majority of charge is stored in heat exchangers [5,6], thus minimizing the heat exchangers’ volume seems to be the most effective method of increasing the capacity of these systems with regards to limitations on their charge. This is even more critical in the condenser’s case as it could contain 50% of the total charge [6]. In an air sourced heat pump, the majority of the charge is stored in the condenser; nevertheless, the evaporator charge is still considerable, especially in lower temperatures where it can be more than 20% of the total charge [6].
Different studies have shown the possibility to run specially designed low charge heat pumps with capacities up to 8 k W with a maximum charge of 150 g to fulfill regulations and provide maximum safety by minimizing inner volume, especially for components containing liquid refrigerant [7,8,9]. Studies have shown that hydrocarbons’ heat transfer coefficient can be increased substantially by using microfinned tubes with minimum penalization in pressure drop [10,11,12], which could be utilized to reduce refrigerant charge of heat pumps. Moreover, brazed plate heat exchangers (BPHE) are favorable for condensation and evaporation due to their low inner volume at high thermal capacity. However, heat transfer in the secondary side of hydrocarbon heat exchangers, being that a liquid (water or brine) or air, may limit the potential of heat exchanger and refrigerant charge reduction.
Thus, while some research has studied the two-phase characteristics of hydrocarbons in different geometries, the resulting effect on the design of heat exchangers is not investigated. Furthermore, the benefits and drawbacks of direct and indirect systems in relation to charge and capacities are not fully understood. This article analyzes the refrigerant charge and efficiency of two R290 reversible heat pumps, one with indirect heat transfer using BPHE and intermediate circuits with an brine-to-air outdoor heat exchanger and an indoor panel heating and cooling system with water as heat transfer fluid, and another with direct air-to-air system, using fin-and-tube heat exchangers. The design heating (winter) and cooling (summer) capacities are 8 k W and 5 k W , respectively. Two independent models, one per heat pump system, were utilized to design the corresponding heat exchangers (condenser and evaporator). These utilized models were based on correlations developed by experimental data on two-phase flow of propane.

2. Tested Systems

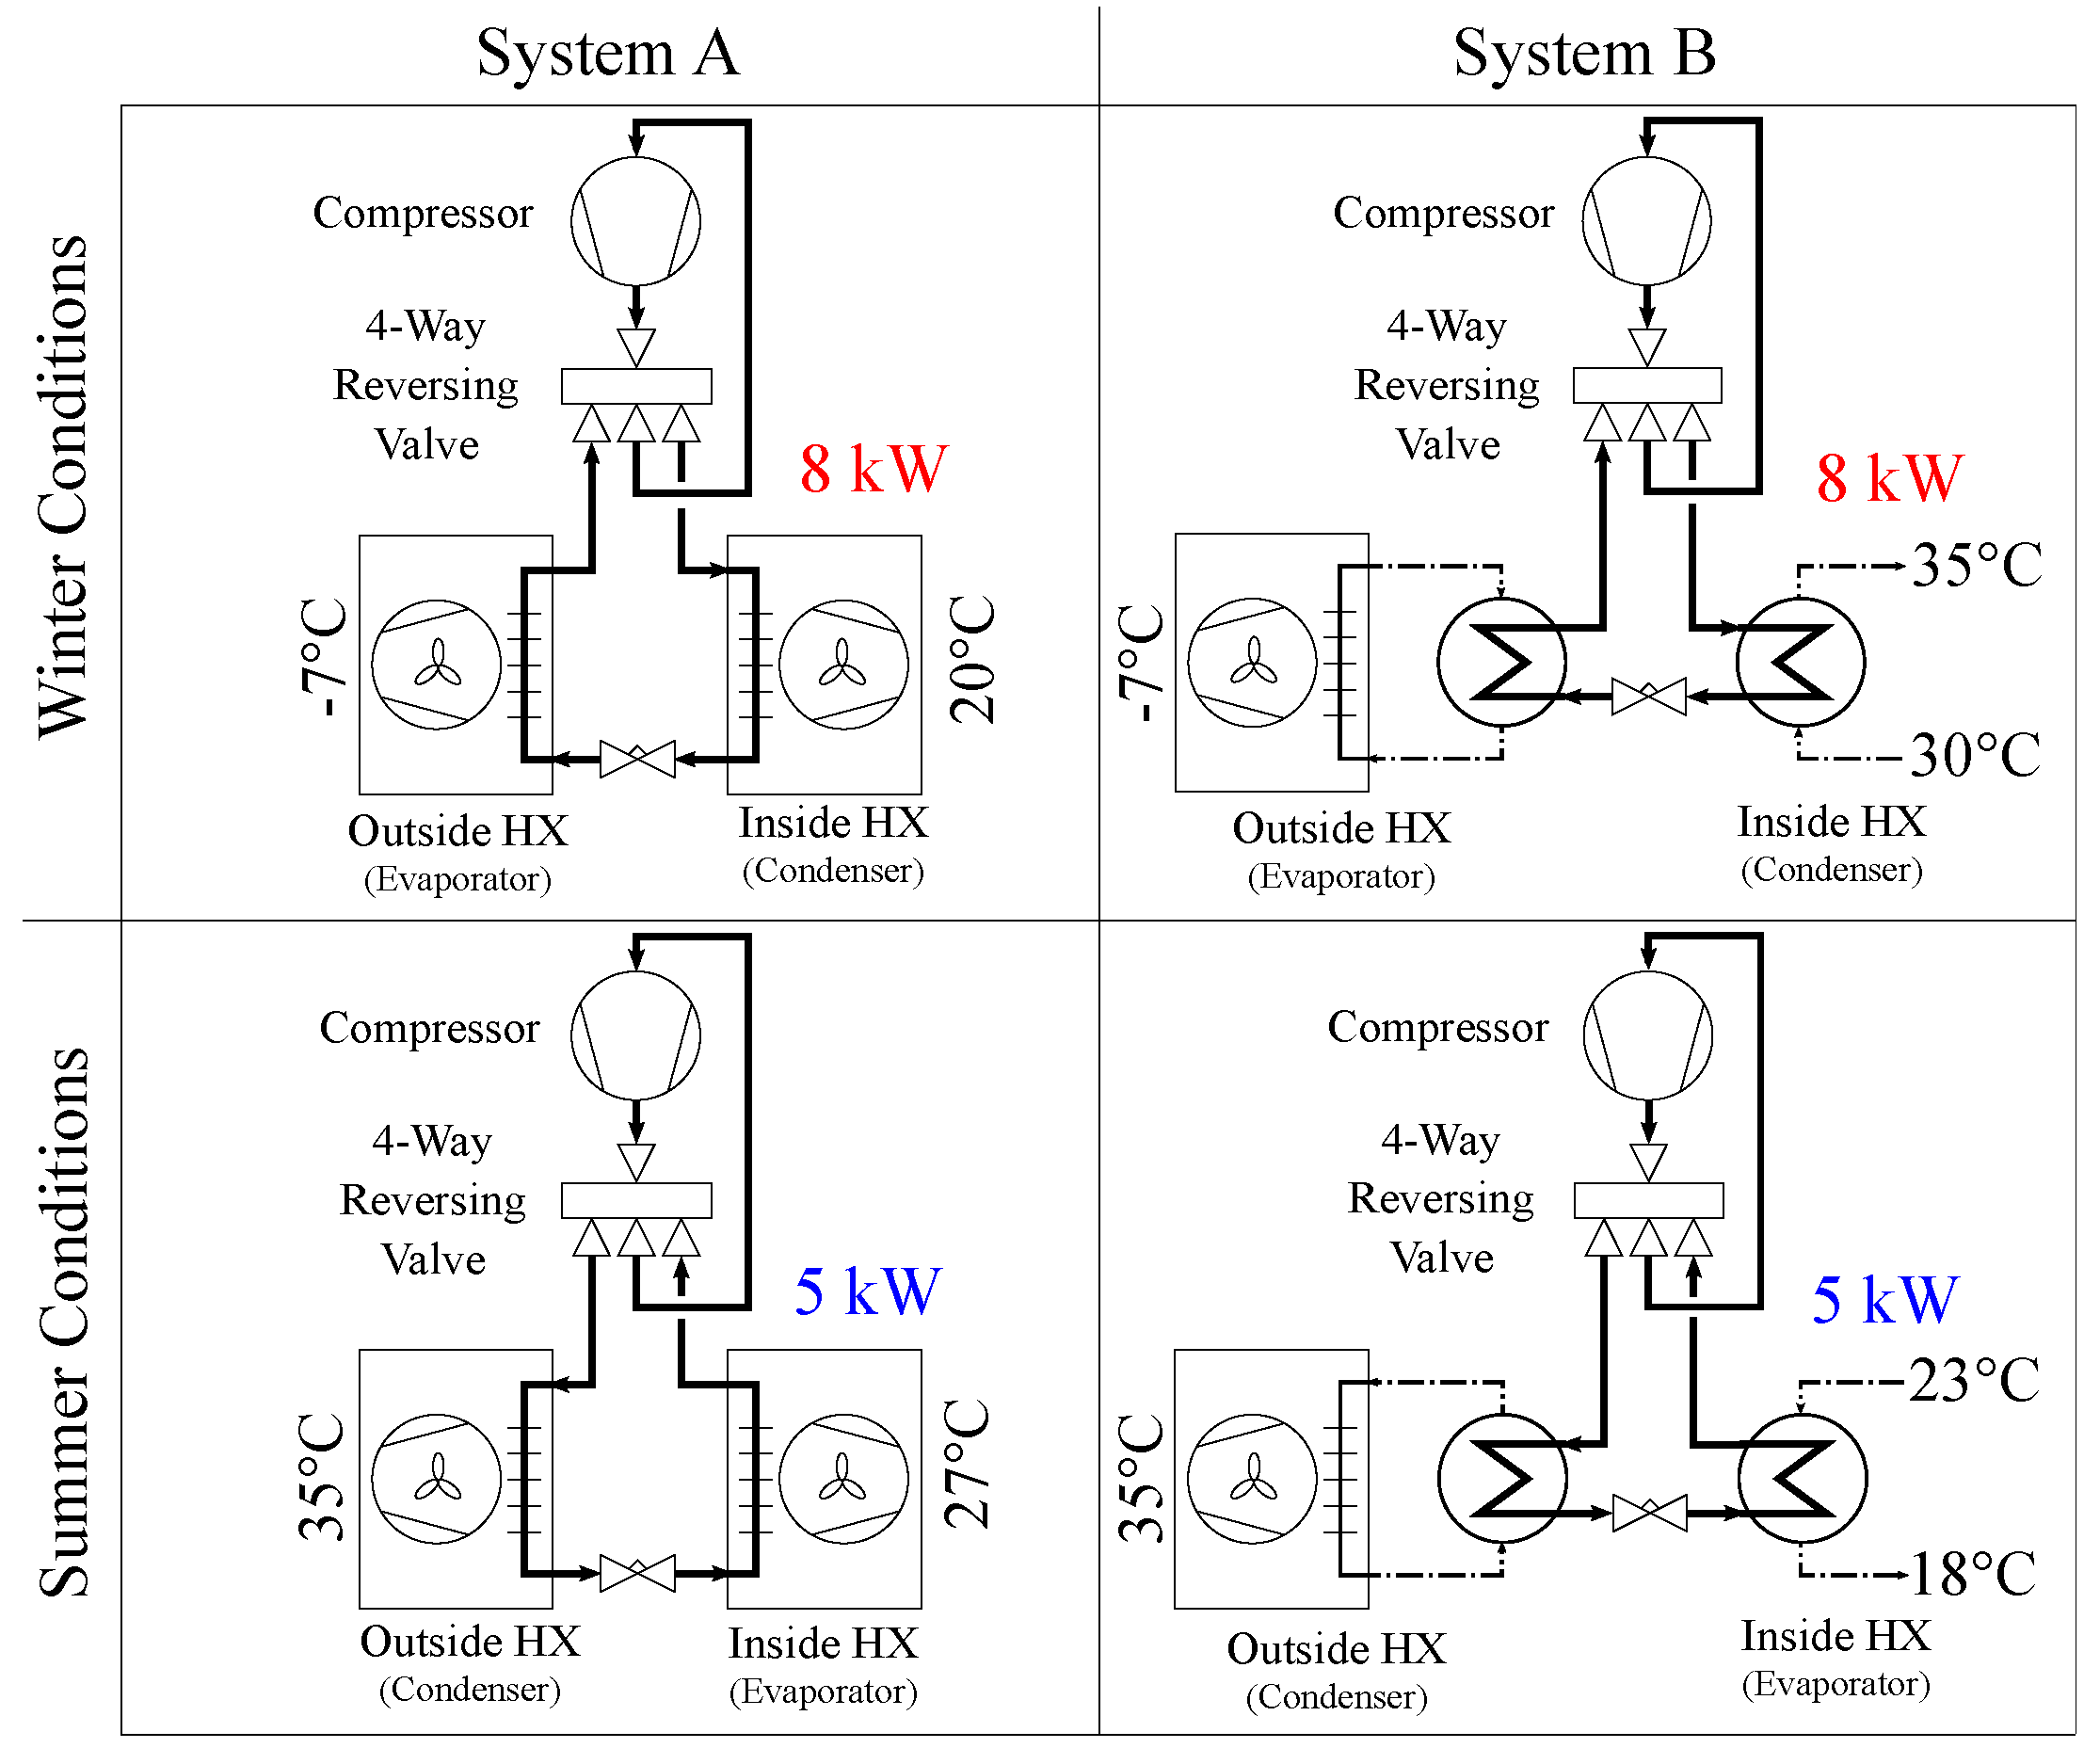
2.1. Heat Pump Architectures

Two R290 reversible heat pump systems are defined and compared in this work: a direct air to air unit and an indirect brine to water system, using air as heat source and sink. For each system, only the evaporator and condenser have been analyzed, and elements such as compressor, tubes and other installations are not evaluated. The different systems and testing conditions are shown in Figure 1. The direct system (System A) uses a fin-and-tube heat exchanger configuration where one smooth (SM) and two microfinned tubes (MF1 and MF2) are considered for the indoor and outdoor heat exchangers. The indirect system (System B) is a more compact solution comprising of two brazed plate heat exchangers, with an intermediate brine loop to the outdoor heat exchanger, and water loop to the indoor unit, which is defined as a panel heating/cooling configuration. Both systems have been analyzed for summer and winter conditions, with equal design capacities of 5 k W cooling in summer and 8 k W heating in winter. The standards DIN EN 14511 and DIN EN 14825 [13,14] define temperatures for air to air and air to water heat pumps and air conditioners. The nominal values for average climate were used for the basis of the calculations. The defined input parameters are declared in Table 1 and in context with the different systems in Figure 1.
Both systems were considered with a superheating degree of 5 K at the compressor suction port and a subcooling of 3 K at the condenser’s outlet. For System B, an isentropic efficiency for the compressor has been set at 0.85. For System A, the isentropic efficiency was not a free parameter in the used simulation tool HXSim. The inlet temperature to the condenser, i.e., compressor discharge temperature, must be balanced with the condenser subcooling degree, which was given a higher priority as it strongly affects the charge. Nevertheless, after several iterations it was possible to reach an acceptably close value of 0.86–0.82 for isentropic efficiency in the different tested cases.

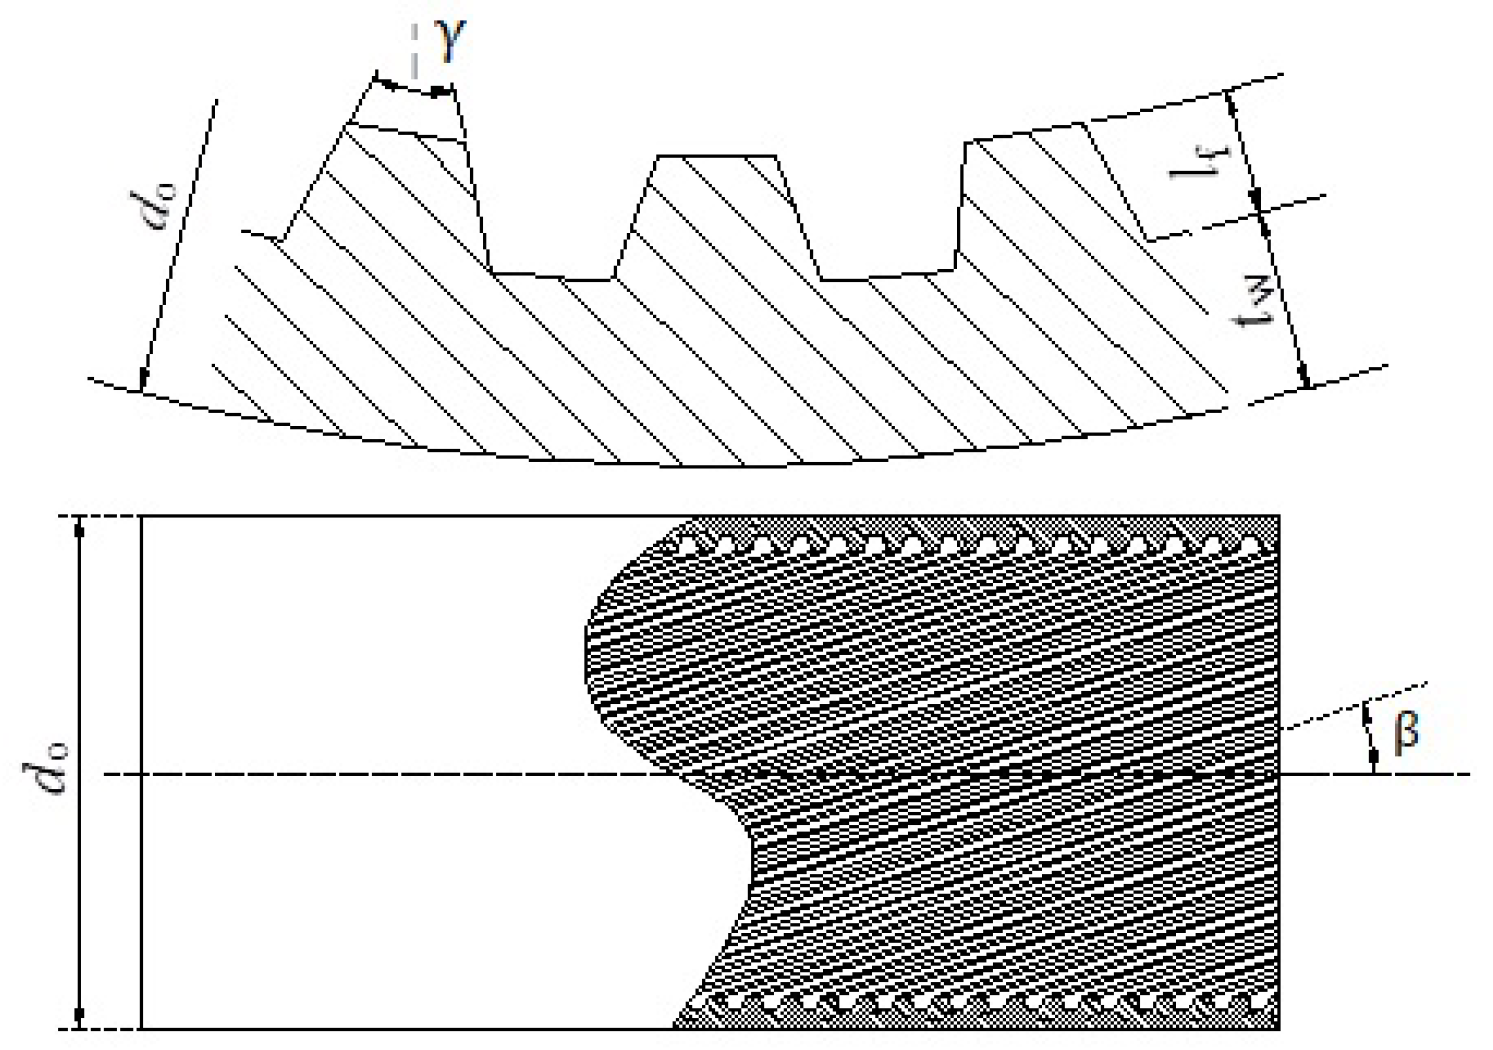
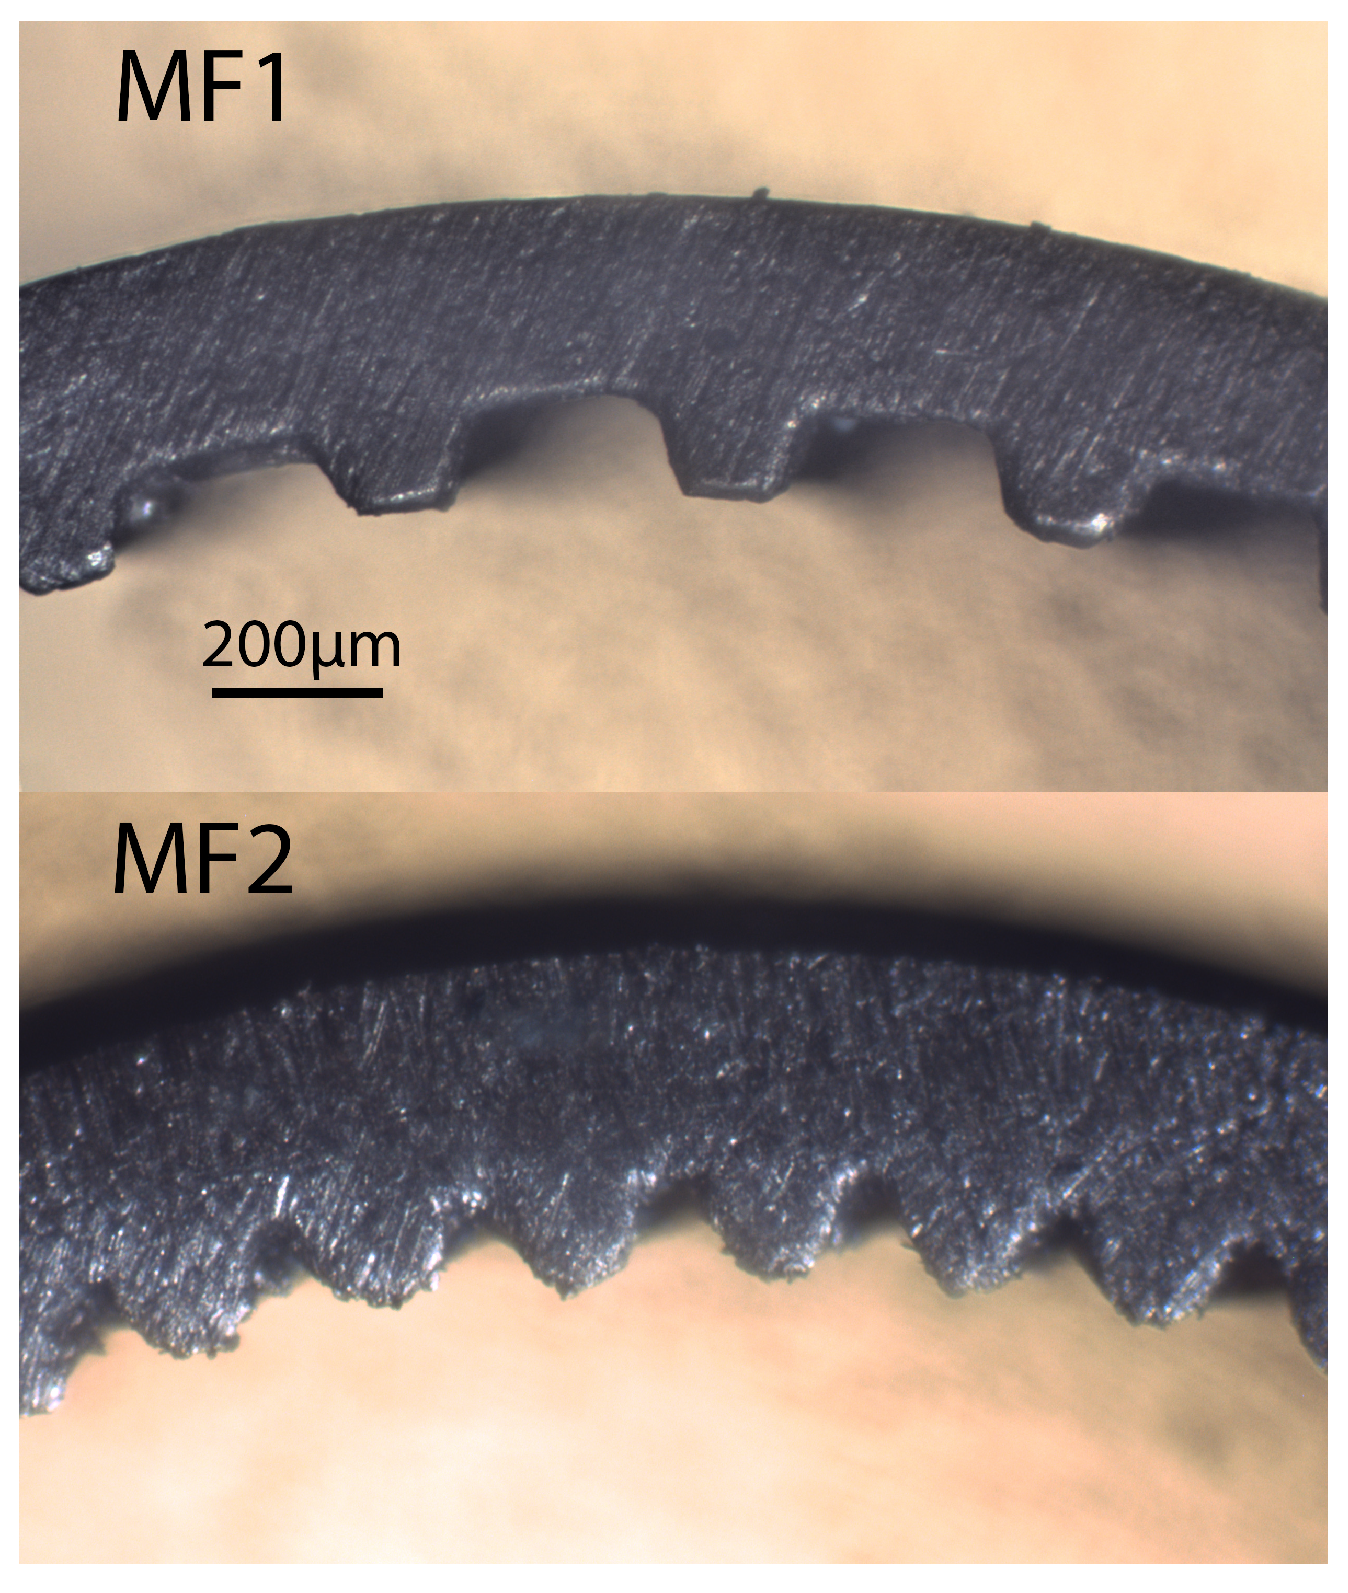
2.2. System A—Fin-and-Tube Heat Exchanger

For the fin-and-tube heat exchangers, three tubes were considered with different internal geometries, as represented in Figure 2 and Figure 3 and with detailed information in Table 2. The two microfinned tubes (MF1 and MF2) differ in the number of fins and the spiral angle, being both parameters higher in the MF2 tube and resulting in a higher area available for heat exchange, this increase in relative heat exchange area of a microfinned tube compared to a smooth tube with the same fin tip diameter can be calculated as R x which is calculated as:
R x = 2 · l f · n · [ 1 sin ( γ / 2 ) ] π · D · cos ( γ / 2 ) + 1 · 1 cos β
In addition to the parameters mentioned in Table 1, some other parameters are set for the fin side as reported in Table 3. The airside fin pitch is higher for the outside unit to prevent frost blockage while the air face velocity is lower in the inside unit to have an acceptable level of fan noise. Most values are based on Thulukkanam [15]. The fin patter is plain in all the designed heat exchangers and the tubes are arranged in a staggered design.

2.3. System B—Brazed Plate Heat Exchangers

Plate heat exchangers provide compact, highly efficient and adaptable designs with high heat transfer area to inner volume ratio. Different designs and plate patterns such as sinusoidal, fishbone, dimple structure, or specially designed insert plates exist to optimize heat transfer and pressure drop mechanisms [16,17]. One of the last developments in this field has been asymmetrical patterns that reduces the inner volume only of the refrigerant channels with a low influence on heat transfer coefficients and pressure drop for both fluids aiming to reduce refrigerant charge. However, for this study three different brazed plate heat exchangers with symmetrical patterns were selected due to limitations in the modelling tool utilized for this selection. BPHE1 is a brazed plate heat exchanger with no optimization in terms of inner volume, both BPHE2 and BPHE3 have reduced pattern depths to minimize the inner volume. Geometrical values for the brazed plate heat exchangers are reported in Table 4, the given geometry parameters of the BPHE are shown in Figure 4. Three configurations were simulated each with the same type of plate heat exchanger as condenser and evaporator.
As intermediate brine circuit, a fin-and-tube outdoor unit was assumed with a heat transfer area of 25 m 2 and a heat transfer coefficient of 40 W m 2 K 1 at the airside and a heat transfer area of 1.5 m 2 and a heat transfer coefficient of 3 k W m 2 K 1 for the brine side. The temperatures of the brine circuit have been estimated using an ϵ -NTU method [18]. In order to prevent the brine from freezing, an ethylene glycol-water mixture with a mass fraction of 50% glycol and a freezing temperature of −36 °C was used. The water temperatures for the panel heating and cooling system are fixed and given in Table 1.

3. Simulation Method

3.1. HXSim

The results for fin-and-tube heat exchangers are obtained using an in-house code, HXSim, developed by SINTEF Energy Research. This code has been detailed and validated against experimental data in Skaugen [19]. This is a rating program that estimates the heat exchanger performance for a fully described geometry and operating conditions. It has been used extensively to design compact CO 2 heat exchangers [20]. The code was updated to include the latest heat transfer coefficient (HTC) and pressure drop prediction correlations on the refrigerant side, both for smooth and microfinned tubes. The correlations for microfinned tubes are specially developed to consider specific geometrical characteristics of the tubes that can significantly affect HTC and pressure drop values. The prediction methods considered in the current study are based on the best performing correlations shown in [10,11,12], they are summarized in Table 5 where δ 30 % presents the number of experimental data points that the correlation can predict with less than 30% error.
The correlation from Granryd [27] was used for the airside heat transfer and pressure drop. This model is also described by Verma et al. [28] and validated against experiments and CFD by Lindqvist et al. [29]. The evaporator is calculated as a dry expansion type where the evaporation temperature and degree of superheat are defined at the outlet, specified by the pressure and temperature upstream of the expansion valve. The heat exchanger duty is found by iteration on the refrigerant flow rate. The refrigerant side’s capacity and pressure loss are integrated from the outlet towards the inlet with an estimated air temperature relative humidity profile. After one integration, the refrigerant duty, wall and fin root temperatures are found, and the airside profile can be updated. The solution has converged when the correct inlet refrigerant enthalpy corresponds with the expansion enthalpy and the refrigerant and airside duties are equal. The two main differential equations for integrating the capacity (enthalpy) and pressure in a direction z are:
m ˙ · d h = q · P r · d z
d p = P z d z
where P r is the refrigerant side surface perimeter and q, refrigerant side heat flux is calculated by:
q = U r Δ T L M T D
where Δ T L M T D is the logarithmic temperature difference between the air and the refrigerant and U r is the overall heat transfer coefficient referred to the refrigerant side based on the local refrigerant side heat transfer coefficient, tube wall resistance and the apparent local airside heat transfer coefficient.
Most correlation used for prediction of HTC do not have into account the heat transfer mechanism after dryout in initiated. Thus, in simulations, HTC would increase up to x = 1 and suddenly drop to single phase HTC values, usually an order of magnitude smaller. This huge drop at a single point of calculation would destabilize the iterative process and stop the simulation. To ensure a good convergence behavior on the refrigerant side, HTC needed to be smoothed between the two-phase and single-phase regions. An asymptotic interpolation via weighed tanh-function was used between HTC at vapor fraction 0.8 and superheated vapor at 20 K superheat. Figure 5 illustrates this principle where the blue markers show the calculated HTC directly from the correlation (depending on temperature, pressure, vapor quality and heat flux) and the orange line show the smoothing function between vapor fraction 0.8 with superheating values of 0.0 and 20.0 K . The justification of smoothing against a non-equilibrium vapor fraction bigger than one is based on [30]. It is noteworthy that while the smoothing of HTC between the phases might seem aggressive and show a considerable difference, the longitudinal heat conduction along the length of copper tubes walls would have a similar effect where the dryout will not be localized to a single point and thus smoothed. The dry-out point can also be calculated from a correlation, and the asymptotic interpolation regarded as a post-dryout heat transfer.

3.2. IMST-ART

The plate heat exchangers were simulated with the simulation software IMST-ART Version 3.9.0 developed by the Universidad Politecnica de Valencia (UPV) which is a commercial tool for the design and optimization of refrigeration cycles [31]. On the refrigerant side, the used heat transfer and pressure drop correlations for two-phase flow in plate heat exchangers utilize correlations for tubular geometries with measurements done at the UPV. For single-phase flow, the correlation of [32] is used. The void fraction and refrigerant mass are calculated with the correlation of [33]. Only symmetrical plate heat exchangers can be modeled since there is no difference in the two fluids’ geometry. The software requires the dimensional data of the plate heat exchanger and enhancement factors for the heat transfer and pressure drop for both fluids, plus the conditions of both fluids at the inlet and the mass flow rate or outlet conditions. The enhancement factors were adapted in order to achieve same overall heat transfer coefficients and pressure drop which the distributors suggested. The software only calculates the masses and volumes in the core and neglects the ports, these were added manually with a homogeneous void fraction model.

4. Results and Discussion

4.1. Fin-and-Tube Heat Exchanger Designs

Fin-and-tube heat exchangers need to be designed based on the requirements of the tested case. The goal of the design was to limit the available volume in the heat exchanger. The most important design parameters are reported in Table 6. The higher HTC for MF allowed for shorter lengths of passes but led to a slightly higher number of passes to attain higher capacities. The inlet and outlet header for all heat exchangers had an internal diameter of 12 m m .
While two internally enhanced tubes were used to design fin-and-tube heat exchangers, the authors were unable to find a satisfactory simulation of the MF2 tube. The significant challenge was the evaporator in summer condition (inside unit), where no converging solution was found. On the other hand, the condensation unit at winter condition (inside unit) seemed to have higher than anticipated HTC. These problems are explained by the inability of the correlations to predict HTC of microfinned tubes with a high number of fins. This was expected and it is well documented in Allymehr et al. [10,11]. It can be seen in Table 5 where the δ 30 % value for MF2 tube is significantly lower than MF1 tube. In addition to higher δ 30 % values, the results for MF2 have a high level of scattering, which the authors believe to be the underlying reason for simulation convergence problems. Additionally, the performance of the internal units in both summer and winter conditions are related to the outer unit, so the results from these units are also not dependable; therefore, MF2 results were not included in this study. However, the details of the MF2 tube are kept to show the limitations of this numerical simulation and the need for the experimental test in certain scenarios.

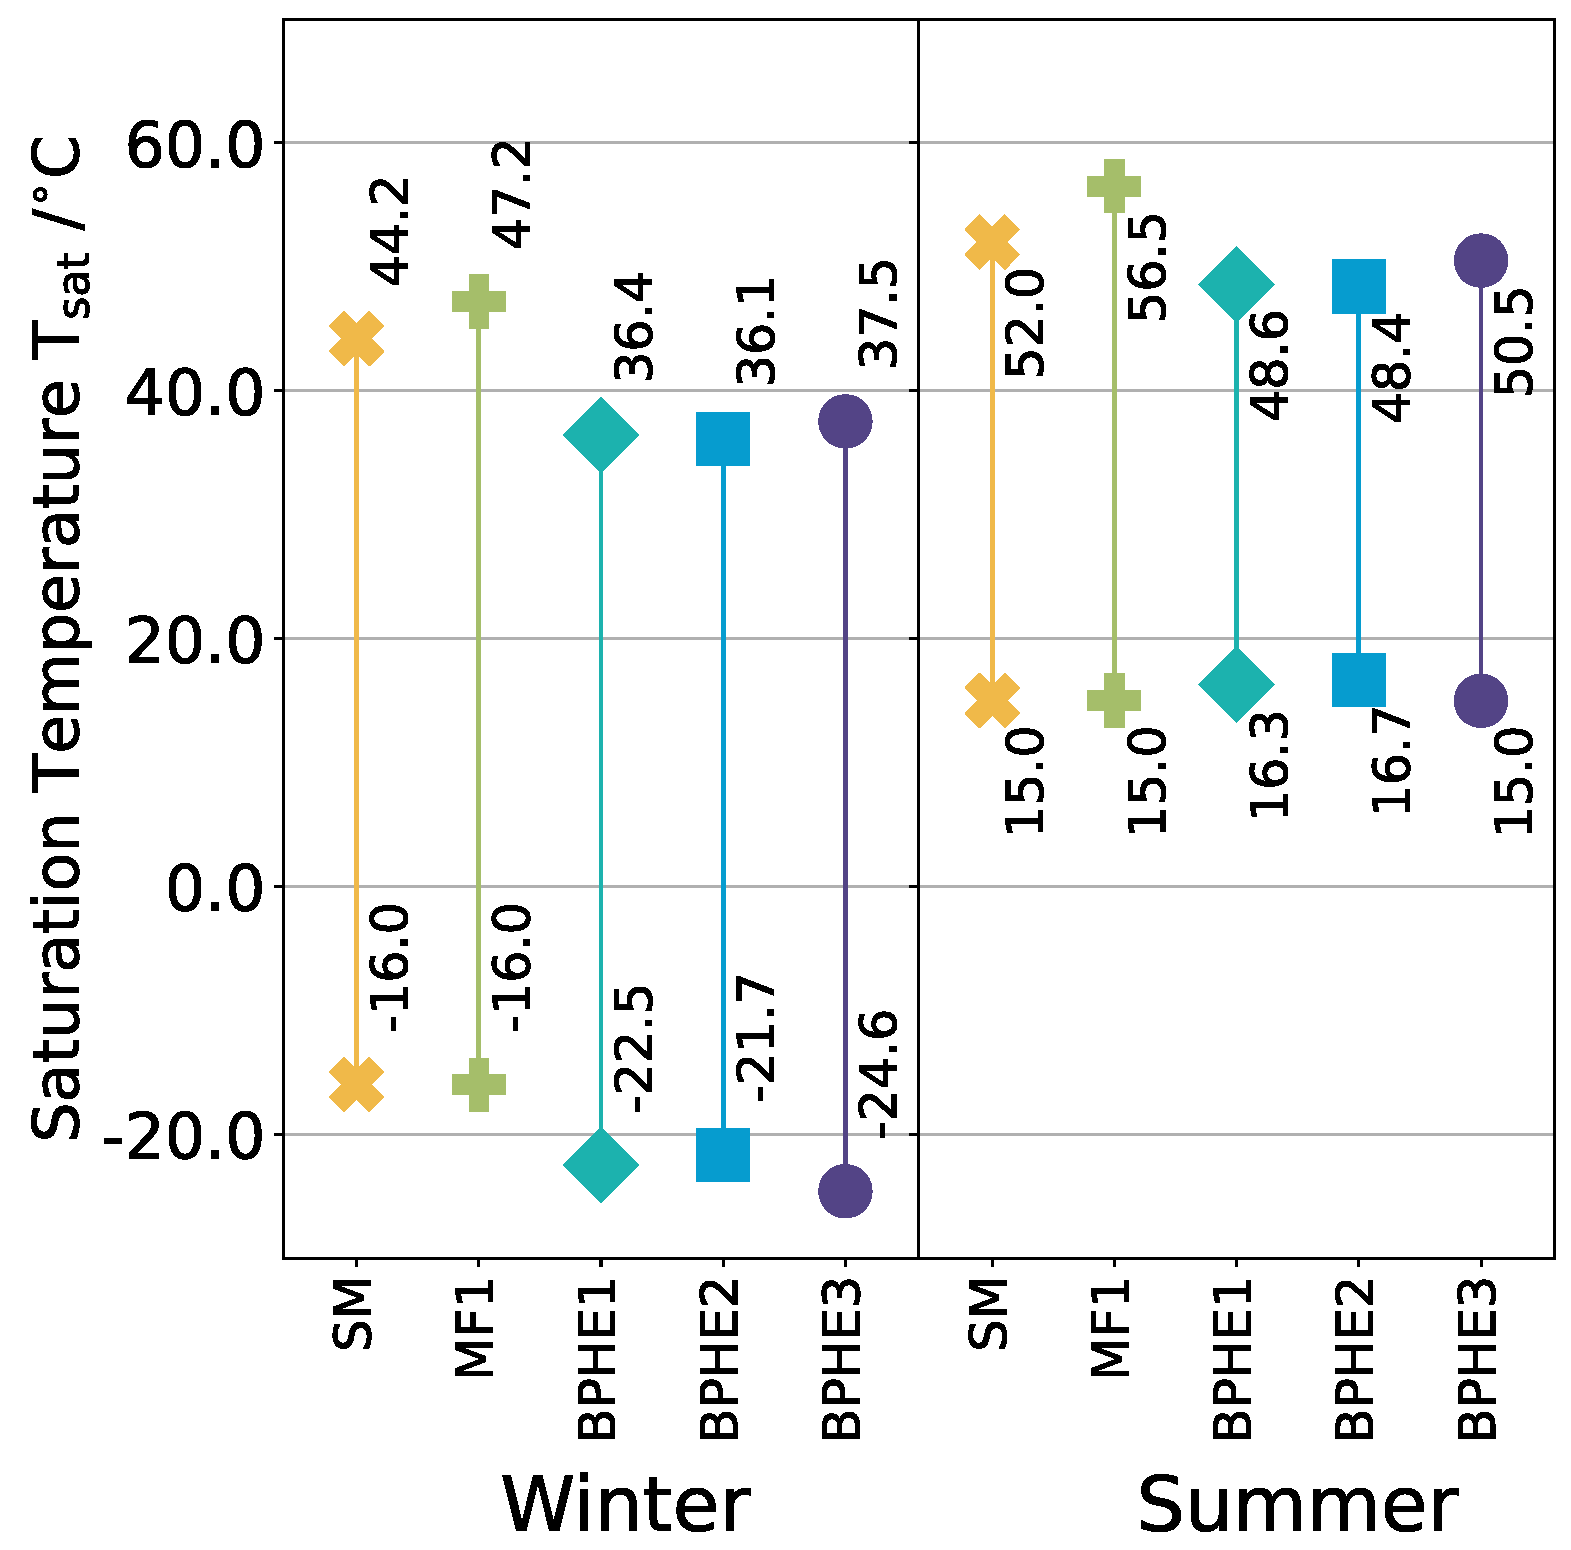
4.2. System Comparison
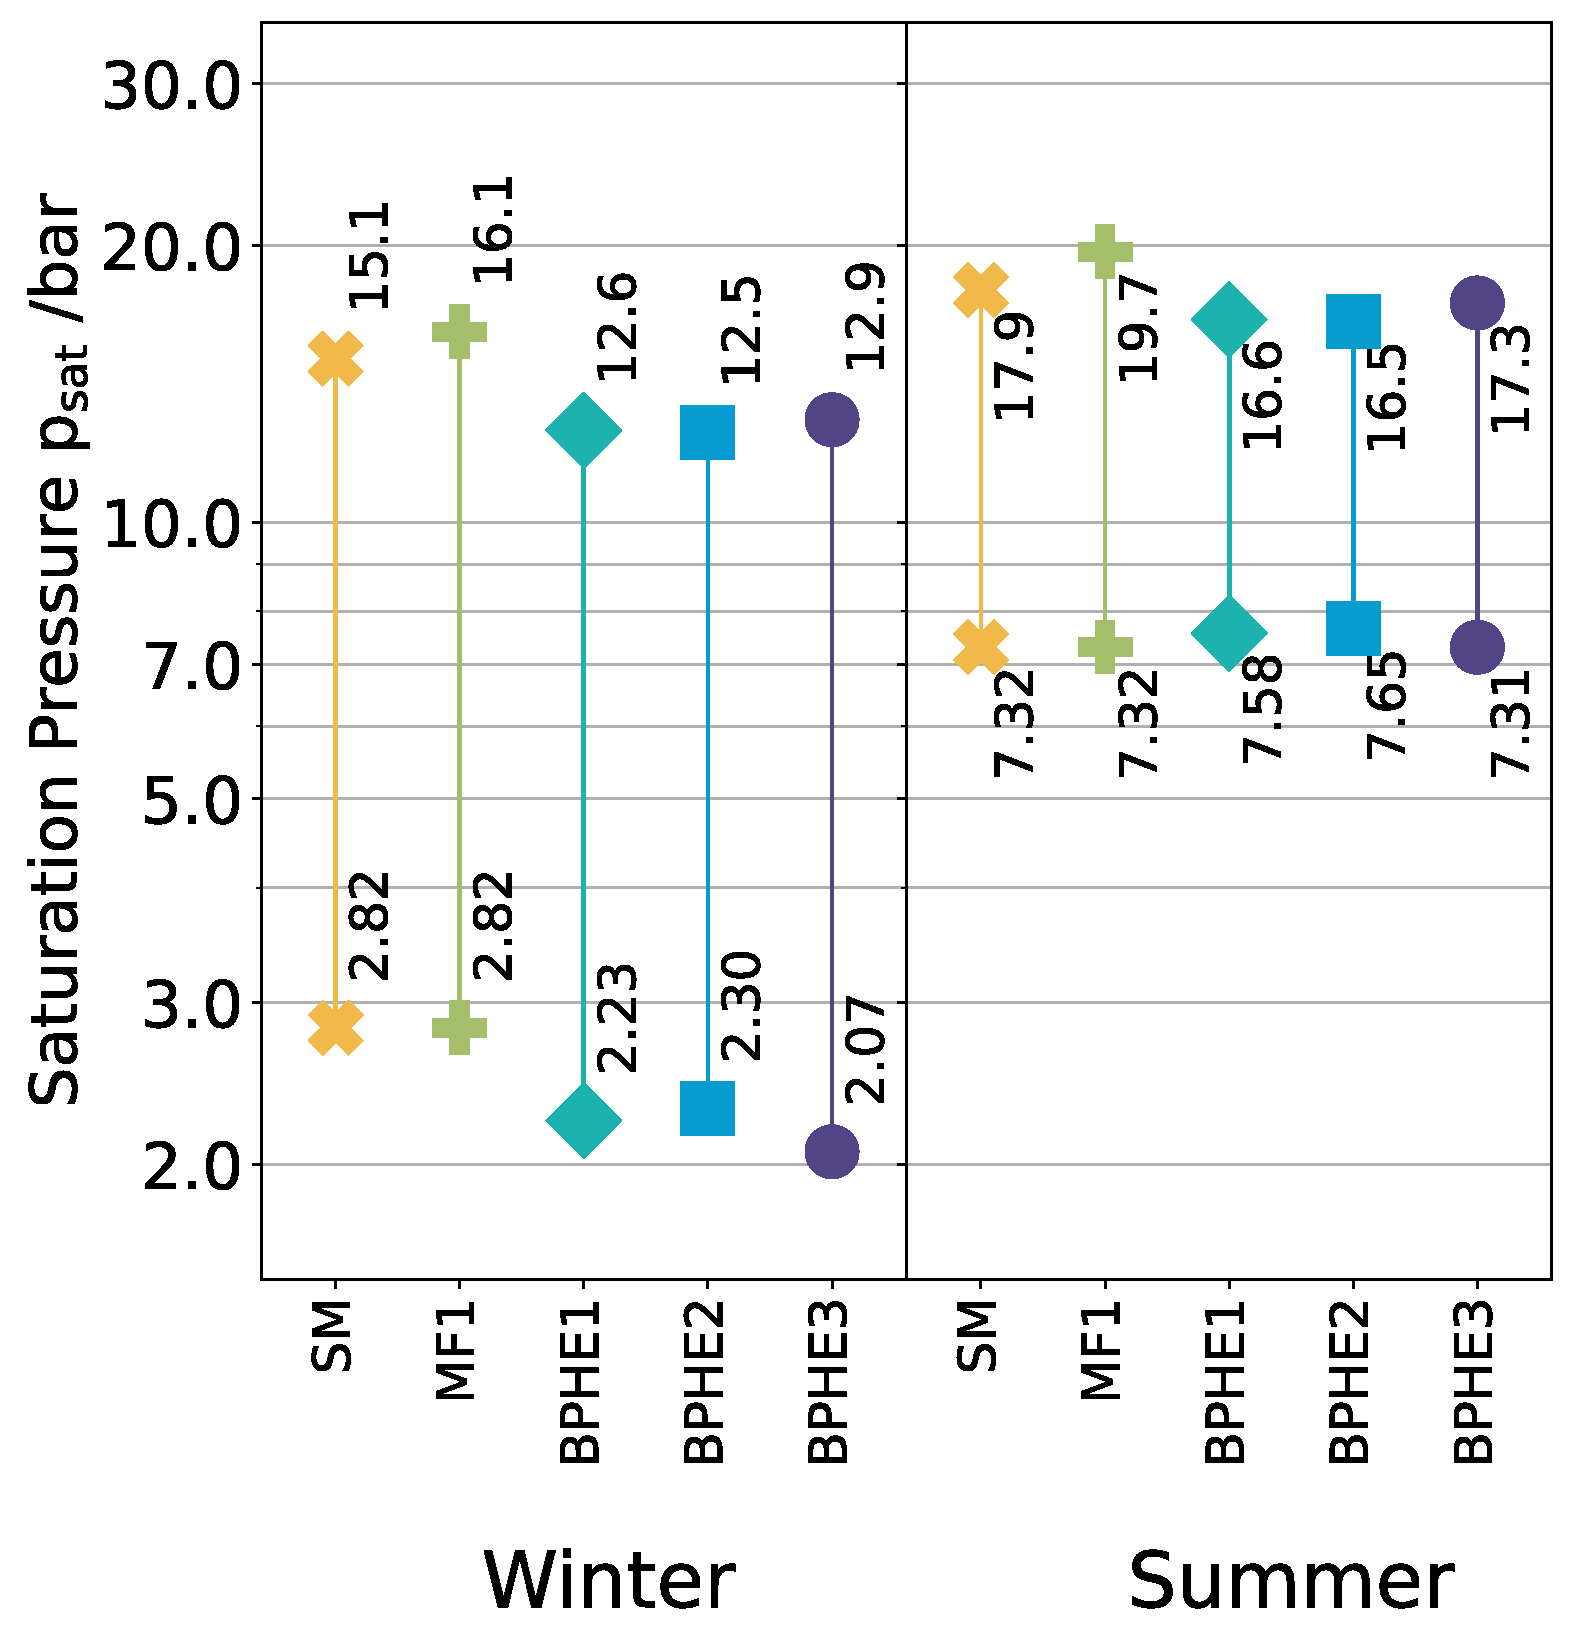
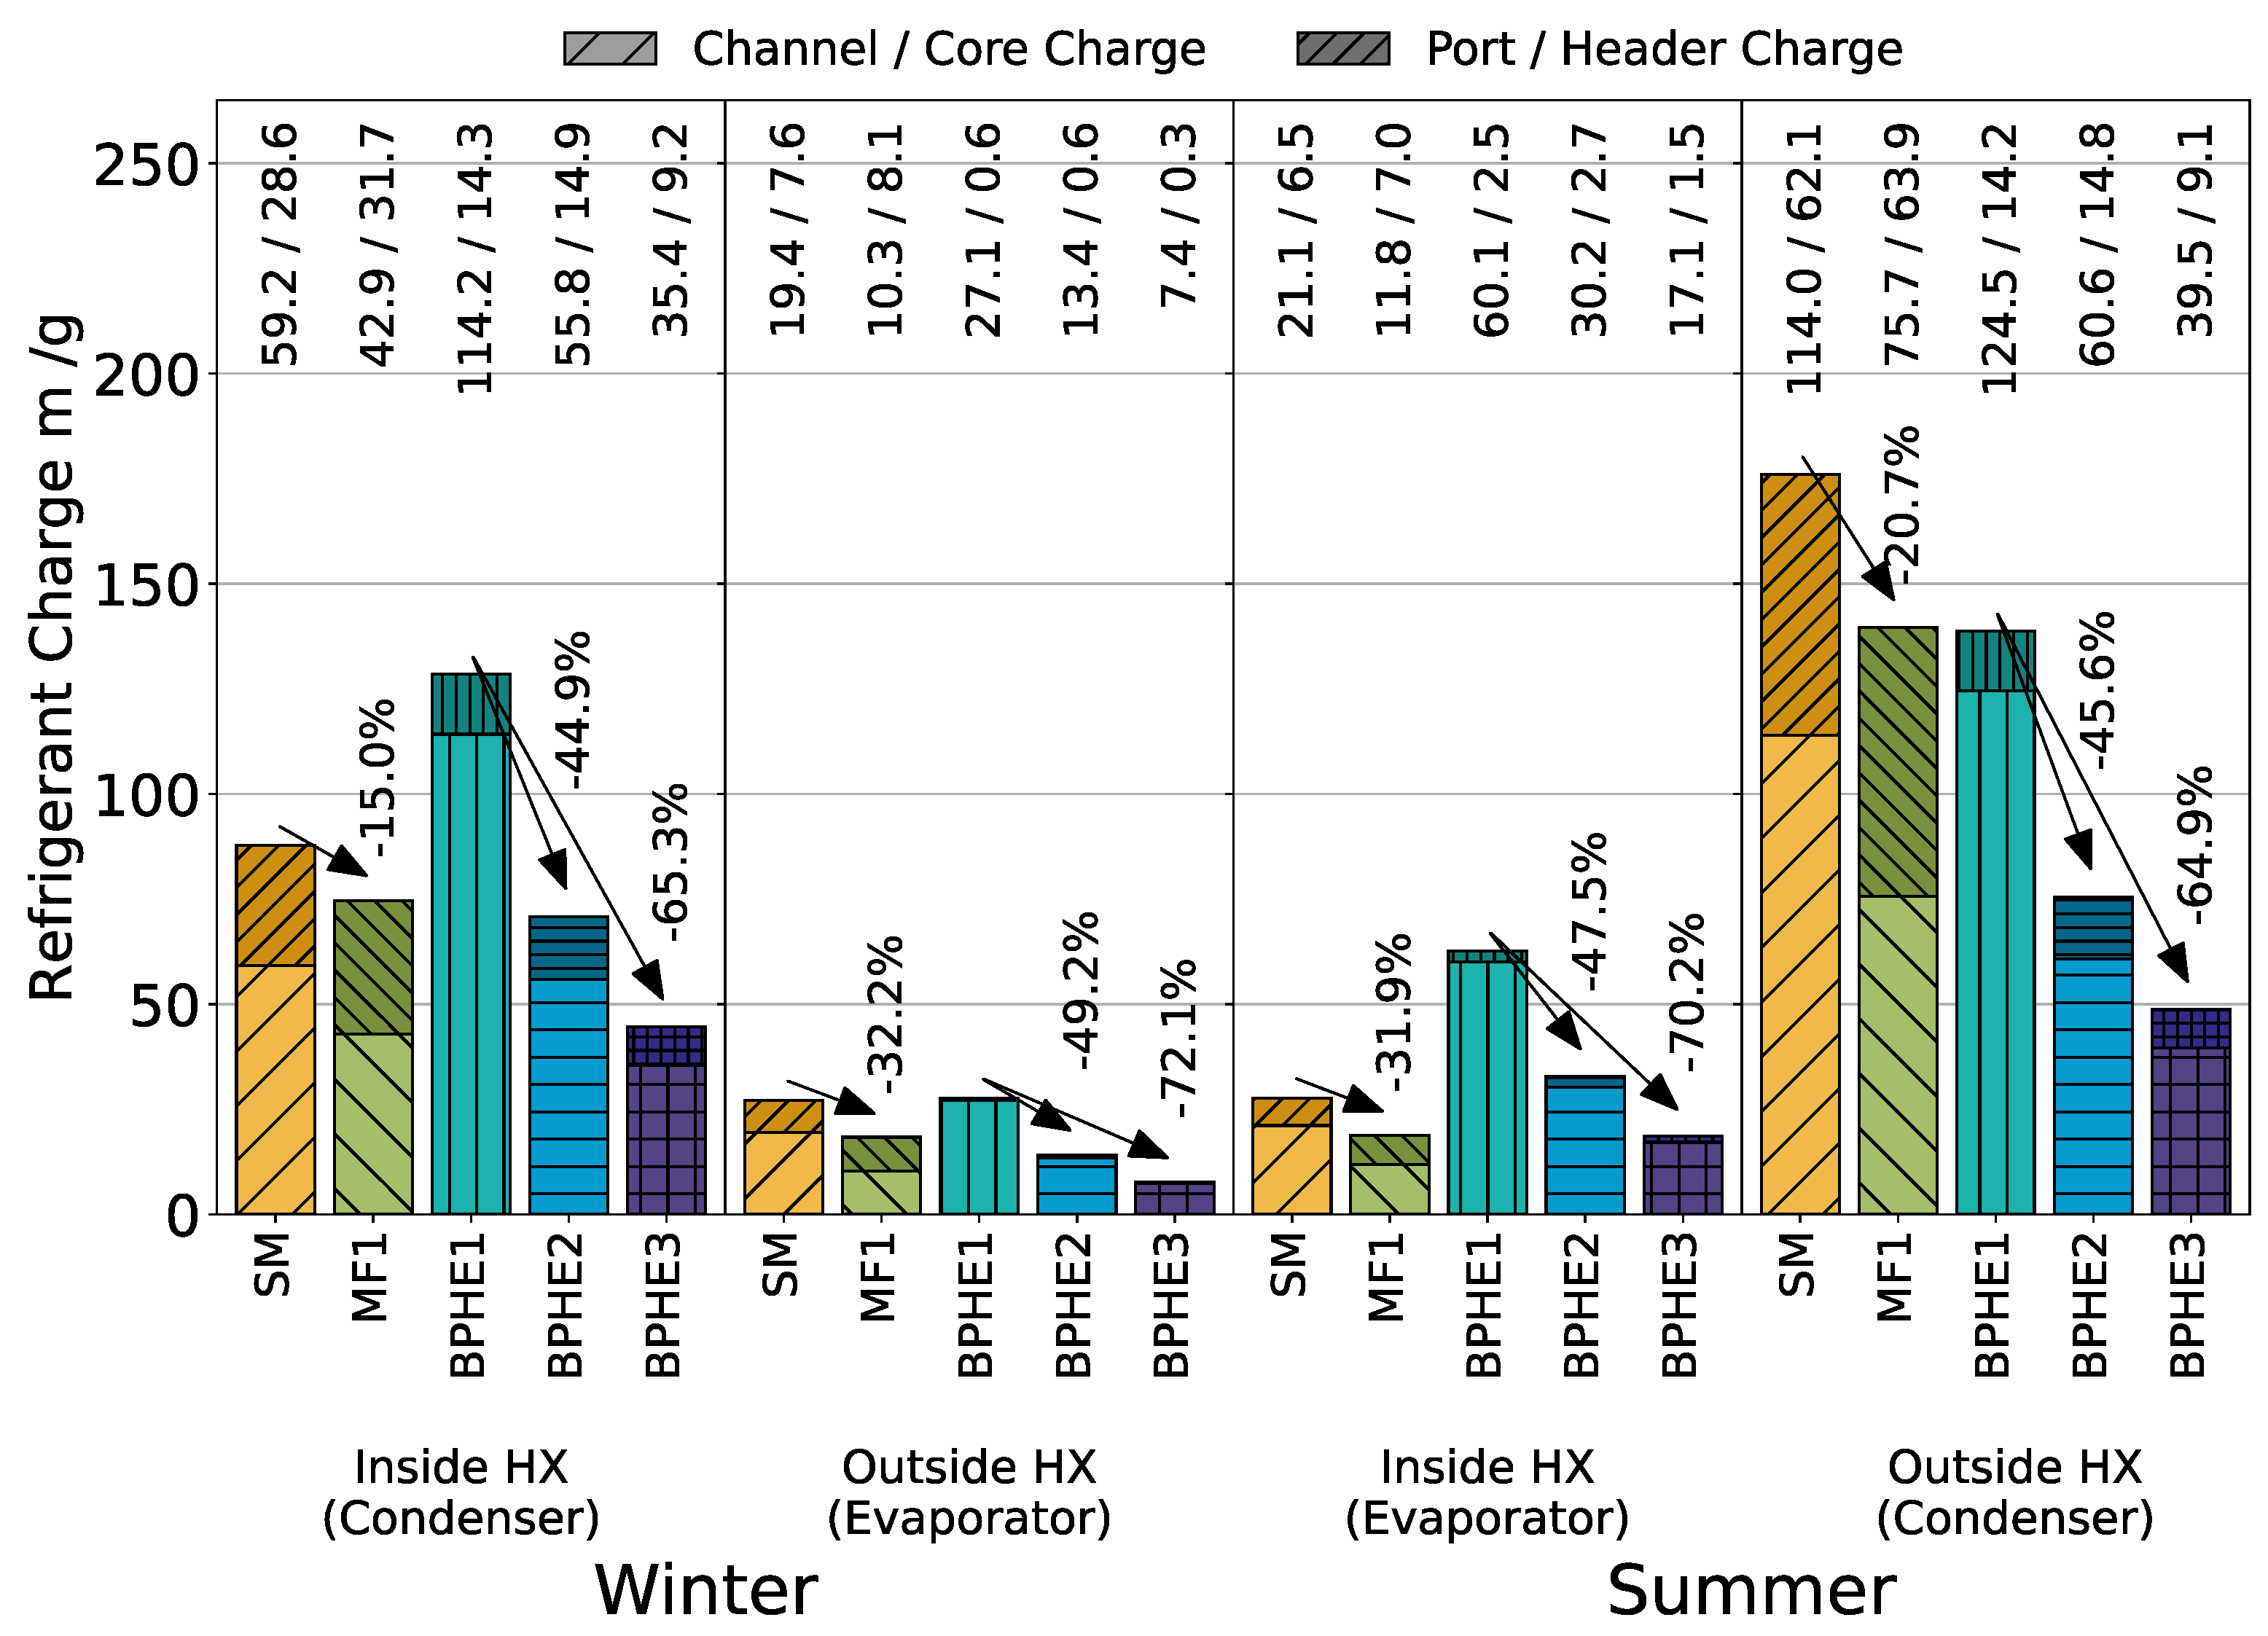
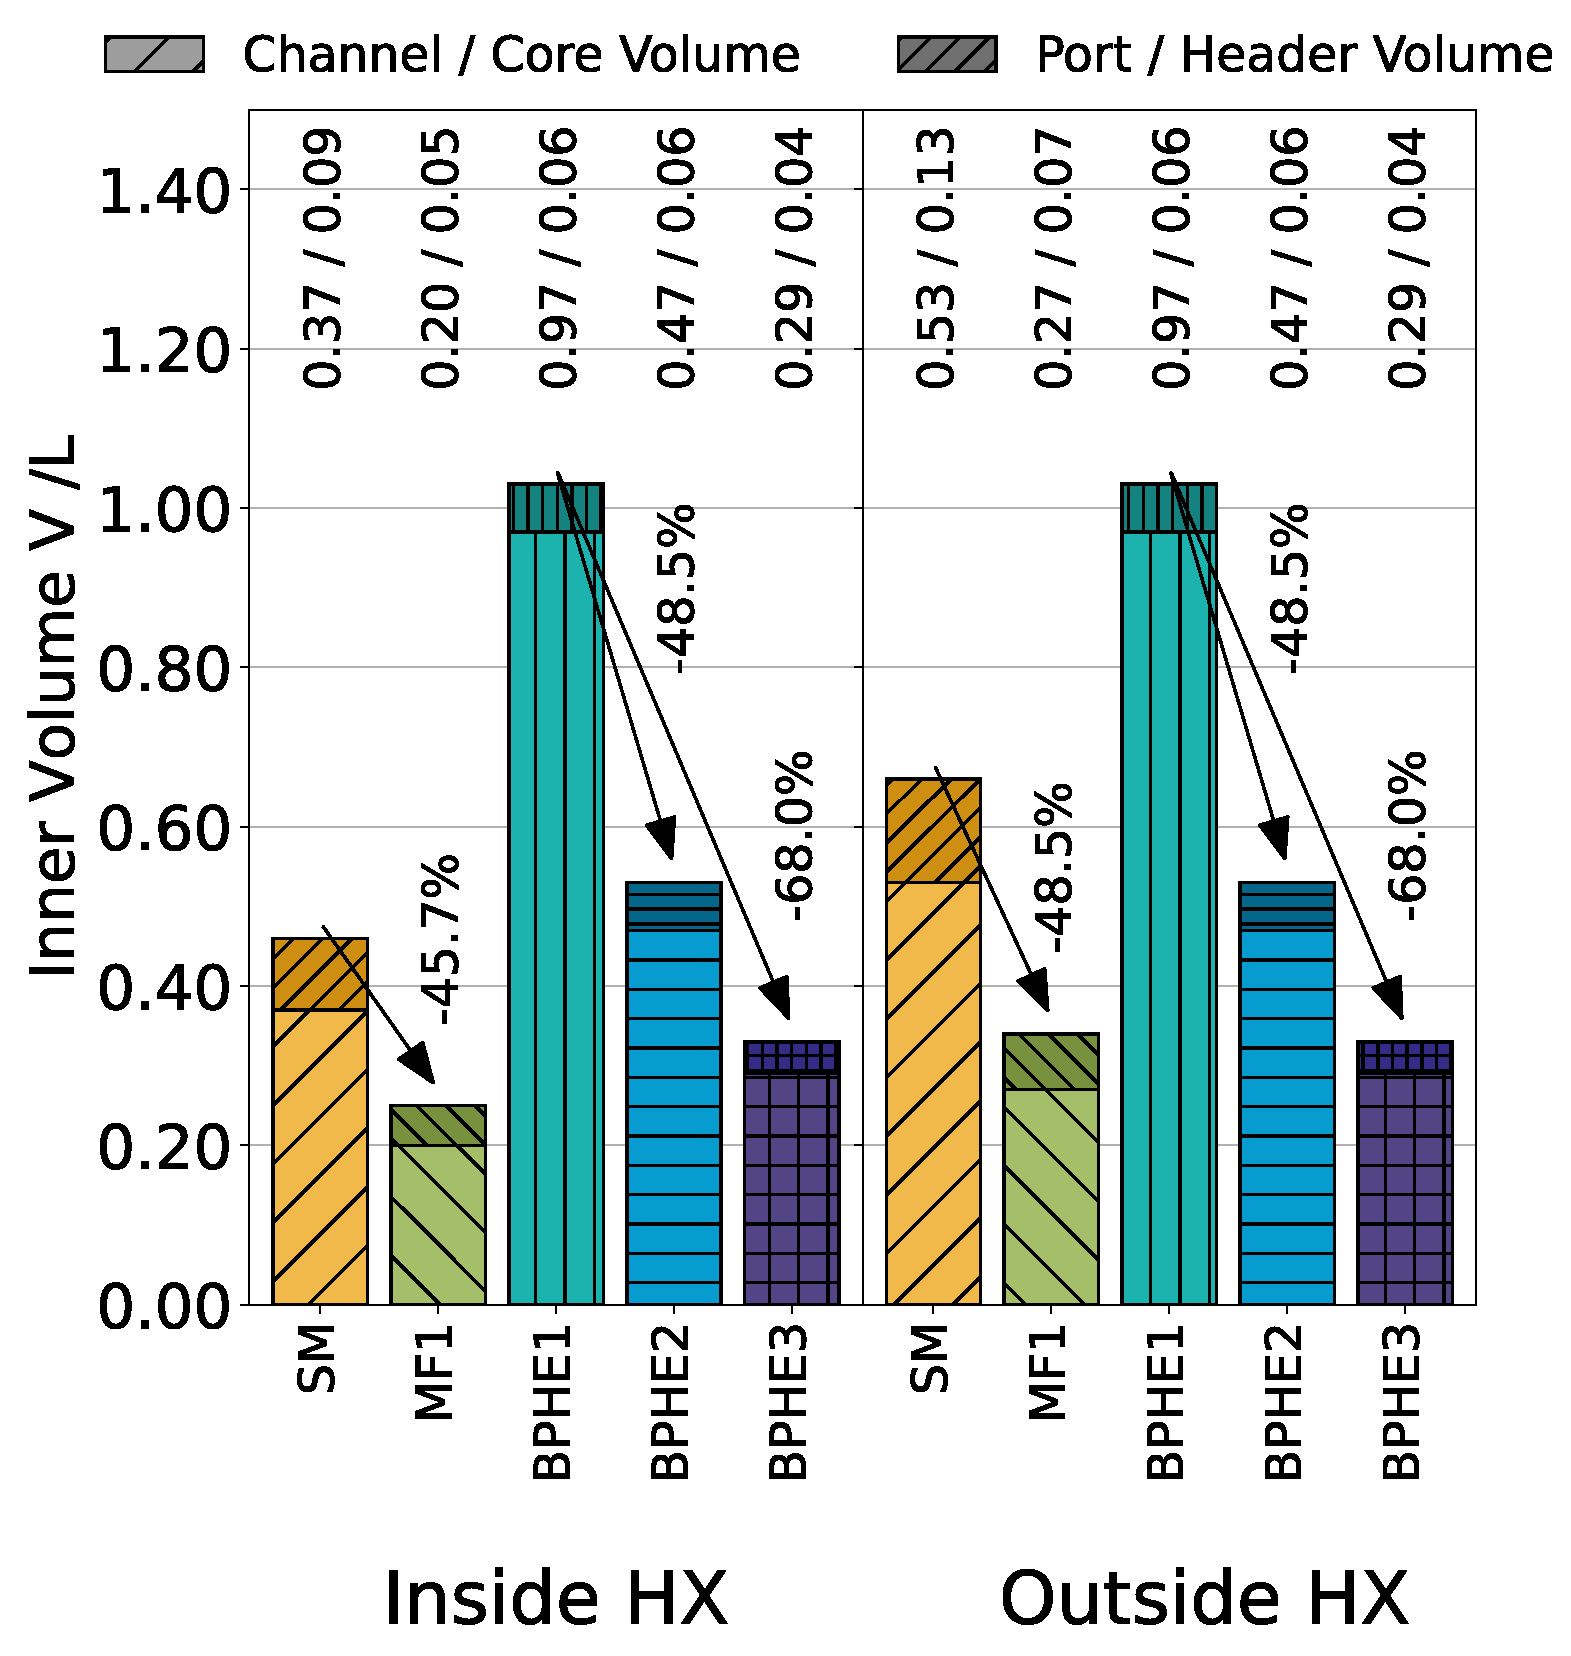
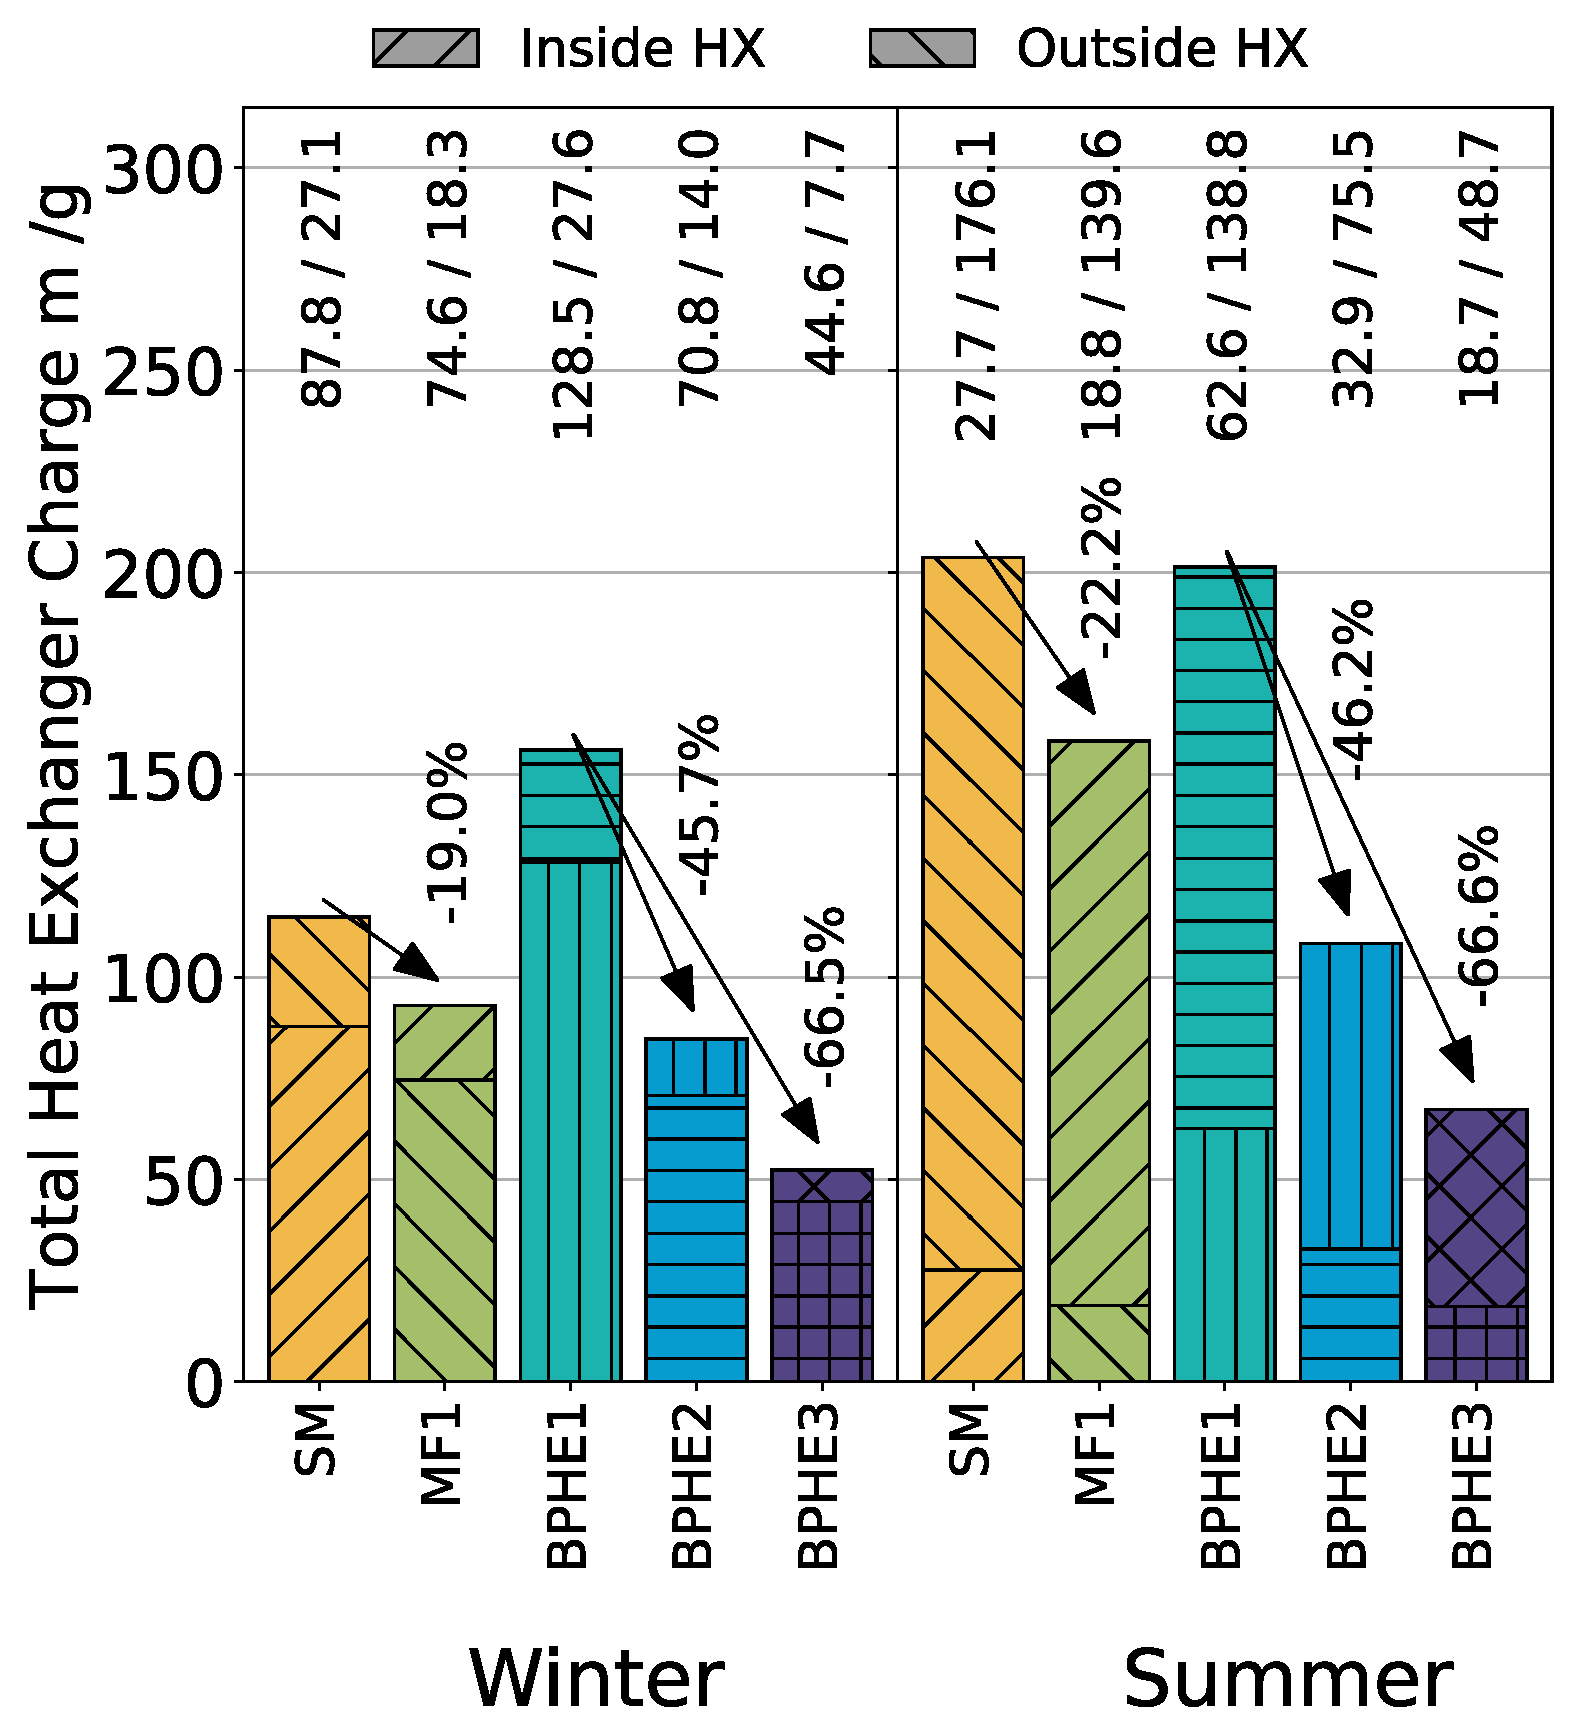
The capacities, saturation pressures and saturation temperatures for both system are shown in Figure 6, Figure 7 and Figure 8. For System A, HXSim calculates each heat exchanger separately and needs to manually balance parameters such as mass flow between the indoor and outdoor units. This limits the control over the design parameters such that reaching identical conditions between the MF tube and smooth tube design was not possible. The differences in these parameters were not significant, nevertheless Figure 6 shows the deviation from the design parameter for capacity while Figure 7 and Figure 8 visualize the disparity of saturation temperature in the two tested systems. System A was designed with the goal of charge reduction in heat exchangers, thus the saturation temperatures were chosen to give the maximum reasonable temperature difference between the fluid and the air, additionally this provides a chance to compare the charges in systems on a more equitable basis in relation to efficiency of the system. For System B all calculated capacities match the design capacity, the deviation in the saturation pressure and saturation temperatures are very small and result from a changed thermal transmittance, which is best in BPHE2. Qualitatively, the results for summer and winter conditions are identical.

4.3. Charge

Figure 9 shows the charge distribution in the heat exchangers in winter conditions (Heating mode) and summer conditions (air conditioning mode) for both fin-and-tube heat exchangers (System A) and the plate heat exchangers (System B). The charge required for other components and dissolved in the oil was not the focus of this study and thus has not been discussed. The simulation results show that the configuration with BPHE1 requires the largest amount of refrigerant followed by the configuration with a fin-and-tube heat exchanger with smooth tubes (SM). The fin-and-tube heat exchanger with microfinned tubes (MF1) and BPHE2 need a comparable amount of refrigerant while MF1 requires less charge inside the core but more in the header, only for the summer condition the outside unit requires a much higher amount of refrigerant. BPHE3 required the lowest charge for all conditions. All condensers show a considerably higher charge for the header and core than the evaporators resulting from the presence of completely liquefied refrigerant. The summer condition requires a higher charge for all compared systems than winter condition because of higher saturation pressures in both evaporator and condenser leading to a higher vapour density, a lower inlet quality and a lower density ratio of the gaseous and liquid refrigerant. For System A the different heat exchanger designs of the inside and outside unit affects the charge additionally. For System A, in summer conditions, microfinned tube (MF1) yield a higher HTC; thus, the circuit length is substantially reduced compared to smooth tubes (SM). However, in order to compensate for the resistance on the airside, more parallel circuits are required. The longer header section required for the larger number of parallel circuits holds a high amount of charge. This is because in the evaporator, the inlet header has the lowest vapor quality and thus the lowest void fraction. Since most of the charge is in the liquid phase, the evaporator’s inlet header can contain a considerable amount of charge, leading to a diminishing effect of charge reduction of microfinned tubes. Correspondingly for the condenser, the outlet header is a subcooled fluid with the highest density and, therefore, the mass. The charge distribution for System A in winter conditions follows the same pattern as summer conditions. The lower condenser charge in winter condition compared to summer condition seems to result from the higher number of fins on the airside for the inside unit and the resulting heat flux increase. Thus, the air can remove more heat from the same length of the tube. For System B the required charge for the configurations with BPHE2 and BPHE3 compared to BPHE1 are reduced by 45% to 49% and 65% to 72%, respectively. These values are similar to the reduction of the inner volume (Figure 10). The logarithmic mean temperature difference (LMTD) for BPHE2 compared to BPHE1 is approximately the same as the heat transfer coefficient rises on both sides and the heat transfer area reduces. For BPHE3 both heat transfer area and heat transfer coefficient are reduced compared to BPHE2 leading in a 60–70% higher LMTD. For all configurations the pressure drop on the refrigerant side is negligible but for the secondary fluids’ side the pressures drop in BPHE2 and BPHE3 can be up to 50 k Pa which can be considered excessive. This is the problem of the symmetrical plate pattern and is already solved by using asymmetrical plate patterns which provide an increased cross sectional area for the secondary fluid and thus reduced velocities and pressure drops.
The inner volume and total charge of the different configurations for both systems are shown in Figure 10 and Figure 11. For System A, microfinned tubes reduced the charge by 19% for winter and 22% for summer conditions. While the reduction in charge is notable, the increase of the charge in the header (up to 11% for winter inside HX) and a slight reduction in capacity in some cases reduce the benefit of utilizing microfinned tubes. The reduction of volume for plate heat exchanger seems to translate to the same level of reduction in charge. BPHE2 configuration has a reduced volume of 48% and the configuration with BPHE3 has a reduced volume of 68% compared to a configuration utilizing BPHE1 as condenser and evaporator. While different parameters such as high inlet mass fraction, higher mass flux, increased density ratio between gaseous and liquid phase and reduced pressure lead to a charge reduction but the defining parameter for charge reduction seems to be the reduction of the inner volume. Similar to System A, the required charge for all configurations in the summer condition in System B exceeds the winter condition charge. The main increase charge seems to be in the evaporator were a lower inlet quality and a higher pressure, lead to increased vapor phase density.

4.4. System Effectiveness

The performance indicators coefficient of performance (COP for winter) and energy efficiency ratio (EER for summer) of all systems was calculated in summer and winter conditions considering isentropic efficiency of 0.82 to 0.86 for System A and 0.85 for System B. For System A, no heat loss in compressor was assumed. Additionally the ventilator energy consumption was not included in the calculations. For system B, the pumps (assumed efficiency: 70%) with additional pressure losses in the brine circuit and water circuit of 30 k Pa and 20 k Pa , respectively, inverter and motor losses (assumed efficiency: 90%) and energy consumption of the ventilator of the brine-to-air heat exchanger of 100 W have been taken into account for the performance calculation. Defrost cycles have been neglected. The performance indicators for each condition can be formulated as:
C O P = Q H e a t i n g W C o m p · 1 / η C o m p + W P u m p s · 1 / η P u m p s
E E R = Q C o o l i n g W C o m p · 1 / η C o m p + W P u m p s · 1 / η P u m p s
The performance indicators of the different systems are visualized in Figure 12. Because of the slightly higher pressure ratio between condensation and evaporation. Nevertheless, as the saturation temperatures chosen for the System A are close to saturation temperatures of the System B, performance of both systems are similar. System B using plate heat exchangers manages to achieve a slightly higher performance than System A using fin-and-tube heat exchangers. In fin-and-tube heat exchangers, the smooth tube has a slightly higher performance, especially in summer because of the lower condensation saturation temperature. As for the plate heat exchangers, BPHE3 performs slightly worse than the other plate heat exchangers which is again caused by the slight variation in saturation temperatures.

5. Conclusions

This article numerically studies two different charge reduction methods for a reversible air conditioning/ heat pump system using propane (R290) as working fluid. Heating and cooling capacities were 8 k W and 5 k W , respectively. A direct system with fin-and-tube heat exchanger, System A, is compared with an indirect system using brazed plate heat exchangers, System B. System A is designed with tubes with smooth internal surface and with microfinned tubes. System B was simulated with three brazed plate heat exchangers with different internal volumes. System A was simulated with HXSim, an in-house built code, while simulation of System B was performed with IMST-ART. The refrigerant charge is primarily influenced by the inner volume. Microfinned tubes in System A (Fin-and-tube) compared to the smooth tube resulted in a maximum charge reduction and volume reduction of 22% of 48%, respectively. For System B, using specially designed BPHE with the minimum internal volume, these values were 66% and 68%, respectively. In general, the charge can be reduced more aggressively using BPHE with a smaller internal volume. Other parameters such as higher mass flux seem to reduce the charge, albeit to a lesser extent. The charge reduction by using microfinned tubes in System A (Fin-and-tube) heat exchangers is negated by the increase in the volume and, consequently, the header’s charge (up to 11%). System B achieve a higher COP than System A in winter conditions (System A 2.6, System B 3.1) and similar values in summer conditions (System A 4.9, System B 4.9). COP is reduced by microfinned tubes in System A (up to 9%) and specially designed BPHE in System B (up to 10.8%). This is most notable in summer conditions. Both systems provide a possibility of charge reduction or capacity increase in RACHP equipment. Effects such as maldistribution and other components of a functional system such as liquid line have not been considered in this study which could have a considerable effect on the charge of the system. Simulation of these parameters was not possible with the used simulation tools and requires further studies. Moreover, cost analysis between two systems can be suggested for further research.

Author Contributions

Conceptualization, E.A., T.W., A.H., T.M.E. and Á.Á.P.; methodology, E.A, T.W. and Á.Á.P.; software, G.S., E.A., T.W.; validation, E.A, T.W.; formal analysis, E.A., T.W. and Á.Á.P.; investigation, E.A., T.W. and Á.Á.P.; resources, G.S., A.H., T.M.E.; data curation, G.S., E.A., T.W. and Á.Á.P.; writing—original draft preparation, E.A., T.W. and Á.Á.P.; writing—review and editing, E.A. and Á.Á.P.; visualization, E.A.; supervision, A.H., L.S., T.M.E.; project administration, A.H., T.M.E.; funding acquisition, A.H., T.M.E. All authors have read and agreed to the published version of the manuscript.

Funding

This publication has been funded by HighEFF—Centre for an Energy Efficient and Competitive Industry for the Future, an 8-years’ Research Centre under the FME-scheme (Centre for Environment-friendly Energy Research, 257632). The authors gratefully acknowledge the financial support from the Research Council of Norway and user partners of HighEFF.

Institutional Review Board Statement

Not applicable.

Informed Consent Statement

Not applicable.

Data Availability Statement

Not applicable.

Conflicts of Interest

The authors declare no conflict of interest.

Nomenclature

Greek
β Spiral angle
δ 30 Percentage of predicted values with less than 30% error
η Efficiency
γ Fin angle
Roman
BPHEBrazed plate heat exchangers [-]
COPCoefficient of Performance [-]
d i Fin tip diameter for MF tubes, internal diameter for smooth tube [mm]
d o Outer diameter [mm]
EEREnergy Efficiency Ratio [-]
hEnthalpy [kJ kg 1 ]
HTCHeat Transfer Coefficient [kWm 2 K 1 ]
l f Fin height [mm]
mRefrigerant mass [g]
nNumber of fins [-]
pPressure [Pa]
P r Refrigerants side heat exchange perimeter [m]
QCapacity [kW]
qHeat flux [kWm 2 ]
R x Heat exchange area ratio of a MF tube to a smooth tube [-]
SMSmooth tube [-]
TTemperature [°C]
t w Wall thickness [mm]
U r Refrigerants overall heat transfer coefficient [kWm 2 K 1 ]
WPower [W]
xVapor quality [-]
zLength of tube simulated [m]
Subscripts
s a t Saturated condition

References

  1. Schulz, M.; Kourkoulas, D. Regulation (EU) No 517/2014 of The European Parliament and of the council of 16 April 2014 on fluorinated greenhouse gases and repealing Regulation (EC) No 842/2006. Off. J. Eur. Union 2014, 2014, L150. [Google Scholar]
  2. Straub, M. Alternative Refrigerants For Household Refrigerators Alternative Refrigerants For Household Refrigerators. Int. Refrig. Air Cond. 2018, 2002, 1–10. [Google Scholar]
  3. Mota-Babiloni, A.; Makhnatch, P. Predictions of European refrigerants place on the market following F-gas regulation restrictions. Int. J. Refrig. 2021, 127, 101–110. [Google Scholar] [CrossRef]
  4. Tang, W.; He, G.; Zhou, S.; Sun, W.; Cai, D.; Mei, K. The performance and risk assessment of R290 in a 13 kW air source heat pump. Appl. Therm. Eng. 2018, 144, 392–402. [Google Scholar] [CrossRef]
  5. Palm, B. Hydrocarbons as refrigerants in small heat pump and refrigeration systems—A review. Int. J. Refrig. 2008, 31, 552–563. [Google Scholar] [CrossRef]
  6. Li, T.; Lu, J.; Chen, L.; He, D.; Qiu, X.; Li, H.; Liu, Z. Measurement of refrigerant mass distribution within a R290 split air conditioner. Int. J. Refrig. 2015, 57, 163–172. [Google Scholar] [CrossRef]
  7. Andersson, K.; Granryd, E.; Palm, B. Water to water heat pump minimum charge of propane. In Proceedings of the 13th IIR Gustav Lorentzen Conference on Natural Refrigerants (GL2018), Valencia, Spain, 18–20 June 2018. [Google Scholar] [CrossRef]
  8. Dankwerth, C.; Methler, T.; Oltersdorf, T.; Peter, S.; Marek, M.; Schnabel, L. Entwicklung einer Propan-Wärmepumpe mit einer Kältemittelfüllmenge von 150 Gramm. DKV-Tagungsband 2019, 2019, 60–61. [Google Scholar]
  9. Dankwerth, C.; Methler, T.; Oltersdorf, T.; Schossig, P.; Schnabel, L. Kältemittelreduktion in Propan-Wärmepumpen—Aktuelle Arbeiten. DKV-Tagungsband 2020, 2020, 70. [Google Scholar]
  10. Allymehr, E.; Pardiñas, Á.Á.; Eikevik, T.M.; Hafner, A. Characteristics of evaporation of propane (R290) in compact smooth and microfinned tubes. Appl. Therm. Eng. 2020, 181, 115880. [Google Scholar] [CrossRef]
  11. Allymehr, E.; Pardiñas, Á.Á.; Eikevik, T.M.; Hafner, A. Condensation of Hydrocarbons in Compact Smooth and Microfinned Tubes. Energies 2021, 14, 2647. [Google Scholar] [CrossRef]
  12. Allymehr, E.; Pardiñas, Á.Á.Á.; Eikevik, T.M.T.; Hafner, A. Comparative analysis of evaporation of Isobutane (R600a) and Propylene (R1270) in compact smooth and microfinned tubes. Appl. Therm. Eng. 2021, 188, 116606. [Google Scholar] [CrossRef]
  13. CEN. Air Conditioners, Liquid Chilling Packages and Heat Pumps for Space Heating and Cooling and Process Chillers Using Electrically Driven Compressors—Part 1: Terms and Definitions; DIN EN 14511-1:2015-12; DIN Standards Committee Refrigeration Technology: Berlin, Germany, 2015. [Google Scholar]
  14. CEN. Air Conditioners, Liquid Chilling Packages and Heat Pumps, with Electrically Driven Compressors, for Space Heating and Cooling–Testing and Rating at Part Load Conditions and Calculation of Seasonal Performance; DIN EN 14825:2016-10; DIN Standards Committee Refrigeration Technology: Berlin, Germany, 2016. [Google Scholar]
  15. Thulukkanam, K. Heat Exchanger Design Handbook; CRC Press: Boca Raton, FL, USA, 2013. [Google Scholar]
  16. Dović, D.; Palm, B.; Švaić, S. Generalized correlations for predicting heat transfer and pressure drop in plate heat exchanger channels of arbitrary geometry. Int. J. Heat Mass Transf. 2009, 52, 4553–4563. [Google Scholar] [CrossRef]
  17. Piper, M.; Olenberg, A.; Tran, J.M.; Kenig, E.Y. Determination of the geometric design parameters of pillow-plate heat exchangers. Appl. Therm. Eng. 2015, 91, 1168–1175. [Google Scholar] [CrossRef]
  18. VDI Verein Deutscher Ingenieure, e.V. VDI-Wärmeatlas; Springer GmbH: Berlin/Heidelberg, Germany, 2013. [Google Scholar]
  19. Skaugen, G. Simulation of extended surface heat exchangers using CO2 as refrigerant. In Proceedings of the 4th IIR-Gustav Lorentzen Conference on Natural Working Fluids, West Lafayette, IN, USA, 25 –28 July 2000; pp. 306–314. [Google Scholar]
  20. Pettersen, J.; Hafner, A.; Skaugen, G.; Rekstad, H. Development of compact heat exchangers for CO2 air-conditioning systems. Int. J. Refrig. 1998, 21, 180–193. [Google Scholar] [CrossRef]
  21. Liu, Z.; Winterton, R.H. A general correlation for saturated and subcooled flow boiling in tubes and annuli, based on a nucleate pool boiling equation. Int. J. Heat Mass Transf. 1991, 34, 2759–2766. [Google Scholar] [CrossRef]
  22. Dorao, C.A.; Fernandino, M. Simple and general correlation for heat transfer during flow condensation inside plain pipes. Int. J. Heat Mass Transf. 2018, 122, 290–305. [Google Scholar] [CrossRef]
  23. Rollmann, P.; Spindler, K. A new flow pattern map for flow boiling in microfin tubes. Int. J. Multiph. Flow 2015, 72, 181–187. [Google Scholar] [CrossRef]
  24. Cavallini, A.; Del Col, D.; Mancin, S.; Rossetto, L. Condensation of pure and near-azeotropic refrigerants in microfin tubes: A new computational procedure. Int. J. Refrig. 2009, 32, 162–174. [Google Scholar] [CrossRef]
  25. Xu, Y.; Fang, X. A new correlation of two-phase frictional pressure drop for evaporating flow in pipes. Int. J. Refrig. 2012, 5, 2039–2050. [Google Scholar] [CrossRef]
  26. Diani, A.; Mancin, S.; Rossetto, L. R1234ze(E) flow boiling inside a 3.4 mm ID microfin tube. Int. J. Refrig. 2014, 47, 105–119. [Google Scholar] [CrossRef]
  27. Granryd, E. Forced Convection Heat Transfer and Pressure Drop in Tube- in-Fin Heat Exchangers. Licentiate Thesis, Kungliga Tekniska Högskolan, Stockholm, Sweden, 1964. [Google Scholar]
  28. Verma, P.; Bullard, C.W.; Hrnjak, P.S. Design Tool for Display Case Heat Exchanger Frosting and Defrosting; Technical Report TR-201; Air Conditioning and Refrigeration Center, College of Engineering, University of Illinois at Urbana-Champaign: Urbana, IL, USA, 2002. [Google Scholar]
  29. Lindqvist, K.; Skaugen, G.; Meyer, O.H.H. Plate fin-and-tube heat exchanger computational fluid dynamics model. Appl. Therm. Eng. 2021, 189, 116669. [Google Scholar] [CrossRef]
  30. Shah, M.M.; Siddiqui, M.A. A General Correlation for Heat Transfer During Dispersed-Flow Film Boiling in Tubes. Heat Transf. Eng. 2000, 21, 18–32. [Google Scholar] [CrossRef]
  31. IMST-ART. Simulation Tool to Assist the Selection, Design and Optimization Of Refrigerator Equipment and Components; Institute for Energy Engineering, Universitat Politècnica de València: Valencia, Spain, 2010. [Google Scholar]
  32. Cooper, A.; Dennis Usher, J. 3.7 Plate Heat Exchangers: 3.7.5 Heat Transfer Correlations. In Heat Exchanger Design Handbook; VDI Verein Deutscher Ingenieure e.V., Ed.; Hemisphere Publishing Corporation: London, UK, 1983. [Google Scholar]
  33. Crisholm, D. A theoretical basis for the Lockhart-Martinelli correlation for two-phase flow. Int. J. Heat Mass Transf. 1972, 10, 1767–1778. [Google Scholar] [CrossRef]
Figure 1. Overview of the tested systems. System A: direct system with fin-and-tube heat exchangers, System B: indirect system with plate heat exchangers and intermediate brine and water loops.
Energies 14 04480 g001
Figure 2. Physical presentation of the geometrical parameters.
Energies 14 04480 g002
Figure 3. Cross sectional view of the microfinned tubes.
Energies 14 04480 g003
Figure 4. Brazed plate heat exchanger Geometry: (a) General parameters (b) Plate design of a sinodial herringbone-type plate (c) Side view of a symmetrical pattern (d) Side view of an asymmetrical pattern.
Energies 14 04480 g004
Figure 5. Heat transfer coefficients based on correlation of two-phase flow (x < 1) and single phase vapour flow (x > 1) (blue) and smoothing function at dry-out region (0.8 < x < 1.1) for HXSim program.
Energies 14 04480 g005
Figure 6. Designed capacity and the actual capacity of the systems simulated.
Energies 14 04480 g006
Figure 7. Saturation pressure of the designed systems.
Energies 14 04480 g007
Figure 8. Saturation temperature of the designed systems.
Energies 14 04480 g008
Figure 9. Charge distribution for all tested heat exchangers, numbers on top of figure show the charge for channel/core and port/header.
Energies 14 04480 g009
Figure 10. Total inner volume of the heat exchangers, numbers on top of figure show the volume for channel/core and port/header.
Energies 14 04480 g010
Figure 11. Total charge of the heat exchangers, numbers on top of figure shows the charge for inside/outside heat exchangers.
Energies 14 04480 g011
Figure 12. Coefficient of performance (COP for winter) and energy efficiency ratio (EER for summer) in different configurations.
Energies 14 04480 g012
Table 1. Parameters set based on standard DIN EN 14511 and DIN EN 14825 for summer and winter conditions.
Thermal Capacity [kW]Ambient Dry-Bulb Temperature (Wet-Bulb Temperature) [°C]Inside Dry-Bulb Temperature (Wet-Bulb Temperature) (System A) [°C]Water Temperature (System B) [°C]
Summer535 (24)27 (19)23/18
Winter8−7 (−8)20 (max. 15)30/35
Table 2. Geometrical parameters of the tubes considered.
UnitSmooth TubeMF1MF2
Outer diameter ( d o ) m m 555
Internal diameter a ( d i ) m m 4.14.324.26
Wall thickness b ( t w ) m m 0.450.220.22
Actual cross sectional area m m 2 13.215.714.8
Effective diameter c m m -4.474.34
Fin height ( l f ) m m -0.120.15
Fin number (n)[-]-3556
Fin angle ( γ ) ° -3515
Spiral angle ( β ) ° -1537
Heat exchange area ratio ( R x )[-]11.512.63
a Internal diameter for smooth tube, fin tip diameter for microfinned tubes. b Length between fin root and outer diameter. c Equivalent internal diameter for a smooth tube to have same actual cross section area.
Table 3. Set parameters for the fin-and-tube heat exchangers.
Air Side Fin Pitch [mm]Vertical Tube Pitch [mm]Fin Thickness [mm]Air Face Velocity [m s 1 ]
Inside Unit2500.0752
Outside Unit3.2500.095
Table 4. Geometry of the selected brazed plate heat exchangers.
UnitBPHE1BPHE2BPHE3
Number of Plates-403640
Heightmm471324328
Widthmm819490
Depth per platemm2.31.460.95
Inner volume (Refrigrant)L1.00.530.33
Inner Volume (Secondary Fluid)L1.10.540.34
Heat transfer area m 2 1.500.950.78
Port Diameter m m 202725
Table 5. Correlations used for prediction of two phase flow characteristics, values in parenthesis present the δ 30% for both tubes.
Evaporation ( δ 30%)Condensation ( δ 30%)
HTCSmoothLiu and Winterton [21] (100)Dorao and Fernandino [22] (100)
MFRollmann and Spindler [23] (MF1 = 100, MF2 = 66.7)Cavallini et al. [24] (MF1 = 100, MF2 = 5.4)
Δ PSmoothXu and Fang [25] (100)Xu and Fang [25] (100)
MFDiani et al. [26] (100)Diani et al. [26] (MF1 = 98, MF2 = 100)
Table 6. Geometrical design parameters of Fin-and-tube heat exchanger units.
Tube TypeUnit LocationParallel Circuits (Rows)Passes in Each CircuitTotal Heat Exchanger Tube Length [m]
Smooth (SM)Inside unit8433.6
Outside Unit18446.8
MFInside unit9217.1
Outside Unit19222.8
Publisher’s Note: MDPI stays neutral with regard to jurisdictional claims in published maps and institutional affiliations.

