1. Introduction
Global climate change caused by greenhouse gases has motivated the automobile industry to perform research on CO
2 reduction through improvements in the fuel economy of vehicles. Statistics verify the impact of automobiles on the atmosphere [
1,
2,
3]. In 2018, road transport accounted for 96.5% of the CO
2 emissions by Korea’s transportation sector, which, in turn, accounted for 15.6% of Korea’s energy sector [
4]. Urban buses are classified as mid-to-heavy duty vehicles. Mid-to-heavy duty vehicles in Korea accounted for 55% of road transport emissions in 2018 [
5], whereas the number of registered mid-to-heavy duty vehicles was approximately one-fourth that of passenger vehicles [
6]. This illustrates that, as a percentage of the total number of registered vehicles, the CO
2 emissions of mid-to-heavy duty vehicles were relatively higher than those for passenger vehicles. Therefore, a reduction in CO
2 emissions through the improvement of the fuel economy of mid-to-heavy duty vehicles can have a higher impact than a similar reduction for passenger vehicles. This study addresses the concept of eco-drive for improving the fuel economy of urban buses that have a high frequency of acceleration/deceleration and frequent operation. If the fuel economy of approximately 7400 urban buses registered in Seoul (an annual average fuel economy of 2.0 km/m
3) is improved by 10%, economic benefits of approximately KRW 23.8 billion are likely, in addition to improvements in air quality. This assumes an average daily operation of 266 km [
7] and the unit CNG (Compressed Natural Gas) price of KRW 730.
This study used machine learning to verify the contribution of items related to fuel economy. Machine learning is used in various research fields such as network security [
8], transportation engineering [
9], finance and credit rating [
10,
11], and medical science [
12] to establish a relationship between a target value (label) and a wide range of data. In the automobile industry, efforts are being undertaken to use machine learning in areas that incur substantial time and cost. For example, machine learning has been applied to safety and failure detection [
13,
14], driver classification [
15], vibration [
16], calibration [
17], and system modeling [
18], etc. In addition, the need for explainable artificial intelligence has emerged recently, and the predictive model contributions of machine learning features through SHAP (SHapley Additive exPlanations) value [
19] are being used [
20,
21]. In this study, a tool [
22] to examine the impact of the tree decision model feature is used.
Eco-drive is a widely used concept that is likely to improve fuel economy through alterations to driving behavior [
23] and gear shift strategy [
24]. In addition, to promote eco-drive, on-board display methods such as indication through eco-lamps [
25] or an indication of the degree of eco-drive by grade for a few items [
26,
27,
28] may be used. In general, these methods pass on information on eco-driving from a macroscopic perspective. Therefore, in this study, a method for quantitatively determining the driving characteristics that cause inefficient fuel consumption and the potential for improvement was investigated. Furthermore, the effectiveness was verified by the rate of improvement in fuel economy.
2. Relationship between Driving Behavior and Fuel Economy of Urban Buses
In the case of passenger vehicles, the effect of driving habits on fuel economy is widely accepted as the underlying concept of eco-drive. In particular, fuel economy can be improved using eco-drive, e.g., early gear shifting [
29,
30], inertial energy recovery driving [
31], avoiding rapid acceleration of the vehicle [
32], and calm driving [
33,
34,
35]. Through test and driving data analyses of five urban buses, the relationship between these driving behaviors and the fuel economy of urban buses classified as mid-to-heavy duty vehicles was identified.
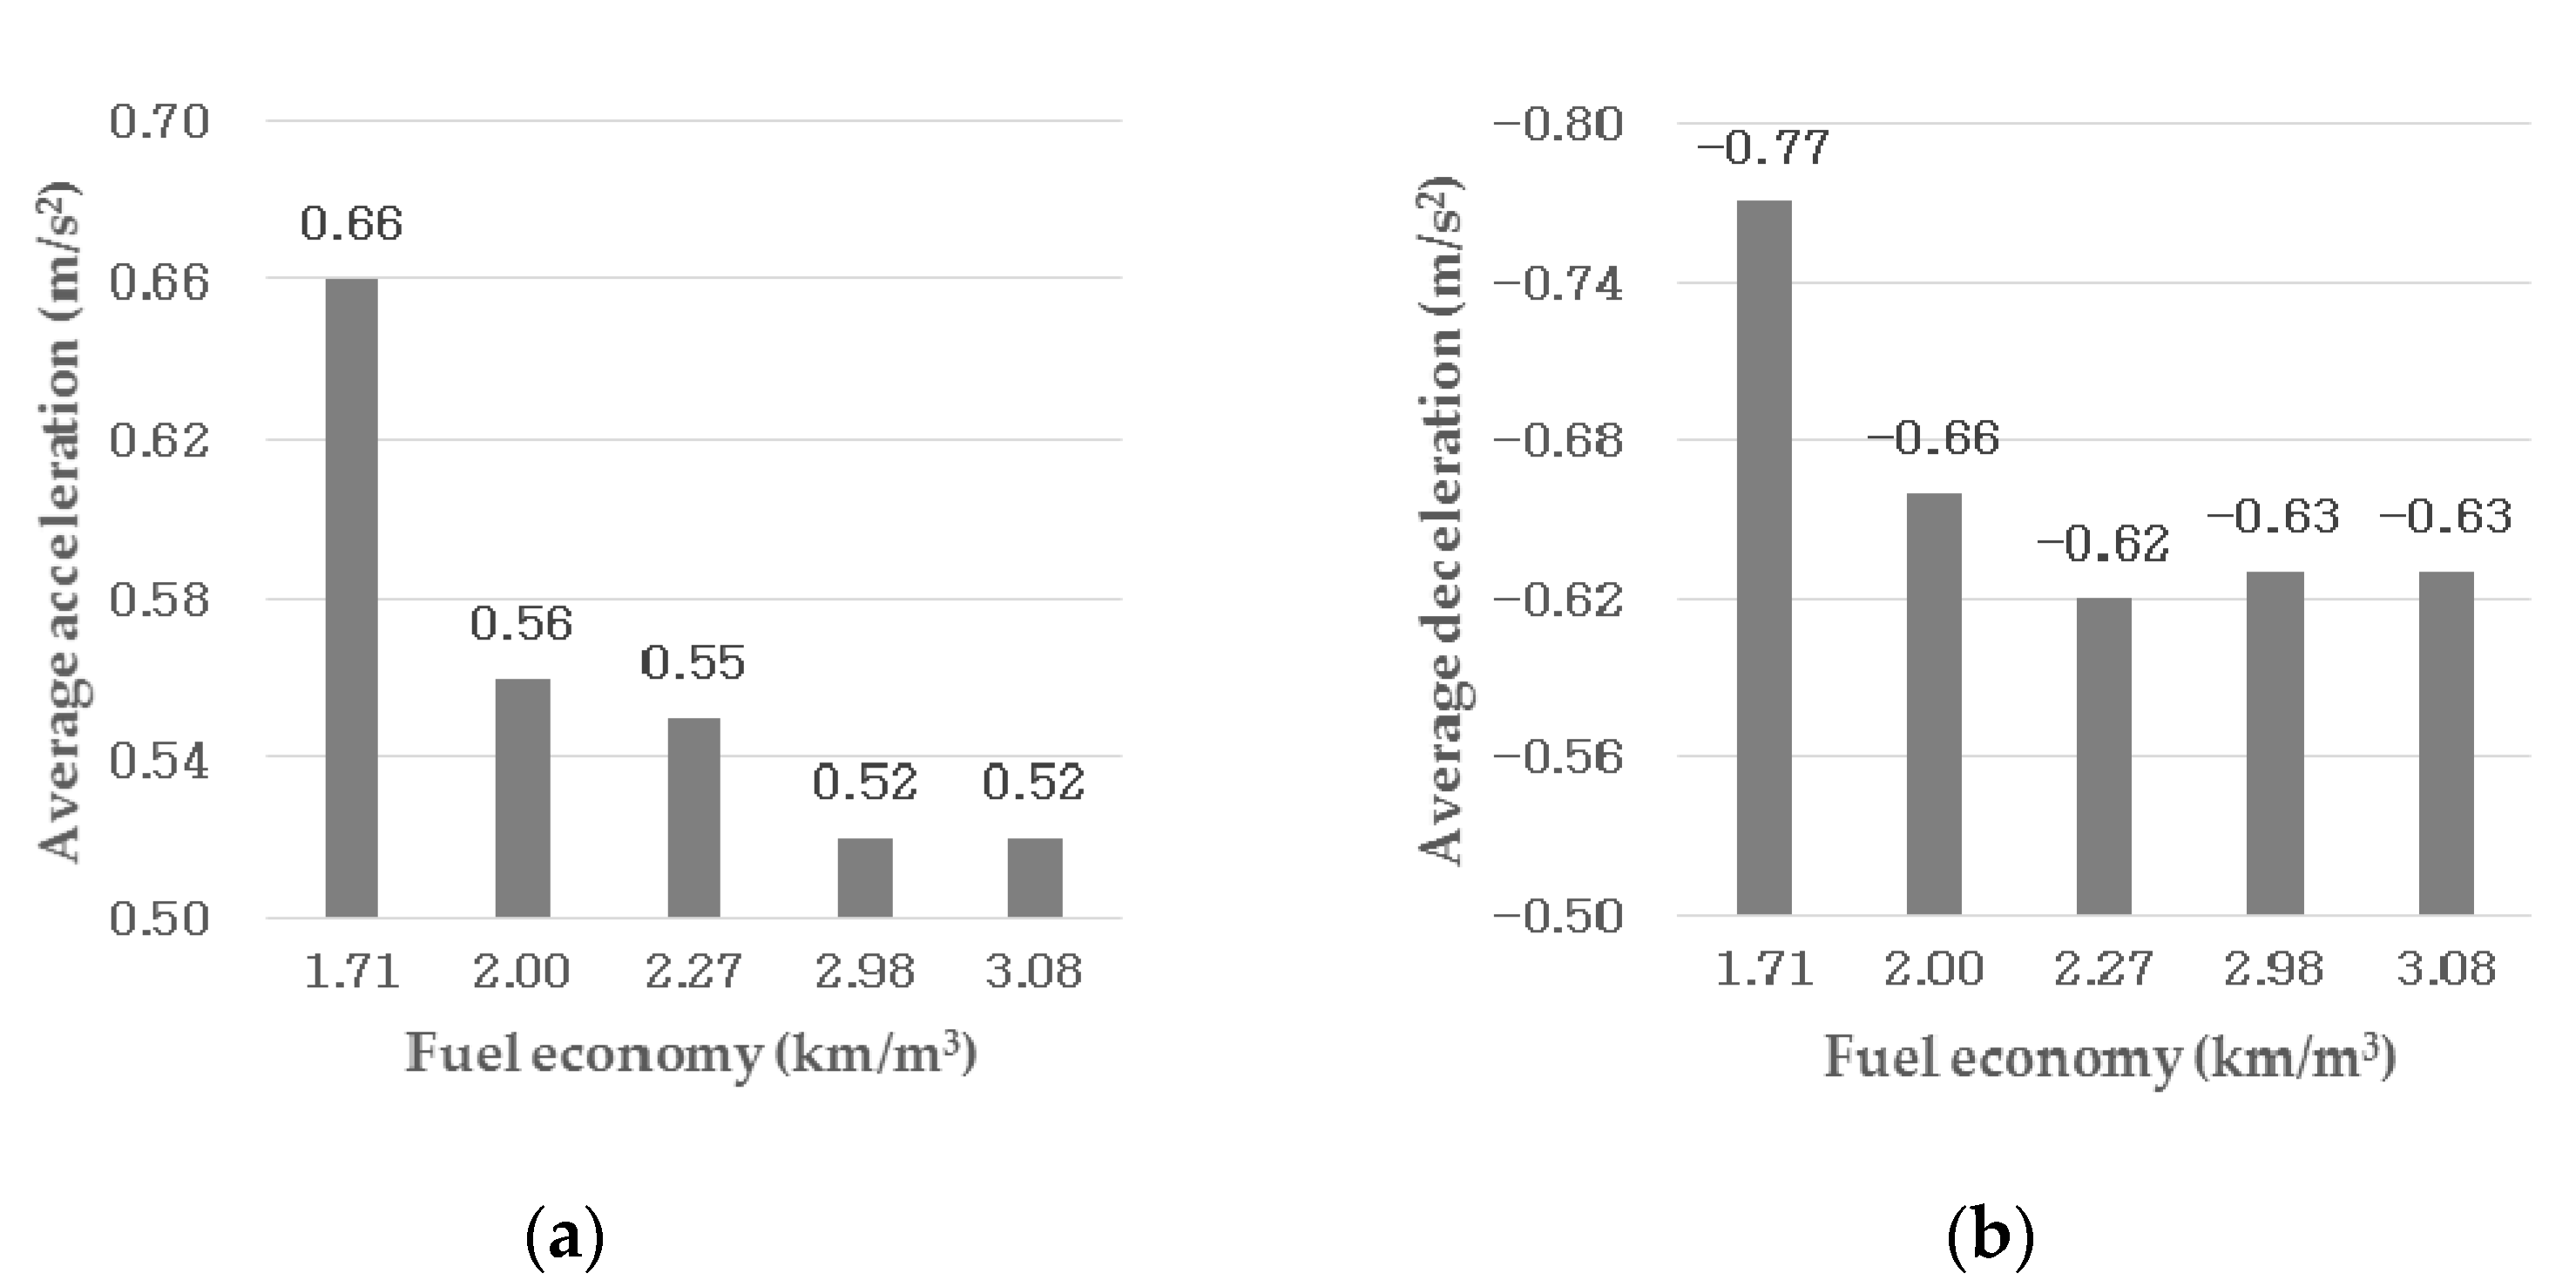
Figure 1a shows that high acceleration reduces fuel economy in urban buses in operation, and
Figure 1b shows that rapid deceleration reduces fuel economy. Acceleration is calculated using measured vehicle speed and time. It is evident that as the vehicle speed gradient becomes more intense, the fuel economy decreases.
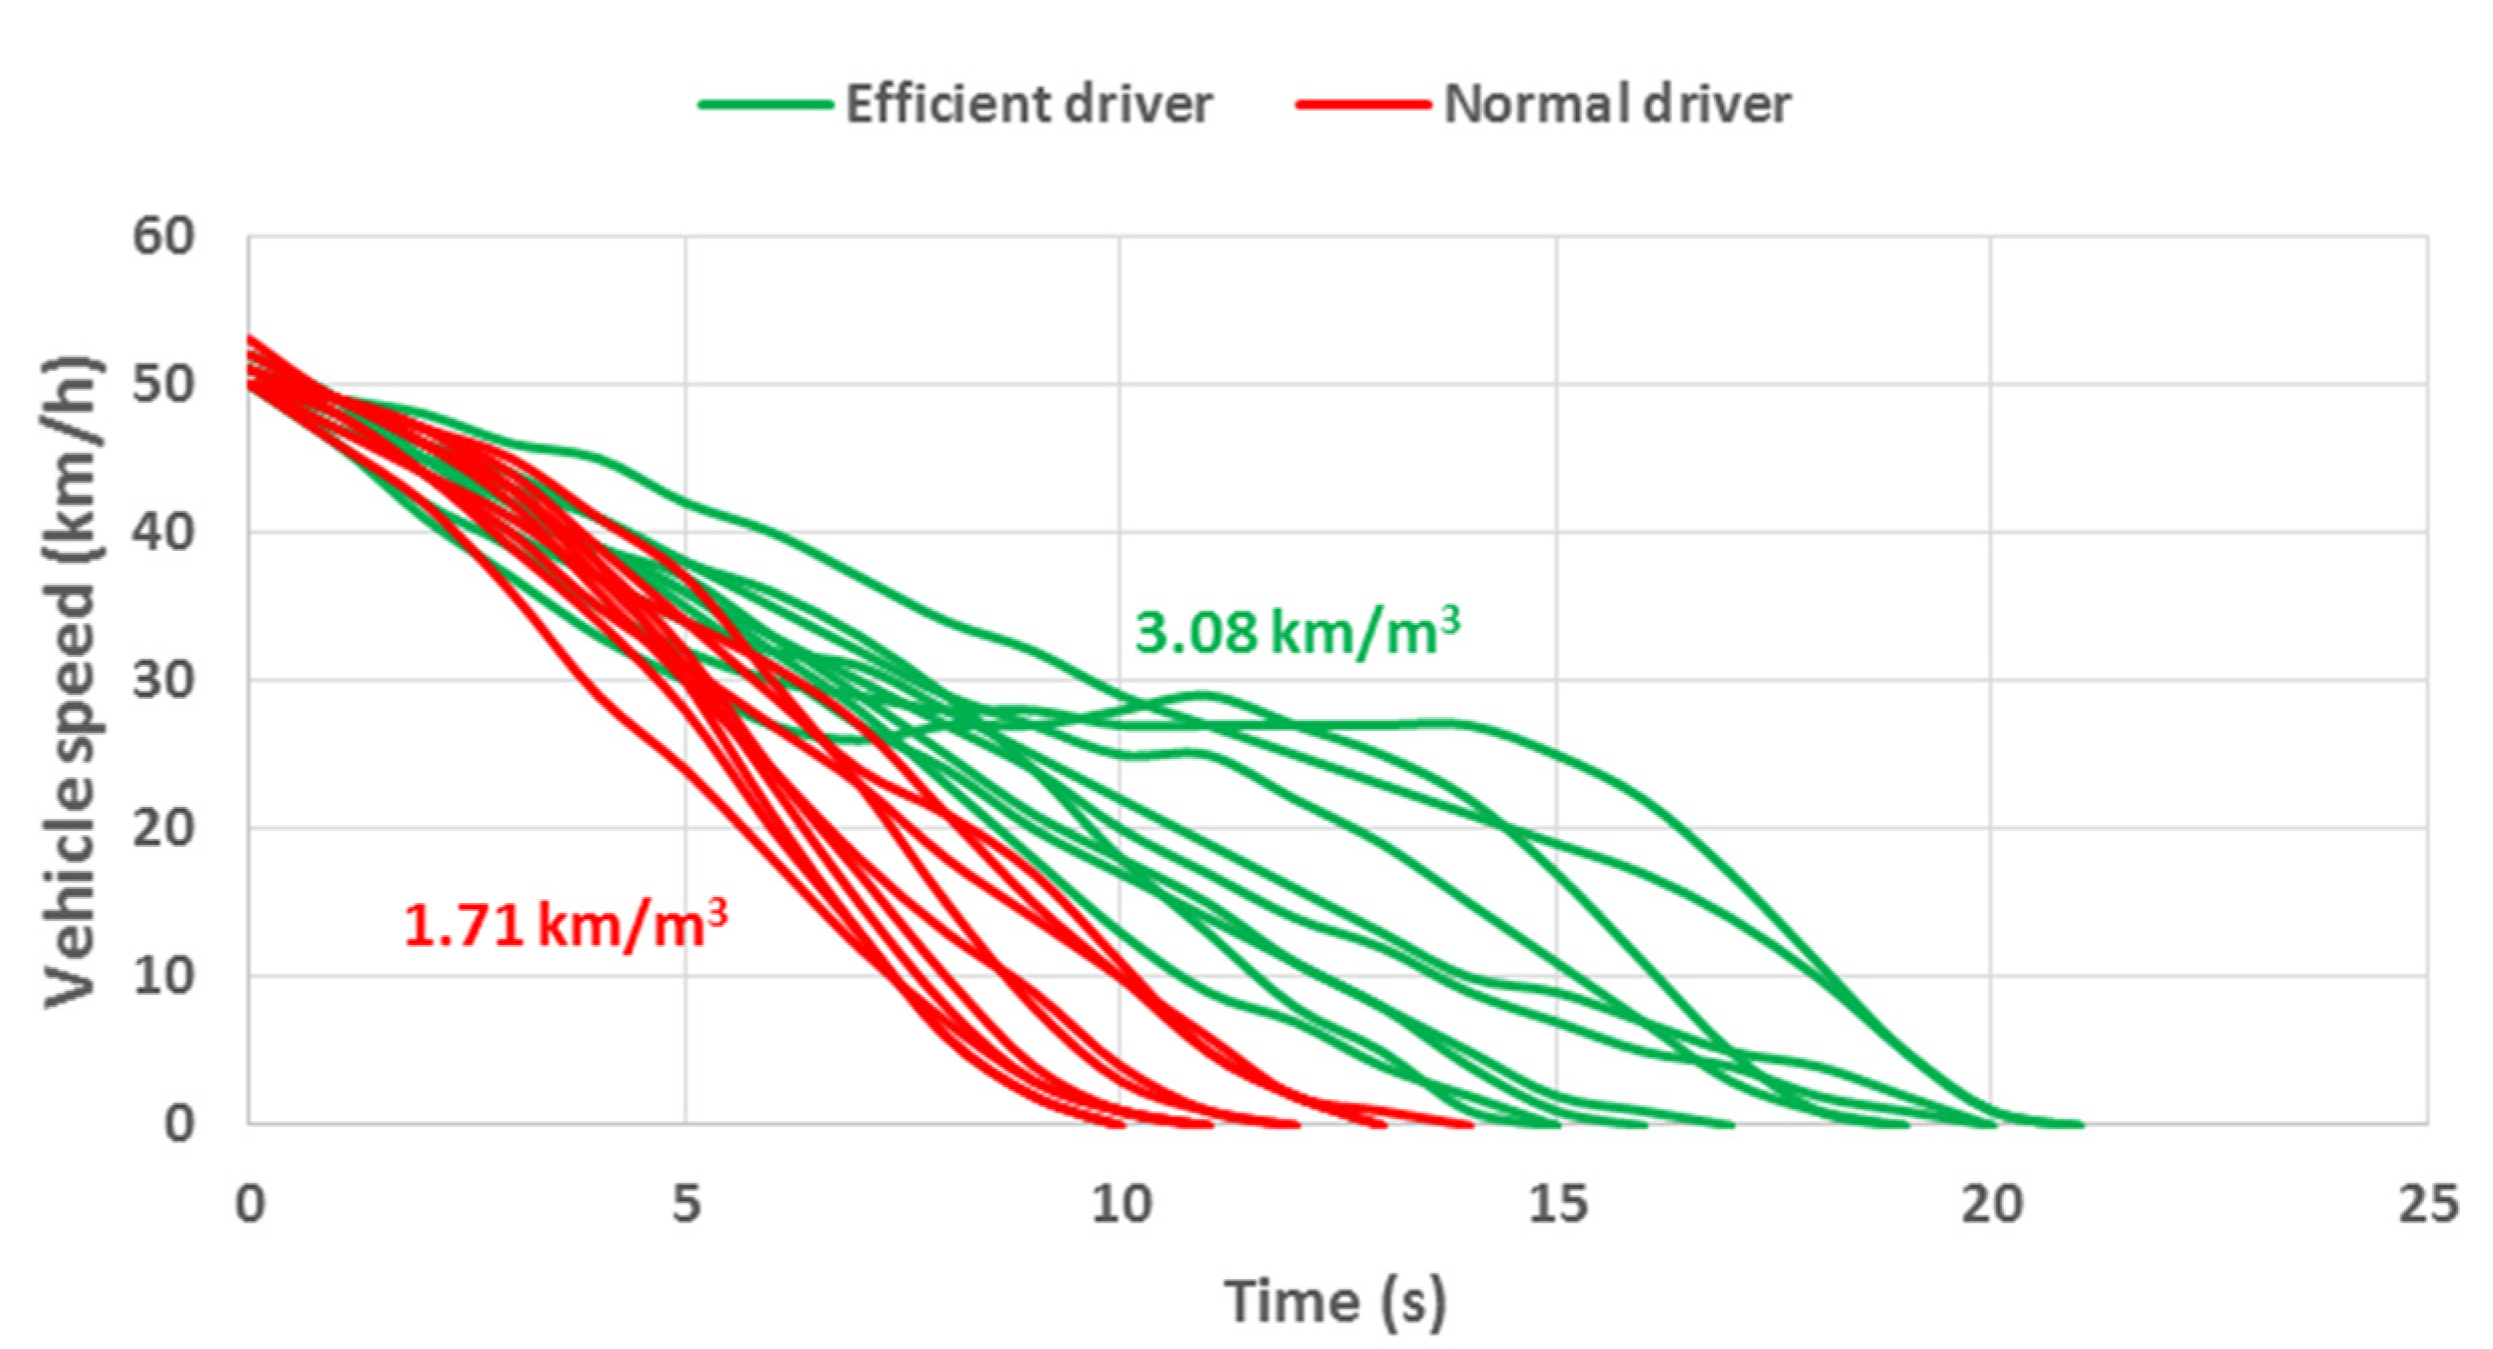
The recovery rate of inertial energy for eco-drive can be enhanced by increasing the coasting ratio during vehicle stoppage and reducing the energy consumed by the brakes. Through analyzing driving data from two different drivers, it can be shown that a fuel-efficient driver has a higher coasting ratio and gradual speed variation while stopping compared with those of a normal driver. As
Figure 2 illustrates, a fuel-efficient driver uses gentle deceleration, including coasting.
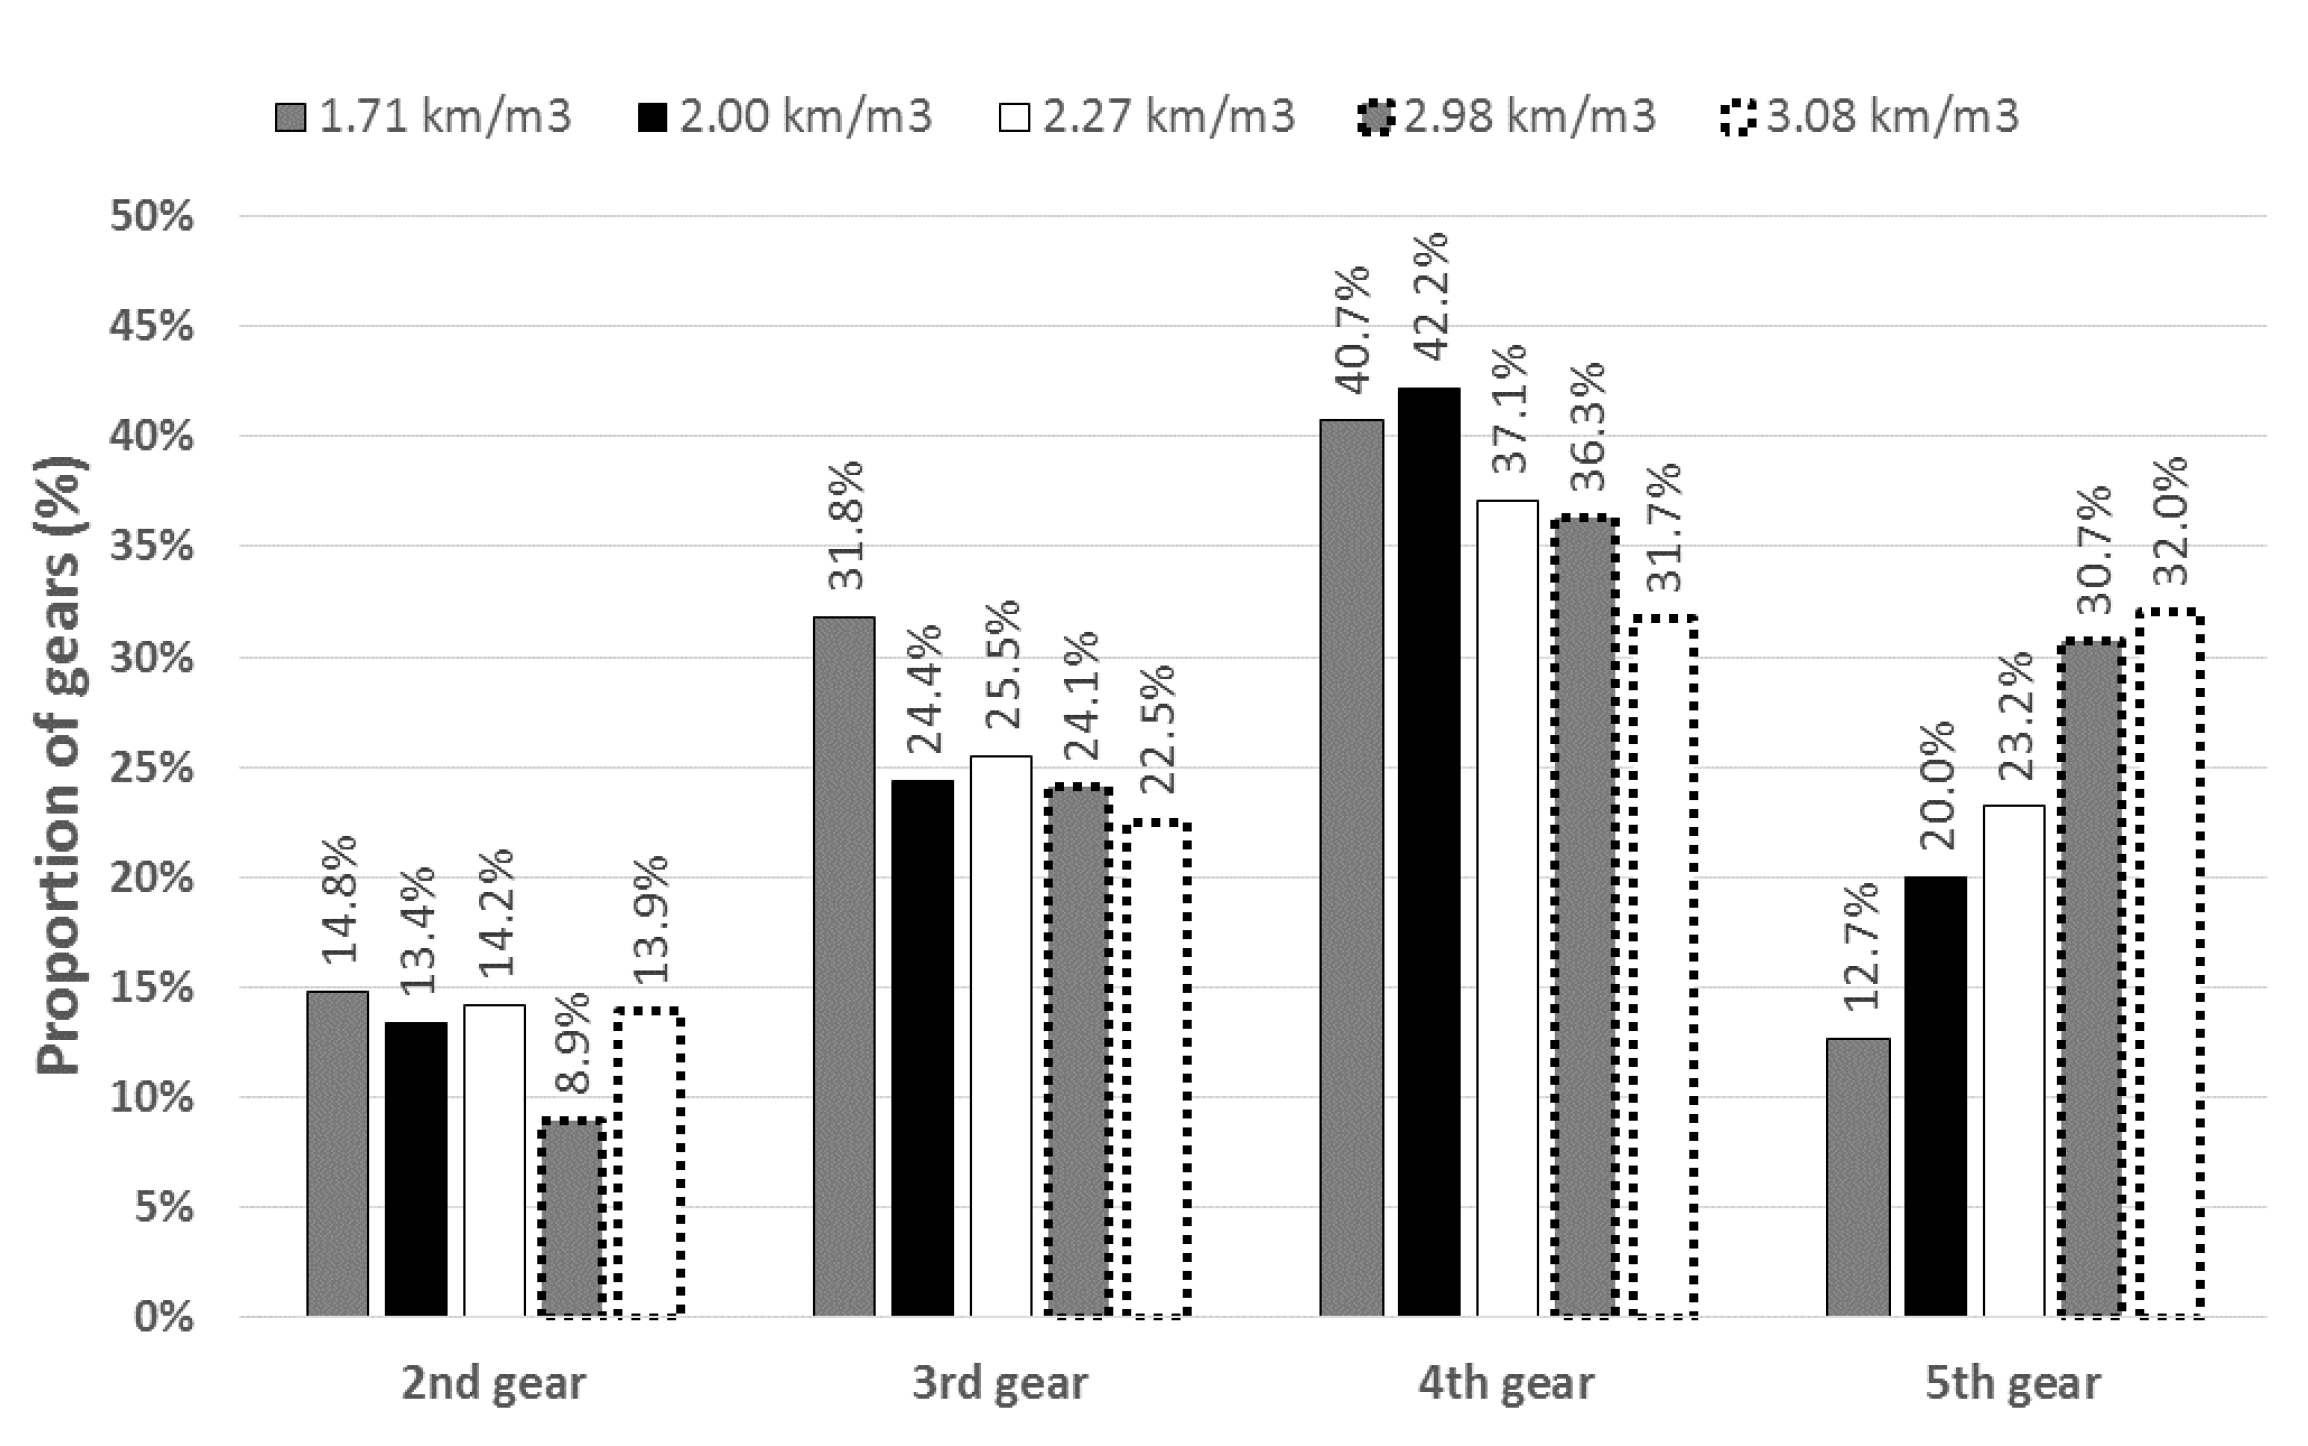
Early gear shifting is a technique wherein the shifting of gears for increasing speed while driving is performed earlier. This process induces the engine to enter the low-speed, high-load range by shifting while constant power is generated by the engine. Brake-specific fuel consumption (BSFC, g/kWh) refers to the fuel consumption per unit of engine brake power. BSFC is efficient in the low-speed, high-load range of the engine. Therefore, fuel economy is likely to improve with an early gear shift. As shown in
Figure 3, through data analysis of five urban buses, a greater ratio of using the highest gear (5th) and a lower ratio of using low gears increase fuel economy. Therefore, it is necessary to induce fast shifting to the highest gear for better fuel economy.
As described above, on-board display devices and ratings for several items are being used for the promotion of eco-drive. However, in this study, the effect on fuel economy improvement was identified through actual vehicle application after segmentation of items for scoring (which can be comprehended intuitively by drivers), setting scoring methods for each item, and allocating points based on machine learning.
3. Index Calculation of Monitoring Items for Eco-Drive Scoring
To promote eco-drive for urban buses, including those discussed in
Section 2, rapid take-off/acceleration/deceleration, accelerator pedal gradient, coasting rate, shift indicator violation, average engine speed, over speed, and gear shifting under low-end engine speed were used as monitoring items. An index was calculated for each monitoring item. Furthermore, a coefficient was multiplied to the index, and an offset was added to it to obtain a score. The total score represents the eco-drive score. The method for calculating each index of the monitoring item was established to score each item using the appropriate coefficient and offset.
3.1. Monitoring Index of Items Related to Speed Variation
An operating characteristic of urban buses is that the number of stop-and-go is significantly higher than that of passenger vehicles owing to bus stops and traffic lights. In addition, rapid acceleration and deceleration occur frequently to ensure arrival within a specified dispatch time or shorten the operation time. In an urban bus having high inertia owing to its relatively high weight and large number of passengers, driving habits that consume a substantial amount of energy while accelerating should be avoided. Therefore, items related to speed variation were divided and monitored as rapid take-off/acceleration/deceleration, accelerator pedal gradient, and coasting rate.
Rapid take-off is a driving habit that adversely affects fuel economy. Therefore, the acceleration at take-off was monitored to improve the fuel economy of the urban bus. Violation monitoring of rapid take-off is performed when certain conditions are satisfied, such as when the accelerator pedal is pressed more than a certain amount during vehicle departure, vehicle speed is below a specific range, and vehicle speed is increasing. A threshold take-off acceleration (
Thd.launch) is set to determine rapid take-off. When the take-off acceleration (
Acc.launch) exceeds the threshold in the monitoring range, the take-off acceleration exceeding rate (
Marklaunch) is calculated and accumulated. The accumulated take-off acceleration exceeding rate is divided by the total number of stops and is used as the rapid take-off index (
Indexlaunch) (see Equation (1)).
The monitoring of rapid acceleration/deceleration adversely affects fuel economy. Therefore, driving acceleration is monitored by a set standard. The monitoring condition is set above the vehicle speed that can be considered as driving. Furthermore, an acceleration threshold (
Thd.acc) and deceleration threshold (
Thd.dec) are set according to vehicle speed. When the variation in speed (
Acc.running) while driving exceeds the acceleration threshold or deceleration threshold, the acceleration exceeding rate or deceleration exceeding rate, respectively, is calculated (see Equation (2)).
The frequent use of the accelerator pedal adversely affects fuel economy owing to the frequent variations in the driving range. The accelerator pedal gradient is monitored every 3 s when the vehicle is being driven without shifting gears. In the monitoring range, the amount of accelerator pedal variation is calculated three times per second. When the accelerator pedal variation amount threshold is exceeded at least once, the highest value from among the three is considered. The exceeding rate of the accelerator pedal variation amount (Markpedal) is set according to the accelerator pedal variation amount. Furthermore, the accelerator pedal variation amount exceeding the rate corresponding to the highest value among the three is calculated.
The coasting rate is monitored to increase the coasting distance ratio during the entire run. The monitoring range is set when the accelerator pedal is not pressed, and the vehicle speed and vehicle speed variation amount for assessing coasting are higher than or equal to their respective thresholds. The coasting distance (Markcoasting) in the monitoring range is used to calculate the index.
Among the monitoring items related to speed variation, the index of items, excluding rapid take-off, is calculated by dividing the exceeding rate or distance considered in each case by the total travel distance (see Equation (3)).
3.2. Monitoring Index of Shift Indicator Operation
For early gear shift, a shift indicator function is installed in the onboard display device of the urban bus. Shift indicator refers to a function that assists in shifting when it is possible to induce driving in the low-speed, high-load range of an engine wherein the engine efficiency is relatively high, and the driving force margin for maintaining driving performance after shifting is secured [
36,
37].
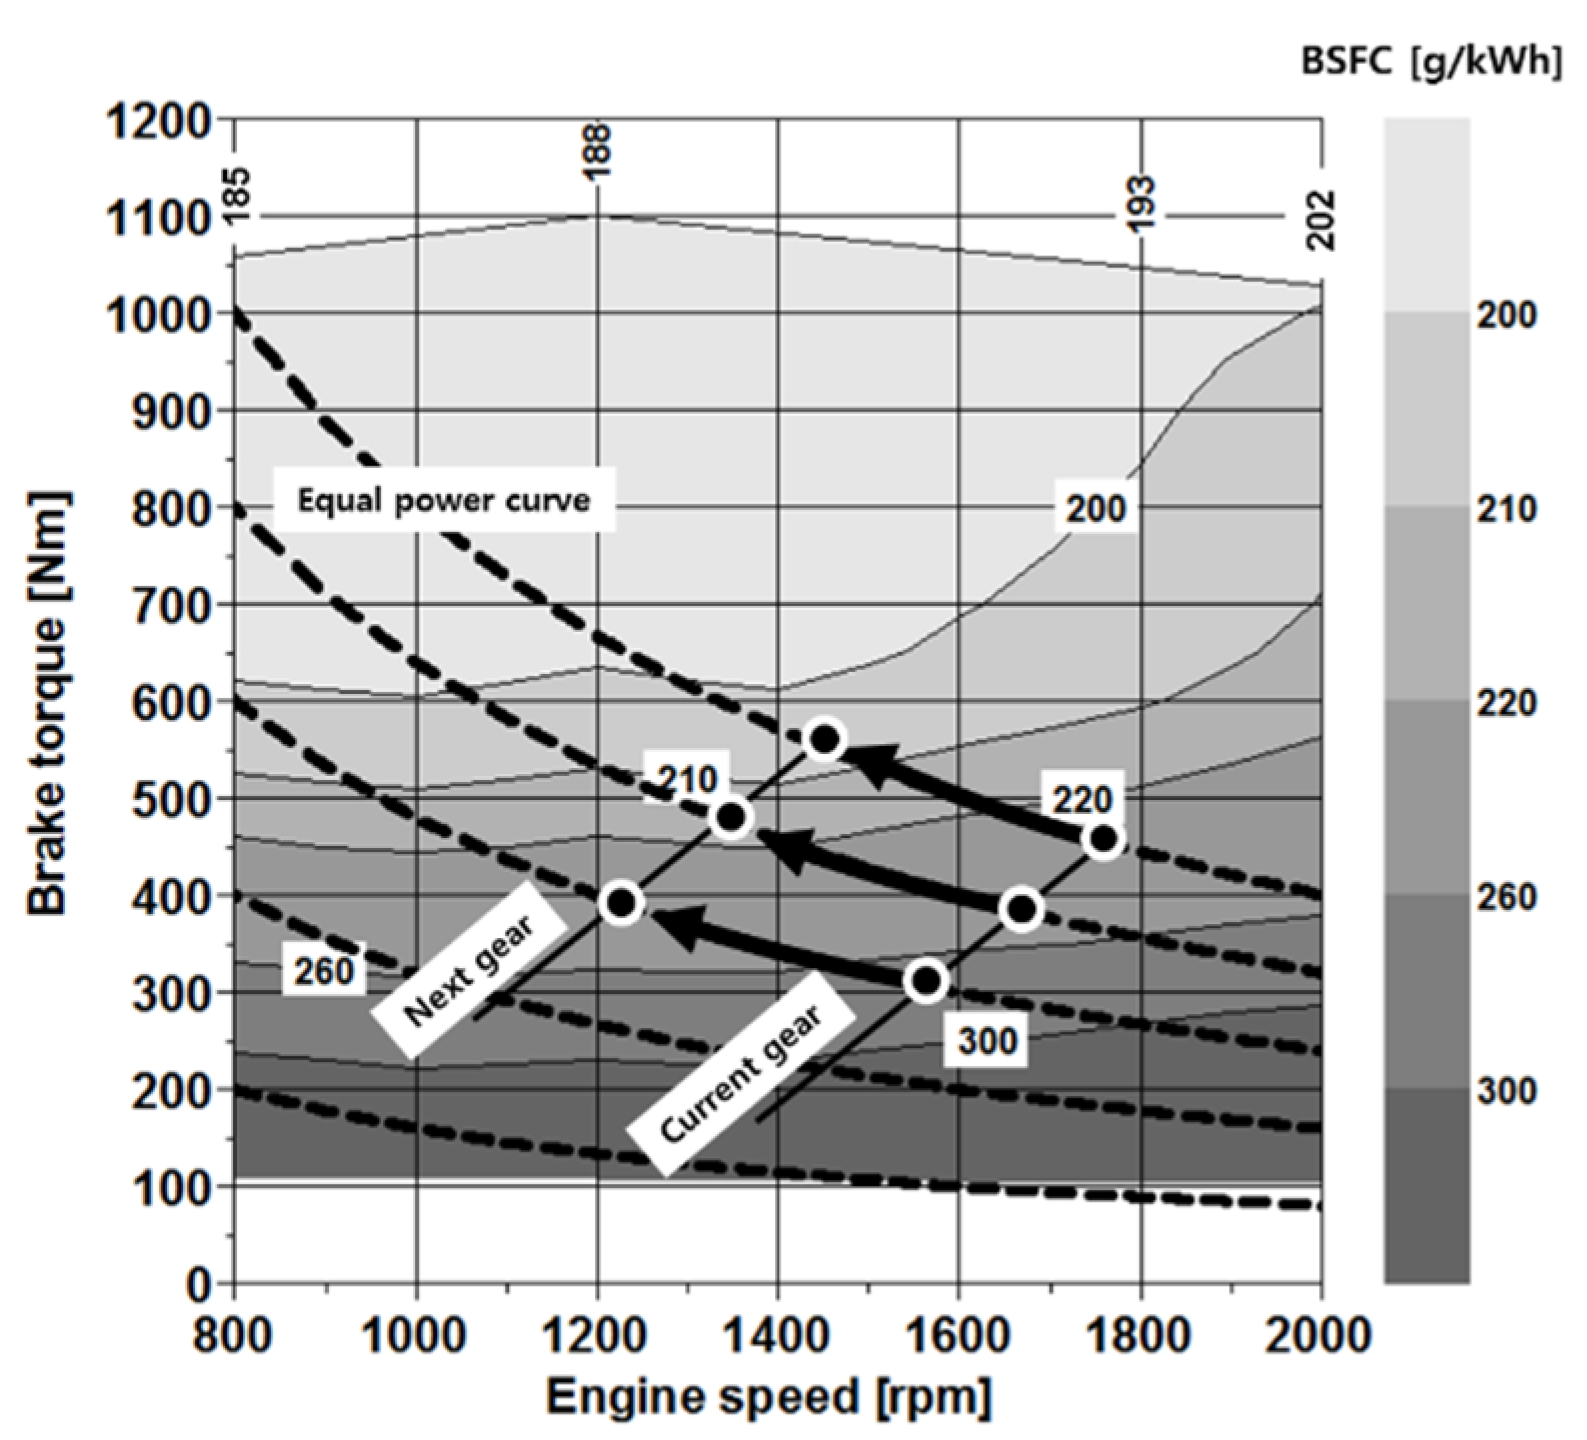
Figure 4 shows a schematic diagram of the difference in BSFC before and after shifting. For an equal power output, the fuel consumption rate improved after shifting.
In urban buses, which are mostly manual transmission vehicles, fuel economy can be improved by indicating the appropriate time to shift gears and by using the accelerator pedal position and vehicle acceleration. The engine speed threshold for shifting gears is set up at each gear ratio such that fuel economy is improved and the driving force margin is secured. Shift indicator performance violations are monitored when the current engine speed exceeds the engine speed specified by the shift indicator. When an incline is detected with a high accelerator pedal value and low acceleration, the engine speed threshold is increased to avoid excessive deductions. If the gear is not shifted within 2 s of shift indication, the delay time (seconds) is accumulated and divided by the total driving distance to be used as the shift indicator violation index (IndexSI).
3.3. Monitoring Index of Other Items
For other eco-drive monitoring items, average engine speed, over speed, and gear shifting under low-end engine speed are used. The average engine speed is monitored to improve fuel economy by limiting operations at high engine speed. The monitoring range for calculating the average engine speed index (Indexrpm) is the driving condition excluding standstill. However, driving at an engine speed of at least 1000 rpm in the highest gear is excluded from the monitoring range. The sum of engine speeds in the monitoring range is divided by the monitoring time and used as the average engine speed index.
Urban buses travel short distances between stops. Therefore, it is difficult to sustain high speeds while driving. As they have to make frequent stops, it is less necessary to drive above the speed limit of the road. In addition, high-speed driving may increase the risk of accidents, and rapid deceleration when stopping may occur. Therefore, monitoring is performed to limit speeding. The speed limit on the national roads of Korea is generally 80 km/h. The time exceeding 80 km/h is accumulated at every second interval. This is divided by the total travel distance and used as the over speed index (Indexvspd).
If the gear is shifted at an excessively low engine speed, the vehicle speed is reduced owing to a low driving force margin. A decrease in vehicle speed results in a decrease in engine speed, and driving at an excessively low engine speed may deteriorate vehicle stability. In addition, it is necessary to induce shifting at an appropriate engine speed to prevent damage to the vehicle from shifting gears at a low engine speed to prevent a shift indicator violation. Accordingly, to determine the appropriateness of the engine speed during a shift performed prior to shift indication, if the engine speed is below a threshold, it is monitored after the shift. Monitoring starts if the vehicle is in motion for over 2 s after shifting. The engine speed threshold is set for each gear ratio, and the time (seconds) during which the engine speed is lower than the threshold is accumulated in the monitoring range. The accumulated time is divided by the total travel distance and used as the gear shifting under the low-end engine speed index (Indexlowrpm).
4. Allocation of Monitoring Item Score Using Machine Learning
4.1. Contribution of Monitoring Item to Fuel Economy through Machine Learning
In this study, a fuel economy prediction model was developed using the machine learning algorithm LightGBM (Guolin Ke, Microsoft Research) to comprehend the fuel economy contribution of the eco-drive monitoring items. LightGBM is a gradient-boosting decision tree framework. It has the advantage of speed improvement through gradient-based one-side sampling (GOSS, which maintains features with large gradients for obtaining prediction information and randomly discards other features) and through exclusive feature bundling (which combines features with high correlation) [
38]. In addition, compared with other gradient-boosting techniques of machine learning such as XGBoost (The XGBoost Contributors) and CatBoost (Andrey Gulin, Yandex), LightGBM has high speed without compromising accuracy [
39].
A total of 15,000 one-trip driving data of the representative route (Route No. 101) were used. Data preprocessing was performed by removing the outlier for which the magnitude of z-score (which indicates the difference between each data and the average compared with the standard deviation) exceeds three. The preprocessing of the data input to the developed model is a highly important process because it affects the improvement of accuracy. The performance of the model can be improved by input data normalization [
40,
41], outlier removal [
42], and dimension reduction of the feature [
43].
LightGBM GOSS-type regression model and five-fold cross-validation were used for modeling. Mean squared error was used as the loss function. The input features of the model are shown in
Table 1. The training loss was 0.004.
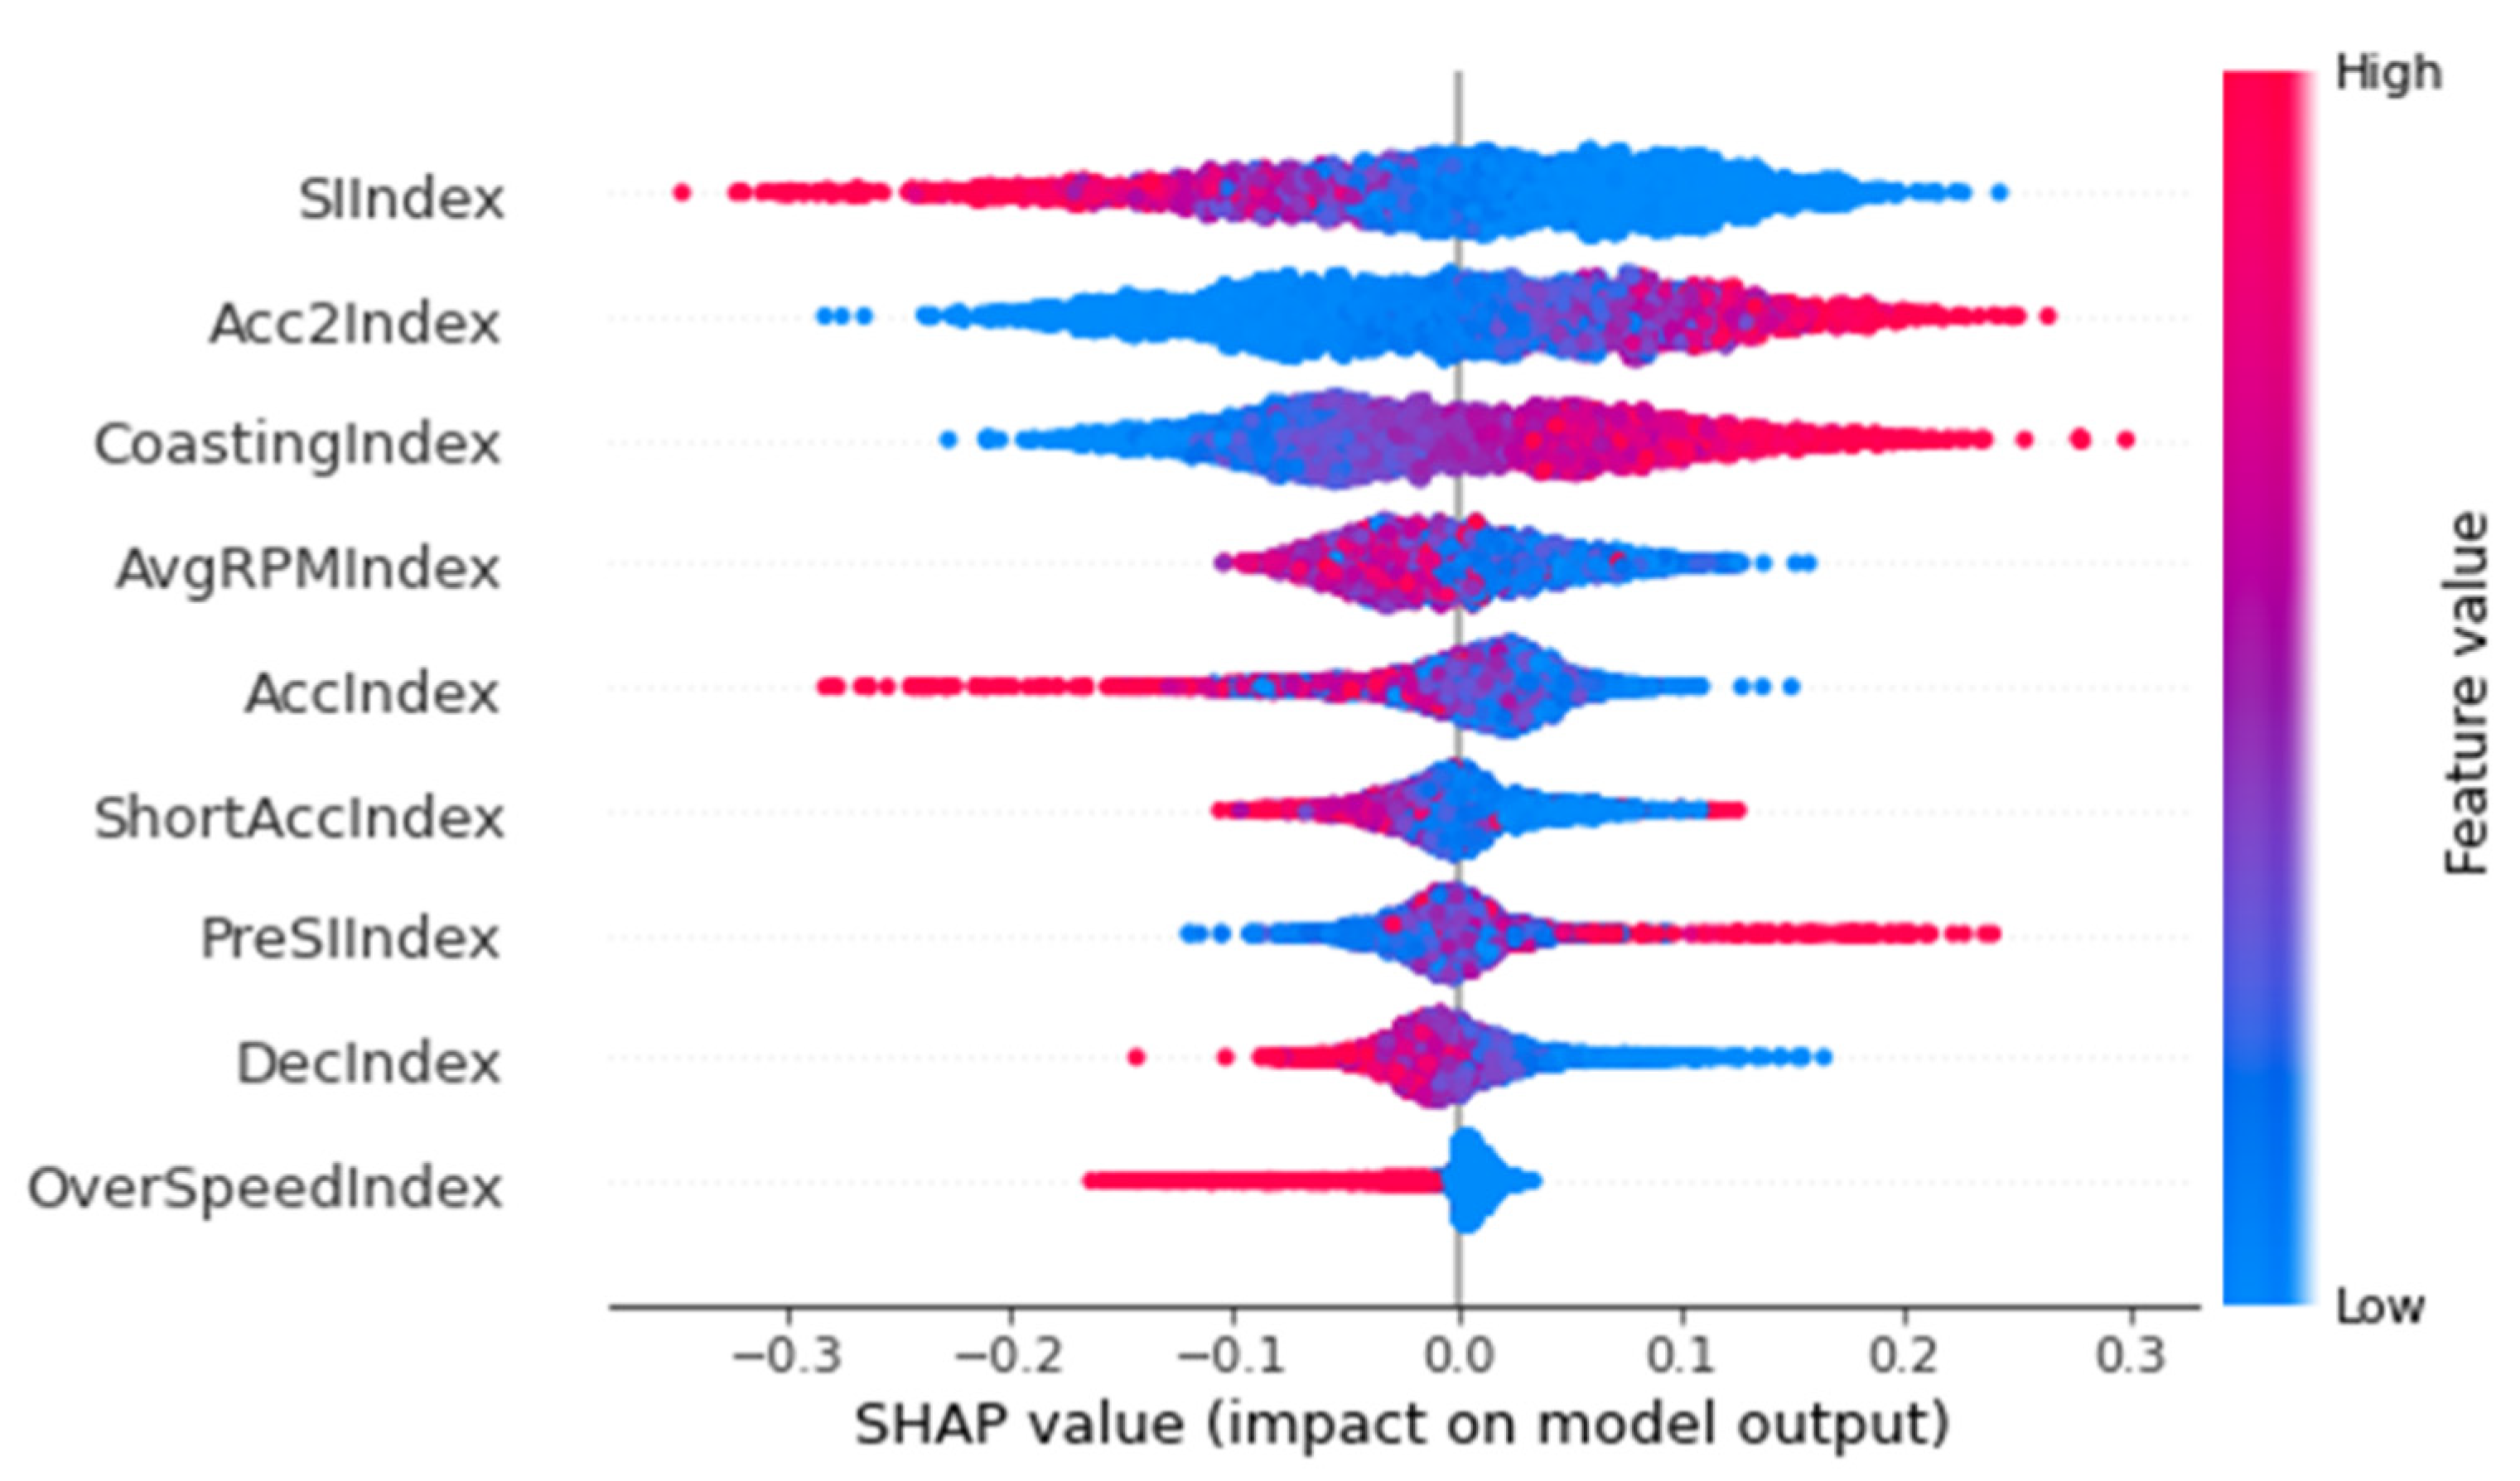
Figure 5 shows an overview of the SHAP value by feature verified by the tree explainer of the model. The distribution of the shift indicator violation index was the widest.
The range of the x-axis of the overview graph indicates the SHAP value, which shows the contribution of the prediction feature considered interaction between features. The thickness variation shown in the y-direction indicates the distribution, and the contrast variation indicates the amount of feature. Let us consider one of the features, Acc2Index (rapid acceleration index), as an example. Here, the fuel economy improved with a larger data value, and the number of data decreased as the SHAP value shifted away from zero.
4.2. Allocation of Each Monitoring Item Score
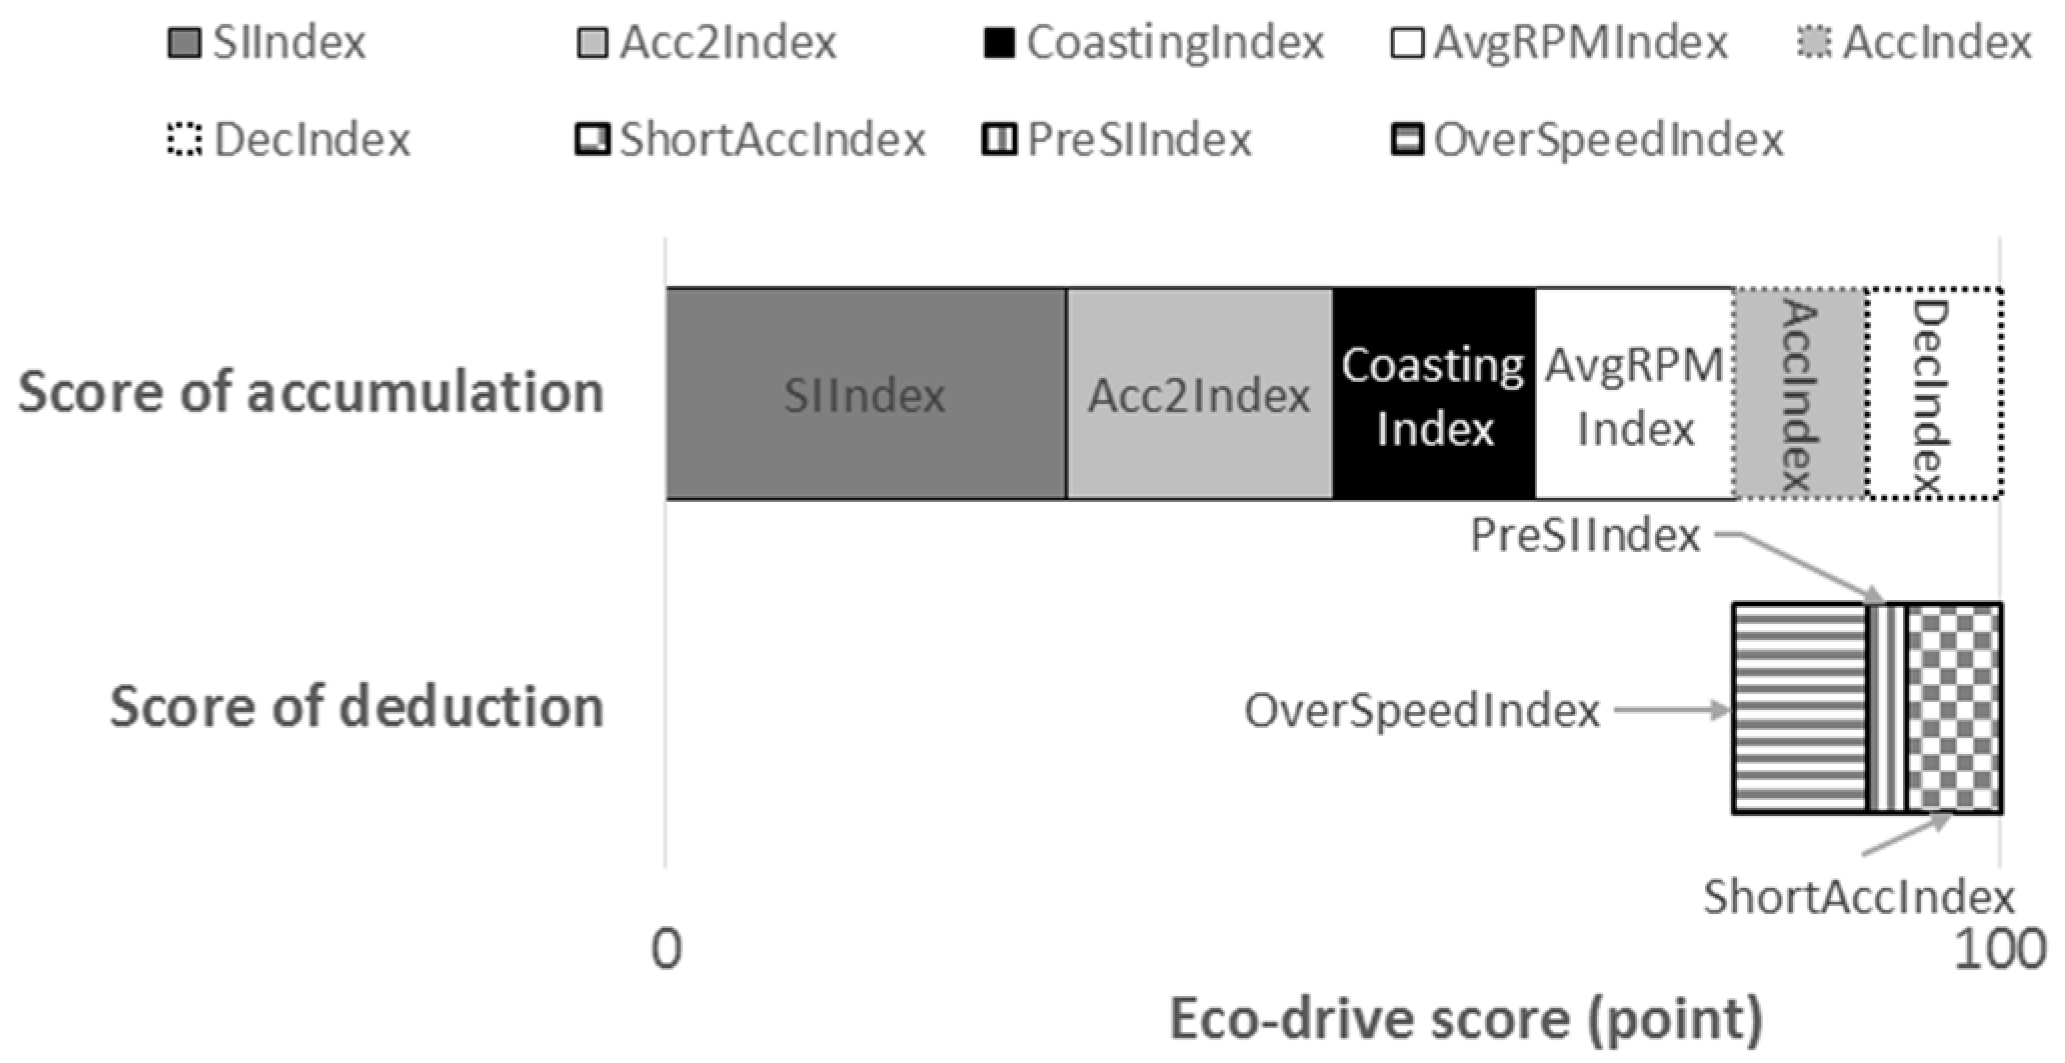
The analysis results of the fuel economy prediction model using LightGBM revealed the impact of the monitoring items on fuel economy in the following descending order: shift indicator, rapid acceleration, coasting rate, average engine speed, rapid take-off, accelerator pedal gradient, gear shifting under low-end engine speed, rapid deceleration, and over speed. Using the above results, the score allocation rate was adjusted based on 100 points. The coefficient and offset were set such that the sum of adjusted points according to the index of each item was 100 points. Depending on the circumstances, if a certain item does not have a violation, the coefficient and offset can be set such that starting from zero, points can be deducted. The method of converting the index of each item into a score (the sum of these scores is the eco-drive score) is expressed as Equation (4).
For the eco-drive score set in this study, the indexes of certain items were cumulatively summed (shift indicator violation, rapid take-off/acceleration/deceleration, coasting rate, and average engine speed), and those of others were deducted (accelerator pedal gradient, gear shifting under low-end engine speed, and over speed). Even when the cumulative sum is 100 points, if points are deducted from the deduction items, the eco-drive score would have a lower outcome.
Figure 6 shows the point allocation for each item.
5. Result
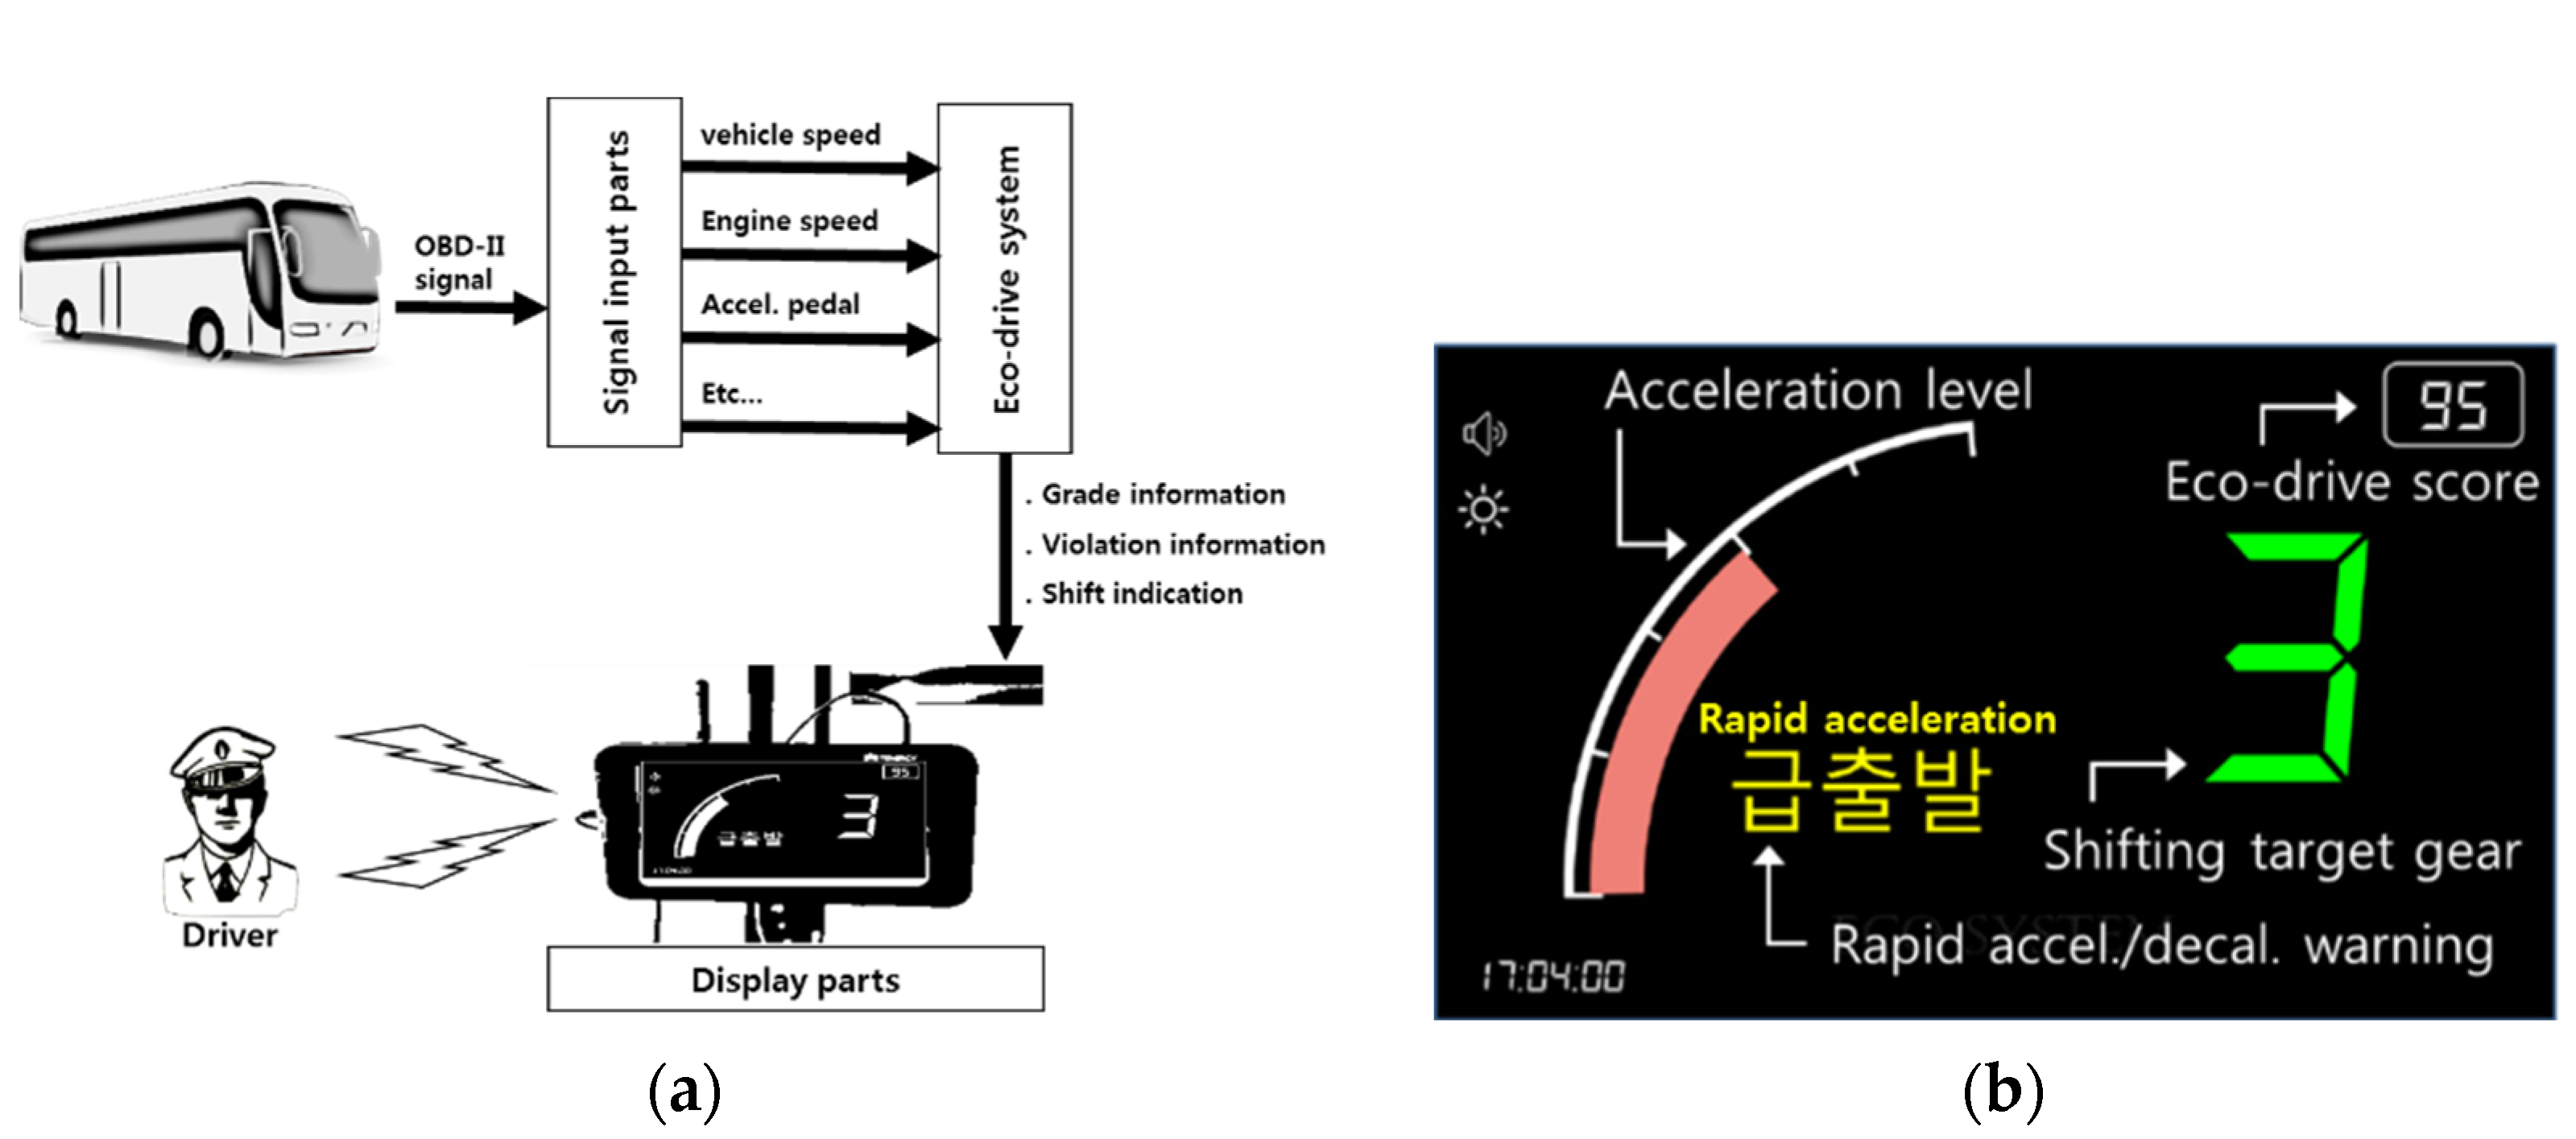
An on-board display device incorporated with an eco-drive score indicator and a shift indicator is defined as the eco-drive system. As shown in
Figure 7a,b, devices displaying the shift point/acceleration level/eco-drive score were installed and used on 3864 urban buses on 281 routes in the Urban Buses Fuel Economy Improvement Project hosted by the Seoul Metropolitan Government (see
Table 2). These buses operated on assigned routes without shifting. The driver received information about the eco-drive score and shift indicator based on their driving characteristics. Furthermore, the eco-drive score, the index for each monitoring item, and score were saved when driving was completed.
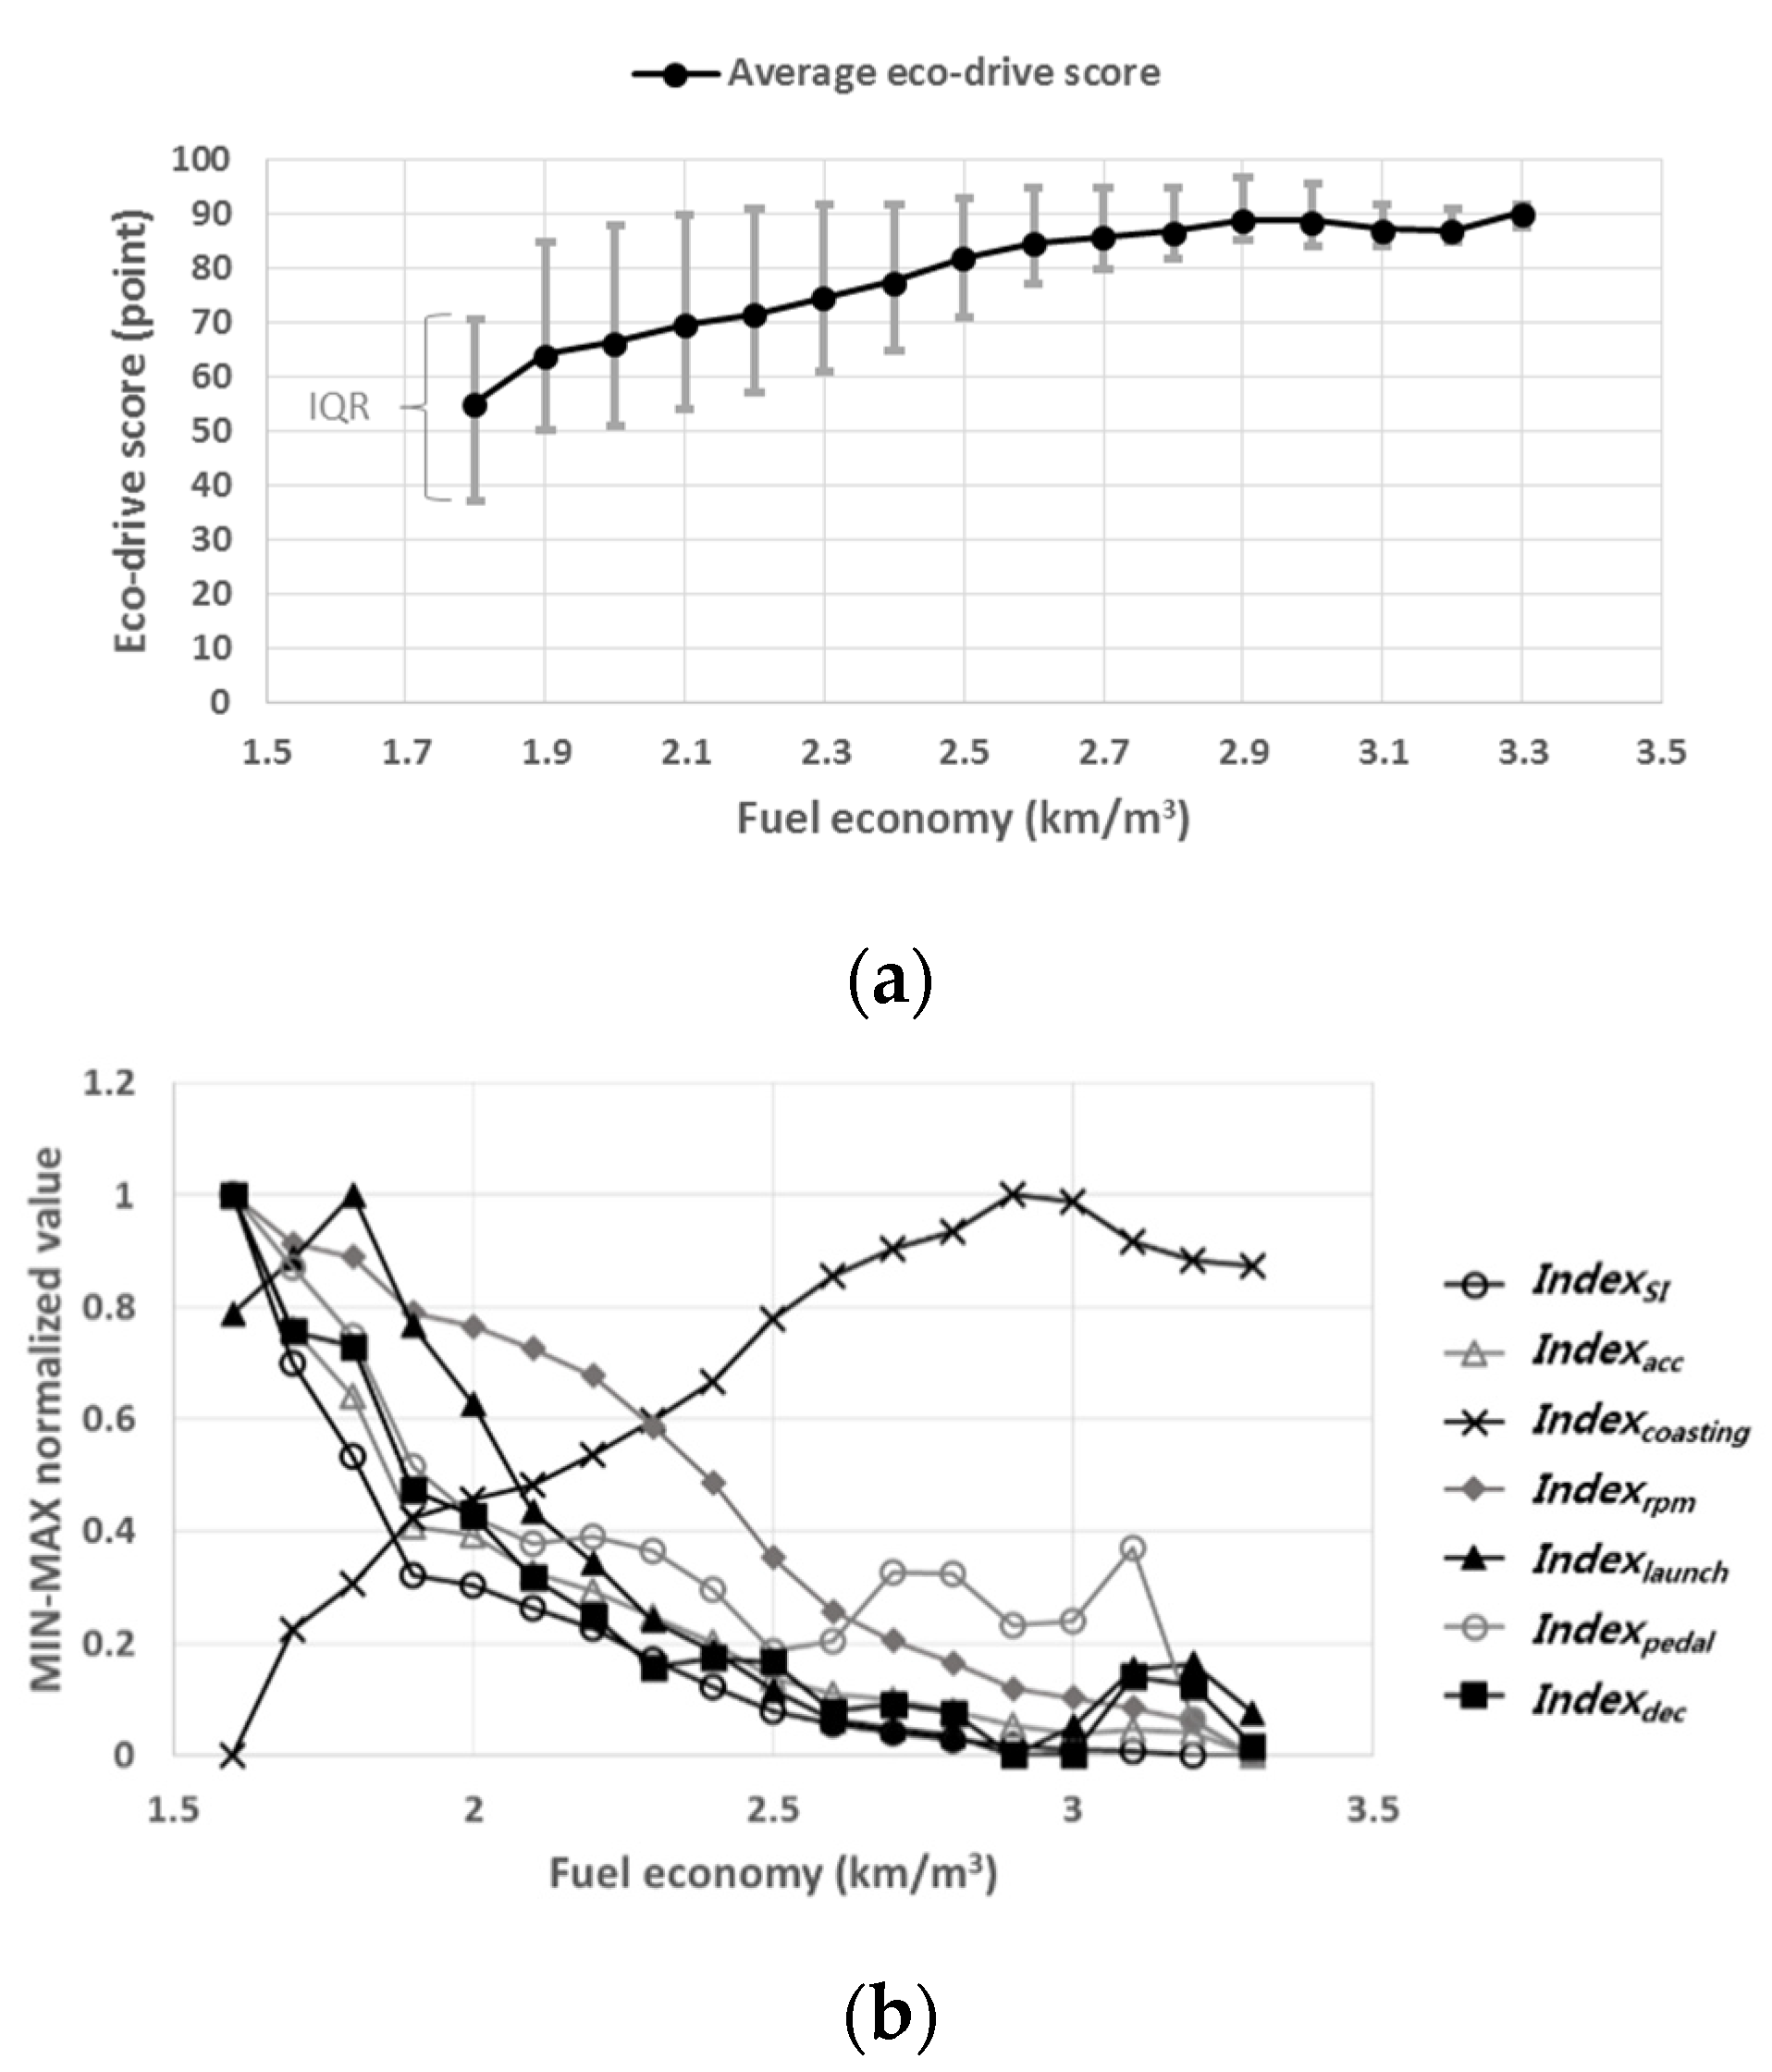
A higher eco-drive score was achieved with higher fuel-efficient driving. This implies that the eco-drive score can represent the eco-drive characteristics of urban buses. It is conjectured that the improvement in fuel economy can be maximized through management and enforcement of the eco-drive score.
Figure 8a shows the average eco-drive score of 15,000 driving data for 28 buses for each fuel economy value of the representative route, and the IQR represents the 50% range from the median.
Figure 8b shows the result of MIN–MAX normalization of the monitoring item index related to the average fuel economy on 15,000 driving data of the representative route. The correlation between each monitoring item and fuel economy can be observed.
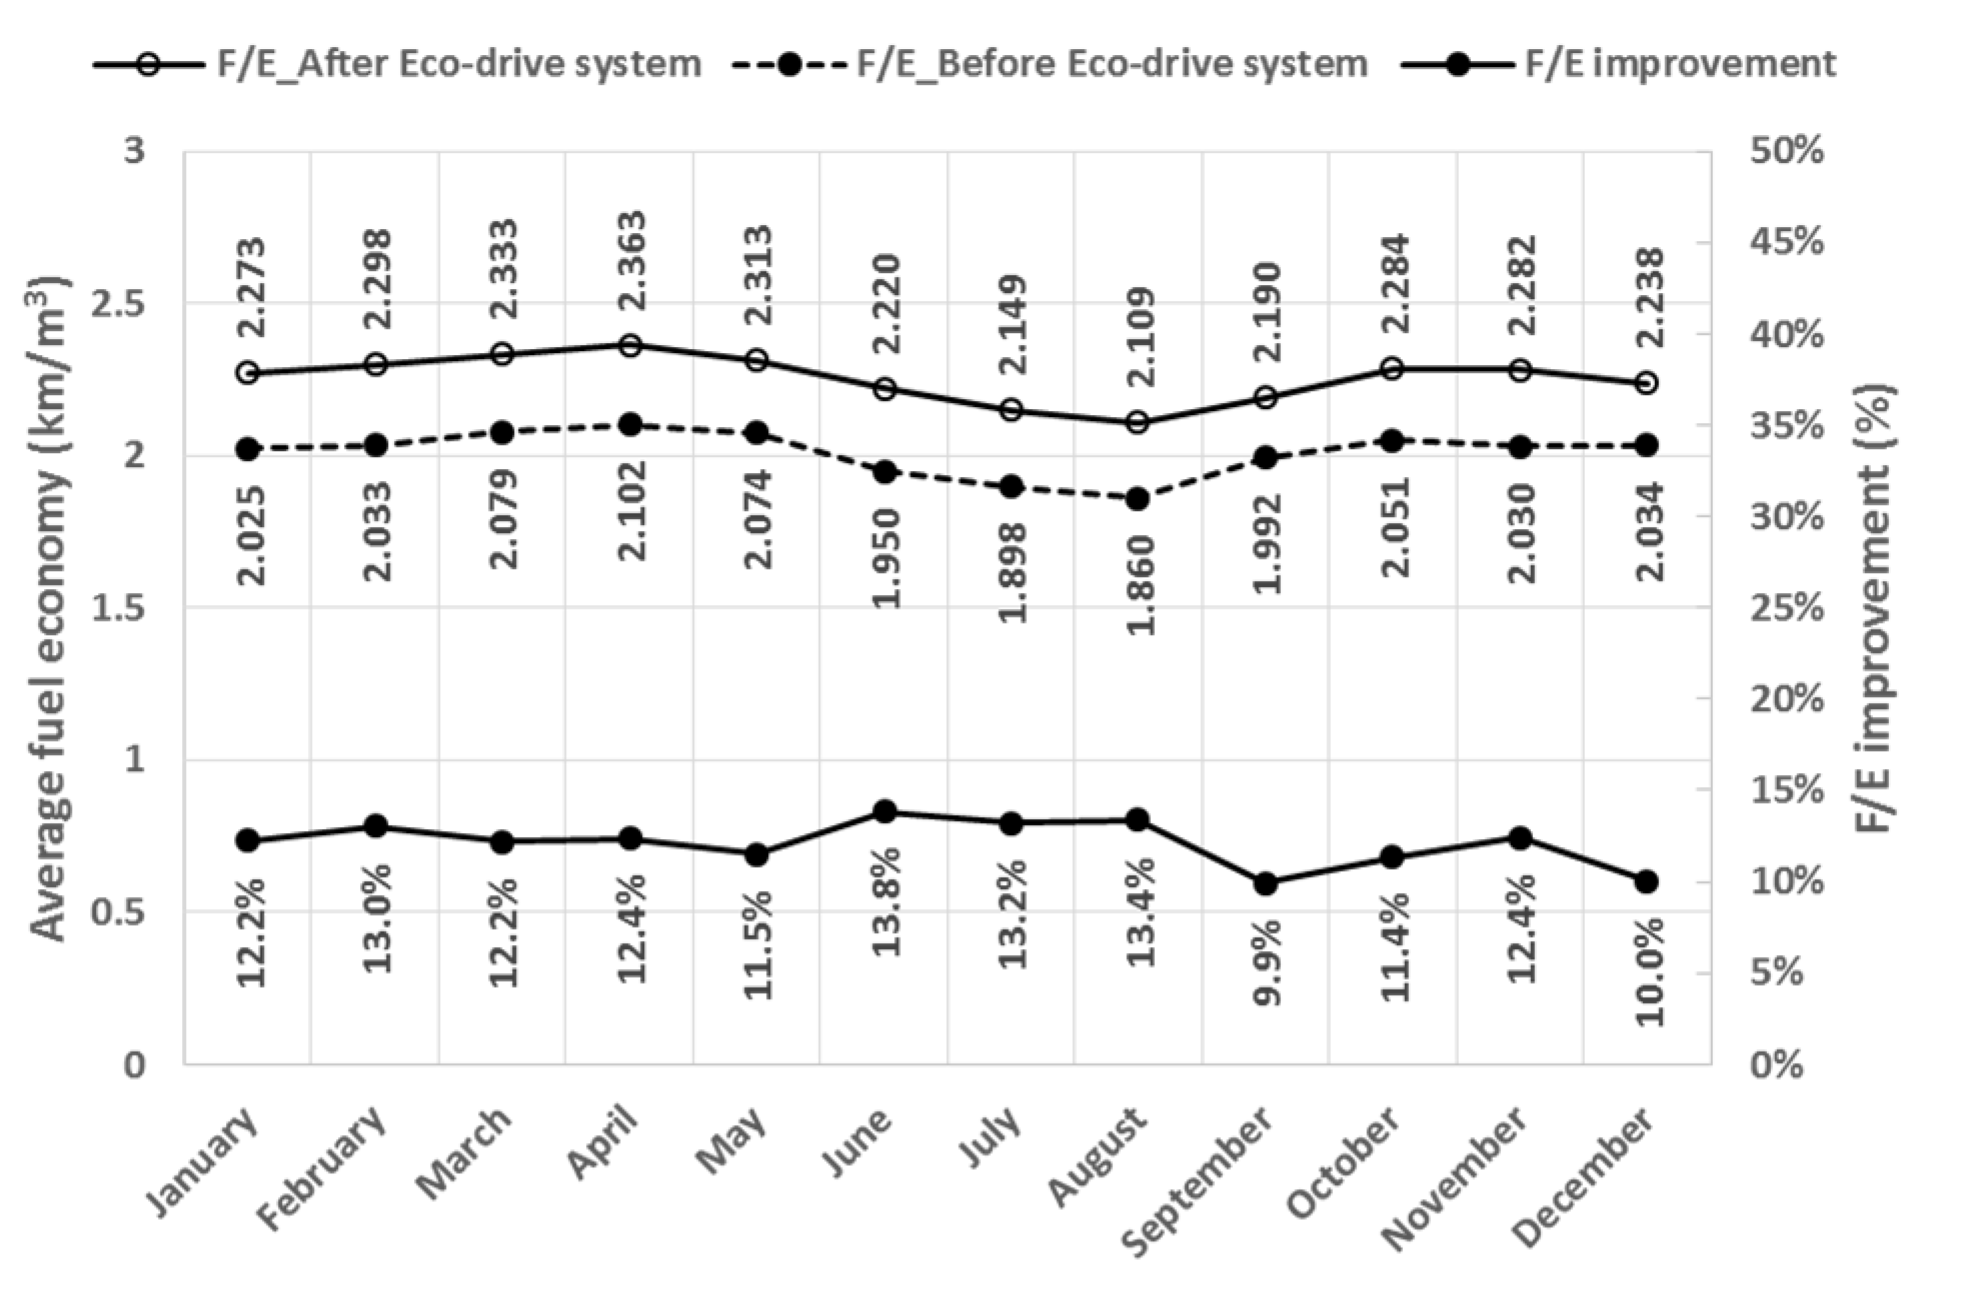
With the display of the eco-drive score, the driver’s adaptation period to the eco-drive system shortened, and fuel economy improved. Improvement in fuel economy through the eco-drive score was verified for all seasons. An average annual improvement in fuel economy of 12.1% was achieved.
Figure 9 shows the monthly improvement in fuel economy before and after the installation of the eco-drive system during the annual operation on 3864 buses on 281 routes.
The eco-drive scoring in this study, based on 100 points, has the advantage that the driver can comprehend it intuitively. The rank is subdivided, unlike some that provide grades for only a few items or real-time lighting on an eco-lamp. Hence, it is highly likely that driving habits could undergo transformation because of eco-drive and that the eco-drive score can be managed conveniently. The alteration of driving habits will result in improved fuel economy.
6. Discussion
In this study, the fuel economy of urban busses was improved by applying the eco-drive scoring algorithm. The eco-drive score monitored and scored several driving characteristics related to fuel economy. Monitoring items included vehicle speed gradient, accelerator pedal changes, and gear shift behaviors related to eco-drive. Each monitoring function considered the driving distance in the index calculation. A method that considers the driving distance can represent the violation rate in the total driving range. Through monitoring eco-drive, drivers can avoid aggressive driving and unnecessary braking that negatively impacts fuel economy. Drivers can easily recognize their degree of eco-drive. Previous studies with eco-drive information devices in commercial vehicles have shown an 8.8% fuel economy improvement [
27]. In this study, with the application of the eco-drive scoring algorithm, an average annual improvement in fuel economy of 12.1% was achieved in urban buses. These results have shown that fuel economy can be improved by changing driving behaviors without hardware development.
The eco-drive score is displayed based on 100 points, which is the sum of each monitoring item score. In this study, machine learning was used to determine the contribution of input features (monitoring items) in predicting target labels (fuel economy). Each monitoring item score was allocated according to the machine learning contribution result. The score related to shift indicator violations accounted for the highest proportion of the eco-drive score, and scores related to over speed, gear shifting under low-end engine speed, and accelerator pedal gradient were selected as deduction items. The selected deduction items had a low frequency of occurrence. The sum of the scores for each monitoring item was used as the eco-drive score. Through the correlation of the eco-drive score and fuel economy, it has been shown that determining contribution using machine learning is appropriate.
The eco-drive score only considered driving characteristics. However, external factors such as traffic conditions [
44,
45], traffic light systems [
46,
47,
48], and the number of passengers can affect driving characteristics and fuel economy. A future study will consider how external factors can be reflected in the eco-drive score.
7. Conclusions
In this study, the eco-drive scoring method was developed to improve fuel economy by promoting eco-drive for urban buses. The improvement in fuel economy (by an average of 12.1% annually) was verified by implementing it on urban buses in Seoul.
Each item for eco-drive monitoring was set such that the score increases when driving behavior shows a tendency to improve fuel economy. Furthermore, the eco-drive score expressed as the sum tends to increase as the fuel economy increases. It can be used to represent the fuel economy of urban bus operations. This scoring process, based on driving behavior characteristics, is likely to promote the application of eco-drive in urban buses, improve fuel economy, and reduce fuel costs.
When it is infeasible to identify a complex relationship with a target value (e.g., comprehending the contribution of each monitoring item of the eco-drive score for allocating points), machine learning can be effectively used to reduce the time and cost incurred.
In this study, the effects of external factors on driving characteristics and fuel economy were not considered in the eco-drive score. In the future, these should be studied in conjunction with the continuous improvement of the eco-drive system.
Author Contributions
Conceptualization, J.L.; methodology, J.P.; data curation, K.K.; writing—original draft preparation, K.K.; writing—review and editing, J.L.; supervision, J.L. and J.P. All authors have read and agreed to the published version of the manuscript.
Funding
This research received no external funding.
Institutional Review Board Statement
Not applicable.
Informed Consent Statement
Not applicable.
Data Availability Statement
Not applicable.
Conflicts of Interest
The authors declare no conflict of interest.
Abbreviations
| BSFC | Brake specific fuel consumption (g/kWh) |
| CNG | Compressed natural gas |
| SHAP | Shapley additive explanations |
| GOSS | Gradient-based one-side sampling |
| Thd.launch | Threshold take-off acceleration (m/s2) |
| Acc.launch | Take-off acceleration (m/s2) |
| Marklaunch | Take-off acceleration exceeding rate |
| Indexlaunch | Rapid take-off index |
| Thd.acc | Acceleration threshold (m/s2) |
| Thd.dec | Deceleration threshold (m/s2) |
| Acc.running | Variation in speed (m/s2) |
| Markacc | Acceleration exceeding rate |
| Markdec | Deceleration exceeding rate |
| Markpedal | Accelerator pedal variation amount exceeding rate |
| Markcoasting | Coasting distance (km) |
| Indexlaunch/Scorelaunch | Rapid take-off index/score |
| Indexacc/Scoreacc | Rapid acceleration index/score |
| Indexdec/Scoredec | Rapid deceleration index/score |
| Indexpedal/Scorepedal | Accelerator pedal gradient index/score |
| Indexcoasting/Scorecoasting | Coasting rate index/score |
| IndexSI/ScoreSI | Shift indicator violation index/score |
| Indexrpm/Scorerpm | Average engine speed index/score |
| Indexvspd/Scorevspd | Over speed index/score |
| Indexlowrpm/Scorelowrpm | Gear shifting under low-end engine speed index/score |
| CoefficientItem | Coefficient of monitoring item |
| OffsetItem | Offset of monitoring item |
References
- Zacharof, N.; Doulgerls, S.; Myrsinias, I.; Dornoff, J. A Methodology for Monitoring On-Road CO2 Emission Compliance in Passenger Vehicles; SAE Technical Paper 2020-37-0034; SAE International: Washington, DC, USA, 2020. [Google Scholar]
- Yamaguchi, T. Coasting Technology for Real-Wrold Fuel Economy Improvement of a Hybrid Vehicle; SAE Technical Paper 2020-01-1195; SAE International: Washington, DC, USA, 2020. [Google Scholar]
- Pedrozo, V.; Lanzanova, T.; May, I.; Guan, W. The Effective Use of Ethanol for Greenhouse Gas Emission Reduction in a Diesel Engine; SAE Technical Paper 2019-36-0157; SAE International: Washington, DC, USA, 2020. [Google Scholar]
- President of Greenhouse Gas Inventory and Research Center. National Greenhouse Gas Inventory Report of Korea; President of Greenhouse Gas Inventory and Research Center: Seoul, Korea, 2020; pp. 97–168. [Google Scholar]
- Korea Transportation Safety Authority. Greenhouse Gas Emissions by Road Vehicle by Region. Available online: https://www.data.go.kr/en/data/15061155/fileData.do (accessed on 22 March 2021).
- Ministry of Land, Infrastructure and Transport Statistics System. Total Registered Motor Vehicles. Available online: http://stat.molit.go.kr/portal/cate/statView.do (accessed on 21 March 2021).
- 2009 Average Mileage of Automobile; Korea Transportation Safety Authority: Gimcheon, Korea, 2010; pp. 13–32.
- Al-kasassbeh, M.; Abbadi, M.A.; Al-Bustanji, A.M. LightGBM Algorithm for Malware Detection. In Science and Information Conference; Springer: Cham, Switzerland, 2020; pp. 391–403. [Google Scholar]
- Lee, H.; Jeon, G.; Jang, J. Predicting of the Severity of Car Traffic Accidents on a Highway Using Light Gradient Boosting Model. J. KIECS 2020, 15, 1123–1130. [Google Scholar]
- Machado, M.R.; Karray, S.; Sousa, I.T. LihtGBM: An Effective Decision Tree Gradient Boosting Method to Predict Customer Loyalty in the Finance Industry. In Proceedings of the 14th International Conference on Computer Science & Education, Toronto, ON, Canada, 19–21 August 2019; pp. 1111–1116. [Google Scholar]
- Guo, Q.; Zhu, Z.; Pei, H.; Xu, F.; Lu, Q.; Zhang, D.; Wu, W. Mobile User Credit Prediction Based on LightGBM. In Proceedings of the International Conference on Big Data, Electronics and Communication Engineering, Advances in Computer Science Research, Beijing, China, 24–25 November 2019; Volume 94. [Google Scholar]
- Wang, D.; Zhang, Y.; Zhao, Y. LightGBM: An Effective miRNA Classification Method in Breast Cancer Patients. In Proceedings of the International Conference on Computational Biology and Bioinformatics, Newark, NJ, USA, 18–20 October 2017; pp. 7–11. [Google Scholar]
- Salay, R.; Quelroz, R.; Czarneckl, K. An Analysis of ISO 26262: Machine Learning and Safety in Automotive Software; SAE Technical Paper 2018-01-1075; SAE International: Washington, DC, USA, 2018. [Google Scholar]
- Hameed, S.S.; Vaithiyanathan, M.; Kesavan, M. Fault Detection in Single Stage Helical Planetary Gearbox Using Artificial Neural Networks (ANN) and Decision Tree with Histogram Features; SAE Technical Paper 2019-28-0151; SAE International: Washington, DC, USA, 2019. [Google Scholar]
- Shahverdy, M.; Fathy, M.; Berangi, R.; Sabokrou, M. Driver behavior detection and classification using deep convolutional neural networks. Expert Syst. Appl. 2020, 149, 113240. [Google Scholar] [CrossRef]
- Radmilovic, Z.; Zehetner, J.; Watzenig, D. Vibration Comfort Control for HEV Based on Machine Learning; SAE Technical Paper 2014-01-2091; SAE International: Washington, DC, USA, 2014. [Google Scholar]
- Azmin, F.M.; Stobart, R.; Rutledge, J.; Winward, E. Using a Statistical Machine Learning Tool for Diesel Engine Air Path Calibration; SAE Technical Paper 2014-01-2391; SAE International: Washington, DC, USA, 2014. [Google Scholar]
- Choi, D.; An, Y.; Lee, N.; Park, J.; Lee, J. Comparative Study of Physics-Based Modeling and Neural Network Approach to Predict Cooling in Vehicle Integrated Thermal Management System. Energies 2020, 13, 5301. [Google Scholar] [CrossRef]
- Lundberg, S.M.; Lee, S. A Unified Approach to Interpreting Model Predictions. In Proceedings of the 31st International Conference on Neural Information Processing Systems, Long Beach, CA, USA, 4–9 December 2017; pp. 4768–4777. [Google Scholar]
- Mahajan, V.; Cantelmo, G.; Antoniou, C. Explaining demand patterns during COVID-19 using opportunistic data: A case study of the city of Munich. Eur. Transp. Res. Rev. 2021, 13, 26. [Google Scholar] [CrossRef]
- Geurkink, Y.; Boone, J.; Verstockt, S.; Bourgois, J.G. Machine Learning-Based Identification of the Strongest Predictive Variables of Winning and Losing in Belgian Professional Soccer. Appl. Sci. 2021, 11, 2378. [Google Scholar] [CrossRef]
- Lundberg, S.M.; Lee, S. Consistent individualized feature attribution for tree ensembles. arXiv 2018, arXiv:1802.03888. [Google Scholar]
- Fafoutellis, P.; Mantouka, E.G.; Vlahogianni, E.I. Eco-Driving and Its Impacts on Fuel Efficiency: An Overview of Technologies and Data-Driven Methods. Sustainability 2021, 13, 226. [Google Scholar] [CrossRef]
- He, R.; Hu, N. A Gear Shifting Indication Strategy of Eco-Driving Vehicle; SAE Technical Paper 2020-01-0966; SAE International: Washington, DC, USA, 2020. [Google Scholar]
- Kim, S.; Shin, D.; Yoon, H.; Bae, H.; Kim, D. Development of Eco-Driving Guide System; SAE Technical Paper 2011-28-0034; SAE International: Washington, DC, USA, 2011. [Google Scholar]
- Imaizumi, H.; Sengoku, K. Estimation of CO2 Reduction Potential in Japan by Traffic-Flow Smoothing and Eco-Driving Promotion; SAE Technical Paper 2013-01-0621; SAE International: Washington, DC, USA, 2013. [Google Scholar]
- Ueki, S.; Takada, Y. Improvement of Fuel Economy and CO2 Reduction of Commercial Vehicles by the Promotion of Eco-Driving Management System (EMS); SAE Technical Paper 2011-28-0048; SAE International: Washington, DC, USA, 2011. [Google Scholar]
- Takada, Y.; Ueki, S.; Saito, A.; Sawazu, N.; Nagatomi, Y. Improvement of Fuel Economy by Eco-Driving with Devices for Freight Vehicles in Real Traffic Conditions; SAE Technical Paper 2007-01-1323; SAE International: Washington, DC, USA, 2007. [Google Scholar]
- Sato, S.; Suzuki, H.; Miya, M.; Iida, N. Analysis of the Effect of Eco-Driving with Early Shift-Up on Real-World Emission; SAE Technical Paper 2010-01-2279; SAE International: Washington, DC, USA, 2010. [Google Scholar]
- Saito, A.; Ueki, S.; Nagatomi, Y.; Sawazu, N.; Takada, Y. Analysis of CO2 Reduction Mechanism by Eco-Driving with Light Duty Diesel Freight Vehicle in Real Traffic Conditions; SAE Technical Paper 2008-01-1304; SAE International: Washington, DC, USA, 2008. [Google Scholar]
- Koch-Groeber, H.; Wang, J. Criteria for Coasting on Highways for Passenger Cars; SAE Technical Paper 2014-01-1157; SAE International: Washington, DC, USA, 2014. [Google Scholar]
- Ma, H.; Xie, H.; Chen, S.; Yan, Y.; Huang, D. Effects of Driver Acceleration Behavior on Fuel Consumption of City Buses; SAE Technical Paper 2014-01-0389; SAE International: Washington, DC, USA, 2014. [Google Scholar]
- Son, J.; Park, M.; Won, K.; Kim, Y.; Son, S.; Mcgordon, A.; Jennings, P.; Birrell, S. Comparative Study Between Korea and UK: Relationship between Driving Style and Real-World Fuel Consumption. Int. J. Automot. Technol. 2016, 17, 175–181. [Google Scholar] [CrossRef]
- Lee, T.; Son, J. Relationships between Driving Style and Fuel Consumption in Highway Driving; SAE Technical Paper 2011-28-0051; SAE International: Washington, DC, USA, 2011. [Google Scholar]
- Szumska, E.M.; Jurecki, R. The Effect of Aggressive Driving on Vehicle Parameters. Energies 2020, 13, 6675. [Google Scholar] [CrossRef]
- Muthusamy, A.; Ramani, V.S.; Bahl, S.; Ramanathan, H. Effect of Gear Shift Indicator Technique Enhancing Improved Fuel Economy on SUV; SAE Technical Paper 2018-28-0054; SAE International: Washington, DC, USA, 2018. [Google Scholar]
- Yum, S.; Kim, K.; Park, J.; Lee, J.; Park, K. Improvement of Fuel Economy of a City Bus using Shift Indicator. Trans. Korean Soc. Automot. Eng. 2013, 21, 34–39. [Google Scholar] [CrossRef]
- Ke, G.; Meng, Q.; Finley, T.; Wang, T.; Chen, W.; Ma, W.; Ye, Q.; Liu, T.-Y. LightGBM: A Highly Efficient Gradient Boosting Decision Tree. In Proceedings of the 31st International Conference on Neural Information Processing Systems, Long Beach, CA, USA, 4–9 December 2017; pp. 3146–3154. [Google Scholar]
- Daoud, E.A. Comparison between XGBoost, LightGBM and CatBoost Using a Home Credit Dataset. World Acad. Sci. Eng. Technol. Int. J. Comput. Inf. Eng. 2019, 13, 1. [Google Scholar]
- Jo, J. Effectiveness of Normalization Pre-Processing of Big Data to the Machine Learning Performance. J. KIECS 2019, 14, 547–552. [Google Scholar]
- Nawi, N.M.; Atomi, W.H.; Rehman, M.Z. The Effect of Data Pre-Processing on Optimized Training of Artificial Neural Networks. In Proceedings of the 4th International Conference of Electrical Engineering and Informatics, Selangor, Malaysia, 24–25 June 2013; Volume 11, pp. 32–39. [Google Scholar]
- Gibert, K.; Sanchez-Marre, M.; Izquierdo, J. A survey on pre-processing techniques: Relevant issues in the context of environmental data mining. AI Commun. 2016, 29, 627–663. [Google Scholar] [CrossRef] [Green Version]
- Obaid, H.S.; Dheyab, S.A.; Sabry, S.S. The Impact of Data Pre-Processing Techniques and Dimensionality Reduction on the Accuracy of machine Learning. In Proceedings of the 9th Annual Information Technology, Electromechanical Engineering and Microelectronics Conferenc, Jaipur, India, 13–15 March 2019; pp. 279–283. [Google Scholar]
- Mierlo, J.V.; Maggetto, G.; Burgwal, E.V.; Gense, R. Driving style and traffic measures-influence on vehicle emissions and fuel consumption. Proc. Inst. Mechnical Eng. Part D J. Automob. Eng. 2004, 218, 43–50. [Google Scholar] [CrossRef]
- Chung, N.; Lee, W.; Sunwoo, M.; Lee, Y.; Eom, M. A Study of Driving Pattern of City-bus in the City of Seoul. Trans. Korean Soc. Automot. Eng. 2002, 10, 55–65. [Google Scholar]
- Brundell-Freij, K.; Ericsson, E. Influence of street characteristics, driver category and car performance on urban driving patterns. Transp. Res. Part D Transp. Environ. 2005, 10, 213–229. [Google Scholar] [CrossRef]
- Kamal, M.A.S.; Mukai, M.; Murata, J.; Kawabe, T. On Board Eco-Driving System for Varying Road-Traffic Environments Using Model Predictive Control. In Proceedings of the IEEE International Conference on Control Applications, Yokohama, Japan, 8–10 September 2010; pp. 1636–1641. [Google Scholar]
- Ma, H.; Xie, H.; Huang, D.; Xiong, S. Effects of driving style on the fuel consumption of city buses under different road conditions and vehicle masses. Transp. Res. Part D Transp. Environ. 2015, 41, 205–216. [Google Scholar] [CrossRef]
| Publisher’s Note: MDPI stays neutral with regard to jurisdictional claims in published maps and institutional affiliations. |
© 2021 by the authors. Licensee MDPI, Basel, Switzerland. This article is an open access article distributed under the terms and conditions of the Creative Commons Attribution (CC BY) license (https://creativecommons.org/licenses/by/4.0/).


