Article

Complementary Feature Extractions for Event Identification in Power Systems Using Multi-Channel Convolutional Neural Network

Department of Electrical Engineering, Wonkwang University, 460 Iksandae-ro, Iksan 54538, Jeonbuk, Korea
Energies 2021, 14(15), 4446; https://doi.org/10.3390/en14154446
Submission received: 6 July 2021 / Revised: 20 July 2021 / Accepted: 22 July 2021 / Published: 23 July 2021
(This article belongs to the Special Issue Artificial Intelligence in Power Systems Operation and Control)

Abstract

:
This paper presents an event identification process in complementary feature extractions via convolutional neural network (CNN)-based event classification. The CNN is a suitable deep learning technique for addressing the two-dimensional power system data as it directly derives information from a measurement signal database instead of modeling transient phenomena, where the measured synchrophasor data in the power systems are allocated by time and space domains. The dynamic signatures in phasor measurement unit (PMU) signals are analyzed based on the starting point of the subtransient signals, as well as the fluctuation signature in the transient signal. For fast decision and protective operations, the use of narrow band time window is recommended to reduce the acquisition delay, where a wide time window provides high accuracy due to the use of large amounts of data. In this study, two separate data preprocessing methods and multichannel CNN structures are constructed to provide validation, as well as the fast decision in successive event conditions. The decision result includes information pertaining to various event types and locations based on various time delays for the protective operation. Finally, this work verifies the event identification method through a case study and analyzes the effects of successive events in addition to classification accuracy.

1. Introduction

Efficient use of limited energy resources is one of the most important tasks in the future power industry, where social and economic issues are encountered such as the construction of new transmission lines, acquisition of large-scale renewable energy sources, and concentration of loads in metropolitan areas. In addition, the risk of disturbances or outages is increasing owing to the significantly increased scale and density of modern power grids. One of the important technical issues encountered in addressing the reliability of national power grids is the development of the wide-area monitoring, protection, and control (WAMPAC) systems. The WAMPAC system monitors a wide-area power grid using various status information of the power system, including real-time data acquired through a phasor measurement unit (PMU), and provides the static/dynamic stability of the power grid. It is a technology that promotes a stable system operation by protecting and controlling the system. Whereas the traditional wide-area monitoring system (WAMS) monitors and controls the power grid using status information acquired in units of seconds, a PMU-based WAMPAC system can use the status information acquired in milliseconds, rendering it more precise and accurate for monitoring and controlling the power grid [1,2,3,4]. In this regard, these PMU data are widely installed to build power big data. However, PMUs have not yet incorporated application technologies such as automatic system protection, wide-area power outage prevention, which are expected in the PMU design stage. Overall, PMU-based systems can improve recovery times by providing high-precision measurements to identify errors, and these unique characteristics of PMUs are likely to be applied successfully to preventive awareness schemes [5,6].
PMU data are applied to achieve fast decision and high accuracy in system operations, which is consistent to introduce PMUs for power system analysis. In this regard, researchers in the field of situational awareness plan to apply data-driven approaches based on the development of PMU applications. Examples of relevant previous studies are as follows: A CNN application is proposed for the monitoring of power quality with PCA based preprocessing [7]. The extraction of features for parameter identification using phasor measurement data is proposed in [8]. For dynamic event analysis, general details regarding the real-time monitoring of events are well described in [9]. In addition, correlation analysis is performed for the online monitoring of anomalies and their locations [10]. These studies provide methods for obtaining meaningful information from non-stationary synchrophasor data, as well as guidelines for system operation, and can be improved by implementation conditions in real-world operation.
Because PMUs measure the real-time voltage, current, and frequency in the form of phasor data, they can identify the faults or events from dynamic signatures in an almost real-time manner [11]. In this regard, this study aims to deal with the variability of the power system, achieve rapid decisions, and analyze successive events relevant to an actual power system implementation. As data acquisition time and accuracy exhibit a trade-off relationship, the main contribution of our study is the complementary sequencing decision process, as well as a fast decision process for successive events conditions. The design process of event identification involves a complementary sequence to provide fast identification and validation, and the proposal content includes a quick judgment accuracy analysis and output category design. For the analysis of power information in the form of an event signal, the dynamic signals of the power grid measurement can be recognized by applying the convolutional neural network (CNN) [12,13]. In other words, the contribution of this work includes a proposal of two separate structures of data preprocessing methods and a multichannel CNN structures to provide validation, as well as a fast decision in successive event conditions using a single event database. Additionally, the design of categories includes the classified sort of event phenomena in power systems considering the voltage, frequency, real and reactive power disturbances, and classified groups of transmission lines and electrical buses. Finally, this work presents a method for fast event identification using the subtransient features and high-accuracy event identification using fluctuation signatures.
The remainder of this paper is organized as follows: Section 2 provides a state-of-the-art of deep learning applications for PMU analysis and discusses the challenges arising from the real-time cognitive process of power system events. In Section 3, data preprocessing and classification-based event identification are described. The results and discussion of event identification are provided in Section 4. Finally, the conclusion is presented at the end of paper.

2. Background

2.1. State-of-the-Art

In recent years, driven by the vast amount of data associated with PMU-based WAMS operations, innovative methods in the field of data-driven approaches, such as machine learning are beginning to utilize the information provided and extract valuable knowledge for system operators [14,15,16]. Instead of declaring a complex analytic model, learning how to recognize patterns and identify features appears to be an alternative solution for overcoming the challenges imposed by processing vast amounts of raw data associated with WAMS operations. As a class of machine learning algorithms, deep learning is used to model high-level abstractions hierarchically from raw data. Previous studies pertaining to deep learning application of power system signals include as follows: Generative-adversarial-network-based dynamic security assessments are developed considering missing data [17]. The artificial neural network is developed to predict the system behavior and to classify the contingencies or disturbances [18]. In using deep learning for event identification, pseudocontinuous quadrature-wavelet-transform-based feature extraction provides information regarding classified power system phenomena [19].
Among the deep learning methods, CNN is a specialized technique for image identification due to the ability to learn the distinctive features that represent the type of object, and it is widely applied to automatically extract the information targets in an image [20]. As power system information in a wide area is constructed as image format following the time and location domains, CNN application is suitable for two dimensional power system data. In this regards, the examples of CNN based power system analysis are as follows: a one-dimensional CNN is used to process PMU signals and model parameter calibration [21], a convolutional autoencoder-based load-feature analysis [22] are conducted. Especially, for the CNN-based event identification, examples include that the CNN classification based fault line localization using voltage signals [23], successive event identification by predicting the first event signal, and shallow CNN [24], CNN classification for the false data injection attack, as well as the power system events [25]. On the other hand, CNN is vulnerable to viewpoint changes that look at the object. When the angle or size of the image information is changed, it cannot be recognized properly. Thus, accurate event detection and pre-processing stage are required for the CNN application. In addition, the learning process of CNN has a problem in that it cannot process the order relation of incoming information in real time because it is interested only in the features that information has no order of importance. Thus, this work tries to handle the limitation of CNN based real time monitoring at the data pre-processing stage.
Synthetically, deep learning used in PMU system provides the analytic tools for complicated power system and their operation. In addition, fault or event-based situational awareness can improve system reliability by supporting suitable protective operations and operate optimally to isolate and minimize the affected area. On the other hand, the data-driven approach requires learning data that is an important factor to determine the performance and reliability of the proposed method. However, it is difficult to generate a database using a real-world test model while assuming successive events. Therefore, a study should be conducted to improve the classification accuracy of successive fault signals that can be analyzed in a single event database. In this regard, this work improves data processing based on deep learning by establishing preprocessing and complementary classification for fast and accurate identification using a signal event dataset. Finally, it is considered as real-world applications by presenting an event analysis method using a short window and complementary sequencing while considering the various failures.

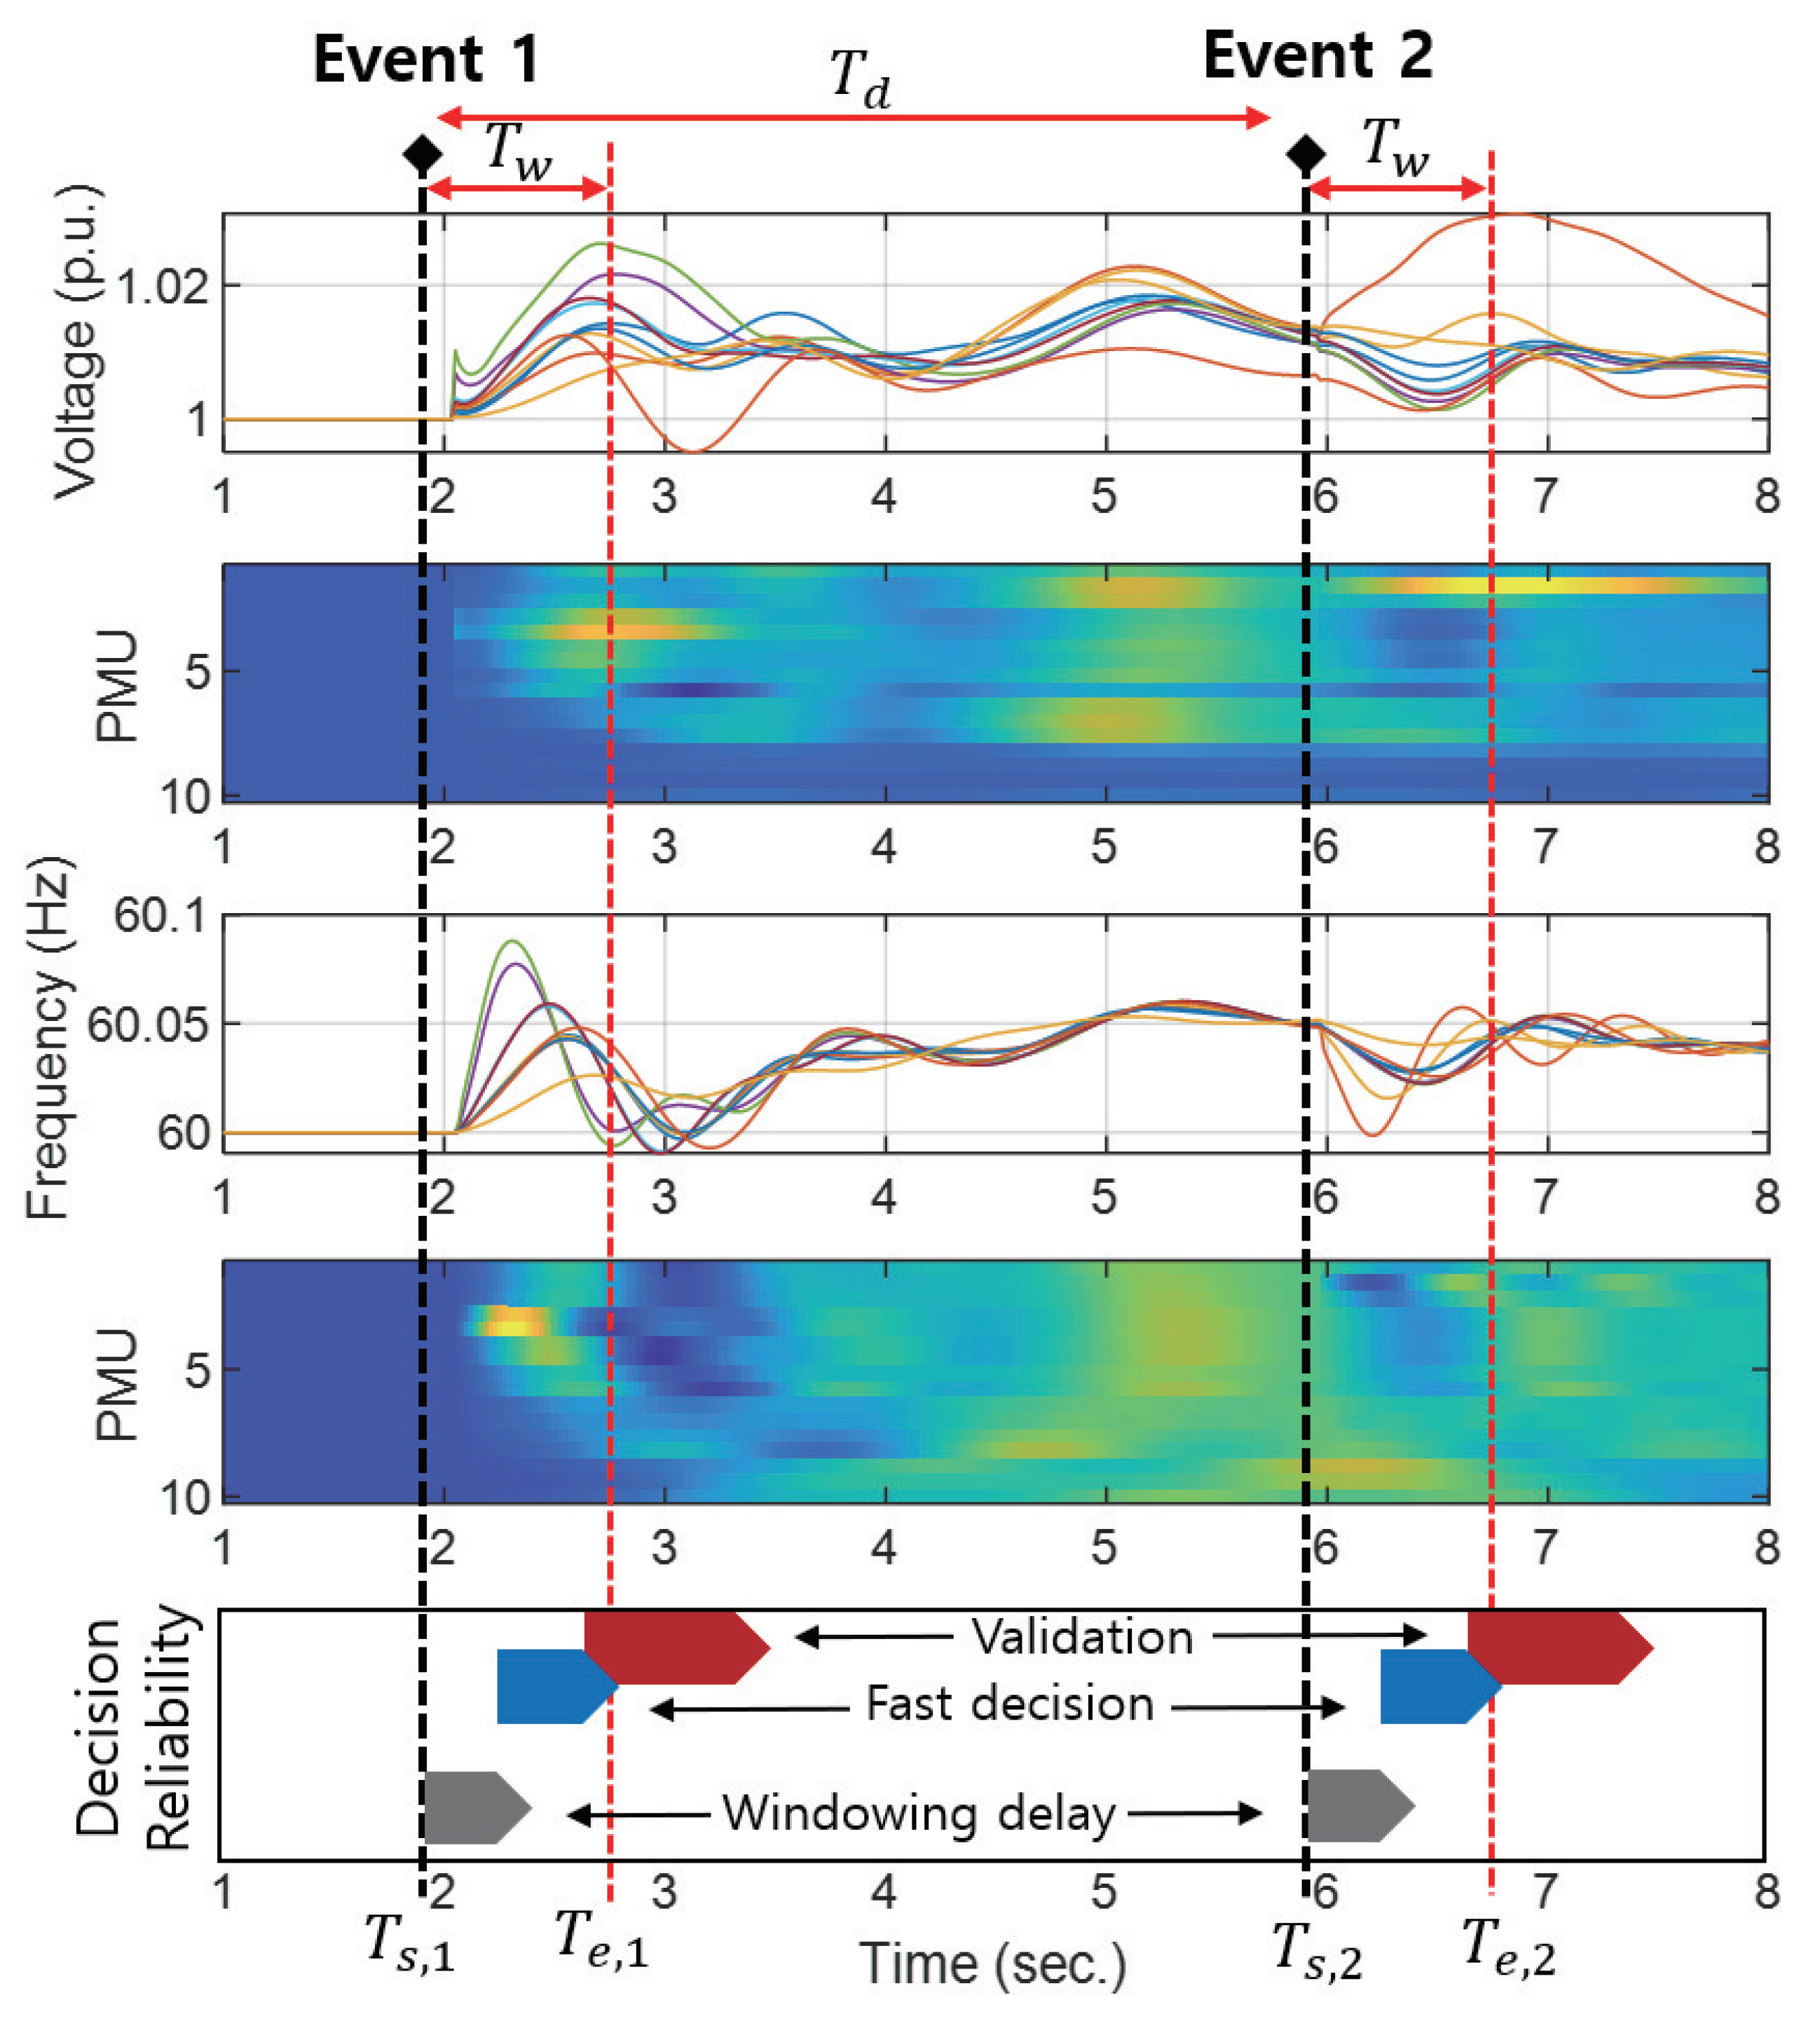
2.2. Problem Formulation

The data acquisition environment of the wide-area PMU measurements is located in the main power plants and nodes of the power system for acquiring voltage, current, and frequency information in the form of time-series phasor data [26]. When a power system event or fault occurs, its dynamic characteristics are represented in the PMU signals based on the type and location characteristics of the event. For example, Figure 1 shows the typical event signals of load and generation losses measured through multiple PMUs, where time-series signals are acquired from multiple sensor PMUs. Because these sensors are distributed in space, the signal sets exhibit different pattern characteristics based on the event types and locations. Hence, the set of measurement devices through test and training exhibits unity in measurement. The decision time steps of the event incorporate the data acquisition time, fast decision, and validation with high accuracy. The window frame of the data acquisition is set to T w , where T s , T e are the start and end times of the event measurement ( T w = T e T s ), respectively; T d is the time difference between the events shown in Figure 1. Subsequently, the measured dataset is represented as follows:
V i P M U = [ V ( t 1 = T s ) , V ( t 2 ) , , V ( t n = T e ) ] , F i P M U = [ F ( t 1 = T s ) , F ( t 2 ) , , F ( t n = T e ) ]
where V i P M U and F i P M U are the measured voltage and frequency signals from the i-th PMU at the n-th sample time t n , respectively. The combined voltage and frequency signal sets are represented as follows:
V s e t = [ V 1 P M U ; V 2 P M U ; ; V n P M U ] , F s e t = [ F 1 P M U ; F 2 P M U ; ; F n P M U ]
where V s e t , F s e t composes the channel data from the voltage magnitude and frequency that are matched with the two-dimensional (2-D) colormap in Figure 1.
When an event is recognized through a narrow-band window of a waveform, the accuracy may be inferior to that from analyzing the entire signal between instrument points. Therefore, the process may be inefficient because of the low accuracy in a single-event situation, where a single event is considered to exhibit a large T d value. Meanwhile, when T d is a small value, the event signals exhibit mutual influences between the data acquisition windows. Hence, the flexibility in window size is considered, where short-time windowing benefits successive event analysis, whereas long-time windowing provides high accuracy. In particular, events occurring in the operating power system can appear in a continuous form; if event information can be determined only by acquiring a signal for a short time after an event occurs, then the event that can be applied to the power system operating with continuous event classification and variability. This can be applied as an analysis technique for the complementary method.
The bottom of Figure 1 shows a temporal process that recognizes information after an event occurs and the data acquisition time. The additional data acquisition time windows support the validation stage with improved accuracy. Furthermore, it is designed as a complementary sequence to improve the accuracy of the instant classification and the detection of single events that have sufficient time difference, as well as to classify continuous events. In addition, the successive event classifier categorizes information that can be recognized through transient signals.

2.3. CNN Classifier

To use the 2-D information shown in the colormap of Figure 1, the CNN can be used to perform image identification, where images are received through convolutional operations and filtering techniques are applied during classification. The basic CNN structure is composed of several layers, as shown in Figure 2. It includes a convolution layer that receives an image as input data and applies an image filtering technique, which is convolved across the width and height of the input volume to compute the dot product between the filter entries and the input, thereby yielding an activation map of that filter. The CNN architecture generally yields a non-linear activation function and a pooling layer. The purpose of the pooling layer is to reduce the amount of data or the image size following the convolution layer. The convolution and pooling processes are repeated based on the CNN design.
After repeating the convolution and pooling layers, the flattened layers convert the data type to a fully connected (FC) neural network. By the convolution and padding phases, the neurons in the fully connected layer are connected to all neurons in the immediately preceding layer. Thereafter, the data are normalized through the activation function Softmax through a FC layer that vectorizes the data. The Softmax function used for the output can perform multiple classifications. This layer identifies larger patterns by combining the features of the previous layer learned from the image. The final FC layer classifies the image based on the design categories. This layer assigns inputs to one of the mutually exclusive classes and computes losses using the probabilities returned by the Softmax activation function for each input.
Depending on the target system and database, the design of hyperparameters determines the CNN performance. The first argument of the convolutional layer is the height and width of the filter used by the training function when scanning along with the input data with the filter size and number of filters, as well as the number of neurons connected to the same area. In the padding step, name-value pair arguments are used to add padding to the input feature map, including the stride. The designed output size parameter of the last FC layer is equivalent to the number of classes in the target data. In this example, the output size is 10, corresponding to 10 classes. The additional principle of a well-known CNN, which is available in previous studies, is not described in detail herein [27]. In addition, the hyperparameters used in the proposed CNN classifier and case study are described in Section 3 and Section 4, respectively.

3. CNN Based Event Identification

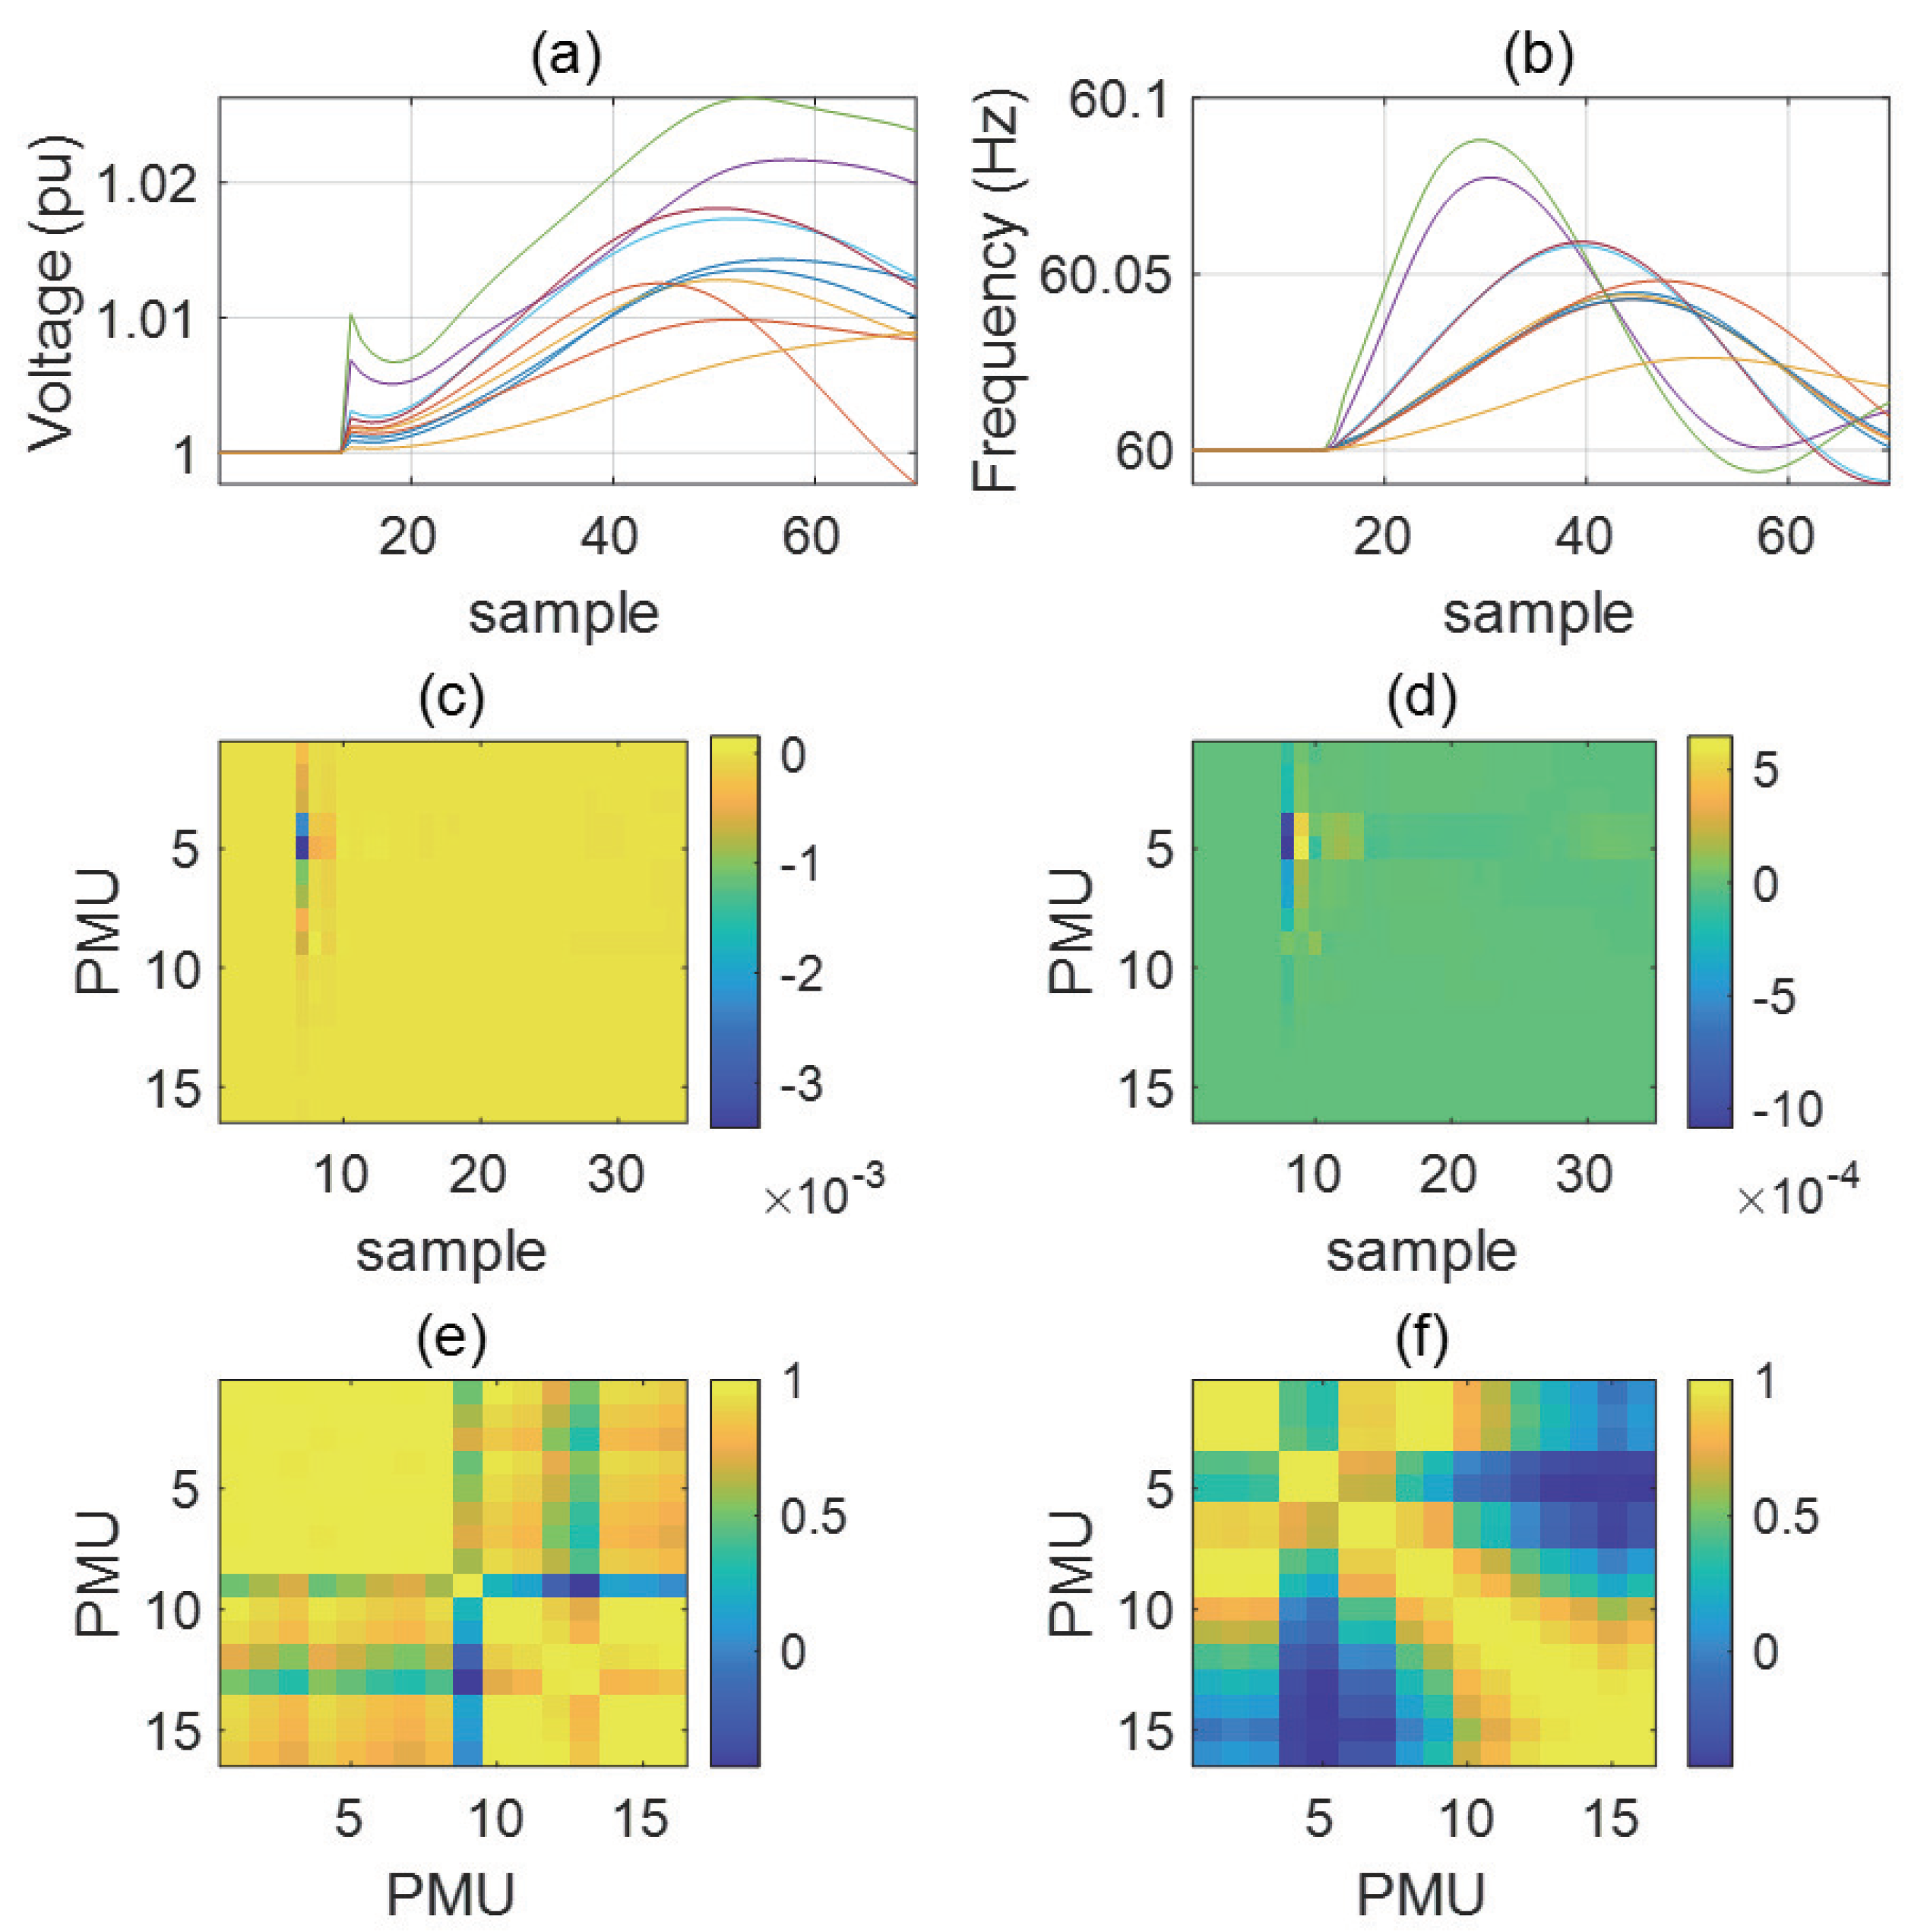
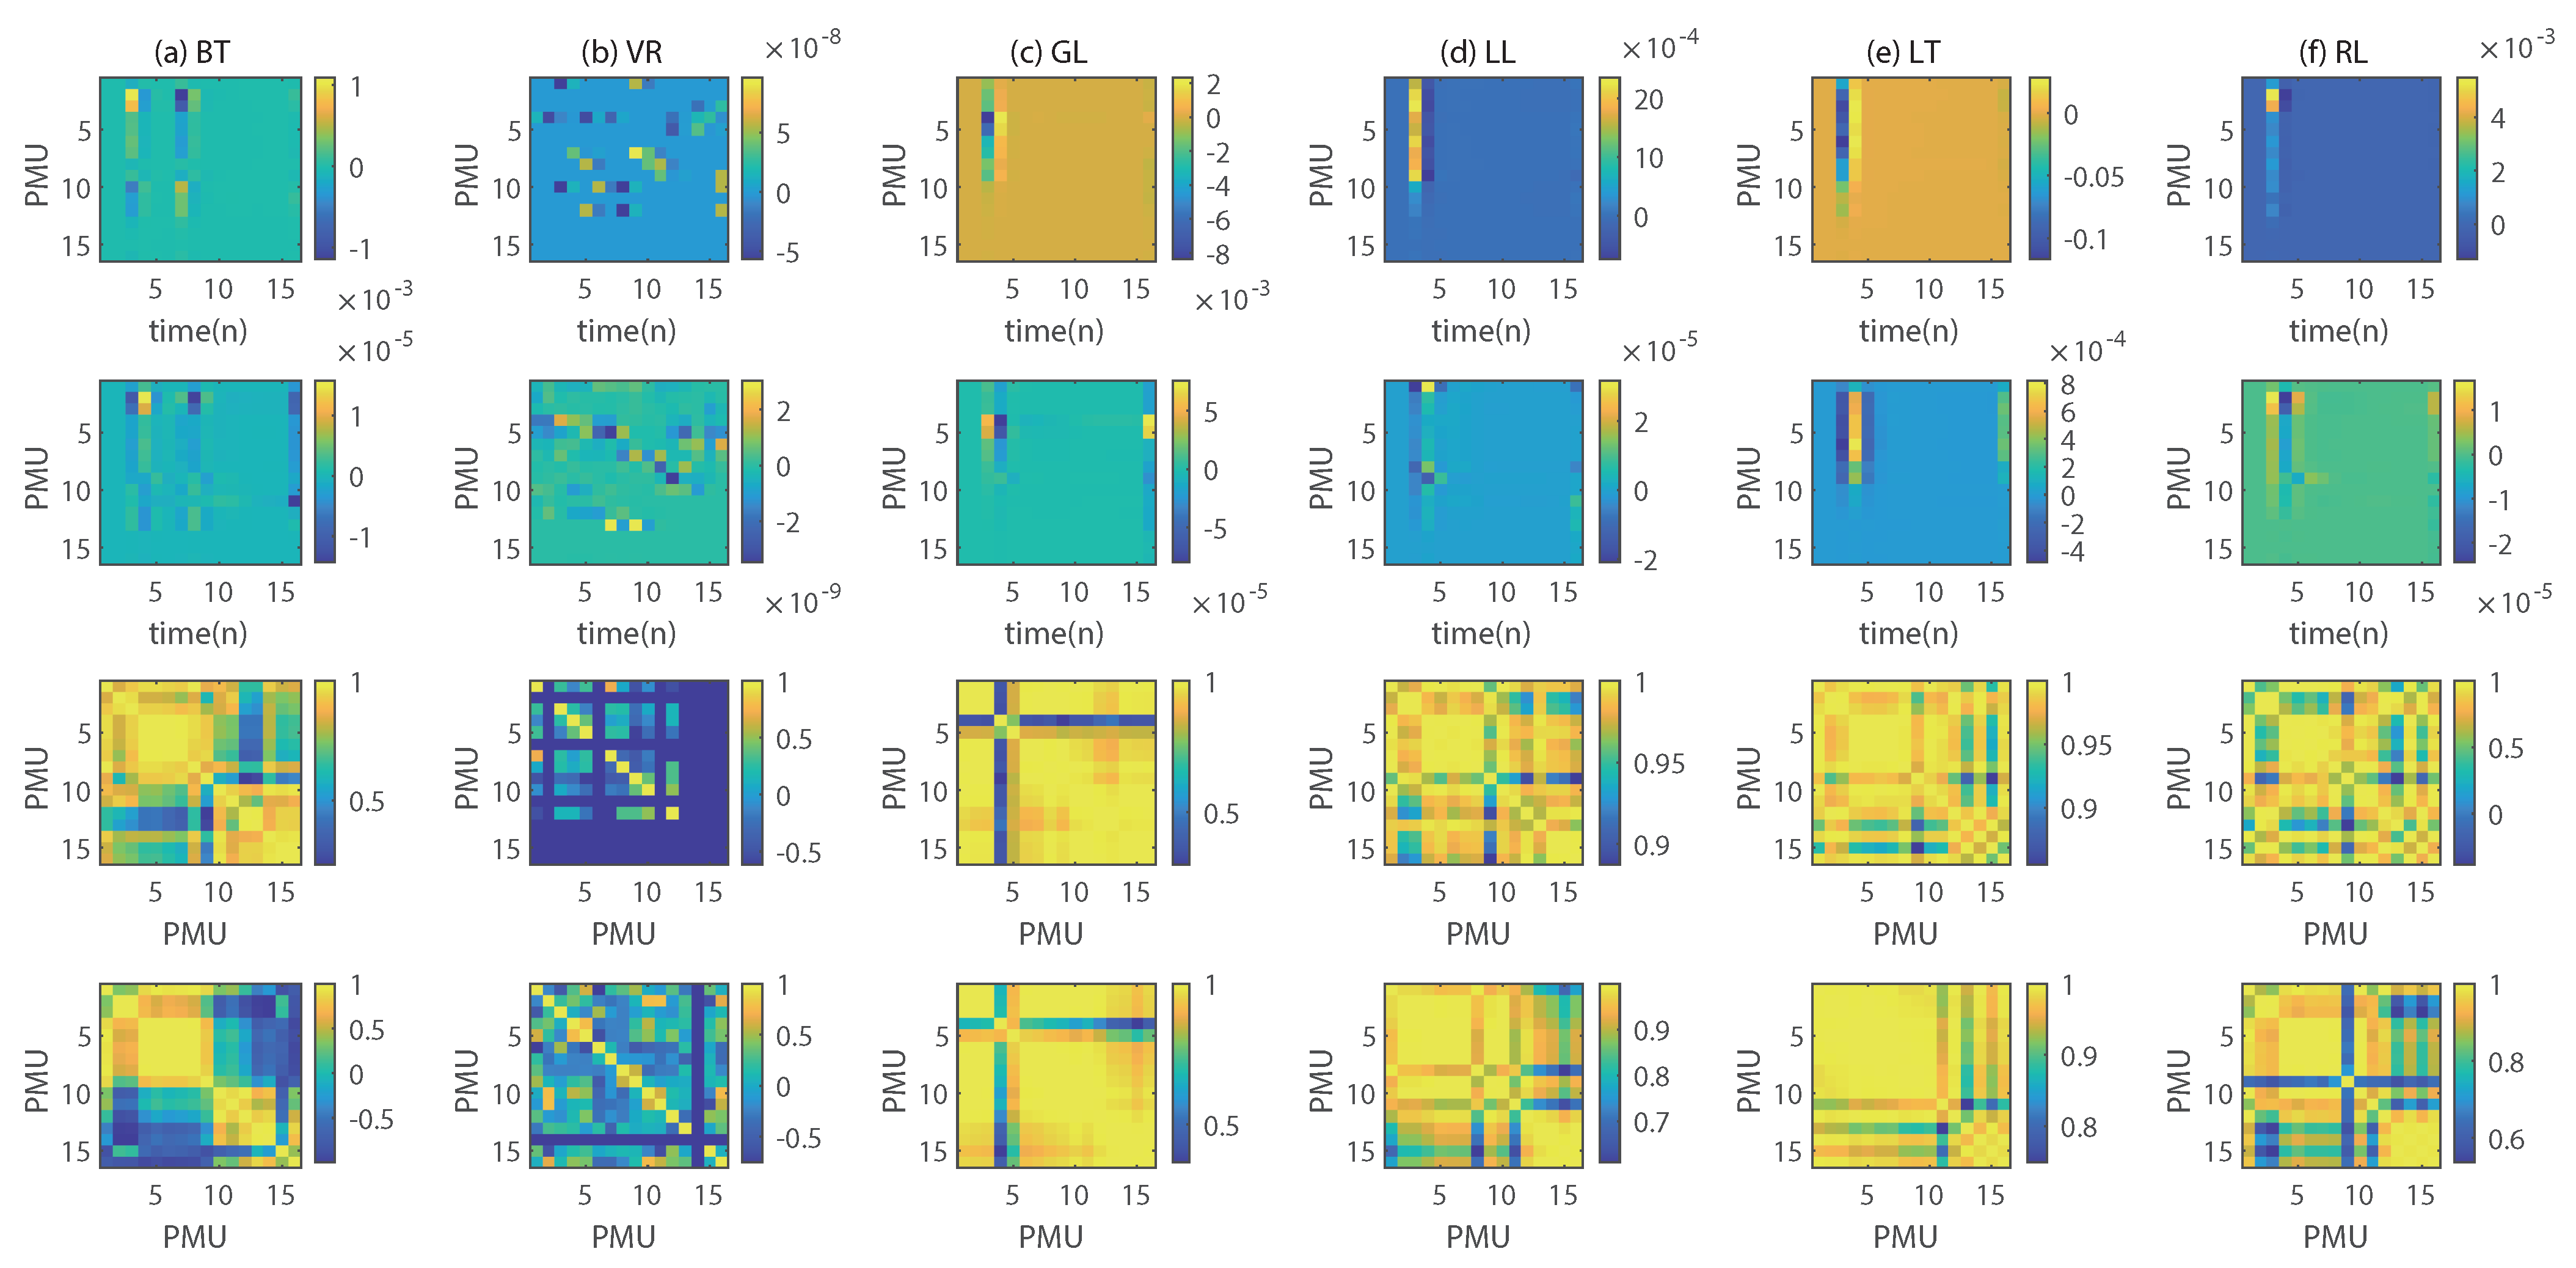
3.1. Data Preprocessing

In advance of inserting data into the CNN structure, preprocessing is required, where the acquired data are sorted by the measurement time and distributed space domains. The measured original windowing time data are represented by the PMU and time sample domains for the voltage and frequency data, respectively. Based on the time-spatial analysis of PMU-based power information, a snapshot configuration is acquired during preprocessing to capture the dynamic signature. The design of the data size and domain during preprocessing improves the performance and construction of the deep neural network. The use of transient period signals that include the signatures of signal fluctuation improves the accuracy by increasing the data amount, while, the only use of short time subtransient signals provides a fast decision by reducing the data acquisition time. Overall, in our approach, separated preprocessing domains for short-time and long-time data acquisition are considered separately in the entire process. Two approaches can be used to design the data domain.
(1) PMU vs. time domain: The PMU and time domain matrix snapshot captures the signal fluctuation in each PMU signal that is composed of multiple 1-D PMU signals for voltage and frequency signals. Owing to the time-varying conditions in power system operations, the operation and bios conditions are ambiguous. Hence, it is crucial to capture the dynamic signature in the subtransient period when the event occurs. The wavelet technique is useful for the analysis of non-stationary PMU signals and is used to acquire the short-term characteristics of a signal during preprocessing [28]. The detail coefficients from the wavelet analysis are coefficients that represent the abrupt changes in time-localized signals, and a wavelet transform technique is applied to each time-series data. The defined discrete wavelet transform (DWT) function obtains the 1 level detail coefficients of the original discrete signal x [ k ] as follows:
D W T ( x [ n ] ) = m x [ k ] ϕ m [ 2 n k ]
where the designed wavelet basis ϕ serves as a high-pass filter, and m is the inner product shifted by the original signal x [ n ] in each time stamp. The detail coefficient comprises a downsampled number of original windowing samples. From the DWT operation, the image data configurations are represented using the detail coefficients as follows:
I M G 1 V = [ D W T ( V 1 P M U ) ; ; D W T ( V n P M U ) ] , I M G 1 F = [ D W T ( F 1 P M U ) ; ; D W T ( F n P M U ) ]
where the 1-D D W T ( v i P M U ) sets construct the i-th row of the I M G 1 V , F for the voltage and frequency channels. A wavelet basis must be designed to shift the inner product of the signal. For the design of the wavelet basis, developed lists of well-used wavelet bases are available, such as the Daubechies wavelet basis. Because it is difficult to simply compare the accuracy of different wavelet basis in a CNN with the same structure, the selection of wavelet basis follows the previous study that conducts the performance evaluations of wavelet bases for PMU signal [29]. As shown in Figure 3c,d, the use of Equation (4) signal sets yields of two-channel voltage and frequency set, which captures the abrupt change in the event time with a normalized value using the Daubeche 3 wavelet basis. These figures show that the detail coefficient captures the abrupt change in the event occurrence time as 2-D image data. In other words, the PMU vs. time domain approach is an efficient signature for a short time window and fast identification.
(2) PMU vs. PMU domain: The complementary preprocessing data are derived via correlation analysis between PMU time-series signals, where the correlation matrix snapshot shows the relationship pertaining to the distributed dynamics. The matrix size depends on the useable PMU installation status and the construction of the symmetric correlation matrix. The correlation operation between 1-D signals is represented as follows:
c o r r ( c n ; c m ) = i = 1 N L ( c n , i c n ¯ ) ( c m , i c m ¯ ) i = 1 N L ( c n , i c n ¯ ) 2 i = 1 N L ( c m , i c m ¯ ) 2
where c o r r ( c n , c m ) implies the calculation of the correlation coefficients between the N L length windowing signals c n and c m , and the correlation matrix that involves the similarities of two event signals from each sensor position. The constructed snapshots are expressed as follows:
I M G 2 V ( n , m ) = c o r r ( V n P M U ; V m P M U ) , I M G 2 F ( n , m ) = c o r r ( F n P M U ; F m P M U )
where I M G 2 V , F is an # P M U × # P M U symmetric matrix composed of correlation coefficients for the voltage and frequency channels, respectively. Furthermore, a correlation matrix is formed through the structure of multiple sensors, as shown in Figure 3e,f, where the results from analyzing the voltage signal information in the form of a correlation matrix. Unlike the Figure 3c,d, this figure does not allow one to visually analyze the variability of the transient signals over time. Meanwhile, through similarity analysis, the location information is analyzed with the event and the variability in similarity, simultaneously. The variation in the voltage level of each PMU over time is represented in the form of a heatmap image, where the size of the correlation matrix depends only on the PMU set instead of the measured time length.

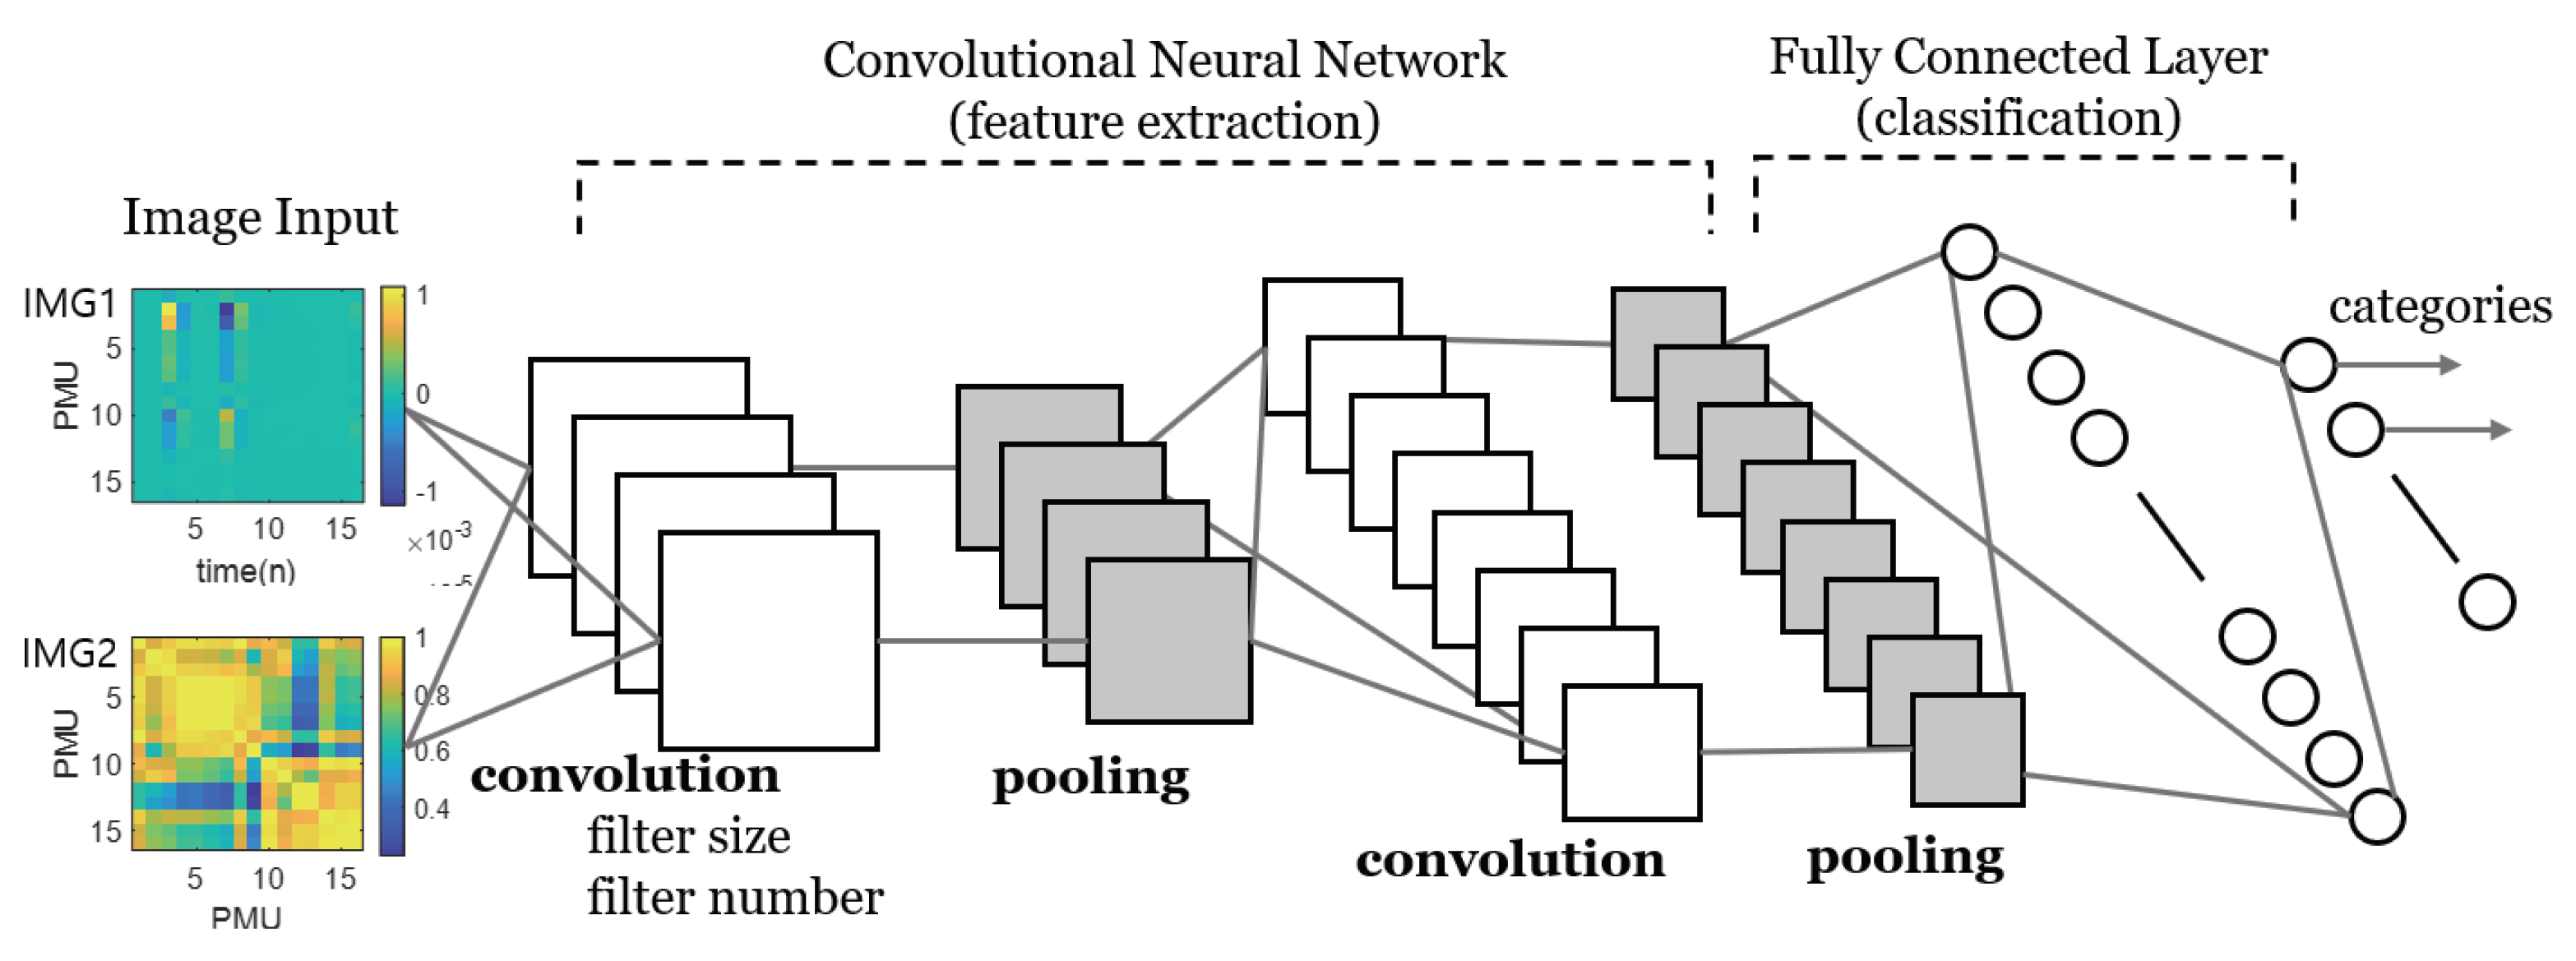
3.2. Multi-Channel CNN Classifier

The simultaneous use of voltage and frequency information requires a CNN with a two-channel input structure. Hence, the proposed CNN structure is designed as a two-channel input structure, as shown in Figure 4, and convolution is performed through the same filter structure, as follows:
s p [ m , n ] = m n c p [ m + v , n + w ] K [ v , w ]
where the output of convolutional layers s p and the following pooling layers are determined by the filter size, number of filters, and input size. For the proposed CNN structures, the image size in the image input layer is specified. At this time, the size of the input image depends on the PMU measurement structure of the target power system, and based on this size, appropriate hyperparameters are designed for each target power system. The filter size and number are designed using the grid search approach. Therefore, the CNN hyperparameter structure used is described in the case study.
In addition to the convolution step, the activation functions used in the placement and FC layer steps used in the proposed CNN structure are the rectified linear unit layer. The batch normalization layer is followed by a non-linear activation function, which is the most frequently used activation function in the CNN operation. When the perceived information is being processed, the Softmax activation function normalizes the output of the FC layer, where the output of the Softmax layer comprises positive numbers with a sum of one. This value can be used as the classification probability for the classification layer. Classification is performed in the form of multiple outputs using the Softmax function. In addition to the multichannel input, the output categories are designed for different event types and locations for classification. However, the output categories do not contain multiple channels. Two separated CNNs are constructed to accommodate the types and locations as C1 and C2 classifications. Whereas the C1 and C2 classifications involve different domains in the input data, the categories of the types comprise the number of events in general power systems, and the location categories depend on the target power systems.

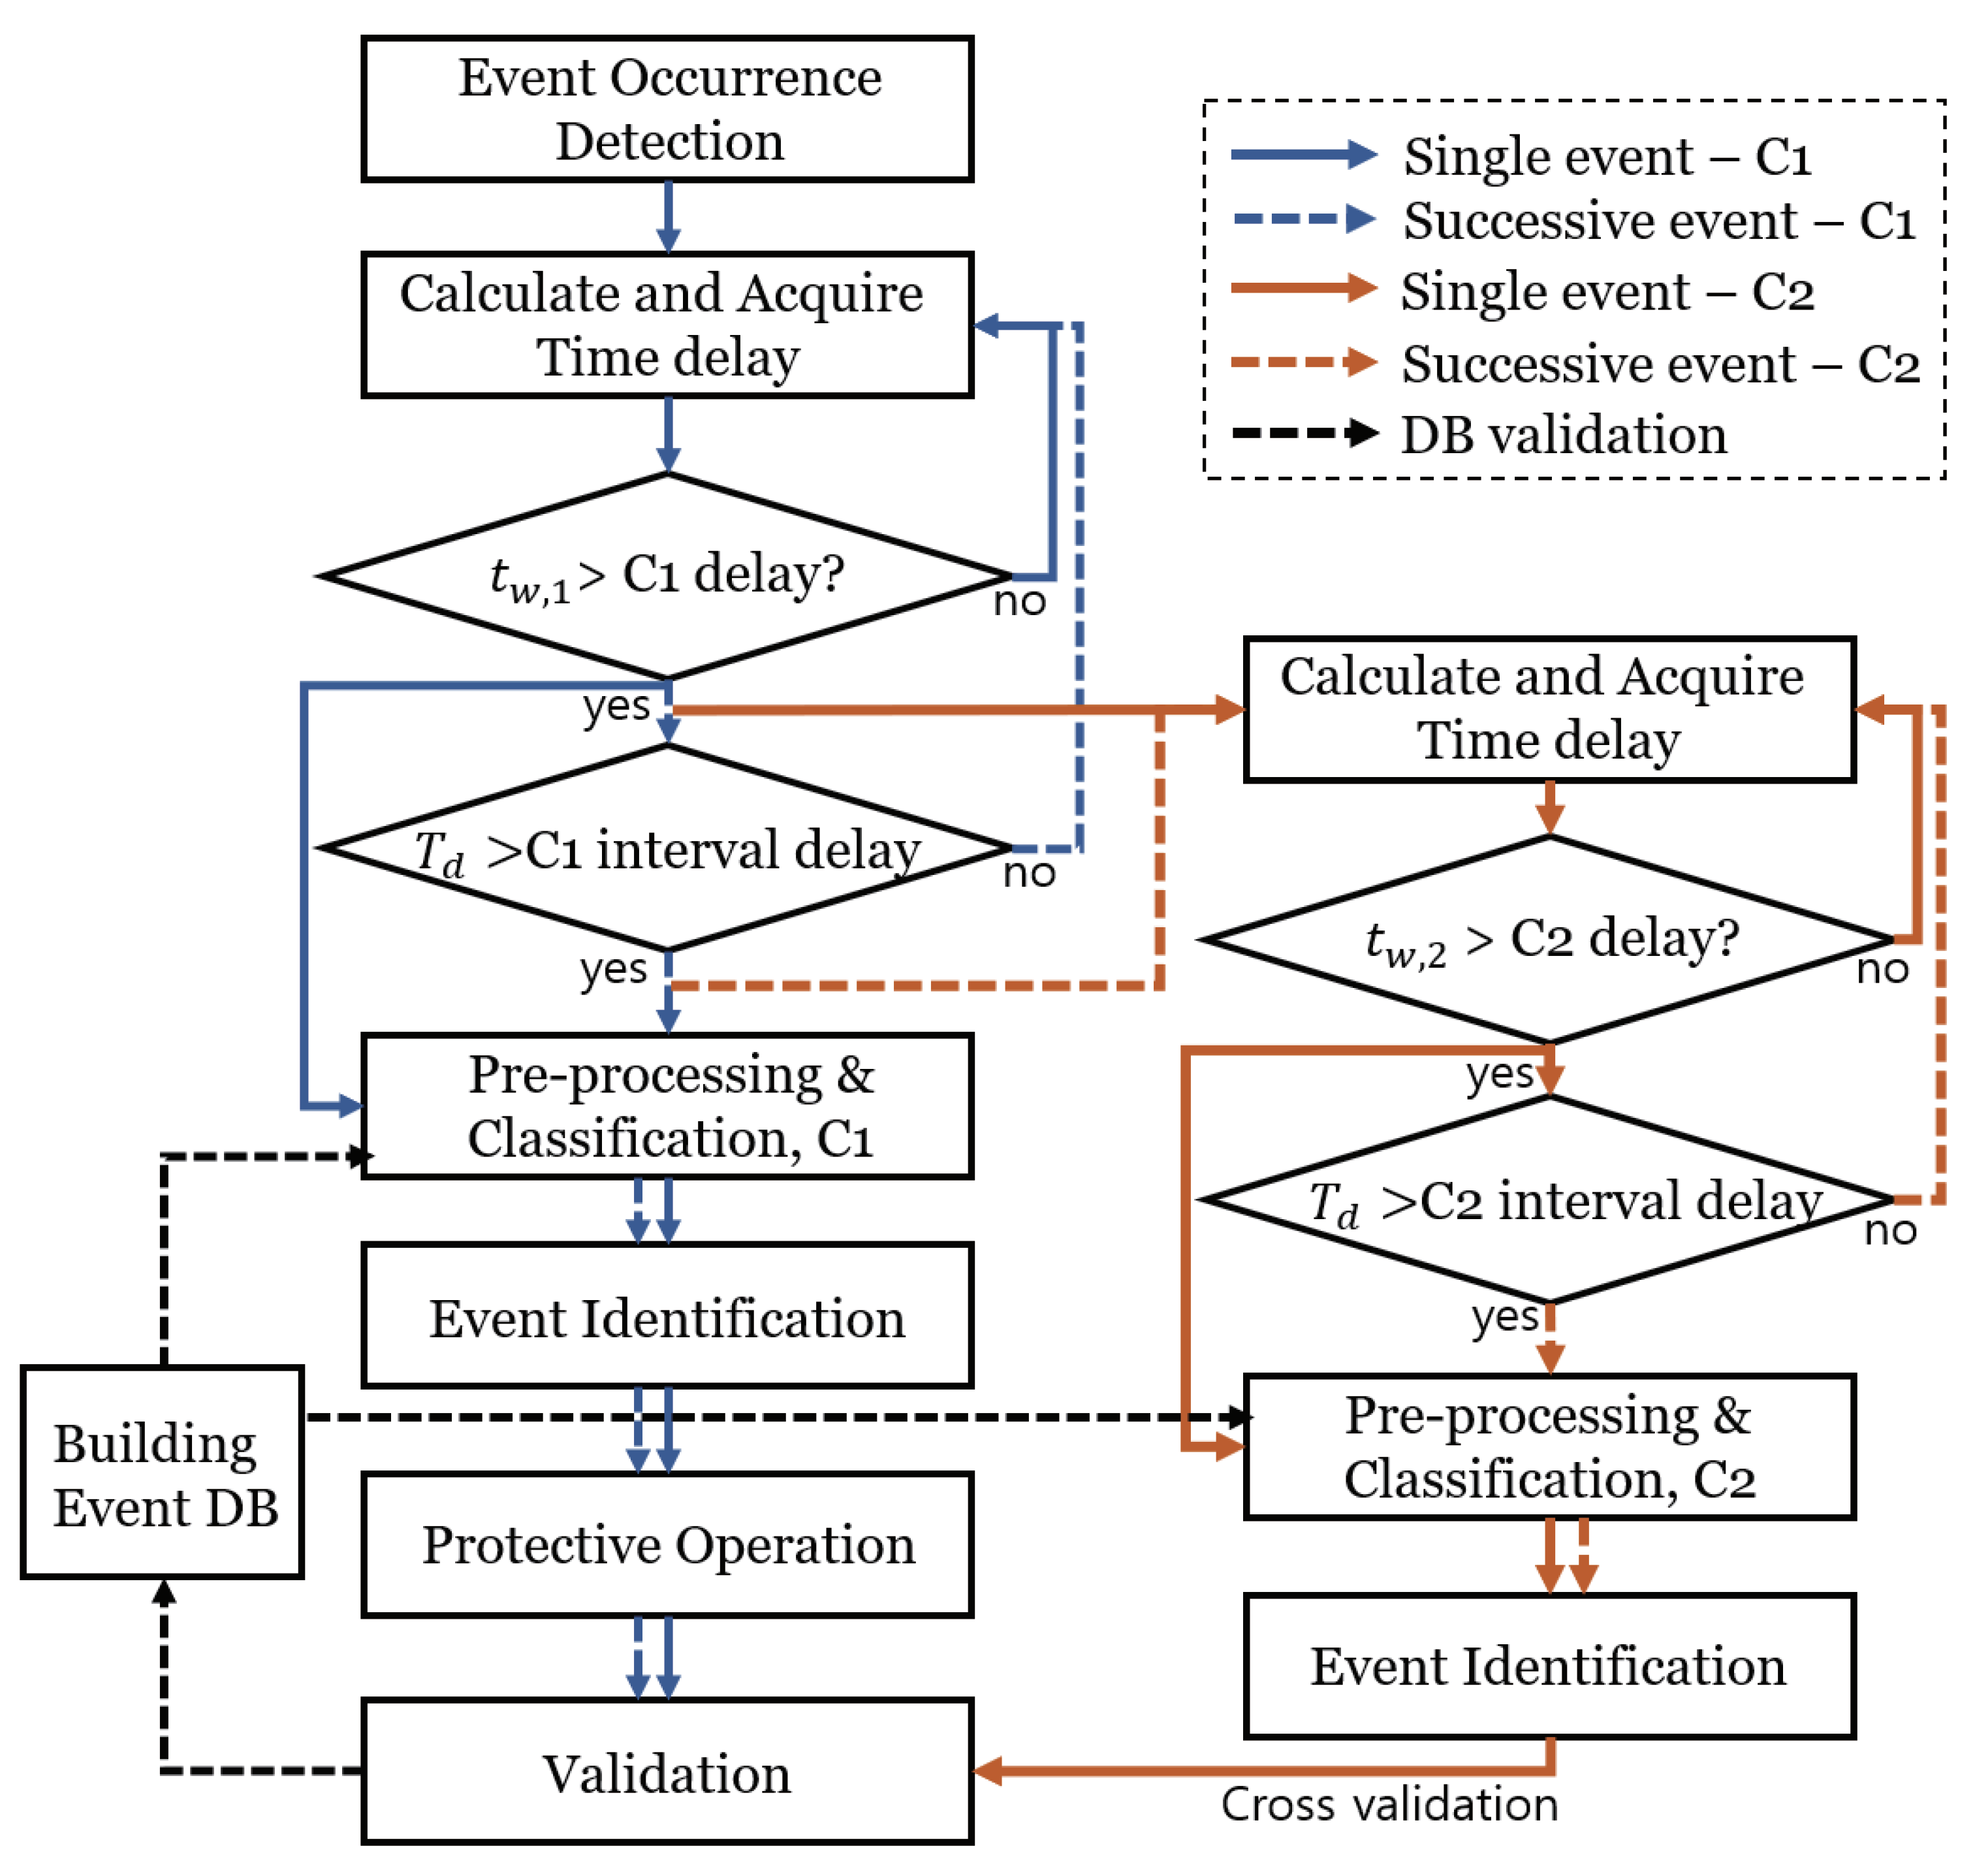
3.3. Event Identification Process

The entire process includes preprocessing, CNN-based power information recognition, and multichannel CNN design. The flowchart of the overall flow design process is shown in Figure 5. In the design of the preprocessing stage, the Daubechies wavelet basis is selected for the sychrophasor voltage and frequency signal, where the Daubechies basis is tested for the power system signals and indicated high performance [30]. The PMU dataset is not a design factor in this work, but an environment of the target power system. In other words, the input data sizes are determined by the target system conditions. The input data are considered in the decision of the CNN classifier, where the design of the hyperparameter of the CNN is determined by the input data size based on the grid search method. The details of the designed CNN are described in the case study.
During online monitoring, the dynamic signature in the PMU signal indicates the detectable event. After a delay in the data acquisition time, the decision for C1 classification is performed for a fast protective operation, and validation is performed via C2 classification. In the case of successive events, a second event identification is performed after the additional data acquisition time. The second event acquisition time depends on the first event and its subtransient periods. The first test and validation network are separated because the connected four-channel neural network downgraded the detection performance. Hence, two separate classifiers are designed for event identification, where the identification information pertains to the event types and locations for system protection.
The target category might be classified as the real and reactive power effects of the voltage and frequency signal. In this study, the output categories are designed as statuses in generation and load variance, line faults, etc. In addition, for location identification in wide-area power systems, the grouping of the power system area for classification is key. This is because it is difficult to acquire the training data from every point or estimate the location using a regression method in a wide-area power system. In addition, the system exhibits varying power system conditions; hence, classification-based location estimation can be considered a suitable method. The grouping method involves network connection and node grouping. The details of the categories are described in the case study. Finally, using the designed event detection process, the system event information can be identified under additional successive event conditions.

4. Case Study

A database for the application stage of data-driven approaches in power systems must be secured; however, it is difficult to perform random tests on actual power systems. An alternative method is to build an abnormal signal database using the IEEE Standard model and conduct a study regarding the application of a CNN-based rapid event identification method and real-world operation data acquisition. In this study, the target power system used is the IEEE standard 68 bus model that represents the reduced order equivalent of the New England test system linked with New York power system. The simulations are performed using PSS/E software for various events in a power system, in which the details about model information composed of 16 machines and 5 areas, can be found in [31] including network, equipment, parameters. The target categories for the classification, such as the event types and locations, are calibrated to accommodate the target system, where the detailed partition of the location group provided a high resolution while requiring more training data. The details of the information and the event identification results are described in the following subsections.

4.1. Target System Analysis

For iterative simulations, Python executes iterative PSS/E simulations for IEEE test systems. In this study, analytic event categories are organized into six events, and 4908 event cases are generated through repeated execution by changing the event conditions such as the type, cycle, location, and rate of change. In our previous study pertaining to event location identification [28], the event location categories are analyzed using the clustering method. This is advantageous because similar dynamics guarantee the location of the group estimation. However, because similarity-based clustering cannot guarantee the uniform distribution of the group area range, uniform location grouping should be adapted to the frequency of occurrence.
In this regard, the location categories in the target system are categorized as follows: (1) Event types: The events are categorized into six types as branch trip (BT), voltage reference change (VR), generation loss (GL), real power load loss (LL), line to ground fault (LG), reactive power loss (RL). (2) Event locations: In this work, the electrical bus groups are uniformly partitioned with the connectivity and the event location between partitioned areas belonging to the starting area. The used data channels are matched with the voltage magnitude and frequency, except for the current data. In addition, by configuring the scenario for the PMU channel installation, they are configured to utilize the PMU channel set instead of the entire node monitoring. Studies regarding the optimal PMU location in the IEEE 68 bus system have been conducted [26], where one of the PMU monitoring methods is used to monitor each generator output stage [32] for the efficient monitoring of the target system.
Hence, the PMU set is configured into 10, 16, and 23 measurement sets, where the 16 PMU set monitored the generation input data. In case that 16 PMU dataset is used as an example, each time sequence matrix and correlation matrix comprised a (16 × 20) and (16 × 16) matrix these are matched with number of PMUs and time samples, respectively. The typical input data of the CNN classifier are shown in Figure 6a–e, where each image involves the features reflecting event types in I M G 1 and I M G 2 . Please note that these figures do not reflect the representative images of each event type, but one of the examples in each event type, which is affected by the scale, location, and type. In addition, these image features are used to train the CNN classifier for the second event as well as the single event. The simulation for the analysis of the second event is performed using the same event. To implement the CNN-based event classification technique, an optimal CNN structure is designed using the grid search approach. The CNN structure comprised two convolution layers, a pooling layer, and a filter comprising eight (3 × 3) matrices with a stride depth of 3. To satisfy the purpose of introducing the CNN structure based on the final design of the CNN structure, the accuracies of classification and failure area estimation are analyzed based on the data acquisition time.

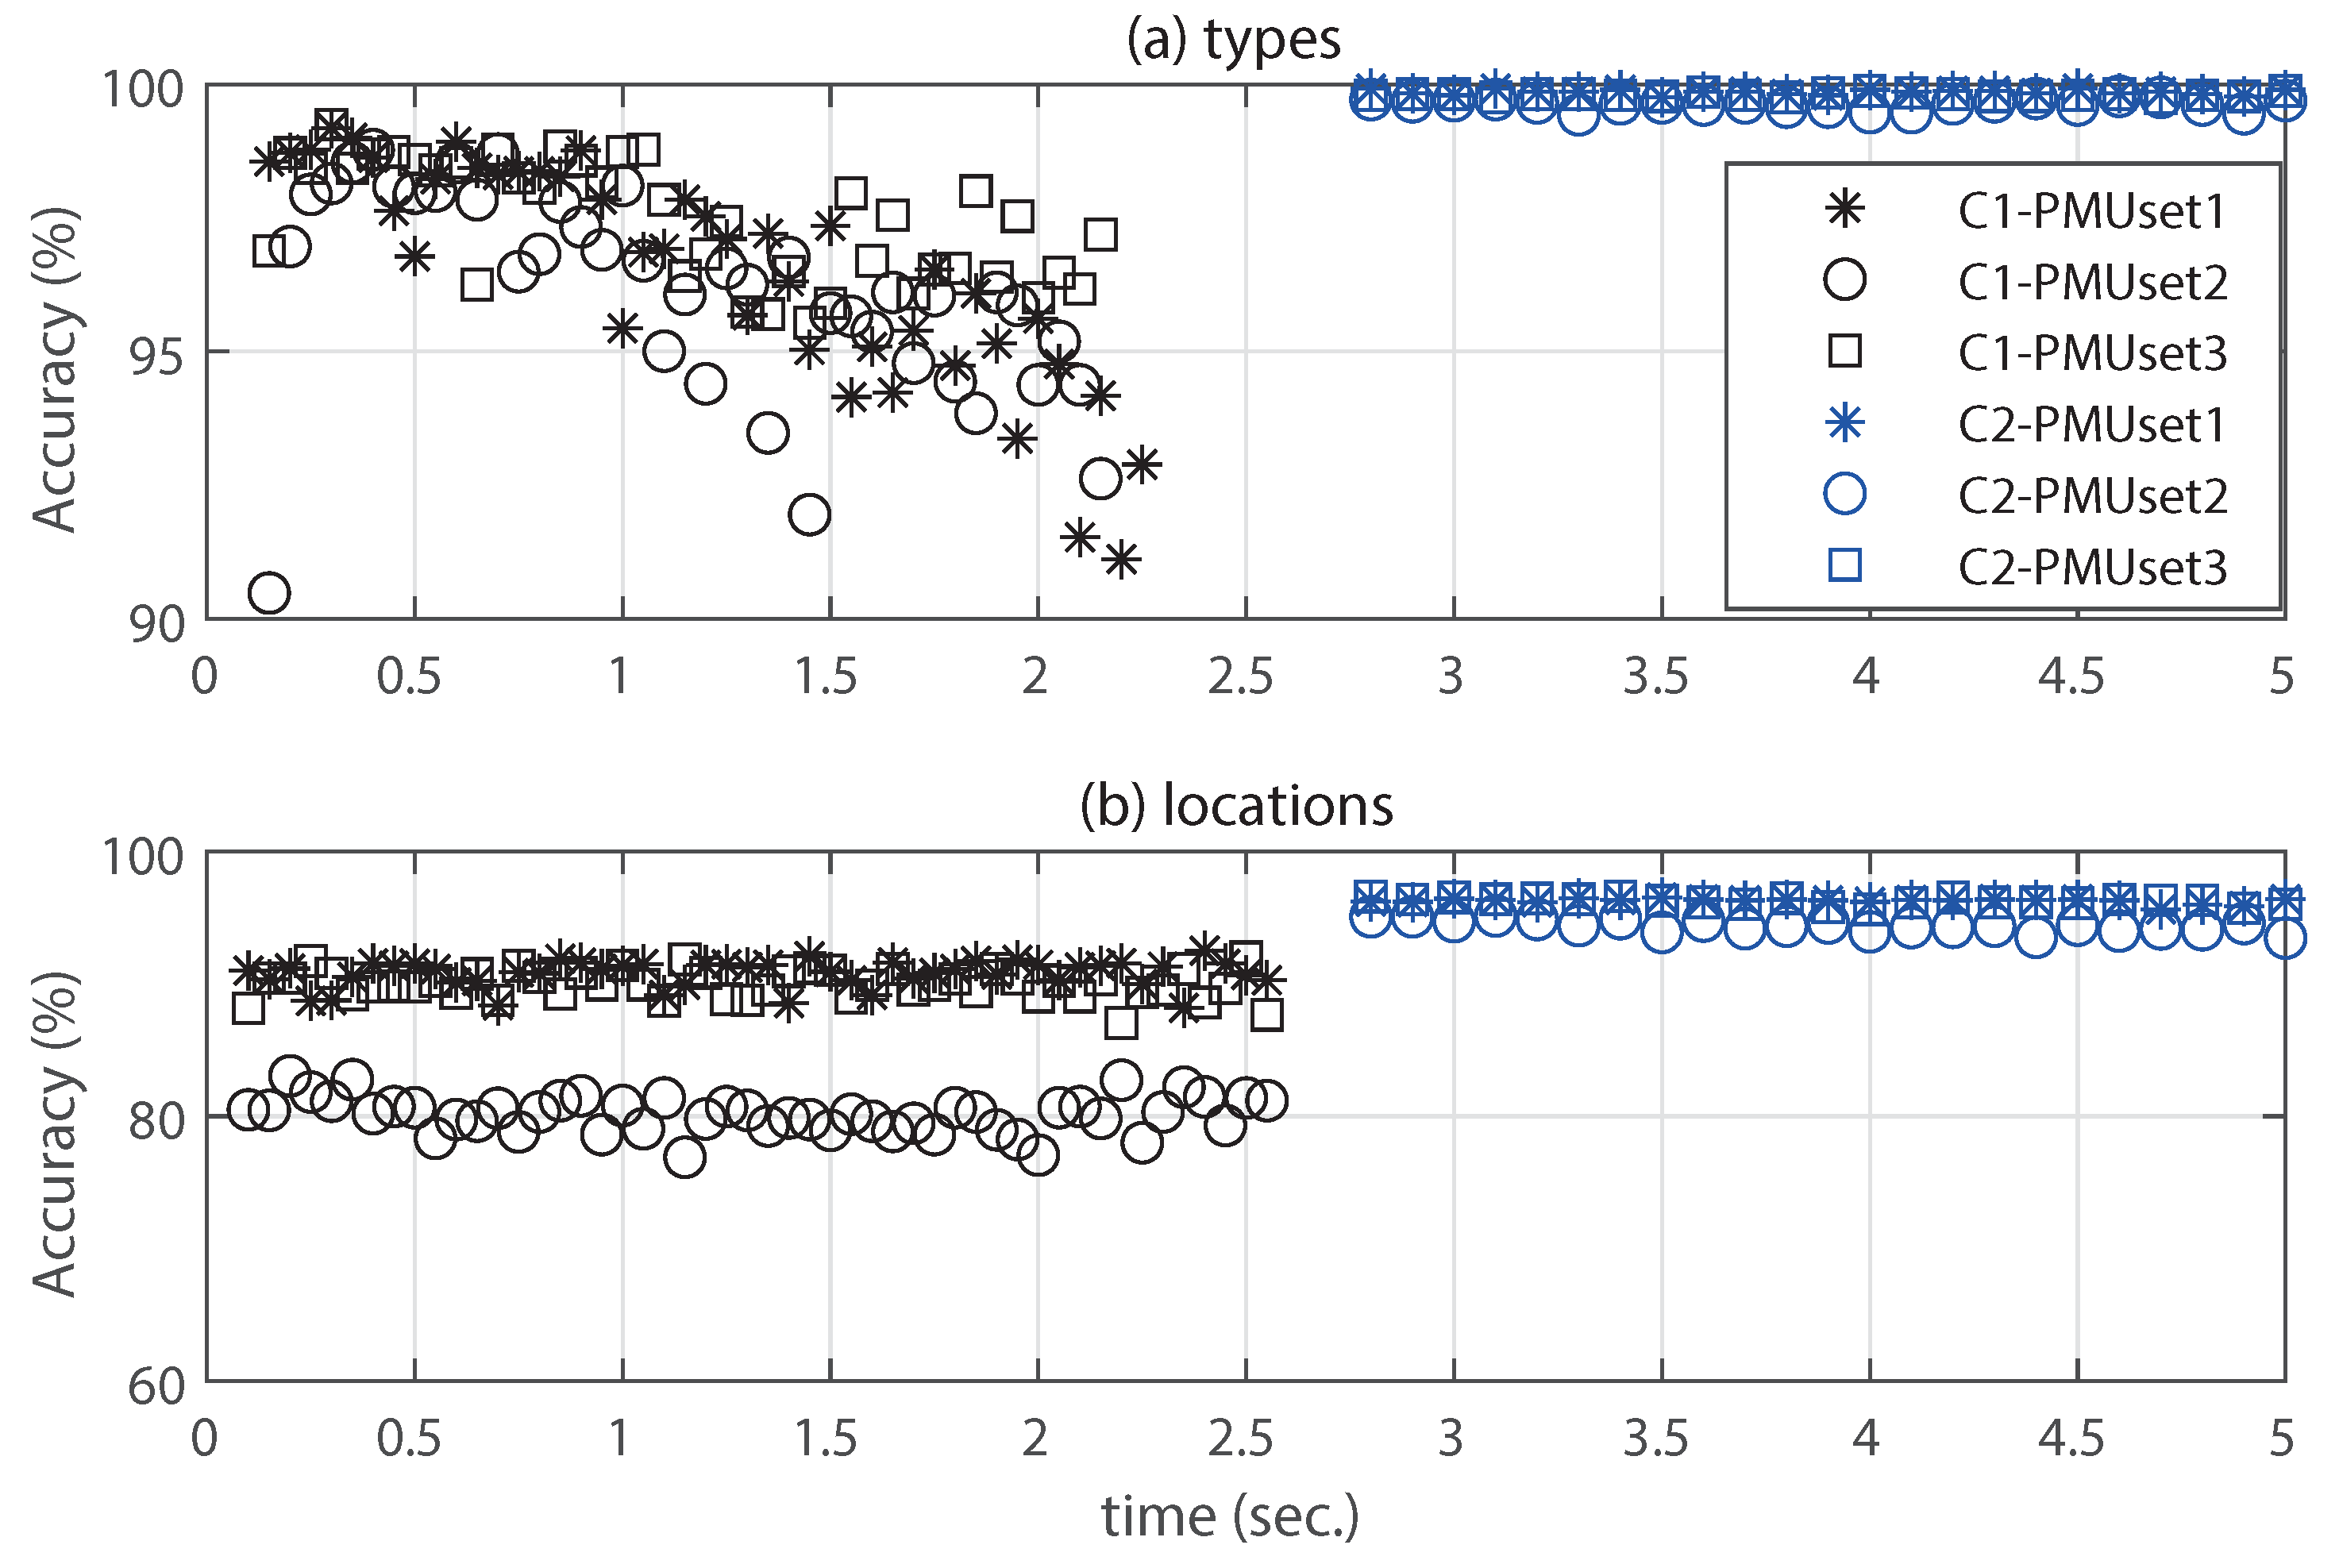
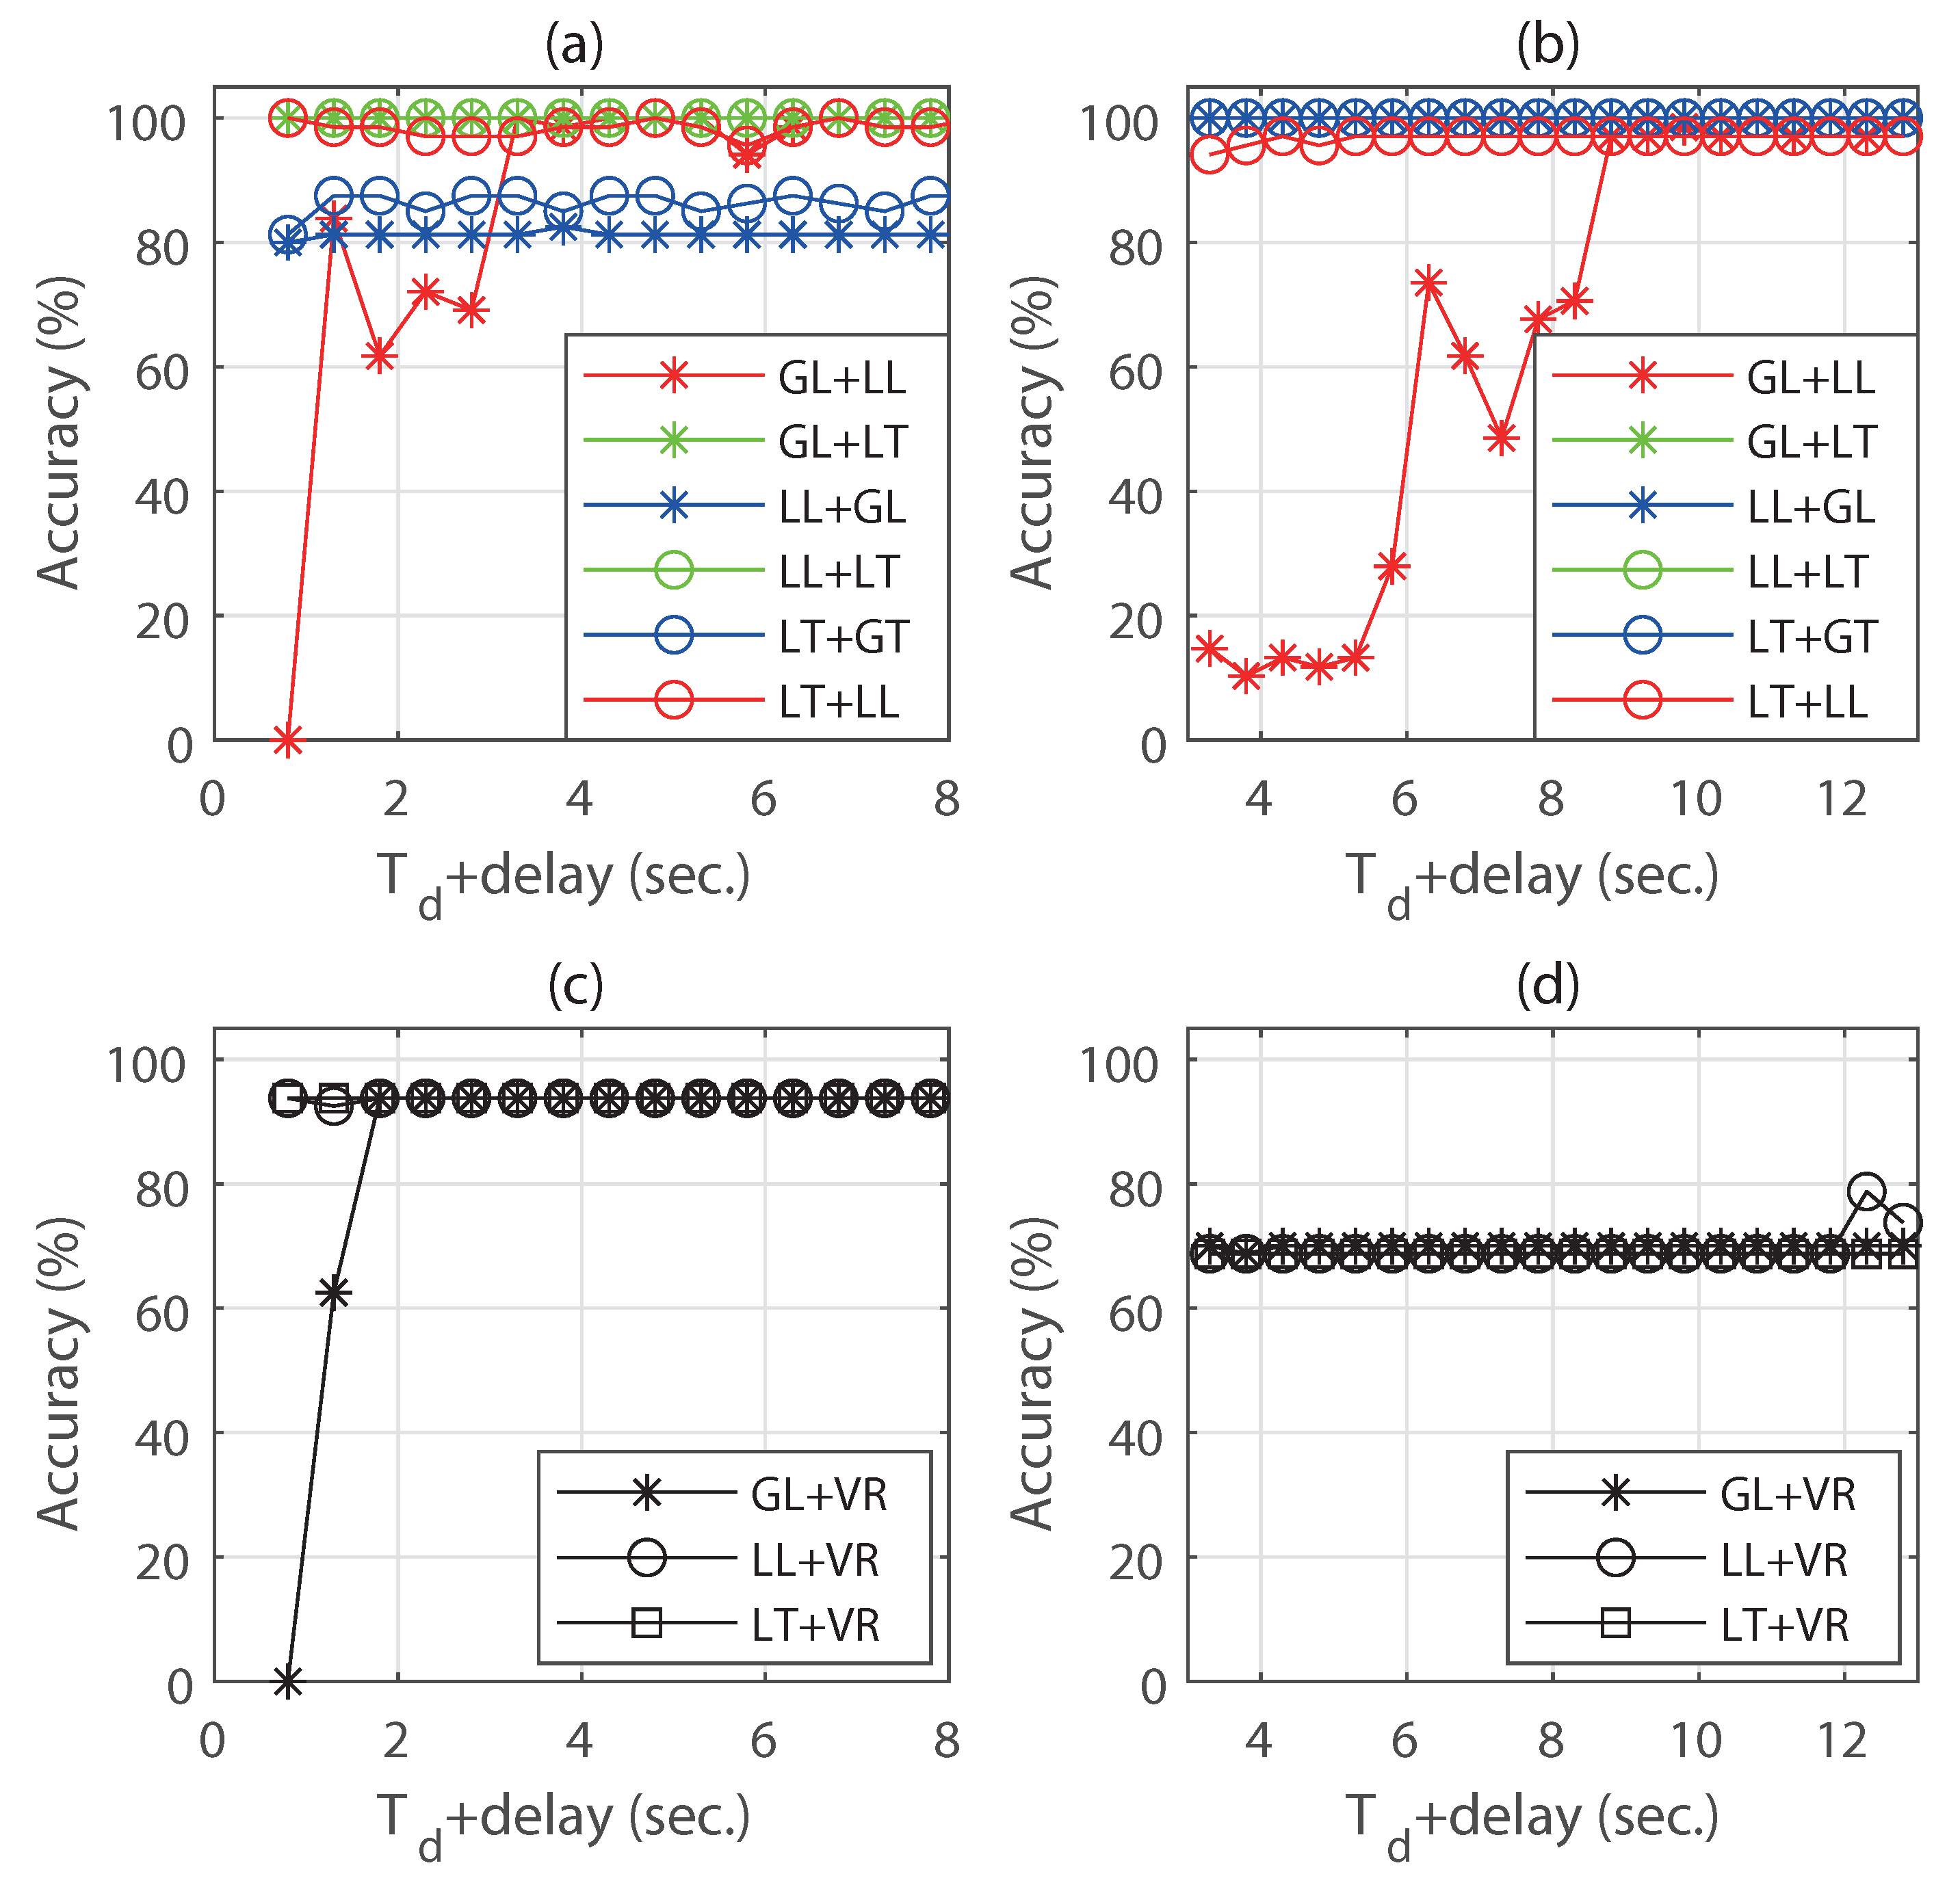
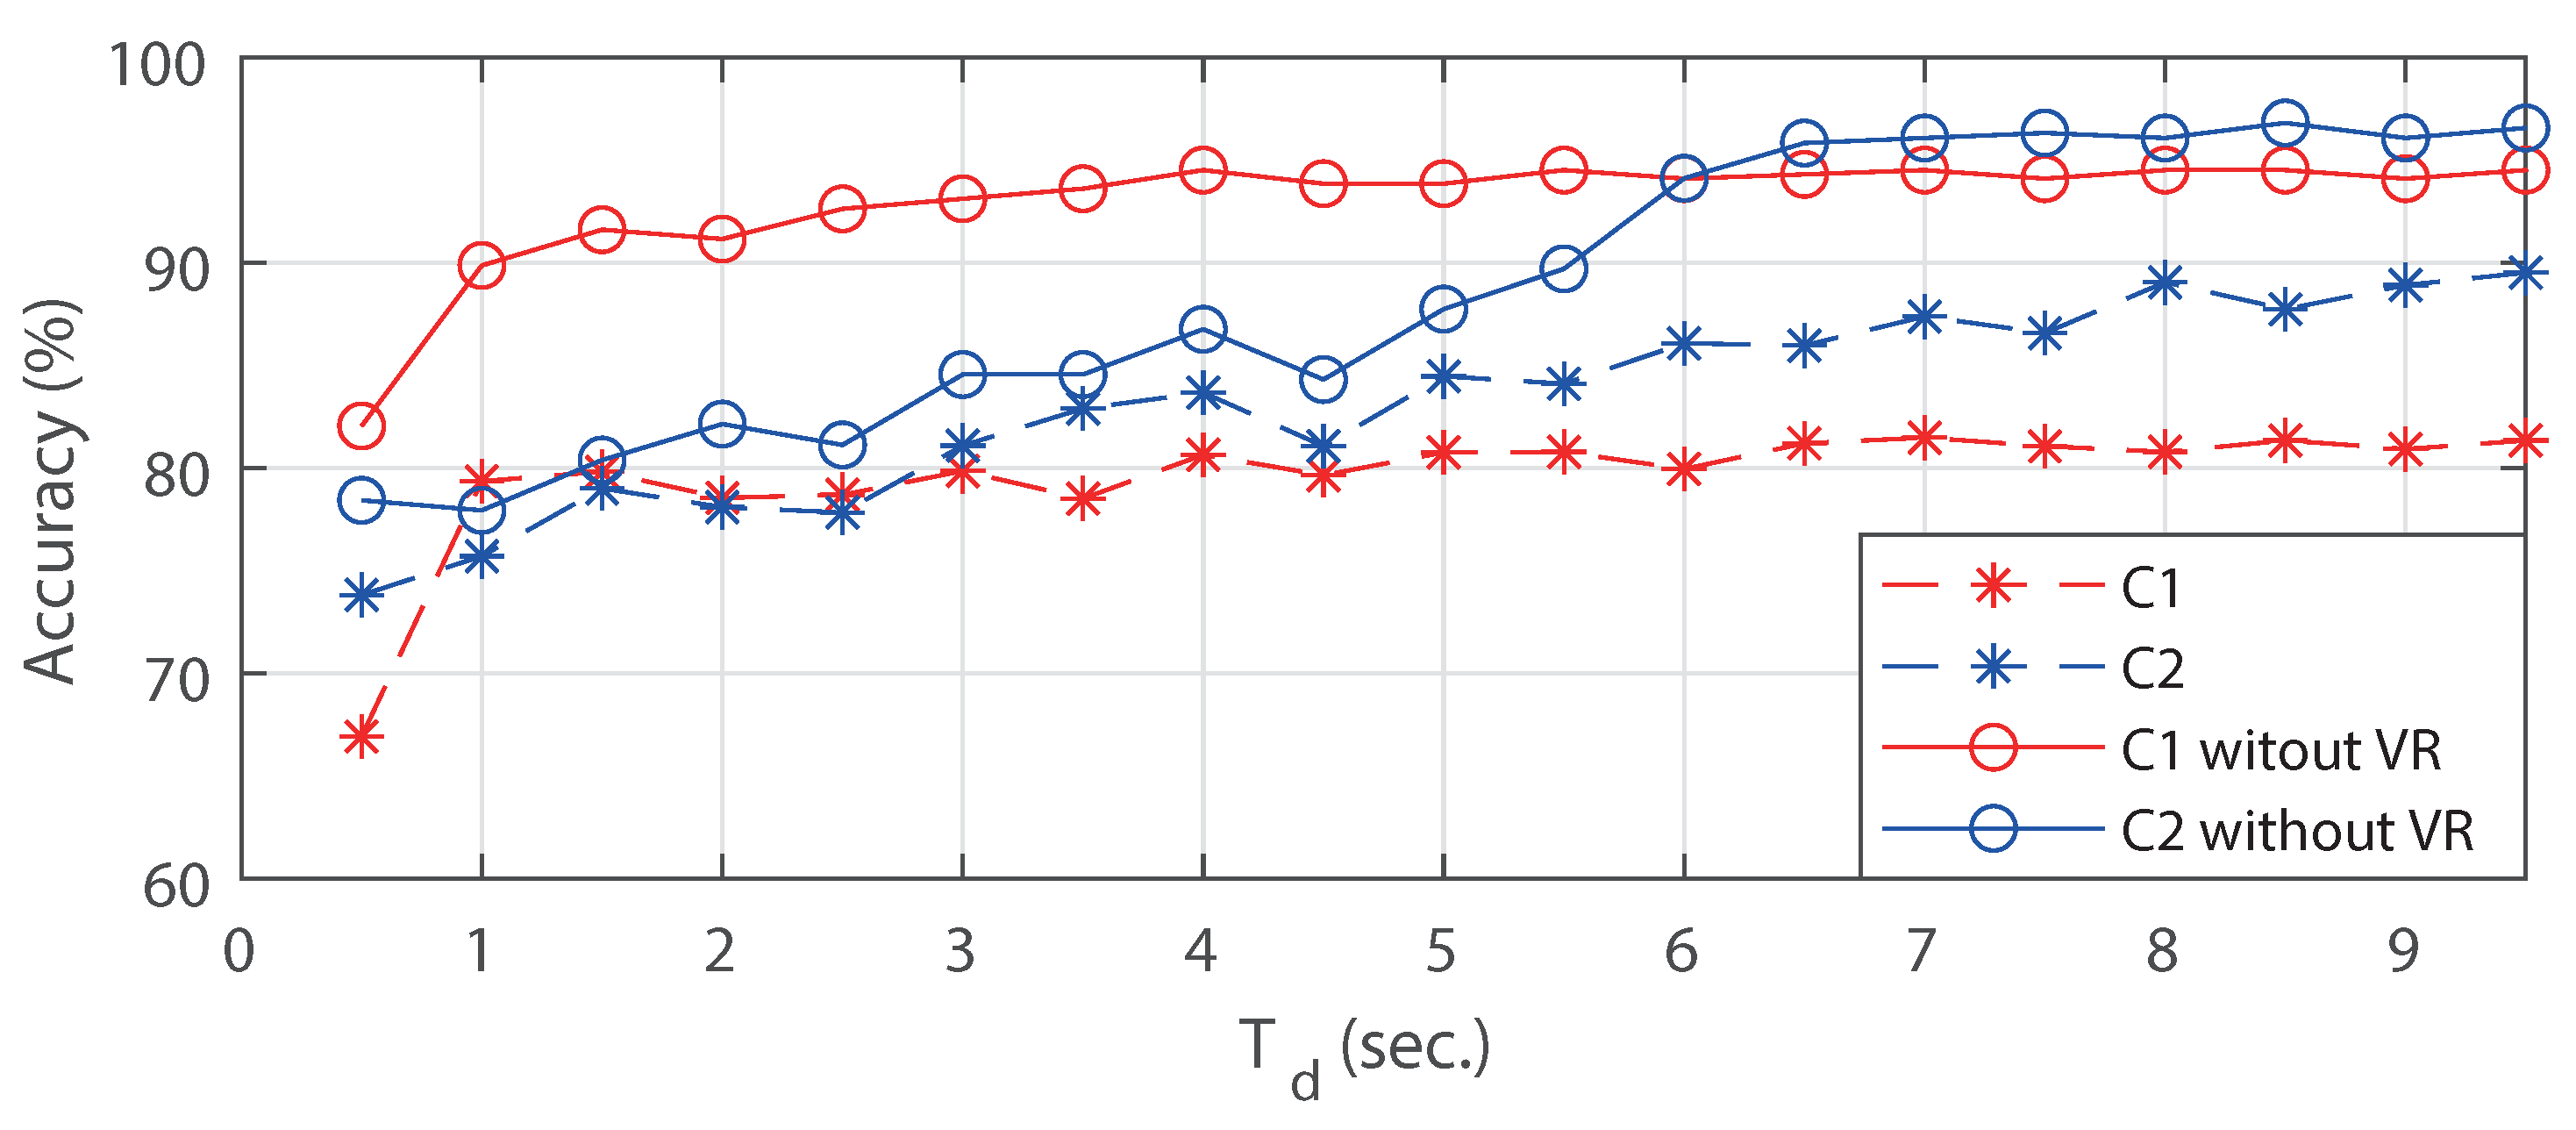
4.2. Numerical Result

The result of single event classifications for the event types and location groups is shown in Figure 7, where the accuracy rates are obtained under three different PMU set conditions. As expected, the C1 classifier can capture the event information after a short data acquisition time. In Figure 7, the results of type and location estimation by the C1 classifier indicate a high accuracy between 0.12 and 0.5 s. However, the longer the data acquisition time in C1 classification with a fixed feature size, the lower is the accuracy owing to the meaningless information. Meanwhile, the C2 validation stage indicates a low speed for the classification after 2.8 s; however, a stable, high accuracy is guaranteed. For the single event identification, C1 classification can be used for fast identification and C2 classification for validation as summarized in Table 1. In particular, for the location group estimation, the C2 classifier performed better than the C1 classifier because the cross-correlation matrix captured the effect between each PMU.
For the implementation of successive event analysis, three event types (GL, LL, LG) are used for the condition of the first event, and subsequent successive events are analyzed via a second event type and the time difference ( T d ) between the first and second events. Figure 8 shows the trend of the identification accuracy for three types of second events based on the time composed of the event time delay and data acquisition time, where the windowing delay is considered. The trend presented in Figure 8 shows the unconfirmed result for several second events during the subtransient period, whereas it shows the confirmed result for the second event identification even in the transient period. In addition, the subtransient period duration affected the first event type. In Figure 8a,b, first events GL, LL, and LG resulted in different fluctuations, where GL+LL successive events possessed an additional delay time for distinguishing the second event. Meanwhile, as shown in Figure 8c,d, the second event analysis using the C2 classifier is not applicable to the case of a VR second event because of the low fluctuation in the VR event. For the event location estimation, Figure 9 also shows the tendency of C1 and C2 classification accuracy with and without VR event. Hence, based on the second-event test result, the flowchart of the design can be constructed, as shown in Figure 5.

4.3. Discussion

The numerical result can be used to construct the proposed monitoring scheme as well as validate the event identification in each C1 and C2 classification. During C1 classification, variability is immediately detected when a failure occurred; hence, the decision can be achieved within a short data acquisition time. Meanwhile, when C2 classification is used for validation, additional data acquisition time is required to derive a meaningful correlation coefficient even after the transient signal is generated. In the accuracy analysis, it is interpreted that the C1 classification indicated high performance in the time period after the correlation coefficient value is obtained. By verifying the second event for various time differences, information can be analyzed not only in continuous events, but also in fluctuating system conditions. Based on the test results from the target system, the decision time factor can be designed in the flowchart for the applications. Table 2 shows the results of the expected accuracy of the second event based on a combination of the first and second events. The results in the table show the effects and relationship between event types and their delay to identification, where the VR second event is not applicable in the validation stage, and the GL first event shows an additional time delay in the subtransient signal. For the complementary use of the CNN algorithm, a method separating each data acquisition time period is considered appropriate for the typical subtransient signal and the second event signal, based on the time difference of T d . From the results of C1 and C2 classification, the data acquisition time and accuracy exhibit a trade-off relationship, in which the design process of event identification involves a complementary sequence to provide fast identification and validation, and the proposal content includes a quick judgment accuracy analysis and output category design in each complementary stage. Finally, data-analysis-based studies do not require model information except when it is difficult to acquire a real system database.

5. Conclusions

In this paper, the use of PMU data for monitoring the transmission network of a power system is presented. Through a data-driven approach, a complementary decision process corresponding to event identification based on types and locations is achieved. Algorithms are developed for the actual power system implementation, and the proposed structure of the multichannel CNN classifiers yielded almost real-time event identification and detection conditions under successive event occurrences. As the feature combination of successive events is difficult to obtain, the single-event features are extended to successive event identification. The results confirmed the performance in terms of accuracy and time delay in various conditions, although the required time difference between the events is a restriction. In addition, a categorical proposal is provided for successive event identification. In the future, a technical use plan for PMUs can be proposed using the big data analysis method and the application technology presented herein. In addition, through cooperation between PMU data and device control facilities based on real-time system operation data, the base technology for the integrated monitoring and control of future power grids can be secured. Finally, a monitoring system that combines and processes real-time and real-world data of power grids should be implemented in the future.

Funding

This work was supported by the National Research Foundation of Korea(NRF) grant funded by the Korea government(MSIT) (No. 2021R1G1A1006406).

Institutional Review Board Statement

Not applicable.

Informed Consent Statement

Not applicable.

Data Availability Statement

Not applicable.

Conflicts of Interest

The author declare no conflict of interest.

References

  1. Hojabri, M.; Dersch, U.; Papaemmanouil, A.; Bosshart, P. A comprehensive survey on phasor measurement unit applications in distribution systems. Energies 2019, 12, 4552. [Google Scholar] [CrossRef] [Green Version]
  2. Salehi, V.; Mazloomzadeh, A.; Fernandez, J.F.; Mohammed, O.A. Real-time power system analysis and security monitoring by WAMPAC systems. In Proceedings of the IEEE PES Innovative Smart Grid Technology, Washington, DC, USA, 16–20 January 2012; pp. 1–8. [Google Scholar]
  3. Almas, M.S.; Vanfretti, L. Impact of time-synchronization signal loss on PMU-based WAMPAC applications. In Proceedings of the IEEE PES General Meeting, Boston, MA, USA, 17–21 July 2016; pp. 1–5. [Google Scholar]
  4. Aminifar, F.; Fotuhi-Firuzabad, M.; Safdarian, A.; Davoudi, A.; Shaidehpour, M. Synchrophasor measurement technology in power systems: Panorama and state-of-the-art. IEEE Access 2015, 2, 1611–1628. [Google Scholar] [CrossRef]
  5. Su, H.-Y.; Liu, T.-Y. A PMU-based method for smart transmission grid voltage security visualization and monitoring. Energies 2017, 10, 1103. [Google Scholar] [CrossRef] [Green Version]
  6. Hong, J.-S.; Sim, G.-D.; Choi, J.-H.; Ahn, S.-J.; Yun, S.-Y. Fault location method using phasor measurement units and short circuit analysis for power distribution networks. Energies 2020, 13, 1294. [Google Scholar] [CrossRef] [Green Version]
  7. Shen, Y.; Abubakar, M.; Liu, H.; Hussain, F. Power quality disturbance monitoring and classification based on improved PCA and convolution neural network for wind-grid distribution systems. Energies 2019, 12, 1280. [Google Scholar] [CrossRef] [Green Version]
  8. Sun, J.; Xia, M.; Chen, Q. A Classification identification method based on phasor measurement for distribution line parameter identification under insufficient measurement conditions. IEEE Access 2019, 7, 158732–158743. [Google Scholar] [CrossRef]
  9. Brahma, S.; Kavasseri, R.; Cao, H.; Chaudhuri, N.R.; Alexopoulos, T.; Cui, Y. Real-time identification of dynamic events in power systems using PMU data, and potential applications-models, promises, and challenges. IEEE Trans. Power Del. 2017, 32, 294–301. [Google Scholar] [CrossRef]
  10. Shi, X.; Qiu, R.; Ling, Z.; Yang, F.; Yang, H.; He, X. Spatio-temporal correlation analysis of online monitoring data for anomaly detection and location in distribution networks. IEEE Trans. Smart Grid 2020, 11, 995–1006. [Google Scholar] [CrossRef] [Green Version]
  11. Yang, F.; Qiu, R.C.; Ling, Z.; He, X.; Yang, H. Detection and analysis of multiple events based on high-dimensional factor models in power grid. Energies 2019, 12, 1360. [Google Scholar] [CrossRef] [Green Version]
  12. Zhu, Y.; Liu, C.; Sun, K. Image embedding of PMU data for deep learning towards transient disturbance classification. In Proceedings of the IEEE International Conference on Energy Internet, Beijing, China, 21–25 May 2018; pp. 1–6. [Google Scholar]
  13. Garcia, C.I.; Grasso, F.; Luchetta, A.; Piccirilli, M.C.; Paolucci, L.; Talluri, G. A comparison of power quality disturbance detection and classification methods using CNN, LSTM and CNN-LSTM. Appl. Sci. 2020, 10, 6755. [Google Scholar] [CrossRef]
  14. Amoateng, D.O.; Yan, R.; Saha, T.K. A deep unsupervised learning approach to PMU event detection in an active distribution network. In Proceedings of the IEEE PES General Meeting, Montreal, QC, Canada, 2–6 August 2020; pp. 1–5. [Google Scholar]
  15. Ma, R.; Basumallik, S.; Eftekharnejad, S. A PMU-based data-driven approach for classifying power system events considering cyberattacks. IEEE Syst. J. 2020, 14, 3558–3569. [Google Scholar] [CrossRef]
  16. Zhang, M.; Li, J.; Xu, R. Deep learning for short-term voltage stability assessment of power systems. IEEE Access 2021, 9, 29711–29718. [Google Scholar] [CrossRef]
  17. Ren, C.; Xu, Y. A fully data-driven method based on generative adversarial networks for power system dynamic security assessment with missing data. IEEE Trans. Power Syst. 2019, 34, 5044–5052. [Google Scholar] [CrossRef]
  18. Olivieri, C.; Paulis, F.D.; Orlandi, A.; Pisani, C.; Giannuzzi, G.; Salvati, R.; Zaottini, R. Estimation of Modal Parameters for Inter-Area Oscillations Analysis by a Machine Learning Approach with Offline Training. Energies 2020, 13, 6410. [Google Scholar] [CrossRef]
  19. Wang, S.; Dehghanian, P.; Li, L. Power grid online surveillance through PMU-embedded convolutional neural networks. IEEE Trans. Indust. Appl. 2020, 56, 1146–1155. [Google Scholar] [CrossRef]
  20. Rivas, A.; Chamoso, P.; González-Briones, A.; Corchado, J.M. Detection of cattle using drones and convolutional neural networks. Sensors 2018, 18, 2048. [Google Scholar] [CrossRef] [Green Version]
  21. Wshah, S.; Shadid, R.; Wu, Y.; Matar, M.; Xu, B.; Wu, W.; Lin, L.; Elmoudi, R. Deep learning for model parameter calibration in power systems. In Proceedings of the IEEE International Conference on Power Systems Technology, Banglaore, India, 13–16 September 2020; pp. 1–6. [Google Scholar]
  22. Ryu, S.; Choi, H.; Lee, H.; Kim, H. Convolutional autoencoder based feature extraction and clustering for customer load analysis. IEEE Trans. Power Syst. 2020, 35, 1048–1060. [Google Scholar] [CrossRef]
  23. Li, W.; Deka, D.; Chertkov, M.; Wang, M. Real-time faulted line localization and PMU placement in power systems through convolutional neural networks. IEEE Trans. Power Syst. 2019, 34, 4640–4651. [Google Scholar] [CrossRef] [Green Version]
  24. Li, W.; Wang, M. Identifying overlapping successive events using a shallow convolutional neural network. IEEE Trans. Power Syst. 2019, 34, 4762–4772. [Google Scholar] [CrossRef]
  25. Basumallik, S.; Ma, R.; Eftekharnejad, S. Packet-data anomaly detection in PMU-based state estimator using convolutional neural network. Int. J. Electr. Power Energy Syst. 2019, 107, 690–702. [Google Scholar] [CrossRef]
  26. Akhlaghi, S. Optimal PMU placement considering contingency-constraints for power system observability and measurement redundancy. In Proceedings of the IEEE PECI, Urbana, IL, USA, 19–20 February 2016; pp. 1–7. [Google Scholar]
  27. Cai, K.; Cao, W.; Aariniovuori, L.; Pang, H.; Lin, Y.; Li, G. Classification of power quality disturbances using wigner-ville distribution and deep convolutional neural networks. IEEE Access 2019, 7, 119099–119109. [Google Scholar] [CrossRef]
  28. Kim, D.-I.; Wang, L.; Shin, Y.-J. Data driven method for event classification via regional segmentation of power systems. IEEE Access 2020, 8, 48195–48204. [Google Scholar] [CrossRef]
  29. Kim, D.-I.; Chun, T.Y.; Yoon, S.-H.; Lee, G.; Shin, Y.-J. Wavelet-based event detection method using PMU data. IEEE Trans. Smart Grid 2017, 8, 1154–1162. [Google Scholar] [CrossRef]
  30. Megahed, A.I.; Moussa, A.M.; Elrefaie, H.B.; Marghany, Y.M. Selection of a suitable mother wavelet for analyzing power system fault transients. In Proceedings of the IEEE PES General Meeting, Pittsburgh, PA, USA, 20–24 July 2008; pp. 1–7. [Google Scholar]
  31. Abhinav, K.S.; Bikash, C.P. IEEE PES Task Force on Benchmark Systems for Stability Control, Report on the 68-Bus, 16-Machine, 5-Area System. Available online: http://www.sel.eesc.usp.br/ieee/NETS68/base.htm (accessed on 3 December 2013).
  32. Dasgupta, S.; Paramasivam, M.; Vaidya, U.; Ajjarapu, V. PMU-based model-free approach for real-time rotor angle monitoring. IEEE Trans. Power Syst. 2014, 30, 2818–2819. [Google Scholar] [CrossRef]
Figure 1. Process of successive event identification composed of 3 time steps: data acquisition, fast decision, validation.
Energies 14 04446 g001
Figure 2. The structure of the single channel CNN classification using single image feature.
Energies 14 04446 g002
Figure 3. Typical preprocessed feature data: (a,b) are original signals, (c,d) are PMU via time domain data, (e,f) are PMU via PMU domain data for voltage and frequency, respectively.
Energies 14 04446 g003
Figure 4. Multi-channels CNN structure to use the IMG1 voltage and frequency image features (C1 classification).
Energies 14 04446 g004
Figure 5. The proposed flow chart of complementary sequence event identification and protective operation.
Energies 14 04446 g005
Figure 6. The typical 2-D features for six event type categories at (af): each row represents the I M G 1 V , I M G 1 F , I M G 2 V , I M G 2 F , respectively.
Energies 14 04446 g006
Figure 7. The single event identification performance: data acquisition time via accuracy.
Energies 14 04446 g007
Figure 8. Performance of successive event type identification at 3 first event types and 4 following event types with windowing delay (C1: 0.3 s, C2: 2.9 s): (a,c) are C1 classification, (b,d) are C2 classification.
Energies 14 04446 g008
Figure 9. Performance of event location identification without windowing delay.
Energies 14 04446 g009
Table 1. Summary of single event decision time and accuracy.
minimum T w Type EstimationLocation Estimation
C1 classification0.3 s86.90%98.86%
C2 classification2.8 s95.96%99.81%
Table 2. Summary of performance of successive event identification.
1st2nd Event Classification Accuracy
BTVRGLLLLTRL
C1GL98.4493.75-10010098.53
LL97.6693.7581.25-10098.53
LG10093.7587.5097.06-100
C2GL98.4470.00-97.06100100
LL10068.75100-10098.53
LG10068.7510097.06-100
Publisher’s Note: MDPI stays neutral with regard to jurisdictional claims in published maps and institutional affiliations.

