
Daily Power Generation Forecasting Method for a Group of Small Hydropower Stations Considering the Spatial and Temporal Distribution of Precipitation—South China Case Study

Abstract
:1. Introduction
2. Methodology
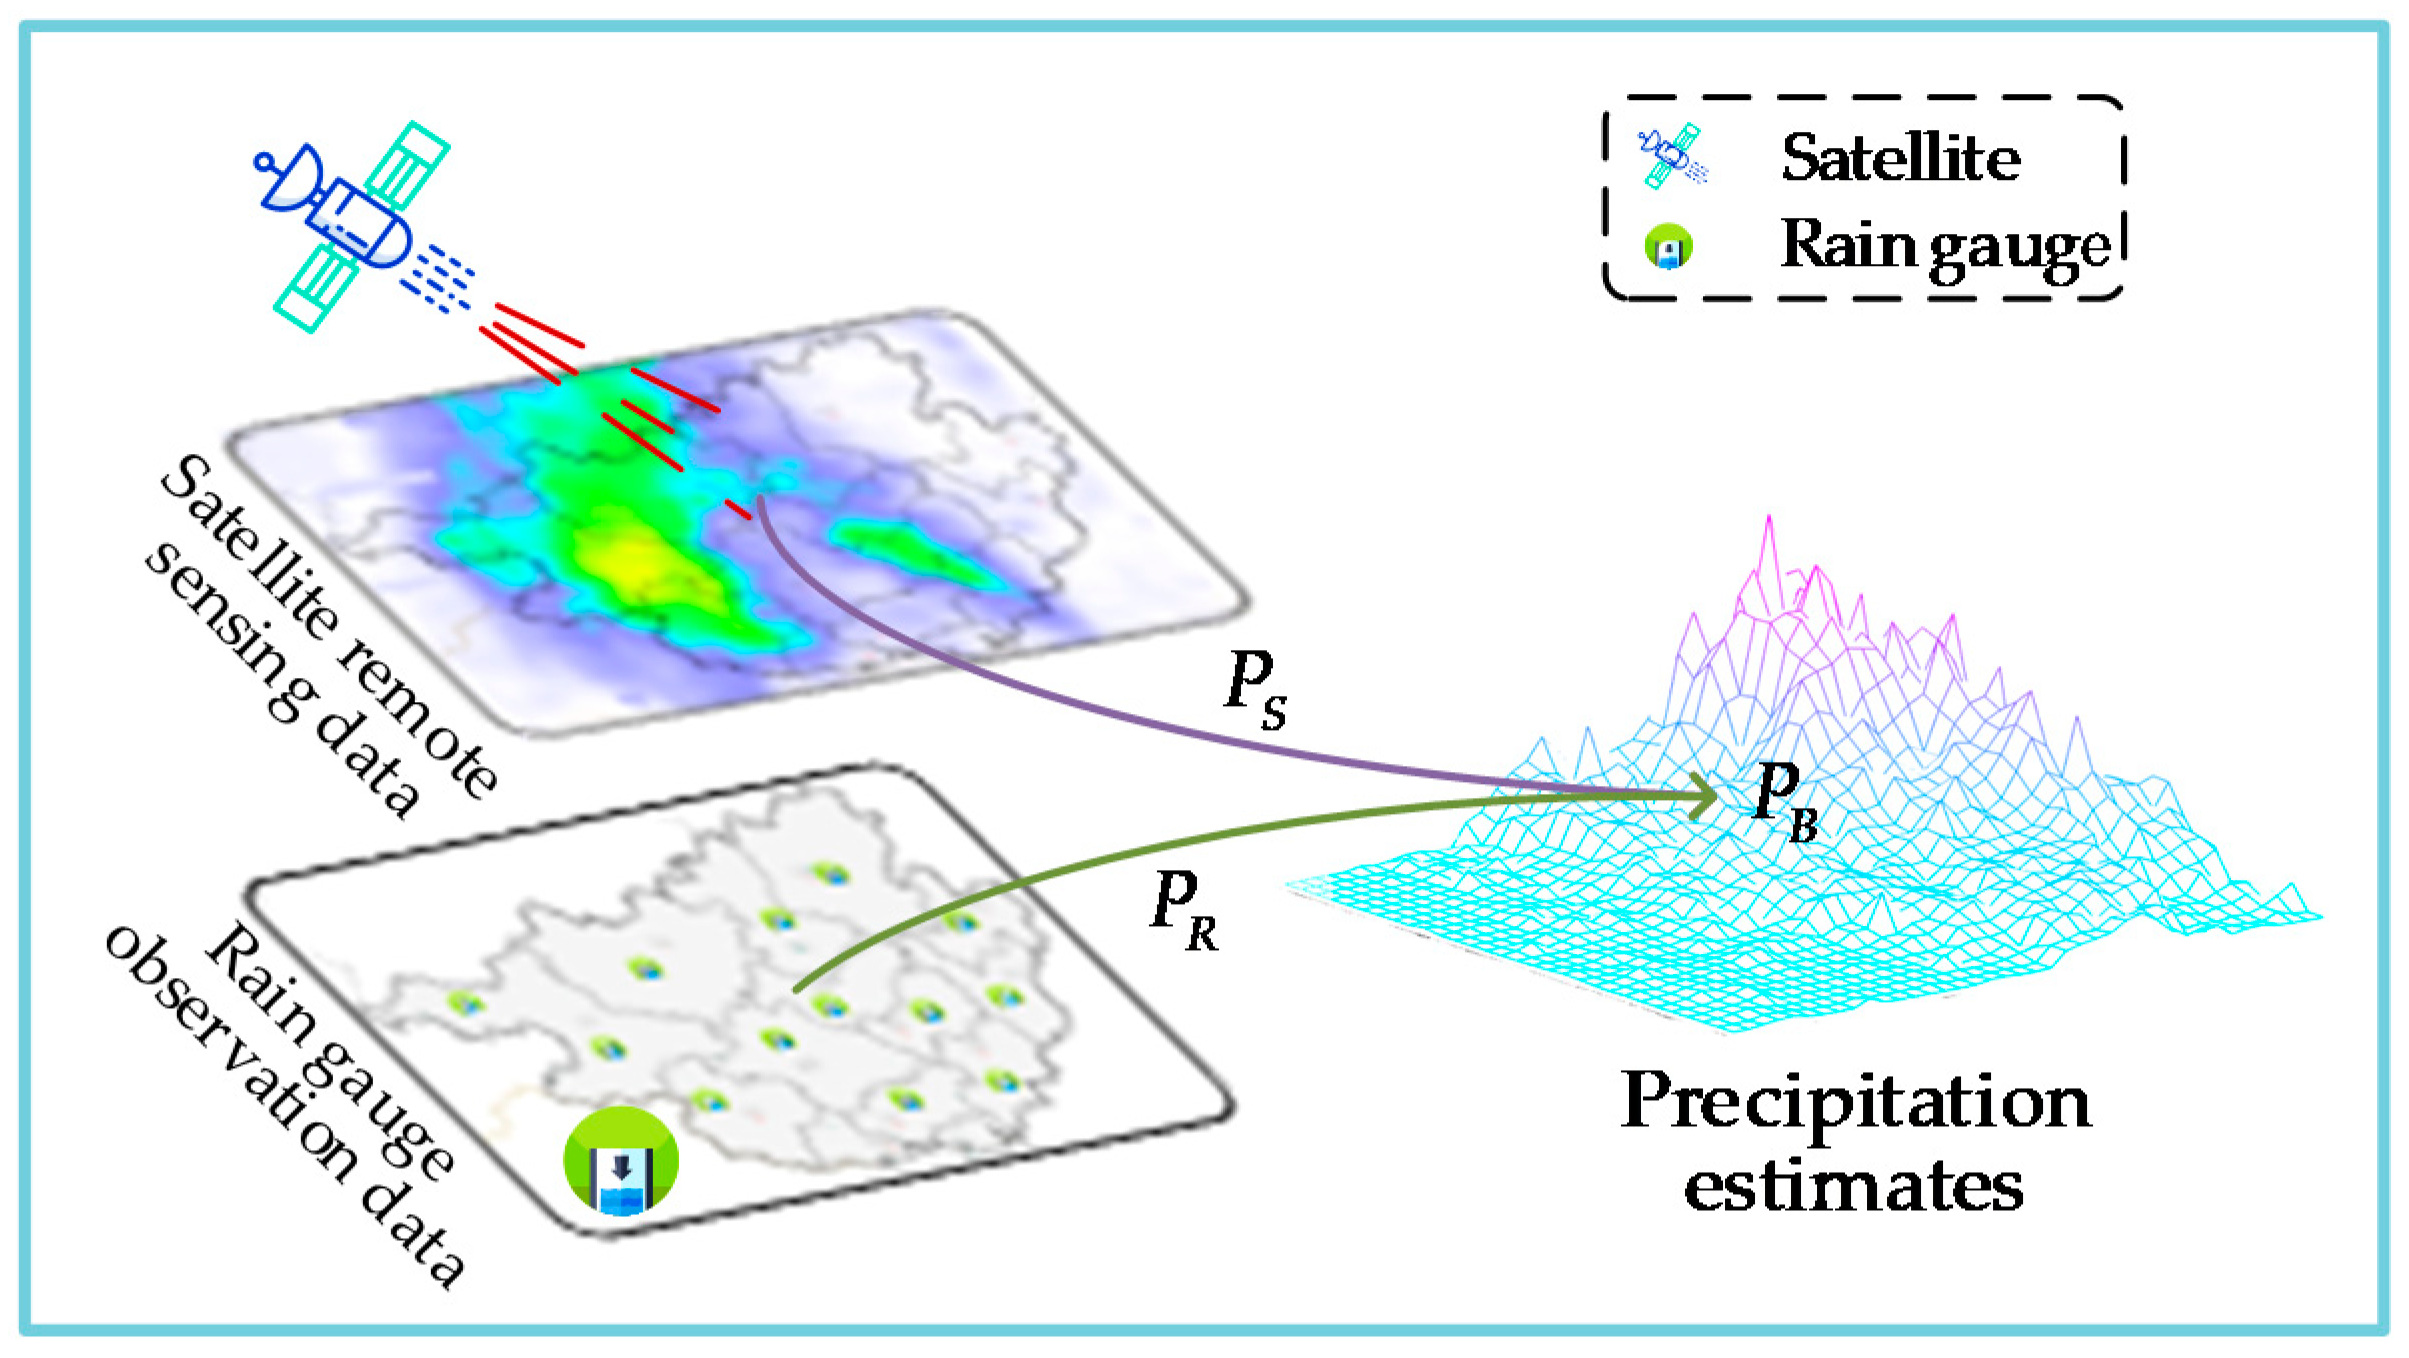
2.1. Precipitation Distribution Estimation Based on Satellite Remote Sensing
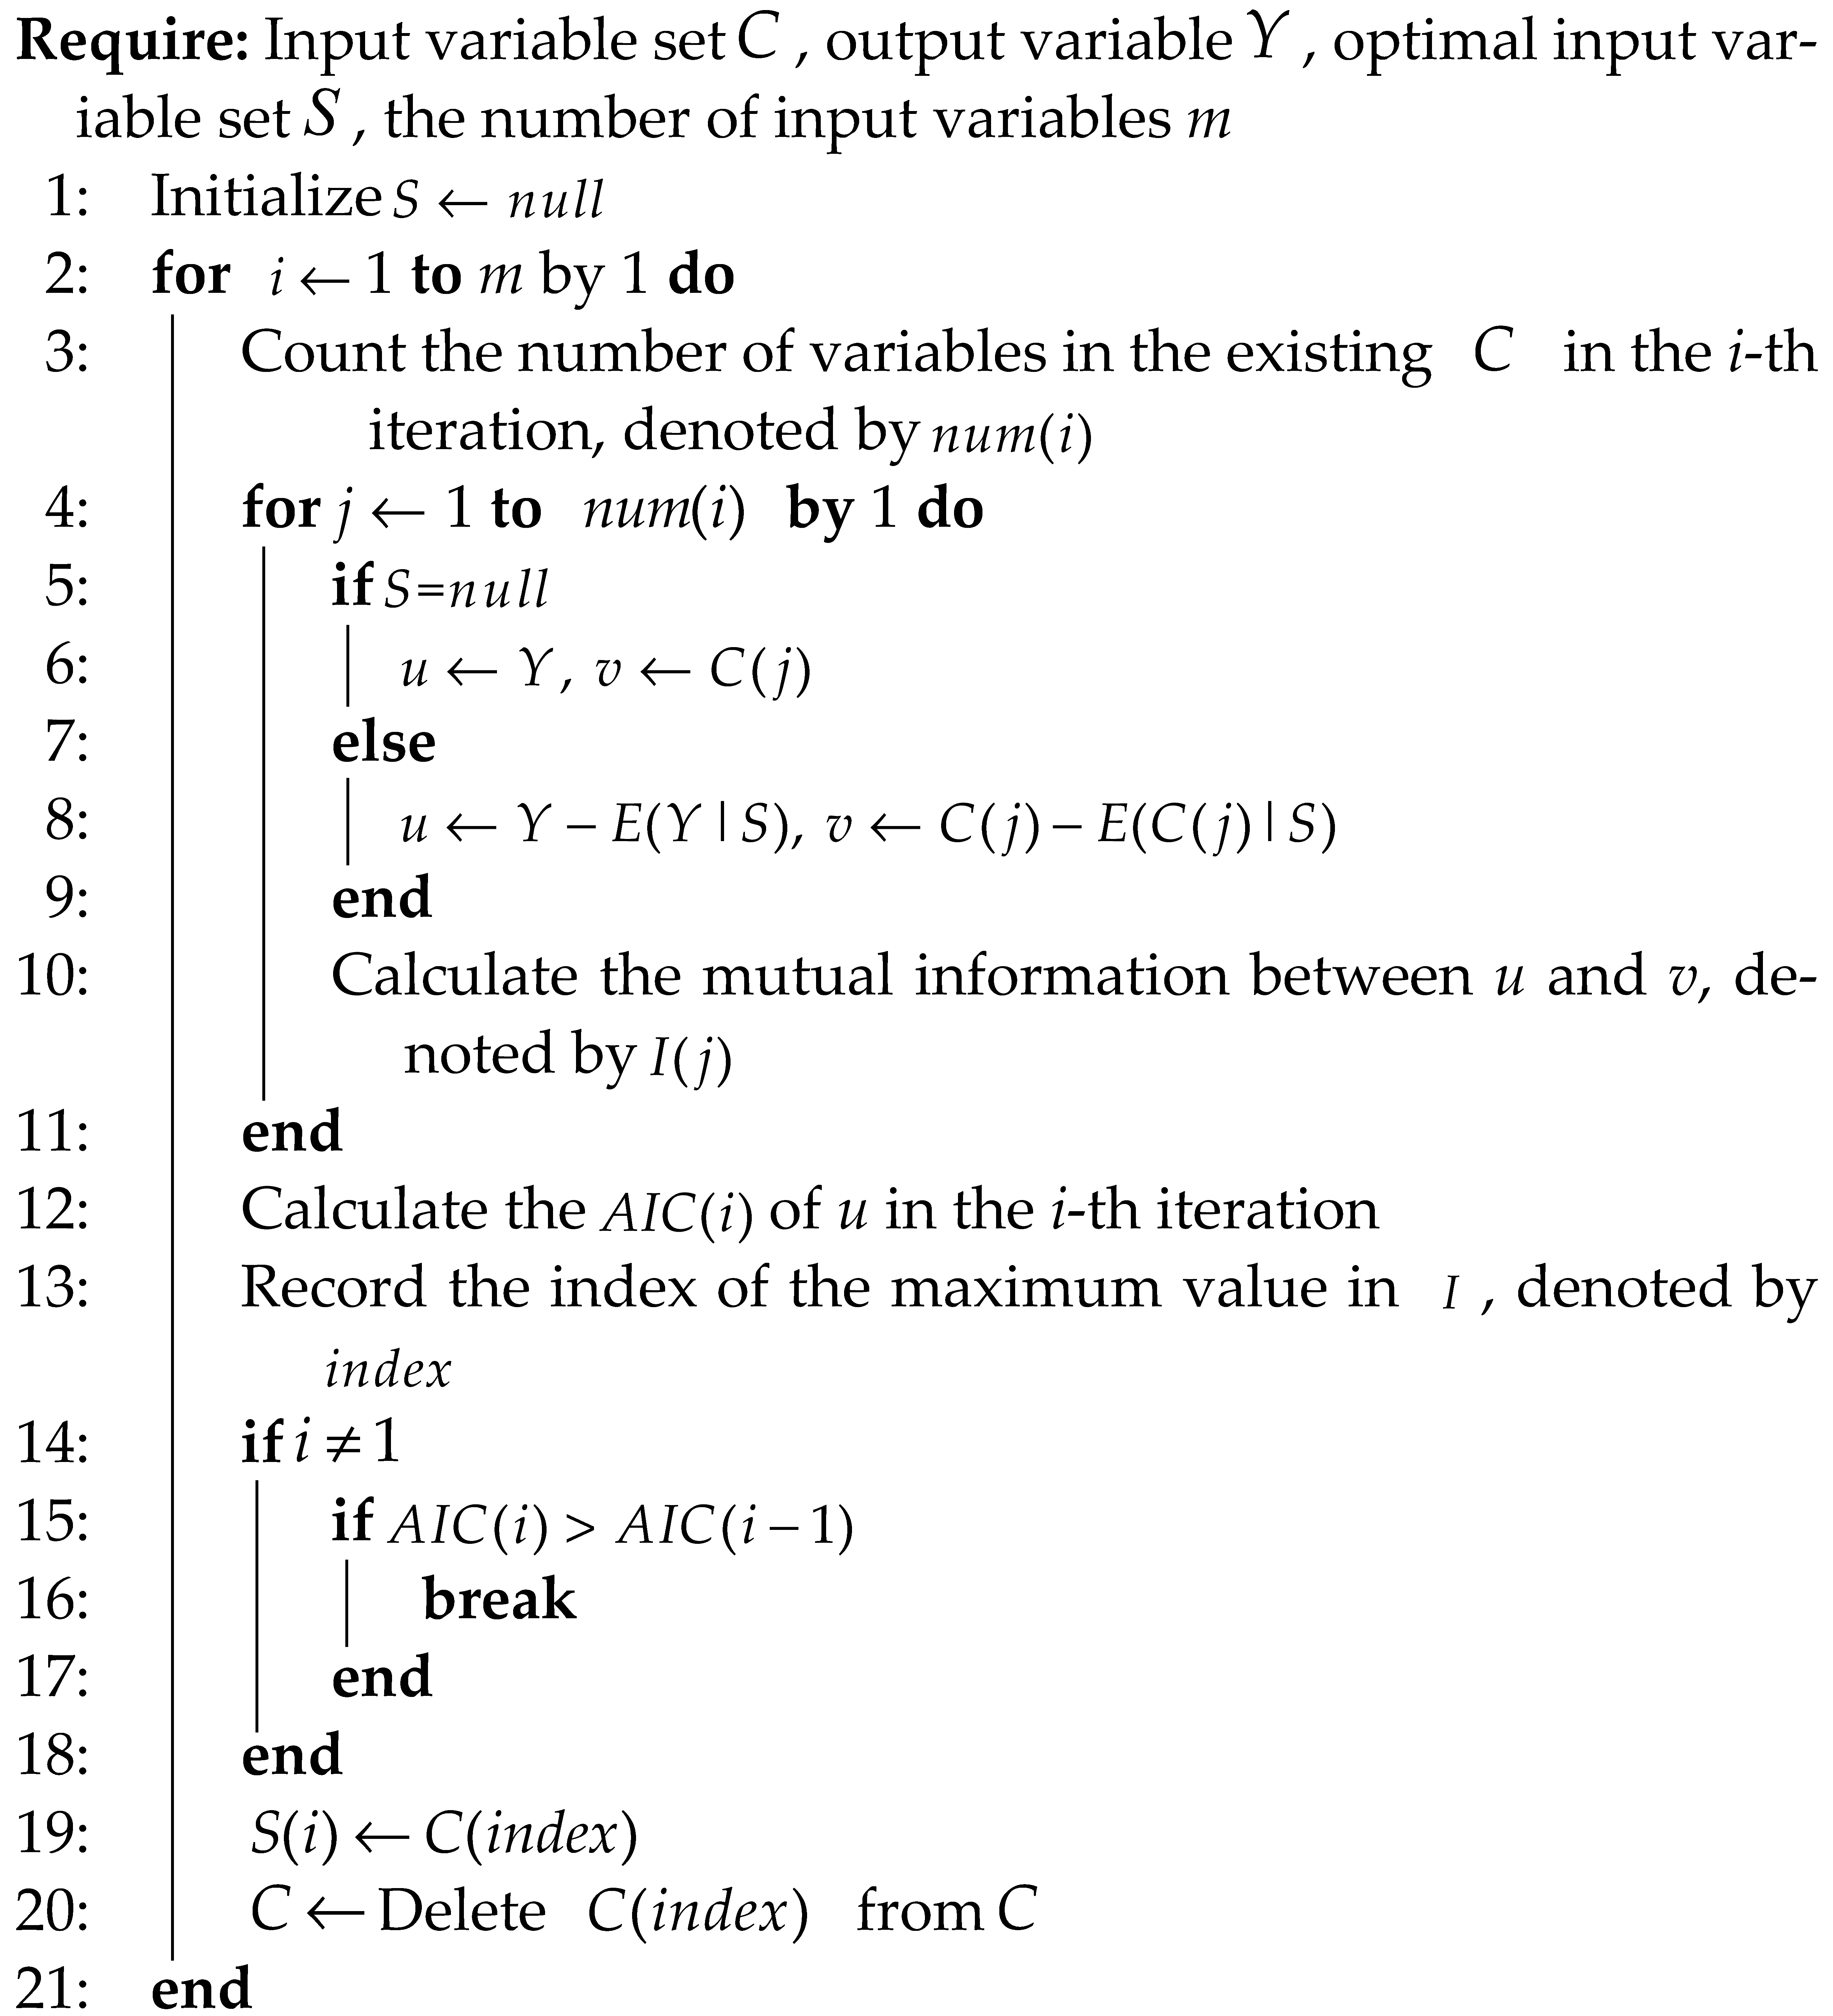
2.2. Hysteresis Effect of Precipitation
| Algorithm 1: The selection process of precipitation lag period. |
 |
2.3. Multimodal Deep Learning
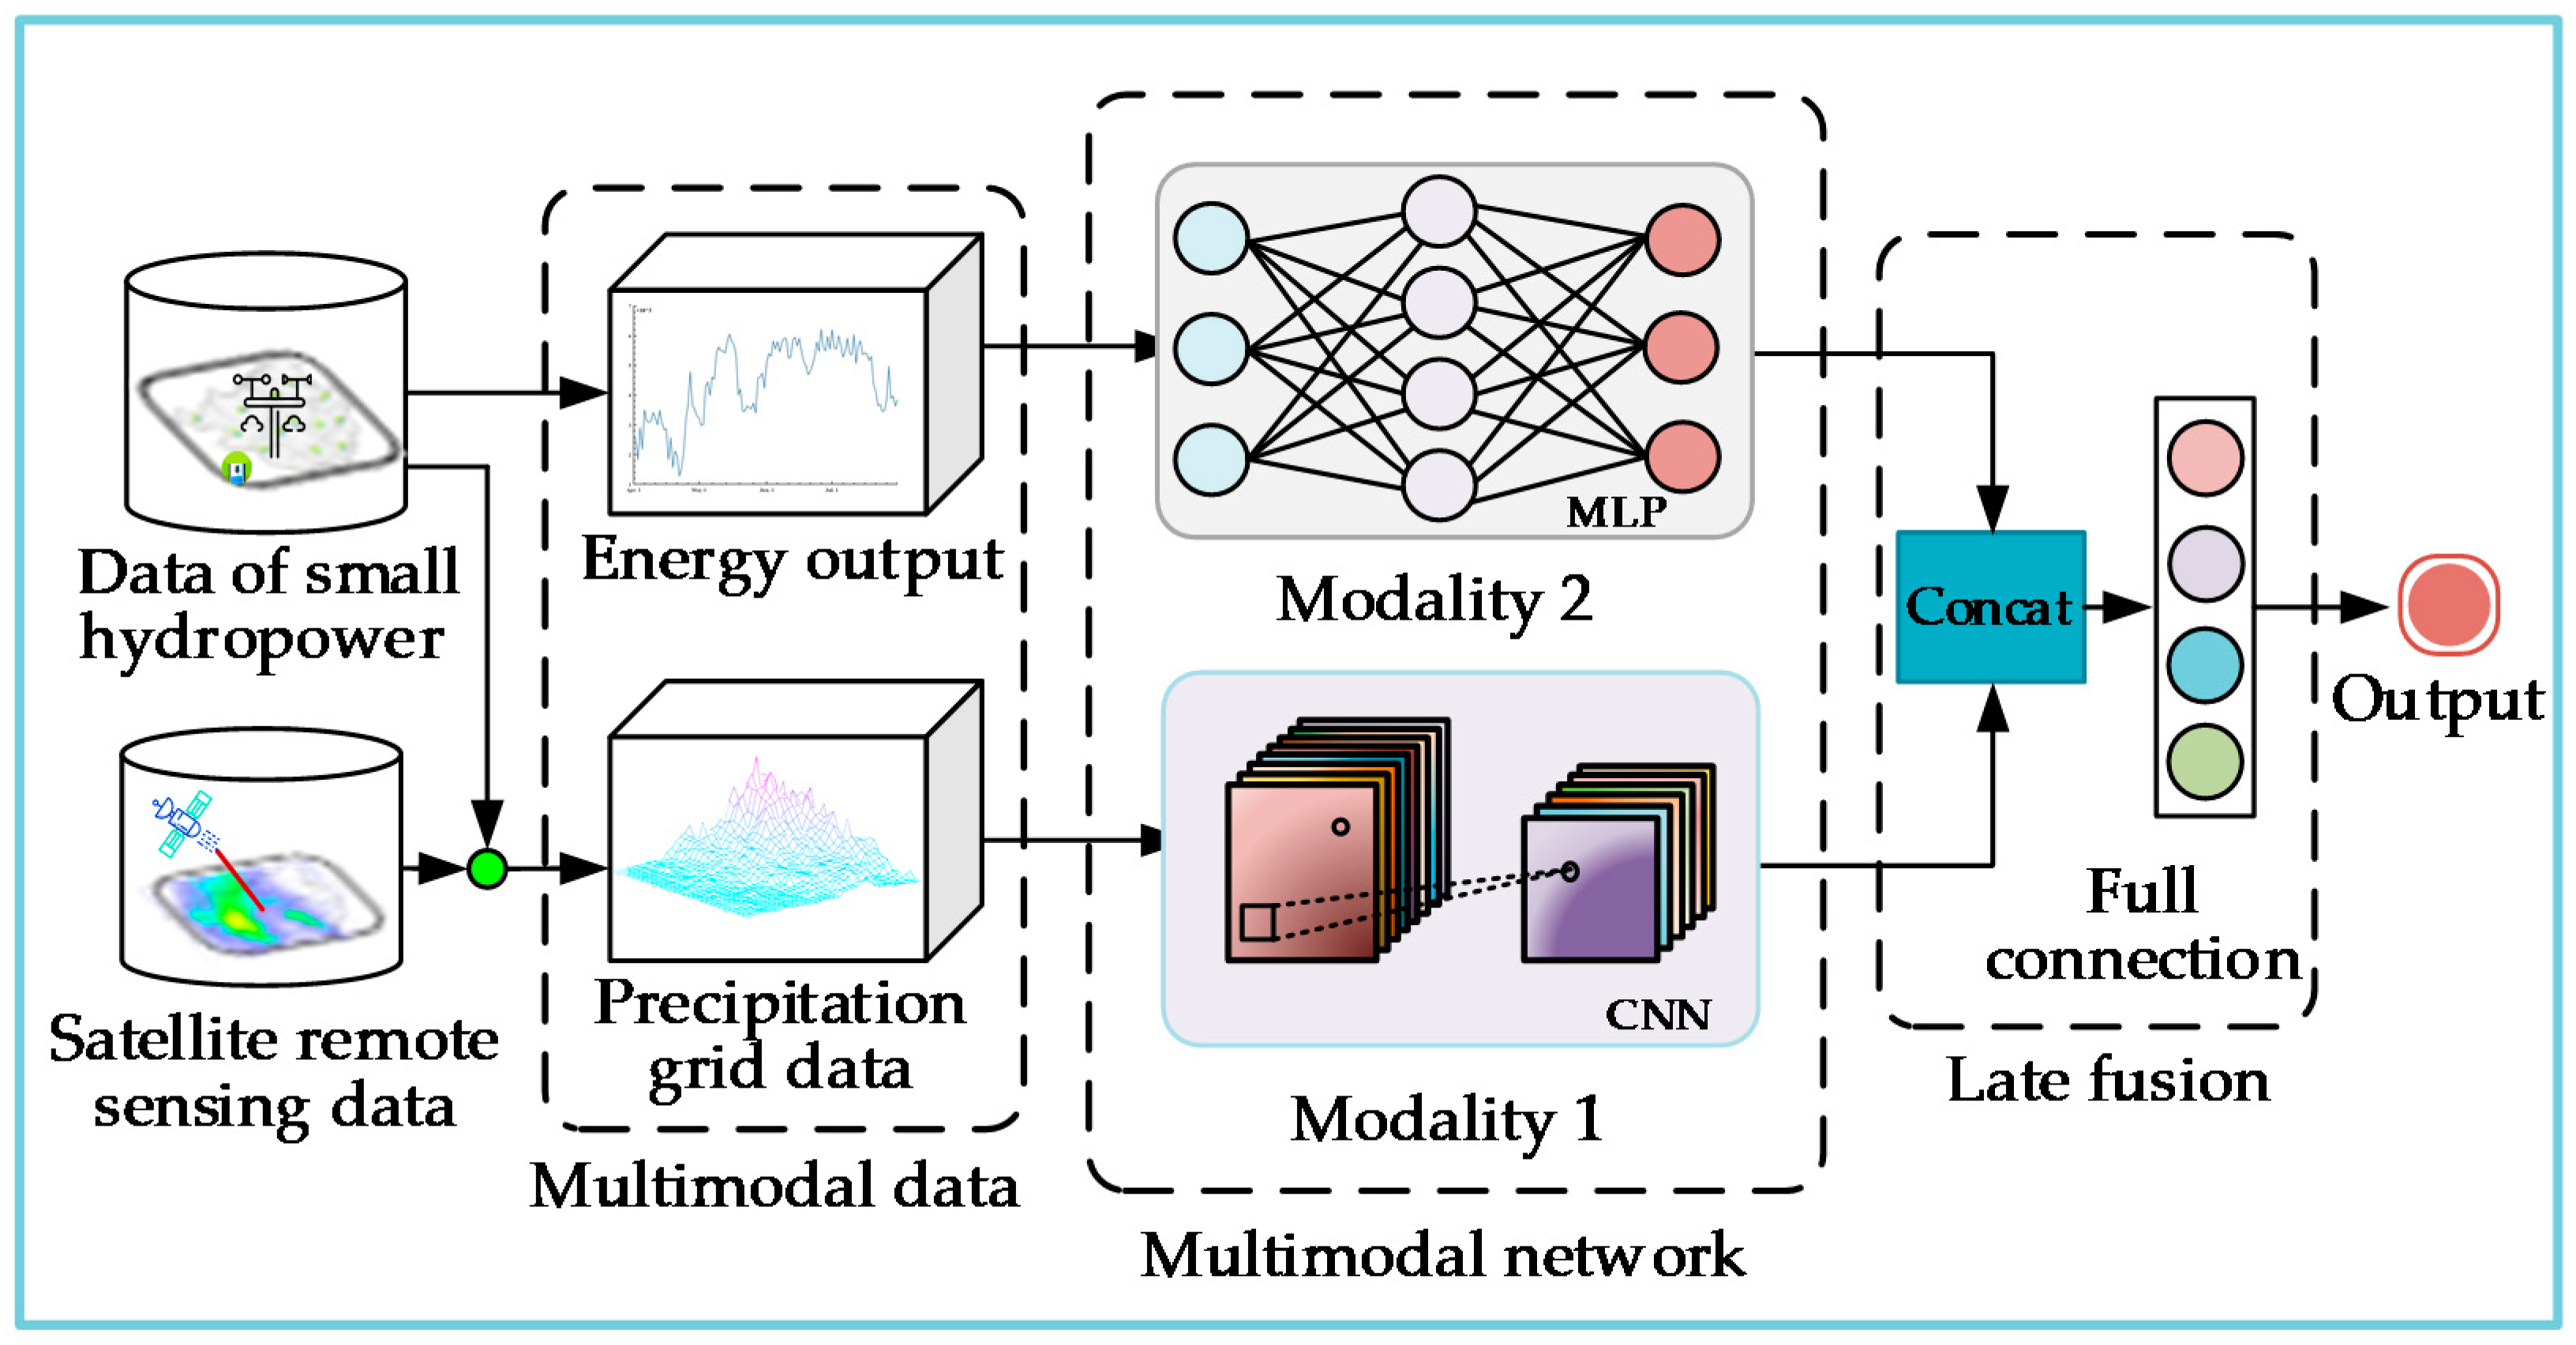
2.4. Power Generation Forecasting Architecture
- (1)
- Multimodal data set. It is a heterogeneous mixed-dimensional data set composed of precipitation data with two-dimensional spatial distribution characteristics and daily power generation data with one-dimensional temporal series characteristics.
- (2)
- Multimodal network. The multimodal network is composed of a CNN and an MLP. The branch of the CNN has six layers ( to ), and the input layer receives the data set of the spatial distribution of precipitation. The deep convolution layer to extracts the deep features of the input variables, and the ReLU function and the BatchNormalization method are used in each layer to activate and adjust the distribution of the extracted feature data. The flattening layer and the fully connected layer integrate the highly abstracted feature data after multiple convolutions to facilitate subsequent feature fusion. The MLP branch has three layers ( to ) which receive the historical power generation data of the several previous periods to extract the variation characteristics of the power generation capacity of the entire group of small hydropower stations in the short term during the present period.
- (3)
- Late fusion. The late fusion network consists of four layers ( to ), and the number of nodes in each layer is 16, 8, 4, and 1. The joint layer receives and dimensionally connects the temporal and spatial feature information of precipitation and the feature information of power generation capacity changes extracted from the multimodal network. The fully connected layers to form a simple neural network, which carries out regression fusion and analysis on the extracted feature information and utilizes a linear function to activate the output layer to obtain the final forecasting value.
3. Data Preprocessing
3.1. Data Description
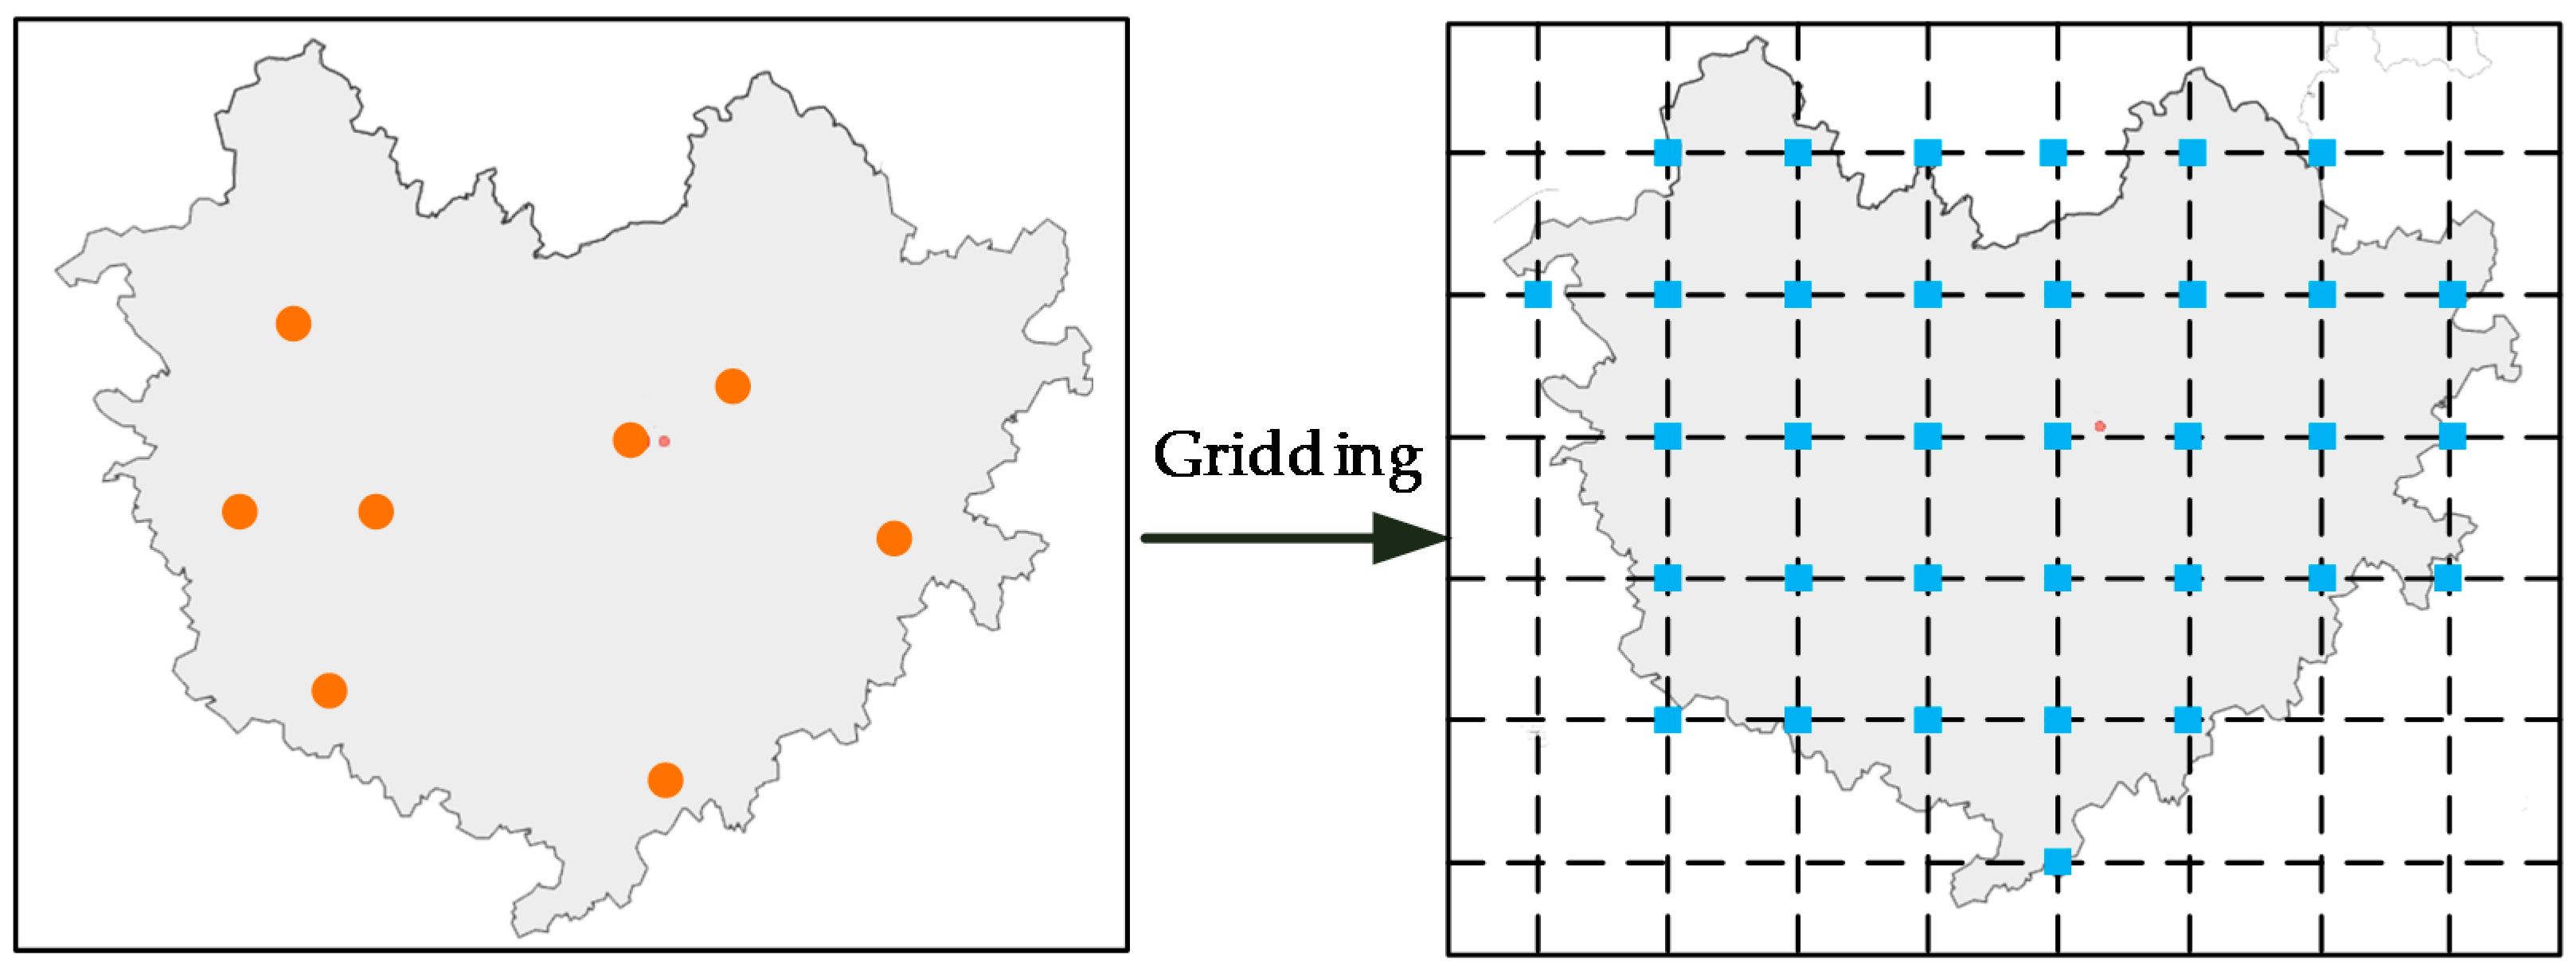
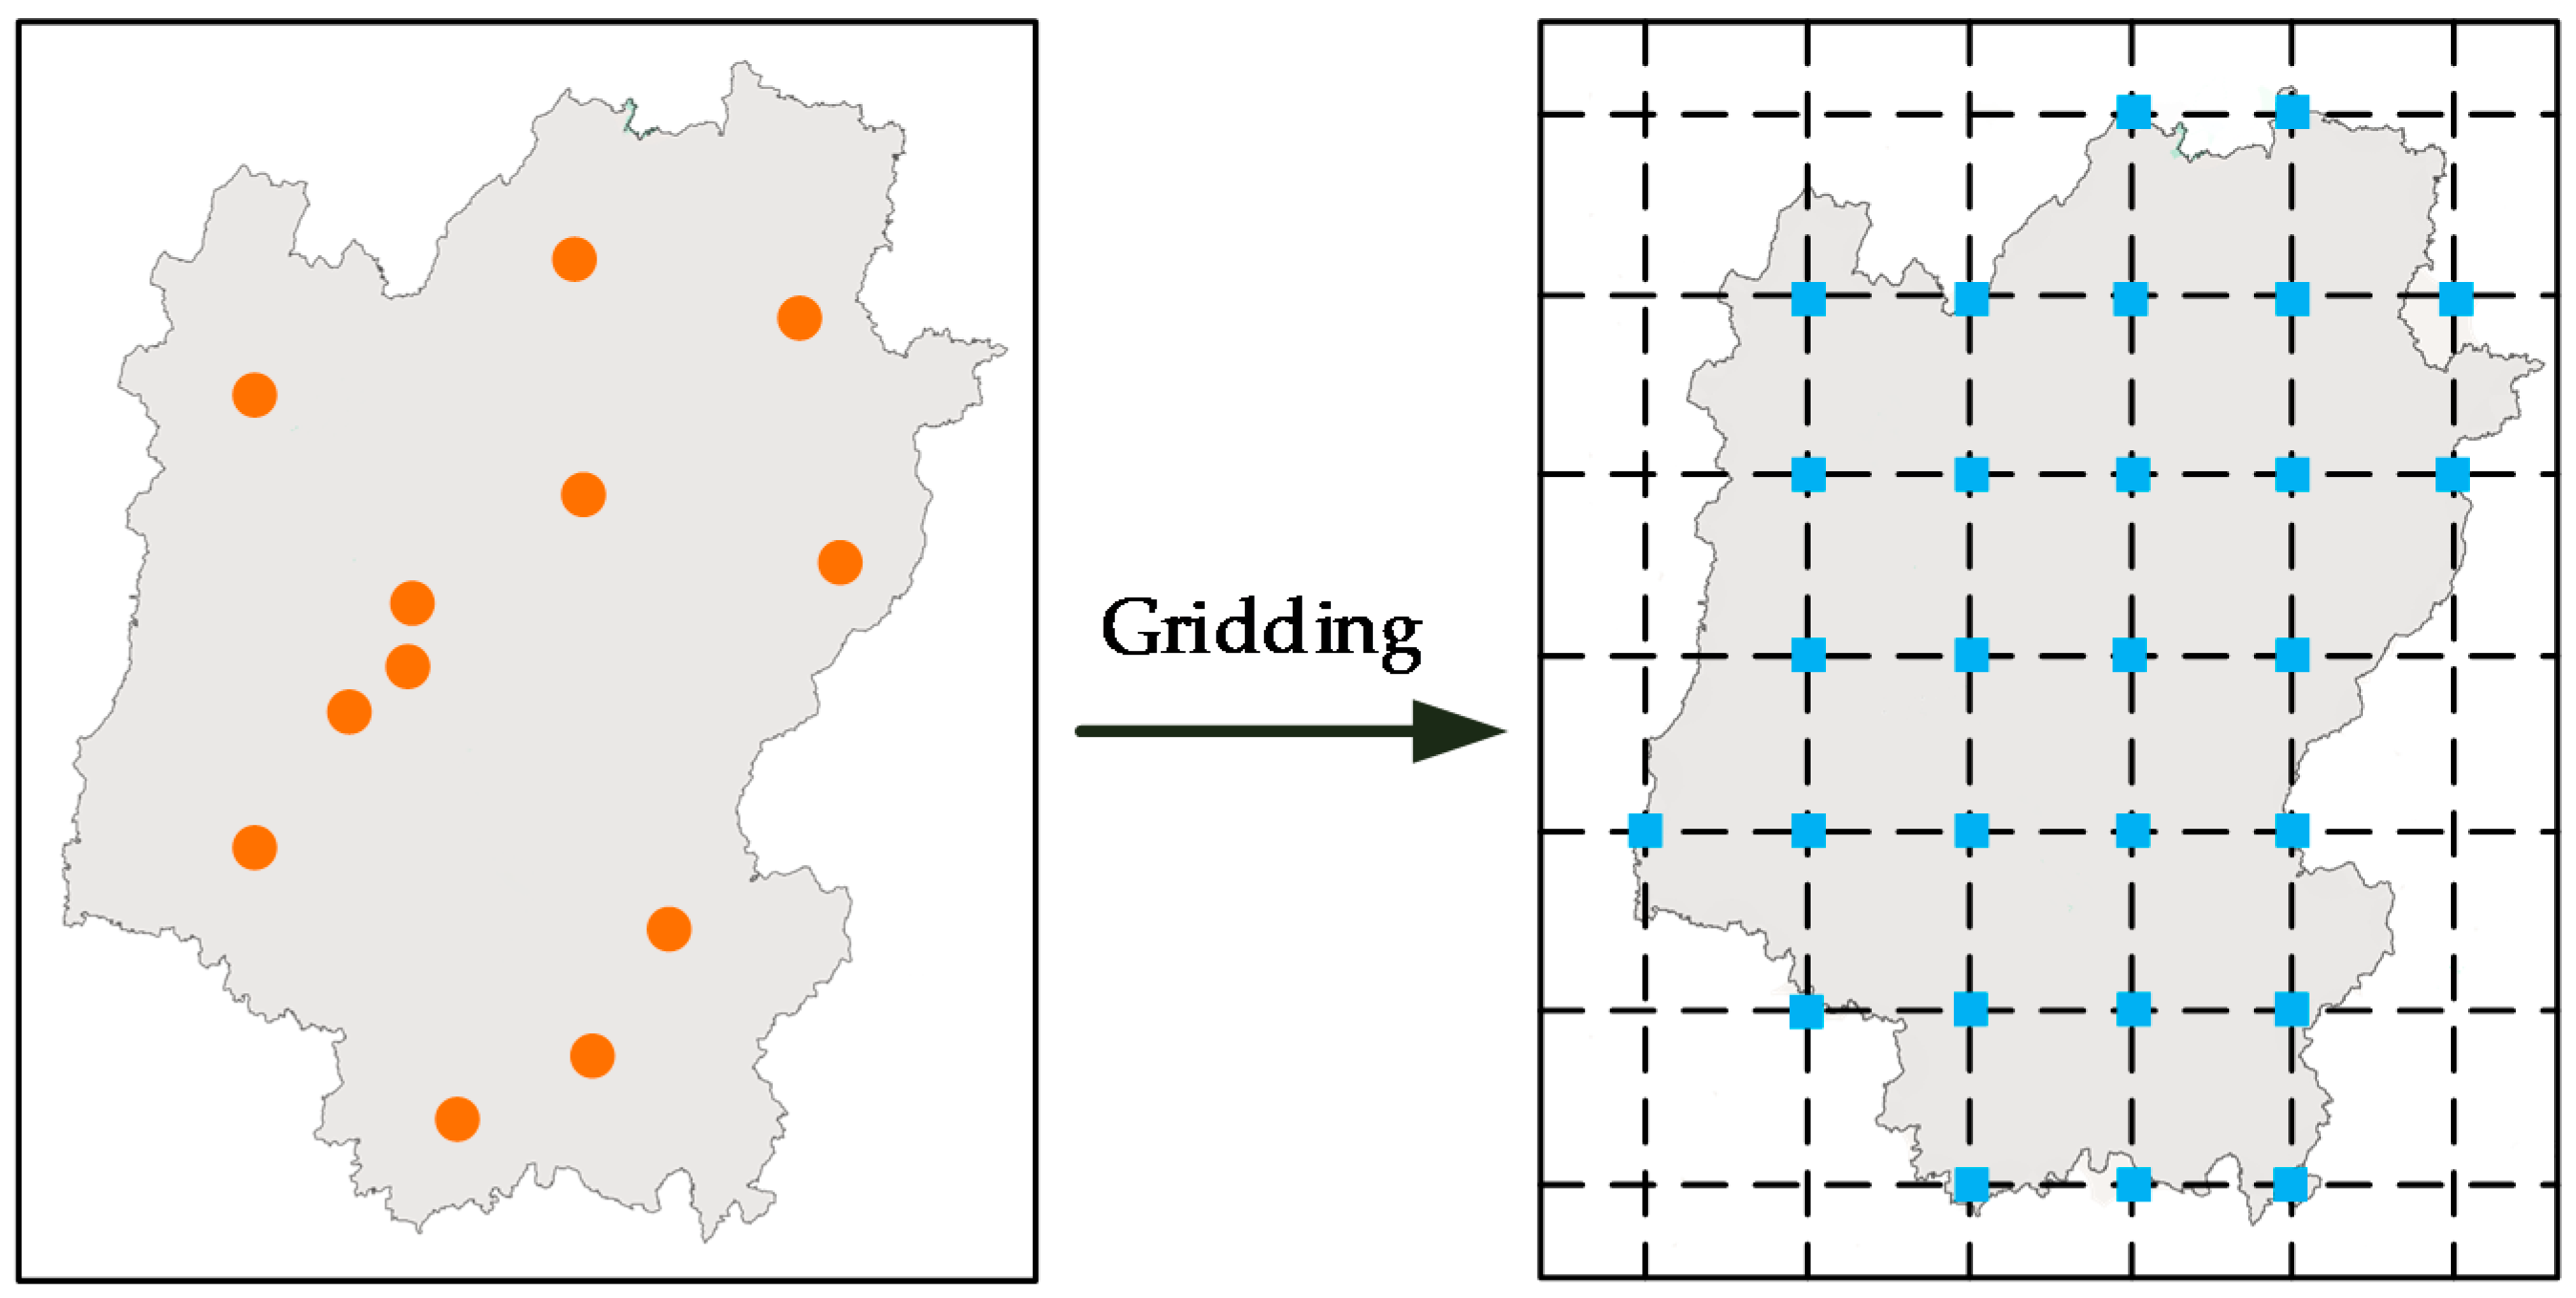
3.2. Grid Division of the Spatial Distribution of Precipitation
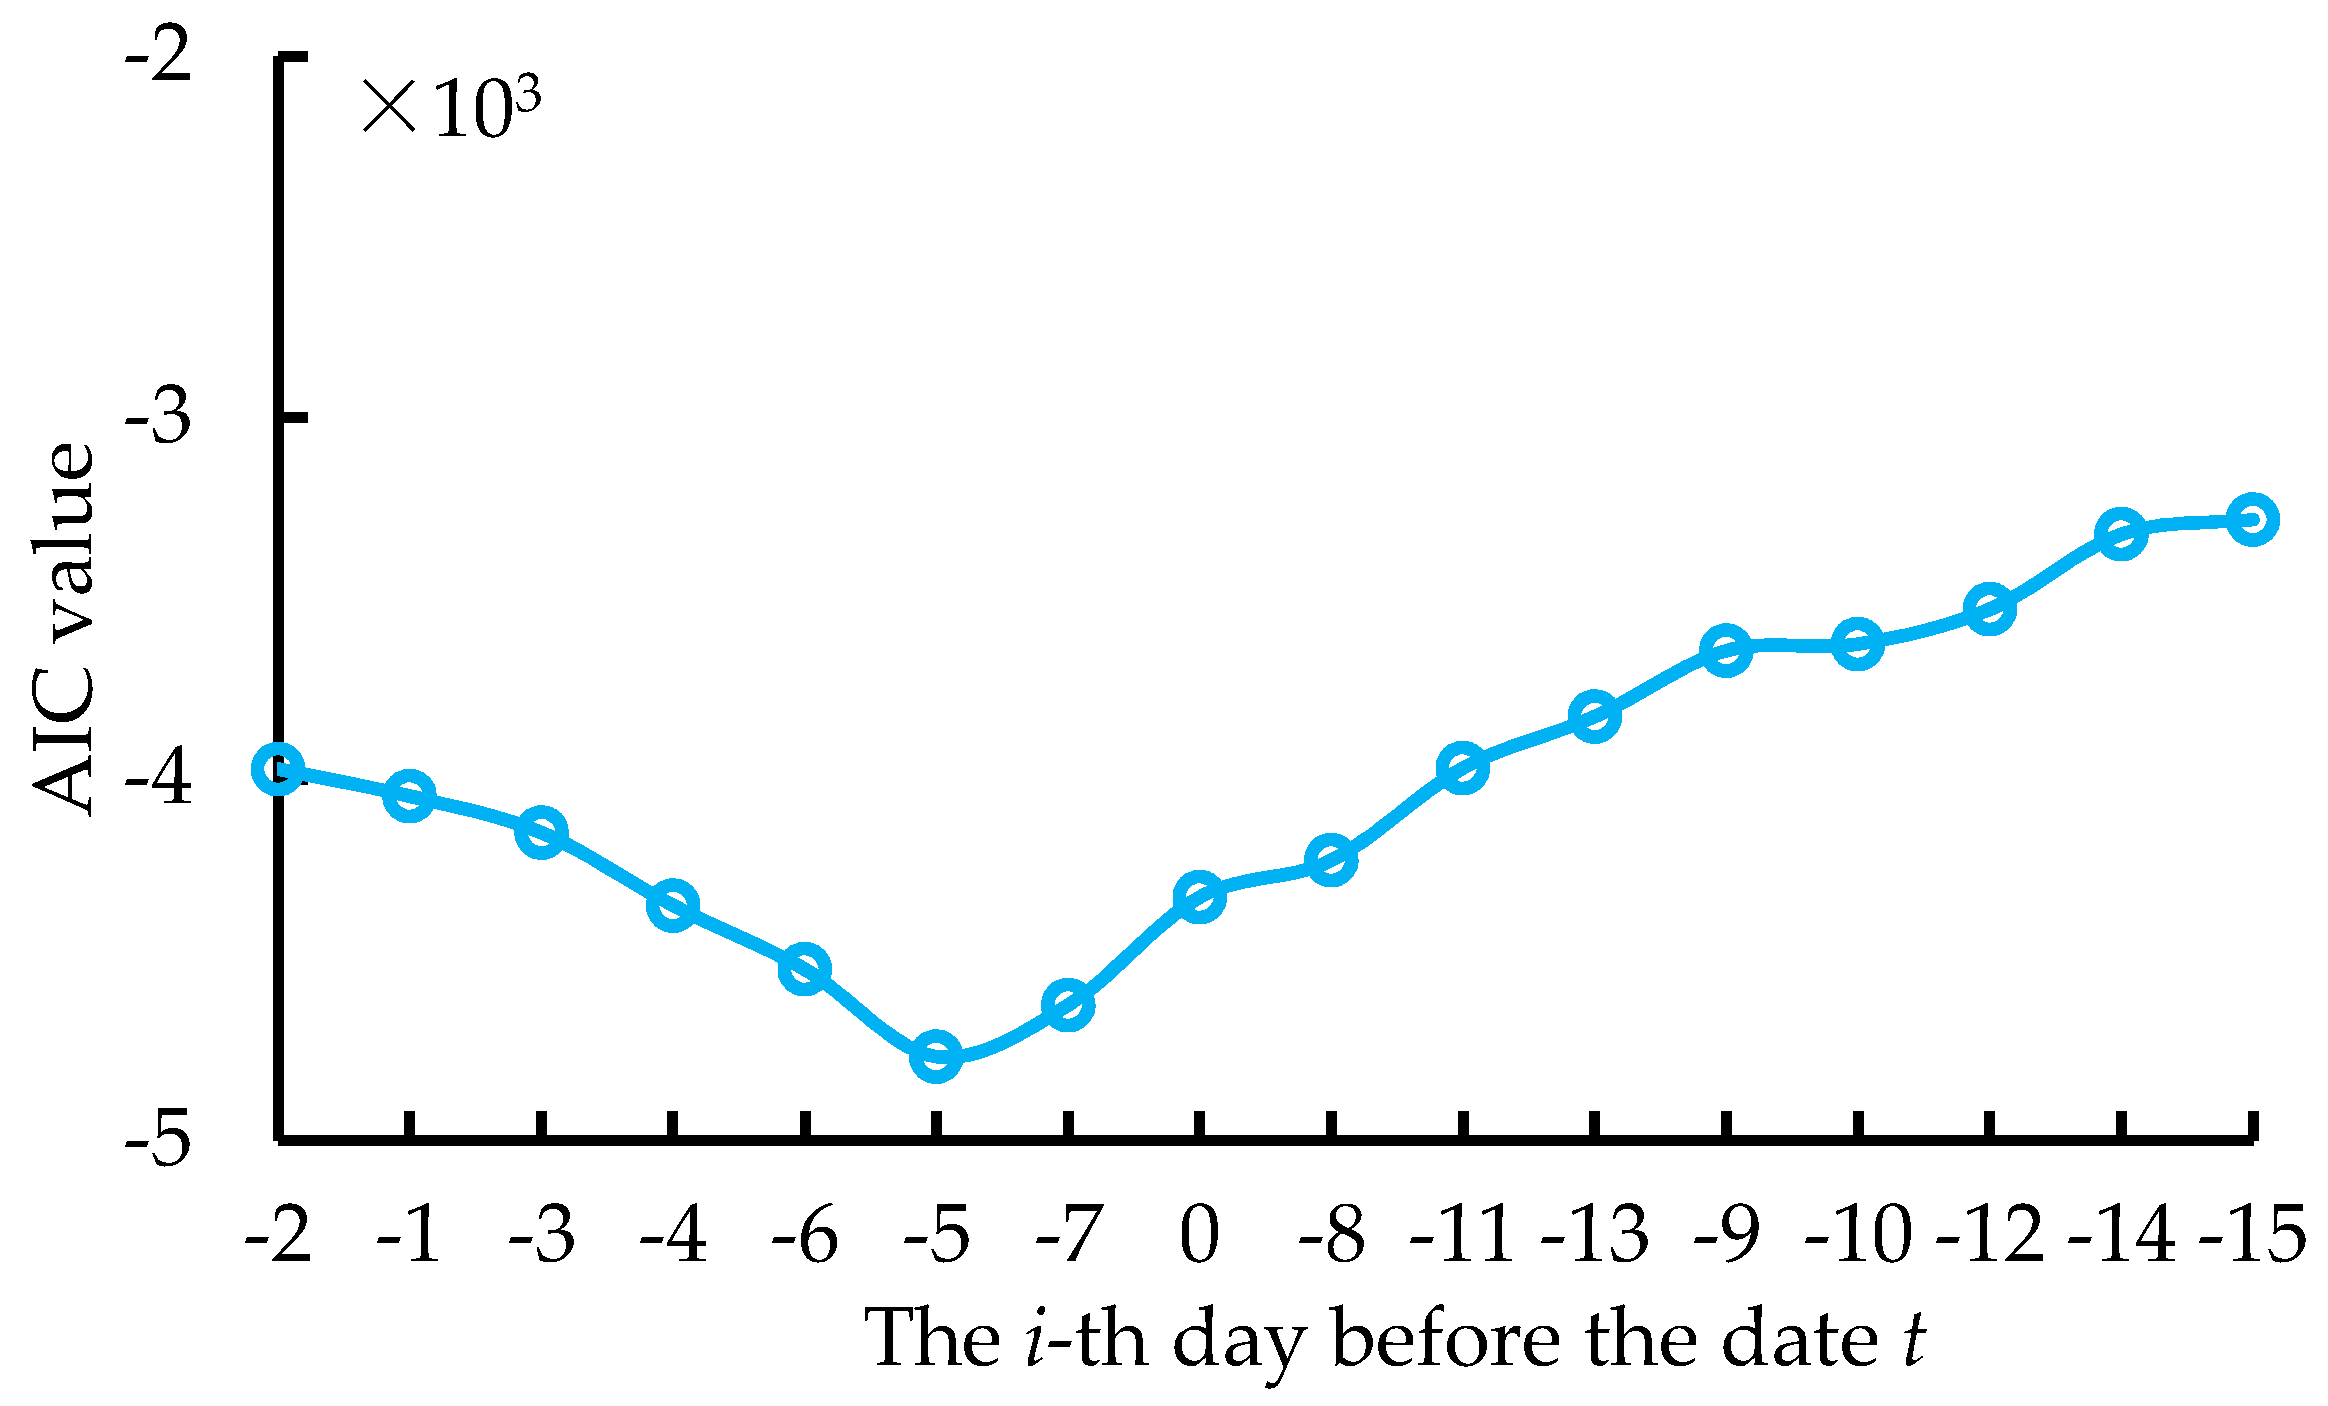
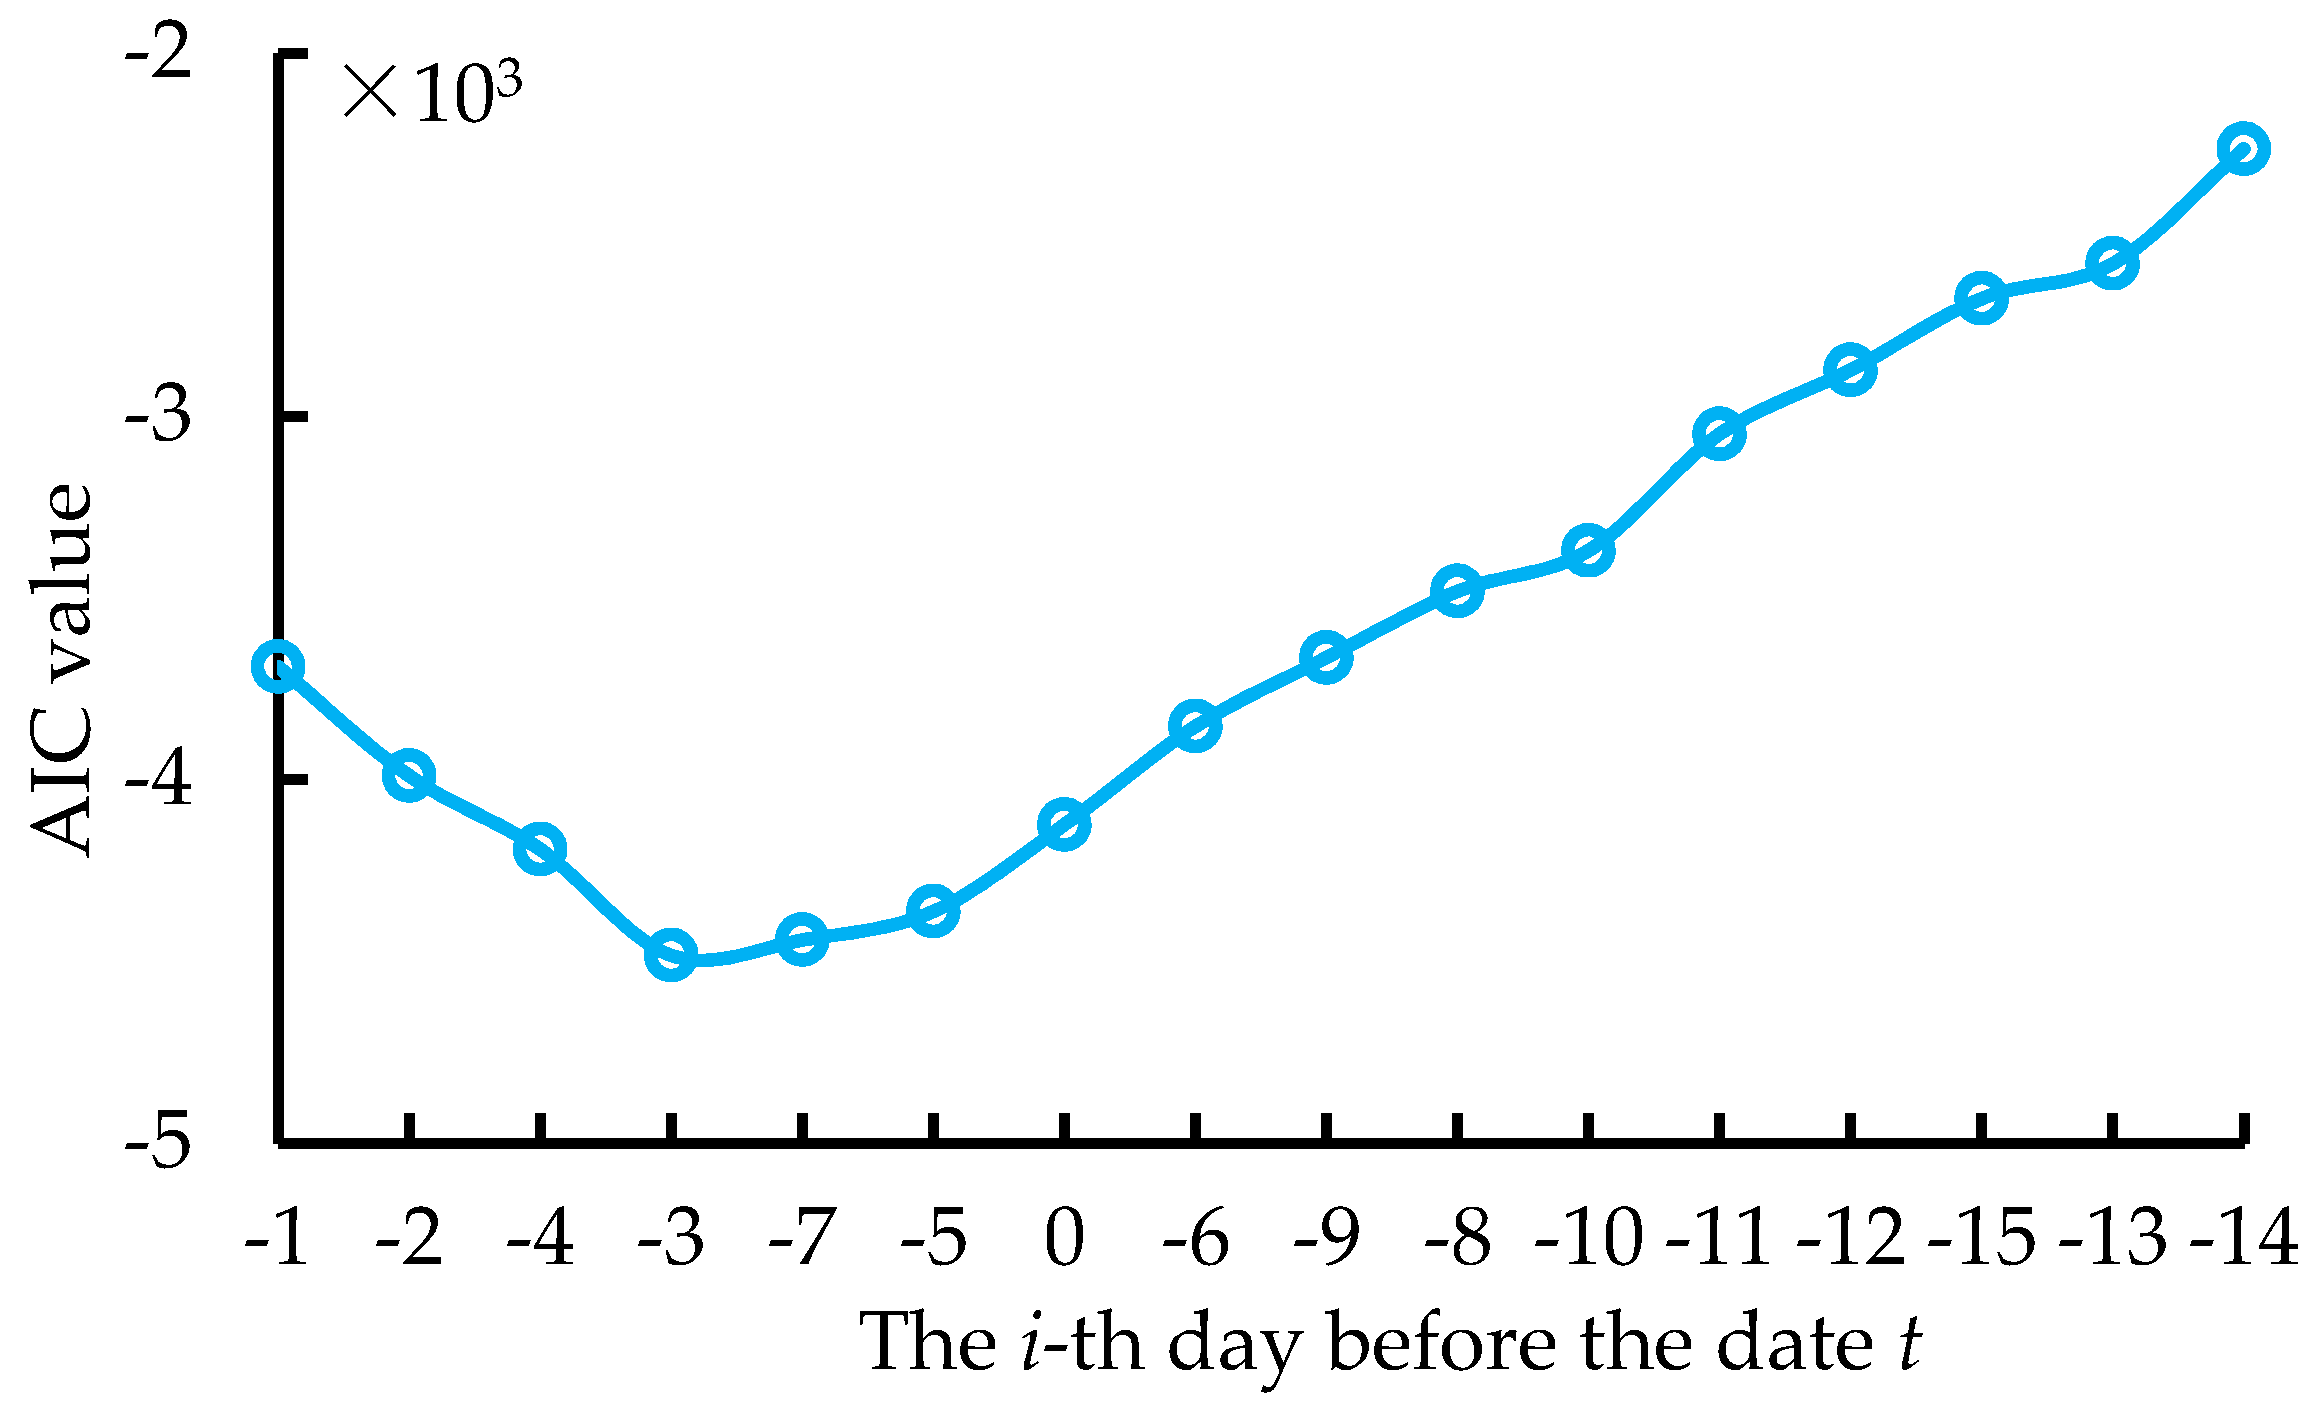
3.3. Calculation of the Lag Time of Daily Generating Capacity
3.4. Filtering the Power Generation Data
3.5. Vectorization of Sample Data
4. Calculation Results and Discussion
4.1. Evaluation Metrics
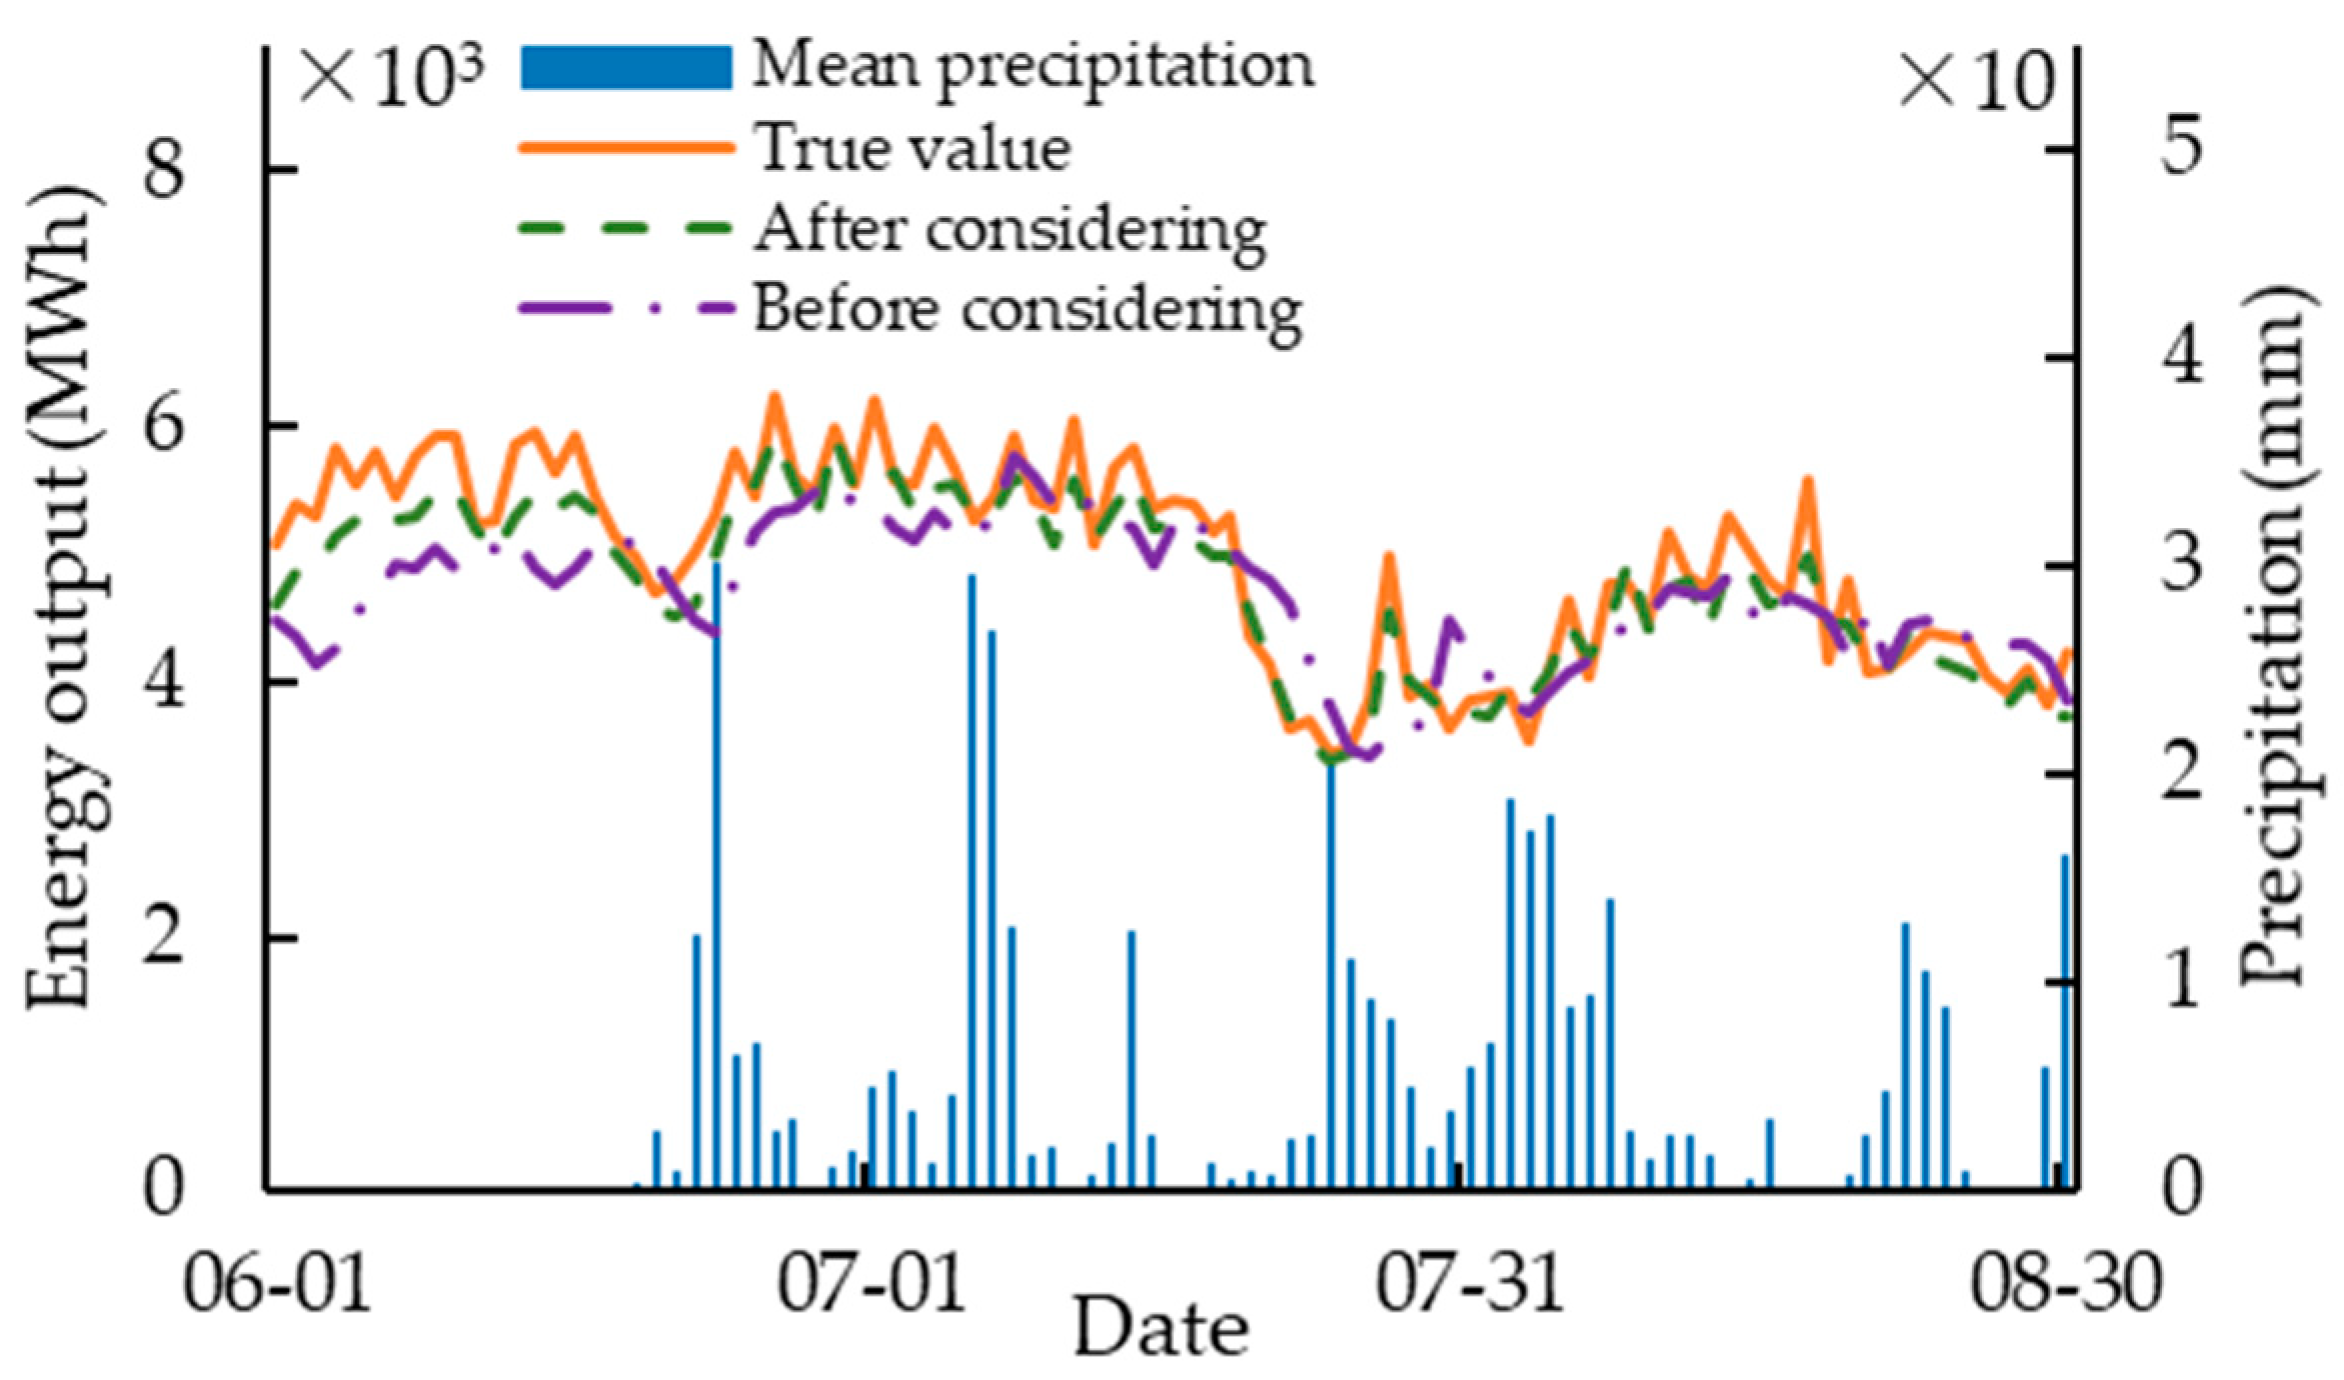
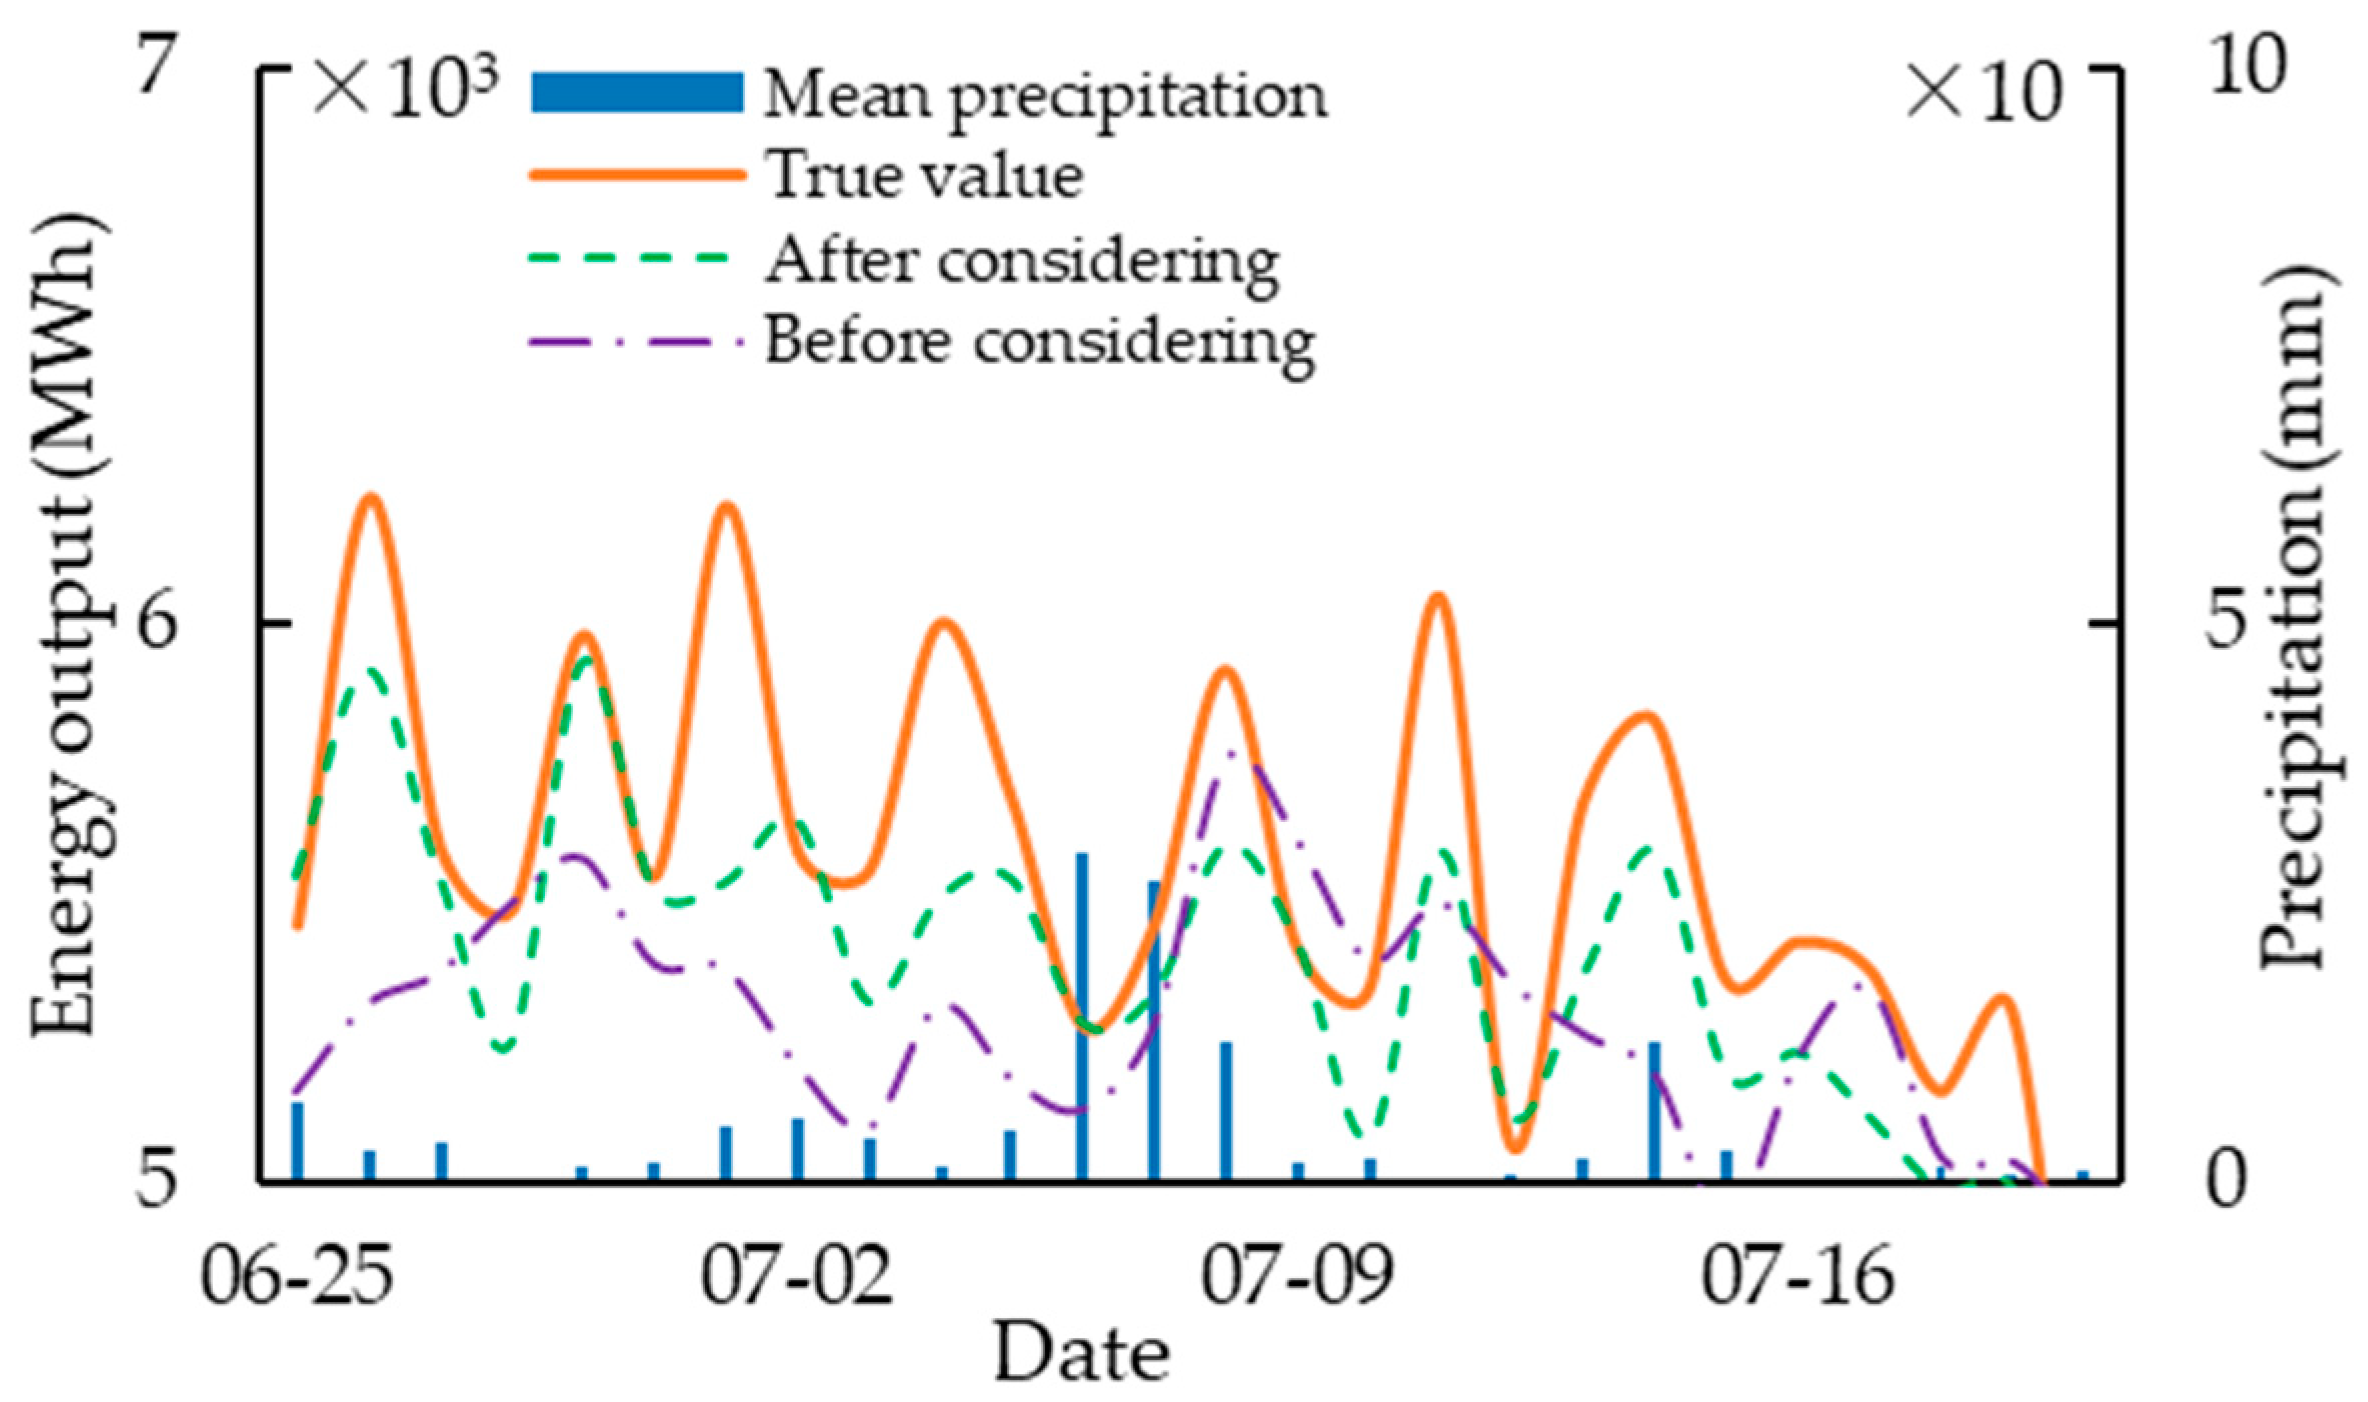
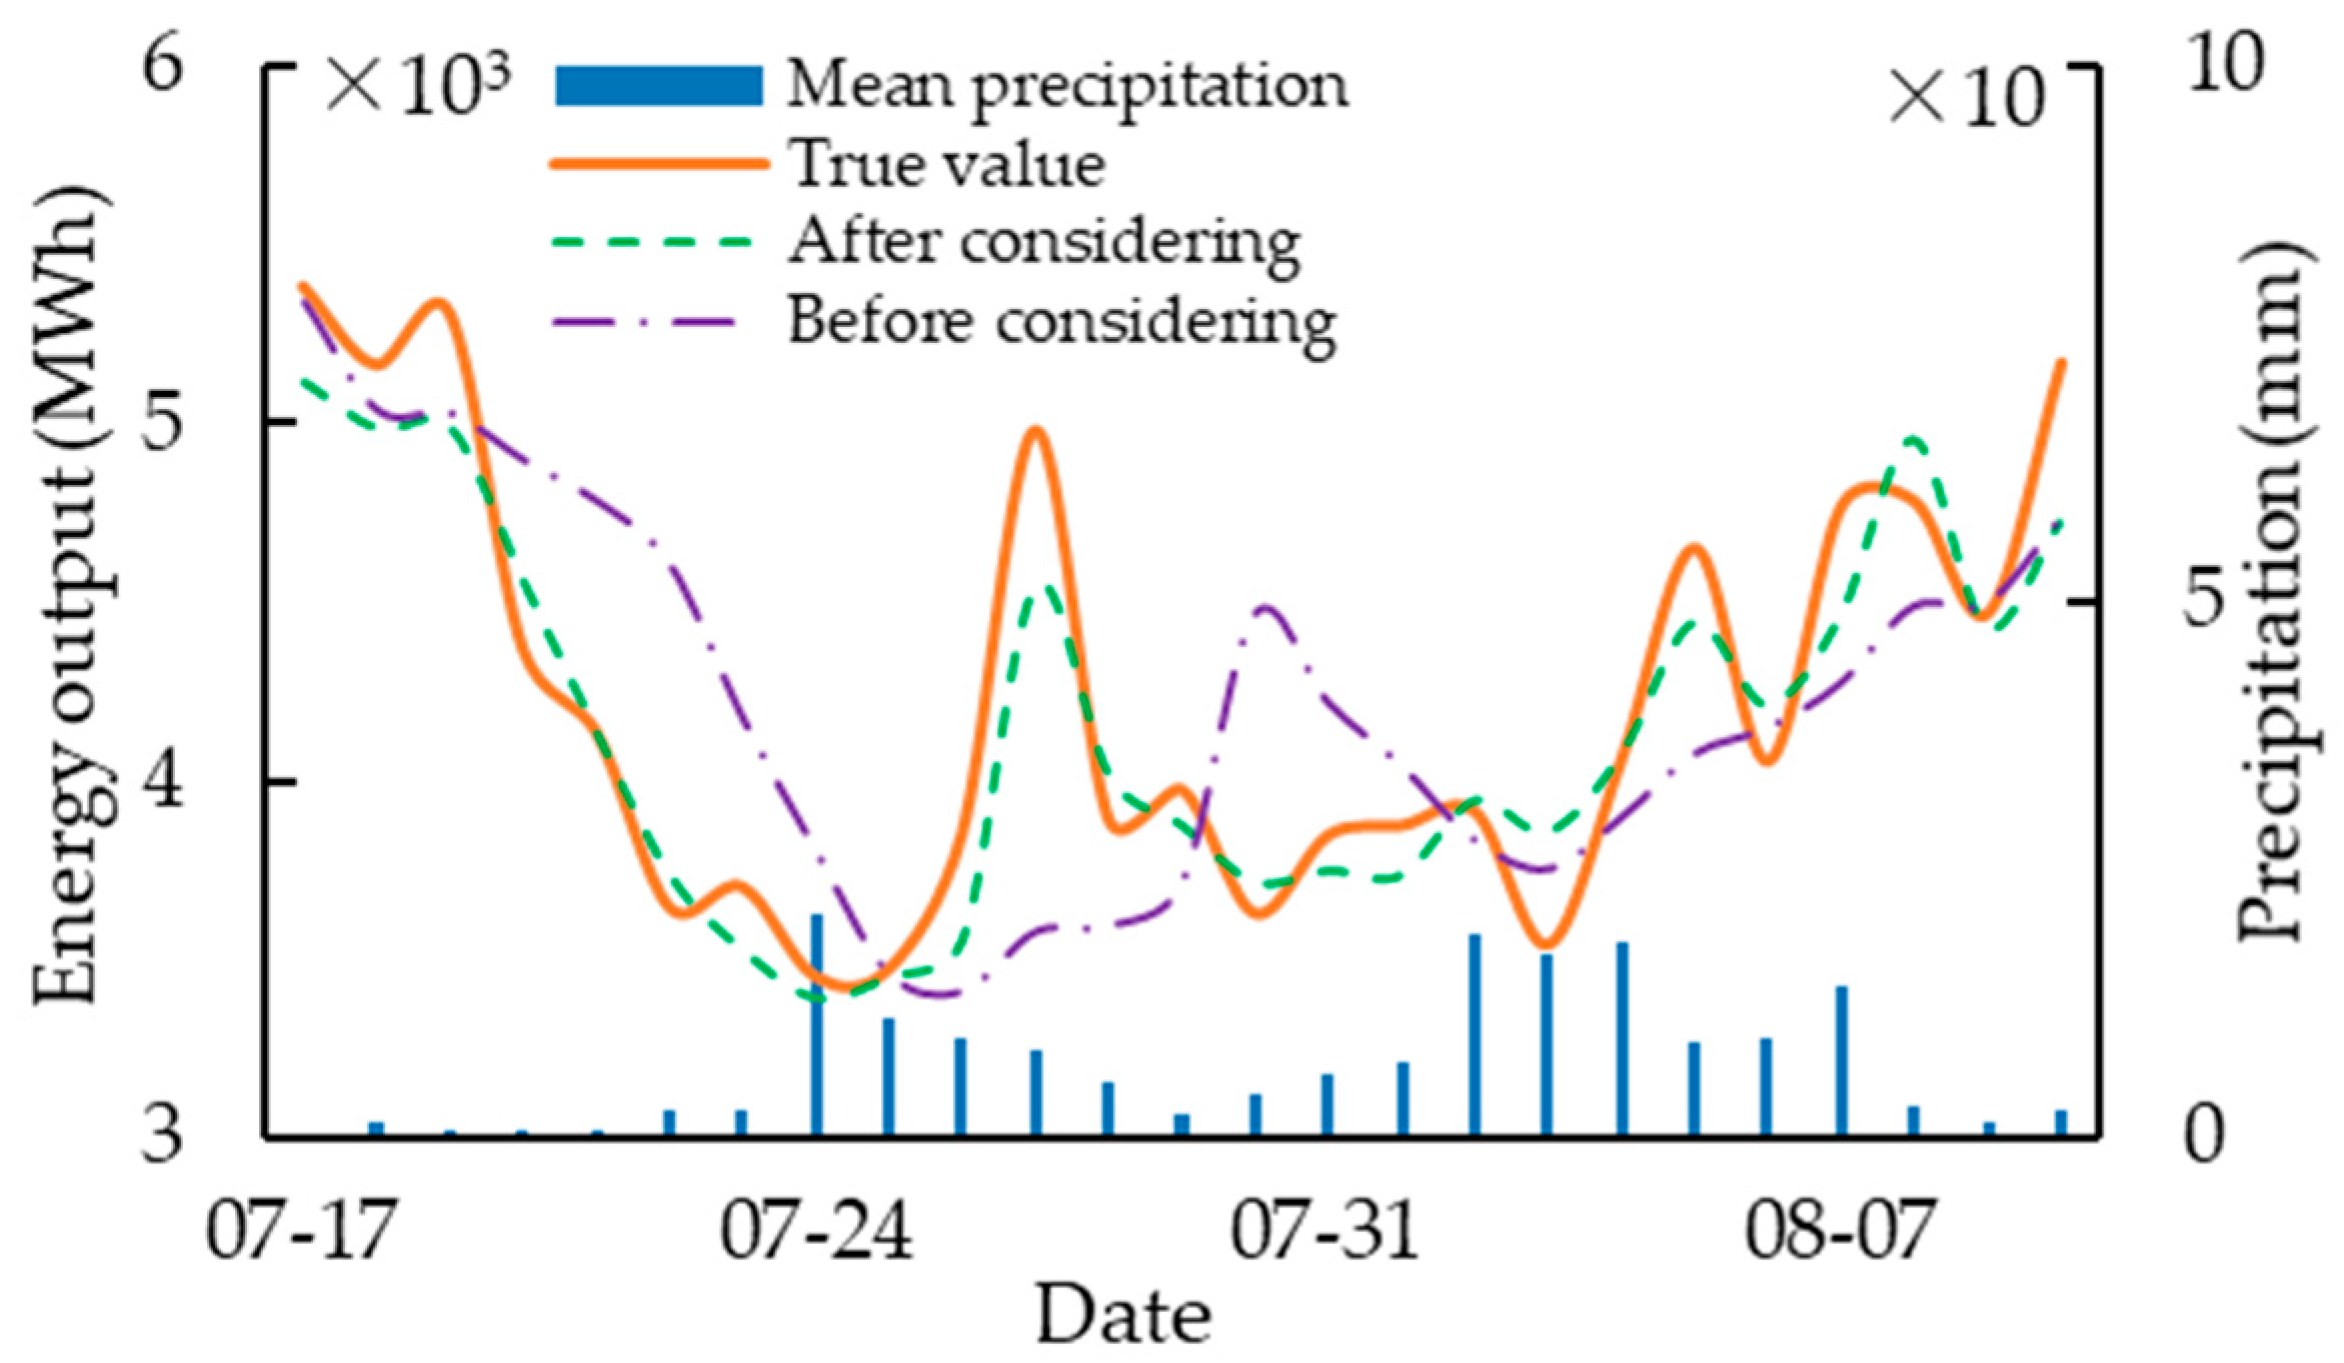
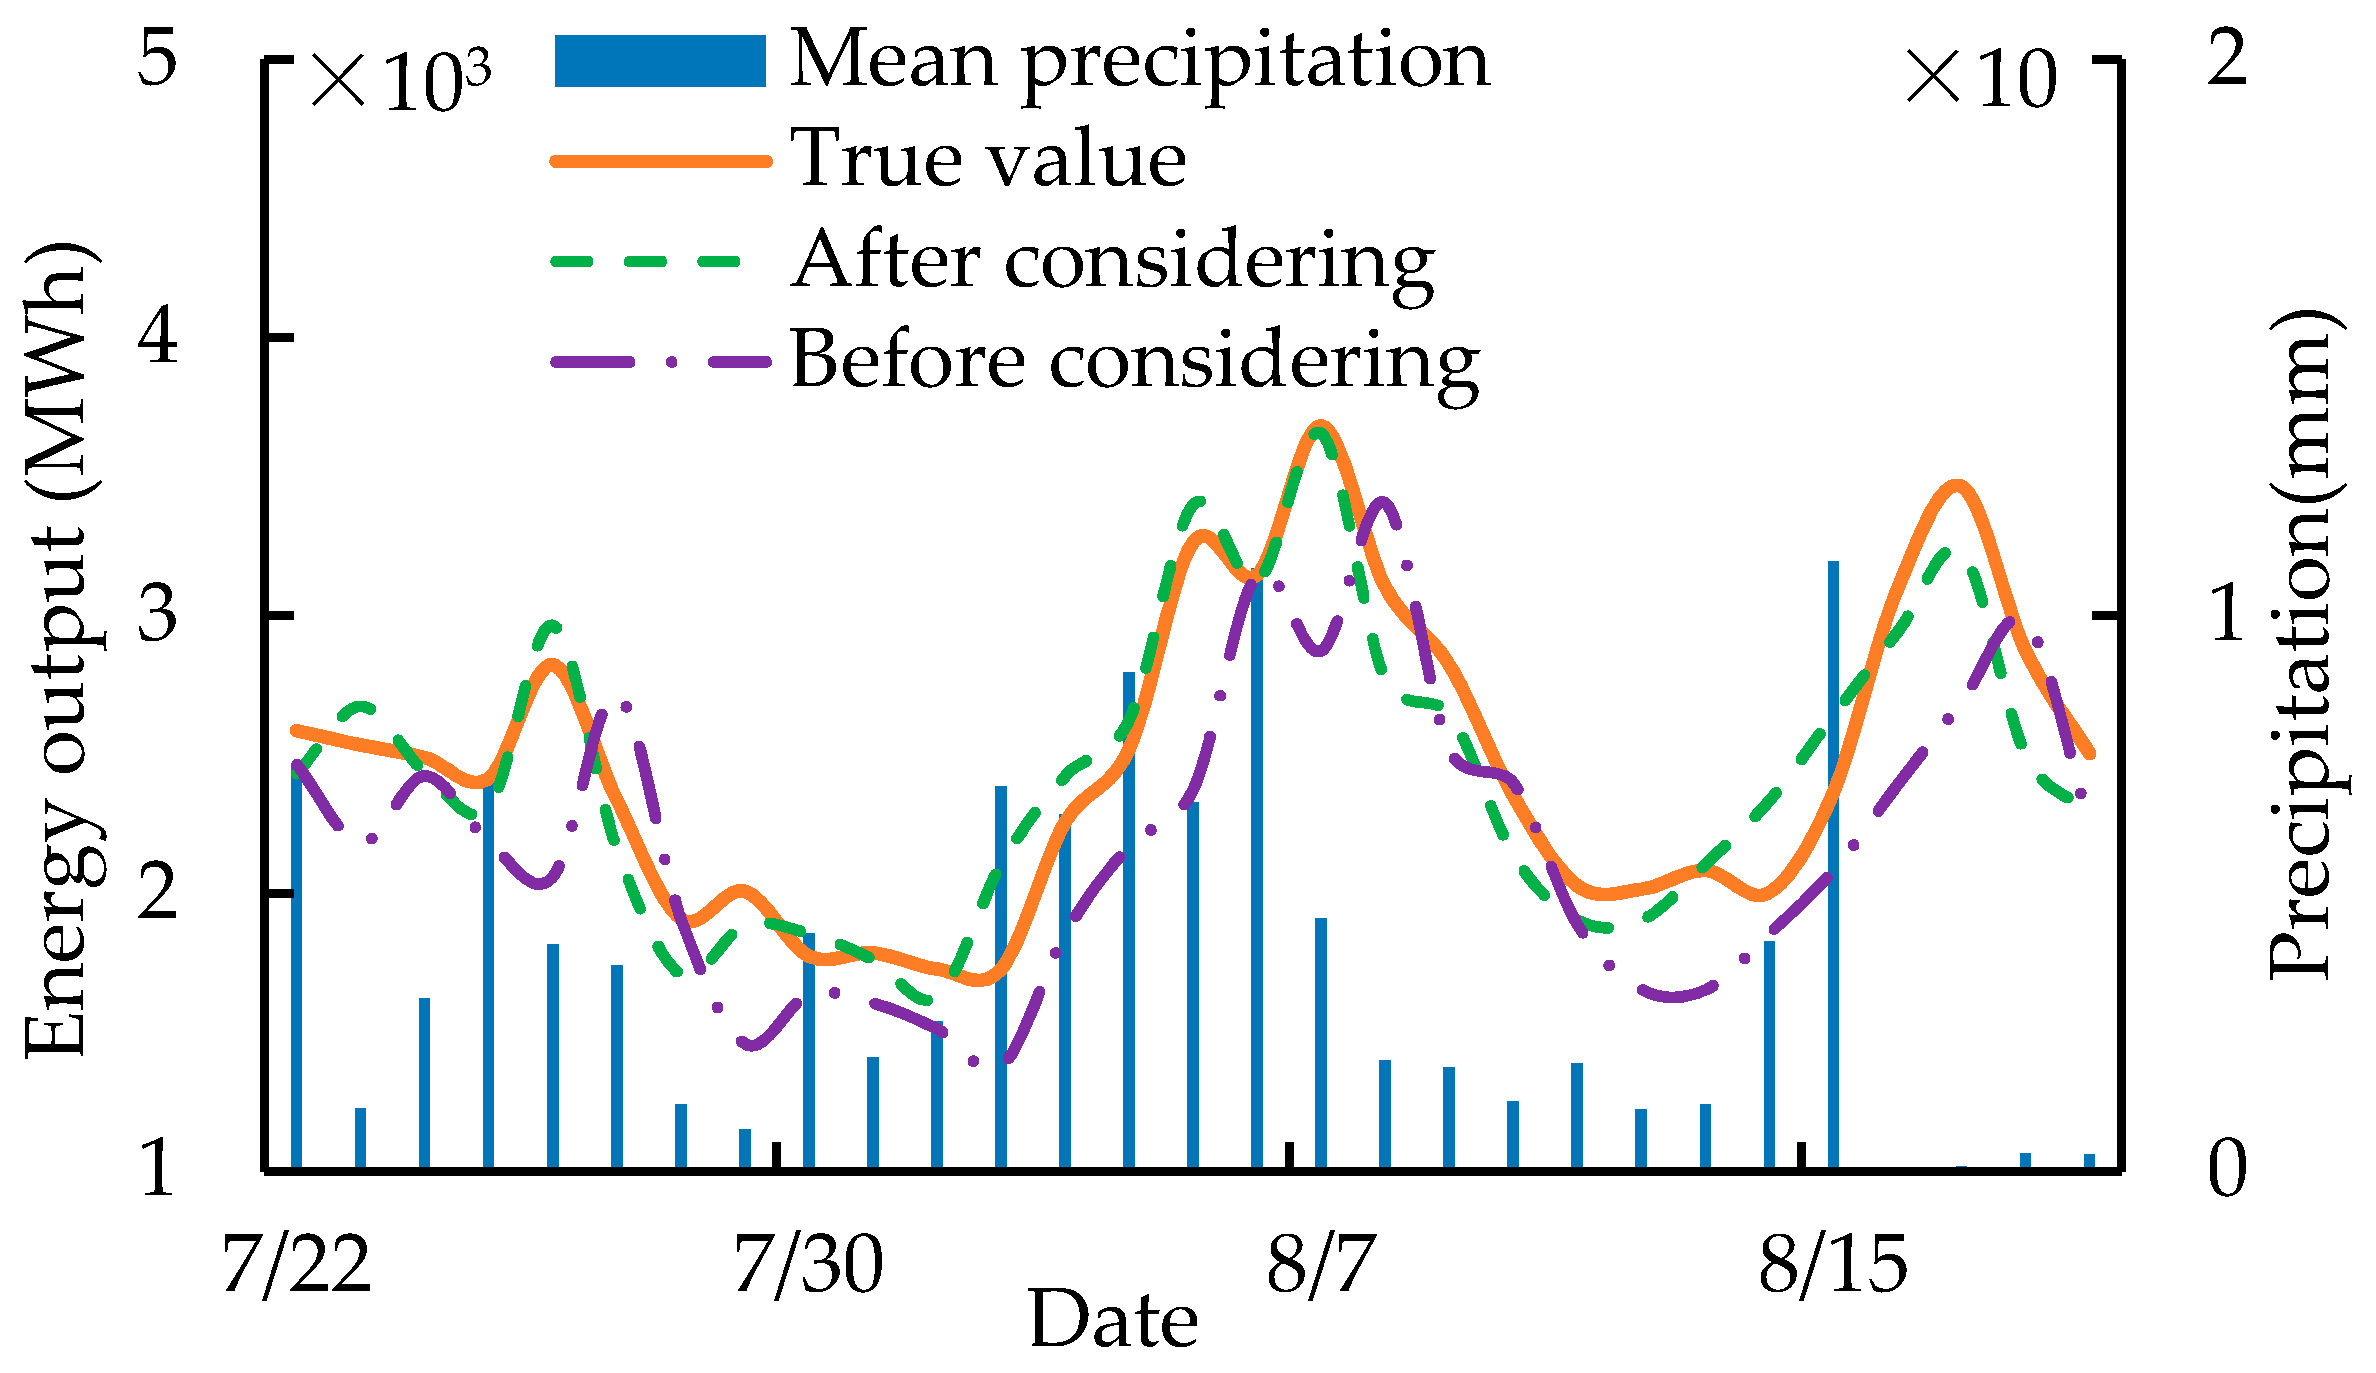
4.2. Validity Analysis Considering the Spatial Distribution of Precipitation
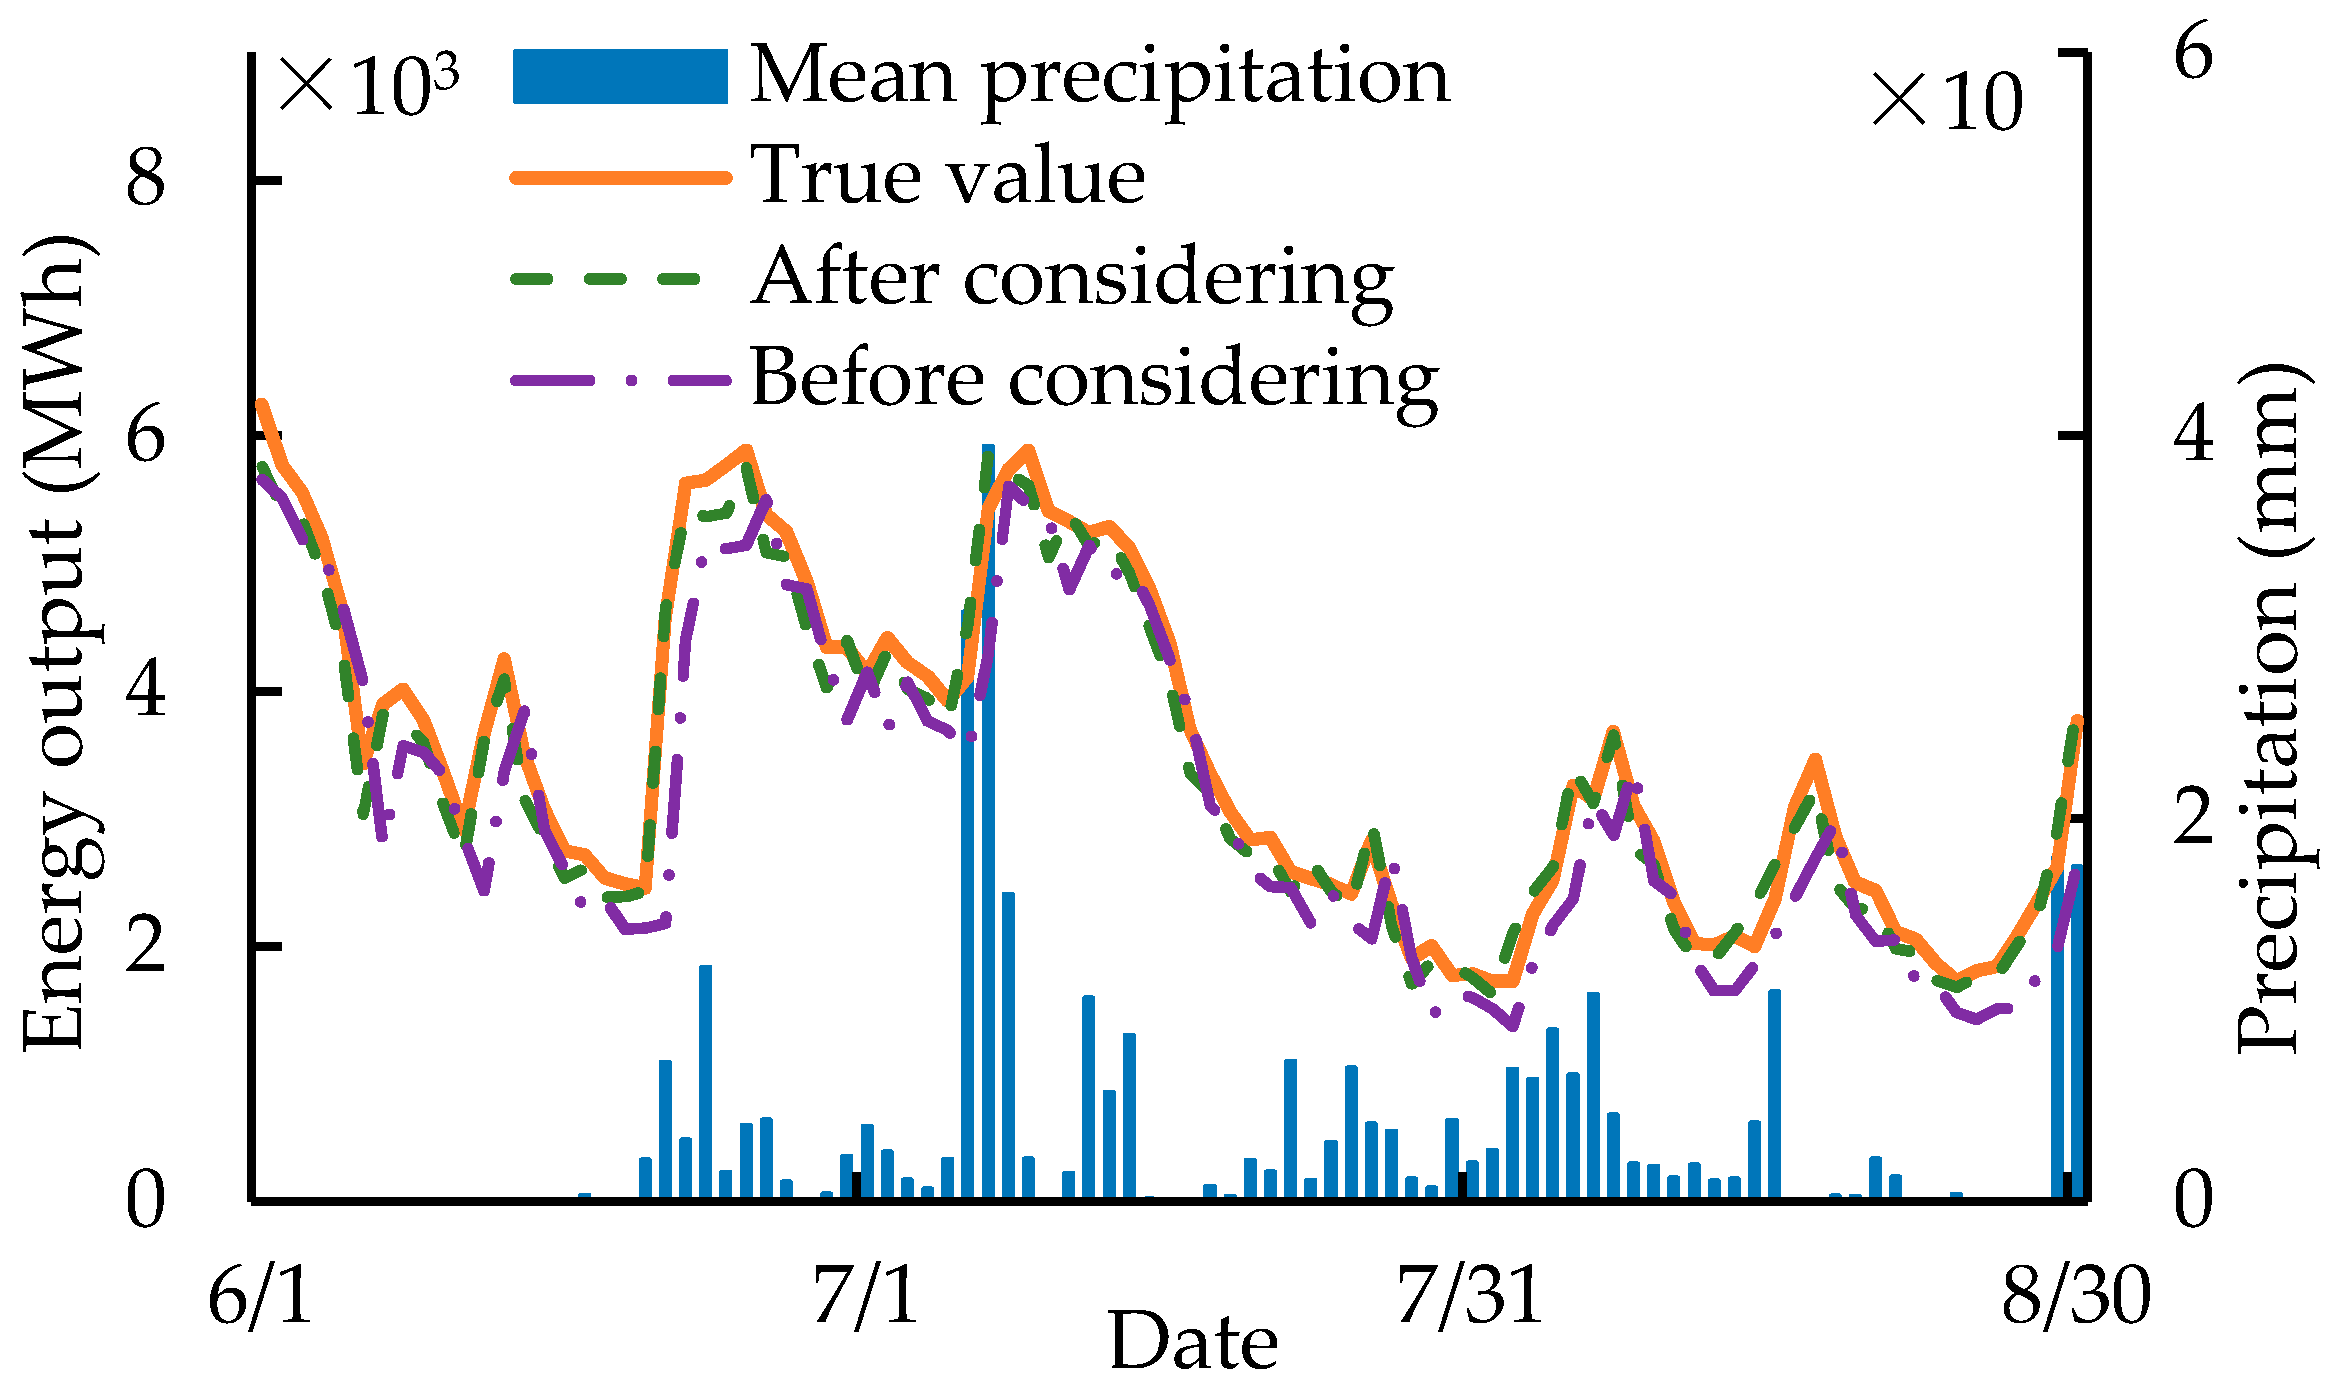
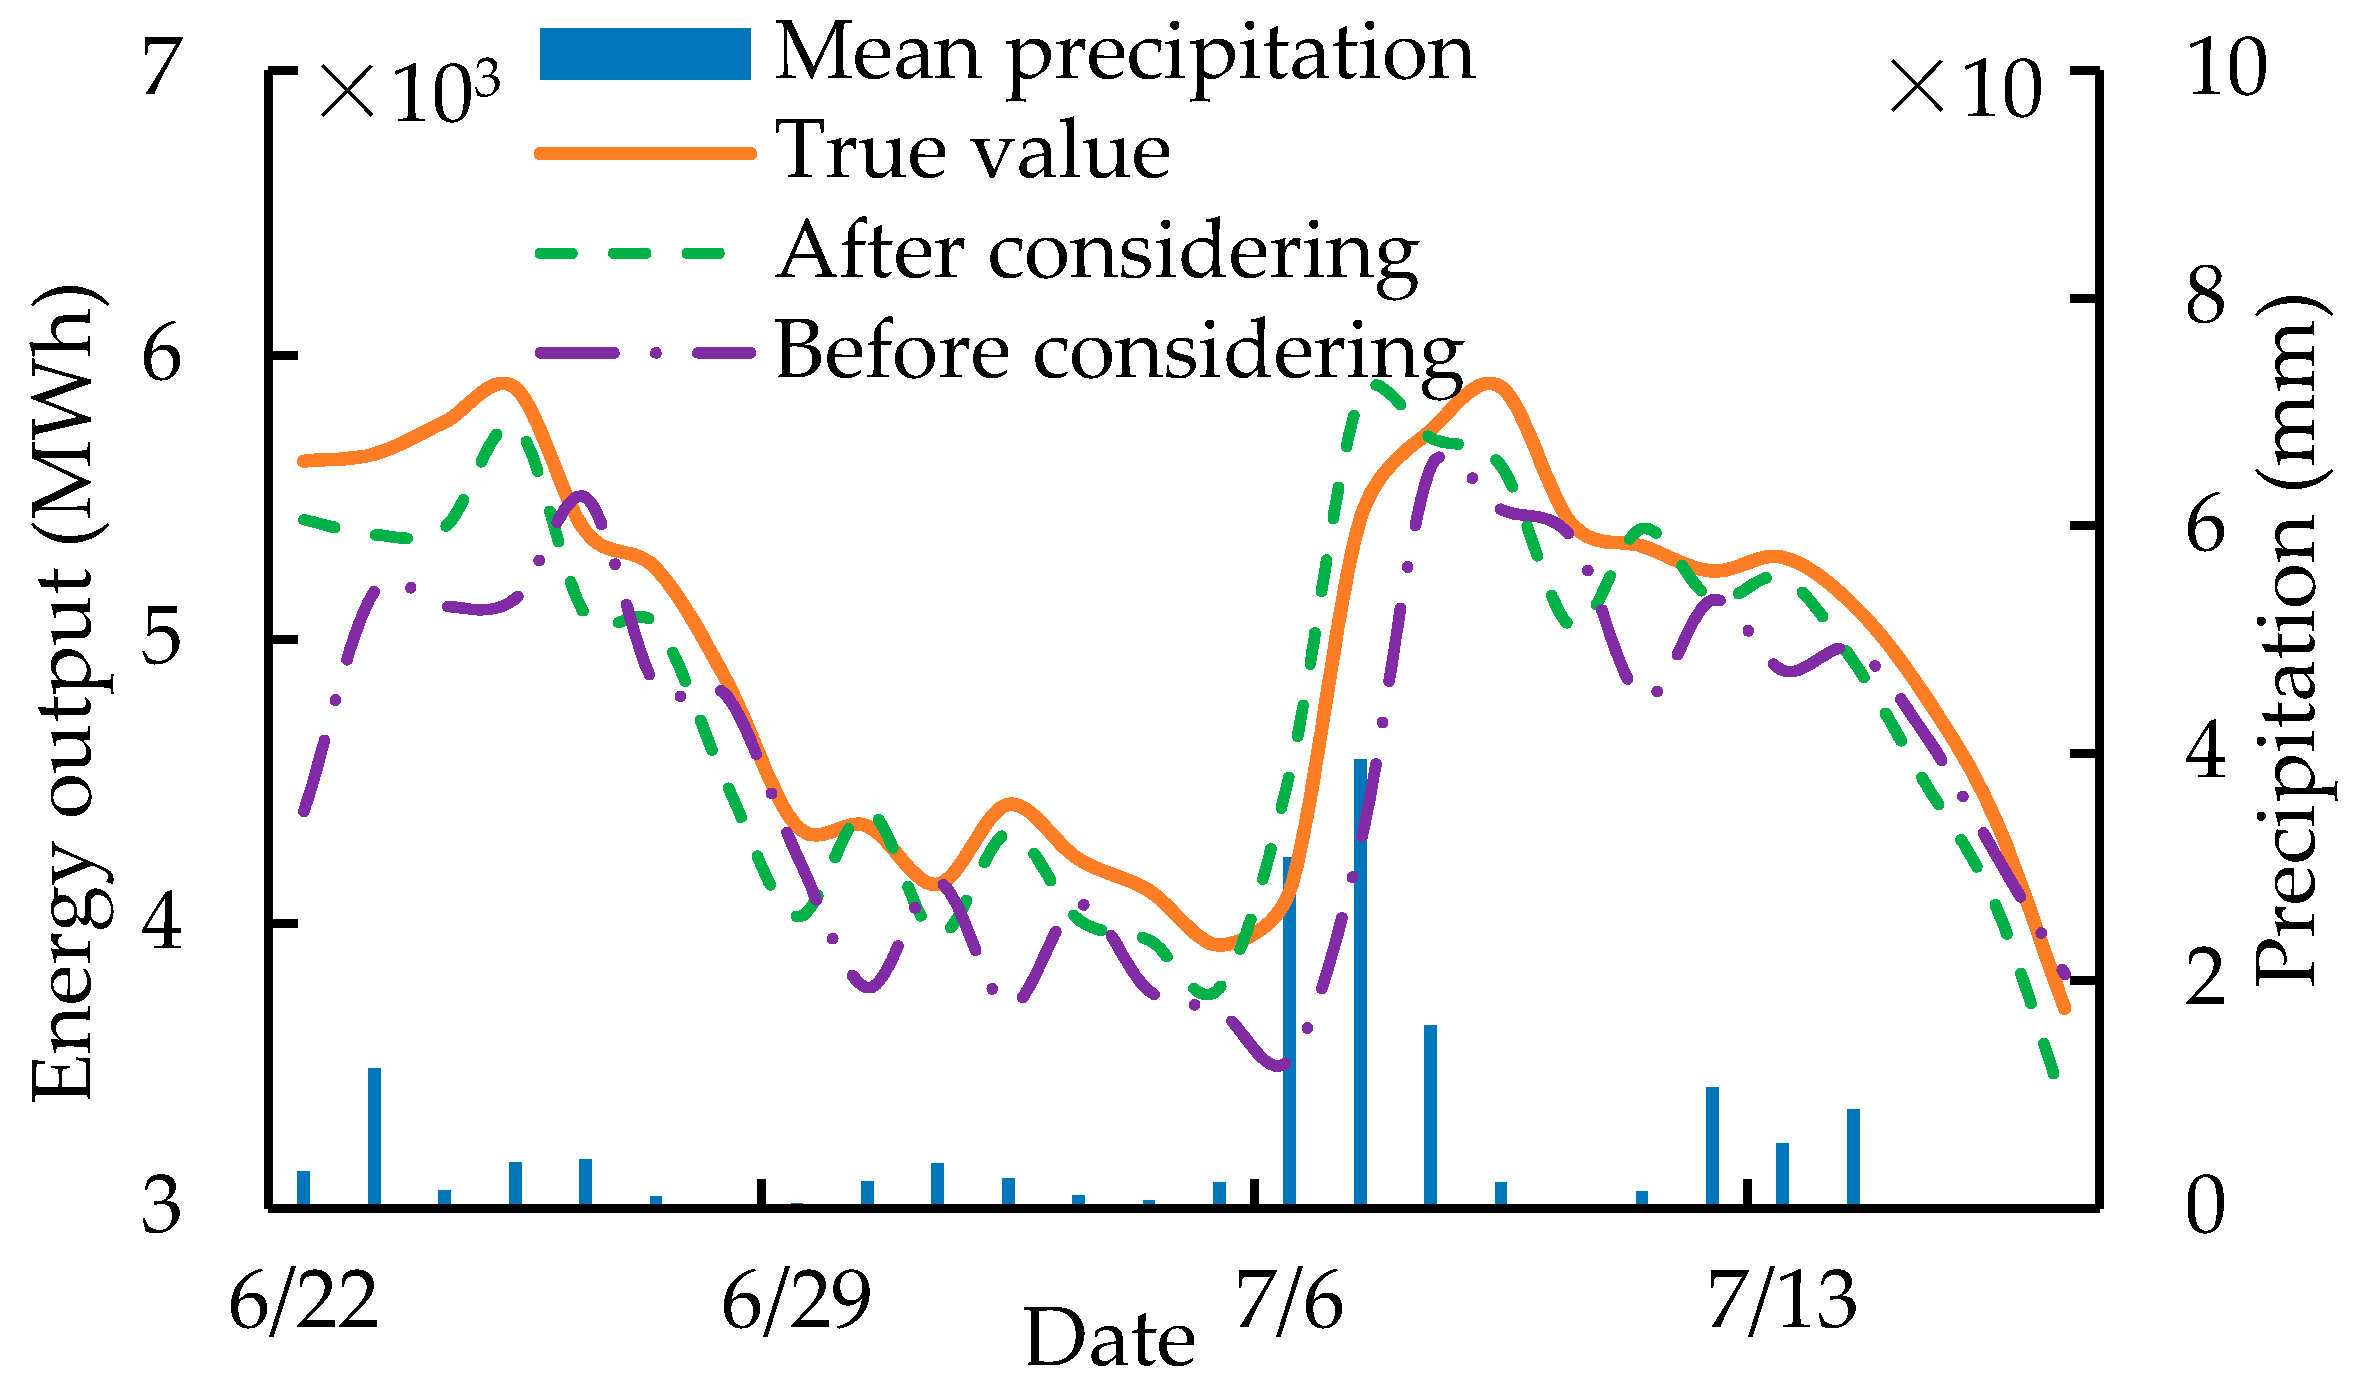
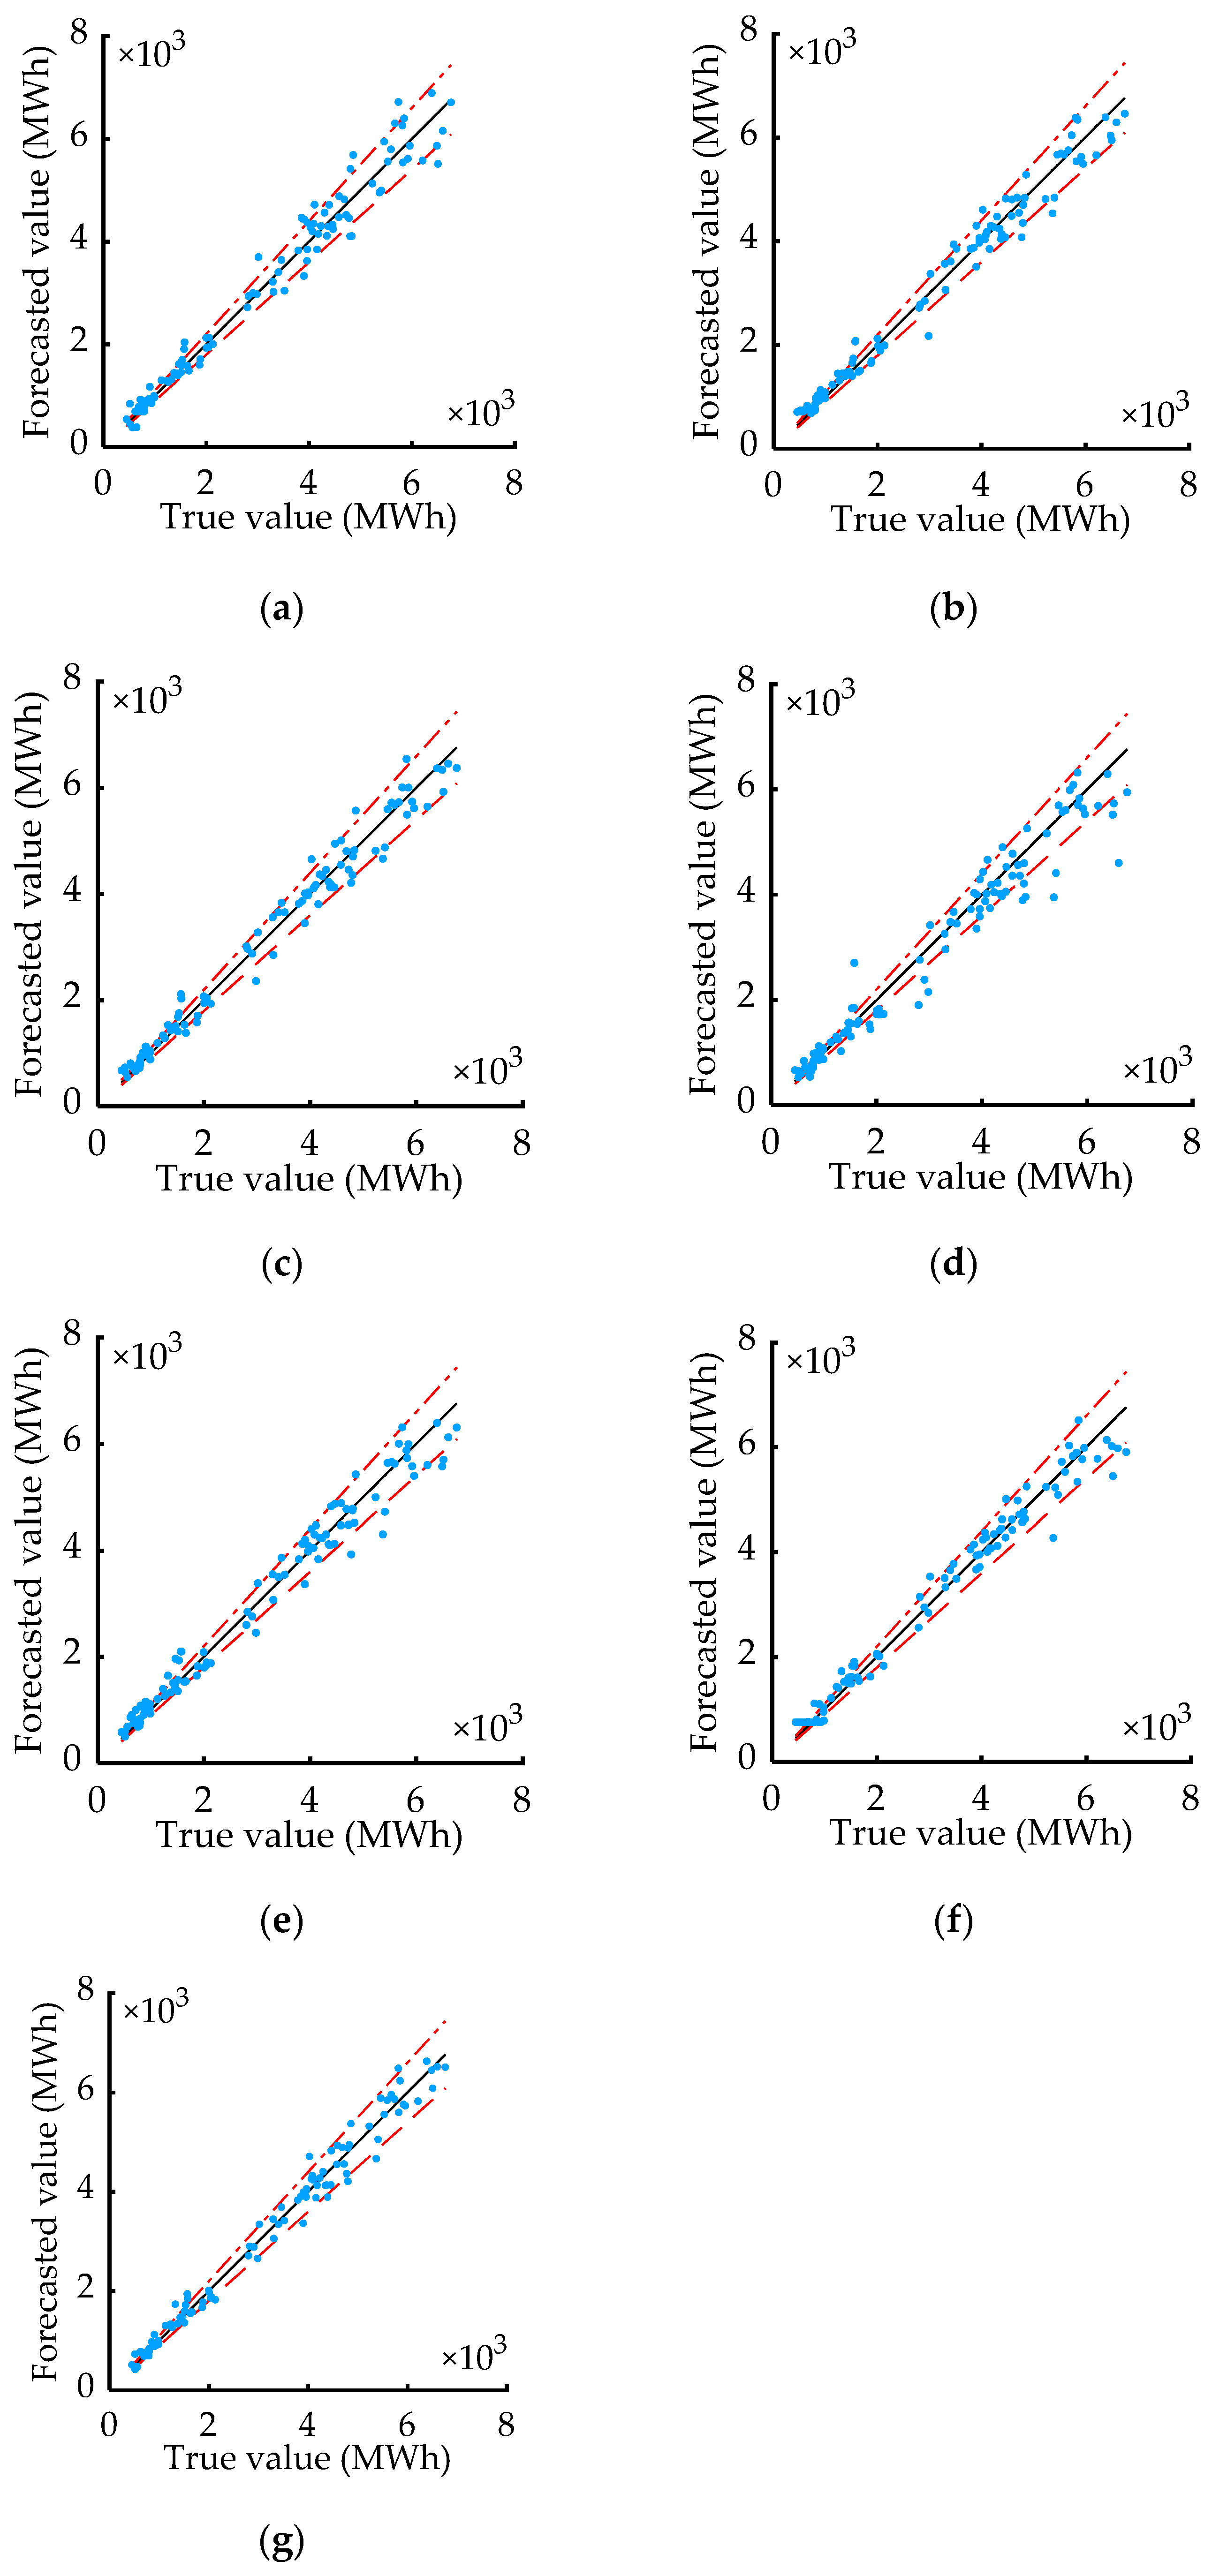
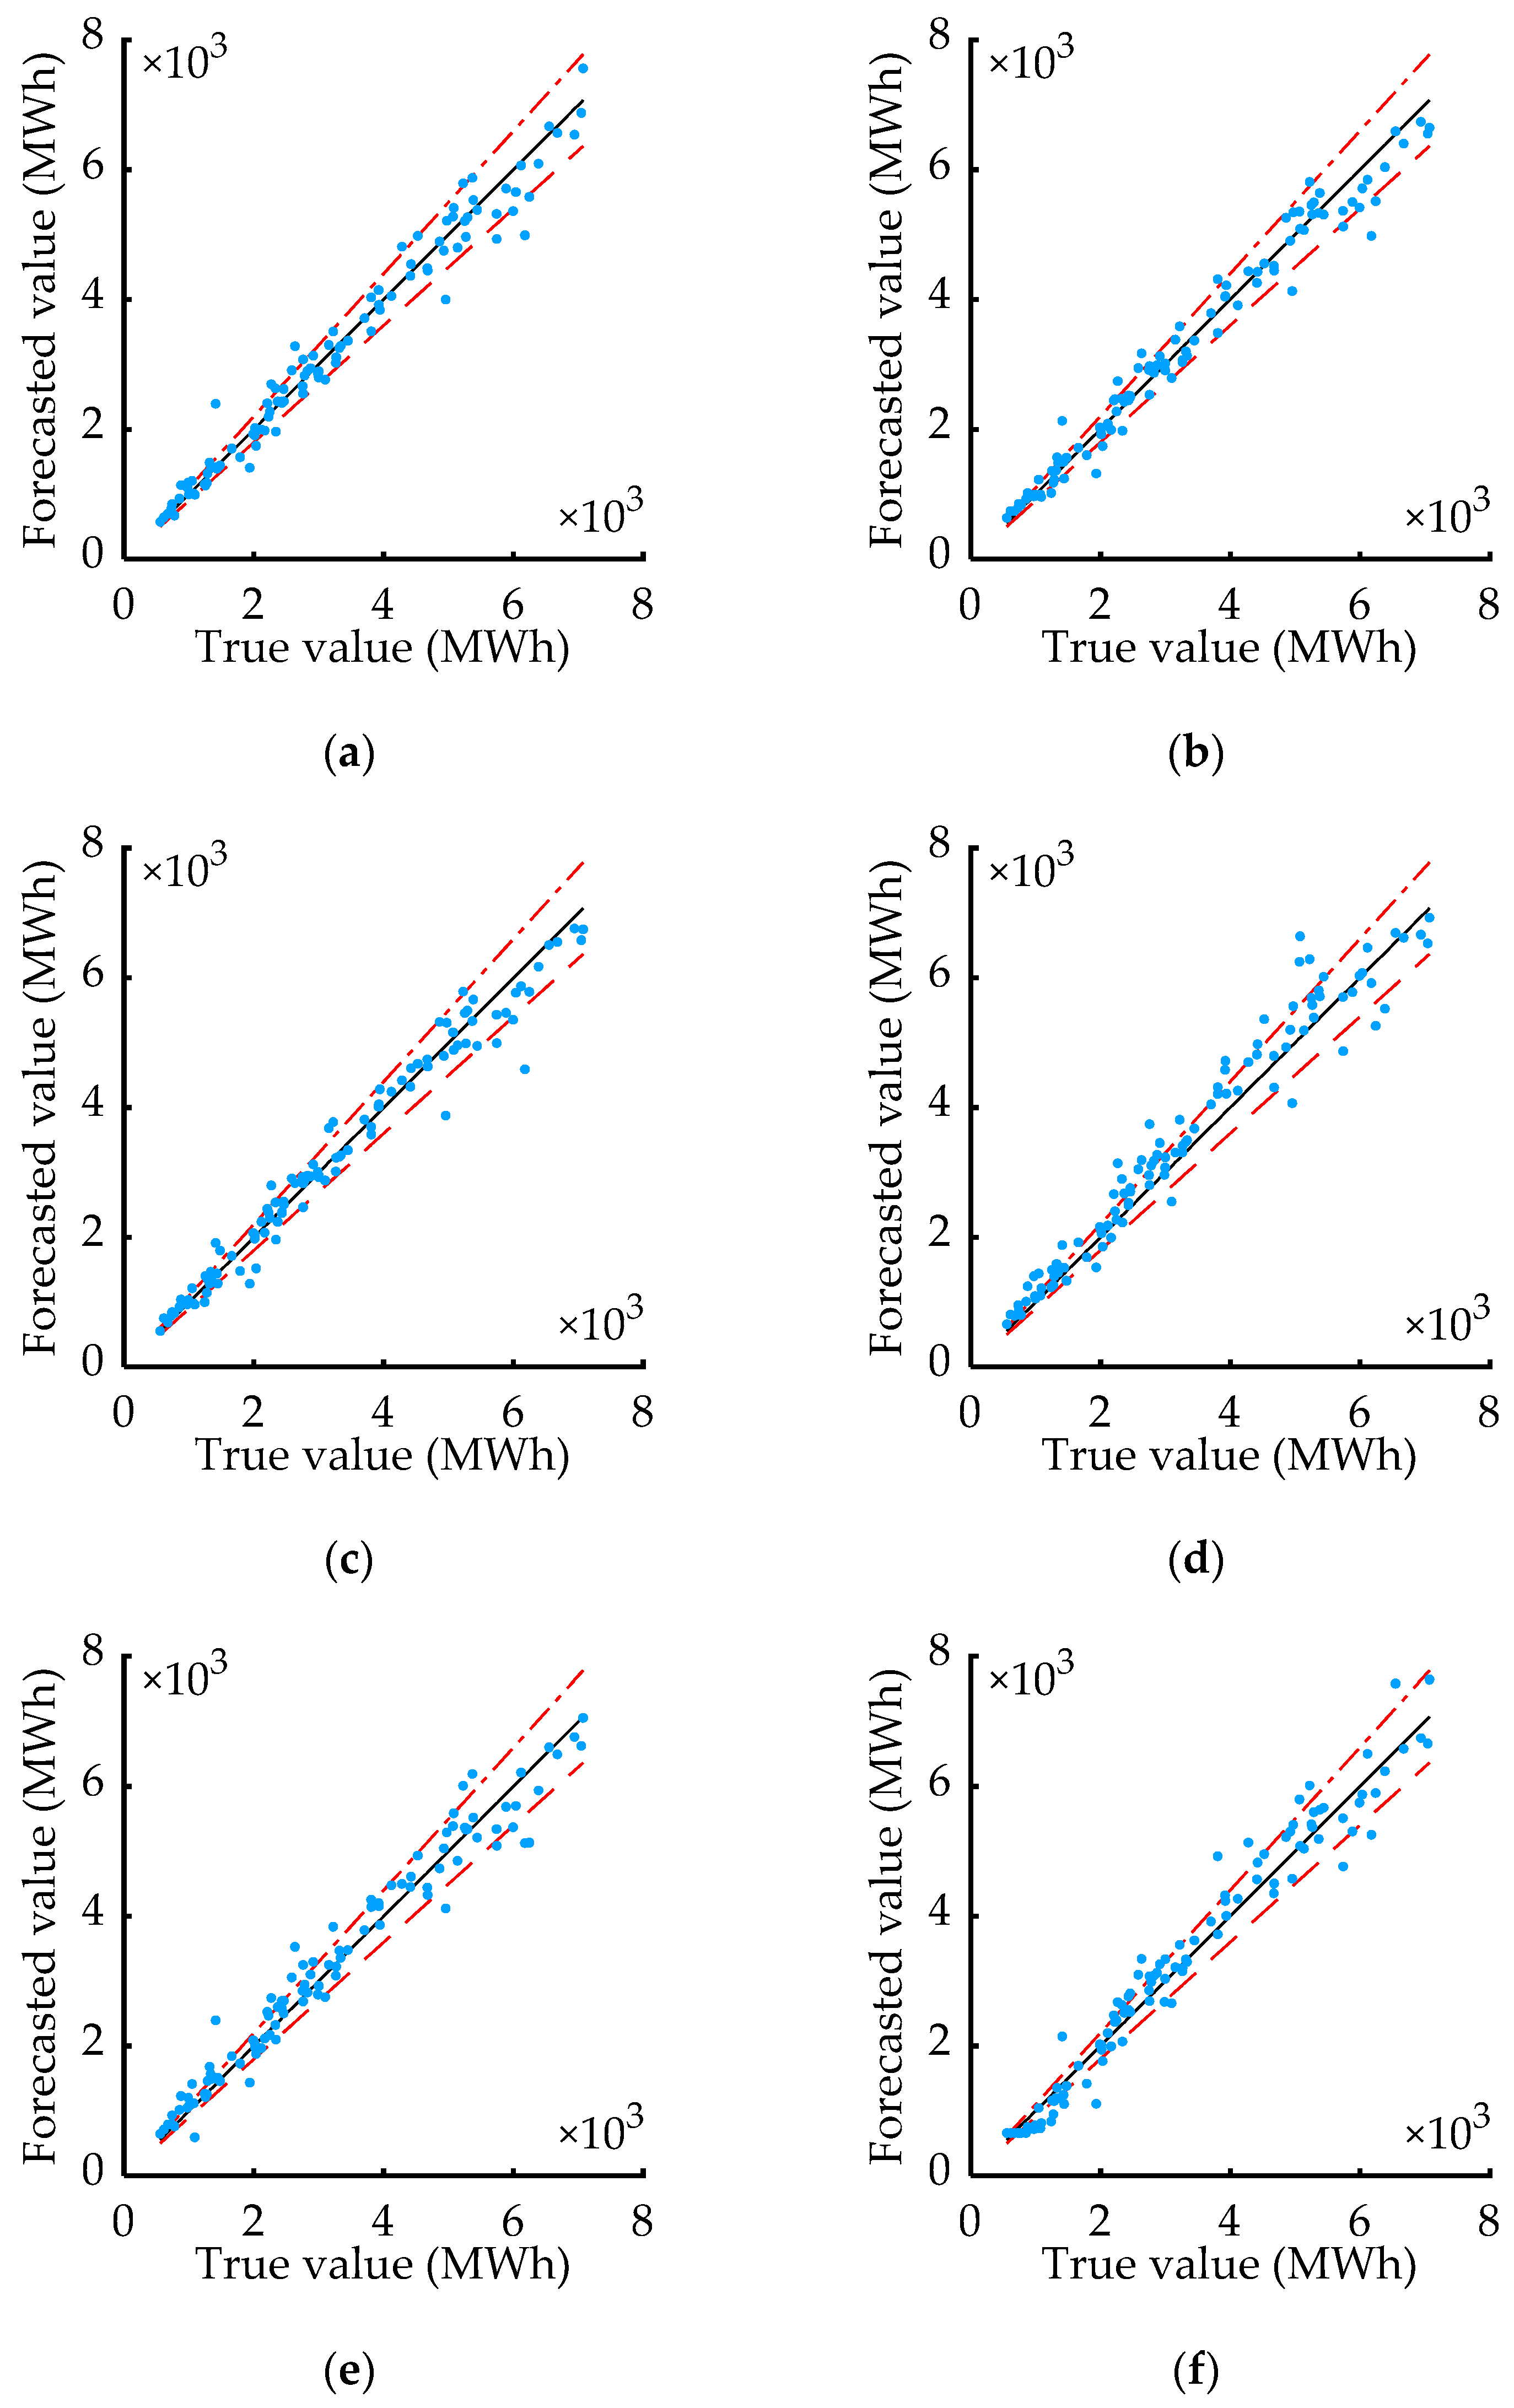
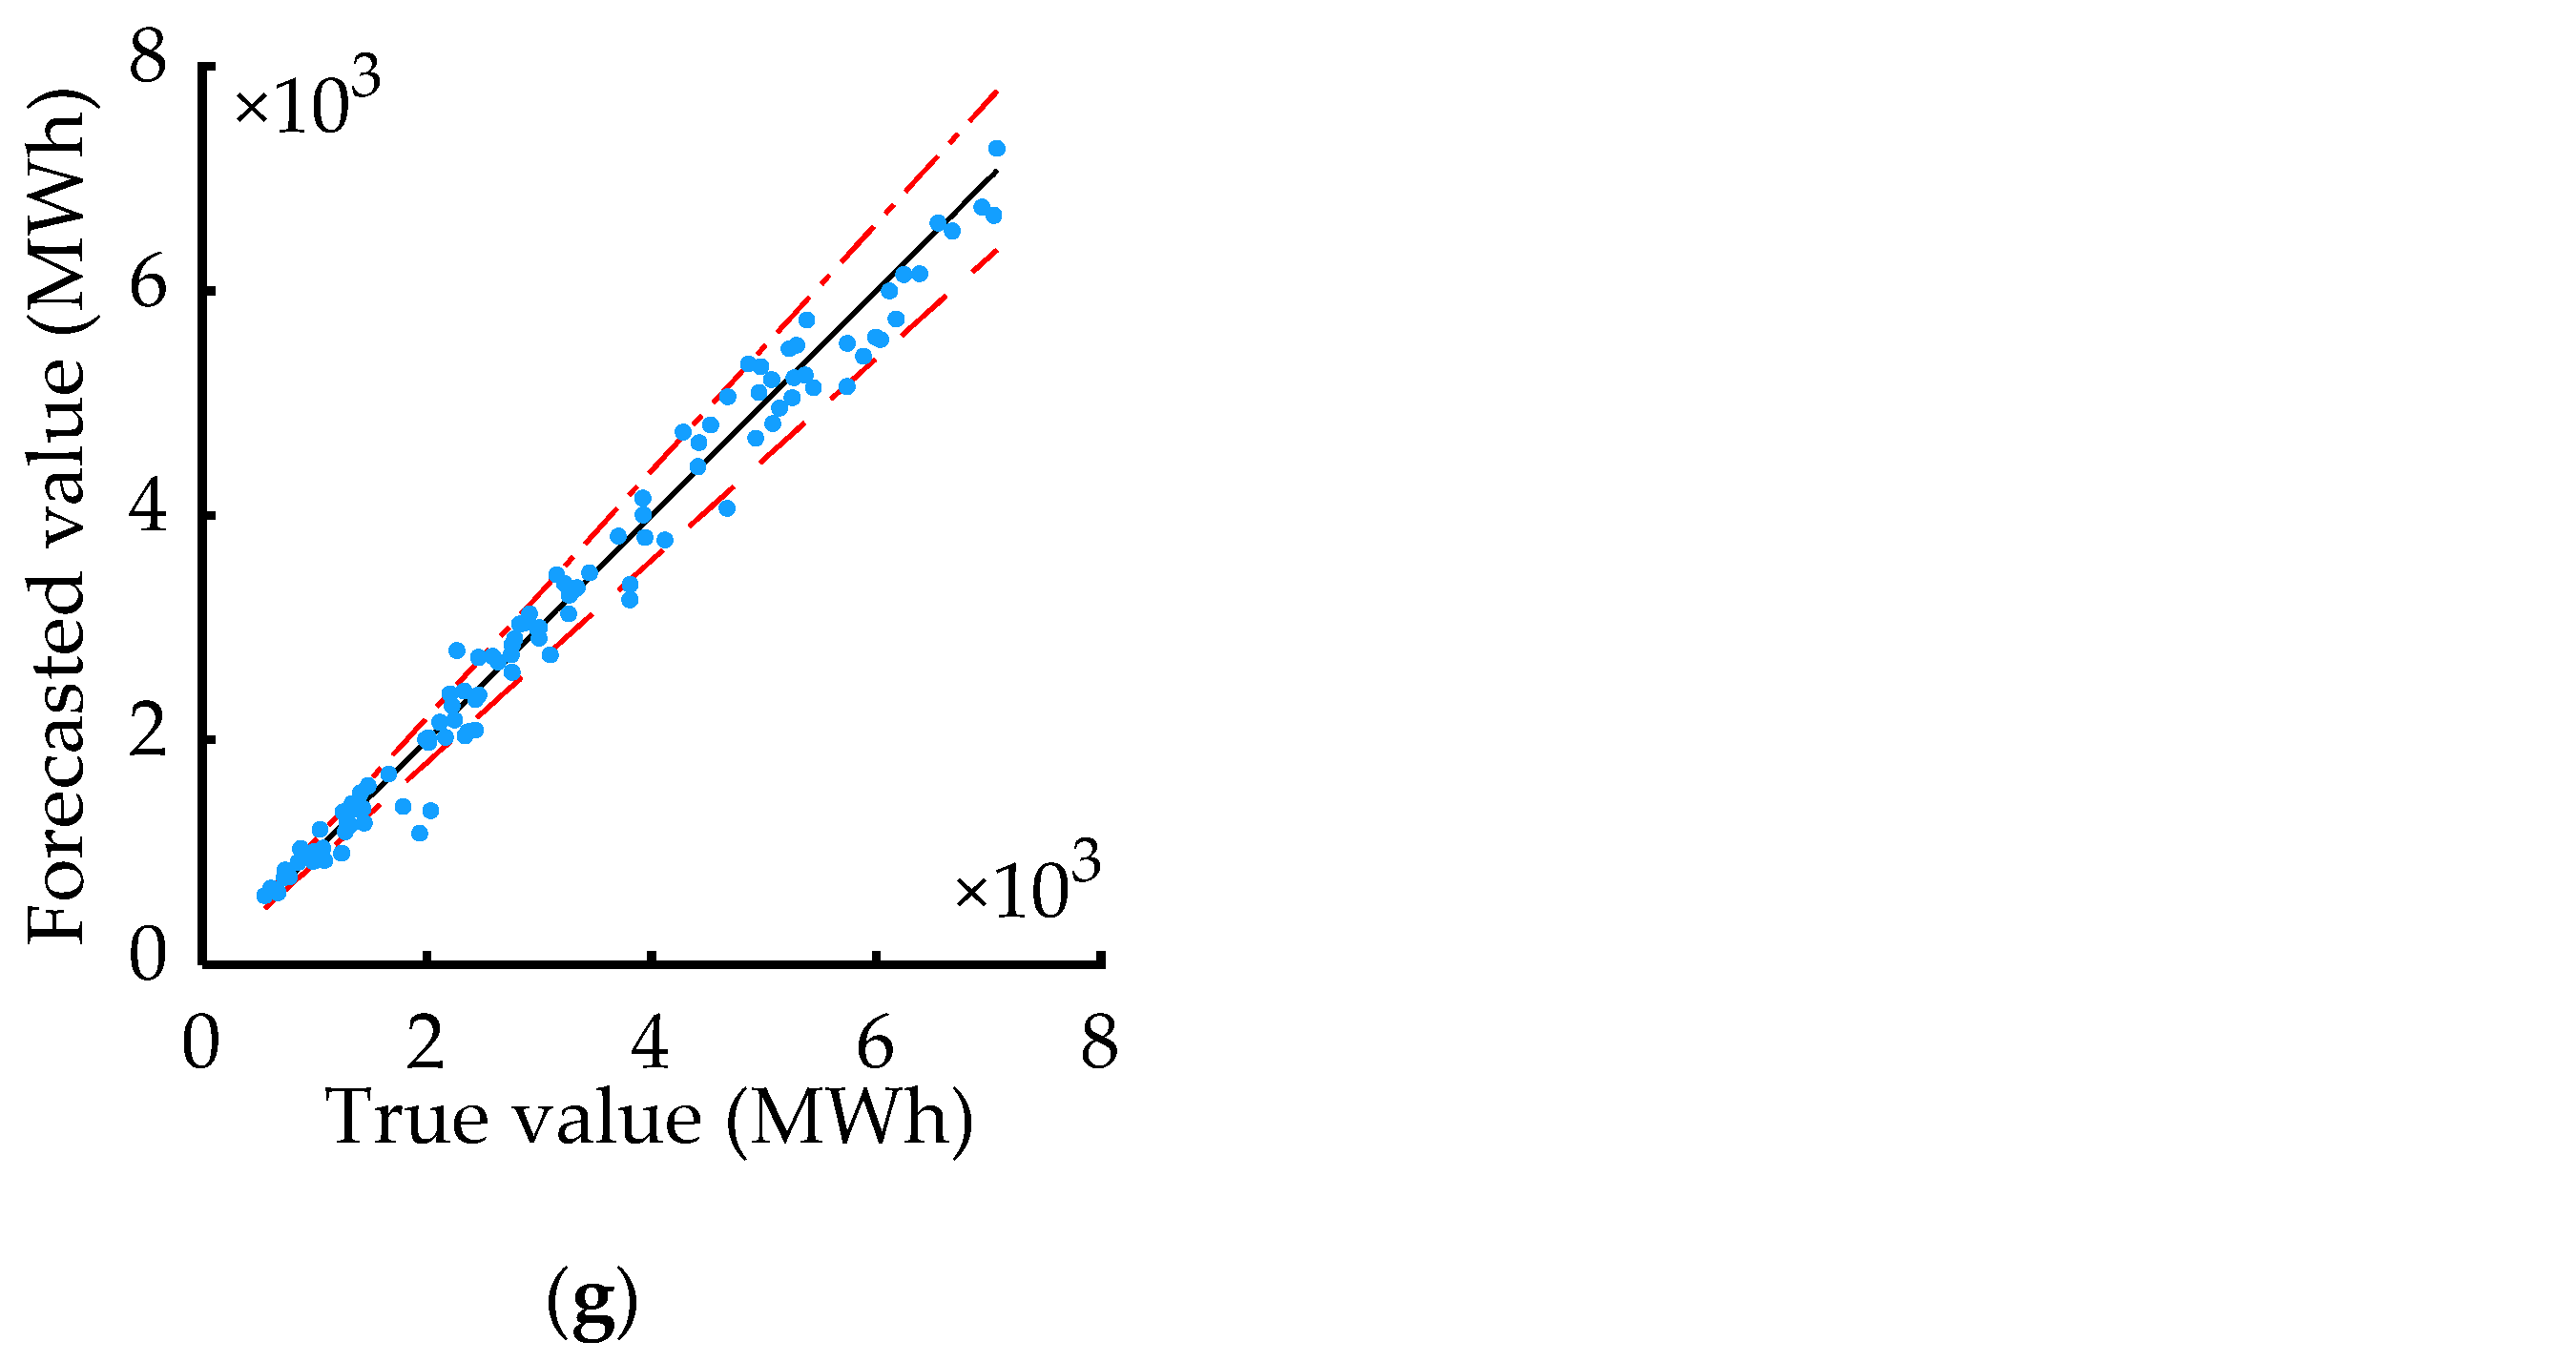
4.3. Comparison of Forecasting Models
5. Conclusions
- (1)
- Precipitation grid data with spatial distribution differences are applied to the neural network model to deeply explore the influence of the spatial distribution of precipitation on the daily power generation of a group of small hydropower stations.
- (2)
- The time lag between daily power generation changes and precipitation is analyzed, and the PMI method is used to estimate this “time difference”, which is used to select the best time-scale precipitation data for forecasting the daily power generation of a group of small hydropower stations.
- (3)
- Using multimodal deep learning methods based on a CNN and an MLP, according to the different characteristics of each modal data, different methods can be used to fully extract and integrate the characteristic information hidden in the precipitation and historical power generation data, improving the accuracy of forecasts of the daily power generation of a group of small hydropower stations.
Author Contributions
Funding
Institutional Review Board Statement
Informed Consent Statement
Data Availability Statement
Acknowledgments
Conflicts of Interest
References
- United Nations Industrial Development Organization. World Small Hydropower Development Report 2019. Available online: https://www.unido.org/sites/default/files/files/2020-07/ASIA%2BPACIFIC%20Book.pdf (accessed on 3 July 2021).
- Department of Rural Water Resources and Hydropower, Ministry of Water Resources of the People’s Republic of China. 2019 Annual Report on Rural Water Conservancy and Hydropower Work. Available online: http://www.mwr.gov.cn/sj/tjgb/ncslsdnb/202007/t20200730_1430330.html (accessed on 6 April 2021).
- Kong, Y.; Wang, J.; Kong, Z.; Song, F.; Liu, Z.; Wei, C. Small hydropower in China: The survey and sustainable future. Renew. Sustain. Energy Rev. 2015, 48, 425–433. [Google Scholar] [CrossRef]
- Cheng, C.; Liu, B.; Chau, K.-W.; Li, G.; Liao, S. China’s small hydropower and its dispatching management. Renew. Sustain. Energy Rev. 2015, 42, 43–55. [Google Scholar] [CrossRef]
- Magnusson, J.; Nævdal, G.; Matt, F.; Burkhart, J.F.; Winstral, A. Improving hydropower inflow forecasts by assimilating snow data. Hydrol. Res. 2020, 51, 226–237. [Google Scholar] [CrossRef]
- Reichl, F.; Hack, J. Derivation of flow duration curves to estimate hydropower generation potential in data-scarce regions. Water 2017, 9, 572. [Google Scholar] [CrossRef] [Green Version]
- Jingsong, D.; Difei, S.; Hanting, Y.; Zhaolong, W. Stochastic modeling of small HydroPower output based on regional synchronism feature and its allowed penetration level research. In Proceedings of the 2018 International Conference on Power System Technology (POWERCON), Guangzhou, China, 6–8 November 2018; pp. 1433–1438. [Google Scholar]
- Wen, X.; Gao, X.; Su, L.; Fan, Q.; Peng, W. Analysis of influencing factors and characteristics of small hydropower generation. In Proceedings of the 2017 9th International Conference on Modelling, Identification and Control (ICMIC), Kunming, China, 10–12 July 2017; pp. 658–662. [Google Scholar]
- Li, G.; Li, B.J.; Yu, X.G.; Cheng, C.T. Echo state network with Bayesian regularization for forecasting short-term power production of small hydropower plants. Energies 2015, 8, 12228–12241. [Google Scholar] [CrossRef] [Green Version]
- Li, G.; Liu, C.X.; Liao, S.L.; Cheng, C.T. Applying a correlation analysis method to long-term forecasting of power production at small hydropower plants. Water 2015, 7, 4806–4820. [Google Scholar] [CrossRef] [Green Version]
- Cheng, C.T.; Miao, S.M.; Luo, B.; Sun, Y.J. Forecasting monthly energy production of small hydropower plants in ungauged basins using grey model and improved seasonal index. J. Hydroinform. 2017, 19, 993–1008. [Google Scholar] [CrossRef] [Green Version]
- Kim, C.; Kim, D.-H. Effect of rainfall spatial distribution and duration on minimum spatial resolution of rainfall data for accurate surface runoff prediction. J. Hydro-Environ. Res. 2018, 20, 1–8. [Google Scholar] [CrossRef]
- Meng, X.Y.; Wang, H.; Shi, C.X.; Wu, Y.P.; Ji, X.N. Establishment and evaluation of the China meteorological assimilation driving datasets for the SWAT model (CMADS). Water 2018, 10, 1555. [Google Scholar] [CrossRef] [Green Version]
- Di, Z.; Maggioni, V.; Mei, Y.; Vazquez, M.; Houser, P.; Emelianenko, M. Centroidal Voronoi tessellation based methods for optimal rain gauge location prediction. J. Hydrol. 2020, 584, 124651. [Google Scholar] [CrossRef] [Green Version]
- Silverman, B.W. Density Estimation for Statistics and Data Analysis; Chapman & Hall: London, UK, 1986; Volume 39, pp. 296–297. [Google Scholar]
- May, R.J.; Maier, H.R.; Dandy, G.C.; Fernando, T.M.K.G. Non-linear variable selection for artificial neural networks using partial mutual information. Environ. Model. Softw. 2008, 23, 1312–1326. [Google Scholar] [CrossRef]
- Hanchuan, P.; Fuhui, L.; Ding, C. Feature selection based on mutual information criteria of max-dependency, max-relevance, and min-redundancy. IEEE Trans. Pattern Anal. Mach. Intell. 2005, 27, 1226–1238. [Google Scholar] [CrossRef] [PubMed]
- Sharma, A.; Luk, K.C.; Cordery, I.; Lall, U. Seasonal to interannual rainfall probabilistic forecasts for improved water supply management: Part 2—Predictor identification of quarterly rainfall using ocean-atmosphere information. J. Hydrol. 2000, 239, 240–248. [Google Scholar] [CrossRef]
- Akaike, H. A new look at the statistical model identification. IEEE Trans. Autom. Control 1974, 19, 716–723. [Google Scholar] [CrossRef]
- Baltrušaitis, T.; Ahuja, C.; Morency, L. Multimodal machine learning: A survey and taxonomy. IEEE Trans. Pattern Anal. Mach. Intell. 2019, 41, 423–443. [Google Scholar] [CrossRef] [PubMed] [Green Version]
- Ramachandram, D.; Taylor, G.W. Deep multimodal learning: A survey on recent advances and trends. IEEE Signal Process. Mag. 2017, 34, 96–108. [Google Scholar] [CrossRef]
- McGurk, H.; MacDonald, J. Hearing lips and seeing voices. Nature 1976, 264, 746–748. [Google Scholar] [CrossRef] [PubMed]
- NASA. The Global Precipitation Measurement Mission (GPM). Available online: https://gpm.nasa.gov/missions/GPM#gpmcoreobservatorysatellite (accessed on 20 March 2021).
- Kim, S.; Kim, H. A new metric of absolute percentage error for intermittent demand forecasts. Int. J. Forecast. 2016, 32, 669–679. [Google Scholar] [CrossRef]

| Layers | ||||||||||||
|---|---|---|---|---|---|---|---|---|---|---|---|---|
| L1,2 | L1,3 | L1,4 | L1,5 | L1,6 | L2,1 | L2,2 | L2,3 | L1 | L2 | L3 | L4 | |
| Num. of neurons | 32 | 64 | 128 | 16 | 8 | 32 | 16 | 8 | 16 | 8 | 4 | 1 |
| Size of conv. kernel | (2, 2) | (2, 2) | (2, 2) | / | / | / | / | / | / | / | / | / |
| Pooling block size | (1, 2) | (1, 2) | (1, 2) | / | / | / | / | / | / | / | / | / |
| Activation function | relu | relu | relu | relu | relu | relu | relu | relu | / | relu | relu | liner |
| Evaluation Metrics | Is the Spatial Distribution of Precipitation Considered? | |
|---|---|---|
| No | Yes | |
| AC (%) | 88.72 | 94.52 |
| MAPE (%) | 8.87 | 4.55 |
| RMSE (MWh) | 570.26 | 288.43 |
| R2 (×10−1) | 5.385 | 8.564 |
| APE < 10% (d) 1 | 58 | 86 |
| APE < 10% (%) 2 | 63.04 | 93.48 |
| APE < 5% (d) 3 | 31 | 57 |
| APE < 5% (%) 4 | 33.70 | 61.96 |
| Evaluation Metrics | Is the Spatial Distribution of Precipitation Considered? | |
|---|---|---|
| No | Yes | |
| AC (%) | 85.02 | 93.39 |
| MAPE (%) | 11.77 | 5.63 |
| RMSE (MWh) | 528.66 | 217.15 |
| R2 (×10−1) | 8.347 | 9.721 |
| APE < 10% (d) 1 | 47 | 82 |
| APE < 10% (%) 2 | 51.09 | 89.13 |
| APE < 5% (d) 3 | 25 | 43 |
| APE < 5% (%) 4 | 27.17 | 46.74 |
| Evaluation Metrics | Methods | ||||||
|---|---|---|---|---|---|---|---|
| SVR | GBRT | RF | LSTM | MLP | CNN | CM-MDLN | |
| AC (%) | 87.31 | 86.77 | 87.97 | 84.91 | 86.32 | 85.87 | 93.07 |
| MAPE (%) | 8.70 | 9.01 | 8.30 | 10.72 | 9.92 | 9.16 | 5.71 |
| RMSE (MWh) | 326.28 | 277.51 | 267.66 | 418.31 | 313.40 | 279.93 | 238.41 |
| R2 (×10−1) | 9.613 | 9.692 | 9.607 | 9.504 | 9.635 | 9.689 | 9.847 |
| APE < 10% (d) 1 | 74 | 80 | 78 | 64 | 70 | 74 | 92 |
| APE < 10% (%) 2 | 69.81 | 75.47 | 73.58 | 60.38 | 66.04 | 69.81 | 86.79 |
| APE < 5% (d) 3 | 44 | 46 | 47 | 37 | 30 | 45 | 55 |
| APE < 5% (%) 4 | 41.51 | 43.39 | 44.34 | 34.91 | 28.30 | 42.45 | 51.89 |
| Evaluation Metrics | Methods | ||||||
|---|---|---|---|---|---|---|---|
| SVR | GBRT | RF | LSTM | MLP | CNN | CM-MDLN | |
| AC (%) | 88.70 | 89.60 | 89.72 | 84.78 | 85.79 | 86.51 | 92.80 |
| MAPE (%) | 7.45 | 7.52 | 7.40 | 11.59 | 9.57 | 10.33 | 5.70 |
| RMSE (MWh) | 305.29 | 290.99 | 311.98 | 429.62 | 344.93 | 362.73 | 210.63 |
| R2 (×10−1) | 9.714 | 9.740 | 9.702 | 9.435 | 9.635 | 9.597 | 9.808 |
| APE < 10% (d) 1 | 80 | 79 | 79 | 60 | 70 | 64 | 82 |
| APE < 10% (%) 2 | 75.47 | 74.52 | 74.52 | 56.60 | 66.03 | 60.37 | 77.36 |
| APE < 5% (d) 3 | 51 | 47 | 52 | 33 | 43 | 35 | 56 |
| APE < 5% (%) 4 | 48.11 | 44.33 | 49.05 | 31.13 | 40.56 | 33.01 | 52.83 |
Publisher’s Note: MDPI stays neutral with regard to jurisdictional claims in published maps and institutional affiliations. |
© 2021 by the authors. Licensee MDPI, Basel, Switzerland. This article is an open access article distributed under the terms and conditions of the Creative Commons Attribution (CC BY) license (https://creativecommons.org/licenses/by/4.0/).
Share and Cite
Yang, S.; Wei, H.; Zhang, L.; Qin, S. Daily Power Generation Forecasting Method for a Group of Small Hydropower Stations Considering the Spatial and Temporal Distribution of Precipitation—South China Case Study. Energies 2021, 14, 4387. https://doi.org/10.3390/en14154387
Yang S, Wei H, Zhang L, Qin S. Daily Power Generation Forecasting Method for a Group of Small Hydropower Stations Considering the Spatial and Temporal Distribution of Precipitation—South China Case Study. Energies. 2021; 14(15):4387. https://doi.org/10.3390/en14154387
Chicago/Turabian StyleYang, Shaojun, Hua Wei, Le Zhang, and Shengchao Qin. 2021. "Daily Power Generation Forecasting Method for a Group of Small Hydropower Stations Considering the Spatial and Temporal Distribution of Precipitation—South China Case Study" Energies 14, no. 15: 4387. https://doi.org/10.3390/en14154387
APA StyleYang, S., Wei, H., Zhang, L., & Qin, S. (2021). Daily Power Generation Forecasting Method for a Group of Small Hydropower Stations Considering the Spatial and Temporal Distribution of Precipitation—South China Case Study. Energies, 14(15), 4387. https://doi.org/10.3390/en14154387