
Permeability and Mineralogy of the Újfalu Formation, Hungary, from Production Tests and Experimental Rock Characterization: Implications for Geothermal Heat Projects

 , , and
Abstract
:1. Introduction
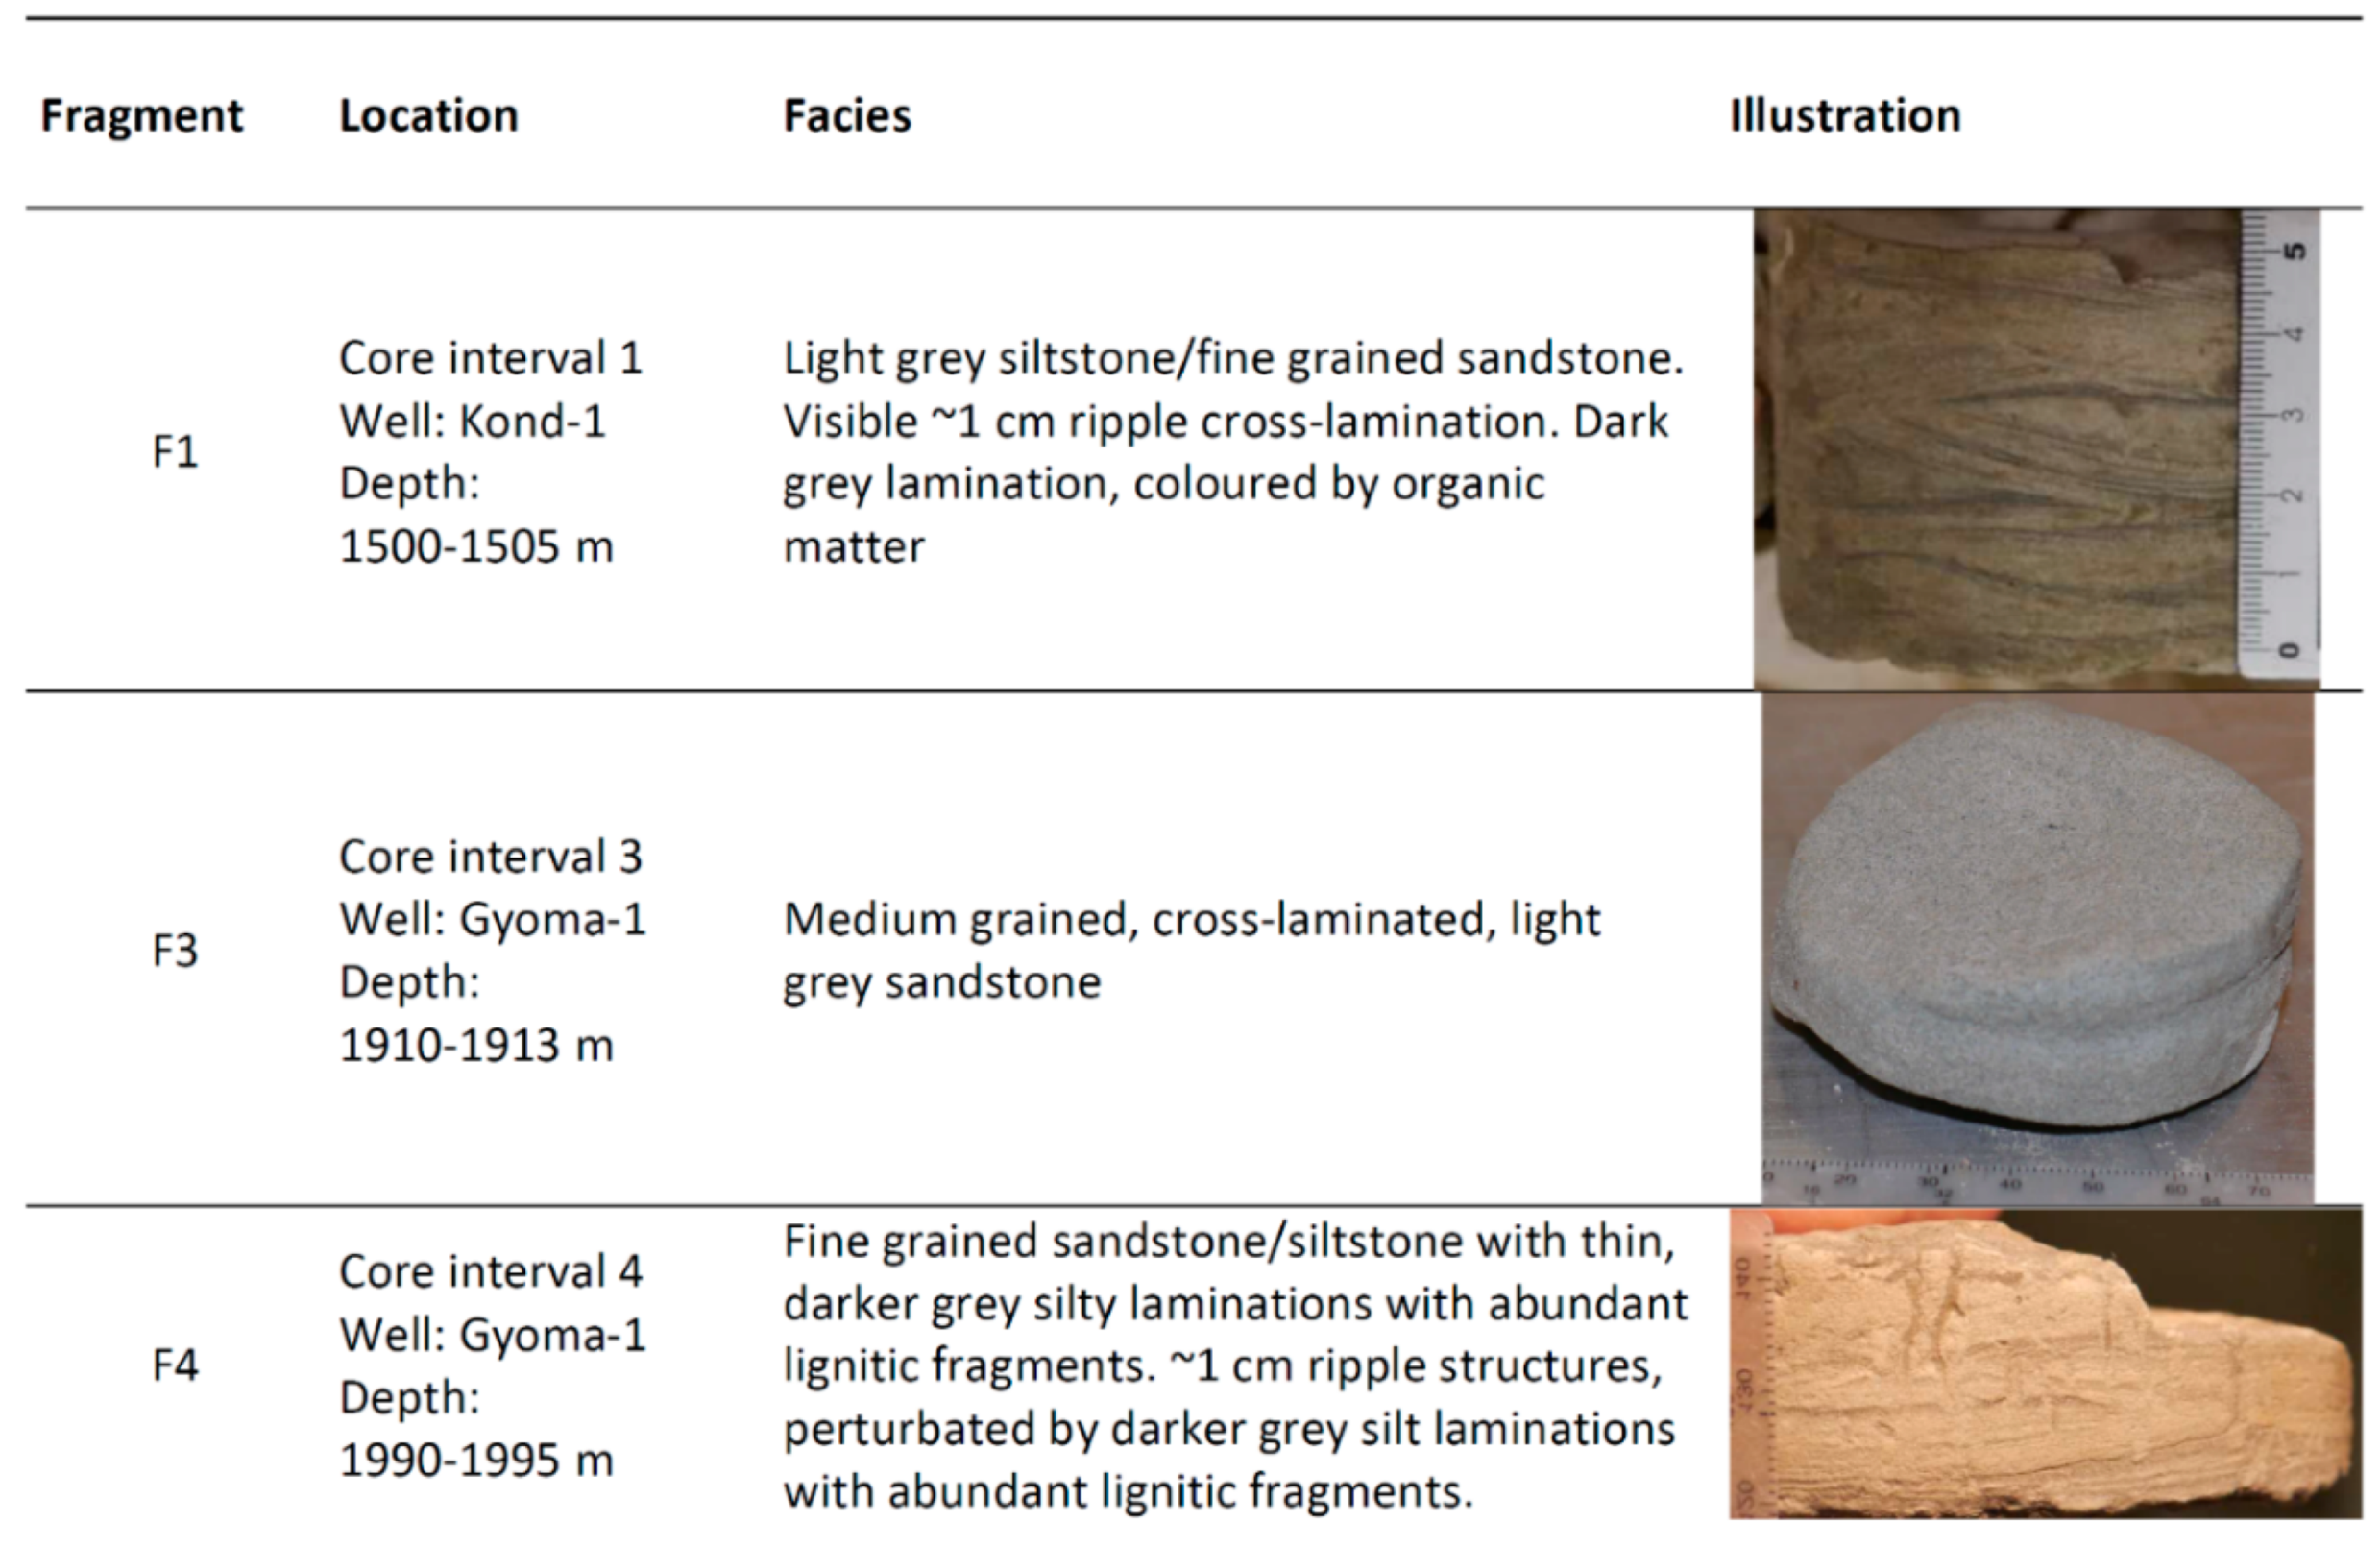
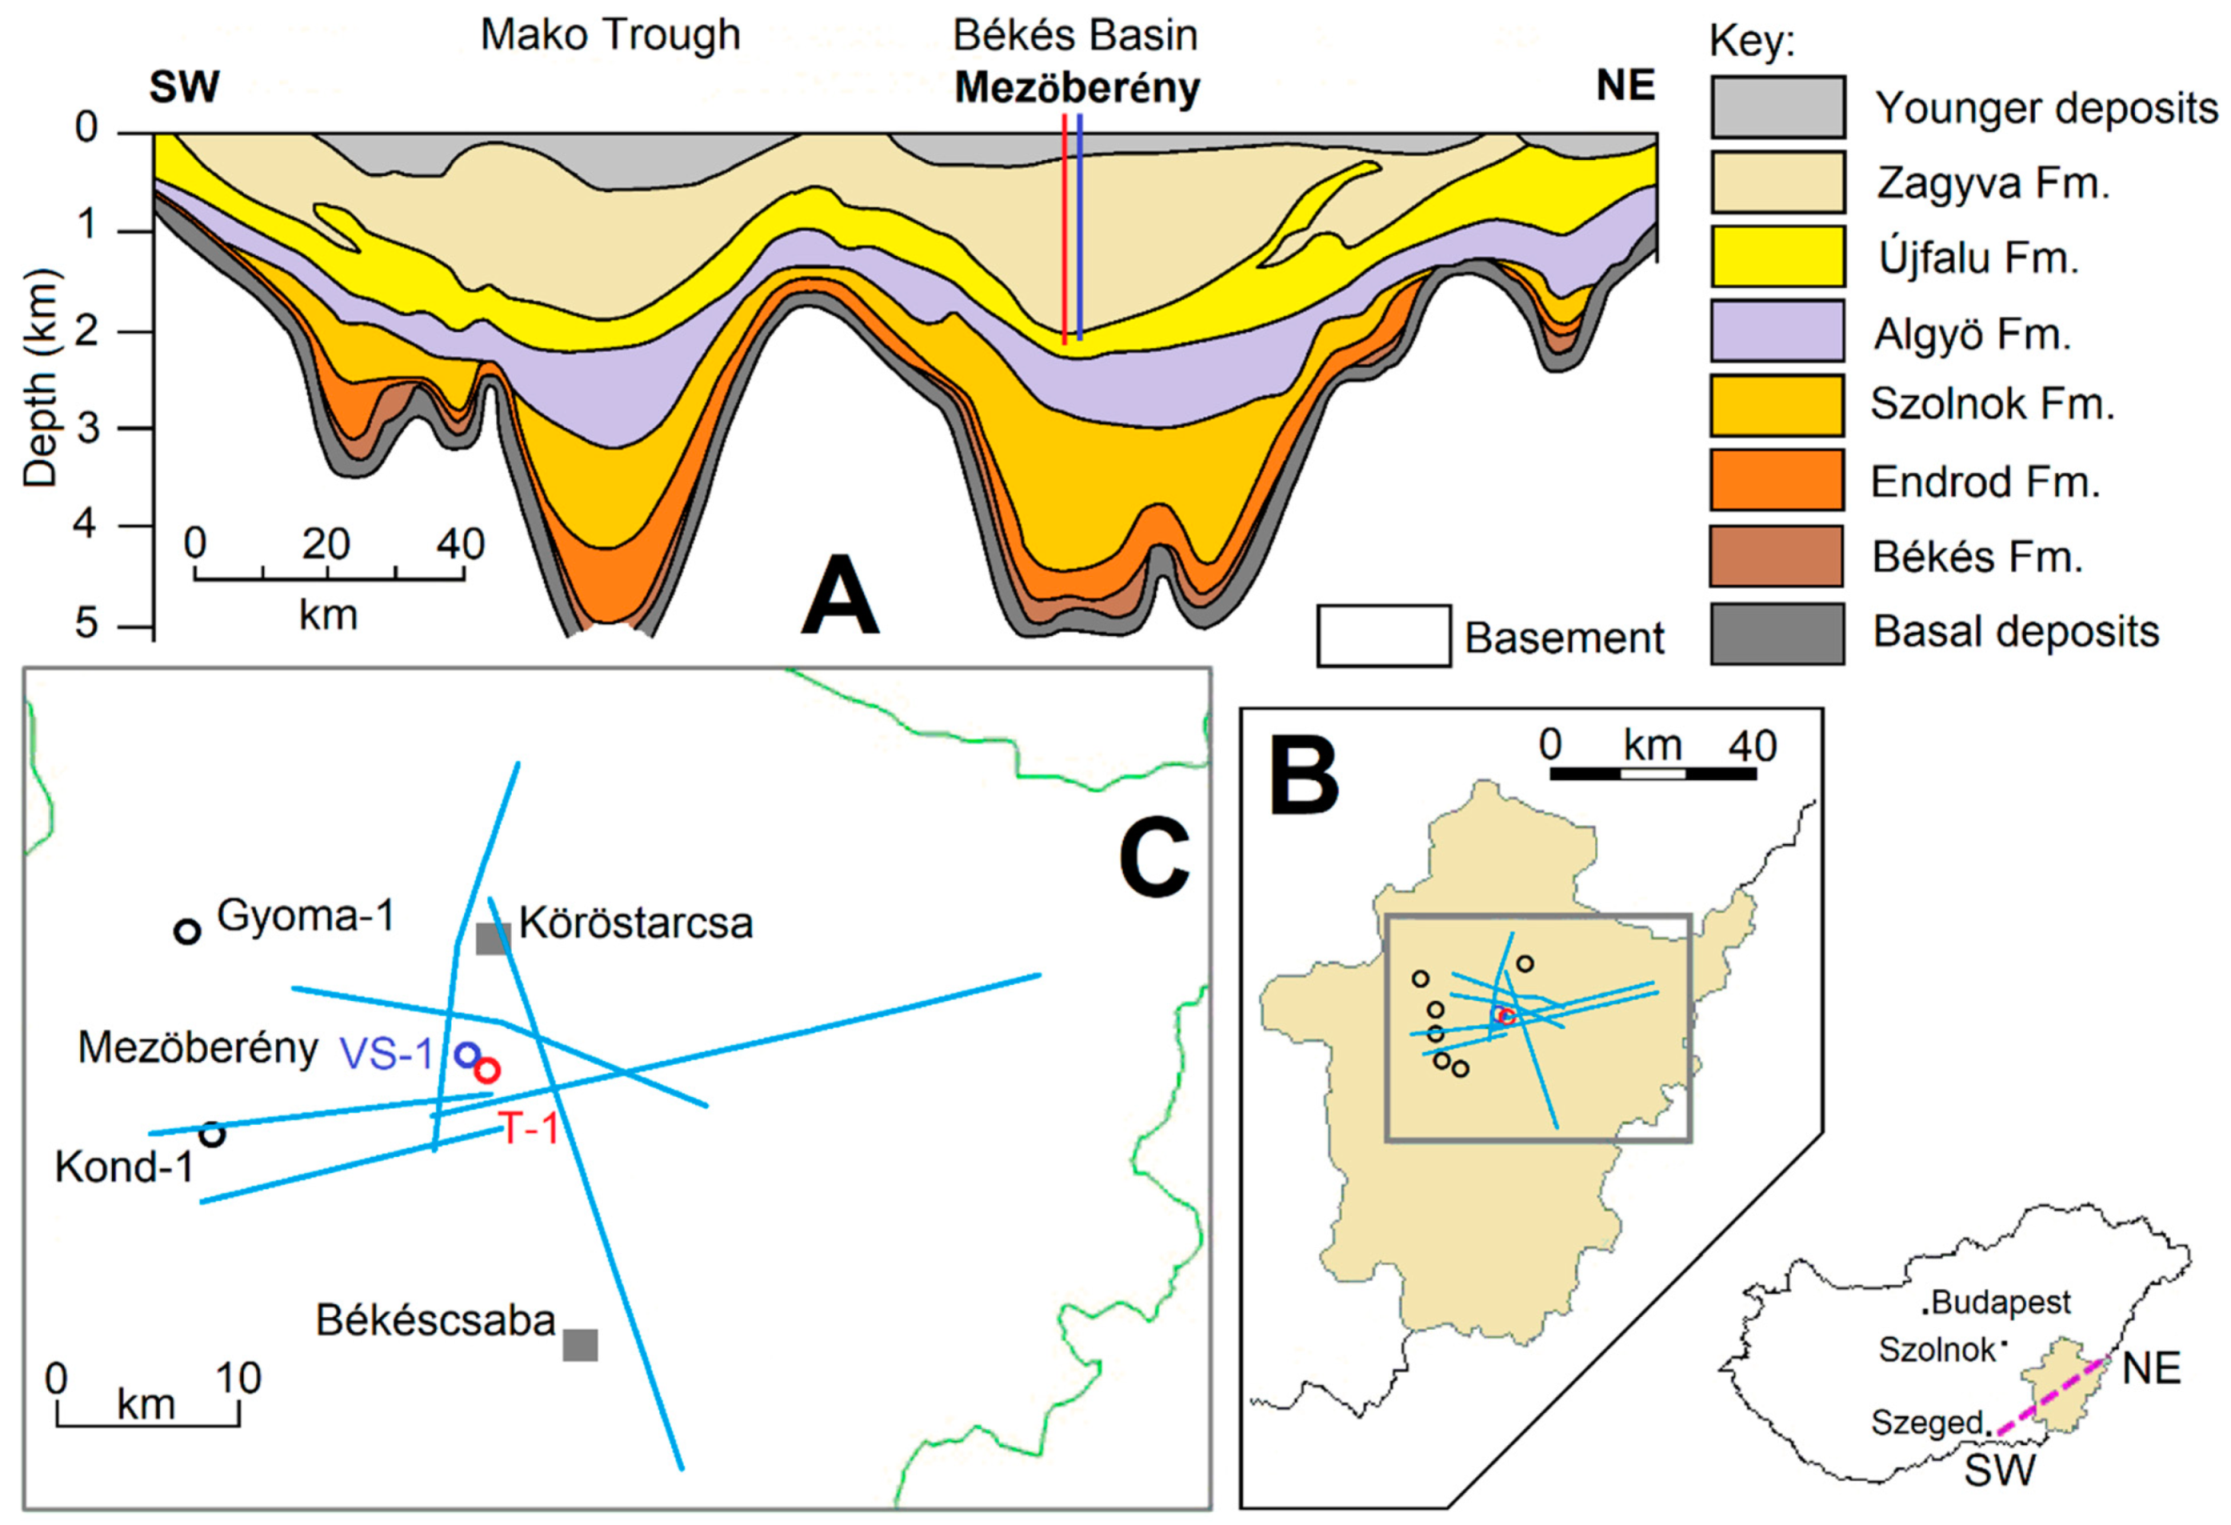
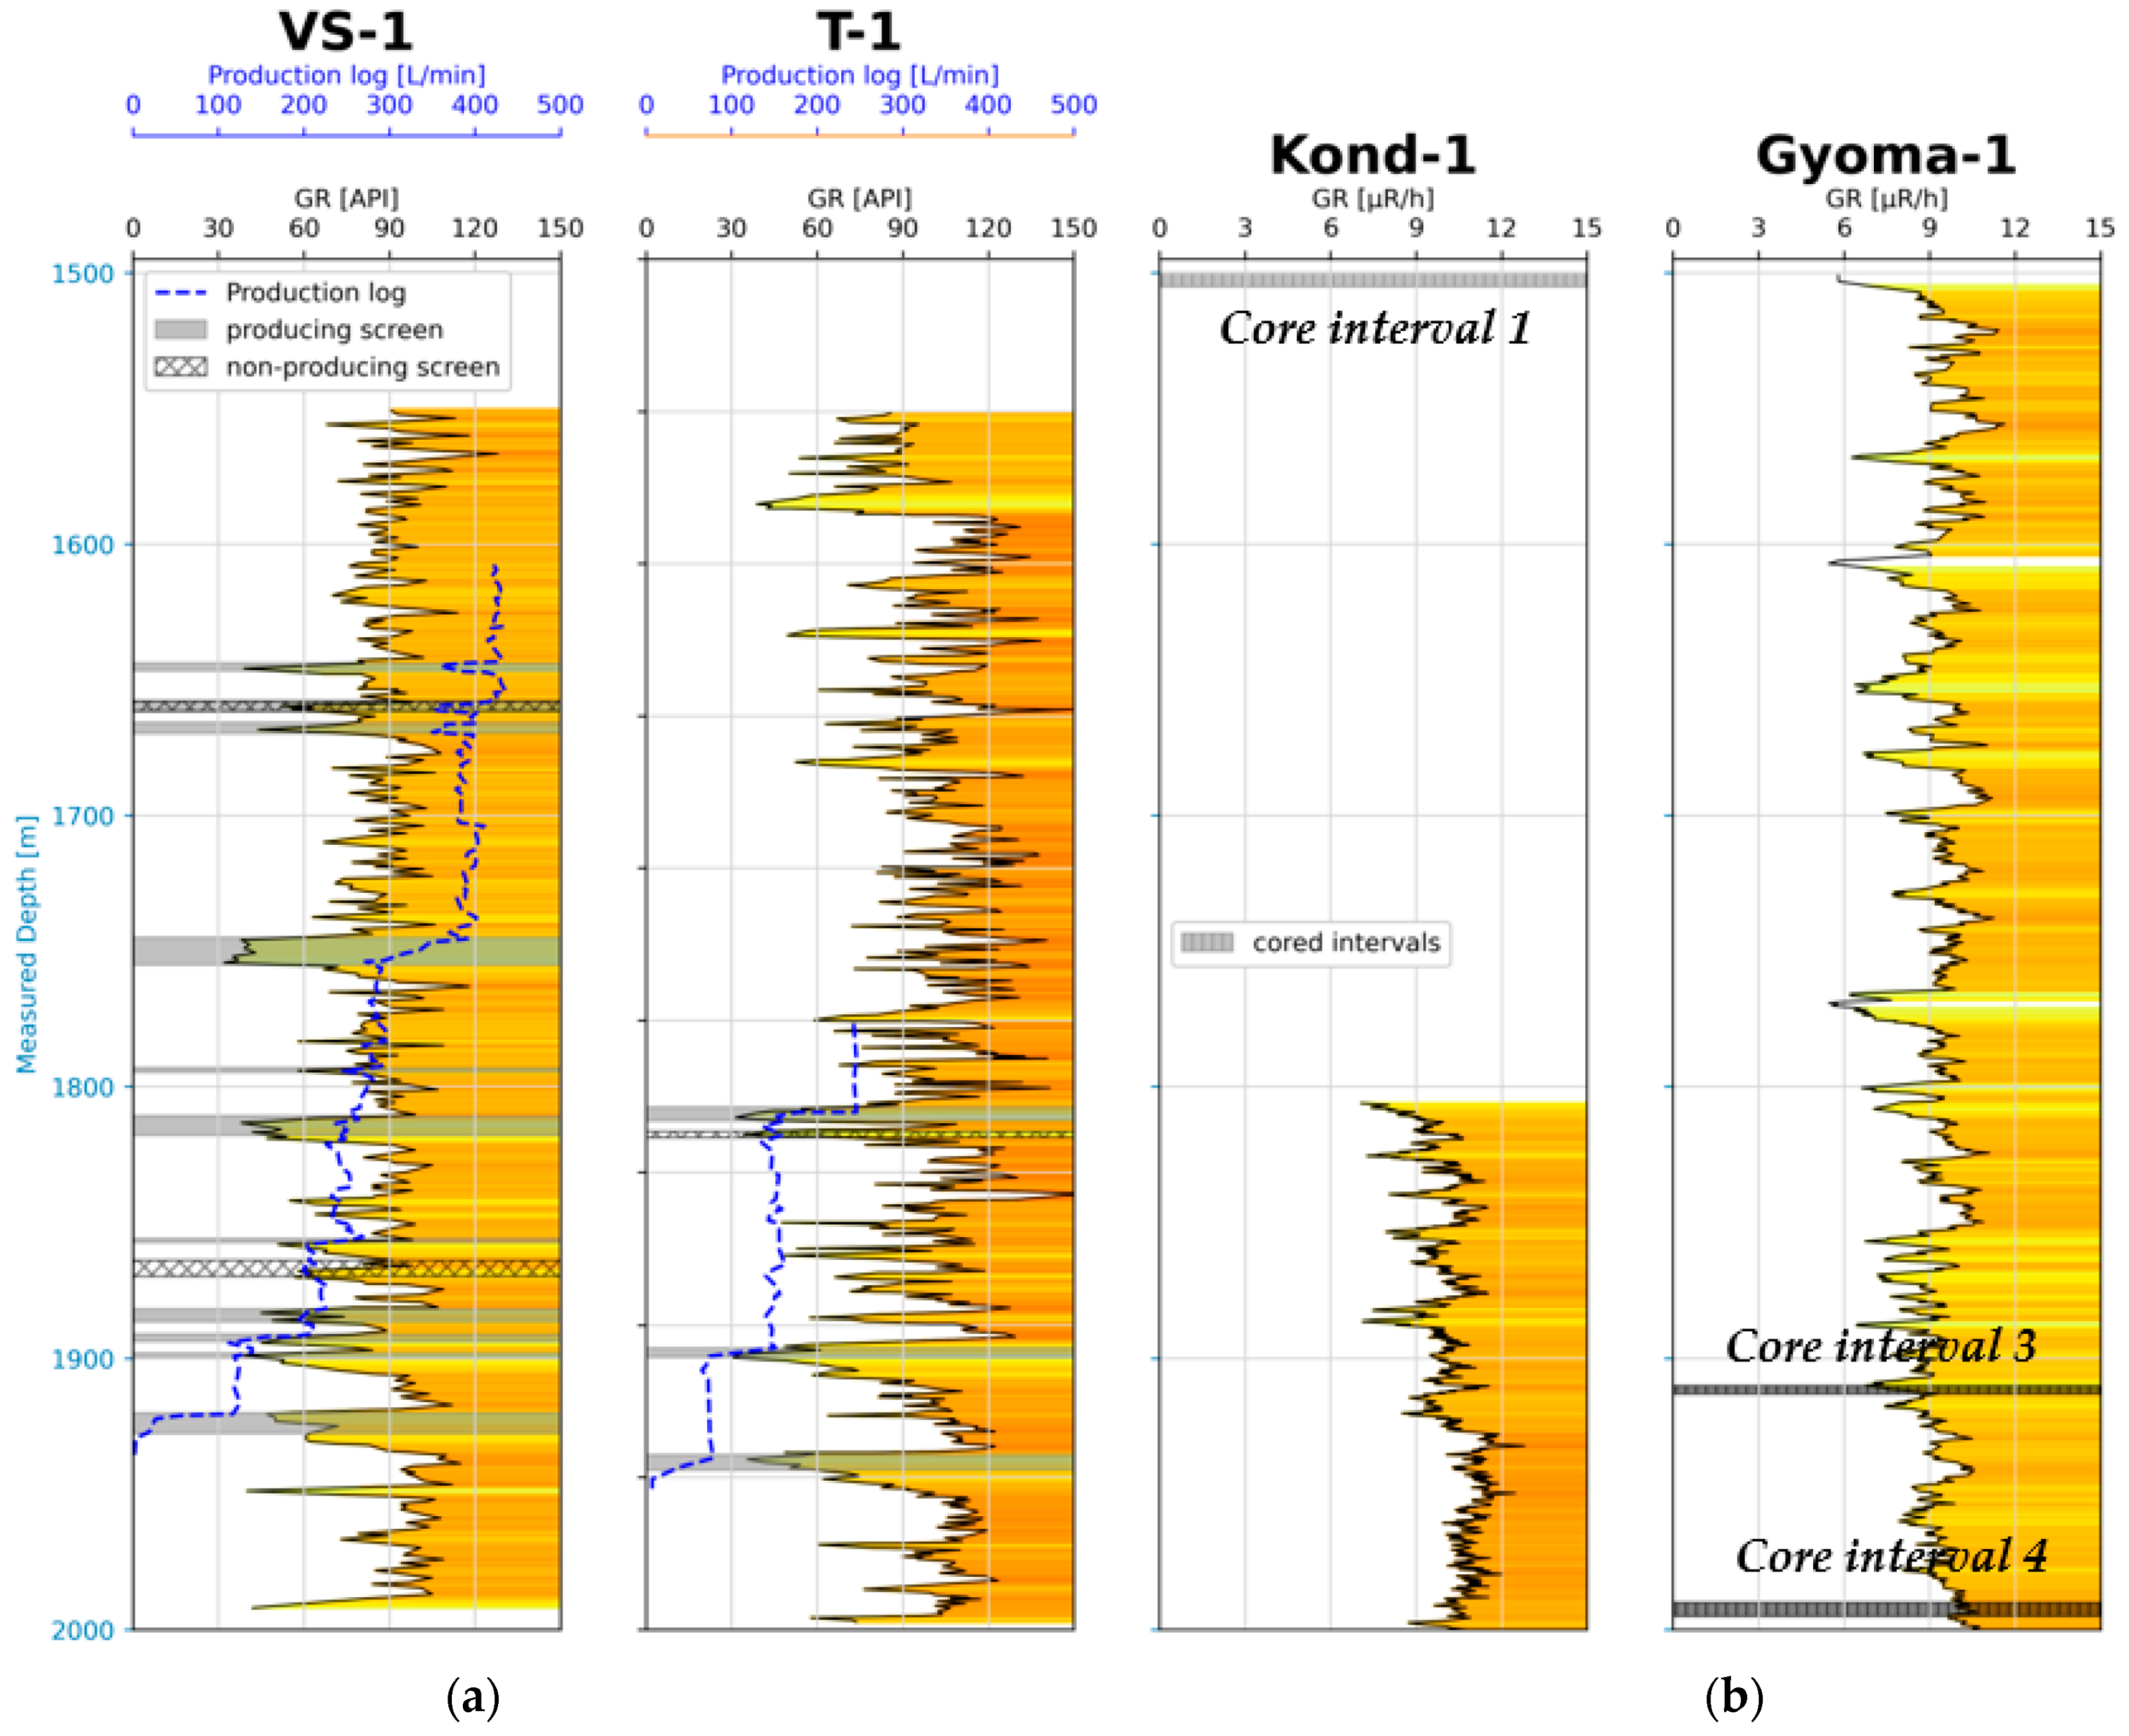
2. Data
3. Experimental Rock Characterization Methods
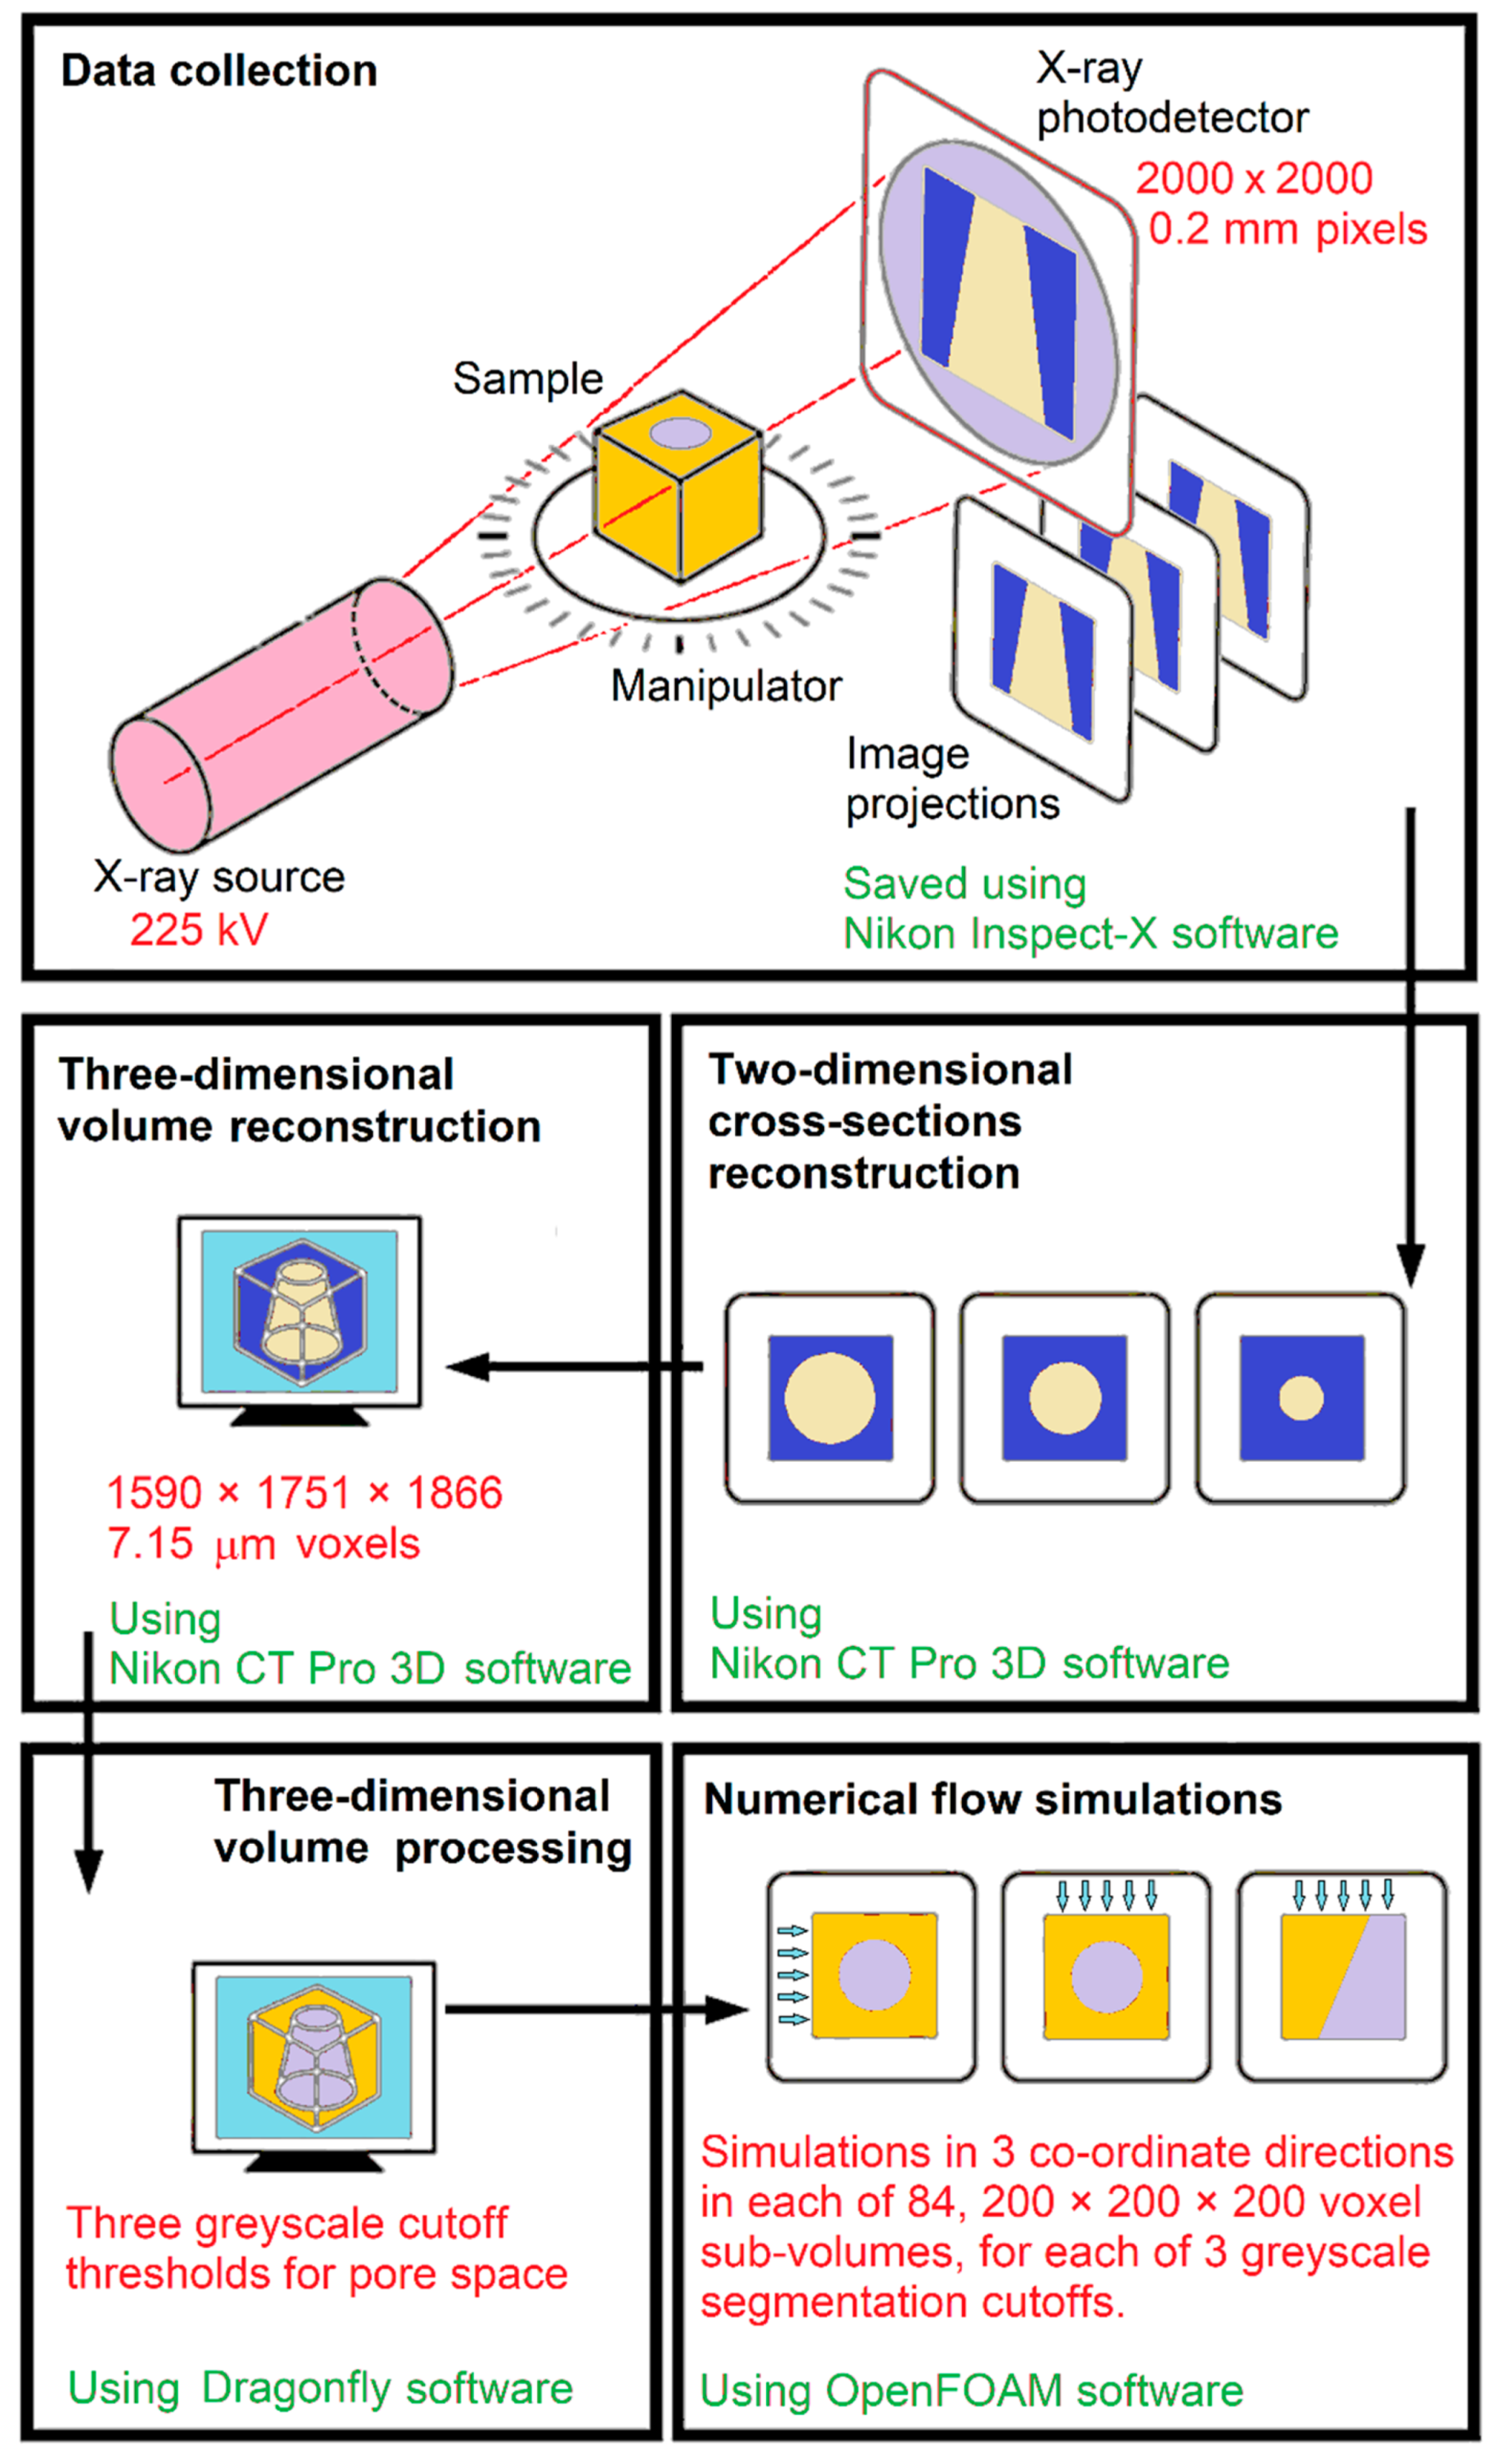
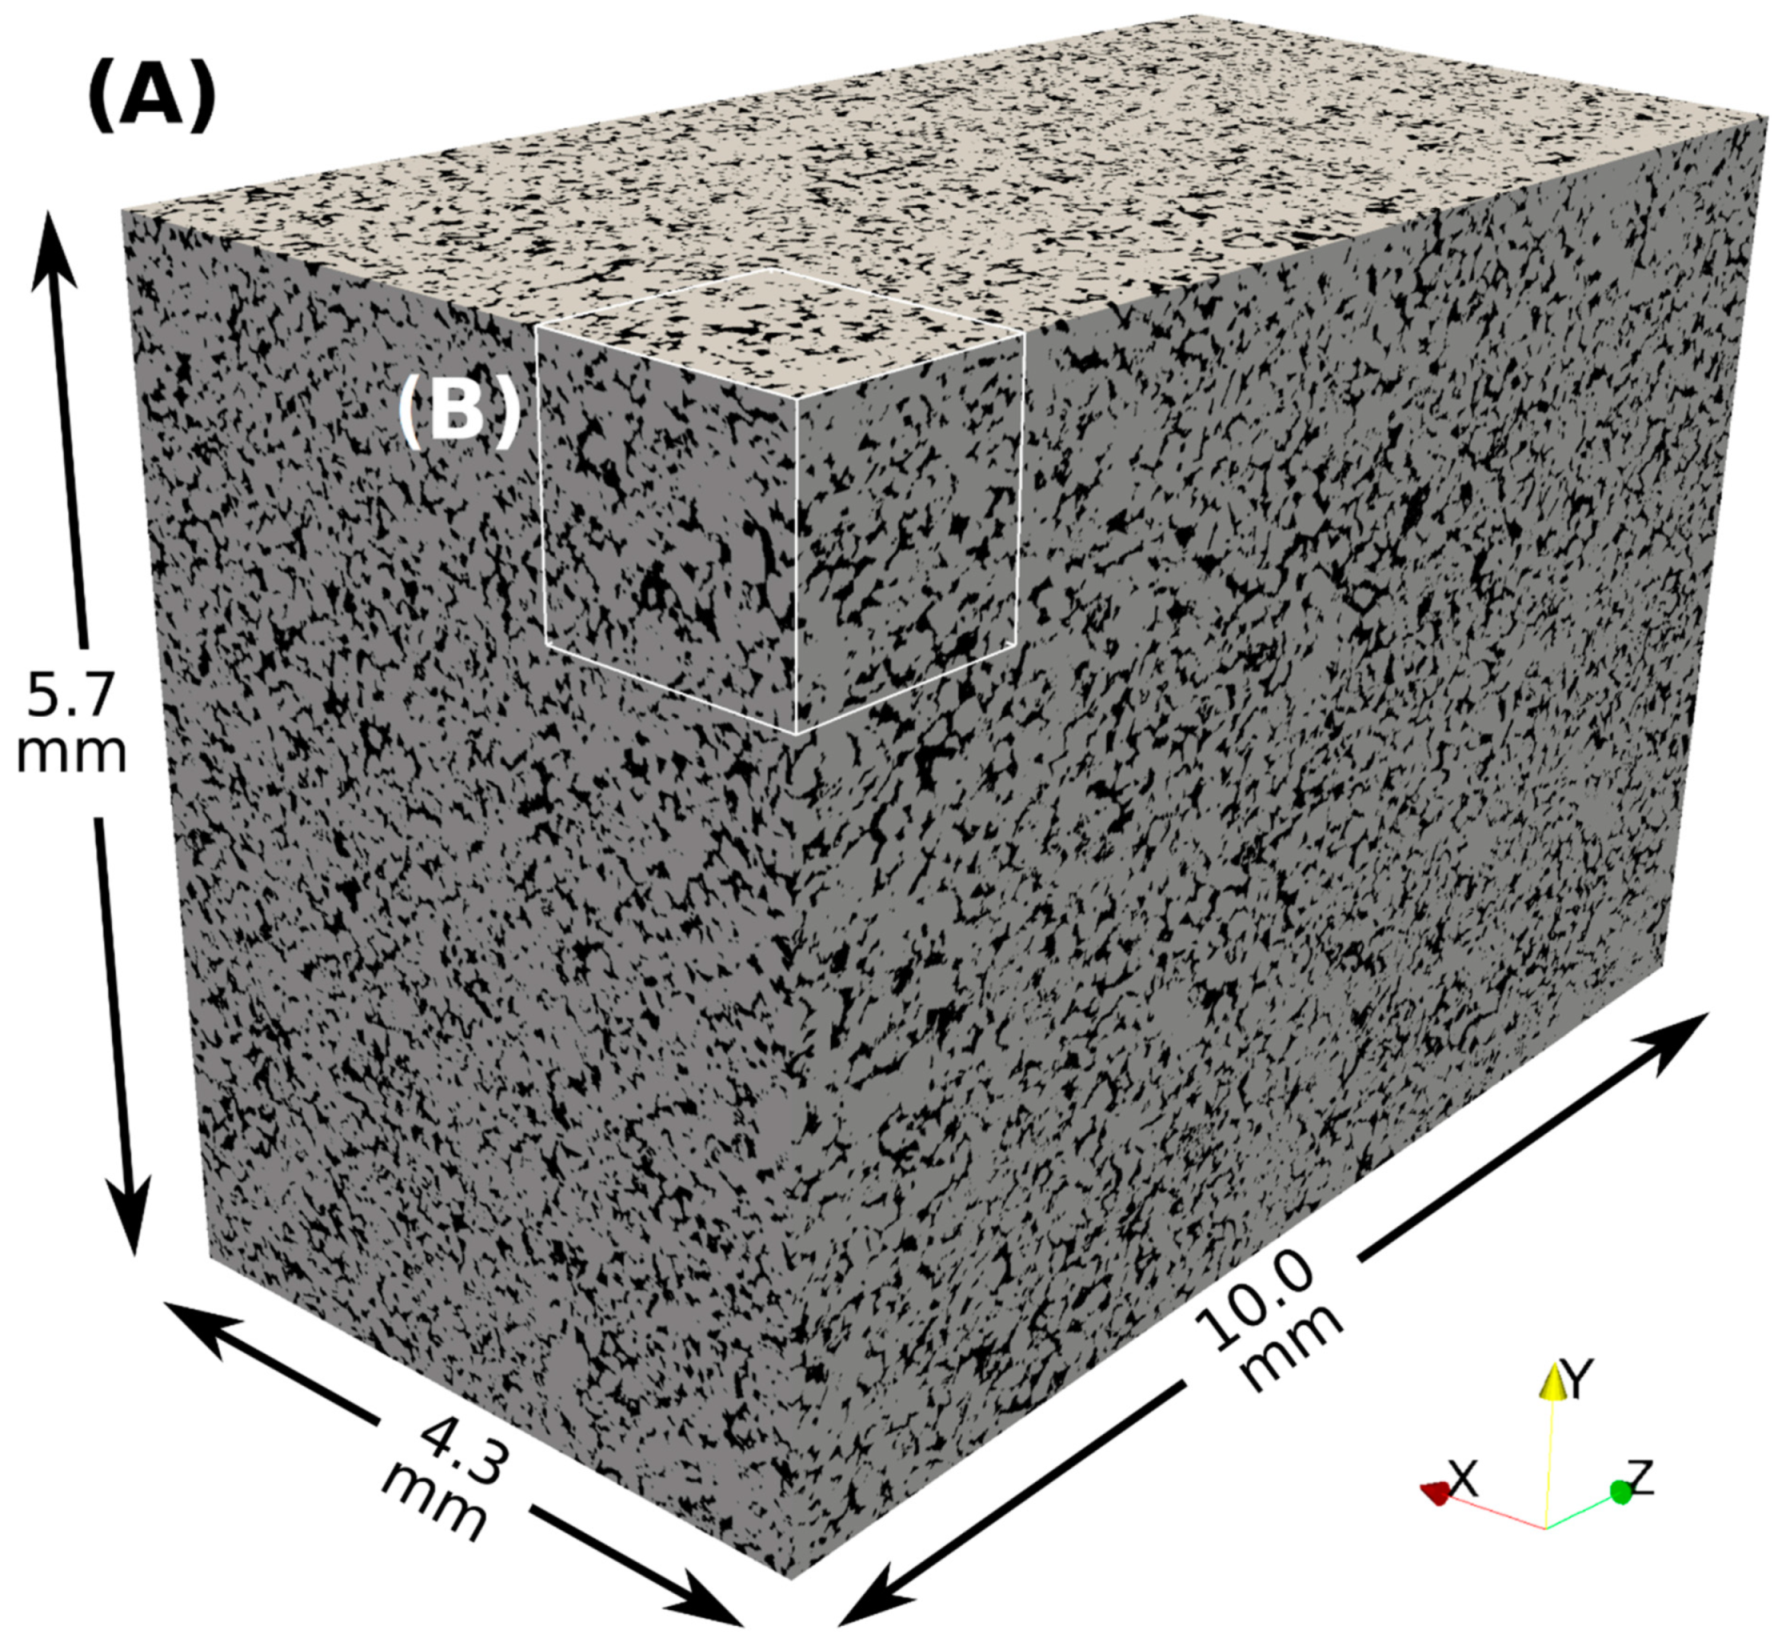
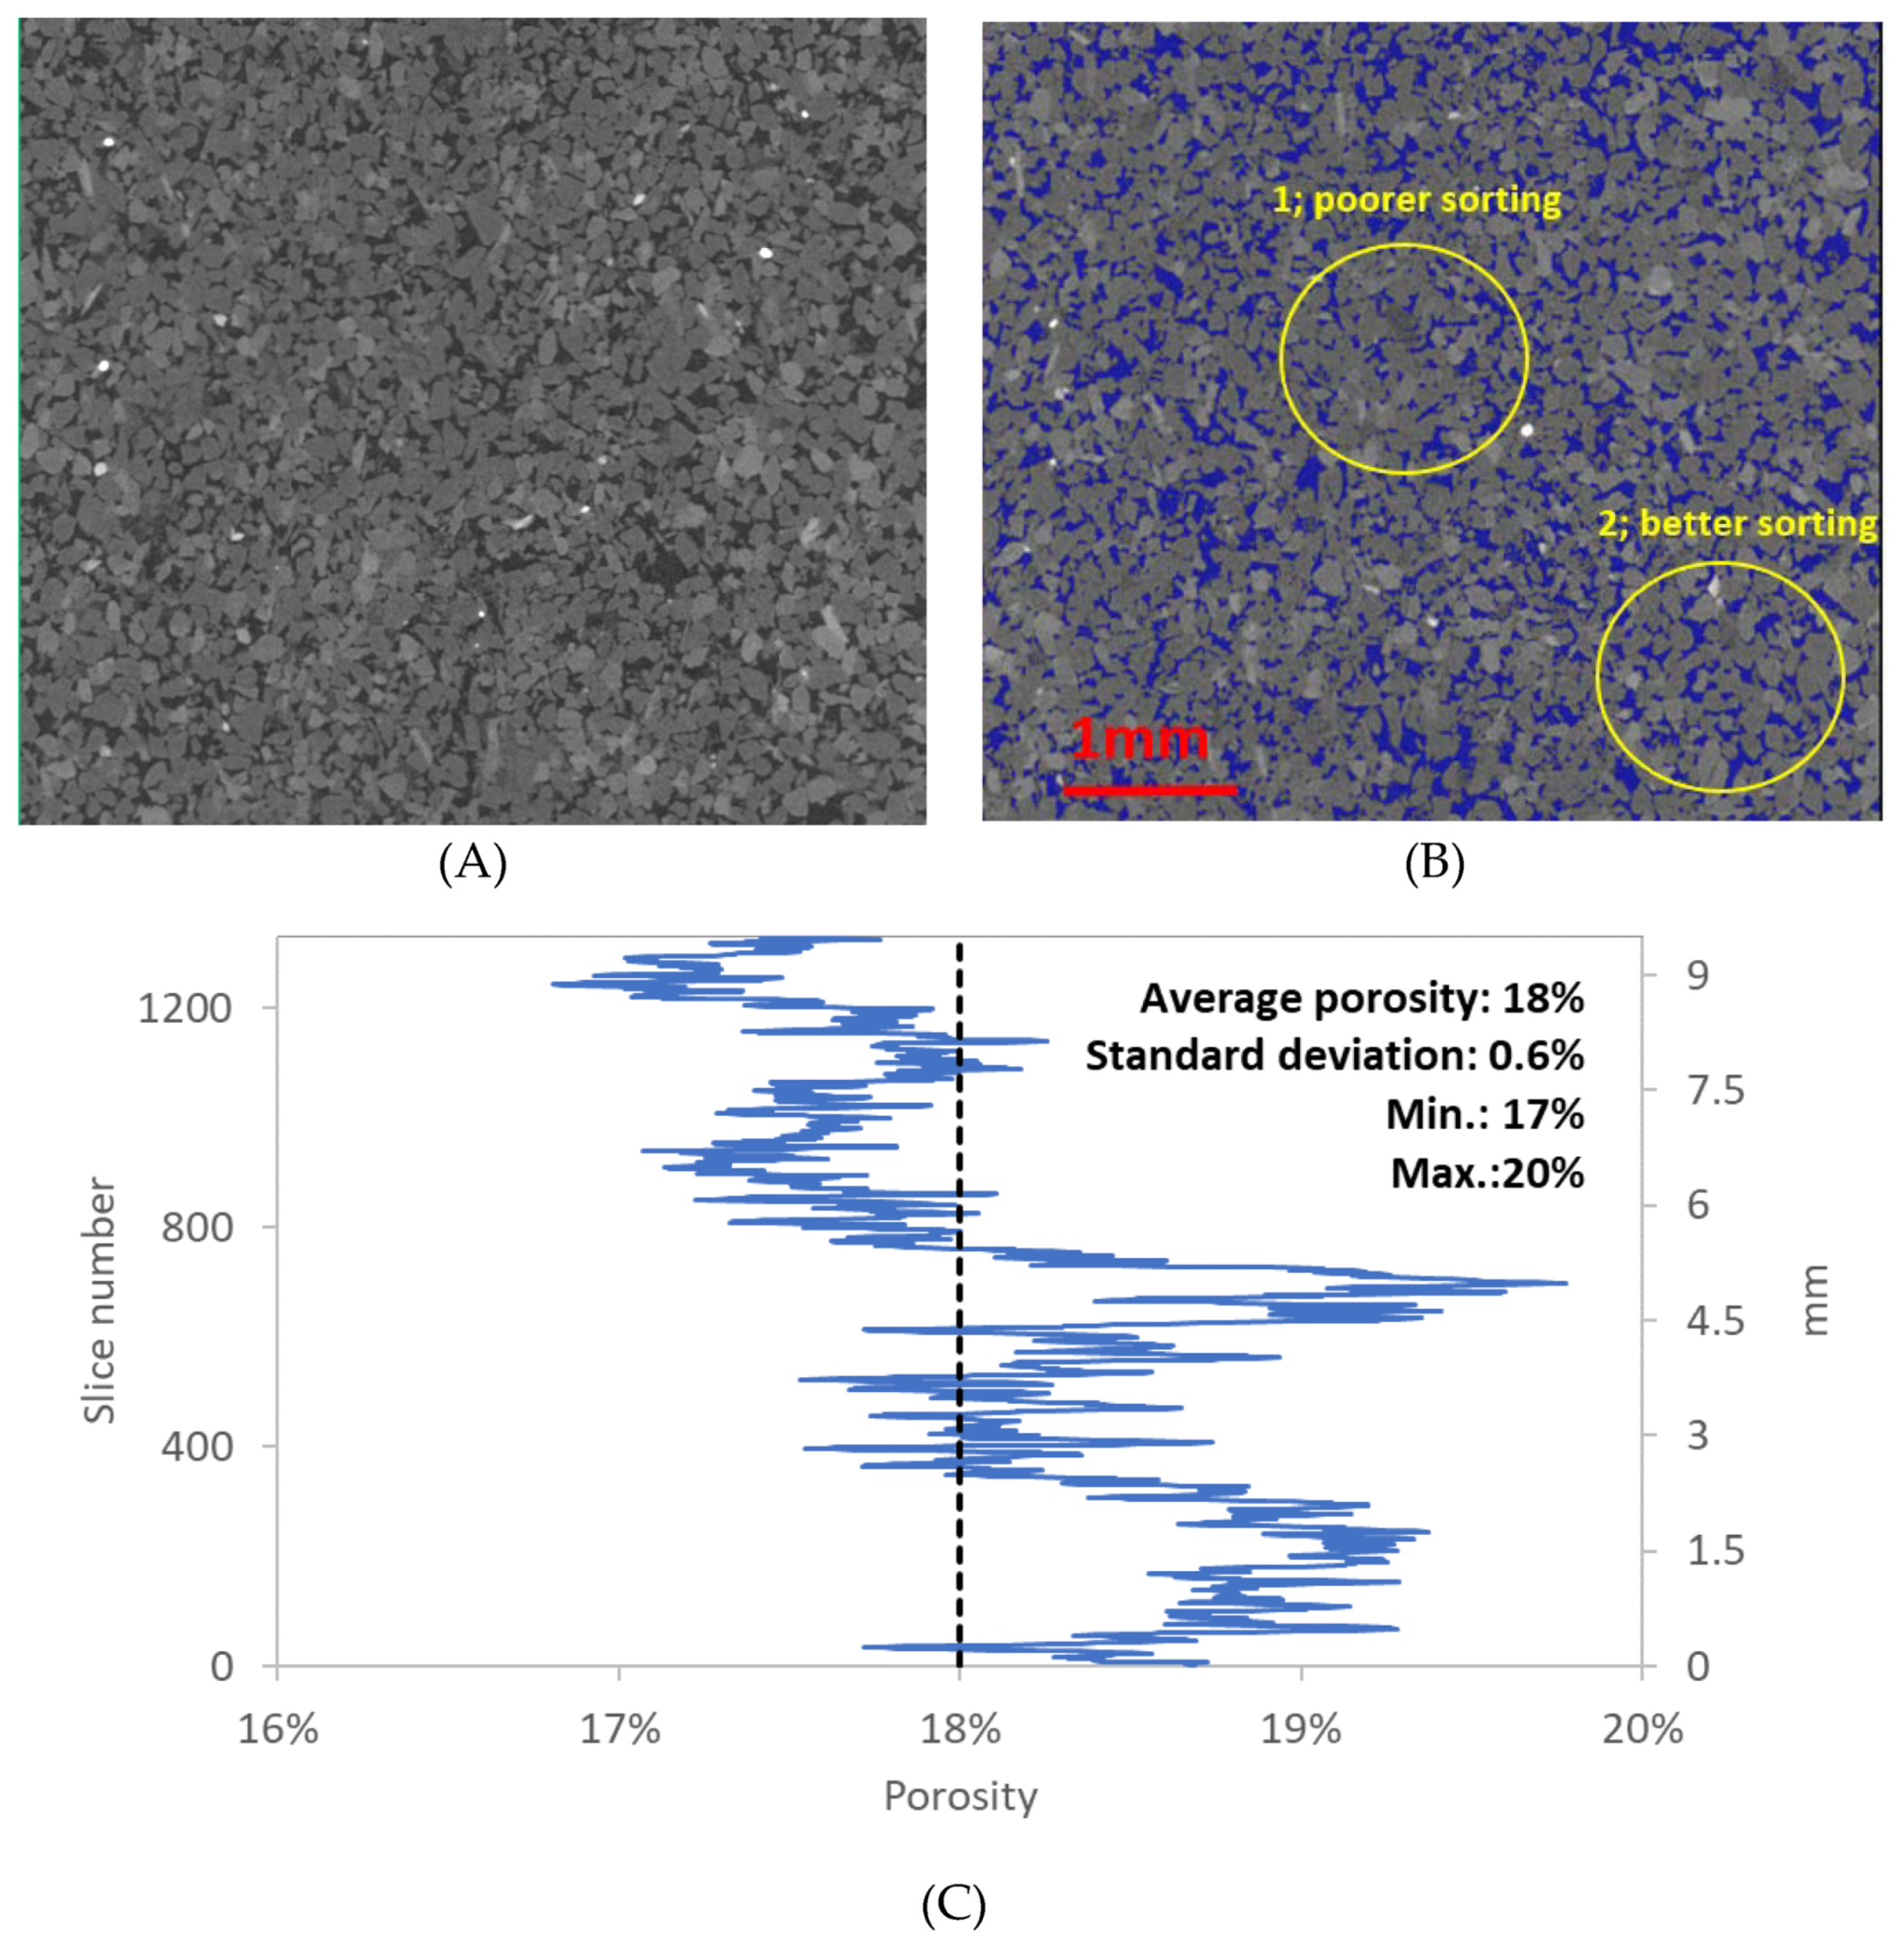
3.1. X-CT Imaging
3.2. X-CT Image Processing
3.3. Porosity and Pore Size Distribution with Porosimetry
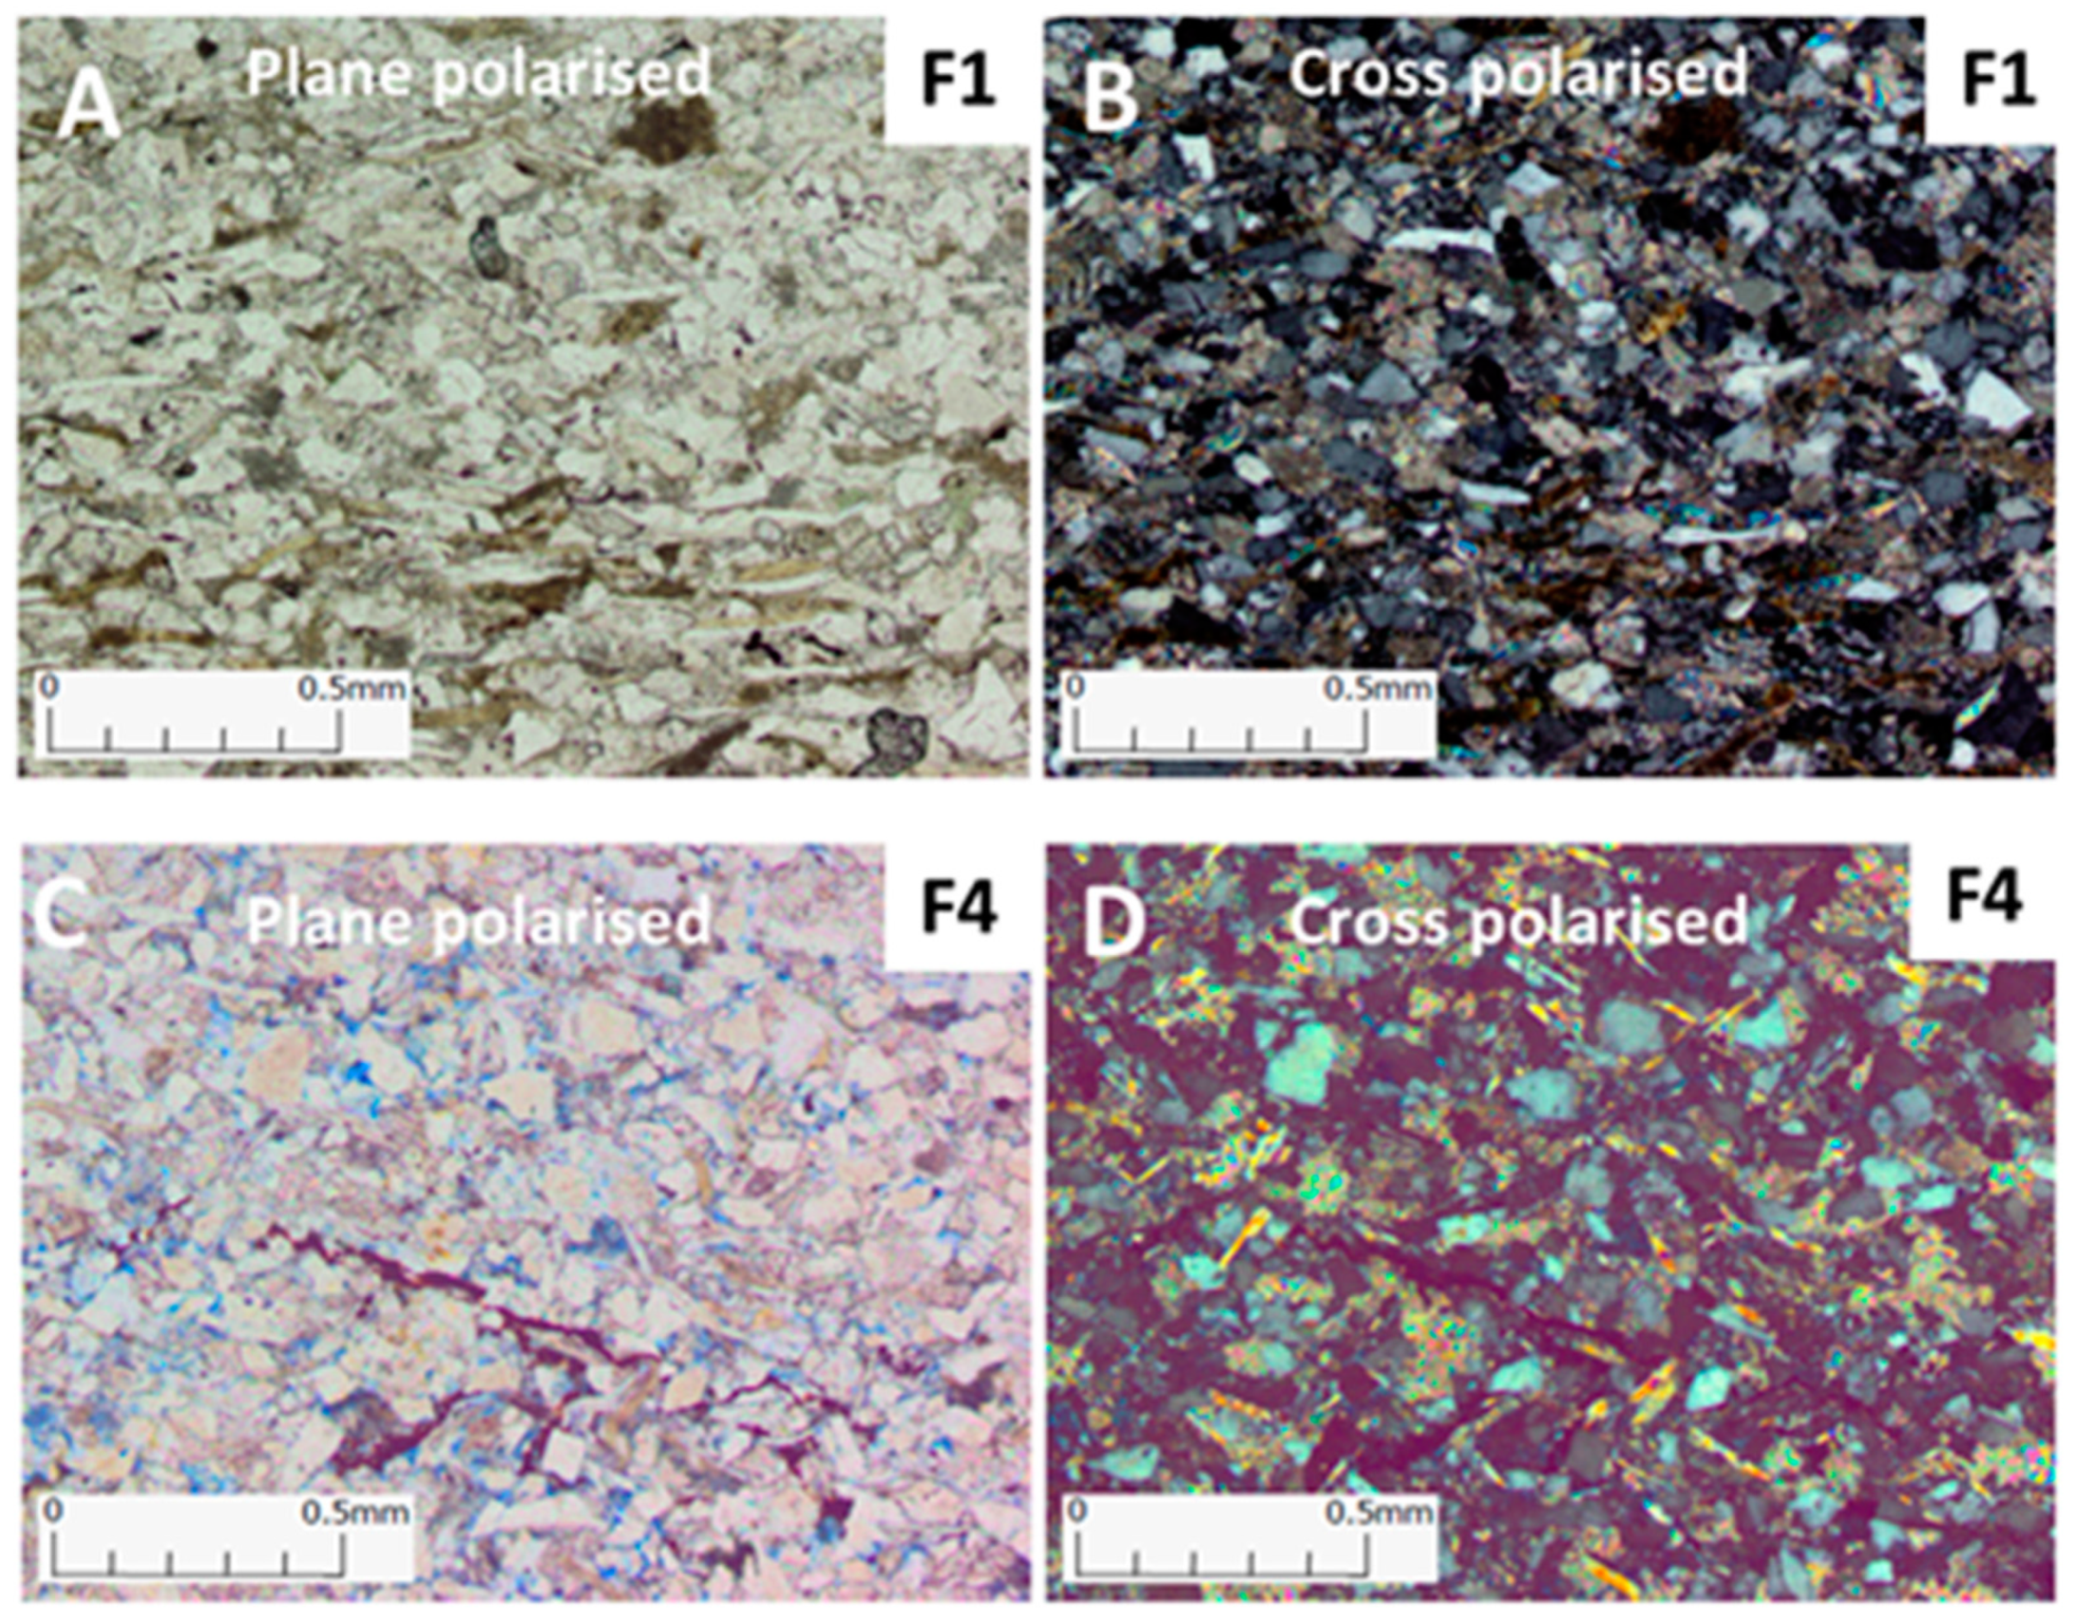
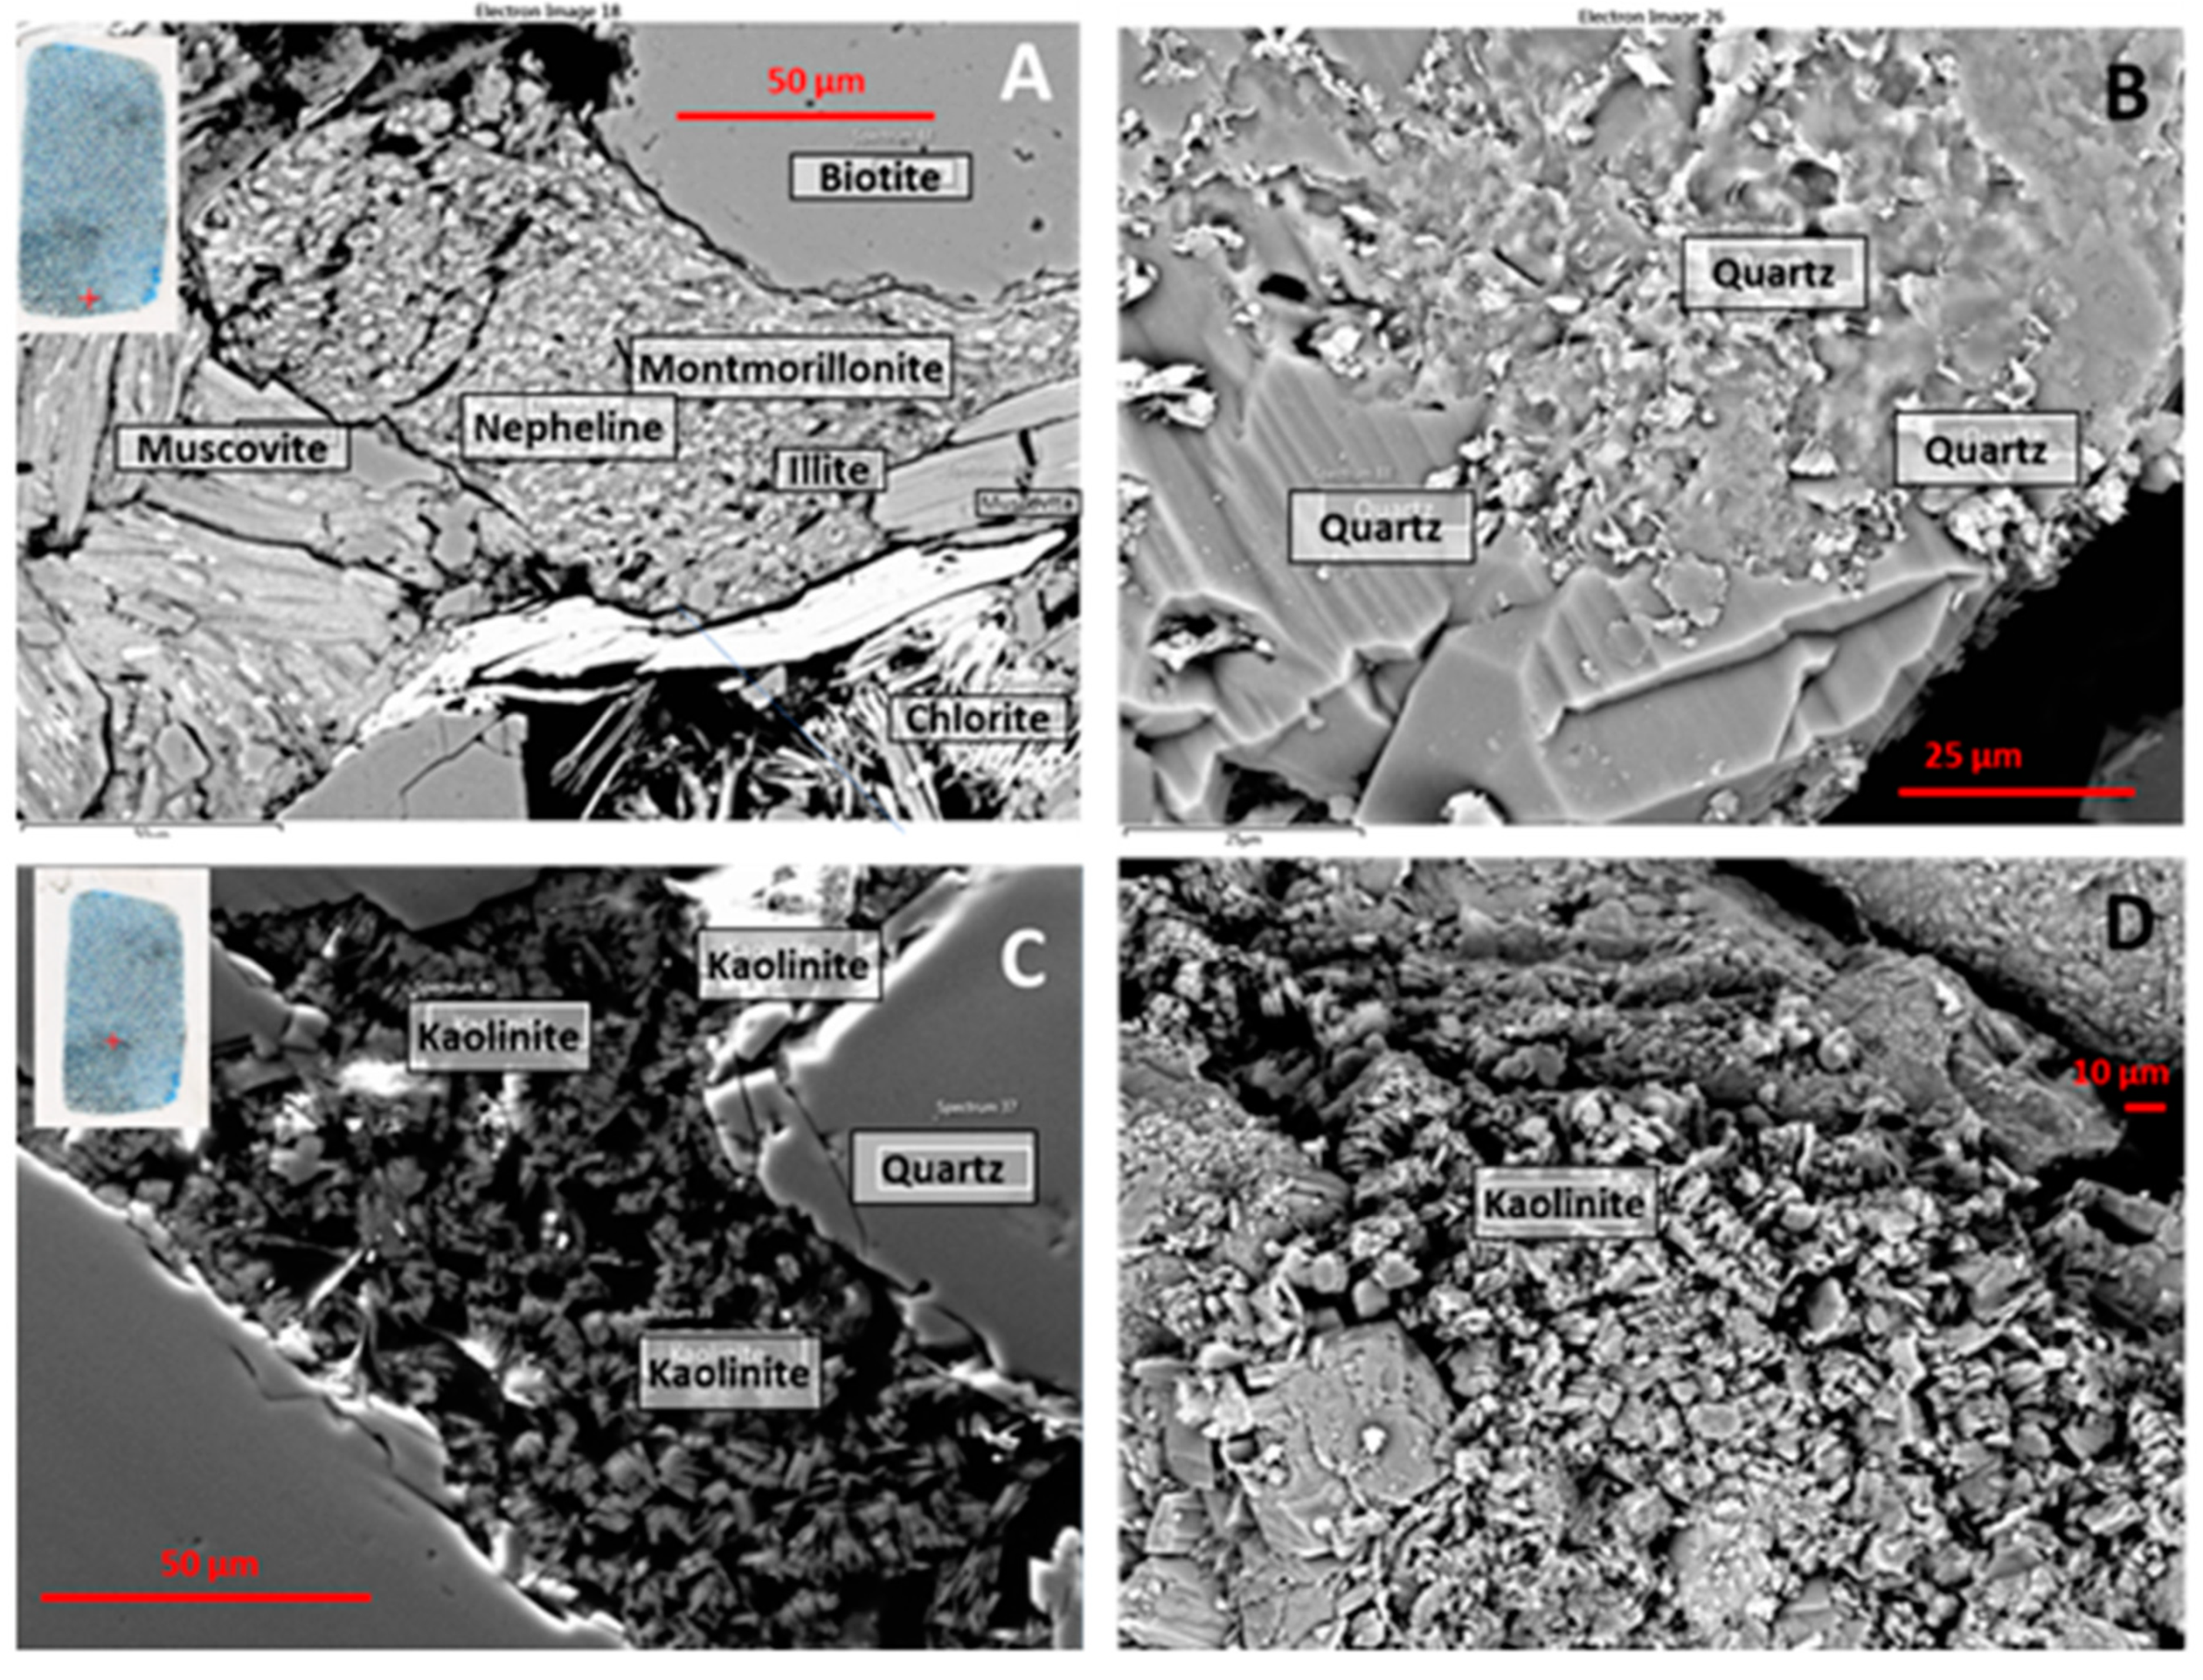
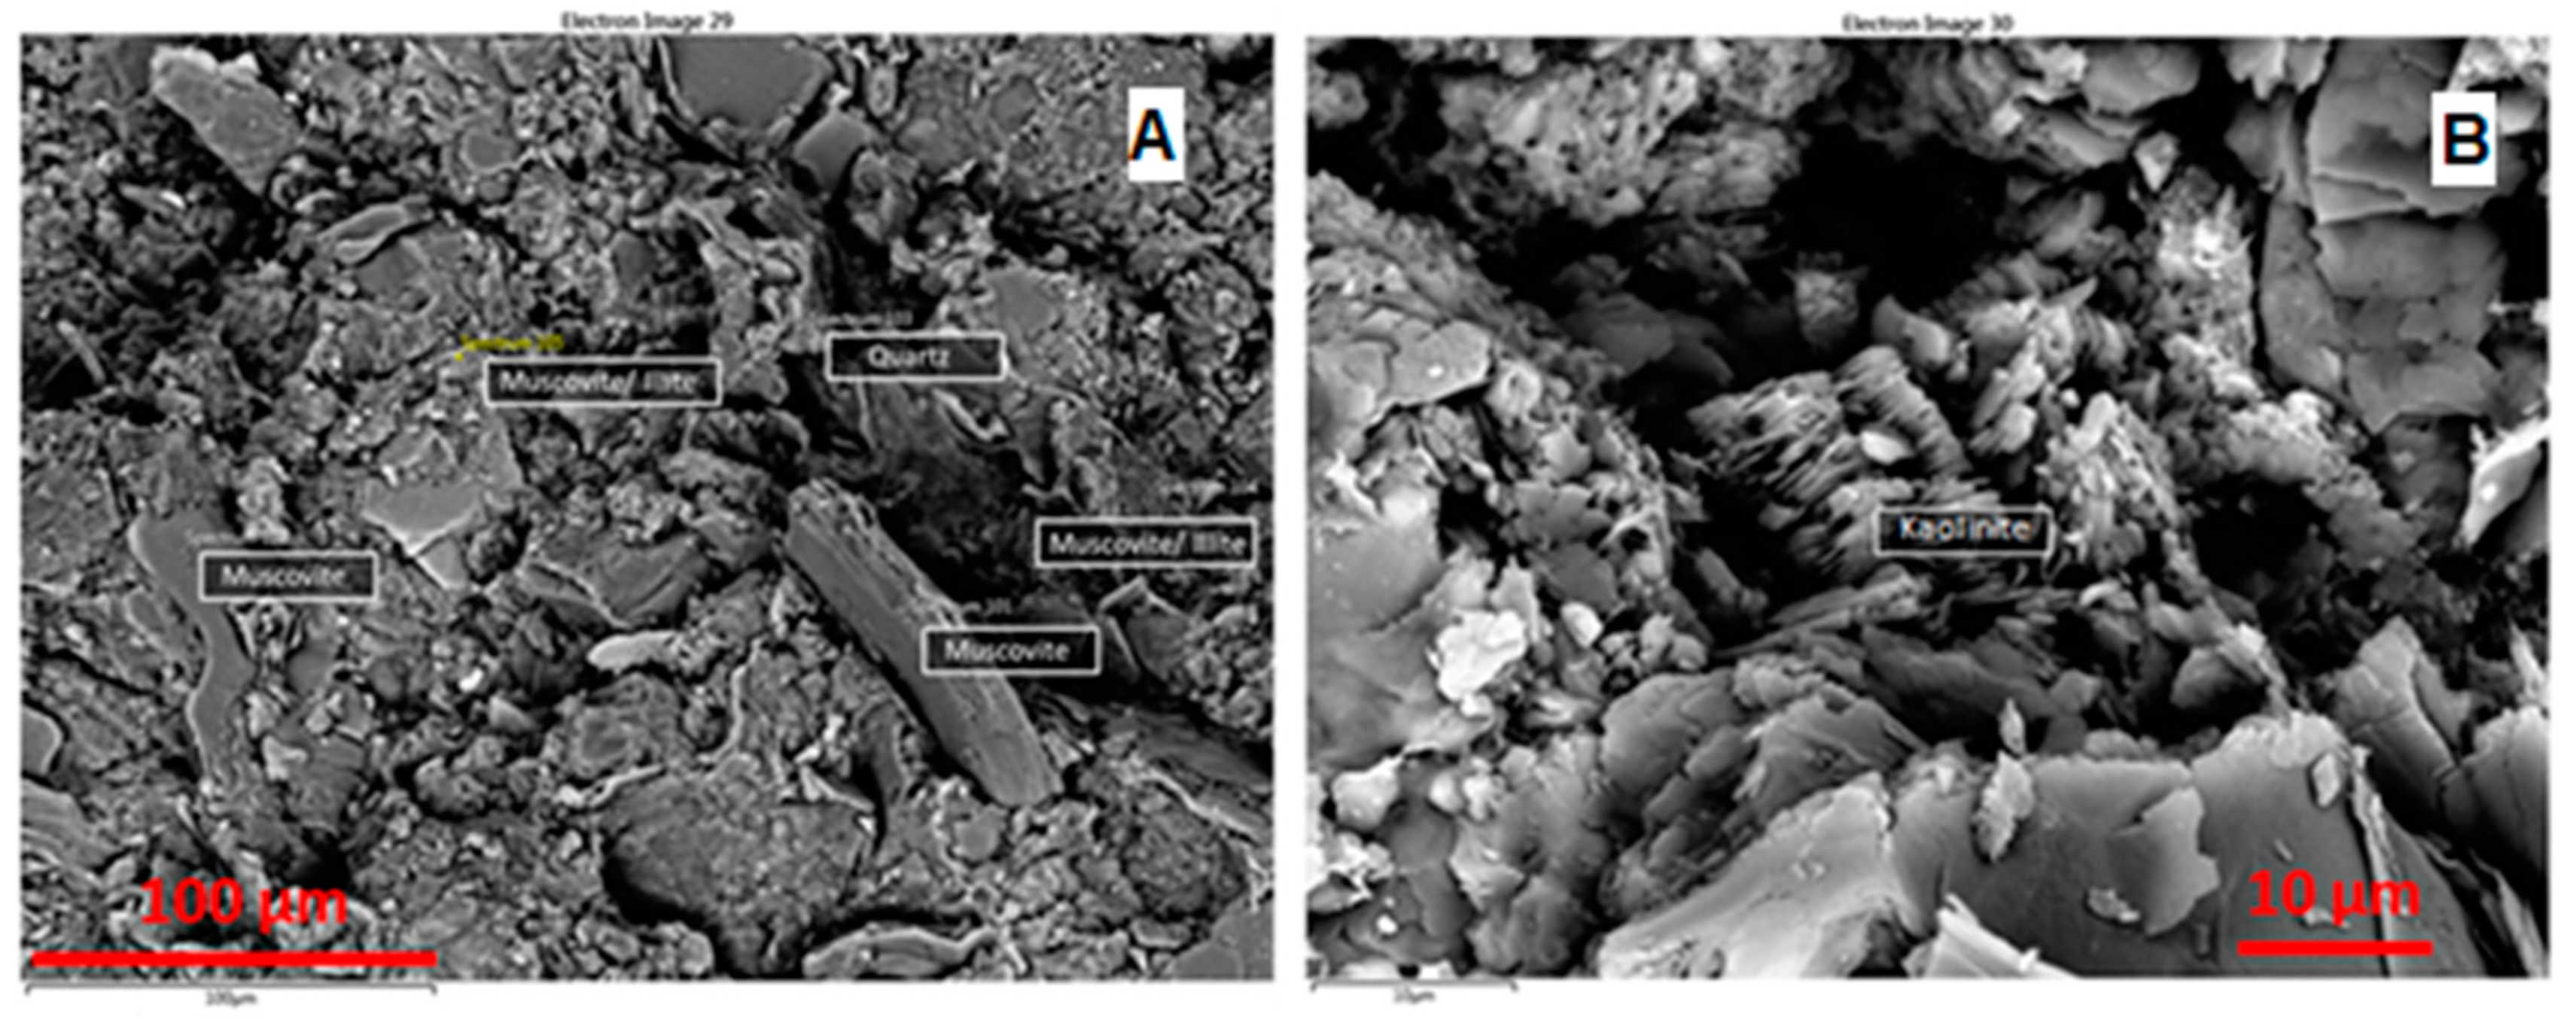
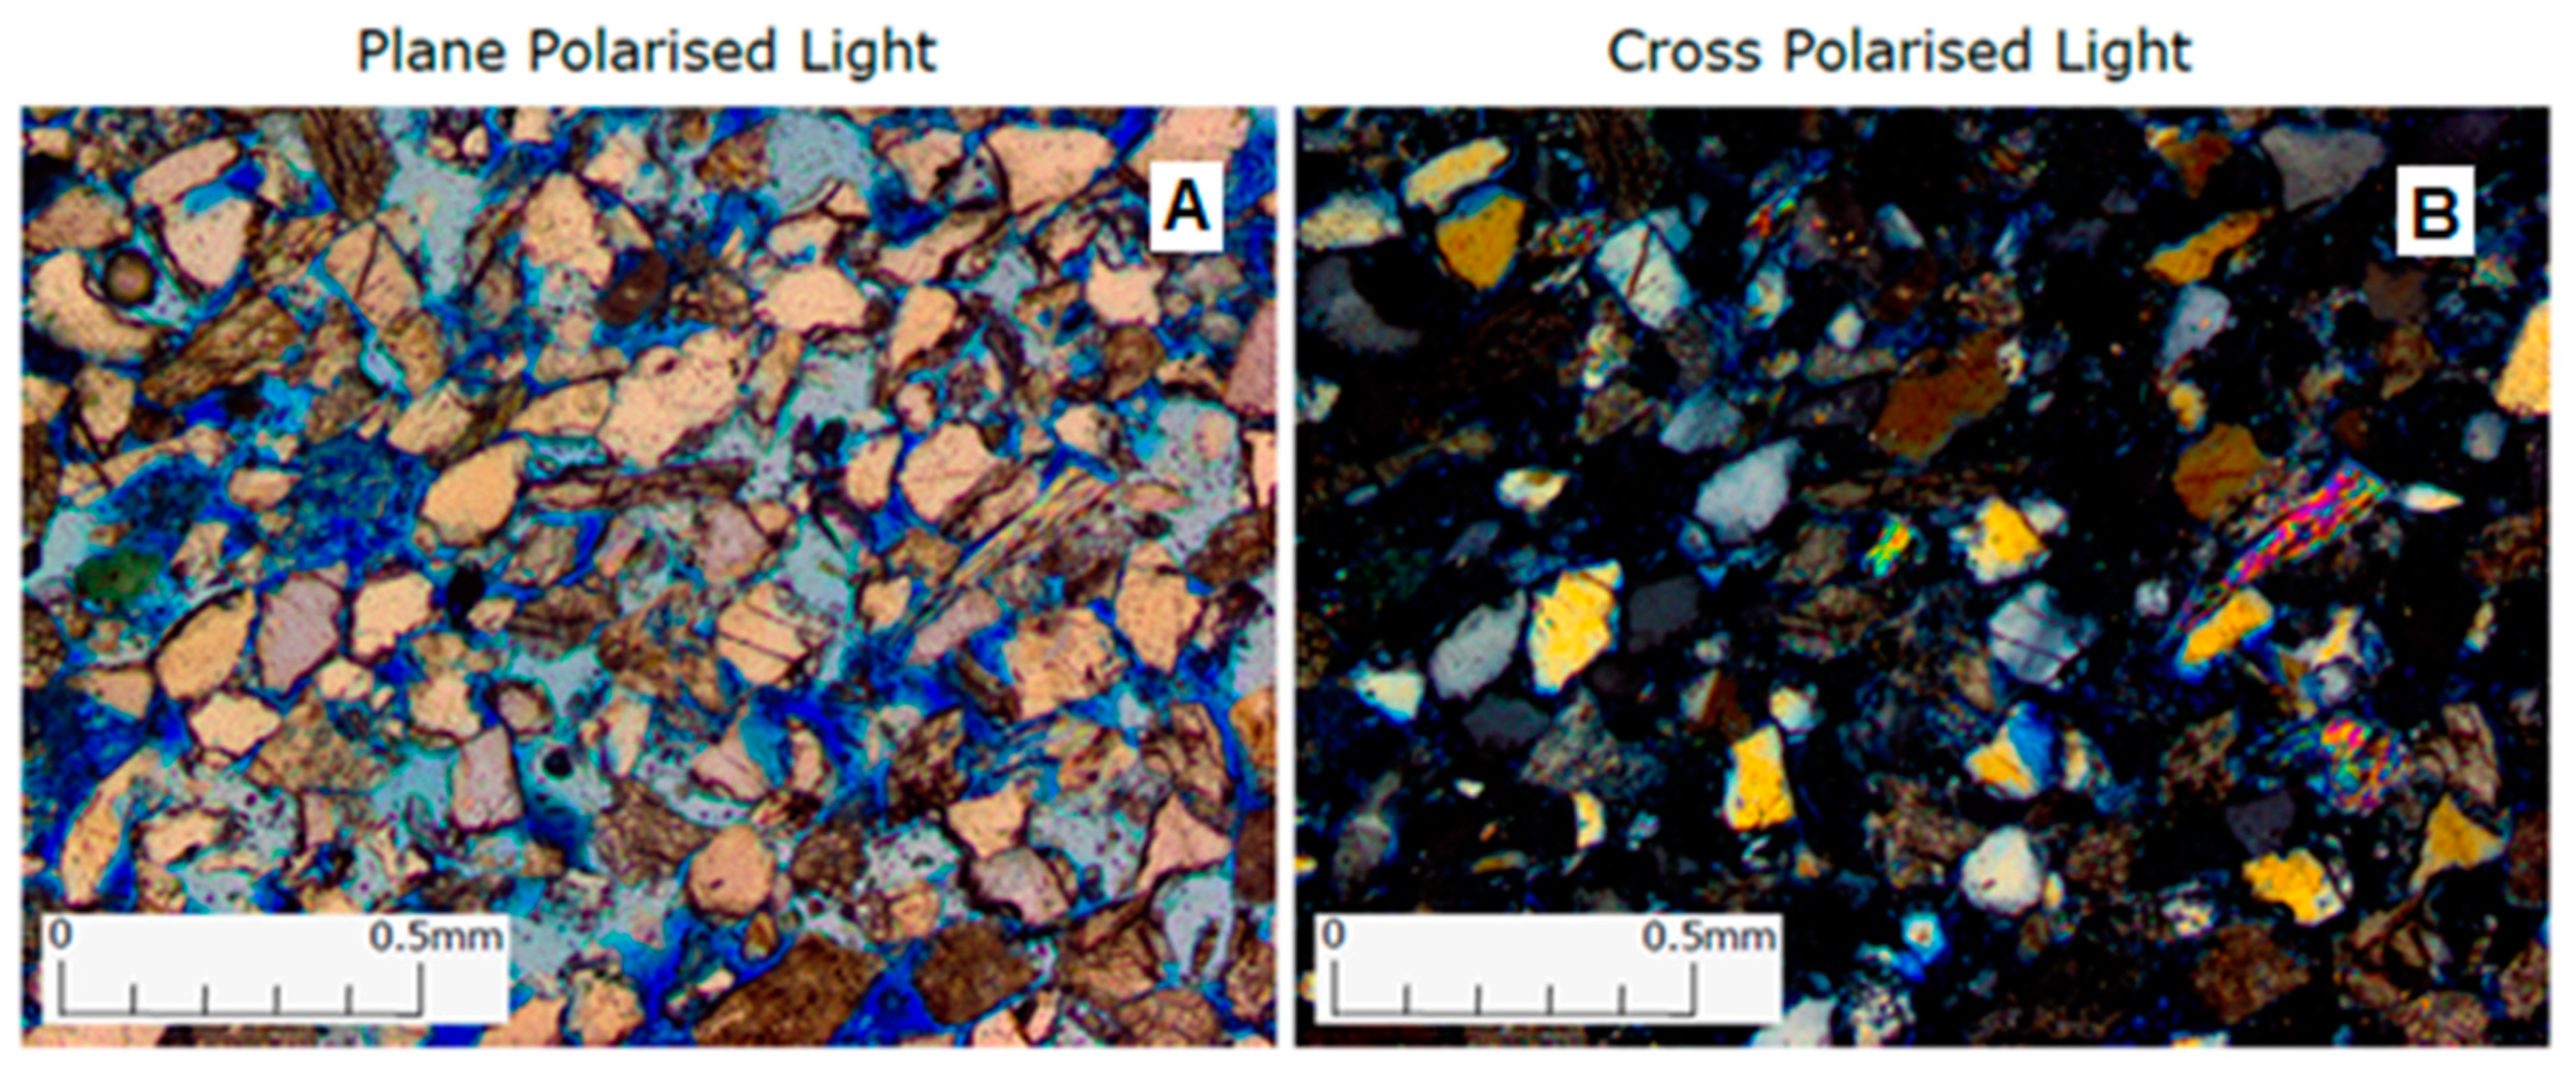
3.4. Thin Section Analysis and Scanning Electron Microscopy
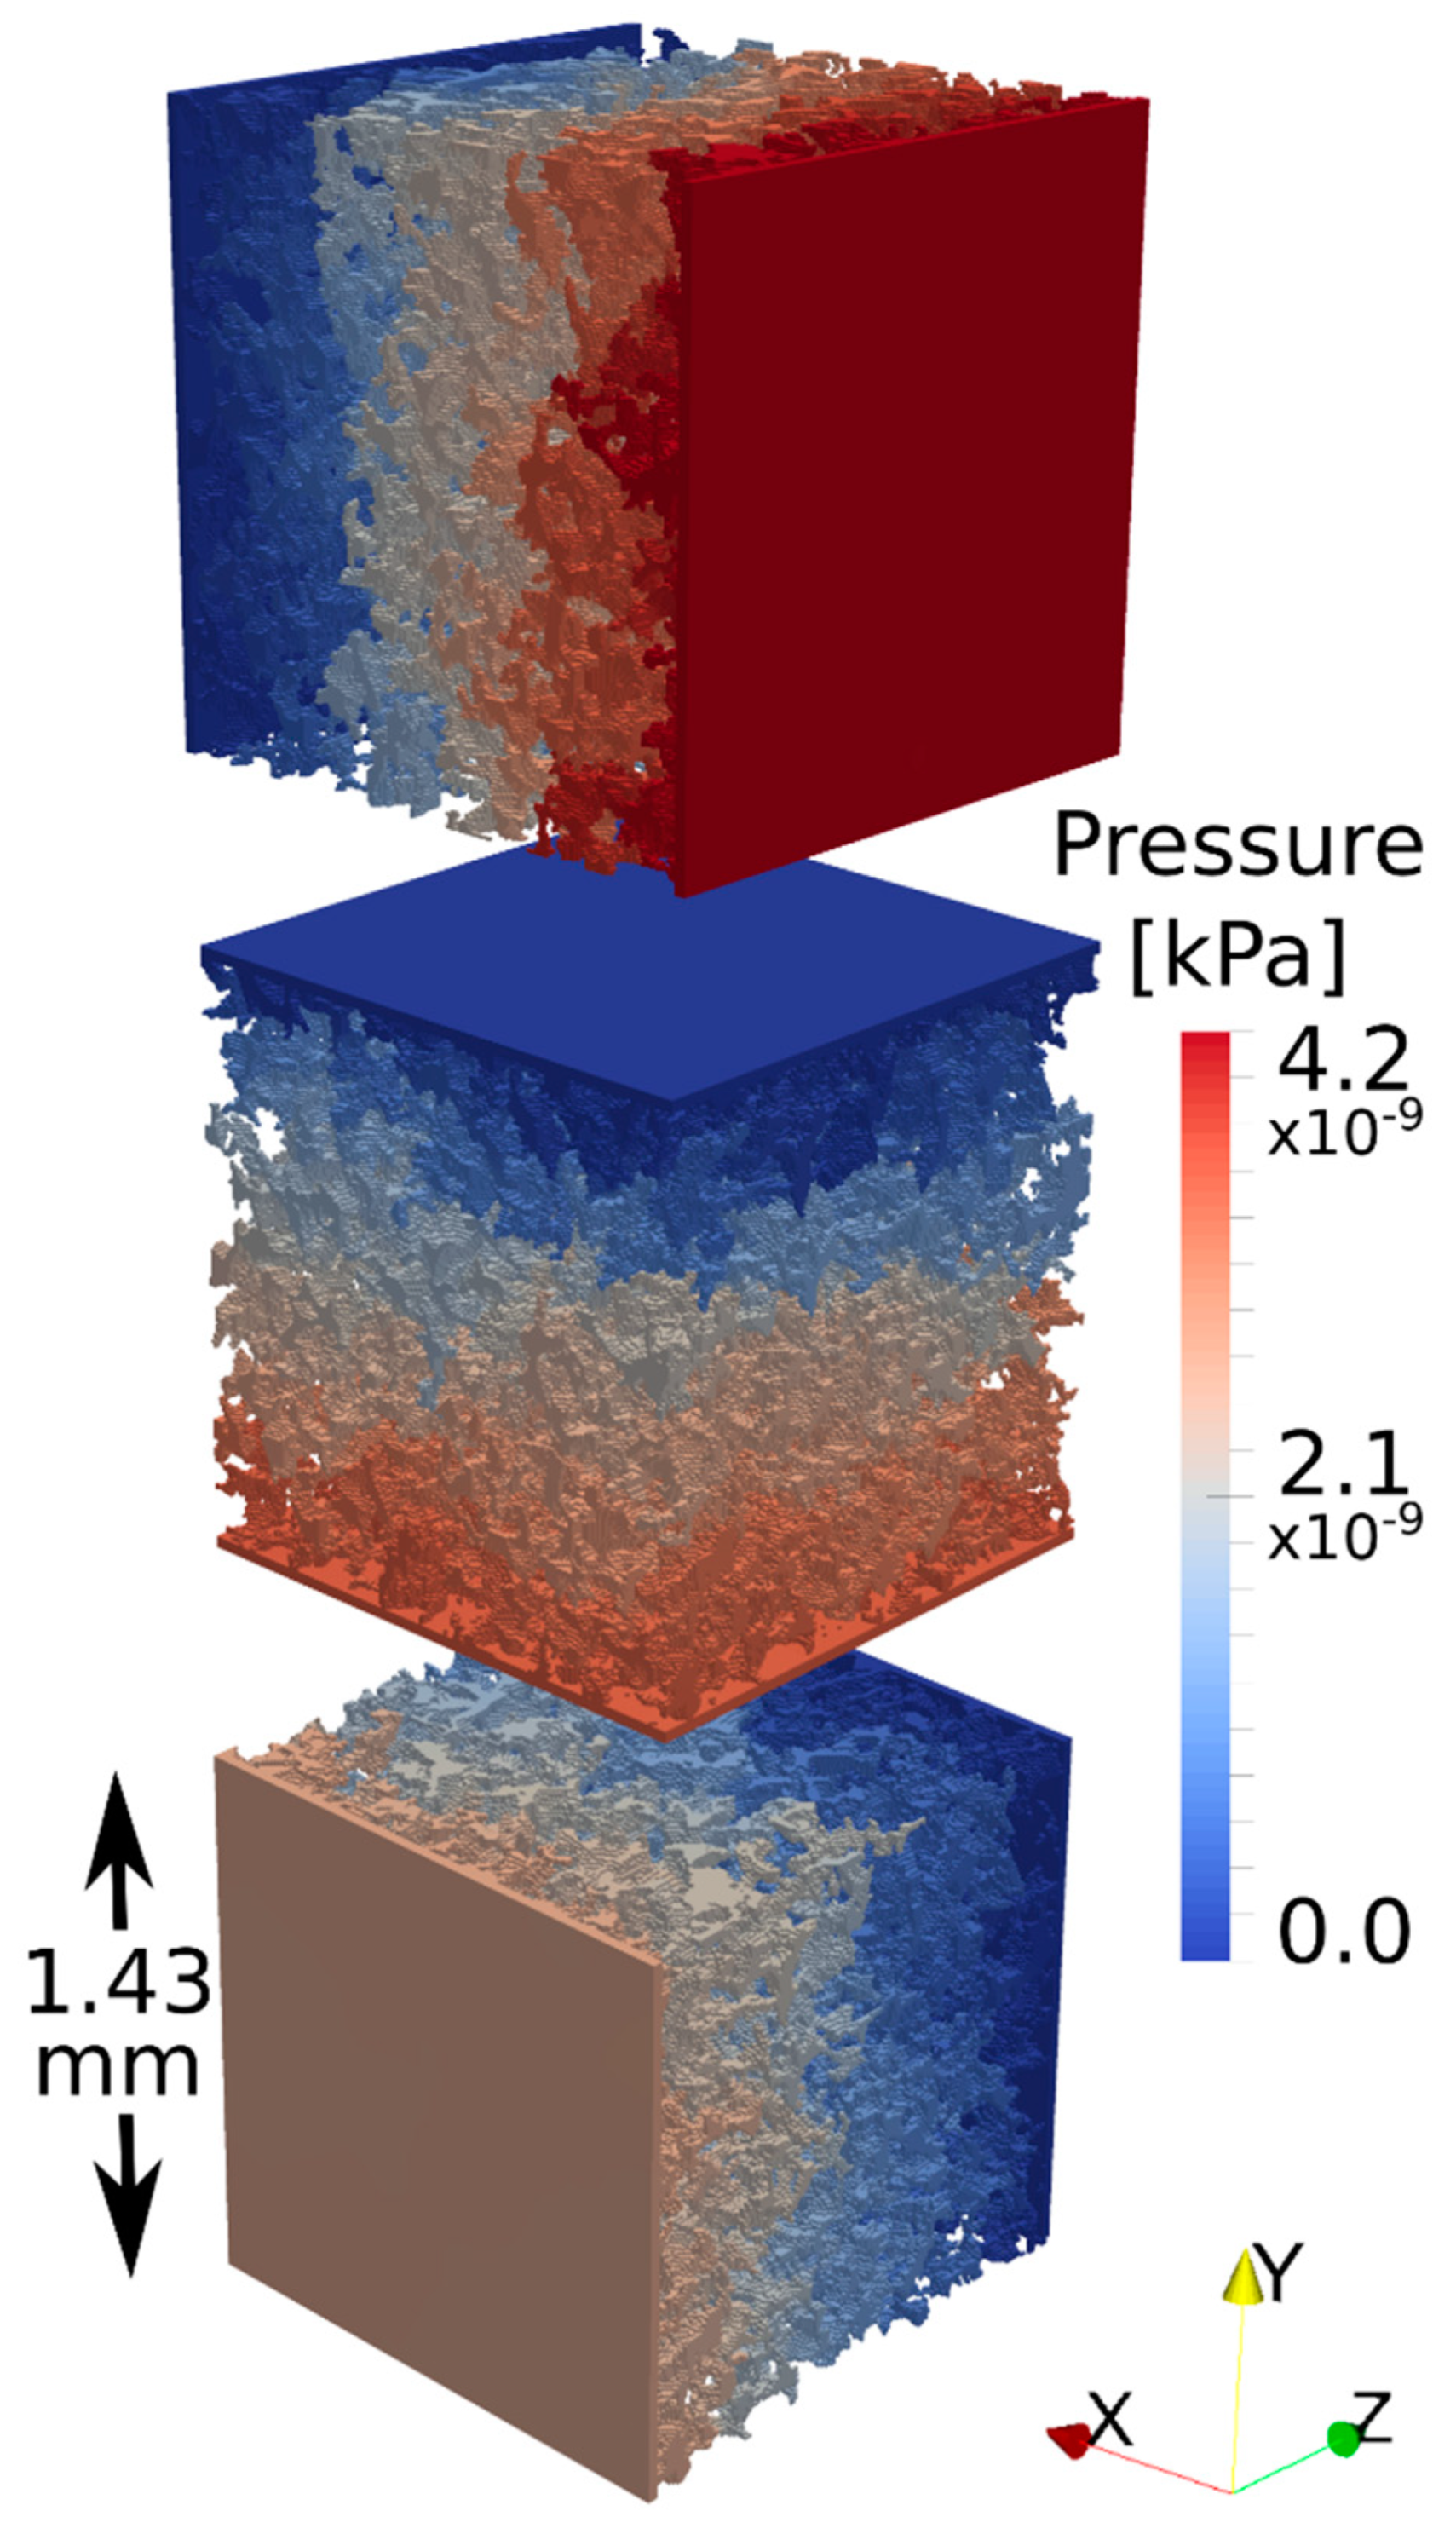
3.5. Numerical Flow Experiments
- Creation of hexahedral meshes for each sub-volume, with every mesh cell directly conformed to a voxel in the X-CT scan. Scan resolution was 7.147 μm, each sub-volume containing 8 million voxels, hence each hexahedral mesh also contained 8 million voxels. All six sides of the bounding box were set as wall-type boundary patches named “Side”.
- Cells that contained a solid voxel were removed from the mesh, leaving only pore space cells. Cell faces exposed by this operation were designated as wall-type boundary patches named “Walls”; these represent the internal boundary between pore space and the rock surface. Total porosity was calculated at this step.
- Inlet and outlet boundary “plates” were added for flow distribution. These plates are analogous to the distribution plates used in rock core holders for experimental measurement of permeability. The boundary patches on these sides were modified to “Inlet” and “Outlet” so that appropriate flow boundaries could be applied. The remaining four external sides of the bounding box stay as no-flow patches named “Side”.
- Regions of pore space not connected to the inlet and outlet plates (i.e., disconnected pore bodies) could not contribute to flow through the sub-volume and were removed. Connected porosity was calculated at this step.
- Steps 3 and 4 were repeated for flow along each axis.
3.6. X-ray Diffraction
4. Results
4.1. Thin Section and SEM Analyses
4.2. Mercury Intrusion Porosimetry Measurements
4.3. X-ray Diffraction
4.4. X-CT Results
4.5. Numerical Flow Experiments
5. Discussion
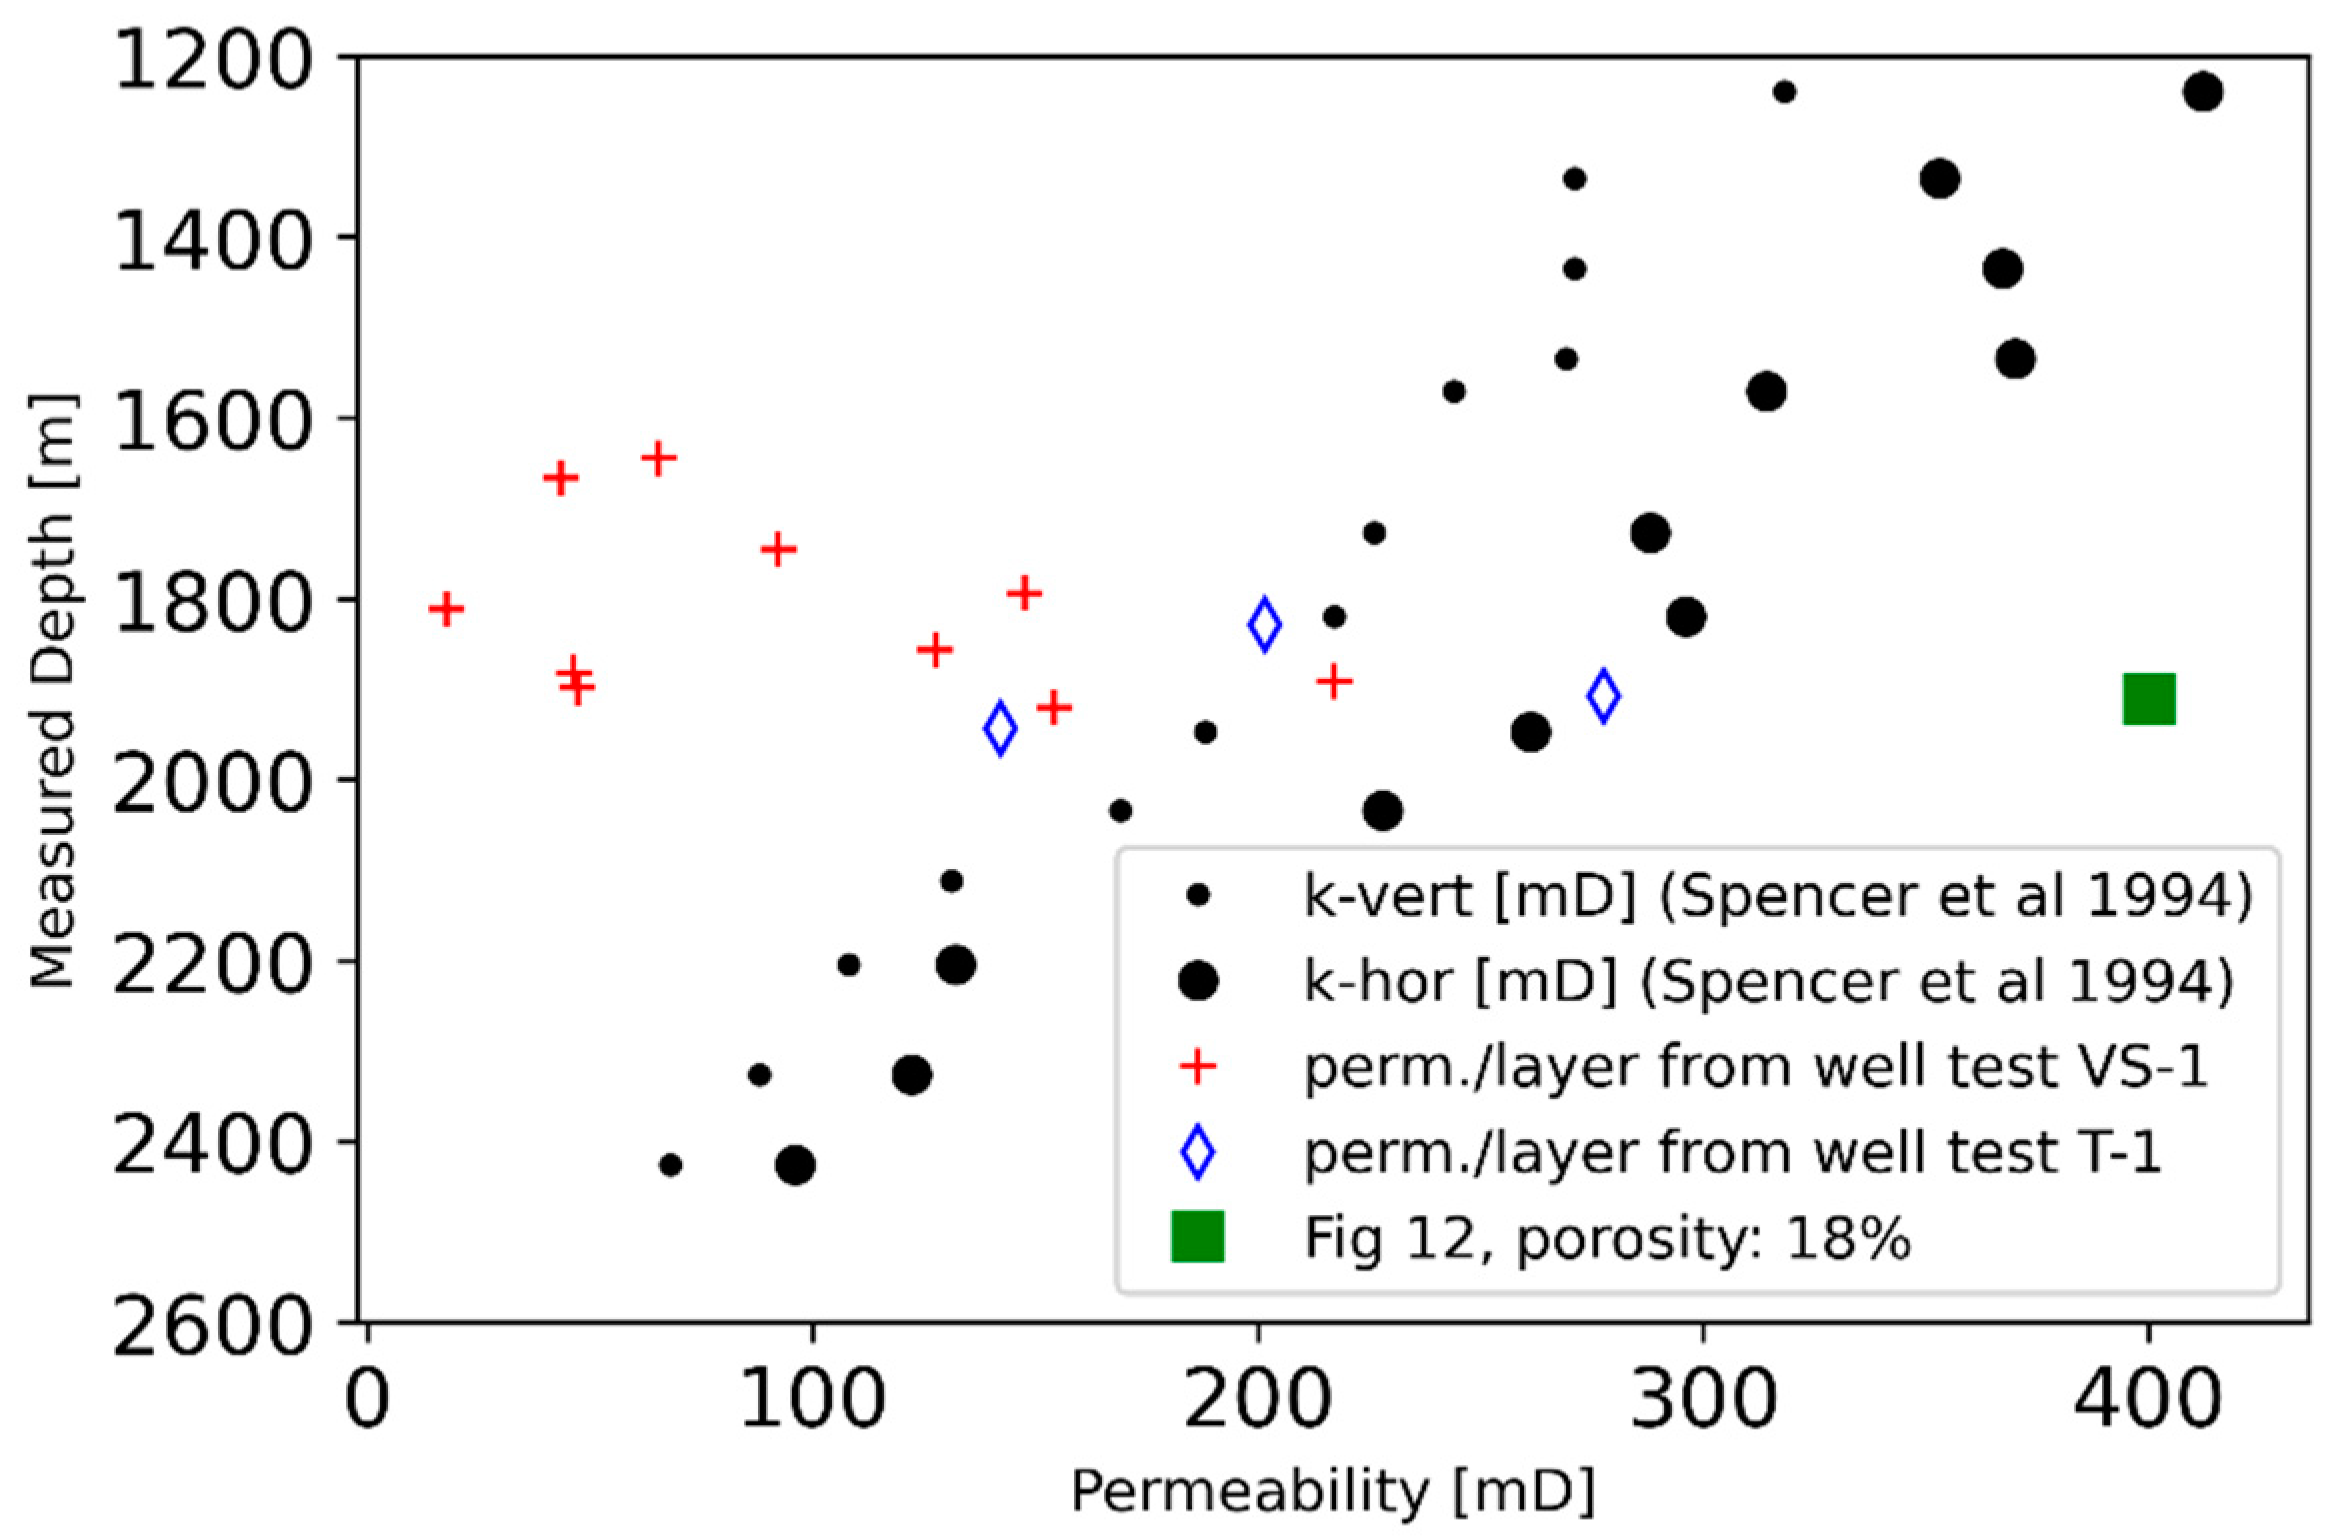
5.1. Comparison of Results
5.2. Injectivity and Productivity Decline
5.3. Application of Our Results
6. Conclusions
Author Contributions
Funding
Data Availability Statement
Acknowledgments
Conflicts of Interest
References
- Toth, A.N. Country Update for Hungary. In Proceedings of the World Geothermal Congress 2020, Reykjavik, Iceland, 2020 + 1, Reykjavik, Iceland, 21–26 May 2021; Paper 01019. p. 10. Available online: https://pangea.stanford.edu/ERE/db/WGC/papers/WGC/2020/01019.pdf (accessed on 15 July 2021).
- Nádor, A.; Kujbus, A.; Tóth, A. Geothermal energy use, country update for Hungary. In Proceedings of the European Geothermal Congress 2019, The Hague, The Netherlands, 11–14 June 2019; paper CUR-14-Hungary. p. 11. Available online: https://europeangeothermalcongress.eu/wp-content/uploads/2019/07/CUR-14-Hungary.pdf (accessed on 15 July 2021).
- Royden, L.H.; Horváth, F.; Burchfiel, B.C. Transform faulting, extension and subduction in the Carpathian-Pannonian region. Geol. Soc. Am. Bull. 1982, 73, 717–725. [Google Scholar] [CrossRef]
- Horváth, F.; Bada, G.; Szafián, P.; Tari, G.; Ádám, A.; Cloetingh, S. Formation and deformation of the Pannonian Basin: Constraints from observational data. Geol. Soc. London Mem. 2006, 32, 191–206. [Google Scholar] [CrossRef]
- Szanyi, J.; Kovács, B. Utilization of geothermal systems in South-East Hungary. Geothermics 2010, 39, 357–364. [Google Scholar] [CrossRef]
- Toth, A.N. Hungarian Country Update 2010–2014. In Proceedings of the World Geothermal Congress 2015, Melbourne, Australia, 19–25 April 2015; p. 12. Available online: https://www.researchgate.net/profile/Aniko-Toth-9/publication/297369483_Hungarian_Country_Update_2010–2014/links/56de9cba08aed4e2a99daf30/Hungarian-Country-Update-2010-2014.pdf (accessed on 15 July 2021).
- Csato, I.; Kendall, C.G.S.C.; Moore, P.D. The Messinian problem in the Pannonian Basin, Eastern Hungary–Insights from stratigraphic simulations. Sediment. Geol. 2007, 201, 111–140. [Google Scholar] [CrossRef]
- Sztanó, O.; Szafián, P.; Magyar, I.; Horányi, A.; Bada, G.; Hughes, D.W.; Hoyer, D.L.; Wallis, R.J. Aggradation and progradation controlled clinothems and deep-water sand delivery model in the Neogene Lake Pannon, Makó Trough, Pannonian Basin, SE Hungary. Glob. Planet. Chang. 2013, 103, 149–167. [Google Scholar] [CrossRef]
- Olariu, C.; Krezsek, C.; Jipa, D.C. The Danube River inception: Evidence for a 4 Ma continental-scale river born from segmented ParaTethys basins. Terra Nova 2018, 30, 63–71. [Google Scholar] [CrossRef]
- Phillips, R.L.; Révész, I.; Bérczi, I. Lower Pannonian deltaic-lacustrine processes and sedimentation, Békés Basin. In Basin Analysis in Petroleum Exploration: A Case Study from the Békés Basin, Hungary; Teleki, P.G., Mattick, R.E., Kokai, J., Eds.; Kluwer: Dordrecht, The Netherlands, 1994; pp. 67–82. [Google Scholar] [CrossRef]
- Spencer, C.W.; Szalay, Á.; Tatár, É. Abnormal pressure and hydrocarbon migration in the Békés Basin. In Basin Analysis in Petroleum Exploration: A Case Study from the Békés Basin, Hungary; Teleki, P.G., Mattick, R.E., Kokai, J., Eds.; Kluwer: Dordrecht, The Netherlands, 1994; pp. 201–219. [Google Scholar] [CrossRef]
- Szentgyorgyi, K.; Teleki, P.G. Facies and depositional environments of Miocene sedimentary rocks. In Basin Analysis in Petroleum Exploration: A Case Study from the Békés Basin, Hungary; Teleki, P.G., Mattick, R.E., Kokai, J., Eds.; Kluwer: Dordrecht, The Netherlands, 1994; pp. 83–98. [Google Scholar] [CrossRef]
- Csato, I.; Tóth, S.; Catuneanu, O.; Granjeon, D. A sequence stratigraphic model for the Upper Miocene-Pliocene basin fill of the Pannonian Basin, eastern Hungary. Mar. Pet. Geol. 2015, 66, 117–134. [Google Scholar] [CrossRef]
- Matenco, L.; Radivojević, D. On the formation and evolution of the Pannonian Basin: Constraints derived from the structure of the junction area between the Carpathians and Dinarides. Tectonics 2012, 31, 31. [Google Scholar] [CrossRef]
- Brehme, M.; Nowak, K.; Marko, A.; Istvan, S.; Willems, C.J.L.; Huenges, E. Injection triggered occlusion of flow pathways in a sedimentary aquifer in Hungary. In Proceedings of the World Geothermal Congress 2020+1, Reykjavik, Iceland, 21–26 May 2021; paper 23011. p. 5. Available online: https://pangea.stanford.edu/ERE/db/WGC/papers/WGC/2020/23011.pdf (accessed on 15 July 2021).
- Pogácsás, G.; Lakatos, L.; Újszászi, K.; Vakarcs, G.; Várkonyi, L.; Váhai, P.; Révész, L. Seismic facies, electro facies and Neogene sequence chronology of the Pannonian Basin. Acta Geol. Hung. 1988, 31, 175–207. [Google Scholar]
- Juhász, G. Lithostratigraphical and sedimentological framework of the Pannonian (s.l.) sedimentary sequence in the Hungarian Plain (Alföld), eastern Hungary. Acta Geol. Hung. 1991, 34, 53–72. [Google Scholar]
- Willems, C.J.L.; Westaway, R.; Burnside, N.M. Hydraulic connectivity in Pannonian sandstones of the Mezőberény geothermal doublet. In Proceedings of the European Geothermal Congress 2019, The Hague, The Netherlands, 11–14 June 2019; paper 181. p. 10. Available online: https://europeangeothermalcongress.eu/wp-content/uploads/2019/07/181.pdf (accessed on 15 July 2021).
- Toth, A.N. Geothermal energy in Hungary. In Geothermal Energy Here and Now: Sustainable, Clean, Flexible, Proceedings of the Geothermal Resources Council Annual Meeting (GRC 2016), Sacramento, CA, USA, 23–26 October 2016; Geothermal Resources Council: Davis, CA, USA, 2016; Volume 40, pp. 35–42. Available online: https://www.researchgate.net/profile/Aniko-Toth-9/publication/324570464_Geothermal_Energy_in_Hungary/links/5ad618730f7e9b28593807f9/Geothermal-Energy-in-Hungary.pdf (accessed on 15 July 2021).
- MBFSZ. MBFSZ Map Server; Magyar Bányászati és Földtani SZolgálat (MBFSZ; Mining and Geological Survey of Hungary): Budapest, Hungary. Available online: https://map.mbfsz.gov.hu (accessed on 15 July 2021).
- Richter, A. Webinar–Hungary’s Interactive Geothermal Platform, 7 May 2021. Think GeoEnergy, 4 May 2021. Available online: https://www.thinkgeoenergy.com/webinar-hungarys-interactive-geothermal-platform-may-7-2021/ (accessed on 15 July 2021).
- Varga, A.; Bozsó, G.; Garaguly, I.; Raucsik, B.; Bencsik, A.; Kóbor, B. Cements, waters, and scales: An integrated study of the Szeged geothermal systems (SE Hungary) to characterize natural environmental conditions of the thermal aquifer. Geofluids 2019, 2019, 21. [Google Scholar] [CrossRef]
- Almási, I. Petroleum Hydrogeology of the Great Hungarian Plain, Eastern Pannonian Basin, Hungary. Ph.D. Thesis, University of Alberta, Edmonton, AB, Canada, 2001; p. 312. Available online: https://www.nlc-bnc.ca/obj/s4/f2/dsk3/ftp04/NQ60365.pdf?oclc_number=50720988 (accessed on 15 July 2021).
- Pap, S. Alföldi és északi-középhegységi köolaj-földgáztároló közetek (Petroleum reservoir rocks of the Great Hungarian Plain and the North Central Range). Földtani Közlöny 1976, 106, 555–580. (In Hungarian) [Google Scholar]
- Somfai, A. Pressure Conditions and Causes of Fluid Pressures in Hydrocarbon Reservoirs in the Great Hungarian Plain; Hungarian Academy of Sciences: Budapest, Hungary, 1976; p. 145. [Google Scholar]
- Bérczi, I.; Kókai, J. Hydrogeological features of some deep-basins in SE Hungary as revealed by hydrocarbon exploration. In Hydrogeology of Great Sedimentary Basins, Proceedings of the Budapest Conference, May–June 1976; Rónai, A., Ed.; International Association of Hydrological Sciences Memoir, Múszaki Könyvkiadó Publishing House: Budapest, Hungary, 1978; pp. 69–93. Available online: http://hydrologie.org/redbooks/a120/iahs_120_0069.pdf (accessed on 15 July 2021).
- Szalay, Á. A túlnyomás okai és a paleopórusnyomás becslése (Causes of overpressures and estimation of palaeo-pore pressures). Köolaj és Földgáz 1982, 115, 41–46. (In Hungarian) [Google Scholar]
- Geiger, J.; Hajdúné Molnár, K.; Jámbor, Á.; Koncz, L.; Pogácsás, G.; Révész, I.; Somfai, A.; Szalay, Á.; Szentgyörgyi, K. A Pannon Rnedence Fejlödéstörténeti Rekonstnikciója és a Fejlodéstorténeti Modellek Alkalmazasa a Szénhidrogén Prognózisban (The Evolution of the Pannonian Basin and the Application of Evolutionary Models for Hydrocarbon Prognosis) [Internal Report]; Hungarian Institute of Petroleum Exploration and Development: Szeged, Hungary, 1991; p. 1055. (In Hungarian) [Google Scholar]
- Somfai, A. Hungary. In Regional Petroleum Geology of the World, Part 1: Europe and Asia; Kulke, H., Ed.; Gebrüder Borntraeger: Berlin, Germany, 1994; pp. 277–285. [Google Scholar]
- Theis, C.V. The relationship between the lowering of the piezometric surface and the rate and duration of discharge of a well using ground-water storage. Trans. Am. Geophys. Union 1935, 16, 519–524. [Google Scholar] [CrossRef]
- Kułynycza, V.; Maruta, M. The application of X-ray Computed Microtomography for estimation of petrophysical parameters of reservoir rocks. World Sci. News 2017, 76, 91–107. [Google Scholar]
- Brooks, R.A.; Di Chiro, G. Beam hardening in X-ray reconstructive tomography. Phys. Med. Biol. 1976, 21, 390–398. [Google Scholar] [CrossRef]
- Quantachrome. Poremaster—Mercury Intrusion Porosimetry; Quantachrome Corporation: Boynton Beach, FL, USA, 2018; Available online: http://www.quantachrome.com/pdf_brochures/07128.pdf (accessed on 15 July 2021).
- Abell, A.B.; Willis, K.L.; Lange, D.A. Mercury intrusion porosimetry and image analysis of cement-based materials. J. Colloid Interface Sci. 1999, 211, 39–44. [Google Scholar] [CrossRef]
- Washburn, E.W. The dynamics of capillary flow. Phys. Rev. 1921, 17, 273–283. [Google Scholar] [CrossRef]
- Zhang, L.; Jing, W.L.; Yang, Y.F.; Yang, H.N.; Guo, Y.H.; Sun, H.; Zhao, J.L.; Yao, J. The investigation of permeability calculation using digital core simulation technology. Energies 2019, 12, 3273. [Google Scholar] [CrossRef] [Green Version]
- Callow, B.; Falcon-Suarez, I.; Marin-Moreno, H.; Bull, J.M.; Ahmed, S. Optimal X-ray micro-CT image based methods for porosity and permeability quantification in heterogeneous sandstones. Geophys. J. Int. 2020, 223, 1210–1229. [Google Scholar] [CrossRef]
- Schepp, L.L.; Ahrens, B.; Balcewicz, M.; Duda, M.; Nehler, M.; Osorno, M.; Uribe, D.; Steeb, H.; Nigon, B.; Stöckhert, F.; et al. Digital rock physics and laboratory considerations on a high-porosity volcanic rock. Nat. Sci. Rep. 2020, 10, 16. [Google Scholar] [CrossRef] [PubMed] [Green Version]
- Grazulis, S.; Daskevic, A.; Merkys, A.; Chateigner, D.; Das, A.; Serebryanaya, N.R.; Moeck, P.; Lutterotti, L.; Quiro, M.; Downs, R.T.; et al. Crystallography Open Database (COD): An open-access collection of crystal structures and platform for world-wide collaboration. Nucleic Acids Res. 2012, 40, 420–427. [Google Scholar] [CrossRef]
- Karathanasis, A.D.; Hajek, B.F. Transformation of smectite to kaolinite in naturally acid soil systems: Structural and thermodynamic considerations. Soil Sci. Soc. Am. J. 1983, 47, 158–163. [Google Scholar] [CrossRef]
- Kozeny, J. Ueber kapillare Leitung des Wassers im Boden. Sitzungsber. Akad. Wiss. Wien 1927, 136, 271–306. [Google Scholar]
- Carman, P.C. Fluid flow through granular beds. Trans. Inst. Chem. Eng. London 1937, 15, 150–166. [Google Scholar] [CrossRef]
- Mavko, G.; Nur, A. The effect of a percolation threshold in the Kozeny-Carman relation. Geophysics 1997, 62, 1480–1482. [Google Scholar] [CrossRef]
- Dubelaar, C.W.; Nijland, T.G. The Bentheim Sandstone: Geology, petrophysics, varieties and its use as dimension stone. In Engineering Geology for Society and Territory; Lollino, G., Giordan, D., Marunteanu, C., Christaras, B., Yoshinori, I., Margottini, C., Eds.; Springer: Cham, Switzerland, 2015; Volume 8, pp. 557–563. [Google Scholar] [CrossRef]
- Andrew, A.; Bijeljic, B.; Blunt, M.J. Pore-scale imaging of trapped supercritical carbon dioxide in sandstones and carbonates. Int. J. Greenhouse Gas Control 2014, 22, 1–14. [Google Scholar] [CrossRef] [Green Version]
- Jacobsen, T.; Rendall, H. Permeability patterns in some fluvial sandstones. An outcrop study from Yorkshire, North East England. In Reservoir Characterization II; Lake, L., Carroll, H.B., Jr., Wesson, T.C., Eds.; Academic Press: Cambridge, MA, USA, 1991; pp. 315–338. [Google Scholar] [CrossRef]
- Alexander, J.; Gawthorpe, R.L. The complex nature of a Jurassic multistorey, alluvial sandstone body, Whitby, North Yorkshire. In Characterization of Fluvial and Aeolian Reservoirs: Problems and Approaches; North, C.P., Prosser, D.J., Eds.; Geological Society: London, UK, Special Publications; 1993; Volume 73, pp. 123–142. [Google Scholar] [CrossRef]
- Hartkamp, C.A.; Arribas, J.; Tortosa, A. Grain size, composition, porosity and permeability contrasts within cross-bedded sandstones in Tertiary fluvial deposits, central Spain. Sedimentology 1993, 40, 787–799. [Google Scholar] [CrossRef] [Green Version]
- Willems, C.J.L.; Nick, H.M.; Donselaar, M.E.; Weltje, G.J.; Bruhn, D.F. On the connectivity anisotropy in fluvial hot sedimentary aquifers and its influence on geothermal doublet performance. Geothermics 2017, 65, 222–233. [Google Scholar] [CrossRef]
- Larue, D.K.; Hovadik, J. Connectivity of channelized reservoirs: A modelling approach. Pet. Geosci. 2006, 12, 291–308. [Google Scholar] [CrossRef]
- Manzocchi, T.; Walsh, J.J.; Tomasso, M.; Strand, J.; Childs, C.; Haughton, P.D.W. Static and dynamic connectivity in bed-scale models of faulted and unfaulted turbidites. In Structurally Complex Reservoirs; Jolley, S.J., Barr, D., Walsh, J.J., Knipe, R.J., Eds.; Geological Society: London, UK, Special Publications; 2007; Volume 292, pp. 309–336. [Google Scholar] [CrossRef] [Green Version]
- Ainsworth, R.B.; Sanlung, M.; Duivenvoorden, S.T.C. Correlation techniques, perforation strategies, and recovery factors: An integrated 3-D reservoir modeling study, Sirikit Field, Thailand. Am. Assoc. Pet. Geol. Bull. 1999, 83, 1535–1551. [Google Scholar] [CrossRef]
- Croese, E. Microbiology in Geothermal Operations; Microbial Analysis B.V.: Groningen, The Netherlands, 2018; p. 37. Available online: https://www.kasalsenergiebron.nl/content/user_upload/Final_Report_Microorganisms_in_geothermal_operations_20177513_1987.pdf (accessed on 15 July 2021).
- Osvald, M.; Maróti, G.; Pap, B.; Szanyi, J. Biofilm forming bacteria during thermal water reinjection. Geofluids 2017, 2017, 7. [Google Scholar] [CrossRef]
- Rühaak, W.; Guadagnini, A.; Geiger, S.; Bär, K.; Gu, Y.; Aretz, A.; Homuth, S.; Sass, I. Upscaling thermal conductivities of sedimentary formations for geothermal exploration. Geothermics 2015, 58, 49–61. [Google Scholar] [CrossRef]
- SPE. Permeability Determination; Society of Petroleum Engineers: Dallas, TX, USA, 2015; Available online: https://petrowiki.spe.org/Permeability_determination#cite_note-r1-1 (accessed on 15 July 2021).
- OpenEI. Geothermal Exploration; Open Energy Information, U.S. government Department of Energy: Washington, DC, USA, 2018. Available online: https://openei.org/wiki/Geothermal/Exploration (accessed on 15 July 2021).
- Shearing, P.; Turner, M.; Sinclair, I.; Lee, P.; Ahmed, F.; Quinn, P.; Leach, R.; Sun, W.J.; Warnett, J. EPSRC X-ray Tomography Roadmap; Engineering & Physical Sciences Research Council: Swindon, UK, 2018; p. 31. Available online: https://epsrc.ukri.org/files/research/epsrc-X-ray-tomography-roadmap-2018/ (accessed on 15 July 2021).
- Kristensen, L.; Hjuler, M.L.; Frykman, P.; Olivarius, M.; Weibel, R.; Nielsen, L.H.; Mathiesen, A. Pre-drilling assessments of average porosity and permeability in the geothermal reservoirs of the Danish area. Geotherm. Energy 2016, 4, 27. [Google Scholar] [CrossRef] [Green Version]
- Bohnsack, D.; Potten, M.; Pfrang, D.; Wolpert, P.; Zosseder, K. Porosity–permeability relationship derived from Upper Jurassic carbonate rock cores to assess the regional hydraulic matrix properties of the Malm reservoir in the South German Molasse Basin. Geotherm. Energy 2020, 8, 47. [Google Scholar] [CrossRef]
- Kearsey, T.; Gillespie, M.; Entwisle, D.; Damaschke, M.; Wylde, S.; Fellgett, M.; Kingdon, A.; Burkin, J.; Starcher, V.; Shorter, K.; et al. UK Geoenergy Observatories Glasgow: GGC01 Cored, Seismic Monitoring Borehole–Intermediate Data Release; British Geological Survey: Nottingham, UK, 2019; Open Report OR/19/049; p. 36. Available online: https://www.ukgeos.ac.uk/data-downloads/glasgow/seismic-borehole-information-pack (accessed on 15 July 2021).


| Production | Depth | Depth | Thickness | Qi | Fi | Ki |
|---|---|---|---|---|---|---|
| Interval, i | Top [m] | Base [m] | Hi [m] | [L/min] | [%] | [mD] |
| Well VS-1 | ||||||
| 1 | 1643.9 | 1646.5 | 2.6 | 20 | 4.4 | 65 |
| 3 | 1665.8 | 1669.7 | 3.9 | 20 | 4.4 | 44 |
| 4 | 1745.0 | 1755.0 | 10.0 | 110 | 23.9 | 92 |
| 5 | 1793.0 | 1794.7 | 1.7 | 30 | 6.5 | 147 |
| 6 | 1810.7 | 1817.9 | 7.2 | 15 | 3.3 | 18 |
| 7 | 1856.0 | 1857.3 | 1.3 | 20 | 4.3 | 128 |
| 9 | 1882.0 | 1886.5 | 4.5 | 25 | 5.4 | 46 |
| 10 | 1891.0 | 1893.7 | 2.7 | 70 | 15.2 | 217 |
| 11 | 1898.0 | 1899.8 | 1.8 | 10 | 2.2 | 47 |
| 12 | 1920.0 | 1927.6 | 7.6 | 140 | 30.4 | 154 |
| Total | 43.3 | 460 | ||||
| Well T-1 | ||||||
| 1 | 1828.5 | 1833 | 4.5 | 130 | 37 | 201 |
| 2 | 1907.5 | 1910.5 | 3.0 | 120 | 34 | 278 |
| 3 | 1942.5 | 1947.5 | 5.0 | 100 | 29 | 142 |
| Total: | 12.5 | 350 |
| Sample | F1 | F3 | F4 | |
|---|---|---|---|---|
| Facies | Siltstone | Med. Grained Sst | Fine Grained Sst. | |
| Analysis | Property | |||
| X-CT imaging | Y | Y | Y | Porosity |
| X-ray Diffraction (XRD) | Y | Y | Minerology | |
| Thin section | Y | Y | Y | Minerology |
| Scanning Electron Microscope (SEM) | Y | Y | Y | Minerology |
| Mercury Intrusion Porosimetry (MIP) | Y | Y | Y | Porosity, density |
| Numerical flow simulation | Y | Permeability |
| Sample | Notes | Scan | Voxel Size (µm) | Scan Size (Voxels) | Voltage (kV) | Current (µA) |
|---|---|---|---|---|---|---|
| F1 | H1 | 7.47888 | 1684 × 1436 × 1592 | 150 | 40 | |
| F4 | (1) | H2 | 8.78948 | 1494 × 1556 × 1779 | 150 | 53 |
| F3 | H3 | 7.14653 | 1590 × 1751 × 1866 | 150 | 40 | |
| F4 | (2) | H4 | 6.52282 | 1609 × 1370 × 1936 | 150 | 40 |
| F3 | (3) | H3-HR | 2.78965 | 2000 × 2000 × 1399 | 140 | 19 |
| Boundary Name | Type | Velocity Field | Pressure Field |
|---|---|---|---|
| Inlet | patch | fixed velocity | zero gradient |
| Outlet | patch | zero gradient | fixed pressure |
| Side | wall | slip | zero gradient |
| Walls | wall | no-slip | zero gradient |
| Sample | Piece | Porosity | Bulk Density | Grain Density |
|---|---|---|---|---|
| ρb (kg m−3) | ρg (kg m−3) | |||
| Sandstone | ||||
| F3 | 1 | 0.296 | 2396 | 3403 |
| F3 | 2 | 0.355 | 2091 | 3242 |
| F3 | 3 | 0.310 | 2111 | 3059 |
| Siltstone | ||||
| F1 | 1 | 0.135 | 2699 | 3120 |
| F4 | 1 | 0.066 | 3088 | 3306 |
| F4 | 2 | 0.063 | 3081 | 3288 |
| Sample | Mineralogical Composition (%) | ||||||||
|---|---|---|---|---|---|---|---|---|---|
| Quartz | Calcite | Dolomite | Mica | Feldspar | 1:1 Clay | 2:1 Clay | Rutile | Pyroxene | |
| F1 | 46.7 | 4.7 | 29.5 | 2.4 | 10.0 | 1.0 | 3.5 | 1.6 | 0.3 |
| F3 | 43.4 | 5.4 | 25.0 | 2.8 | 10.4 | 1.0 | 3.3 | 0.7 | 8.0 |
| Flow Direction | KO (10−12 m2) | KO (mD) | ϕc |
|---|---|---|---|
| z | 104.36 | 105,743 | 0.0287 |
| x, y and z | 71.309 | 72,254 | 0.0208 |
| x and y | 77.006 | 78,026 | 0.0329 |
Publisher’s Note: MDPI stays neutral with regard to jurisdictional claims in published maps and institutional affiliations. |
© 2021 by the authors. Licensee MDPI, Basel, Switzerland. This article is an open access article distributed under the terms and conditions of the Creative Commons Attribution (CC BY) license (https://creativecommons.org/licenses/by/4.0/).
Share and Cite
Willems, C.J.L.; Cheng, C.; Watson, S.M.; Minto, J.; Williams, A.; Walls, D.; Milsch, H.; Burnside, N.M.; Westaway, R. Permeability and Mineralogy of the Újfalu Formation, Hungary, from Production Tests and Experimental Rock Characterization: Implications for Geothermal Heat Projects. Energies 2021, 14, 4332. https://doi.org/10.3390/en14144332
Willems CJL, Cheng C, Watson SM, Minto J, Williams A, Walls D, Milsch H, Burnside NM, Westaway R. Permeability and Mineralogy of the Újfalu Formation, Hungary, from Production Tests and Experimental Rock Characterization: Implications for Geothermal Heat Projects. Energies. 2021; 14(14):4332. https://doi.org/10.3390/en14144332
Chicago/Turabian StyleWillems, Cees J. L., Chaojie Cheng, Sean M. Watson, James Minto, Aislinn Williams, David Walls, Harald Milsch, Neil M. Burnside, and Rob Westaway. 2021. "Permeability and Mineralogy of the Újfalu Formation, Hungary, from Production Tests and Experimental Rock Characterization: Implications for Geothermal Heat Projects" Energies 14, no. 14: 4332. https://doi.org/10.3390/en14144332
APA StyleWillems, C. J. L., Cheng, C., Watson, S. M., Minto, J., Williams, A., Walls, D., Milsch, H., Burnside, N. M., & Westaway, R. (2021). Permeability and Mineralogy of the Újfalu Formation, Hungary, from Production Tests and Experimental Rock Characterization: Implications for Geothermal Heat Projects. Energies, 14(14), 4332. https://doi.org/10.3390/en14144332