1. Introduction
Power systems transmit electric energy to consumers through essential devices. For safety, power system operators must inspect the devices before connecting them to the system using computer simulations. Particularly, the power transformer is an essential component that steps up or down voltages for efficient and safe power transmissions. Therefore, there have been many studies on modeling and model parameter estimation of the power transformers. The power transformer model primarily has turn ratios and includes loss components, if necessary. However, this model presents limited information about the characteristics of a power transformer. A high-frequency transformer model reflects the structural and physical characteristics [
1]. As described in [
2,
3,
4,
5,
6,
7,
8,
9,
10,
11,
12,
13,
14], the model comprises of repetitive RLC sections and is called a lumped parameter model or ladder circuit because its structure looks like a ladder. A single-winding transformer model was introduced in [
2,
3,
4,
5,
6,
7], and particularly [
6,
7] represented mutual magnetic coupling between sections in a single winding. Moreover, [
8,
9,
10,
11,
12,
13,
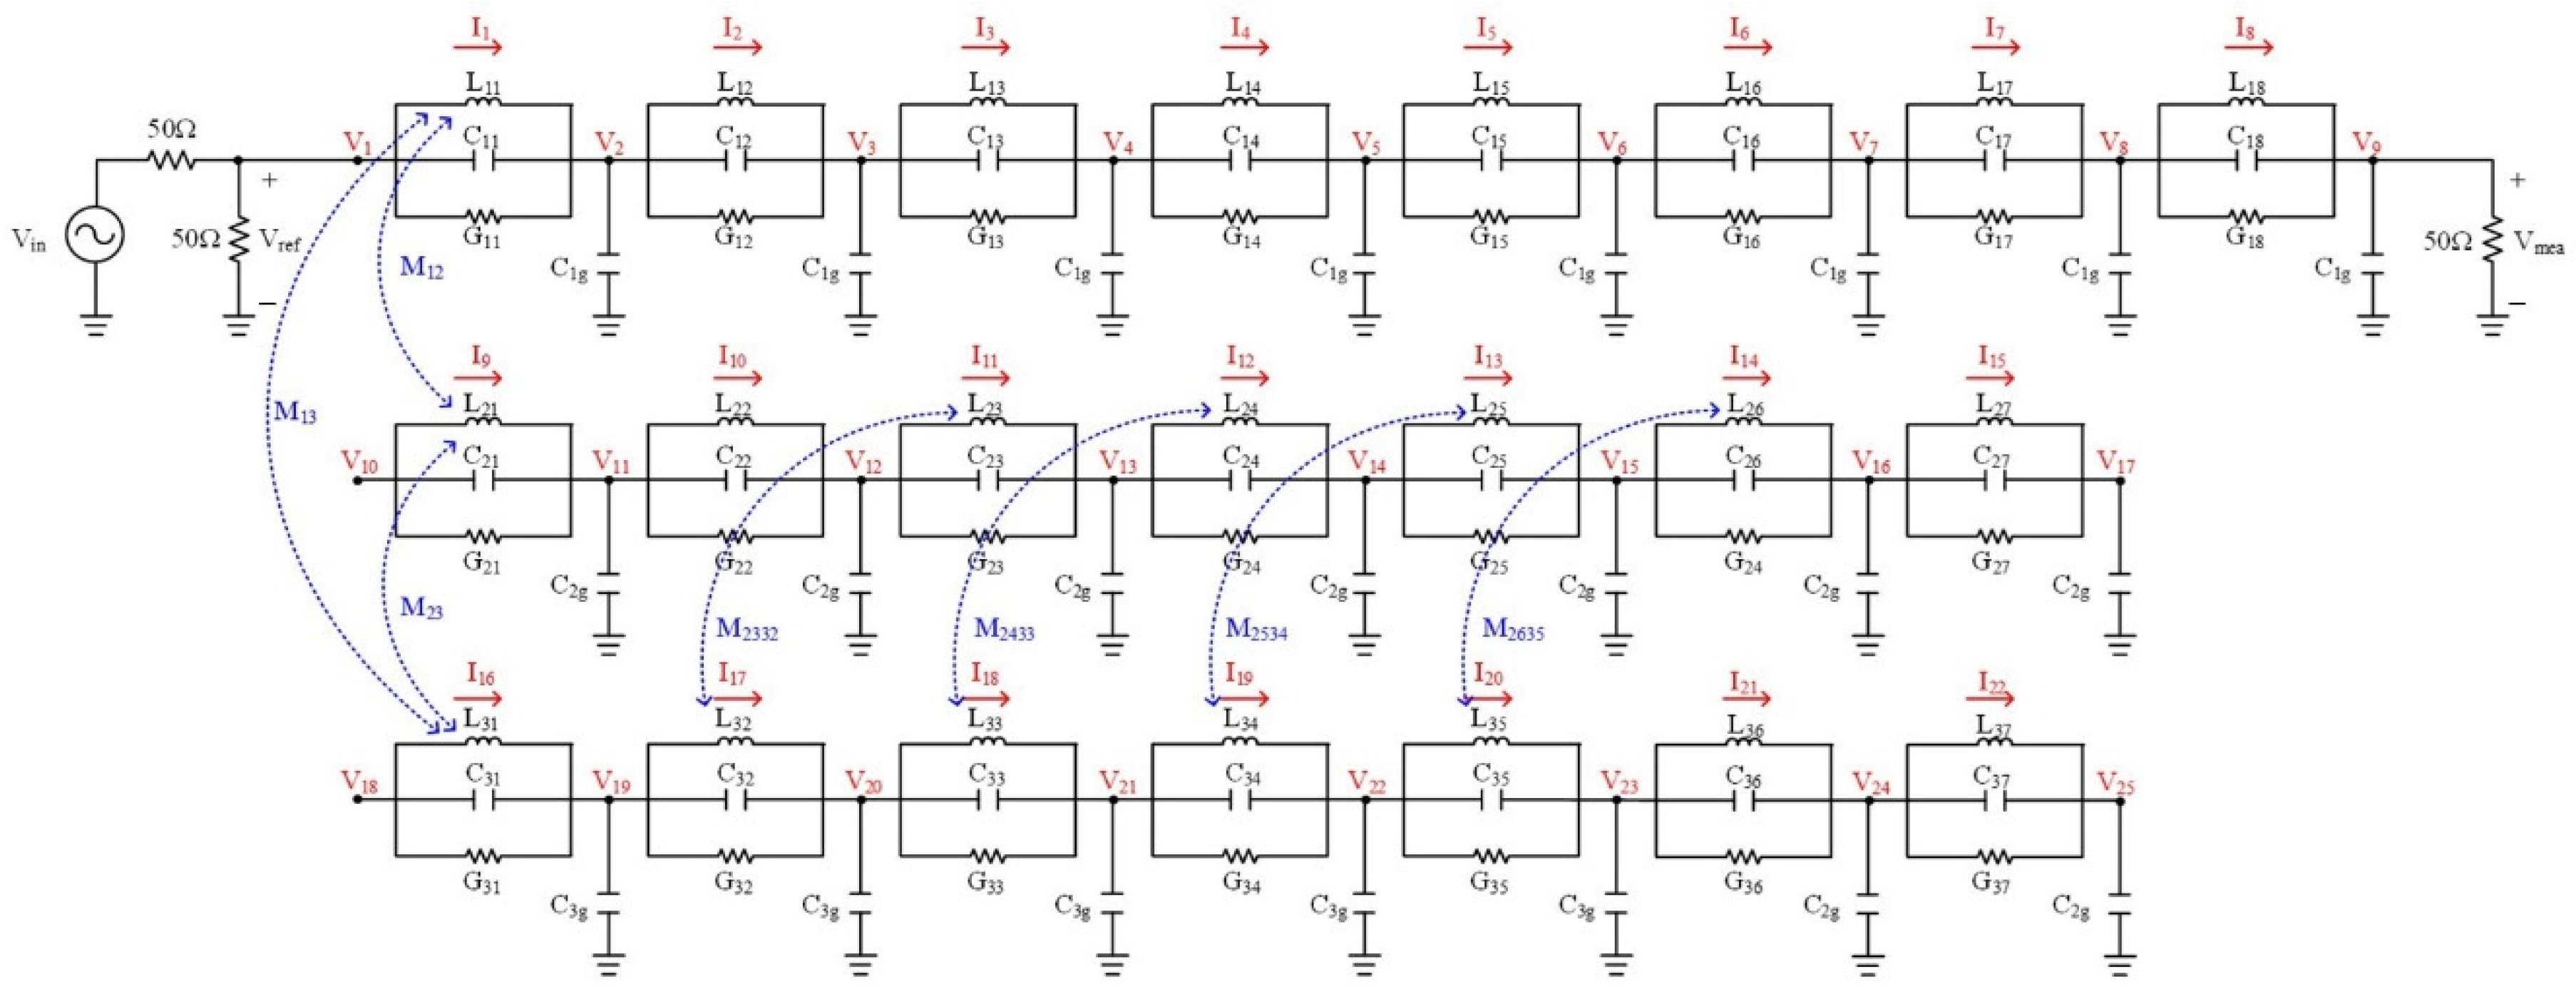
14] designed a two-winding model with mutual magnetic coupling. However, although three-winding transformers are widely used in practice, few three-winding transformer models have been studied. A comprehensive three-winding model with mutual magnetic coupling is required for credible simulations with the model. In this sense, this work focuses on a three-winding transformer model.
A high-frequency transformer model with lumped R, L, and C components is usually modeled by circuit analysis programs, such as MATLAB/Simulink, electromagnetic transients program (EMTP), or PSpice [
12]. In addition, the state-space method has also been used to analyze the circuit [
11,
15]. The state-space method is an efficient approach that calculates the transfer function of the model and conducts frequency response analysis (FRA).
The R, L, and C components of a high-frequency transformer model cause resonance phenomena, and FRA results sufficiently reflect this phenomena. The typical FRA for power transformers is sweep frequency response analysis (SFRA), which measures frequency responses ranging from approximately 20 Hz to 20 MHz. The SFRA is commonly used for transformer fault diagnosis based on distortion observation. In [
3], the normal and fault states were compared using FRA, and the authors of [
4] simulated the FRA on the high-frequency transformer model by changing various parameters. Similarly, [
8] observed the relationships between parameters and frequency responses and then compared the FRA results of normal and fault states. In [
6], impulse tests and fast Fourier transform were conducted for the FRA. In [
7], the authors used driving-point impedance for transformer parameter estimation. In [
5,
12,
13,
14,
16,
17,
18,
19,
20], SFRA data was used to detect the deformation or fault of a power transformer. The core diagnosis based on SFRA was covered in [
5]. In [
12], the authors first observed the relationships between parameters and frequency response and then analyzed frequency response in fault conditions. In [
13,
14,
17,
19], the SFRA was used to diagnose interturn faults such as short-circuit faults and winding deformation. The authors of [
21] presented a comprehensive, detailed review of the transformer FRA, including test methods, objectives, structures, and results. In [
5,
7,
9,
10,
14,
17,
18,
19,
20], methods that calculate magnetic deformation using structural or physical analysis were presented with the comparison of normal and fault states via graphs.
As aforementioned, frequency or magnetic analysis of power transformers can be used to detect transformer faults. In other words, modeling of a power transformer and parameter estimation using FRA is practicable because FRA results based on a high-frequency model represent transformer characteristics well. Therefore, this paper proposes a high-frequency transformer model and an efficient parameter estimation method based on SFRA data. Based on the high-frequency model, SFRA results are calculated and then compared with measured SFRA data. The parameters can be estimated to make the calculated SFRA results identical to the measured ones. Ultimately, the transformer model should reflect resonances in the frequency domain, and the state-space equations need to be developed for efficient FRA simulation.
Existing modeling methods require a long computation time and large amounts of data, including specific structural or physical data [
9,
10,
11,
17,
20]. In [
9,
10], the authors estimated transformer parameters by analyzing transformer structures and calculating the deformation of turns. The authors of [
11,
17] used the finite element method based on electromagnetics and structural mechanics data to model and analyze the transformer. In [
20], 3D structures and schematic diagrams were used to design a high-frequency equivalent circuit of a transformer. The proposed method of this paper takes a shorter time to estimate transformer parameters than the previous works because the method uses simple SFRA data rather than detailed transformer structural and physical data.
The rest of this paper is as follows. In
Section 2, a three-winding transformer model is proposed, and a parameter estimation method based on the model is introduced in
Section 3. Then,
Section 4 presents case studies with an actual 154kV single-phase three-winding transformer. Finally, the paper is concluded in
Section 5.
3. Parameter Estimation Process Based on SFRA
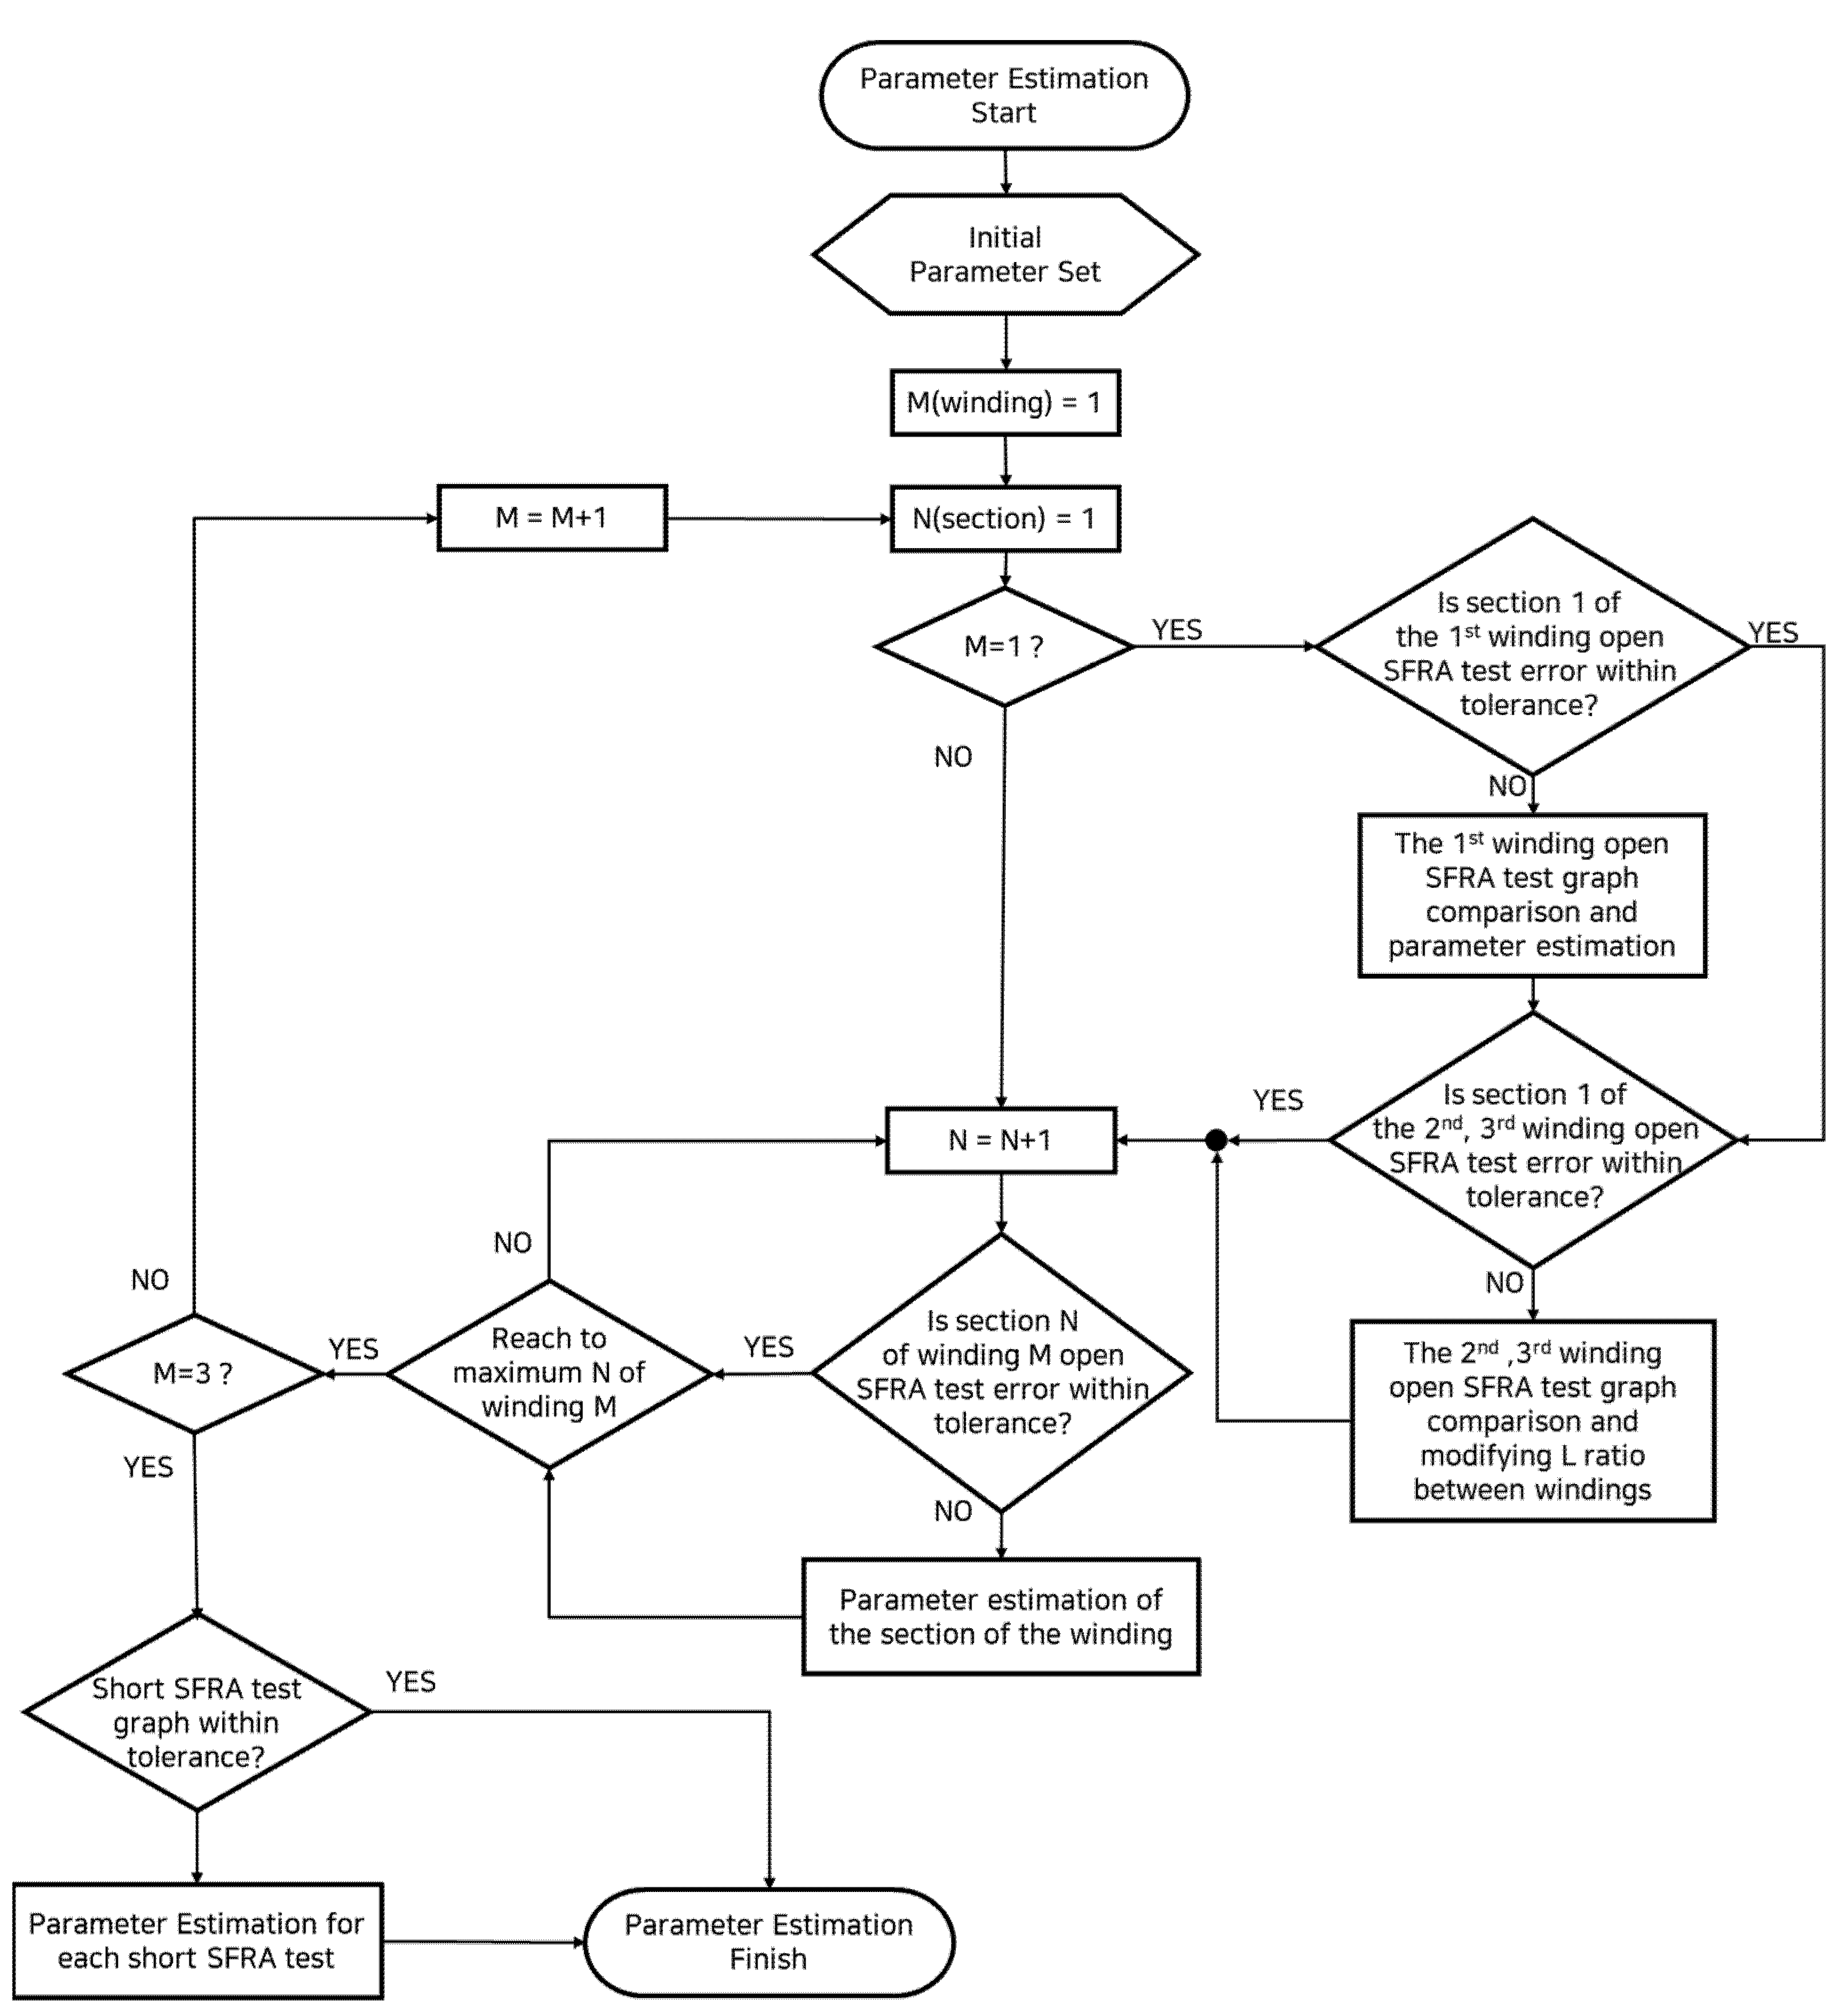
The process of estimating parameters via matching the measured and simulated SFRA data is summarized in
Figure 3.
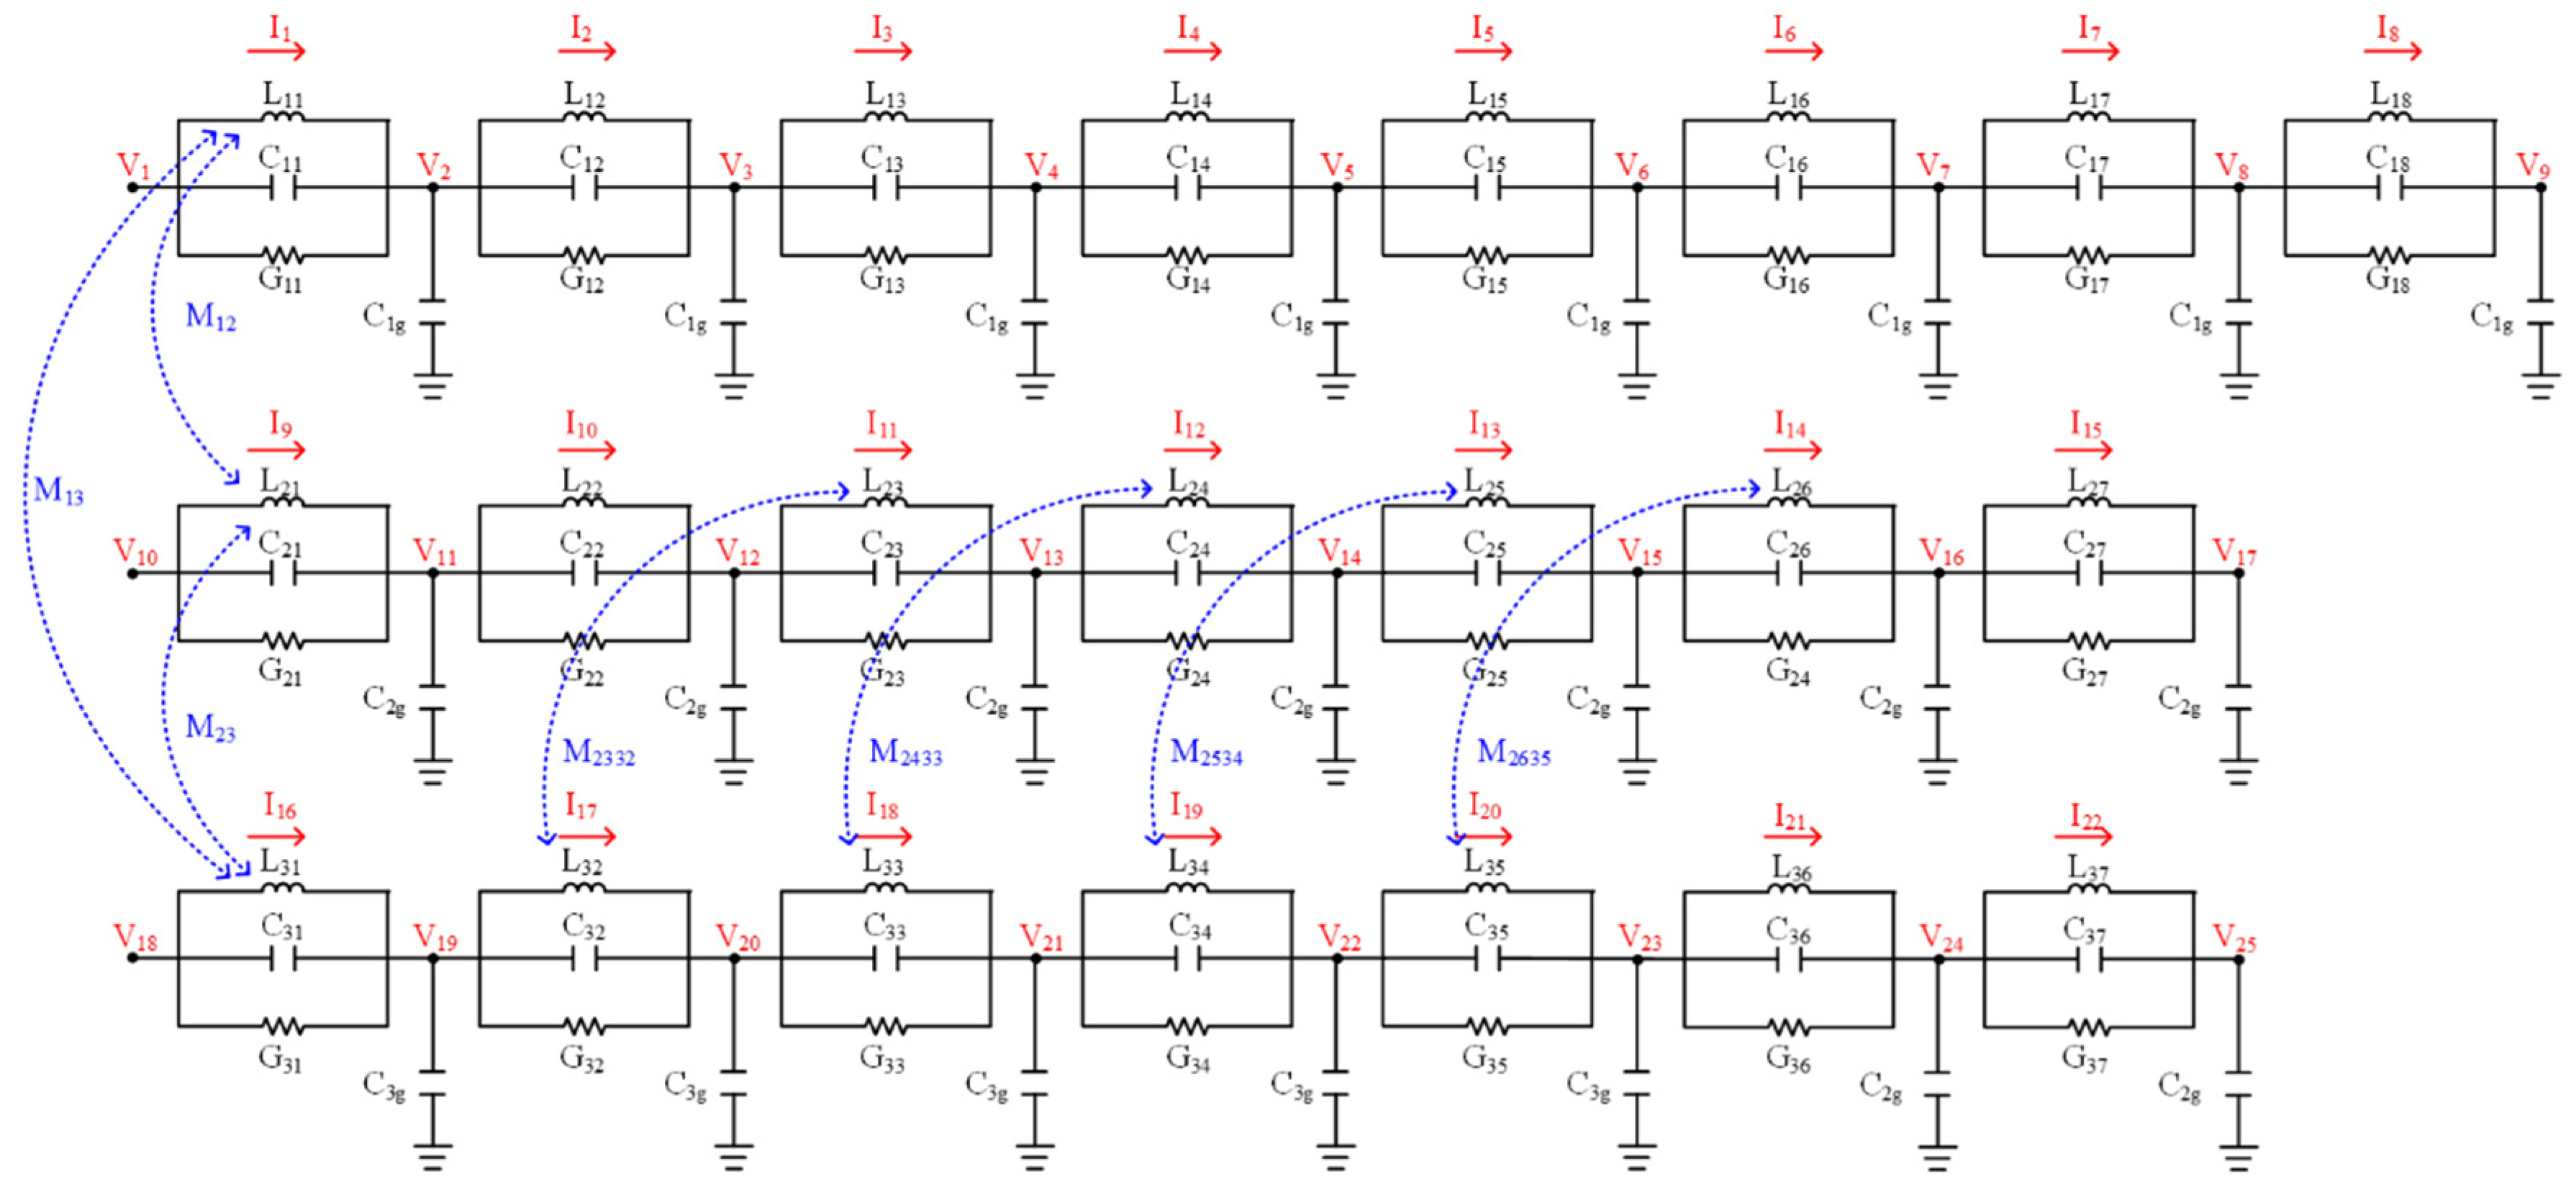
The measured SFRA of the real transformer is compared with the simulated frequency response of the proposed transformer model, and the estimation process aims to improve the consistency of the two SFRA. The process begins from the appropriate initial parameters of the proposed model, which are fit to the comparison SFRA graph. If any three-winding transformer has SFRA data, the above parameter estimation process can be applied based on the proposed model, such as
Figure 2.
The more winding sections in the transformer circuit model located to the right, the more the high-frequency response is involved. For the first section of the first winding, modifying L, C, and G values in that section affects the first resonance point of all six SFRA tests as other windings consider magnetic coupling. Therefore, a frequency response comparison is initiated in the first winding measurement open-circuit test. The first section parameters of the first winding should be corrected to align with the first resonance point of the first winding measurement open-circuit test. Besides, determining the ratio of the first, second, and third winding L values, according to the ratio of the frequency response magnitude, allows the first resonance point of all first, second, and third winding opening tests to be aligned.
Next, the parameters of the remaining sections, except for the magnetic coupling section, should be modified values for each section according to the resonant frequency and magnitude of each winding open-circuit test. For example, if the operator tries to align the third resonance point of the second winding, the operator should change the L, C, and G values in the third section of the second winding and compare the SFRA graphs.
Finally, the last process is comparing SFRA short test results. The operator modifies the values of the mutual coupling coefficient (k) and shunt capacitance
to align the frequency response graph of the model with the actual SFRA data. The open-circuit test SFRA graph and the short test SFRA graph should be compared and selected to minimize the error between the two SFRA. The effect of each parameter on frequency response is summarized in
Table 1. Based on
Table 1, it is possible to estimate the transformer parameter by modifying the parameters of each section and comparing measured SFRA data and the simulated SFRA of the model.
4. Case Study
According to the parameter estimation process in
Figure 3, the proposed parameter estimation method first applies to one winding parameter and then to the other windings. For this parameter estimation, the effects of each parameter on frequency response are investigated. Then, estimation results for an integrated three-winding model are presented.
As mentioned in
Section 2, the state equations should be constructed for efficient parameter estimation. After building state-space equations from the model, MATLAB is used to obtain the transfer function and perform the FRA. Then, parameters are estimated using the state-space equations.
As performance metrics, the root mean squared error (
RMSE) and mean absolute error (
MAE) are used as follows:
where
N is the number of frequency samples, and
and
denote the magnitude of simulated and measured SFRA, respectively.
4.1. Single-Winding Model Parameter Estimation of a Single-Phase Transformer
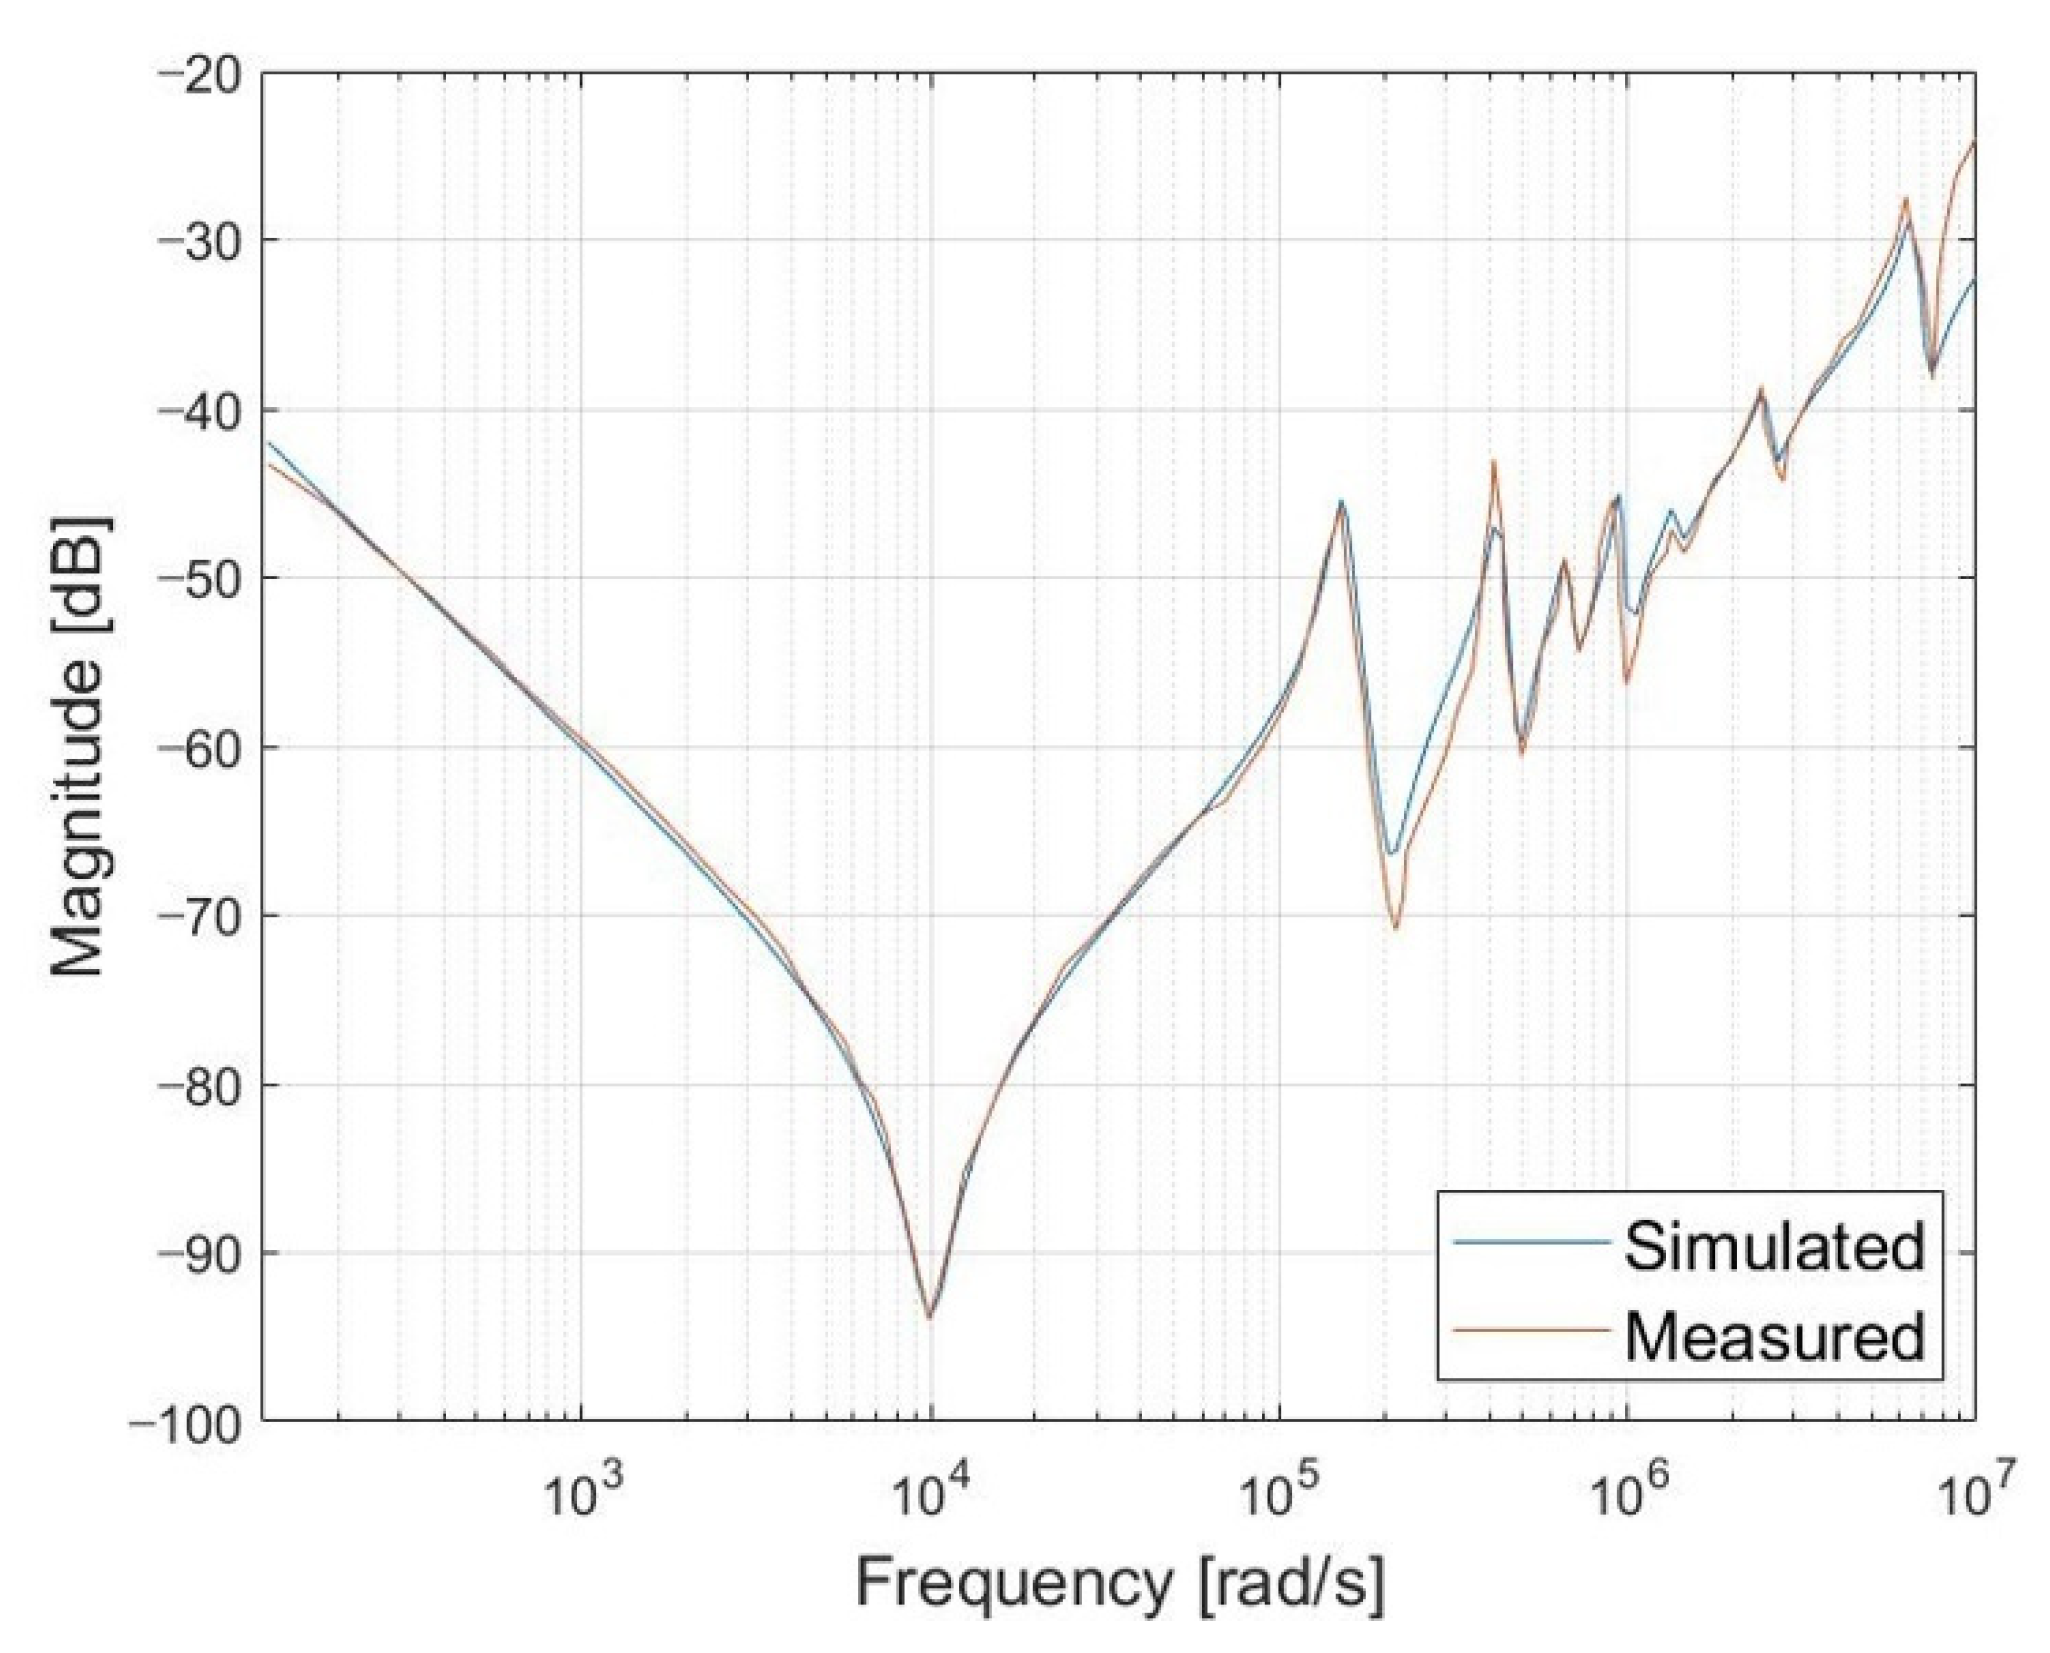
This section presents the estimation results of single-winding model parameters of a single-phase transformer, using SFRA data measured from an open-circuit test of a 154 kV single-phase transformer manufactured by LS Electric. To determine the effectiveness of frequency response for each parameter in the transformer when only a single winding is presented, the parameters of other windings and mutual coupling are not considered. The single-winding model makes it relatively easy to estimate parameters because it has repetitive structures of unit sections without mutual coupling. After the parameter estimation of the single-winding model, the SFRA results of the open-circuit test simulation are compared with those of the actual field test, as shown in
Figure 4.
Quadratic resonances occur in each section of the single-winding model. There are eight anti-resonances and seven resonances within the frequency range shown in
Figure 4. The model parameters are estimated by resonance frequency, width, and magnitude at each section based on
Table 1. From the full frequency range of 120 rad/s to 1 Mrad/s in
Figure 4, the RMSE is 2.5881 dB, and the MAE is 1.8446 dB. For 154 kV transformers, frequency responses from 20 kHz to 20 MHz are utilized for fault verification using SFRA [
16]. However, the frequency response in the high-frequency domain is not important when simulating a transformer model to the power system. When using SFRA data for transformer faults detection, the frequency range below 2 kHz determines the deformation and movement of the transformer steel core, and the 2 kHz to 20 kHz range determines the deformation and movement of the windings in the transformer. The 20 kHz to 2 MHz range is the discriminant range for transformer structures, and frequencies greater than 2 MHz are the frequency response area according to the connection and ground state of the SFRA measuring instrument [
22]. Thus, the target in this simulation and modeling is an iron core and magnetic coupling between transformer windings. Therefore, only the frequency domain below 20 kHz is an important range in the proposed method that uses SFRA. As a result, the RMSE is 0.7127 dB and MAE is 0.5569 dB in the frequency range below 20 kHz.
While the existing FEM method [
11] resulted in the MAE of 1.9782 dB for a single-winding model in the frequency range from 100 Hz to 1 MHz, the MAE in the proposed method was 1.4654 dB in the same range of frequency. This comparison implies that the proposed method can estimate parameters more accurately than the FEM method.
4.2. Three-Winding Model Parameter Estimation of a Single-Phase Transformer
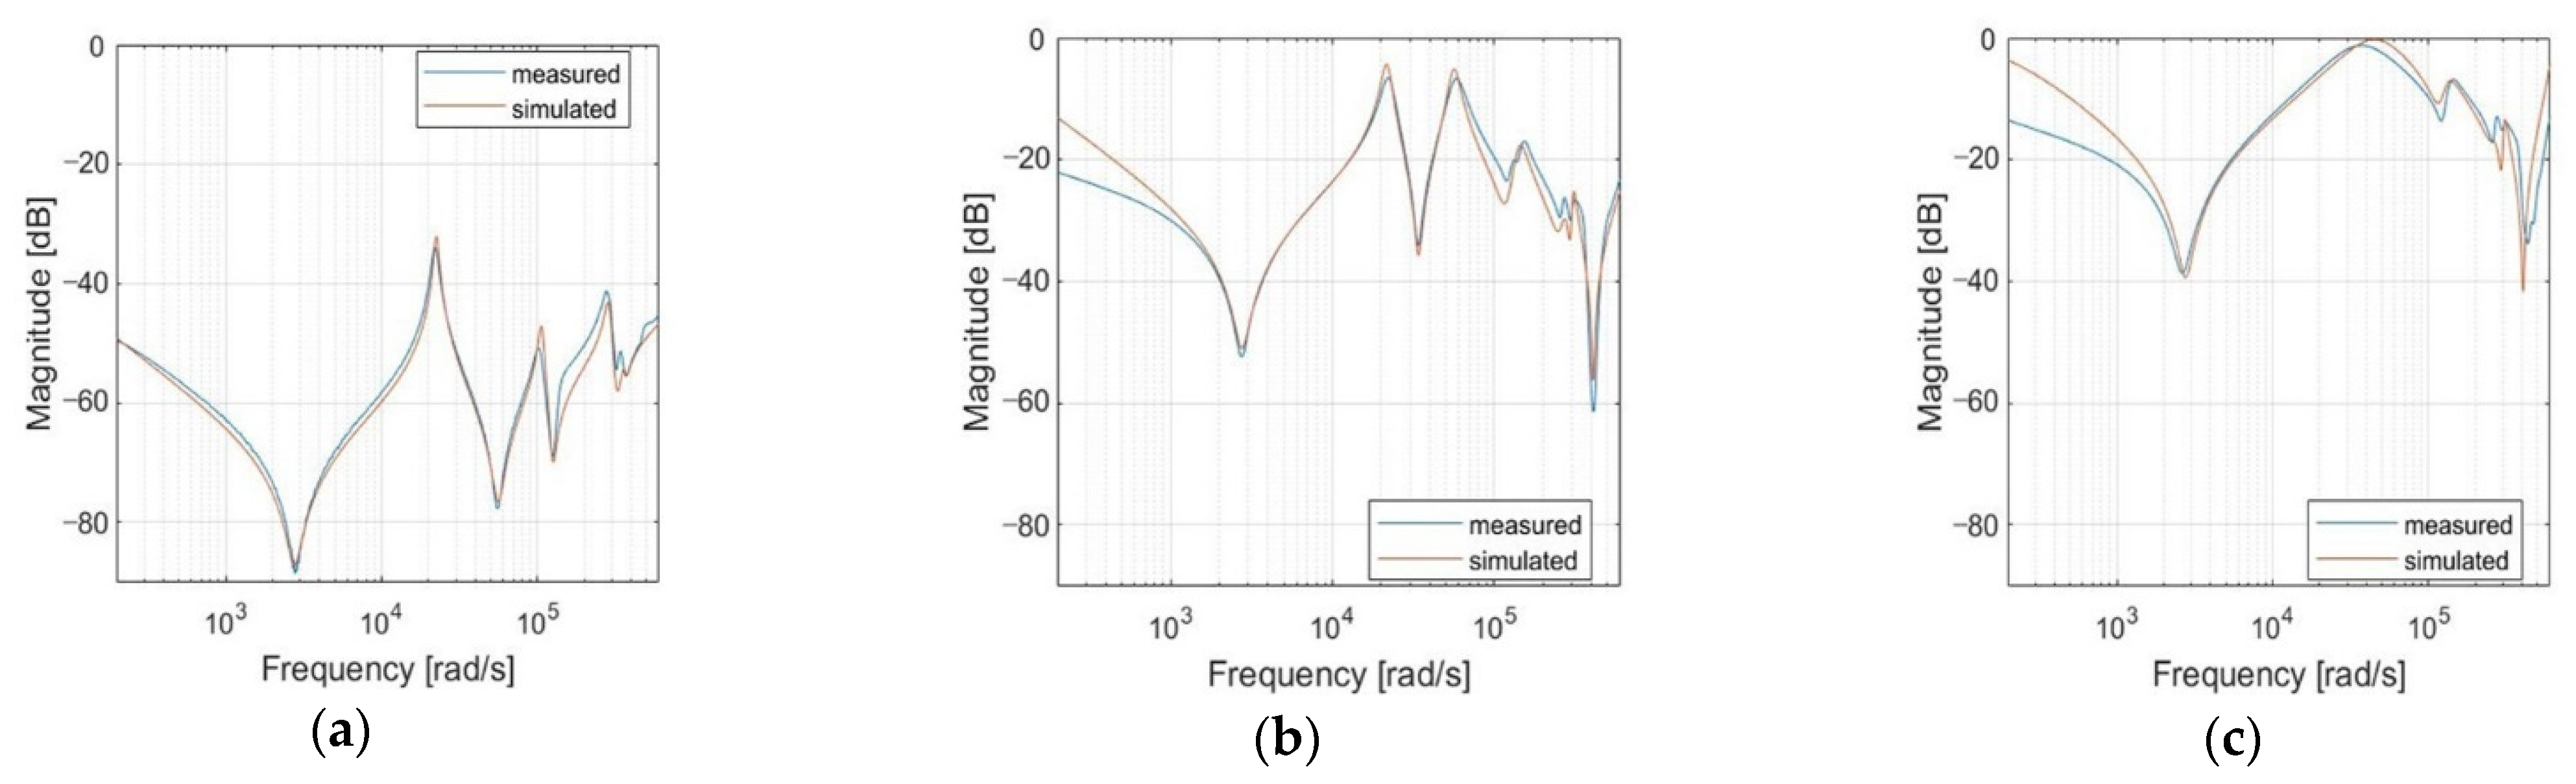
In this section, the methodology used in the parameter estimation of the single-winding model is applied to a three-winding integrated transformer model. For the parameter estimation of the three-winding model presented in
Figure 2, six frequency response tests should be implemented as described in
Table 2. In the end, the estimated model should meet all six tests at once.
Figure 5 presents the parameter estimation result of the three-winding model, indicating that the simulated SFRA curves correspond well with the measured one for the first winding. However, for the second and third windings, the parameter estimation results are not good below 1000 rad/s. This is largely because the first winding parameters were first estimated, and then the second and the third ones were done sequentially; note that the three windings are coupled magnetically. That is, estimation results were biased towards increasing the estimation accuracy of the first winding parameters. These estimation errors can be reduced by more sophisticated structures of RLC sections and thorough estimation than the proposed approach, which is a target of future research.
Table 3 lists the RMSE and MAE of SFRA open-circuit tests for the entire frequency range of SFRA, and
Table 4 presents the RMSE and MAE of the same tests for the frequency range under 20 kHz. It can be observed from
Table 3 and
Table 4 that the proposed method can provide more accurate estimation results under 20 kHz, where the deformation and movement of steel cores and windings are dominant factors for forming SFRA curves.
5. Conclusions
This paper proposes a new parameter estimation scheme for the three-winding transformer model, using an SFRA test, which has widely been used to detect transformer deformation or short-circuit conditions. For the estimation, a single model of a three-winding transformer, which is comprised of a proper combination of repetitive RLC sections, is created and used. The proposed estimation method has the following major contribution. The traditional parameter estimation of transformers is based on the physical and structural information of transformers, which requires a thorough analysis of their electromagnetics and structural mechanics. In comparison, the SFRA-based method uses simple SFRA measurement data, which reflect physical characteristics of transformers, and then estimates circuit parameters directly. In the end, the proposed approach does not need any measured magnetics data or transformer structural data, and therefore the estimation process can be quick and straightforward. Moreover, unlike the previous works considering single- or two-winding models only, this work dealt with a three-winding transformer model. For validation, actual field SFRA data of a 154 kV three-winding power transformer was tested, and then transformer model parameters were estimated. Finally, it can be concluded that the transformer parameter estimation was successful since SFRA data simulated with the estimated model almost matches the measured data.
The estimation developed in this work can be applied to any transformer model. Ultimately, the transformer model should be modified with a proper combination of RLC sections and mutual inductances, which is then followed by new SFRA tests. Then, based on the test measurement data, transformer parameters can be estimated.
For the stability and efficiency of the power grid, it is important to simulate a power device on a computer to model power apparatuses and estimate their parameters. Based on our new model and parameter estimation method for transformers, we expect to contribute to the advancement of power system operational technologies through the additional impulse test of transformers or other power facility linkages. Advanced technologies, such as optimization and parameter estimation through machine learning, will further improve the parameter estimation accuracy of transformer models.


 ,
, 

