Article

Grinding Behaviour of Microwave-Irradiated Mining Waste

by
Sefiu O. Adewuyi
* and
Hussin A. M. Ahmed
Mining Engineering Department, King Abdulaziz University, Jeddah 21589, Saudi Arabia
*
Author to whom correspondence should be addressed.
Energies 2021, 14(13), 3991; https://doi.org/10.3390/en14133991
Submission received: 12 April 2021 / Revised: 24 June 2021 / Accepted: 28 June 2021 / Published: 2 July 2021

Abstract

:
The combined microwave-assisted sorting and microwave-assisted comminution of minerals has been proposed to reduce the huge grinding energy consumption in mineral processing. However, gangue minerals would be discarded after the sorting process despite the microwave energy absorbed during their treatment. Therefore, this paper investigates the effect of microwave pretreatment on the Bond work index (BWI) of quartz and calcite samples, as they represent the dominant gangues in many ores and are key inputs in the cement industry, which requires intensive grinding. The samples were characterized using a scanning electron microscope coupled with energy dispersive X-ray (SEM-EDX), and Fourier transform infrared (FTIR) and X-ray diffraction (XRD) methods. The BWIs of the two samples were determined before and after the microwave treatment (2.45 GHz, 1.7 kW) at 2, 4 and 6 minutes. SEM image analyses of the untreated and microwave-treated samples were performed using ImageJ software. The results showed that after 4 minutes of radiation treatment, the BWI of the studied quartz was reduced by 13.83%, while that of the calcite increased by 15.59%. The results of the SEM image analysis indicated that the quartz developed more cracks than the calcite under the same microwave treatment conditions. Based on these findings, microwave pretreatment is suitable to reduce the grinding energy of the studied quartz, but offers no energy-saving benefit to the studied calcite.

Graphical Abstract

1. Introduction

In the mineral industry, grinding is used to liberate valuable minerals from their associated gangues, and to obtain the suitable particle size required for subsequent beneficiation unit operations [1]. The process is an energy-intensive operation that accounts for 50–70% of the total energy consumption in the mining and cement industries, equivalent to about 5% of the global energy consumption [2]. Despite the huge electrical energy input into grinding machines, only approximately 1% of this energy is used for mineral size reduction, and the rest is dissipated into heat and noise [2,3]. For the mining industry, declining ore grades and fine mineral-gangue dissemination increases the energy consumption during the grinding process [4], making mineral characterization and separation difficult [5,6], and consequently increase tailing [7]. Meanwhile, for the cement industry, the increasing global demand for cement leads to greater energy requirements in grinding [8,9]. In addition, there is high pressure on industries to reduce their energy consumption to curb the increasing greenhouse gas emissions from energy-generating plants [10].
In order to reduce comminution energy consumption, different pretreatment techniques have been studied, e.g., chemical additives [11,12], magnetic pulses [13], high voltage electrical pulses [14,15], bio-milling [16], ultrasonic [17,18], thermal via furnace [19,20], radio-frequency [21] and microwave [22,23]. A review of these techniques has been presented in the literature, where it was concluded that microwave pretreatment could be targeted for mining industrial applications [2]. Microwave pretreatment has been studied in two ways: microwave-assisted sorting and microwave-assisted grinding [24]. The former has been demonstrated to reduce the rock to be comminuted by about 30%, by sorting the gangues from the targeted minerals after microwave treatment [25], while some of the previous studies on the latter approach are presented in Table 1. It can be observed that microwave-assisted grinding improves the grindability of all minerals/ores, with the exception of the copper ore selected from Turkey [22]. Apart from this, Bobicki et al. (2018) discussed that microwave pretreatment of the ultramafic nickel ore selected from Canada caused adverse effect on its grinding behaviour [26]. Their findings showed that 80% passing size of product increased from 19 µm (without microwave treatment) to 148 µm after microwave treatment (100 g, −2+1 mm, 2.45 GHz, 1000 W, 4 min) of the ore [26].
Recently, researchers have suggested that both microwave-assisted sorting and microwave-assisted grinding can be combined to form a single operation for mining industrial applications [35]. In such a case, only one microwave set-up will be incorporated into the existing mining beneficiation circuits (Figure 1); hence, this is referred to as “combined microwave-assisted comminution and sorting” [35]. After the ore excavation and crushing operations to a pre-determined size distribution (which may be studied prior to beneficiation), the crushed ore will be subjected to microwave radiation, so that gangue minerals can be separated from the targeted minerals on the basis of their response to microwave treatment, using the microwave-assisted sorting technique (Figure 1) [24]. The gangues and targeted minerals are labelled “Reject” and “Accept”, respectively (Figure 1). The latter will be ground for further processing using ball mills, while the former is waste. These operations may reduce the energy requirement in comminution by up to 70% [24]. However, the gangue minerals (“Reject”, mining wastes; Figure 1) would be discarded despite the energy absorbed during the microwave treatment [24]. Some gangue minerals in the mining industry, such as calcite and quartz, are targeted for other industrial applications—for example, cement and construction industries—that also required huge energy for raw material grinding. If the microwave energy absorbed by quartz and calcite improve their grinding behaviour, they may be used for cement production without further microwave treatment (Figure 1). This may lead to future collaboration between the mining and cement industries for better resource sustainability.
The application of microwave technology in the cement industry has been performed for the calcination of limestone [37] and flyash (with about 51% quartz content) [38]. It was found that microwave calcination required lower temperatures, takes less processing time to produce the same quality product compared to the convectional approach, and may therefore reduce the overall energy required for cement production [9,37]. Hartlied and Grafe (2017) studied the effect of microwave pretreatment (2.45 GHz, 24 kW, 30 s) on the cutting behaviour of granite (27% quartz content) [39]. It was found that the cutting force was reduced by 10% after microwave treatment [39]. It was not known whether the cutting force of granite may be reduced further after 30 s microwave treatment, and the energy consumption of the microwave was not considered in the understanding of whether an improvement in the cutting force translates to a reduction in the cutting energy [39]. Wang et al. (2000) studied the microwave-assisted comminution of quartz (−9.50 + 4.74 mm) and limestone (−9.50 + 4.74 mm) by comparing the untreated and microwave-treated (2.45 GHz, 7 kW, 10 min) samples using the breakage function approach [40]. Their findings showed that the specific rate of breakage of quartz increased from 0.3804 to 0.5069 min−1 after microwave treatment (7 kW, 10 min), while that of limestone increased from 0.2989 to 0.3331 min−1 under the same microwave treatment and grinding conditions [40]. However, the grinding energy saving due to the microwave radiation treatment was not estimated [40]. Recently, the effect of microwave radiation on the grinding behaviour of limestone was performed [41]. The results indicated that microwave-treated (2.45 GHz, 180 W, 5 min) limestone samples (−2.36 + 1.18 mm) showed an improvement in their grinding behaviour, adjudged based on the particle size distribution of the untreated and microwave-treated samples [41]. Nothwithstanding, neither author considered the effect of microwave radiation treatment time on the grinding behaviour of the studied samples, nor was the effect of microwave energy on the mineral phases in the studied limestone samples studied. To the best of our knowledge, the influence of microwave radiation on the grinding behaviour of quartz and calcite is limited in the literature. The grinding behaviour of minerals and their energy requirements are usually estimated using the industrial standard Bond work index (BWI) method. Hence, this paper aims to investigate the effect of microwave radiation on the Bond work index of quartz and calcite rocks as an indicator of their amenability to grinding.

2. Materials and Methods

2.1. Sample Collection, Preparation and Characterization

Two rock samples were used in this study. The first one (labelled S1) was collected from the Al Masane Al Kobra (AMAK, Nejran, Saudi Arabia) mining company, while the second (labelled S2) was collected from the Yanbu cement company (Ras Baridi, Saudi Arabia). Both samples consisted of a mixture of cobbles (8–29 cm) and boulders (30–40 cm). The average moisture content of the samples were 0.07% and 0.13%, with standard deviations of 0.0277 and 0.0075 for S1 and S2, respectively.
In order to perform the Bond ball mill grindability tests, samples S1 and S2 were prepared using the same approach. The primary and secondary crushing operations were performed using a laboratory jaw crusher (BB300 Mangan Retsch, Retsch-Allee Haan, Germany) and a roll crusher (Sew-Eurodrive GmbH & Co KG, Bruchsal, Germany), respectively, until 100% passed a size 3.35 mm sieve [22]. The coning and quartering method was used to divide the homogenous product into sub-samples of 5 kg each. A mechanical riffle splitter (KHD Humboldt Wedag AG, Cologne, Germany) was used to obtain appropriate samples for the particle size analysis. Eight sieve sizes of 3150, 2500, 2000, 1400, 1000, 600, 106 and 75 µm were selected for this analysis, as the particle size of the samples were distributed within these sieve sizes. The sample was placed on the upper sieve (3150 µm) and dry screened using a laboratory electric sieve shaker (AS 200, Retsch, Retsch-Allee Haan, Germany). The mass retained on each sieve was recorded against the sieve size, and the cumulative passing was calculated and recorded. Graphs of the particle size against the cumulative percentage weight passing were plotted to determine the 80% passing size (F80).
For the sample characterizations, field emission scanning electron microscope (FESEM) coupled with an energy dispersive X-ray (EDX), Fourier transform infrared spectroscopy (FTIR), and X-ray diffraction (XRD) methods were employed. The FESEM-EDX was used to determine the elemental compositions in the untreated samples. Meanwhile, FTIR and XRD were employed to identify the molecular compositions and mineral phases in the samples, respectively, before and after microwave treatment. In order to achieve these, the sample obtained by a mechanical riffle splitter (KHD Humboldt Wedag AG, Cologne, Germany) was ground in a laboratory ball mill using a roller machine (Sew-Eurodrive GmbH & Co KG, Germany) until 100% of the sample was below an 80 µm sieve size. The powder sample was thoroughly mixed, and a specimen was taken for characterization purposes. For the elemental composition, a powder sample (without coating) was placed on the carbon tape fixed on the stub [42]. The stub was then placed into the sample chamber where the electron beam from the FESEM (JSM-7600F, JEOL Ltd., Musashino, Akishima, Tokyo, Japan) illuminated the sample to capture the image (taken at a low voltage of 5 kV to avoid over charging of the sample), and the peak intensities corresponding to different elements at specific energy levels were recorded by the EDX spectrometer (EDX, Oxford instruments, Abingdon, United Kingdom) [42]. The average value of each element was calculated and recorded based on four iterated values obtained the using normalized processing option. The FTIR spectrometer (Nicolet iS50 FTIR, Thermo Fisher Scientific, USA) was used to generate the FTIR spectra of the samples (powder form, without coating) between 4000 and 400 cm−1 in the transmittance mode. For the XRD analysis of both samples (S1 and S2), an X-ray diffractometer (Regaku, Ultima 1V, Japan) with Cu kα radiation (40 kV, 40 mA) was employed to scan the samples in continuous mode, and the XRD results were recorded at a scattering angle of 2θ in the range of 5° to 80° at a step of 0.05°. The ASCII PDF-2 card published by the International Centre for Diffraction Data (ICDD, Campus Blvd, Newtown Square, PA, USA) was used to match and confirm the diffraction peaks with the minerals present in the samples [43].

2.2. Microwave Treatment

The microwave treatment of the prepared representative samples (−3.35 mm) was performed using a commercial multimode microwave oven (Amana RC17S2, 2.45 GHz, power output up to 1.7 kW, 553 Benson Road, Benton Harbor, MI 49022, USA). The oven has a variable power level from 10% to 100% (at 10% increments), such that at 100%, the oven generates power continuously, while at the other microwave power levels the power is delivered in pulses, depending on the preset value [44]. The representative samples were placed on the floor of the microwave cavity, forming beds of 331 × 330 × 35 mm and 331 × 330 × 37 mm dimensions for S1 and S2, respectively (by leaving 50 mm from the oven door). The difference in the samples’ height between S1 and S2 was due to the lower pack density of sample S2. The sample was separately exposed to microwave radiation (at 100% power level, 1.7 kW) at different residence times (2, 4 and 6 min). After the required radiation exposure time was reached for each sample, the microwave oven was turned off and an infrared thermometer (Habotest HT650B, 0–550 °C, accuracy: ±3 °C, Dongguan, China) was used to promptly measure the final bulk temperature of the sample. The sample was then cooled to room temperature [22]. The microwave treatment test was repeated three times using other representative samples, and the average temperature was calculated. This procedure was repeated for the second sample (S2). Further microwave treatments of the samples after 6 minutes showed no significant changes in temperature; therefore, the effect of microwave pretreatment on the grinding behaviour of samples S1 and S2 was studied at 2, 4 and 6 minutes radiation exposure times. In order to observe the effect of microwave radiation on the mineralogy and microstructure of the studied samples, FTIR, XRD and SEM analyses of untreated (UT) and microwave treated (MWT) samples were performed.

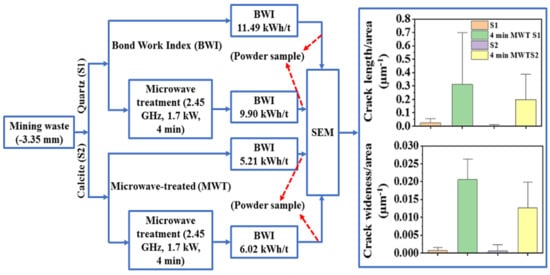
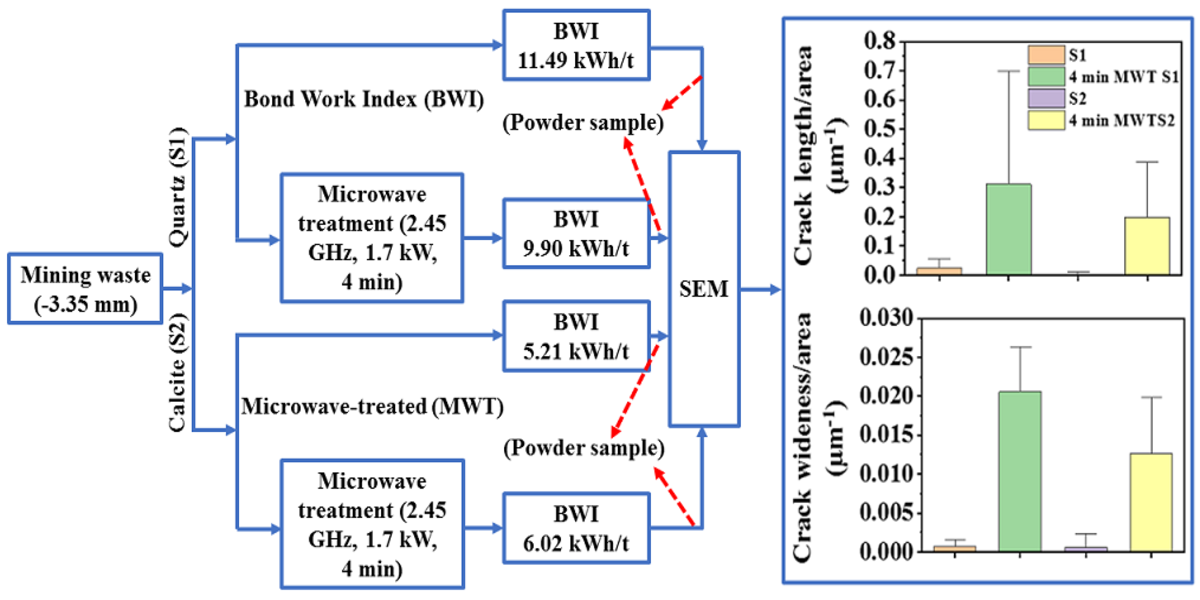
2.3. Bond Ball Mill Grindability Test

The Bond ball mill grindability test is usually conducted to determine the Bond work index of ores. The method is considered to be the industrial standard to estimate the comminution energy requirement. The index is widely used in the mineral industry for the comparison of a material’s resistance to ball milling. It is also used for the determination of the energy required for ball milling and for the scaling up of comminution operations [45]. Hence, the method was considered for the two studied samples. A mechanical riffle splitter was used to subdivide a 5 kg homogeneous sample until a mass equivalent to 700 cm3 was obtained for the sample’s pack density. The average masses of five repeated experiments for S1 and S2 were 1282.5 g and 1114.43 g, respectively, with standard deviations of 0.2160 and 0.1670, respectively.
The mass of the representative sample equivalent to 700 cm3 was fed together with the 285 steel balls (having a total mass of 20, 125 g) [46] into the Bond ball mill (model 395-51, Bico Braun International, 116 Valhalla Drive, Burbank, California, USA) [46]. The ball mill was set to run for 100 revolutions, after which the balls and the product were discharged into the screen container. The steel balls were screened and properly cleaned before being fed into the mill for another run. The product was dry screened using a sieve test size of 106 µm and a number of grams per revolution; the grindability ( G b p ) was calculated. A mass equivalent to that of the undersize product was added to the recirculating load to form a feed for the next grinding cycle [47]. The number of revolutions for the next grinding cycle that was expected to give a 250% recirculating load was determined [22,47,48]. The procedure was repeated until the G b p was constant after at least five grinding rounds [49]. The Bond work index (Wi) was then calculated using equation 1 after the particle size distributions of the products were obtained [22,47]. The reproducibility of the results was investigated for untreated samples S1 and S2. A grindability test was also performed for each of the microwave-treated representative samples, S1 and S2.
W i = 44.5 P 1 0.23 G b p 0.82 10 P 80 10 F 80
where W i is the Bond work index (kWh/ton), P 1 is the sieve test size (μm), G b p is the ideal grindability (g/rev), P 80 is the 80% passing size (μm) of the undersize product and F 80 is the 80% passing size (μm) of the prepared feed (−3.35 mm).
Once the W i is determined, the comminution energy of the rock can be estimated using Equation (2).
W = 10 W i 1 Y 80 1 X 80
where W is the comminution energy consumption (kWh/ton), Y 80   is the 80% passing size (μm) of the required product, and X 80 is the 80% passing size (μm) of the as-received feed.

3. Results and Discussions

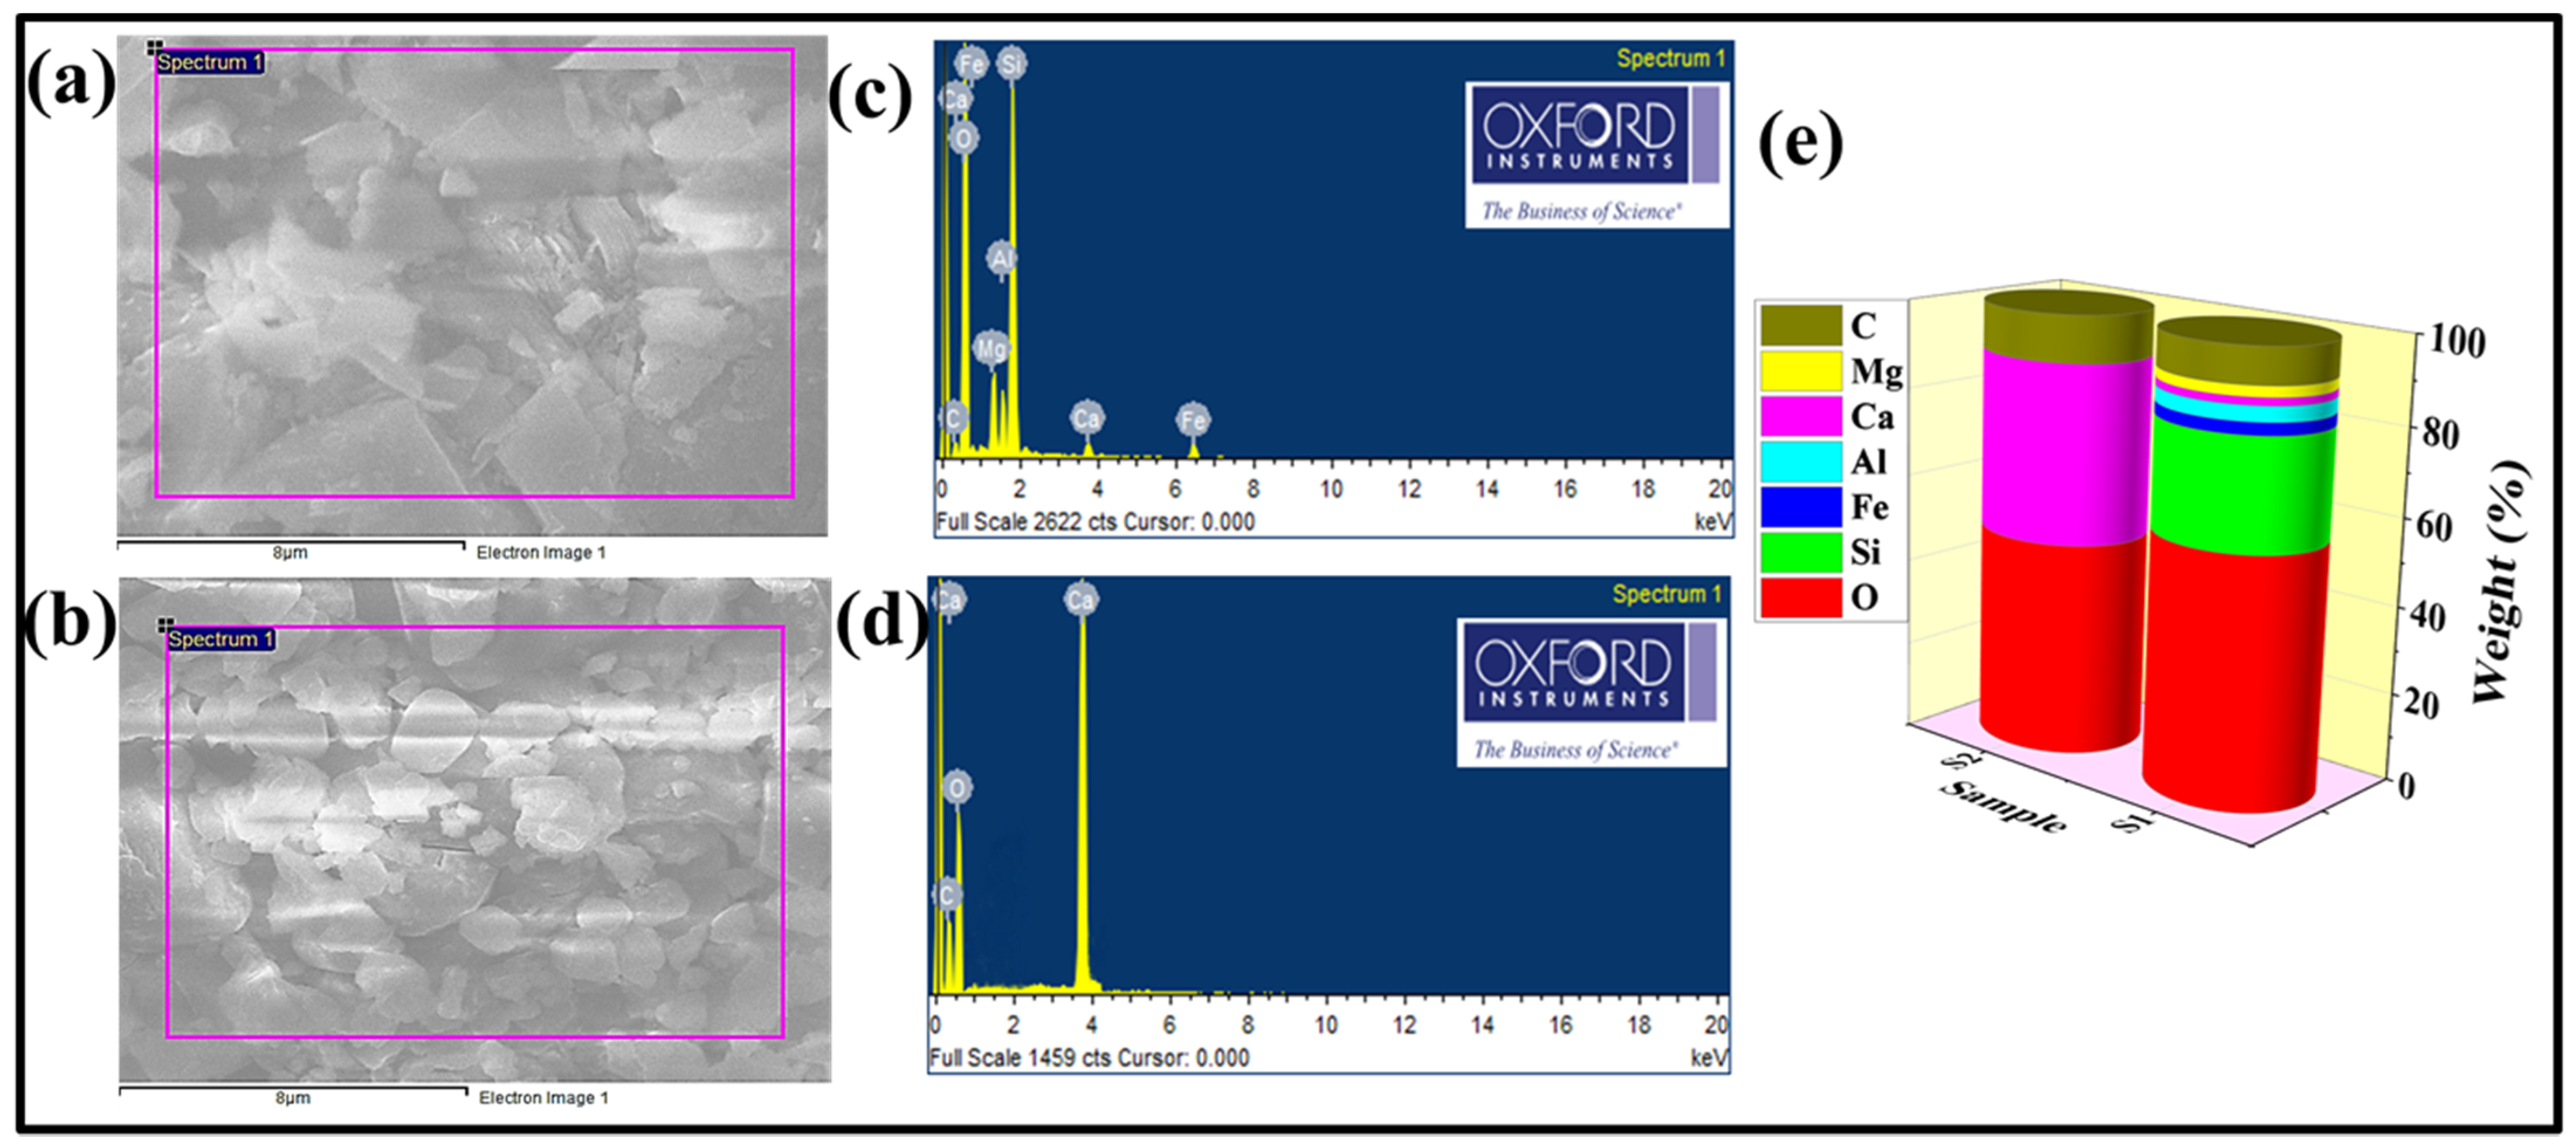
3.1. FESEM-EDX Characterization
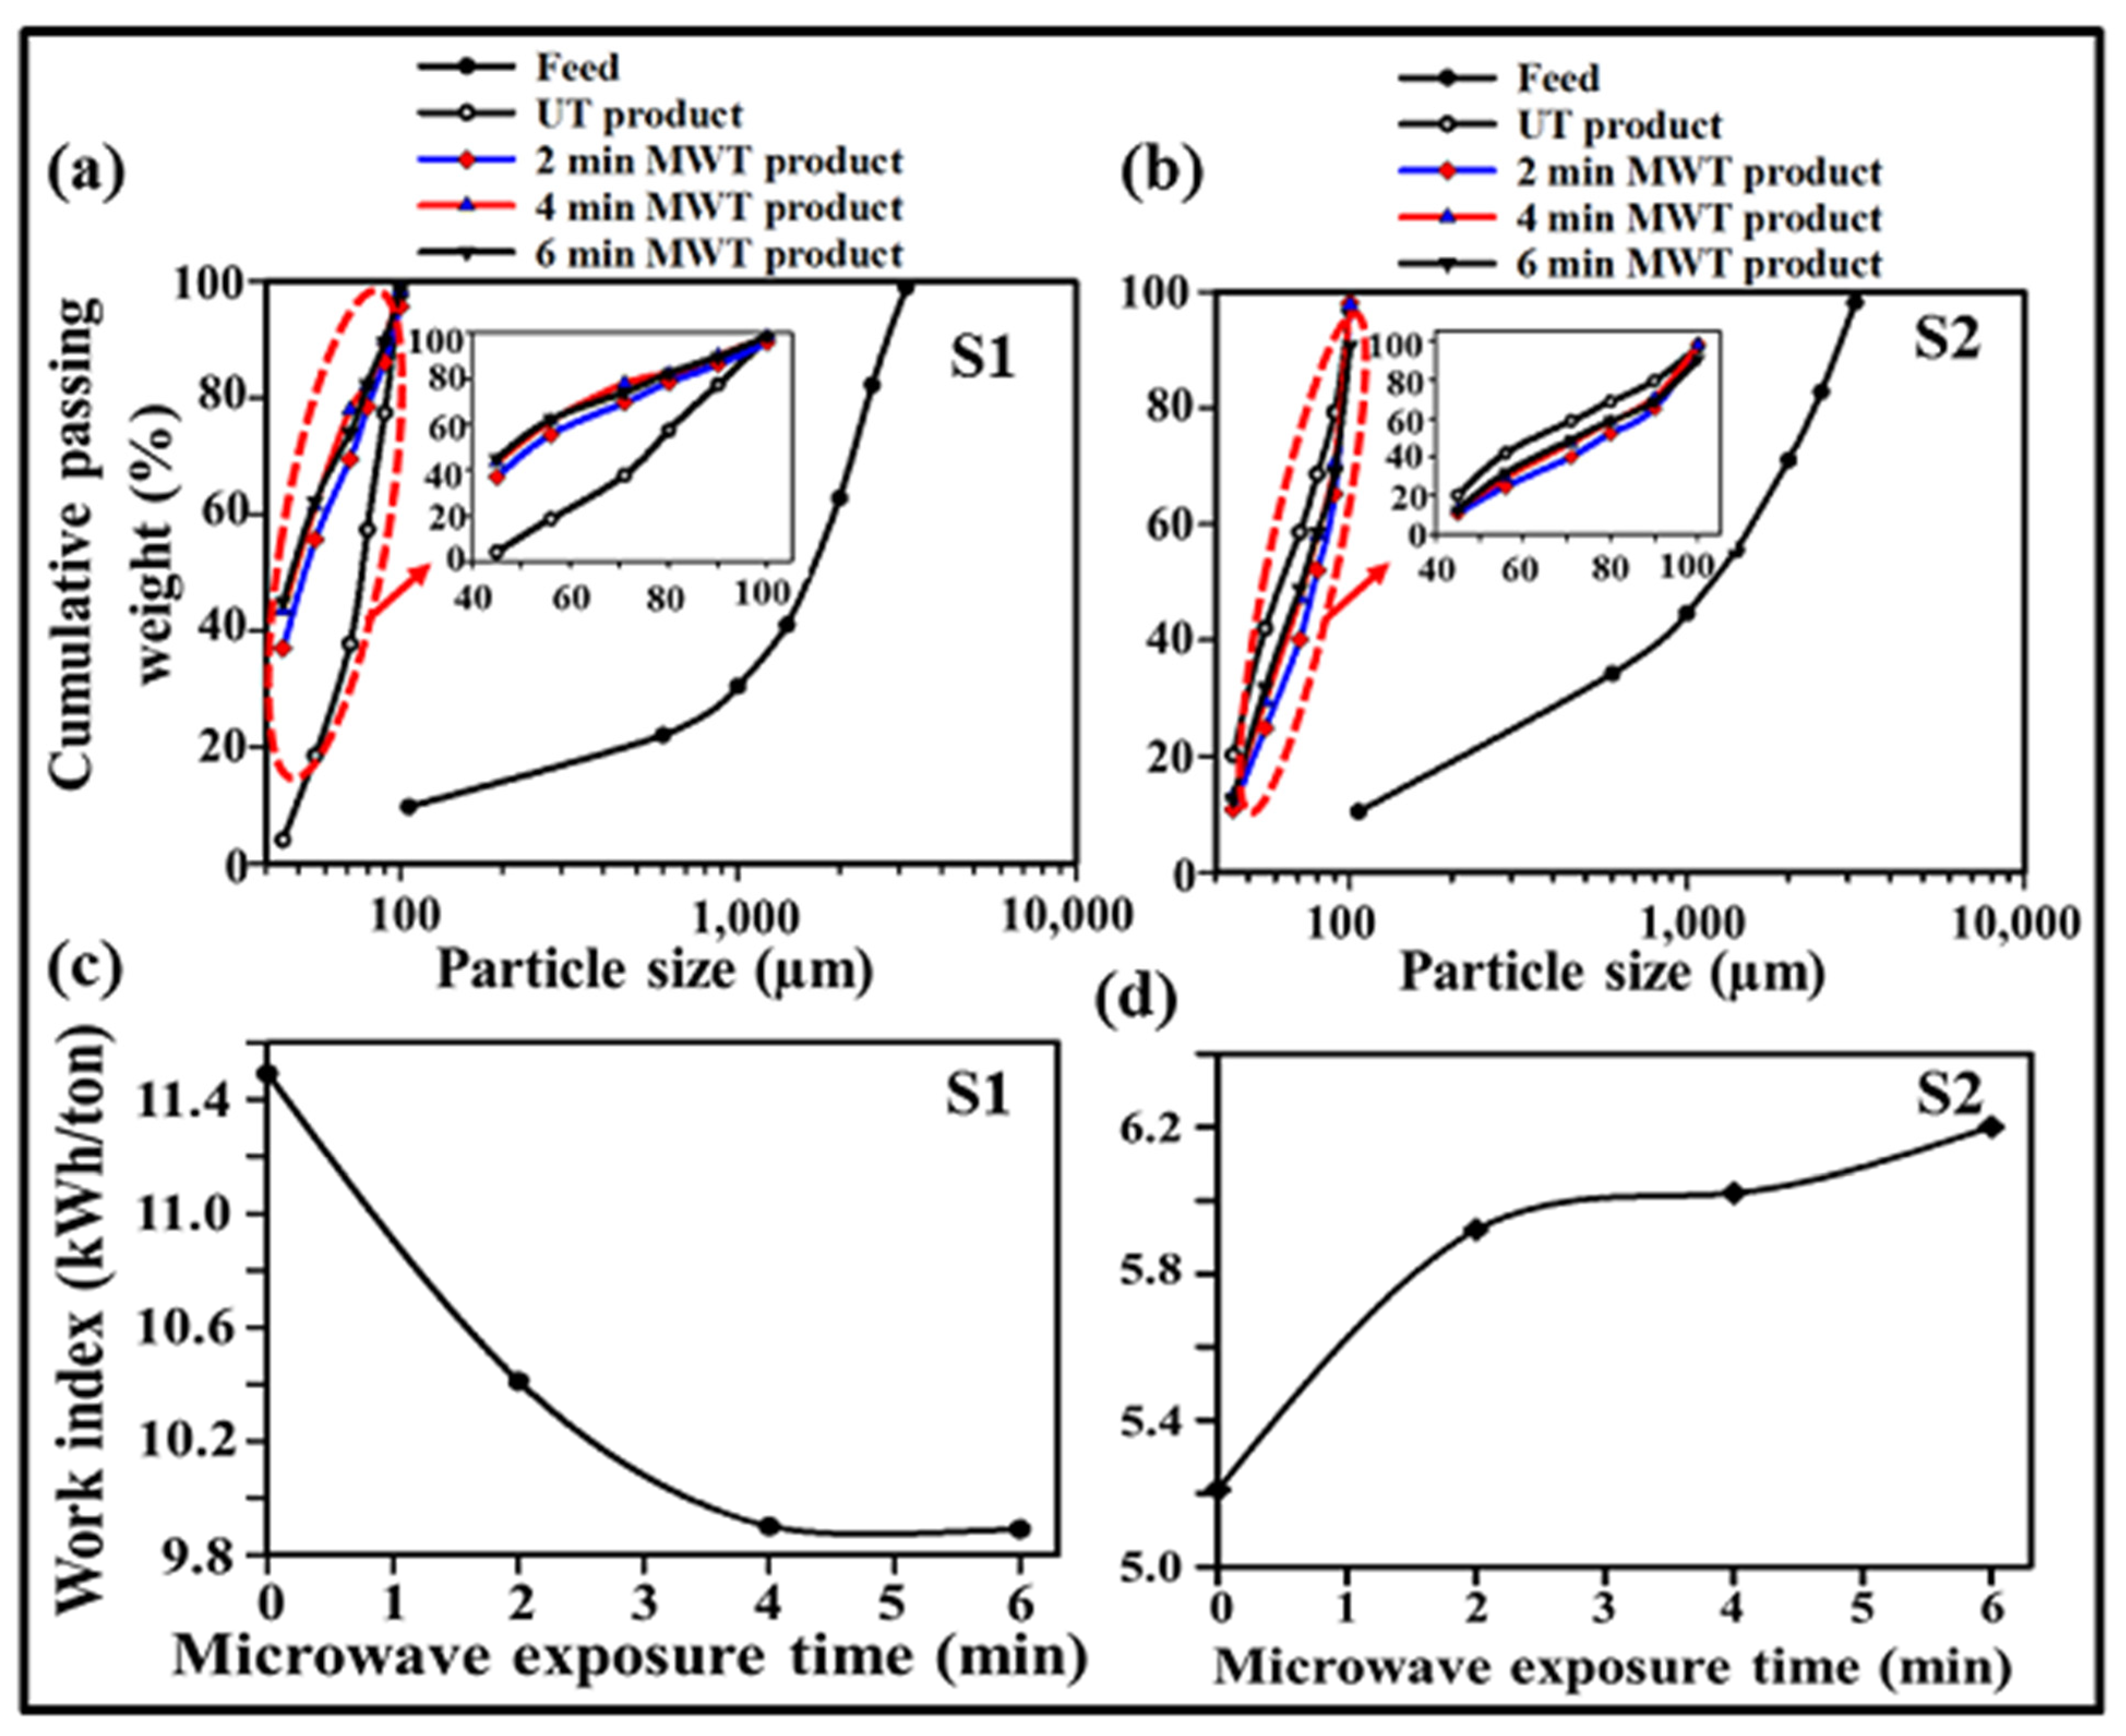
Figure 2 presents the results of the FESEM-EDX characterization of the studied samples. The results show that the abundant elements in S1 are oxygen and silicon, with 56.68 and 25.04%, respectively, which suggests quartz (Figure 2c,e). The results also indicate that sample S2 may be pure calcite, as it contains carbon, oxygen, and calcium (Figure 2d,e). Meanwhile, Figure 2a,b presents the SEM images of samples S1 and S2, respectively. It can be observed that the two samples have different morphologies. This suggests that their grinding behaviour and response to microwave treatment may be differ.

3.2. Grindability

The results of the Bond Ball mill grindability test for the untreated and microwave-treated samples S1 and S2 are presented in Table 2 and Table 3, respectively. The results show that variation between the grindability values ( G b p ), obtained using the last three steady state values of test 1 and test 2 for the as-received (untreated) samples S1 and S2 were approximately 0.07% and 0.50%, respectively. It was noted that the grindability of S1 increases as the microwave irradiation time increases (using the steady state values, along the rows) (Table 2). For the sample S2, the grindability decreases with the increasing microwave radiation exposure (using the steady state values, along the rows) (Table 3). The average temperatures (obtained using three repeated tests, variation ±3 °C) of sample S1 after microwave treatment at 2, 4 and 6 minutes were 55.8, 88.5 and 114.6 °C, respectively. The earlier study on the heating of quartz under microwave radiation (2.45 GHz, 1 kW) resulted in 79 °C after 7 minutes of microwave radiation time [50]. In a related study, quartz mineral (20 g, −0.5 + 0.2 mm) selected from Slovakia was reported to have reached 175 °C after 5 minutes of microwave radiation (900 W, 2.45 GHz) [51]. The variation in the morphology of the minerals and the electric field strength of the microwave oven used may have influenced their heating response when subjected to microwave radiation. For sample S2, the obtained temperatures at 2, 4 and 6 minutes of radiation time were 67.3, 95.0 and 117.5 °C, respectively.
Figure 3a,b presents the results of the size distribution analysis of the untreated and microwave-treated representative samples (a—S1, b—S2). For S1, the 80% passing size of microwave-treated products was lower than that of the untreated product (Figure 3a) while for S2, the reverse was the case (Figure 3b), indicating that microwave pretreatment changed the grinding behaviour of S2 to have fewer fine particles. This may not necessarily mean that the microwave-treated particles of sample S2 are fused together, but may suggest a change in their breakage characteristics after radiation exposure.

Bond Work Index

Table 4 presents the Bond work index results for both untreated samples (S1 and S2) using the standard Bond grindability test procedure. The results show that sample S1 has a high resistance to grinding (with a Bond work index around 11.49 kWh/ton) compared to sample S2 (with a Bond work index around 5.21 kWh/ton); see Table 4. The results also indicate that repeated tests for both untreated samples (S1 and S2) showed variation within ±0.4% (Table 4). This variation is within the industrial acceptable error of ±3.4% [49]. The results of the Bond work indices for both the untreated and microwave-treated samples at different residence times are presented in Figure 3c,d. It can be observed that the Bond work index of sample S1 decreases as the microwave treatment time increases up until 4 minutes, when no significant changes occur up to 6 minutes (Figure 3c). Conversely, the Bond work index of sample S2 increases with the increasing microwave radiation exposure time (Figure 3d). This shows that microwave radiation caused an adverse effect on the grinding behaviour of S2. Similar results have been reported for ultramafic nickel ore [26]. Two ultramafic nickel ore samples were studied; however, microwave pretreatment improved the grindability of one and caused an adverse effect on the grinding behaviour of the other [26]. The grinding energies of untreated and microwave-treated samples were compared using the largest as-received sample size of 40 cm (feed) and a product size of 75 µm (calculated using Bond’s equation 2). The results indicate that the grinding energy of studied sample S1 was reduced by 9.4% (1.23 kWh/ton), 13.83% (1.81 kWh/ton) and 13.98% (1.83 kWh/ton) at 2, 4 and 6 minutes of microwave treatment (2.45 GHz, 1.7 kW), respectively. On the other hand, the microwave pretreatment increased the grinding energy of studied sample S2 by 13.66% (0.81 kWh/ton), 15.59% (0.93 kWh/ton), and 19.06% (1.13 kWh/ton) at 2, 4 and 6 min, respectively.
The hitherto discussed results showed that microwave treatment affects the studied samples’ Bond work indices. In order to understand the change in the grinding behaviour and consequent change in the Bond work index of the studied samples after microwave treatment (2.45 GHz, 1.7 kW, 4 min), FTIR, XRD and SEM analyses of the untreated and microwave-treated representative ground samples (below 80 µm sieve) S1 and S2 were compared. FTIR and XRD were used to investigate the effect of the microwave radiation on the mineralogy of the studied samples. Meanwhile, SEM was used to study the morphology and crack propagation after the microwave treatment of the samples.

3.3. Mineralogy Analysis

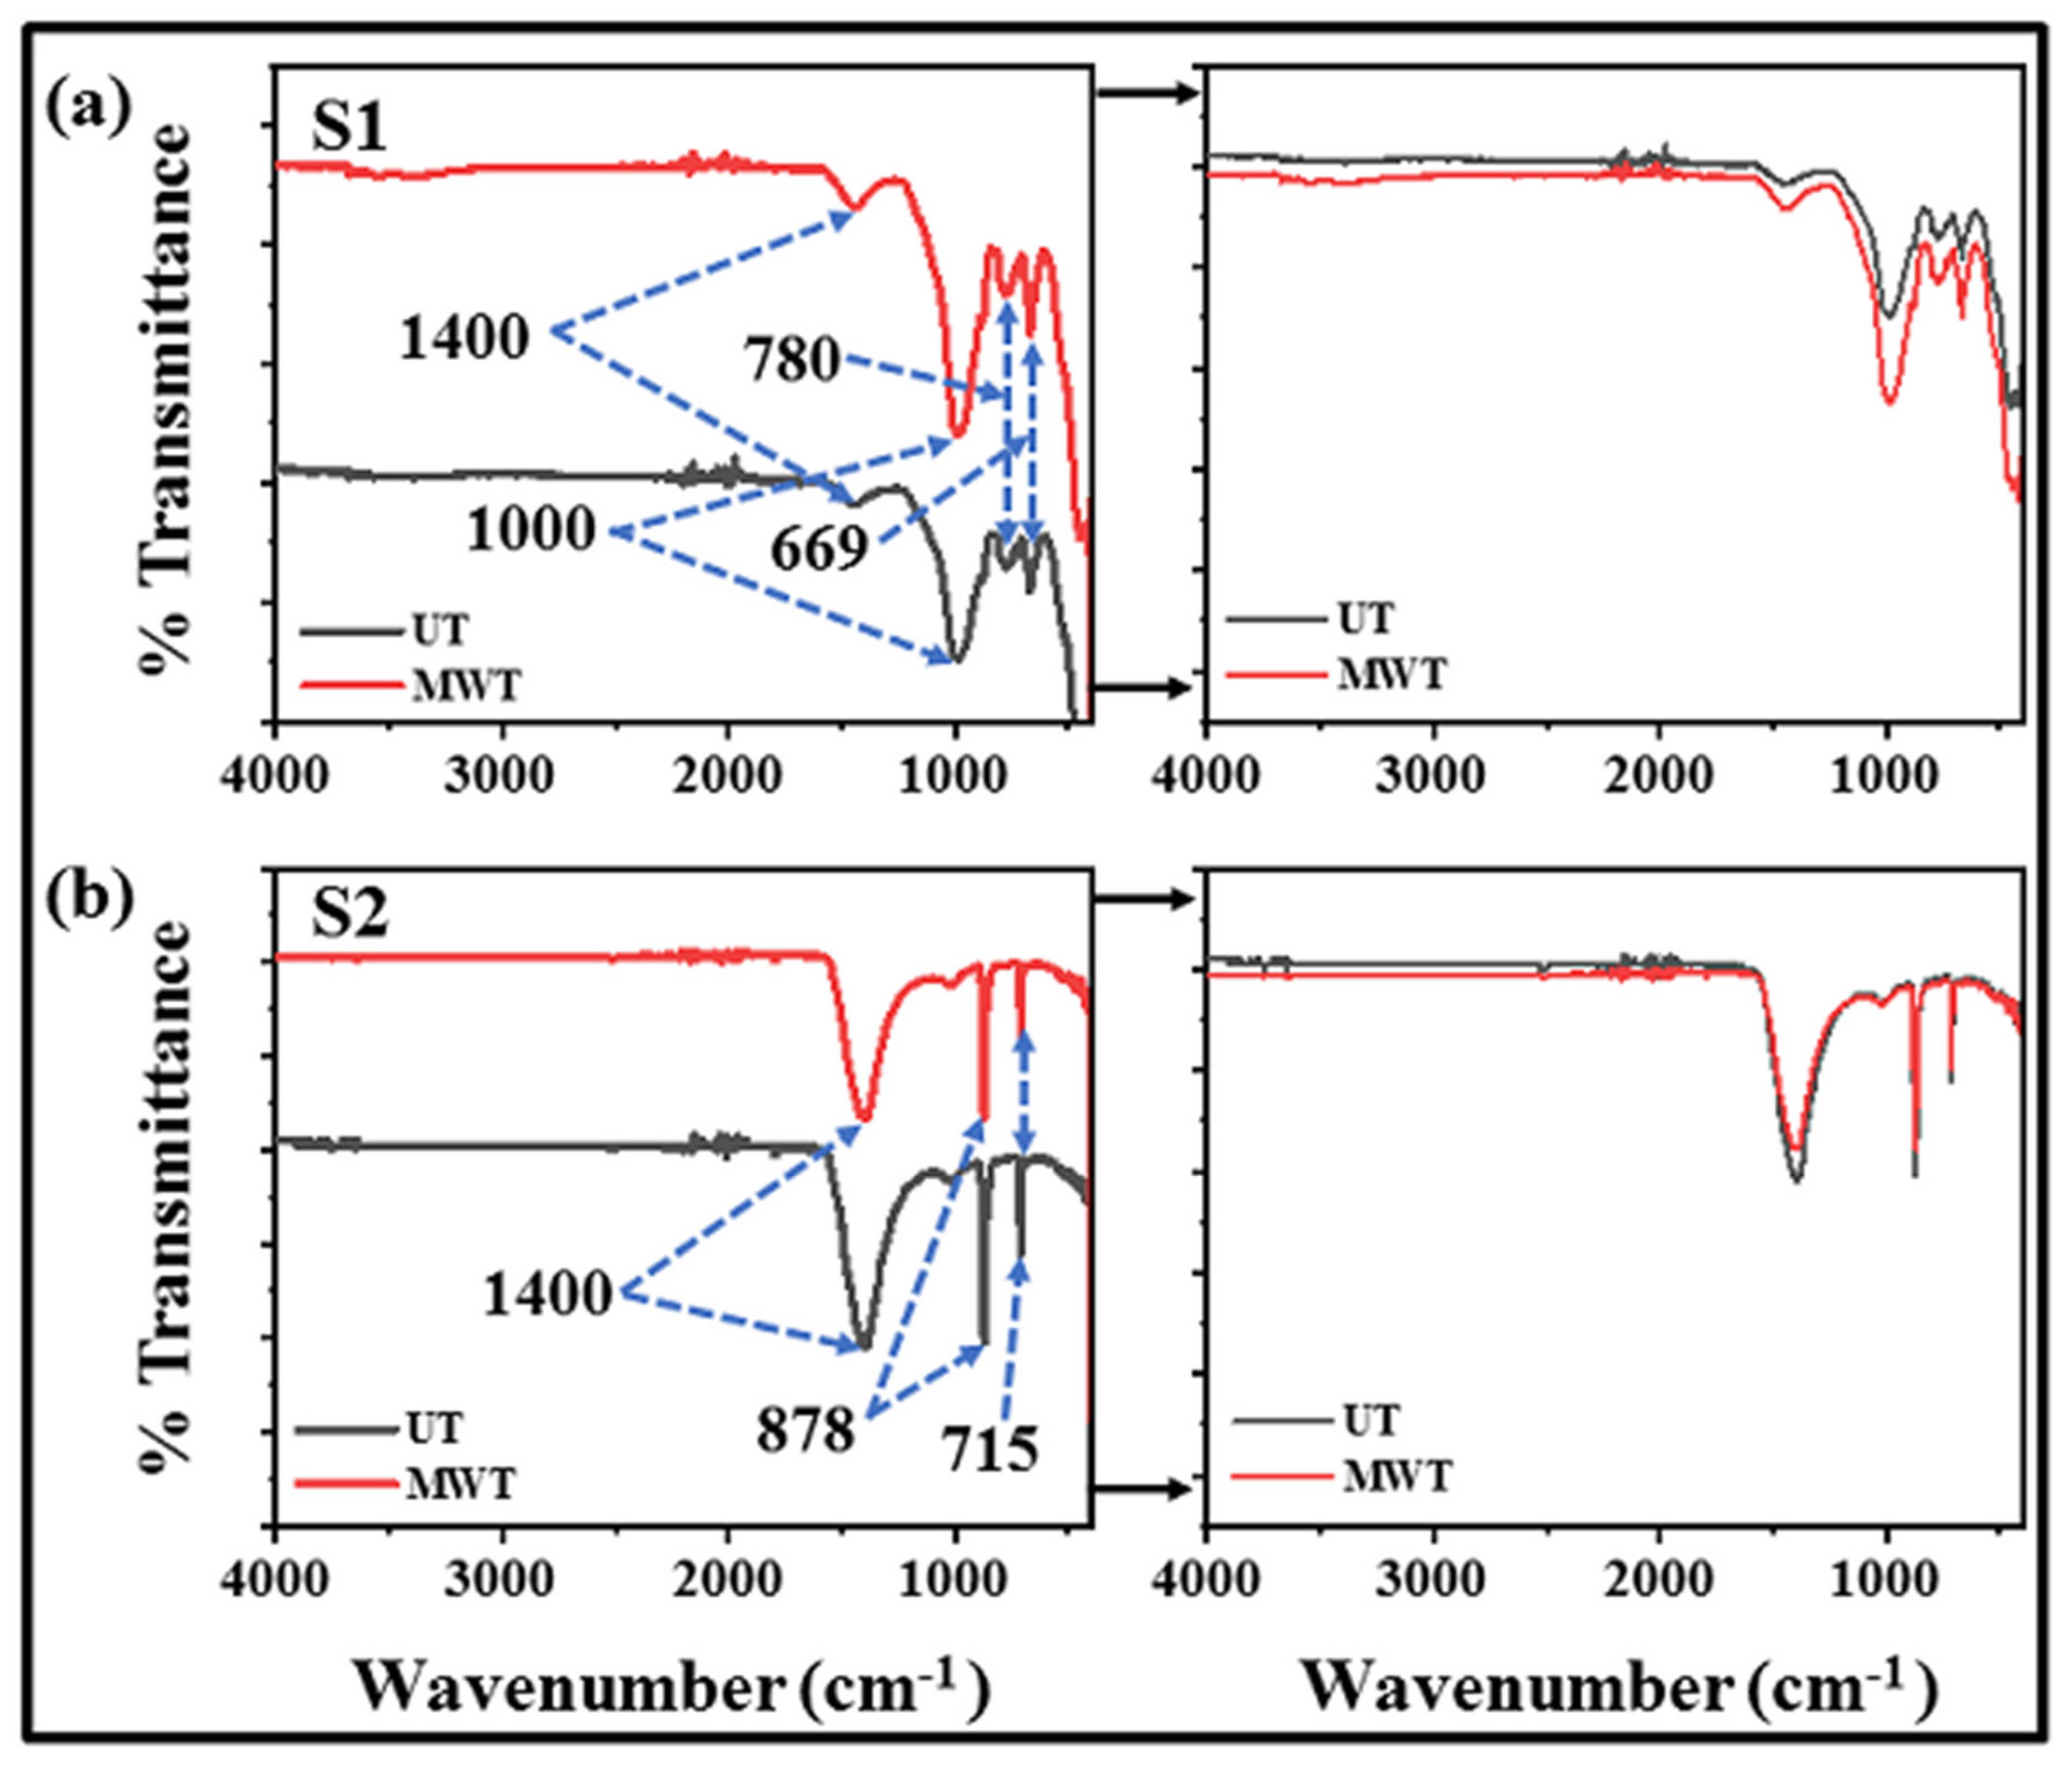
3.3.1. FTIR Analysis
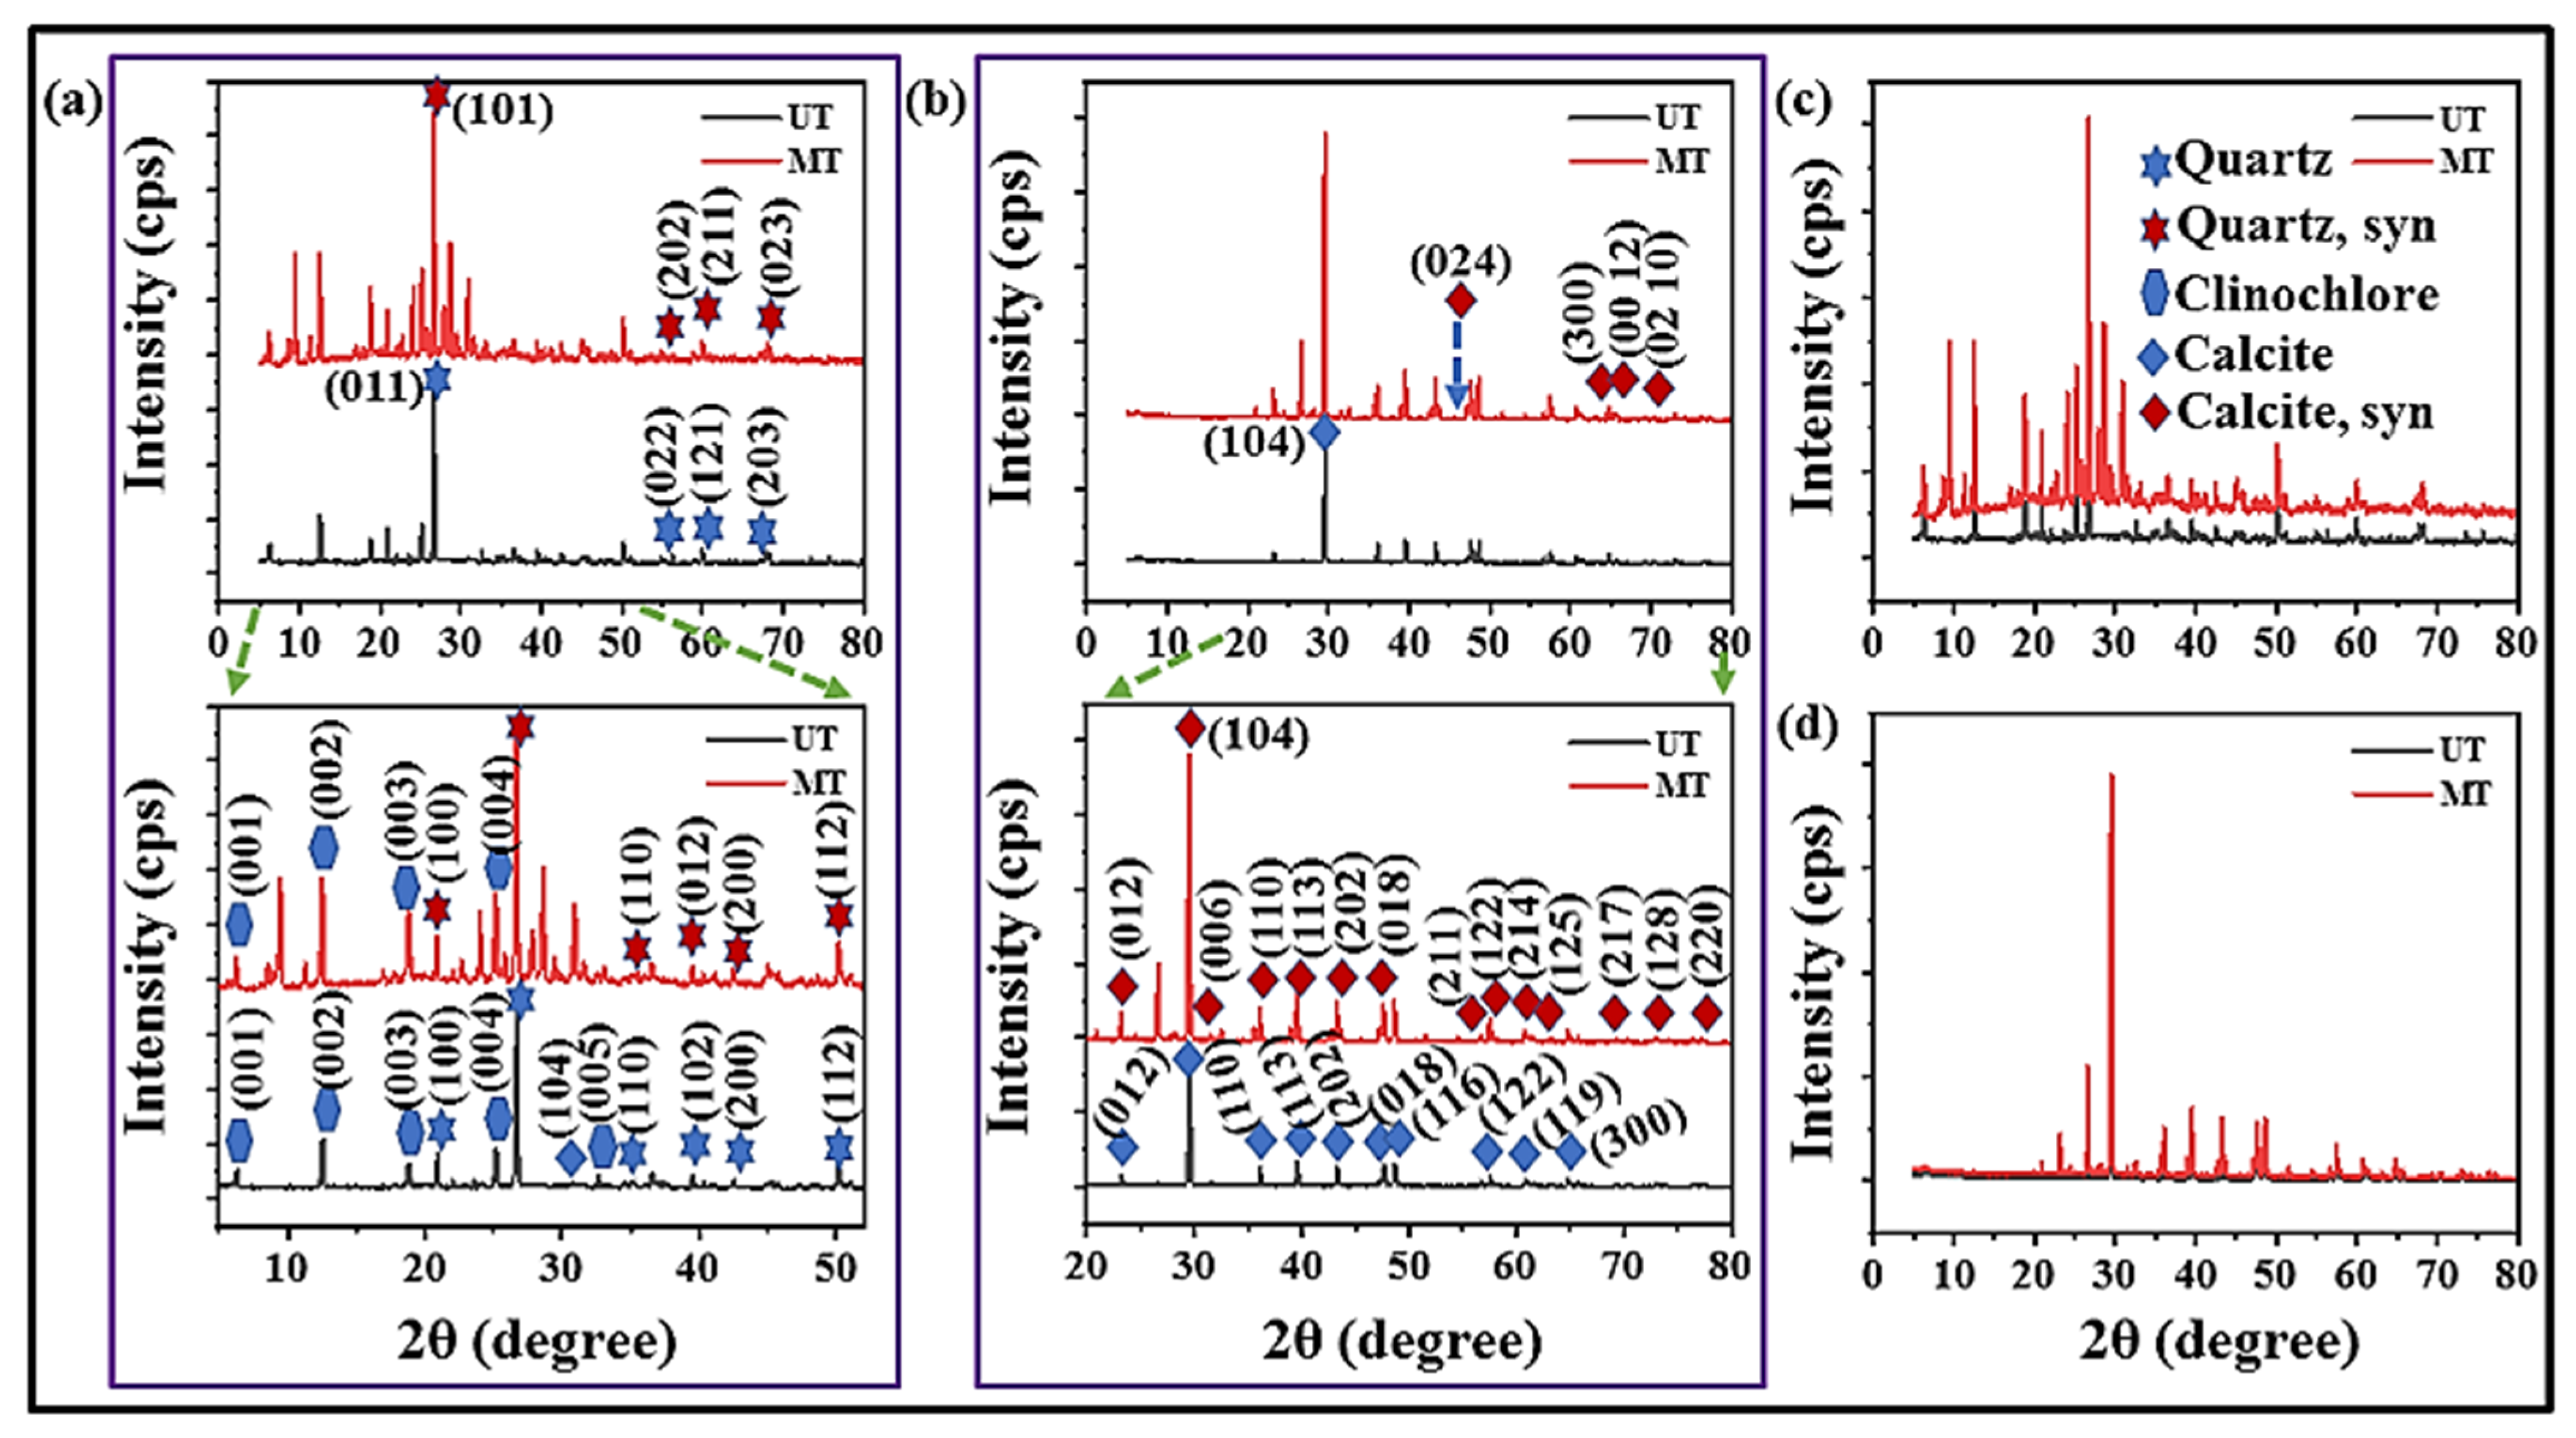
Figure 4 presents the FTIR spectra of samples S1 and S2, before and after microwave treatment (2.45 GHz, 1.7 kW, 4 min). It can be observed that the FTIR bands of microwave treatment sample S1 remain the same as those of the untreated sample (Figure 4a). However, the percentage transmittance of S1 decreased throughout the FTIR bands after the microwave treatment, leading to bigger peaks (Figure 4a, right hand side image). The results indicate that the FTIR spectra’s bands occurred at 1400, 1000, 780 and 669 cm−1 for sample S1 (Figure 4a). The peak band at 1400 cm−1 represents the C-O vibration, indicating a carbonate mineral [52,53,54]. The frequency band 1000 cm−1 is associated with the asymmetrical stretching vibration of Si-O, while that at 780 cm−1 indicates the symmetric stretching vibration of Si-O, indicating a quartz mineral. [55] The frequency band 669 cm−1 indicates the vibration of Al-O [56], which may be attributed to the presence of clinochlore ferroan, glycolated and oriented. For sample S2, its FTIR spectra is presented in Figure 4b. The results show three transmittance peaks at 1400, 878 and 715 cm−1 that are all attributed to C-O vibrations, symmetric in-plane bending, and the stretching of CO3−2, indicating the presence of a carbonate mineral in the sample, which agrees with the results obtained using the FESEM-EDX method [52,53,54]. Like S1, the FTIR bands of sample S2 remain the same after the microwave treatment; however, the percentage of transmittance is increased, leading to shorter peaks (Figure 4b, right hand side image). Because the two samples show different transmittance behaviour after microwave treatment, this may be responsible for the different breakage behaviors exhibited by the two samples (S1 and S2) after the radiation treatments.

3.3.2. XRD Analysis

The results of the mineralogy of the untreated and microwave-treated (2.45 GHz, 1.7 kW, 4 min) samples (S1 and S2) using the XRD method are presented in Figure 5. The quantitative analysis of the XRD spectra of sample S1 showed that it contains 95% by weight quartz (SiO2, card number: 01-070-7344), with the rest identified as Clinochlore, ferroan, glycolated and oriented ((Mg, Fe, Al)6 (Si, Al)4 O10 (O H)8, 4.0%, card number—00-060-0322), and calcite (CaCO3, 1%, card number: 000471743) (Figure 5a; UT). For sample S2, only one mineral was indexed according to the XRD spectra (Figure 5b; UT), i.e., calcite (100% by weight), which agrees well with the results obtained using both the SEM-EDX and FTIR methods.
The XRD spectra of the UT and MWT samples S1 and S2 were separately compared. The results show that the x-ray intensities of sample S1 significantly increased after the microwave treatment (Figure 5c). The increased intensities of the XRD spectra after the microwave treatment have been reported for iron ore [27]. For sample S2, the X-ray intensities nearly remain the same after microwave treatment (Figure 5d). The results also indicate that both samples exhibit slight phase shifts (Figure 5a,b). For this reason, some minerals changed phases, which led to their slight change in crystallographic directions; some peaks disappeared and new peaks emerged (Figure 5a,b). For sample S1, quartz changed to quartz syn (SiO2, card number: 010861629), while clinochlore, ferroan, glycolated and oriented ((Mg, Fe, Al)6 (Si, Al)4 O10 (O H)8) remained the same. Furthermore, some peaks were developed that cannot be identified by XRD (Figure 5a). For sample S2, calcite changed to calcite syn (card number; 010713699) and some unknown phases also emerged (Figure 5b). From this analysis, one may conclude that the change in some of the crystallographic directions of quartz after the microwave treatment of sample S1 caused the recrystallization of the grains and consequently changed the breakage behaviour of the sample, which led to the reduction in its Bond work index. On the other hand, the change in the mineral phase and the new peaks with some wider crystallographic directions (such as 0, 0, 12 and 0, 2, 10) after the microwave treatment of sample S2 may be responsible for the change in the particle breakage behaviour that caused the adverse effect on its grinding (Figure 5b) [26].

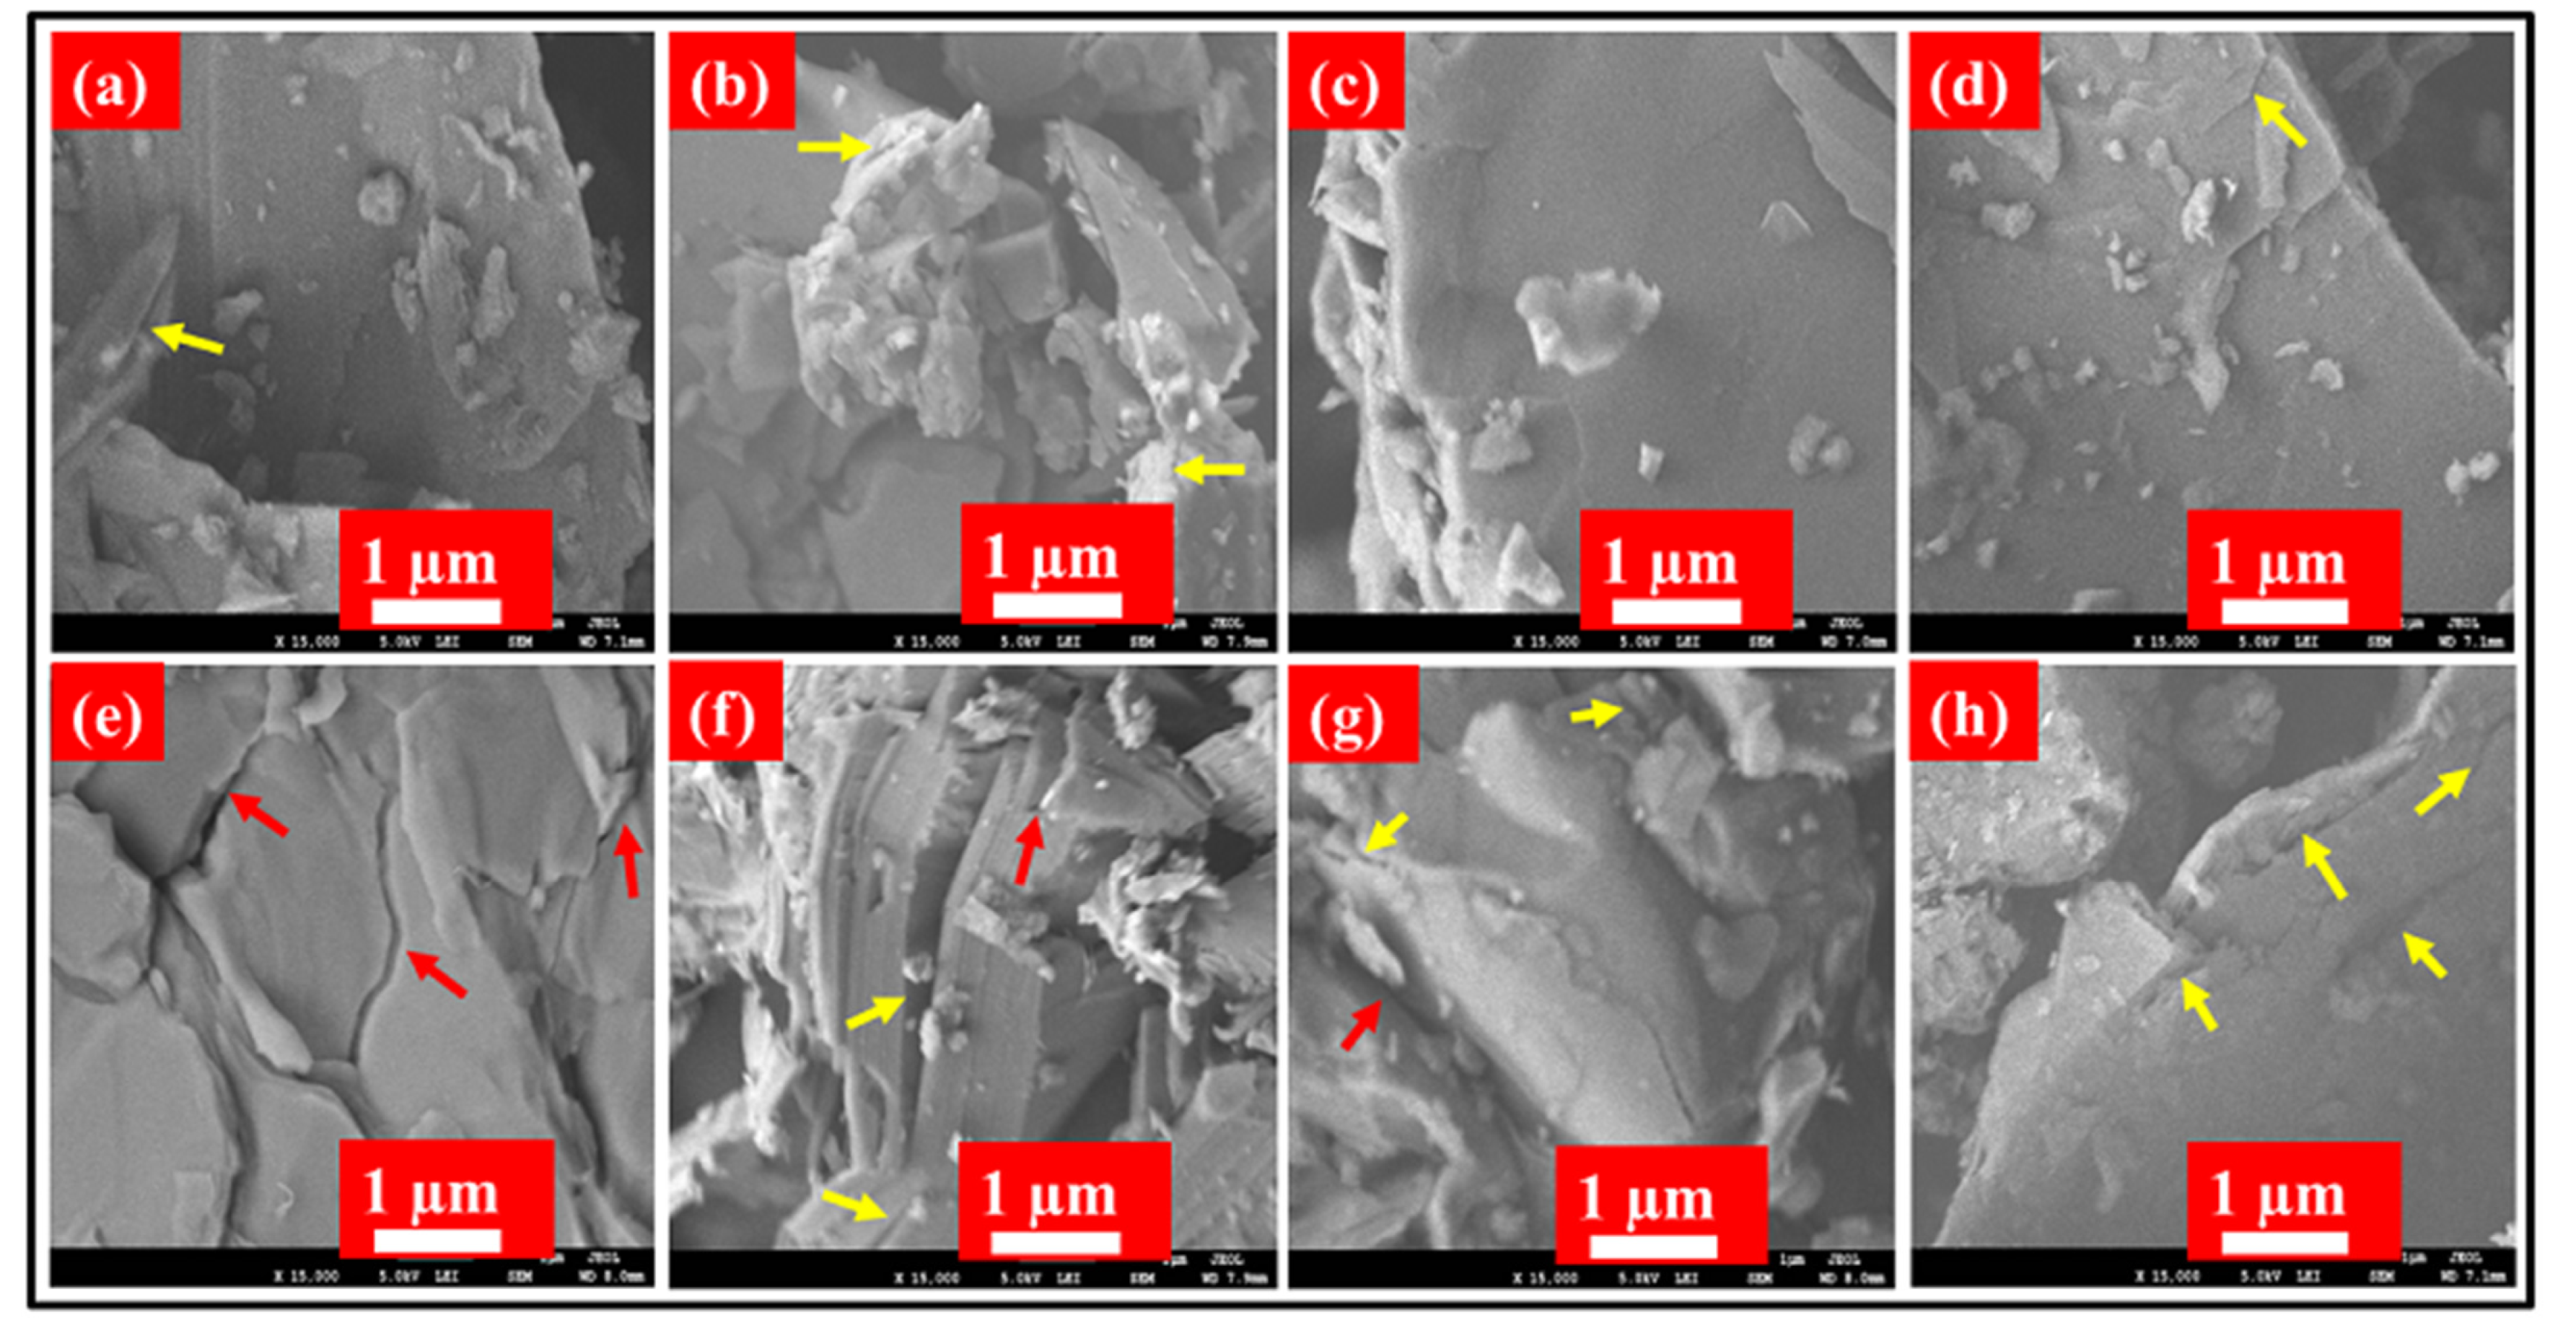
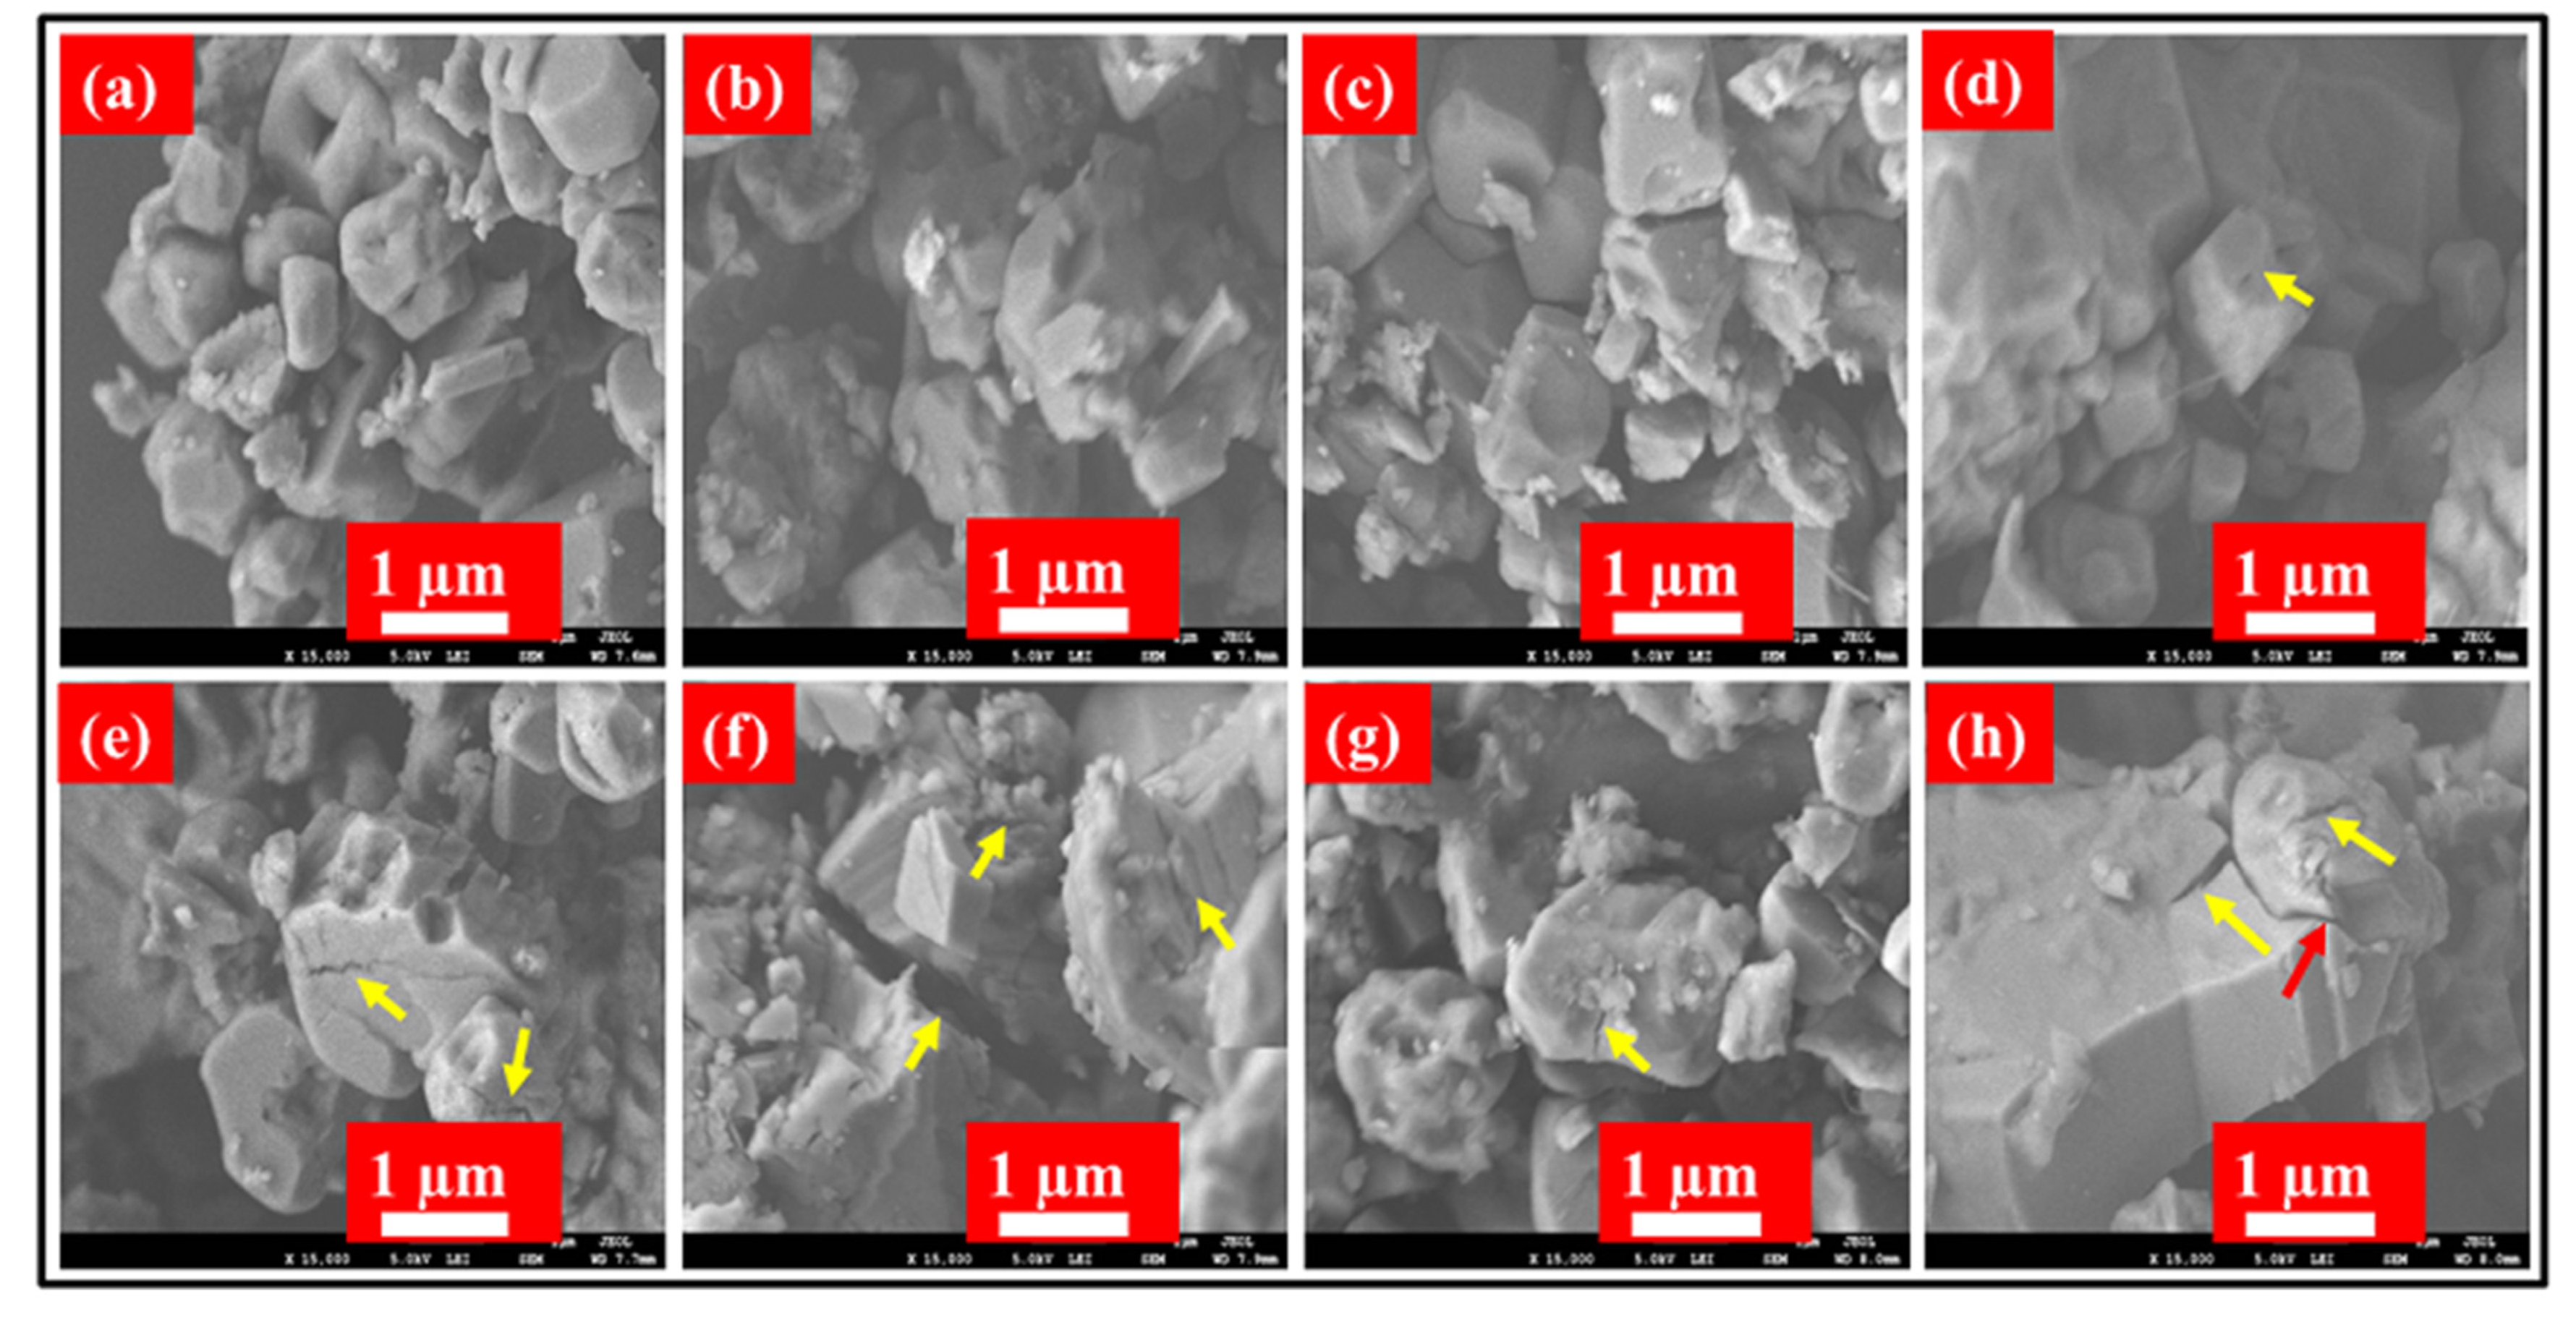
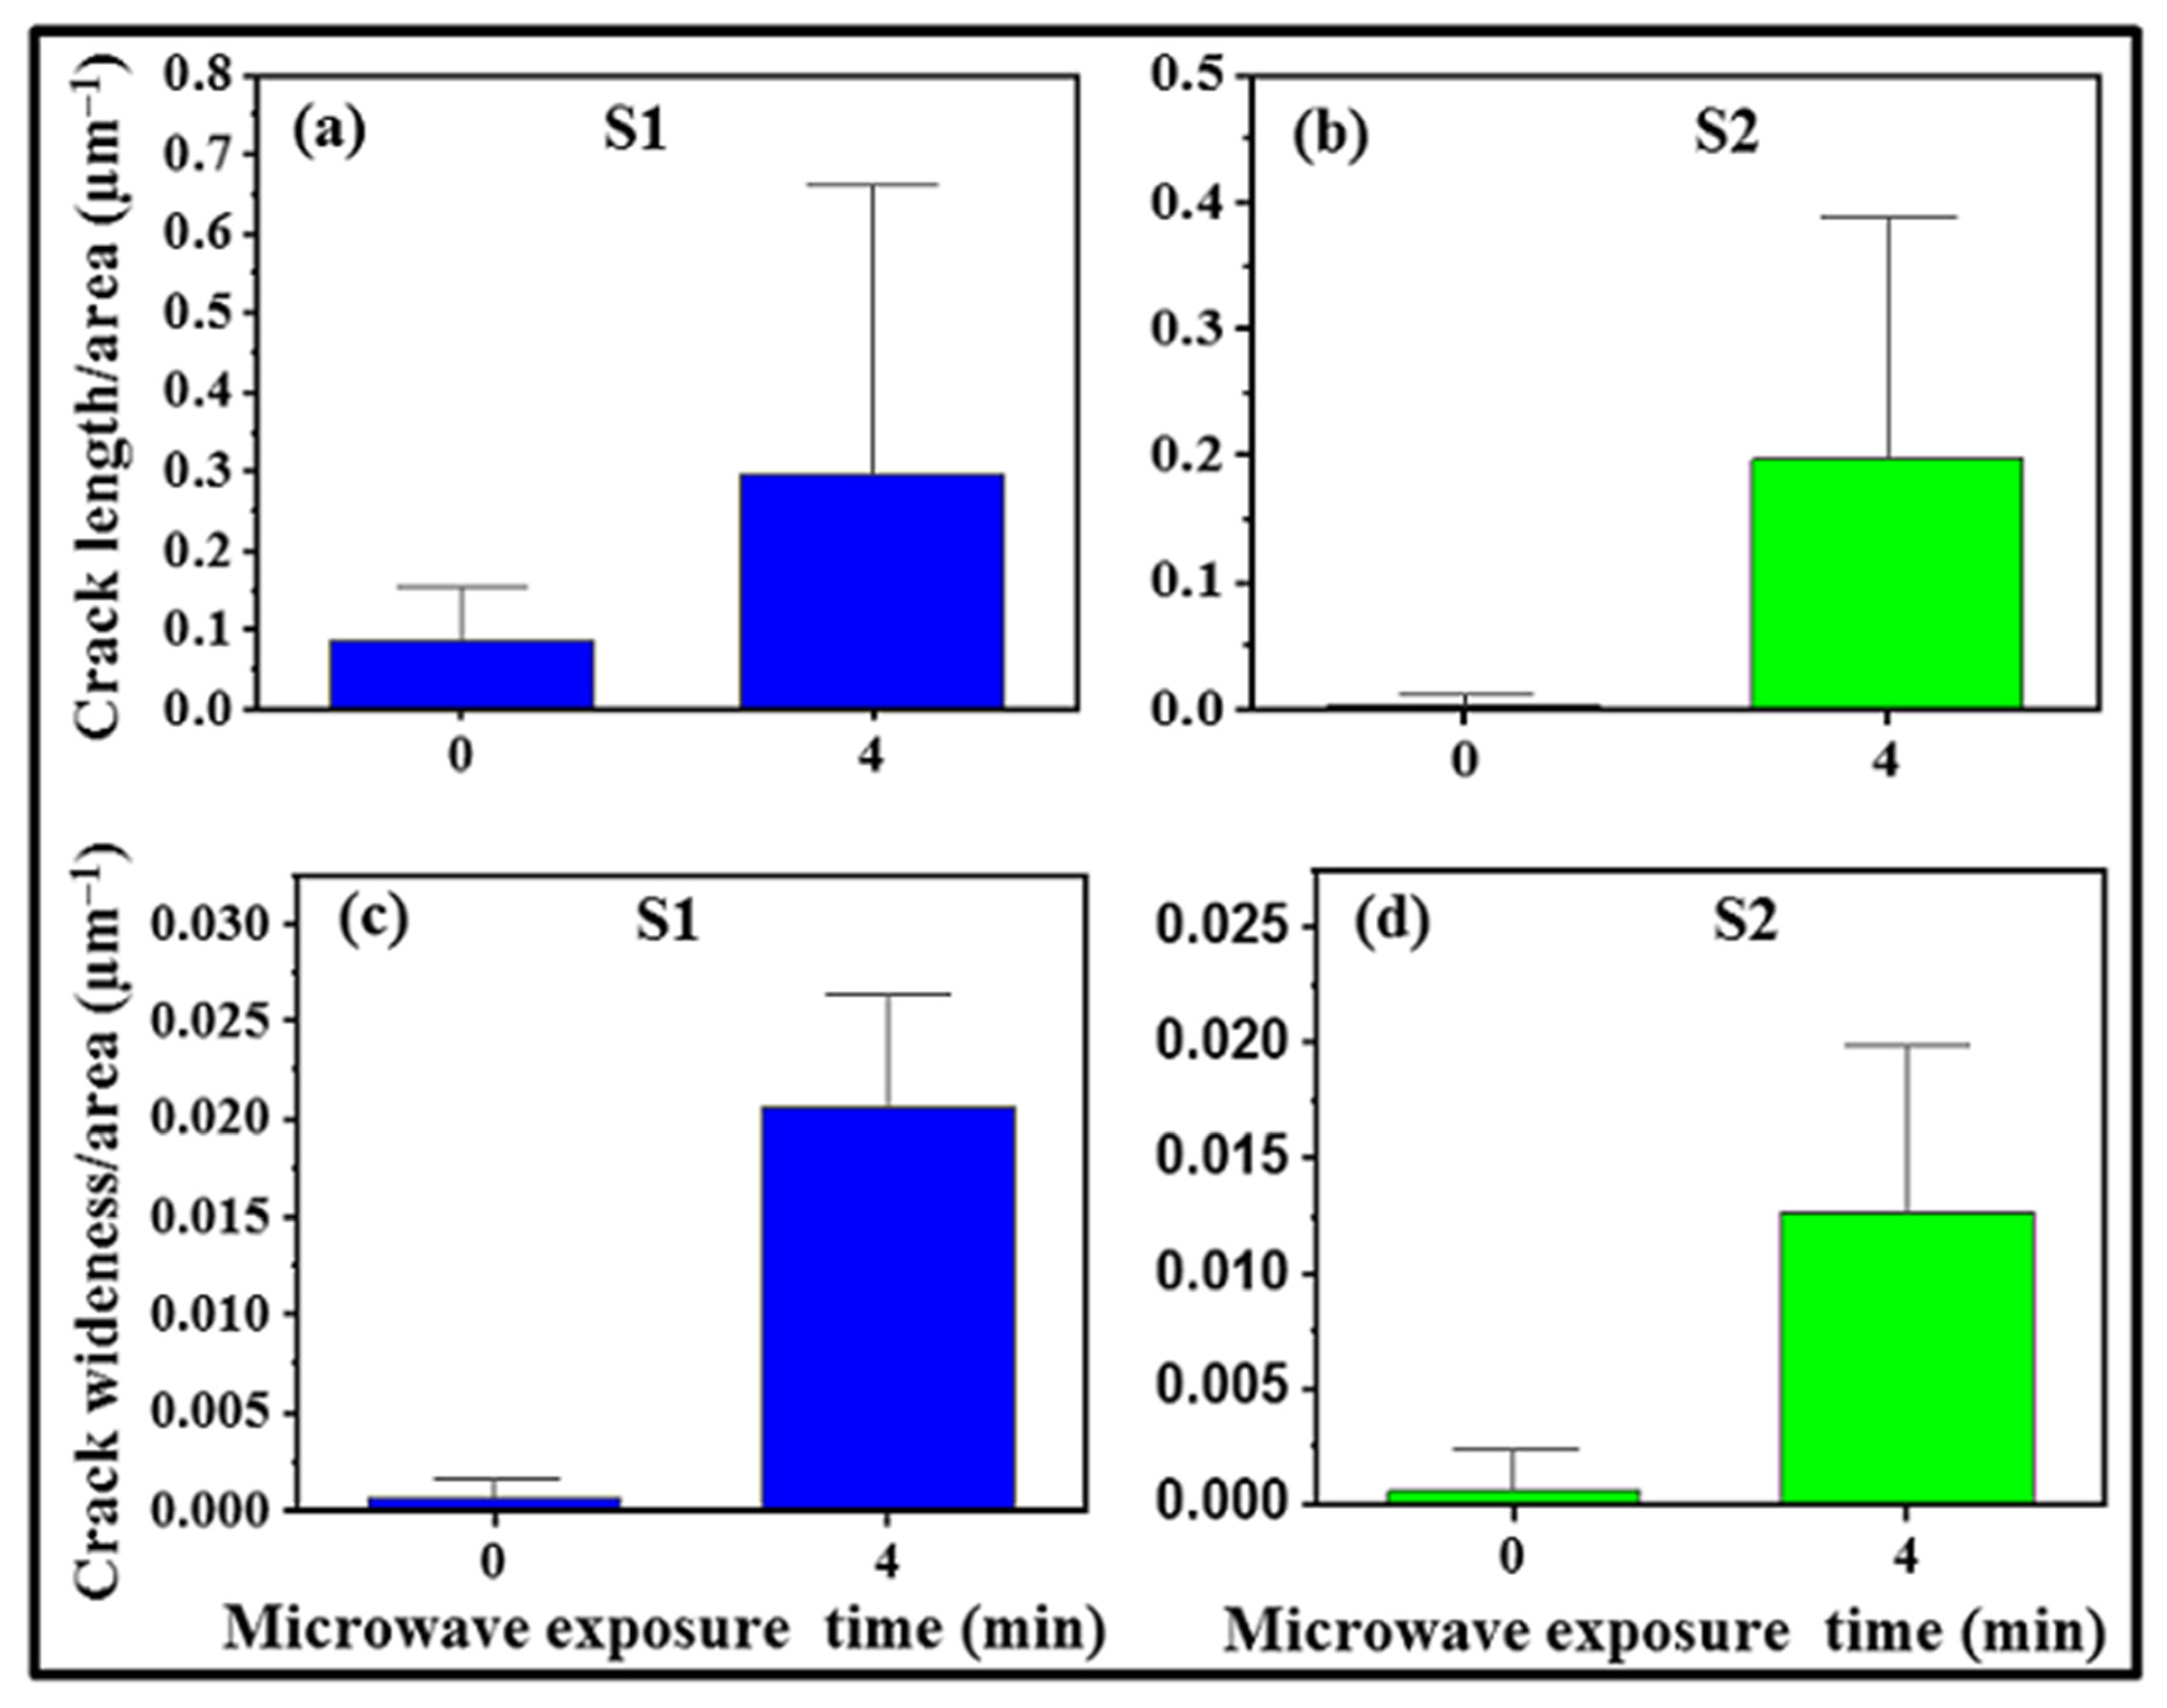
3.4. Morphology Analysis

Figure 6 (a–d, untreated; e–h, microwave-treated) presents the results of the SEM micrographs of the untreated and microwave-treated sample S1. It can be seen that sample S1 has particles with smooth surfaces, coarse and fine textures (Figure 6a–d), whereas sample S2 consists of particles with smooth and rough surfaces and a mostly fine texture (Figure 7a–d). Furthermore, it can be observed that intragranular (yellow arrow) and intergranular (red arrow) cracks were developed after the microwave treatment of sample S1; see Figure 6e–h. For the second sample (S2), the results of multiple SEM micrographs of the untreated and microwave-treated representative samples are presented in Figure 7. Comparing the SEM microstructures of the untreated (Figure 7a–d) and microwave-treated sample S2 (Figure 7e–h), it can be seen that, unlike sample S1, most of the developed cracks after the microwave treatment are intragranular (Figure 7e–h). Researchers have earlier suggested that intragranular cracks may be developed in calcite grains when they are subjected to microwave treatment [57]. This was demonstrated by placing a galena grain in a calcite matrix, and the effect of microwave treatment on crack propagation was studied computationally, through a simulation approach. The findings showed that intergranular cracks were developed between galena and calcite’s boundaries, and intragranular cracks were developed within the calcite matrix despite its low dielectric properties [57].
In order to determine the extent of the cracks developed after the microwave treatment of the studied samples, a quantitative SEM image analysis of the untreated and microwave-treated samples (S1 and S2) was performed [26] using ImageJ (Fiji, 64 bit version, open-source software, National Institutes of Health, 9,000 Rockville Pike, Bethesda, Maryland, USA) [58,59]. The results for the two studied samples are presented in Figure 8. The results indicate that in both the crack length per unit area and the crack wideness per unit area, sample S1 developed slightly more cracks (Figure 8a,c) than sample S2 (Figure 8b,d) under the same microwave treatment conditions. It is important to note that most of the cracks which developed in sample S1 are within the grain boundary (Figure 6e–h), which improved the grinding behaviour and consequently reduced its BWI. However, for sample S2, most of the developed cracks are transgranular, meaning that the particle breakage may firstly take place within the sample’s matrix, rather than between the grain boundaries (Figure 7e–h). This may be responsible for the differential particle breakage behaviour that changed the particle size distribution of the sample after grinding. This can be observed as presented in Table 3, where the Gbp decreases with the microwave treatment time. Furthermore, the 80% passing size of the products (after grinding) of the microwave-treated sample almost remained the same (Figure 3b); this led to the increased BWI of sample S2, as the Gbp also decreased (Table 3).

4. Conclusions

This paper investigated the amenability of microwave irradiated mining waste (rocks) to grinding using the standard Bond ball mill grindability test procedure. The selected samples (labelled S1 and S2) were characterized using FESEM-EDX, XRD, FTIR and SEM spectroscopy analyses. The results showed that S1 and S2 are predominantly quartz and calcite, respectively. The Bond ball mill grindability tests were conducted for the untreated and microwave-treated (2.45 GHz, 1.7 kW) quartz and calcite representative samples. The findings showed that the Bond work indices of the untreated quartz and calcite are 11.49 kWh/ton and 5.21 kWh/ton, respectively. The results also indicated that the BWI of the studied quartz improved, which led to a reduction in grinding energy by 13.83% (equivalent to 1.81 kWh/ton) at 4 minutes of microwave radiation. Meanwhile, at the same microwave treatment conditions, the grinding energy of the studied calcite increased by 15.59% (equivalent to 0.93 kWh/ton). The FTIR, XRD and SEM analyses of the untreated and microwave-treated (2.45 GHz, 1.7 kW, 4 min) representative samples (S1 and S2) were compared. The findings showed that percentage transmittance of S1 decreased throughout the FTIR bands; meanwhile, that of S2 increased under the same microwave treatment conditions. The XRD results showed that the XRD intensities of the mineral phases increased for sample S1 after the microwave treatment. However, that of the second sample (S2) remained nearly the same after the microwave treatment. The image analysis of multiple SEM micrographs of the two studied samples clearly revealed that more cracks were developed in sample S1 than sample S2 after the microwave treatment. Based on these findings, microwave pretreatment improved the grinding behaviour of the studied quartz, but caused an adverse effect on the grinding behaviour of the studied calcite. Due to the change in the crystallographic directions of some mineral phases in the studied samples after microwave pretreatment, future research may be tailored towards determining the effect of microwave pretreatment on the binding and cementation properties of cement, as the two samples were being used for cement production. Furthermore, research may be conducted to investigate whether microwave pretreatment can reduce the grinding additives used for cement production.

Author Contributions

Conceptualization, S.O.A.; methodology, S.O.A.; formal analysis, S.O.A.; investigation, S.O.A.; resources, S.O.A. and H.A.M.A.; data curation, S.O.A.; writing—original draft preparation, S.O.A.; writing—review and editing, S.O.A. and H.A.M.A.; visualization, H.A.M.A.; supervision, H.A.M.A.; project administration, S.O.A. and H.A.M.A.; funding acquisition, S.O.A. and H.A.M.A. All authors have read and agreed to the published version of the manuscript.

Funding

This work was supported by the Deanship of Scientific Research (DSR), King Abdulaziz University, Jeddah, under grant No. DG-026-306-1441. The authors, therefore, gratefully acknowledge the DSR’s technical and financial support.

Institutional Review Board Statement

Not applicable.

Informed Consent Statement

Not applicable.

Conflicts of Interest

The authors declare no conflict of interest.

References

  1. Gokcen, H.S.; Cayirli, S.; Ucbas, Y.; Kayaci, K. The Effect of Grinding Aids on Dry Micro Fine Grinding of Feldspar. Int. J. Miner. Process. 2015, 136, 42–44. [Google Scholar] [CrossRef]
  2. Adewuyi, S.O.; Ahmed, H.A.M.; Ahmed, H.M.A. Methods of Ore Pretreatment for Comminution Energy Reduction. Minerals 2020, 10, 423. [Google Scholar] [CrossRef]
  3. Meisels, R.; Toifl, M.; Hartlieb, P.; Kuchar, F.; Antretter, T. Microwave Propagation and Absorption and Its Thermo-Mechanical Consequences in Heterogeneous Rocks. Int. J. Miner. Process. 2015, 135, 40–51. [Google Scholar] [CrossRef] [Green Version]
  4. Calvo, G.; Mudd, G.; Valero, A.; Valero, A. Decreasing Ore Grades in Global Metallic Mining: A Theoretical Issue or a Global Reality? Resources 2016, 5, 36. [Google Scholar] [CrossRef] [Green Version]
  5. Goodall, W.R.; Scales, P.J.; Butcher, A.R. The use of QEMSCAN and Diagnostic Leaching in the Characterisation of Visible Gold in Complex Ores. Miner. Eng. 2005, 18, 877–886. [Google Scholar] [CrossRef]
  6. Otsuki, A.; Chen, Y.; Zhao, Y. Characterisation and Beneficiation of Complex Ores for Sustainable Use of Mineral Resources: Refractory Gold Ore Beneficiation as an Example. Soc. Mater. Eng. Resour. Japan 2014, 20, 126–135. [Google Scholar] [CrossRef] [Green Version]
  7. Reemeyer, L. Ore sorting and Pre-Concentration-Potential to Boost Profit and Ease Risks. Available online: http://www.resourcefulpaths.com/blog/2016/12/6/ore-sorting-and-pre-concentration-potential-to-boost-profit-and-ease-risks (accessed on 5 June 2021).
  8. Jankovic, A.; Valery, W.; Davis, E. Cement Grinding Optimisation. Miner. Eng. 2004, 17, 1075–1081. [Google Scholar] [CrossRef]
  9. Makul, N.; Rattanadecho, P.; Agrawal, D.K. Applications of Microwave Energy in Cement and Concrete-A review. Renew. Sustain. Energy Rev. 2014, 37, 715–733. [Google Scholar] [CrossRef]
  10. Klein, B.; Wang, C.; Nadolski, S. Energy-Efficient Comminution: Best Practices and Future Research Needs. In Energy Efficiency in the Minerals Industry Best Practices and Research Directions; Awuah-Offei, K., Ed.; Springer International Publishing: Cham, Switzerland, 2018; pp. 197–211. ISBN 9783319541990. [Google Scholar]
  11. Fuerstenau, D.W. Grinding Aids. KONA Powder Part. J. 1995, 13, 5–18. [Google Scholar] [CrossRef] [Green Version]
  12. Rao, R.B.; Narasimhan, K.S.; Rao, T.C. Effect of Additives on Grinding of Magnetite Ore. Min. Met. Explor. 1991, 8, 144–151. [Google Scholar] [CrossRef]
  13. Yu, J.; Han, Y.; Li, Y.; Gao, P. Effect of Magnetic Pulse Pretreatment on Grindability of a Magnetite Ore and Its Implication on Magnetic Separation. J. Cent. South Univ. 2016, 23, 3108–3114. [Google Scholar] [CrossRef]
  14. Shi, F.; Zuo, W.; Manlapig, E. Characterisation of Pre-Weakening Effect on Ores by High Voltage Electrical Pulses Based on Single-Particle Tests. Miner. Eng. 2013, 50, 69–76. [Google Scholar] [CrossRef]
  15. Wang, E.; Shi, F.; Manlapig, E. Pre-Weakening of Mineral Ores by High Voltage Pulses. Miner. Eng. 2011, 24, 455–462. [Google Scholar] [CrossRef]
  16. Mazumder, B.; Uddin, I.; Khan, S.; Ravi, V.; Selvraj, K.; Poddar, P.; Ahmad, A. Bio-Milling Technique for the Size Reduction of Chemically Synthesized BiMnO3 Nanoplates. J. Mater. Chem. 2007, 17, 3910–3914. [Google Scholar] [CrossRef]
  17. Omran, M.; Fabritius, T.; Elmahdy, A.M.; Abdel-Khalek, N.A.; Gornostayev, S. Improvement of Phosphorus Removal from Iron Ore Using Combined Microwave Pretreatment and Ultrasonic Treatment. Sep. Purif. Technol. 2015, 156, 724–737. [Google Scholar] [CrossRef] [Green Version]
  18. Gaete-Garretón, L.F.; Vargas-Hermández, Y.P.; Velasquez-Lambert, C. Application of Ultrasound in Comminution. Ultrasonics 2000, 38, 345–352. [Google Scholar] [CrossRef]
  19. Heshami, M.; Ahmadi, R. Effect of Thermal Treatment on Specific Rate of Breakage of Manganese Ore. J. Min. Environ. 2018, 9, 339–348. [Google Scholar]
  20. Sener, S.; Bilgen, S.; Ozbayoglu, G. Effect of Heat Treatment on Grindabilities of Celestite and Gypsum and Separation of Heated Mixture by Differential Grinding. Miner. Eng. 2004, 17, 473–475. [Google Scholar] [CrossRef]
  21. Swart, A.J.; Mendonidis, P. Evaluating the Effect of Radio-Frequency Pre-Treatment on Granite Rock Samples for Comminution Purposes. Int. J. Miner. Process. 2013, 120, 1–7. [Google Scholar] [CrossRef]
  22. Kaya, E. Comminution Behaviour of Microwave Heated Two Sulphide Copper Ores. Indian J. Chem. Technol. 2010, 17, 455–461. [Google Scholar]
  23. Walkiewicz, J.W.; Clark, A.E.; McGill, S.L. Microwave-Assisted Grinding. IEEE Trans. Ind. Appl. 1991, 27, 239–243. [Google Scholar] [CrossRef]
  24. Bobicki, E.R.; Boucher, D.; Forster, J.; Gillis, A.; Holcrof, G.; Fragomeni, D.E. Whiteman CANMICRO: Scaling up Microwave Technology for the Mining Industry. In Proceedings of the 52nd Annual Canadian Mineral Processors Operators Conference, Ottawa, ON, Canada, 21–23 January 2020; pp. 131–144. [Google Scholar]
  25. Tong, Y. Technical Amenability Study of Laboratory-Scale Sensor Based Ore Sorting on a Missippi Valley Type Lead-Zinc Ore. Master’s Thesis, Mining Engineering, The University of British Columbia, Vancouver, BC, Canada, 2012. [Google Scholar]
  26. Bobicki, E.R.; Liu, Q.; Xu, Z. Microwave Treatment of Ultramafic Nickel Ores: Heating Behavior, Mineralogy, and Comminution Effects. Minerals 2018, 8, 524. [Google Scholar] [CrossRef] [Green Version]
  27. Omran, M.; Fabritius, T.; Mattila, R. Thermally Assisted Liberation of High Phosphorus Oolitic Iron Ore: A Comparison between Microwave and Conventional Furnaces. Powder Technol. 2015, 269, 7–14. [Google Scholar] [CrossRef]
  28. Kumar, P.; Sahoo, B.K.; De, S.; Kar, D.D.; Chakraborty, S.; Meikap, B.C. Iron Ore Grindability Improvement by Microwave Pre-Treatment. J. Ind. Eng. Chem. 2010, 16, 805–812. [Google Scholar] [CrossRef]
  29. Omran, M.; Fabritius, T.; Abdel-Khalek, N.; El-Aref, M.; Elmanawi, A.E.-H.; Nasr, M.; Elmahdy, A. Microwave Assisted Liberation of High Phosphorus Oolitic Iron Ore. J. Miner. Mater. Charact. Eng. 2014, 2, 414–427. [Google Scholar] [CrossRef]
  30. Kingman, S.W.; Vorster, W.; Rowson, N.A. The Influence of Mineralogy on Microwave Assisted Grinding. Miner. Eng. 2000, 13, 313–327. [Google Scholar] [CrossRef]
  31. Marion, C.; Jordens, A.; Maloney, C.; Langlois, R.; Waters, K.E. Effect of Microwave Radiation on the Processing of Cu-Ni Sulphide Ore. Can. J. Chem. Eng. 2016, 94, 117–127. [Google Scholar] [CrossRef]
  32. Vorster, W.; Rowson, N.A.; Kingman, S.W. The Effect of MICROWAVE Radiation Upon the Processing of Neves Corvo copper Ore. Int. J. Miner. Process. 2001, 63, 29–44. [Google Scholar] [CrossRef]
  33. Batchelor, A.R.; Jones, D.A.; Plint, S.; Kingman, S.W. Increasing the Grind Size for Effective Liberation and Flotation of a Porphyry Copper Ore by Microwave Treatment. Miner. Eng. 2016, 94, 61–75. [Google Scholar] [CrossRef]
  34. Kumar, A.; Kamath, B.P.; Ramarao, V.V.; Mohanty, D.B. Microwave Energy Aided Mineral Comminution. In Proceedings of the International Seminar on Mineral Processing Technology, Chennai, India, 8–10 March 2006; pp. 398–404. [Google Scholar]
  35. Glencore, C. XPS: A Key Team Member for the Crush It! Challenge. Available online: https://www.glencore.ca/en/Media-and-insights/Insights/XPS-A-Key-Team-Member-for-the-Crush-It-Challenge (accessed on 18 July 2020).
  36. Mejeoumov, G.G. Improved Cement Quality and Grinding Efficiency by Means of Closed Mill Circuit Modeling. Ph.D. Thesis, Civil Engineering, Texas A&M University, College Station, TX, USA, 2007. [Google Scholar]
  37. Fall, M.; Yakovlev, V.; Sahi, C.; Baranova, I.; Bowers, J.; Esquenazi, G. Energy Efficient Microwave Hybrid Processing of Lime for Cement, Steel, and Glass Industries; Ceralink Inc.: Troy, NY, USA, 2012. [Google Scholar]
  38. Kar, B.B.; Panda, T.; Dash, S.; Mustakim, S.M. Phase Changes During Microwave Sintering of Flyash. Int. J. Innov. Res. Sci. Eng. Technol. 2013, 2, 4131–4136. [Google Scholar]
  39. Hartlieb, P.; Grafe, B. Experimental Study on Microwave Assisted Hard Rock Cutting of Granite. BHM 2017, 162, 77–81. [Google Scholar] [CrossRef] [Green Version]
  40. Wang, Y.; Forssberg, E.; Svensson, M. Microwave Assisted COMMINUTION and Liberation of Minerals. In Mineral Processing on the Verge of the 21st Century; Özbayoğlu, G., Hoşten, Ç., Atalay, M.Ü., Hiҫyılmaz, C., Arol, A.İ., Eds.; A.A. Balkema: Rotterdam, The Netherlands, 2000; p. 753. ISBN 90 5809 172 4. [Google Scholar]
  41. Bilen, C. Microwave Assisted Limestone Grinding. Part. Sci. Technol. 2021, 1–14. [Google Scholar] [CrossRef]
  42. Akhtar, K.; Khan, S.A.; Khan, S.B.; Asiri, A.M. Scanning Electron Microscopy: Principle and Applications in Nanomaterials Characterization. In Handbook of Materials Characterization; Sharma, S.K., Verma, D.S., Khan, L.U., Kumar, S., Khan, S.B., Eds.; Springer International Publishing AG: Basel, Switzerland, 2018; pp. 113–145. ISBN 97833199295452. [Google Scholar]
  43. Milinovic, J.; Dias, Á.A.; Janeiro, A.I.; Pereira, M.F.; Martins, S.; Petersen, S.; Barriga, F.J. XRD Identification of Ore Minerals during Cruises: Refinement of Extraction Procedure with Sodium Acetate Buffer. Minerals 2020, 10, 160. [Google Scholar] [CrossRef] [Green Version]
  44. Amana. Amana Commercial Microwave Oven Owner’s Manual; Amana: Benton Harbor, MI, USA, 2001. [Google Scholar]
  45. Man, Y.T. Why is the Bond Ball Mill Grindability Test Done the Way It Is done? Eur. J. Miner. Process. Environ. Prot. 2002, 2, 34–39. [Google Scholar]
  46. Bico, F.C. Bond Bico Ball Mill Manual; Bico Braun International: Burbank, CA, USA, 2009. [Google Scholar]
  47. Bond, F.C. Crushing and Grinding Calculations—Part I. Br. Chem. Eng. 1961, 6, 378–385. [Google Scholar]
  48. Batchelor, A.R.; Buttress, A.J.; Jones, D.A.; Katrib, J.; Way, D.; Chenje, T.; Stoll, D.; Dodds, C.; Kingman, S.W. Towards Large Scale Microwave Treatment of Ores: Part 2-Metallurgical Testing. Miner. Eng. 2017, 111, 5–24. [Google Scholar] [CrossRef]
  49. Mosher, J.B.; Tague, C.B. Conduct and Precision of Bond Grindability Testing. Miner. Eng. 2001, 14, 1187–1197. [Google Scholar] [CrossRef]
  50. Walkiewicz, J.W.; Kazonich, G.; McGill, S.L. Microwave Heating Characteristics of Minerals and Compounds. Miner. Metall. Process. 1988, 39, 39–42. [Google Scholar]
  51. Lovás, M.; Znamenáčková, I.; Zubrik, A.; Kováčová, M.; Dolinská, S. The Application of Microwave Energy in Mineral Processing-A Review. Acta Montan. Slovaca 2011, 16, 137–148. [Google Scholar]
  52. Zhu, Y.; Li, Y.; Ding, H.; Lu, A.; Li, Y.; Wang, C. Infrared Emission Properties of a Kind of Natural Carbonate: Interpretation from Mineralogical Analysis. Phys. Chem. Miner. 2020, 47, 1–15. [Google Scholar] [CrossRef]
  53. So, R.T.; Blair, N.E.; Masterson, A.L. Carbonate Mineral Identification and Quantification in Sediment Matrices Using Diffuse Reflectance Infrared Fourier Transform Spectroscopy. Environ. Chem. Lett. 2020, 18, 1725–1730. [Google Scholar] [CrossRef]
  54. Adamu, M.B. Fourier Transform Infrared Spectroscopic Determination of Shale Minerals in Reservoir Rocks. Niger. J. Basic Appl. Sci. 2010, 18, 6–18. [Google Scholar] [CrossRef] [Green Version]
  55. Saikia, B.J.; Parthasarathy, G.; Sarmah, N.C. Fourier Transform Infrared Spectroscopic Estimation of Crystallinity in SiO2 Based Rocks. Bull. Mater. Sci. 2008, 31, 775–779. [Google Scholar] [CrossRef] [Green Version]
  56. Hosseini, S.A.; Niaei, A.; Salari, D. Production of γ-Al2O3 from Kaolin. Open J. Phys. Chem. 2011, 1, 23–27. [Google Scholar] [CrossRef] [Green Version]
  57. Ali, A.Y.; Bradshaw, S.M. Bonded-Particle Modelling of Microwave-Induced Damage in Ore Particles. Miner. Eng. 2010, 23, 780–790. [Google Scholar] [CrossRef]
  58. Arena, A.; Delle Piane, C.; Sarout, J. A New Computational Approach to Cracks Quantification from 2D Image Analysis: Application to Micro-Cracks Description in Rocks. Comput. Geosci. 2014, 66, 106–120. [Google Scholar] [CrossRef]
  59. Buckman, J.; Bankole, S.A.; Zihms, S.; Lewis, H.; Couples, G.; Corbett, P.W.M. Quantifying Porosity Through Automated Image Collection and Batch Image Processing: Case study of three carbonates and an aragonite cemented sandstone. Geosciences 2017, 7, 70. [Google Scholar] [CrossRef] [Green Version]
Figure 1. Microwave-assisted sorting and grinding; mineral processing (modified after [24]) and microwave-assisted grinding; cement production (modified after [36]).
Energies 14 03991 g001
Figure 2. FESEM-EDX analysis of the studied samples: (a) SEM image of S1, (b) SEM image of S2, (c) EDX image of S1, (d) EDX image of S2, and (e) elemental composition of S1 and S2.
Energies 14 03991 g002
Figure 3. (a,b) Particle size distribution of the feeds and standard Bond ball mill grindability test of steady-state products, (c,d); work indices of the studied samples (microwave treatment conditions: 2.45 GHz, 1.7 kW).
Energies 14 03991 g003
Figure 4. FTIR spectra of the untreated (UT) and microwave-treated (MWT) samples. (a) S1); (b) S2.
Energies 14 03991 g004
Figure 5. XRD results of the untreated and microwave-treated (2.45 GHz, 1.7 kW, 4 min) representative samples (a) S1 and (b) S2; (c) comparison of the peak intensities of untreated and microwave-treated S1; (d) comparison of the peak intensities of untreated and microwave-treated S2.
Energies 14 03991 g005
Figure 6. SEM images (×15,000, 5 kV) of the untreated and microwave-treated (2.45 GHz, 1.7 kW, 4 min) sample S1: (ad) untreated, (eh) microwave-treated.
Energies 14 03991 g006
Figure 7. SEM images (×15,000, 5 kV) of the untreated and microwave treated (2.45 GHz, 1.7 kW, 4 min) sample S2: (ad): untreated, (eh): microwave-treated.
Energies 14 03991 g007
Figure 8. (a,b) Crack length per unit area of the untreated and microwave-treated S1 and S2. (c,d) Crack wideness per unit area of the untreated and microwave-treated S1 and S2 samples.
Energies 14 03991 g008
Table 1. Mineral/ore studies for microwave-assisted grinding (2.45 GHz).
Mineral/
Ore
CountryMass
(kg)
Feed Size
(mm)
MW Power (kW)t
(min)
Measured Property(%) Impact on Measured PropertyRef.
MagnetiteUSA0.35−3.363.03.5RWI+21.4[23]
TaconiteUSA0.35−3.363.03.5RWI+18.2[23]
HematiteUSA0.35−3.363.03.5RWI+23.7[23]
HematiteEgypt0.10-0.91.0−125 µm+13.2[27]
HematiteIndia0.50−19.05
+12.70
0.92.0−253 µm+47.9[28]
HematiteEgypt0.05−0.1250.91.0−125 µm+13.2[29]
Sulphide *Portugal0.50−22.502.61.5RWI+68.0[30]
SulphideCanada0.253.363.01.5RWI+41.5[31]
Gold *Guinea0.5022.502.64.0RWI+2.9[30]
Copper *Portugal0.50-2.61.5RWI+70.0[32]
CopperChile1.25−53.00 + 9.5014.1-RWI+8.0[33]
Sphalerite *India3.00−19.00 + 2.004.05.0RWI+30.0[34]
Nickel USA0.10−2.00 + 1.001.015.0RWI+3.6[26]
Copper (1)Turkey1.00−3.406.010.0BWI−7.0[22]
Copper (2)Turkey1.00−3.406.02.0BWI+13.2[22]
* Water quenching after microwave treatment. USA—United States of America, Ref.—reference, RWI—relative work index, t—sample exposure time.
Table 2. Bond Ball mill grindability test results for different runs of sample S1 (sieve test size = 106 μm; average pack density = 1.8321 g/cm3).
Sample StatusTime (min)ParameterRun Number
12345678
Untreated (UT)0 (test 1)No. Rev.100229231216199190191-
Gbp1.48361.43891.51981.64941.73491.73481.7352-
0 (test 2)No. Rev. 100200227214199197190191
Gbp1.54021.46231.53951.64961.67761.73631.73271.7320
Microwave-
treated (MWT)
2No. Rev.100288234209192185185185
Gbp1.191.38851.56121.70521.78391.78841.78821.7868
4No. Rev. 100238224200190187180181
Gbp1.4281.47431.63331.73591.76341.83351.83131.8307
6No. Rev. 100235228201184179180-
Gbp1.4461.4491.62871.77981.8391.83881.8374-
No. of Rev.—number of revolutions used for the run, Gbp—grindability after run completion, expressed as grams generated below the test size per revolution (g/revolution).
Table 3. Bond Ball mill grindability test results for different runs of sample S2 (sieve test size = 106 μm, average pack density = 1.5920 g/cm3).
Sample StatusTime (min)ParameterRun Number
1234567
Untreated (UT)0 (test 1)No. of Rev.100958788756163
Gbp2.91213.23733.23783.75264.53724.53514.5357
0 (test2)No. of Rev.100958685736263
Gbp2.90013.27863.34763.84054.50854.51694.5146
Microwave-
treated (MWT)
2No. of Rev.100787171747171
Gbp3.44213.94093.99463.85594.01594.01524.0128
4No. of Rev.100837575747373
Gbp3.25913.76163.78293.83773.91233.91143.9127
6No. of Rev.100877976767575
Gbp3.13913.57543.72113.73393.81613.81483.8155
Table 4. Test repeatability of the Bond work index for untreated samples S1 and S2.
Sample Test P1 (μm)Gbp (g/rev)P80 (μm)F80 (μm)Wi (kWh/ton)Variation (%)
S111061.735091.52244411.490.087
21061.733791.30244411.48
S211064.536090.5523655.210.384
21064.513389.4023655.19
Publisher’s Note: MDPI stays neutral with regard to jurisdictional claims in published maps and institutional affiliations.

