Abstract
The present study reports the development of a deep learning artificial intelligence (AI) model for predicting the thermal performance of evaporative cooling systems, which are widely used for thermal comfort in different applications. The existing, conventional methods for the analysis of evaporation-assisted cooling systems rely on experimental, mathematical, and empirical approaches in order to determine their thermal performance, which limits their applications in diverse and ambient spatiotemporal conditions. The objective of this research was to predict the thermal performance of three evaporation-assisted air-conditioning systems—direct, indirect, and Maisotsenko evaporative cooling systems—by using an AI approach. For this purpose, a deep learning algorithm was developed and lumped hyperparameters were initially chosen. A correlation analysis was performed prior to the development of the AI model in order to identify the input features that could be the most influential for the prediction efficiency. The deep learning algorithm was then optimized to increase the learning rate and predictive accuracy with respect to experimental data by tuning the hyperparameters, such as by manipulating the activation functions, the number of hidden layers, and the neurons in each layer by incorporating optimizers, including Adam and RMsprop. The results confirmed the applicability of the method with an overall value of R2 = 0.987 between the input data and ground-truth data, showing that the most competent model could predict the designated output features (, , and ). The suggested method is straightforward and was found to be practical in the evaluation of the thermal performance of deployed air conditioning systems under different conditions. The results supported the hypothesis that the proposed deep learning AI algorithm has the potential to explore the feasibility of the three evaporative cooling systems in dynamic ambient conditions for various agricultural and livestock applications.
1. Introduction
The development of low-cost, energy-efficient air-conditioning (AC) systems or devices has received noticeable attention, especially in developing countries due to the fuel poverty [1], energy scarcity [2], and inherently perceived environmental problems [3]. In developed countries, mechanical vapor compression (MVC) based AC (MVCAC) systems are extensively used in residential and commercial buildings to maintain living comfort with respect to the temperature. According to estimations, the creation of the prerequisite living comfort consumes around half of the building’s principal energy supply [4]. However, the refrigerants that are employed in MVCAC systems for the generation of a cooling load have a high global warming potential; furthermore, they are profoundly sensitive to operate. Despite the introduction of advance, environmentally friendly refrigerants into MVCAC systems, comprehending with admissible carbon footprints and greenhouse gas emissions [5], the MVCAC systems are neither energy-efficient nor sustainable cost-effective solutions in the longer run, particularly for low-income [6,7,8].
Thermal vapor compressors (TVCs) have also been investigated as an alternative option for AC applications [9]. In TVC systems, the adsorbent material is the most crucial facet [10]. Therefore, researchers have employed various adsorbents to evaluate their applicability in TVC systems. In this context, silica gel has been extensively studied as an adsorbent. Similarly, polymer- and carbon-based sorbents have been investigated for various AC applications for greenhouses and livestock [11,12,13,14,15]. It was reported that hydrophilic polymeric sorbents surpassed silica gel in dehumidification applications [16]. In addition, these materials are regenerated at high temperatures (~70–95 °C) [10]. Therefore, a substantial amount of heat is required to regenerate the adsorbent bed, thus stressing the need to use renewable energy sources.
Evaporation-assisted air conditioning (E-AC) systems are traditional methods of propagating cooling at relatively low temperatures and are characterized as highly energy-efficient systems with zero climatic impact [17,18,19,20]. The employment of E-AC systems has been revived due to the introduction of new concepts/systems for achieving cooling. Broadly, these E-AC systems are classified as direct evaporative cooling (DEC) [21], indirect evaporative cooling (IEC) [4], or Maisotsenko evaporative cooling (MEC) [2,22,23,24,25] systems. The working principles and open-cycle psychrometric presentations of the E-AC systems can be elucidated with the help of Figure 1. Concerning their applications, E-AC systems have been used in greenhouse AC [26,27], building AC [21], agricultural product storage [28], and livestock and poultry AC [16,29,30,31,32]. However, the type of E-AC that must be employed for a specific application is sensitive to the required thermal comfort. Various analytical/empirical models have been created in order to anticipate the results of E-AC systems due to their different cooling capacities/potentials and thermal performance [33,34,35,36,37]. These studies resulted in a few mathematical/empirical/numerical models that were developed based on the heat- and mass-balance strategy. The few limitations linked with these evolved computational models include detailed heat- and mass-transfer knowledge and the parametric information of the empirical models. In addition, the thermal performance of E-AC systems outside the operational range of the empirical models cannot be predicted. The models are also not capable of operating accurately in actual (dynamic) settings, thereby leading to the presence of uncertainties and errors in the simulated results. Thermal performance indicators are unavoidably affected by the lack of optimal operating conditions.
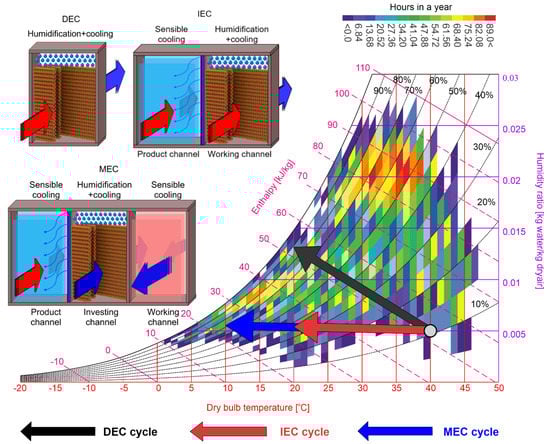
Figure 1.
Working principles of E-AC systems and their open-cycle psychrometric presentations with hourly variations of the ambient conditions in Pakistan.
Software-based simulation packages have also been designed and have been broadly utilized by energy communities all over the globe. These programs/packages (including TRNSYS, ANSYS, and EnergyPlus) were developed based on energy- and mass-balance equations in order to investigate the transient states of AC systems. Additionally, such software programs have the potential to estimate the capacities of AC systems that could be feasible for specific applications based on the measurement of their heating and cooling loads. However, detailed professional knowledge and knowledge of the technicalities of the software are required to make these useful. Moreover, computer simulation models have reportedly been developed by considering predefined assumptions in order to solve analytical equations, which limits their utilization. However, developed software packages impact the thermal performance prediction of AC systems due to neglecting the complex interaction of AC systems with the installed locality in real scenarios [38].
Artificial intelligence (AI) is a data-learning methodology for constructing deep learning algorithms that reliably predict the results of complicated systems without knowing the actual processes incorporated inside the systems. Artificial neural networks (ANNs) and supervised data learning models can fit complex nonlinear relationships. Therefore, they are trained based on past experiences or records obtained from lab-scale experiments. Statistical error-minimizing models are used to evaluate the prediction accuracy of a constructed AI algorithm. In addition, the hyperparameters of an AI model, such as the activation functions for the input features, hidden layers, the number of neurons in each layer, weights, biases, and transfer functions, are tuned for reliable estimations.
With the influx of data-learning modeling techniques, researchers and scientists worldwide have incorporated them in order to find solutions to complex problems based on historical experiences. Certainly, work regarding the prediction of the thermal performance of an E-AC system has been performed. Sohani et al. [39] employed three soft computing techniques—ANN, multivariate regression modeling (MVR), and genetic programming (GP)—for the prediction of two variables, such as the pressure drop and outlet air temperature, by passing ambient air through a DEC system. Cellulose pads were employed as evaporative media. The results were compared with those of analytical models of DEC systems. The results tended to show that the ANN and MVR modeling algorithms had more precise anticipation potential for the DEC system. Likewise, studies regarding IEC AC systems were also conducted, and the thermal performance was evaluated by using deep learning algorithms [40]. In order to predict the thermal performance of an IEC system, Kiran et al. [40] utilized a fuzzy interface system (FIS), ANN, and adaptive neuro-fuzzy interface (ANFI). The Levenberg–Marquardt (LM) training algorithm was employed to develop intricate patterns and compare them with lab-scale experimental records published in renowned journals. According to Kiran et al. [40], the ANN was the superior algorithm, as it had a good agreement (R2 = 0.9999) with the thermal performance found with the lab-scale prototype model. In the same context, Sohani et al. [41] focused on developing an AI-based model in order to predict the thermal performance of an MEC system. The cooling capacity and coefficient of performance (COP) of the MEC prototype (with reference to [42]) were modeled by using a type of group method of data handling (GMDH) neural network. The GMDH neural network escapes the concerns regarding the optimization of the hyperparameters for model regression. Based on the results, the optimized rating conditions for the MEC system could improve the COP and CC by 8.1% and 6.9%, respectively.
However, a research gap is present in previous work and is addressed in this study through the development of a generic algorithm that enables the simultaneous anticipation of the thermal performance of different E-AC systems, i.e., DEC, IEC, and MEC systems. The model was trained with experimental data and with models of the empirical effectiveness coefficient, which were recorded by using prototypes that were designed, fabricated, and installed in the Agricultural Engineering Department of Bahauddin Zakariya University (Multan). Furthermore, the governing hyperparameters for the model regression were optimized in order to accurately and effectively forecast the outcomes. Lastly, the predicted values were compared with the experimental and simulated results.
Motivation of the Study
E-AC systems have great potential in agricultural, livestock, and industrial applications, which urged us to develop an AI model that can assess their thermal performance under various ambient conditions. Notably, it is very crucial to evaluate the thermal performance of E-AC systems used for different applications with various operating conditions. To our knowledge, there are no empirical/mathematical models available in the literature that can accurately predict the thermal performance of various E-AC and cooling systems. Therefore, this study aims to use an AI algorithm (e.g., deep learning) to accurately predict the thermal performance of different evaporative cooling systems—DEC, IEC, and MEC systems—under any climatic conditions. The novelty in this study is the development of a generic algorithm that can precisely anticipate the performance of the three E-AC systems.
The detailed applications of the proposed method in terms of the ambient conditions, inlet velocity, surface area, and type of E-AC system can be seen in Figure 2. The wide range of applications and highly accurate predictions make the proposed method quite beneficial for researchers and industries that work in a similar area. The proposed method should be extended for a wide range of climates and dual cooling systems, as well as for different operating conditions and applications. In addition, the most influential parameters of the thermal performance of the different E-AC systems are identified.
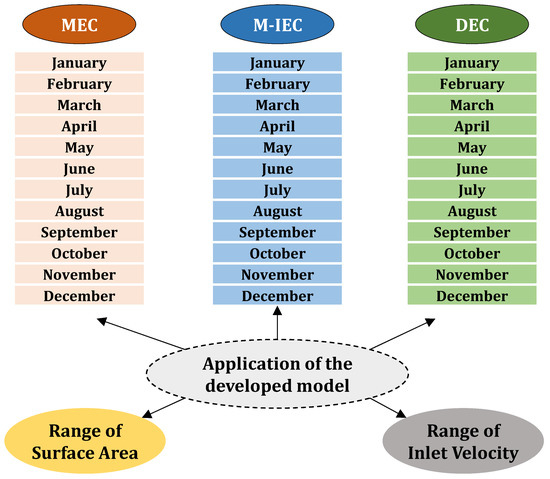
Figure 2.
Applications of the proposed model.
2. Methodology
In this section, the data collection, data normalization, data visualization, and evaluation of the DEC, IEC, and MEC systems are accomplished through feature engineering and are specifically provided. However, the results regarding optimization of the model are presented in Section 2.5. After finding the optimal neural network, unseen data were used as input in order to anticipate the thermal performance of the E-AC systems. The predicted results were validated with lab-scale experimental records. Figure 3 presents a flowchart that depicts the development of the deep learning algorithm.
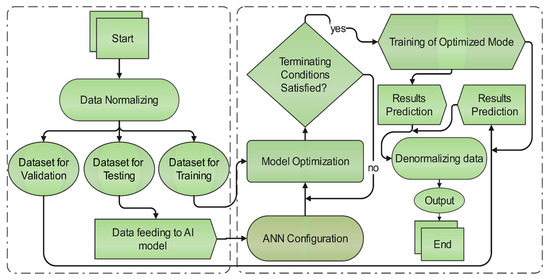
Figure 3.
Flowchart of the deep learning algorithm.
2.1. Data Collection
For the training of the AI model, the experimental data were obtained from E-AC prototype models that were developed and tested at the Agricultural Engineering Department of Bahauddin Zakariya University (Multan). The details regarding the experimental results can be found in the published literature [16,29]. Models of the empirical effectiveness coefficient were also used accordingly. The empirical model was developed by using the experimental results [16,29]. The cited literature mostly employed steady-state analyses that used effectiveness coefficients. The effectiveness of the DEC system ranged between 75 and 95%, whereas it ranged between 50 and 65% for the IEC and MEC systems. However, the effectiveness was considered as 0.95 in this case for all E-AC systems. Consequently, the governing equations of the effectiveness coefficients are provided in Equations (1)–(3).
where shows the effectiveness coefficient based on the wet-bulb and dew-point temperatures for the DEC/IEC systems and MEC system, respectively. The collected data were grouped into training, testing, and validation datasets after normalization. The technique employed to normalize the datasets is discussed in its respective section. A database of up to 1095 experimental data points (daily average input features of the three E-AC systems) was produced for the cooling assessment of the DEC, IEC, and MEC systems. The ranges of all of the investigated parameters (both input and output) are presented in Table 1. It was observed that the investigation extended to a wide range of ambient inlet conditions. It included nearly every categorization of the Köppen–Geiger climate classification [43], emphasizing the applicability of the developed AI model in several climates.

Table 1.
Ranges of the considered parameters.
2.2. Data Normalization
Data normalization is a technique of rescaling datasets into a range between 0 and 1 in order to improve the performance efficiency of a developed AI model. From Table 1, it can be observed that the input and output features fell into different ranges. Therefore, the dataset considered here was normalized by using Equation (4), which is termed the Min-Max scaler. In addition, historical experience has shown that data normalization is more effective in minimizing the computation time, training mistakes, and data redundancies and in omitting outliers during the development of AI algorithms [44]. After developing an optimized AI model, the datasets were denormalized into their actual values by using Equation (5). Similarly, when testing the AI model, unseen datasets were first normalized and then passed to the AI model. The predicted results were denormalized for user understanding.
where X shows all of the considered input and output features that need to be normalized prior to their feeding into the AI model for data learning. The max and min subscripts show the maximum and minimum values recorded for each input and output feature.
2.3. Data Visualization and Analysis of the Correlation Matrix
Feature engineering was performed to select the most suitable input features for developing a simplified AI model that is capable of accurate prediction of thermal performance. The ambient conditions in which the system performed, such as the dry-bulb temperature (), dew-point temperature (), wet-bulb temperature (), relative humidity (), humidity ratio (, and enthalpy (), were taken into consideration. Similarly, the physical parameters of the E-AC systems, including the velocity and area through which the ambient air flowed, were assumed to be influential parameters. On the other hand, among the output features, , , and were selected for feature engineering. The numbers of neurons in the input and output layers were adjusted based on the results obtained from the featured engineering. Only the most influential input and output features were used to develop the deep learning (DL) algorithm.
In order to show the dependency of the predefined input and output features on each other, a data visualization approach, i.e., a heat map, was used. Figure 4 shows the clusters in a heat map developed using the Seaborn library. With higher correlation values, more statistically significant relationships were found between the input and output features. The correlation values between −1 and +1 displayed an inverse and direct association of the variables with the adjacent axis, respectively. However, a value of zero indicated that the variable did not statistically affect the output conditions. From Figure 4, it can be observed that, in the principal diagonal, the maximum positive correlation value was calculated, which expressed the relationship of the variable with itself. It is obvious that the same variables possess direct associations with each other. A positive correlation signals direct proportionality between variables (one variable increases, resulting in its increasing impact on the other variables), whereas the correlation magnitude explains the degree of impact.
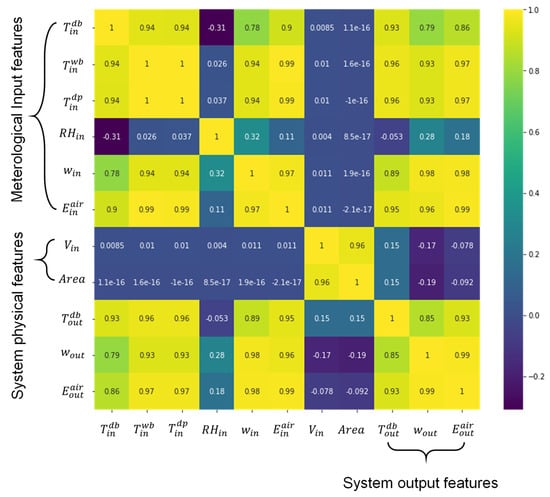
Figure 4.
Data visualization with a heat map.
A correlation chart was drawn to present the dependence of various input variables on the considered output parameters. Figure 5 contains a correlation graph that represents the dependence of the input features on each output feature. The correlation chart shown in Figure 5 was plotted by using Pearson parametric correlation [45]. The ambient conditions (, , , , ) are depicted to have a positive correlation with varying magnitudinal impact corresponding to excluding which shows a minute negative correlation. This means that high values collectively have a detrimental impact on the thermal performance of E-AC systems by decreasing the cooling capacity. Ideally, DEC and IEC systems achieve 100% relative humidity through the constant enthalpy pathway. However, in IEC systems, the humidity ratio does not increase, which distinguishes IEC systems from DEC systems, but the cooling potentials of both systems are nearly equal. On the other hand, in MEC systems, the cooling potential borders the dew-point temperature of the system’s operating conditions. Thus, higher values have an adverse influence on the thermal performance of E-AC systems. Similarly, the and values of E-AC systems have a negative correlation with the Area and Vin.
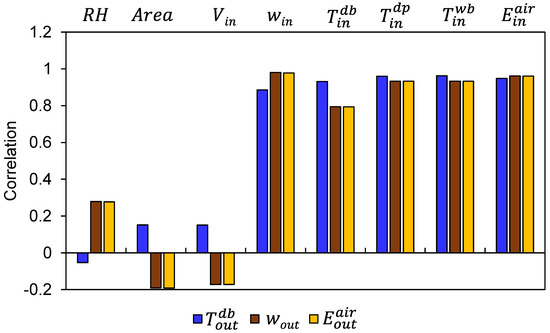
Figure 5.
Correlation graph of the most influential input features corresponding to the output features.
To develop a generalized model, six ambient parameters (, ,, , ) and two system-dependent variables (Vin and Area) were chosen to train the AI model. To predict the applicability of the E-AC systems under different climatic conditions, meteorological data points were regularly captured and made readily available on the server’s end. However, meteorological and environmental factors depend on time and copious natural processes. The other influential parameters were ignored here because they are functions of the selected ambient conditions and can be calculated by using well-known psychrometric equations. In the same way, three psychrometric variables (, , ) at the output end were adequate for evaluating the adequacy of the E-AC systems for the particular zones and application types.
To observe the dispersion of the recorded dataset, scatter plots were drawn between the output parameters and the input features, as shown in Figure 6. The most crucial output feature () of the DEC, IEC, and MEC systems was plotted against the ambient features for 365 days of operation (1095 data points). Here, a linear increment in versus and was observed, whereas in the case of and Vin, a fuzzy dispersion of the data was observed in all of the studied E-AC systems (DEC, IEC, and MEC). Thus, Figure 6 displays the wide dispersions of the data points, which needed to be normalized prior to the development of the AI model. Furthermore, no noticeable outliers that could affect the AI model’s prediction of the E-AC systems thermal performances were observed.
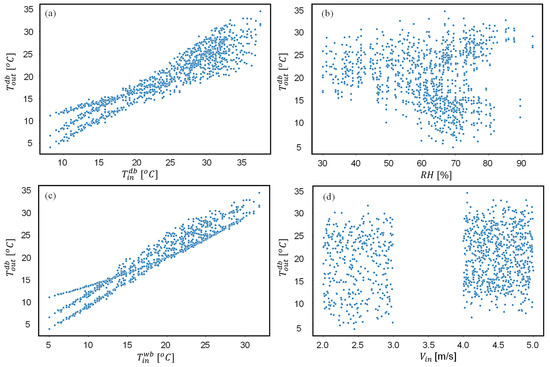
Figure 6.
Plotting of the E-AC systems’ output dry-bulb temperatures with respect to the inlet (a) dry-bulb temperature, (b) relative humidity, (c) wet-bulb temperature, and (d) velocity.
2.4. Developing and Training the AI Model
The details regarding methods of training AI algorithms can be found in the literature [46,47]. However, in this section, a few generic steps are covered. In the first step, the experimental data were loaded and then normalized. Prior to the development of the AI model, the records to be fed into the model were normalized by using the Min-Max scaler [48]. The value of each variable was then rescaled to a number ranging from 0 to 1. Upon the normalization of all of the variables, the data were separated into three classes: training, testing, and validation. Up to 80% of the data were used to train the algorithm, whereas 20% of the data were reserved for the testing. It should be highlighted here that the unseen dataset was used to test the AI model and to compare its results with the outcomes of the experimental lab-scale prototypes. In order to find the optimized model for the prediction of the considered output, the hyperparameters were tuned by varying the sets of neurons in the hidden layers, the batch sizes, the number of iterations or epochs, the activation functions, the step size, and the model learning rate.
Moreover, three activation functions—the hyperbolic tangent (tanh) [49,50], radial basis (RB) [51], and rectified linear activation (ReLU) functions [52]—were tried. In addition, various optimizers (such as Adam and RMSprop) were investigated, along with different learning rates. Furthermore, the iterations were varied from 100 to 3000 in order to mimic the loss. Lastly, various batch sizes were tried. The detailed procedure for finding the optimal AI model for the anticipation of the performance of the considered E-AC systems is presented in Figure 7. The optimal model for the estimation of the investigated output parameter had an input layer (08 neurons), two hidden layers (58–58 neurons), and an output layer (03 neurons). The optimization criteria and associated figures are presented in the next section. The learning rate was varied from 0.1 to 0.0001, whereas the tested batch sizes ranged from 200 to 10. The optimal learning rate and batch size were 0.0001 and 20, respectively.
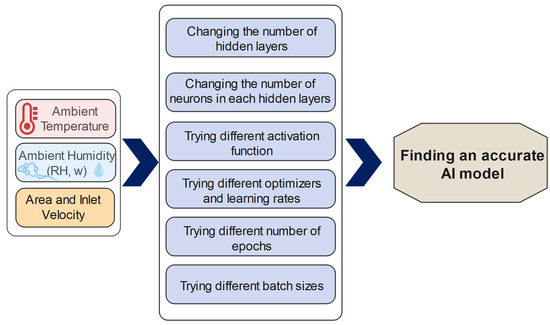
Figure 7.
The proposed method for finding the optimal model for the assessment of the thermal performance of E-AC systems.
RMSprop and ReLU were chosen as a suitable optimizer and activation function, respectively. During the training period, the iterations were changed from 100 to 3000. As a result, the required accuracy was achieved by 1400 iterations, and training was stopped there.
2.5. Correlation and Statistical Error Minimization Analysis
The artificial neural networks (ANNs) were trained to find the relationships between variables (dependent and independent) of the E-AC systems regardless of the actual process involved. In order to find the optimal AI algorithm, weights and biases were tuned in successive iterations. Various loss functions/statistical error minimization models, including the coefficient of determination (R2), mean absolute error (MAE), mean square error (MSE), and absolute average relative deviation (AARD), were used in this study to evaluate the accuracy of the predicted results. The general mathematical representations of the statistical error minimization models are presented in Equations (6)–(9), respectively. The optimization of the developed AI model was merely to reduce the outliers and uncertainties during prediction However, to select the optimal AI model, the hyperparameters were tuned based on the number of hidden layers, and the neurons in each layer were mapped to optimize the AI model. Correspondingly, the variations in the errors in R2, AARD%, and MAE% were calculated to acquire the model with the most precise predictions. Figure 8 presents the different combinations of neurons in hidden layer 1 and hidden layer 2. The higher the number of neurons in the hidden layers is, the deeper the AI model is; consequently, more computational time will be required for learning and predicting the thermal performance. Figure 9 displays the structure of the tuned AI model.
where n indicates the number of data points.
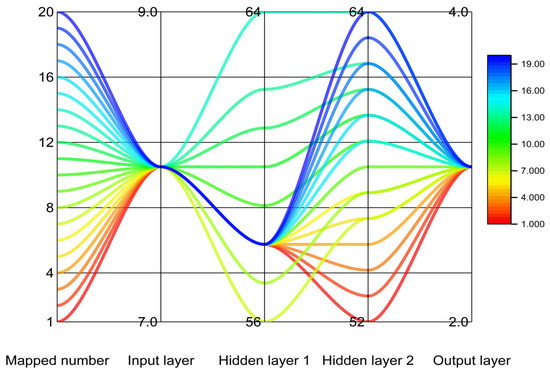
Figure 8.
Mapping of the number of neurons in the hidden layers.
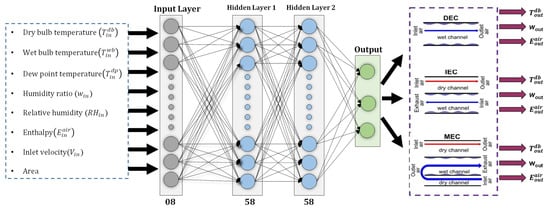
Figure 9.
Structure of the optimal deep learning model.
3. Results and Discussion
The study focuses on the development of a generic model that accurately predicts the outcomes of E-AC systems for use in multiple applications. By using statistical error minimization models, the most optimal parameters were adopted in order to predict unseen data points. In this section, the results obtained during the data learning operation of the AI model are provided to highlight its prediction efficacy. Figure 10 showcases the iterative results obtained in order to minimize the mean square error. It is observed that the AI model learn the data well by considering the optimized hyperparameters, as discussed in the previous section. Consequently, the AI algorithm approached a mean square error value of zero at 100 iterations; then, a constant error value was seen up to 1400 iteration, and after that, the iterative loop was terminated.
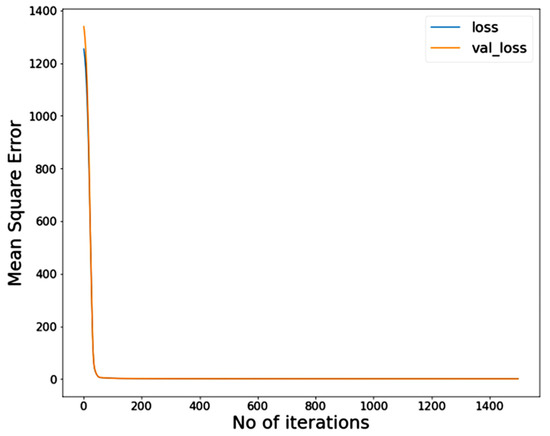
Figure 10.
Minimizing the mean square error and data learning attributes of the AI model during the training stage.
From Figure 11, it is observed that a high number of neurons in the hidden layers caused the AI model to overfit. Therefore, minimum statistical errors (R2, AARD%, and MAE%) are measured in the developed AI model having attributes of 58 neurons in both hidden layers, which can be observable in Figure 8 and Figure 11 with mapped number 9. The overall correlation measured for predicting the thermal performance of the E-AC systems with the optimized AI model was found to be 0.986. At the same time, AARD% = 4.4, 0.88, and 1.93 and MAE% = 4.44, 0.74, and 1.81 for the outlet , and , respectively, with a number of mapped neurons of nine, as shown in Figure 8 and Figure 11.
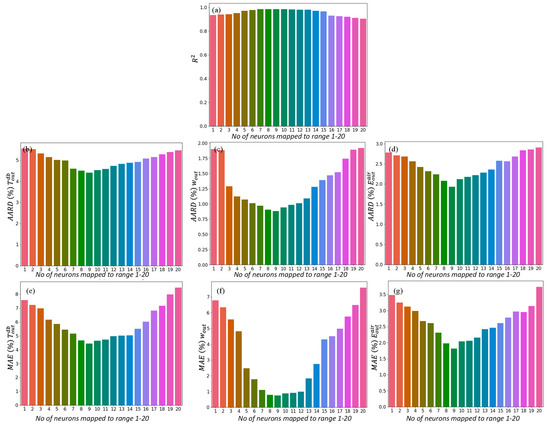
Figure 11.
Variations in (a) R2, (b–d) AARD%, and (e–g) MAE% with different numbers of neurons in the hidden layers.
Figure 12 presents the results of the trained AI model containing the optimized hyperparameters. A linear relationship between the experimental and predicted values was observed with the output features (, , and ) of the E-AC systems, which shows the excellent fitting and good learning of the experimental data. Furthermore, the kernel error density plots show the convergence of the error baskets towards the zero value. Thus, this configuration was selected as the final model for the prediction of the unseen datasets. It can be observed in Figure 12 that approximately all of the data points (except a few) converged to zero in the error density plots. In addition, by increasing the number of neurons in the hidden layers after a certain limit (mapping no. 09), the predictive accuracy decreased, thus increasing the value of the loss function. This was merely due to the overfitting caused by the development of the deep neural network. The error densities of and ranged from −4 to +2 and −4 to +4, respectively, as opposed to which ranged from −0.6 to +0.8.
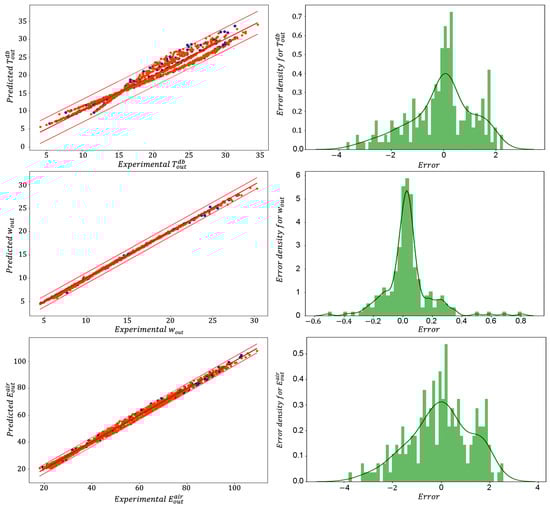
Figure 12.
Analysis of the correlation coefficients and error densities of the developed AI model.
Figure 13 shows the predicted output features (, , and ) of the E-AC systems anticipated by the developed deep learning algorithm. It was observed that the AI model accurately predicted the output characteristics and followed an essentially linear trend between the experimental and expected results. The details showed that the model was not very promising in the prediction of for the IEC and MEC systems. The range of errors was explained by the kernel error density plots, as shown in Figure 14. The x-axis of the error density plots contains the range of errors that could happen during the prediction of the unseen dataset. The normalized data points of the corresponding input features of the plots are arranged on the y-axis. The smooth curve shows the value of the error in the respective normalized data points. It is noteworthy that the maximum error in the prediction of ranged from −1.0 to +0.5 for the IEC system. This means that the predictive model contained a variation of ~±1 °C with respect to the experimental results for . However, regarding the MEC E-AC system, the actual was in a range of ~±2 °C. However, this limit is acceptable compared to the estimations of the other numerical models reported in the literature. In the same pattern, the results obtained from the AI model when predicting are presented in Figure 13. It was observed that the predictions were in decent agreement.
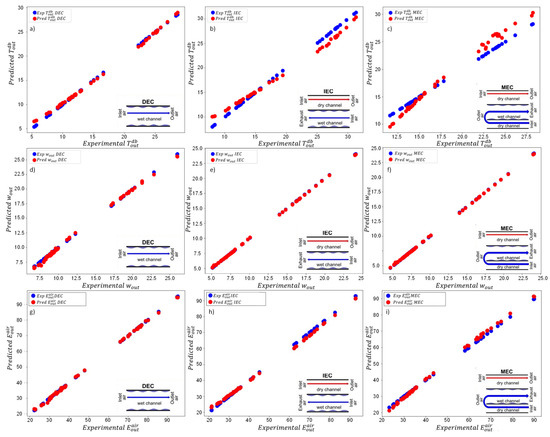
Figure 13.
Assessment of the E-AC systems(DEC, IEC, and MEC) based on the experimental and predicted results considering the output features of (a–c) , (d–f) , and (g–i) .
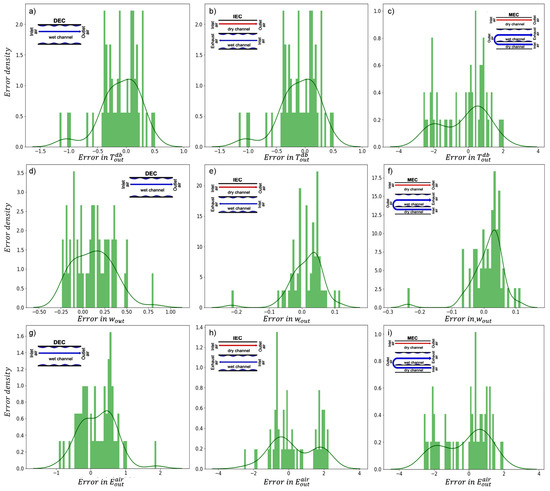
Figure 14.
Error density analysis in output features (a–c) , (d–f) and (g–i) . produced by developed AI model for predicting the thermal performances of the E-AC systems (DEC, IEC, and MEC).
Furthermore, the error density plots in Figure 14 show the accuracy of the prediction of the maximum error ranged between −0.25 and +0.75, whereas for the IEC and MEC systems, the prediction error further decreased to ±0.1, highlighting the more accurate prediction of the humidity ratio. Similarly, it was noticed that the predicted values of were well correlated with the actual values. Furthermore, the kernel error density plots showed a prediction error in a range of ±1 for the DEC system. However, for the IEC and MEC systems, the error was in a range of ±2 from the experimental values. The precise anticipation of the performance of the E-AC systems (~99%) proves the feasibility and utility of the developed AI model under dynamic conditions. The error density of most of the predicted points converged to zero, which shows the great accuracy of the proposed method in the investigation of E-AC systems. Thus, the AI model developed here can be used for a wide range of applications.
4. Impact of the Input Features on the Model Output
The SHAP library was used to determine the influence of several input functions on the output of the designed model, i.e., to forecast the output temperature, moisture, and enthalpy of the three E-AC systems. The black box technique does not consider actual natural processes, so it was not directly imposed. Therefore, the Shapley Additive exPlanation (SHAP) values were used to break down the predictions in order to highlight the influence of each parameter for explaining the developed AI model. It was apparent that the ambient conditions, inlet velocity, and surface area were the most important criteria in the prediction of the systems’ thermal performance. Figure 15 depicts the impacts of the input features on the AI model by using SHAP visualization. It was underlined that the most influential input feature with the greatest impact on the developed AI model was the enthalpy of the air (), which ranked top in the SHAP diagram. Large enthalpy values (the red gradient on the right side of the SHAP diagram from the center point) had a direct impact on the output features of the E-AC systems. On the other hand, small enthalpy values (the blue color on the left side of the SHAP diagram from the center point) were not shown to have a significant impact on the output features of the E-AC systems. In other words, the wider the color strip on the right side, the greater the tendency of an input feature to affect the AI model, and vice versa. A similar pattern was observed by decreasing the degrees of impact in sequence, such as those of the dry-bulb temperature, wet-bulb temperature, dew-point temperature, humidity ratio, and surface area. However, the inlet velocity and relative humidity displayed the inverse phenomenon. Higher values of the parameters mentioned above contributed to an inverse impact on the efficacy of the prediction of the output features with the developed AI model and vice versa. Therefore, these parameters can be modeled in order to attain a quick and accurate estimation of the thermal performance of an E-AC system. In this way, a comparison between the thermal performance of different evaporative cooling systems can be made, and the most suitable and efficient cooling system for a particular application can be selected. Moreover, this investigation can be extended to any evaporative cooling system (even to dual systems) operating in any climate.
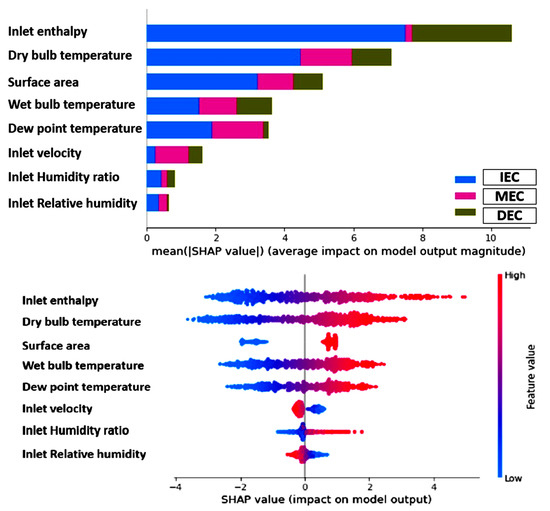
Figure 15.
Average impact of each feature on the model’s output for the three E-AC systems.
5. Conclusions
In this study, an artificial intelligence (AI)-based deep learning (DL) algorithm was developed in order to assess the thermal performance of evaporation-assisted air conditioning (E-AC) systems. This study employed three E-AC systems—direct, indirect, and Maisotsenko—to assess the thermal performance of systems for multiple applications. Prior to the development of the generic AI model, the most influential input features were selected based on a correlation analysis. A database of 1095 points was used and was split 80/20 for training/testing. The AI model was trained and optimized, resulting in a suitable learning rate and batch size of 0.0001 and 20, respectively. In addition, the RMsprop optimizer was found to be suitable for optimizing the AI model to anticipate the thermal performance of the E-AC systems. The AI model developed here was evaluated with an unseen database. The results showed a good agreement. Moreover, the simplicity and high accuracy of the model’s predictions make it valid for any E-AC system. An accuracy of R2 = 0.986 could be achieved when predicting the thermal performance of DEC, IEC, and MEC systems. The simple, fast, and accurate predictive ability of the model makes it suitable for cooling applications that involve evaporative cooling systems.
Author Contributions
Conceptualization, H.M.A., U.S., M.S., K.H., C.-C.W. and R.R.S.; Data curation, H.M.A., U.S., M.S., I.H., K.H., R.R.S. and M.U.K.; Formal analysis, H.M.A., U.S., M.S., I.H. and R.R.S.; Funding acquisition, M.S. and R.R.S.; Investigation, H.M.A., U.S., I.H., K.H., M.A. and M.U.K.; Methodology, U.S., M.S., I.H., K.H., M.A., R.R.S. and M.U.K.; Project administration, U.S., M.S., and C.-C.W.; Software, U.S., M.S., I.H., K.H., M.A. and R.R.S.; Supervision, M.S. and C.-C.W.; Validation, U.S., I.H., K.H. and C.-C.W.; Visualization, M.A., R.R.S. and M.U.K.; Writing—original draft, H.M.A., U.S. and M.S.; Writing—review and editing, I.H., K.H., M.A., C.-C.W., R.R.S. and M.U.K. All authors have read and agreed to the published version of the manuscript.
Funding
This research received no external funding.
Institutional Review Board Statement
Not applicable.
Informed Consent Statement
Not applicable.
Data Availability Statement
The data are contained within the article.
Acknowledgments
The authors acknowledge the financial support from the Open Access Publication Fund of the Leibniz Association, Germany, as well as the partial research funding and editorial support from Adaptive AgroTech Consultancy International.
Conflicts of Interest
The authors declare no conflict of interest.
References
- Looney, B. Statistical Review of World Energy, 2020 | 69th Edition. Bp 2020, 69, 66. [Google Scholar]
- Mahmood, M.H.; Sultan, M.; Miyazaki, T.; Koyama, S.; Maisotsenko, V.S. Overview of the Maisotsenko cycle—A way towards dew point evaporative cooling. Renew. Sustain. Energy Rev. 2016, 66, 537–555. [Google Scholar] [CrossRef]
- Pérez-Lombard, L.; Ortiz, J.; Pout, C. A review on buildings energy consumption information. Energy Build. 2008, 40, 394–398. [Google Scholar] [CrossRef]
- Shahzad, M.W.; Lin, J.; Xu, B.B.; Dala, L.; Chen, Q.; Burhan, M.; Sultan, M.; Worek, W.; Ng, K.C. A spatiotemporal indirect evaporative cooler enabled by transiently interceding water mist. Energy 2021, 217, 119352. [Google Scholar] [CrossRef]
- Devecioʇlu, A.G.; Oruç, V. Characteristics of Some New Generation Refrigerants with Low GWP. Energy Procedia 2015, 75, 1452–1457. [Google Scholar] [CrossRef] [Green Version]
- She, X.; Cong, L.; Nie, B.; Leng, G.; Peng, H.; Chen, Y.; Zhang, X.; Wen, T.; Yang, H.; Luo, Y. Energy-efficient and -economic technologies for air conditioning with vapor compression refrigeration: A comprehensive review. Appl. Energy 2018, 232, 157–186. [Google Scholar] [CrossRef]
- Sajjad, U.; Amer, M.; Ali, H.M.; Dahiya, A.; Abbas, N. Cost effective cooling of photovoltaic modules to improve efficiency. Case Stud. Therm. Eng. 2019, 14, 100420. [Google Scholar] [CrossRef]
- Muneeshwaran, M.; Sajjad, U.; Ahmed, T.; Amer, M.; Ali, H.M.; Wang, C.C. Performance improvement of photovoltaic modules via temperature homogeneity improvement. Energy 2020, 203, 117816. [Google Scholar] [CrossRef]
- Sultan, M.; Miyazaki, T.; Saha, B.B.; Koyama, S. Steady-state investigation of water vapor adsorption for thermally driven adsorption based greenhouse air-conditioning system. Renew. Energy 2016, 86, 785–795. [Google Scholar] [CrossRef]
- Sultan, M.; Miyazaki, T.; Koyama, S. Optimization of adsorption isotherm types for desiccant air-conditioning applications. Renew. Energy 2018, 121, 441–450. [Google Scholar] [CrossRef]
- Sultan, M.; Miyazaki, T.; Koyama, S.; Khan, Z.M. Performance evaluation of hydrophilic organic polymer sorbents for desiccant air-conditioning applications. Adsorpt. Sci. Technol. 2018, 36, 311–326. [Google Scholar] [CrossRef] [Green Version]
- Sultan, M.; El-Sharkawy, I.I.; Miyazaki, T.; Saha, B.B.; Koyama, S.; Maruyama, T.; Maeda, S.; Nakamura, T. Water vapor sorption kinetics of polymer based sorbents: Theory and experiments. Appl. Therm. Eng. 2016, 106, 192–202. [Google Scholar] [CrossRef]
- Sultan, M.; El-Sharkawy, I.I.; Miyazaki, T.; Saha, B.B.; Koyama, S. An overview of solid desiccant dehumidification and air conditioning systems. Renew. Sustain. Energy Rev. 2015, 46, 16–29. [Google Scholar] [CrossRef]
- Sultan, M.; El-Sharkawy, I.I.; Miyazaki, T.; Saha, B.B.; Koyama, S.; Maruyama, T.; Maeda, S.; Nakamura, T. Insights of water vapor sorption onto polymer based sorbents. Adsorption 2015, 21, 205–215. [Google Scholar] [CrossRef]
- Sultan, M.; El-Sharkawl, I.I.; Miyazaki, T.; Saha, B.B.; Koyama, S. Experimental study on carbon based adsorbents for greenhouse dehumidification. Evergreen 2014, 1, 5–11. [Google Scholar] [CrossRef]
- Aleem, M.; Hussain, G.; Sultan, M.; Miyazaki, T.; Mahmood, M.H.; Sabir, M.I.; Nasir, A.; Shabir, F.; Khan, Z.M. Experimental investigation of desiccant dehumidification cooling system for climatic conditions of multan (pakistan). Energies 2020, 13, 5530. [Google Scholar] [CrossRef]
- Smith, S.T.; Hanby, V.I.; Harpham, C. A probabilistic analysis of the future potential of evaporative cooling systems in a temperate climate. Energy Build. 2011, 43, 507–516. [Google Scholar] [CrossRef]
- Al-Sulaiman, F. Evaluation of the performance of local fibers in evaporative cooling. Energy Convers. Manag. 2002, 43, 2267–2273. [Google Scholar] [CrossRef]
- Yang, Y.; Cui, G.; Lan, C.Q. Developments in evaporative cooling and enhanced evaporative cooling—A review. Renew. Sustain. Energy Rev. 2019, 113, 109230. [Google Scholar] [CrossRef]
- Sajjad, U.; Abbas, N.; Hamid, K.; Abbas, S.; Hussain, I.; Ammar, S.M.; Sultan, M.; Ali, H.M.; Hussain, M.; ur Rehman, T. A review of recent advances in indirect evaporative cooling technology. Int. Commun. Heat Mass Transf. 2021, 122, 105140. [Google Scholar] [CrossRef]
- Noor, S.; Ashraf, H.; Sultan, M.; Khan, Z.M. Evaporative Cooling Options for Building Air-Conditioning: A Comprehensive Study for Climatic Conditions of Multan (Pakistan). Energies 2020, 13, 3061. [Google Scholar] [CrossRef]
- Anisimov, S.; Pandelidis, D.; Danielewicz, J. Numerical analysis of selected evaporative exchangers with the Maisotsenko cycle. Energy Convers. Manag. 2014, 88, 426–441. [Google Scholar] [CrossRef]
- Caliskan, H.; Hepbasli, A.; Dincer, I.; Maisotsenko, V. Thermodynamic performance assessment of a novel air cooling cycle: Maisotsenko cycle. Int. J. Refrig. 2011, 34, 980–990. [Google Scholar] [CrossRef]
- Pandelidis, D.; Cichoń, A.; Pacak, A.; Drąg, P.; Drąg, M.; Worek, W.; Cetin, S. Performance study of the cross-flow Maisotsenko cycle in humid climate conditions. Int. Commun. Heat Mass Transf. 2020, 115, 104581. [Google Scholar] [CrossRef]
- Khalid, O.; Ali, M.; Sheikh, N.A.; Ali, H.M.; Shehryar, M. Experimental analysis of an improved Maisotsenko cycle design under low velocity conditions. Appl. Therm. Eng. 2016, 95, 288–295. [Google Scholar] [CrossRef]
- Noor, S.; Ashraf, H.; Hussain, G.; Sultan, M.; Shakoor, A.; Mahmood, M.; Riaz, M. Spatiotemporal investigation of evaporative cooling options for greenhouse air-conditioning application in Pakistan. Fresenius Environ. Bull. 2021, 2858–2870. [Google Scholar]
- Ashraf, H.; Sultan, M.; Shamshiri, R.R.; Abbas, F.; Farooq, M.; Sajjad, U.; Md-Tahir, H.; Mahmood, M.H.; Ahmad, F.; Taseer, Y.R.; et al. Dynamic Evaluation of Desiccant Dehumidification Evaporative Cooling Options for Greenhouse Air-Conditioning Application in Multan (Pakistan). Energies 2021, 14, 1097. [Google Scholar] [CrossRef]
- Islam, M.P.; Morimoto, T. Zero energy cool chamber for extending the shelf-life of tomato and eggplant. Japan Agric. Res. Q. 2012, 46, 257–267. [Google Scholar] [CrossRef] [Green Version]
- Raza, H.M.U.; Sultan, M.; Bahrami, M.; Khan, A.A. Experimental investigation of evaporative cooling systems for agricultural storage and livestock air-conditioning in Pakistan. Build. Simul. 2020, 14, 617–631. [Google Scholar] [CrossRef]
- Sultan, M.; Miyazaki, T.; Mahmood, M.H.; Khan, Z.M. Solar Assisted Evaporative Cooling Based Passive Air-Conditioning System for Agricultural and Livestock Applications Nomenclatures. J. Eng. Sci. Technol. 2018, 13, 693–703. [Google Scholar]
- Aleem, M.; Hussain, G.; Sultan, M.; Miyazaki, T. Lab-Scale Study of Desiccant Dehumidification System for Poultry Shed Air-Conditioning in Pakistan. Proc. Int. Exch. Innov. Conf. Eng. Sci. 2020, 6, 85–91. [Google Scholar] [CrossRef]
- Shahzad, K.; Sultan, M.; Bilal, M.; Ashraf, H.; Farooq, M.; Miyazaki, T.; Sajjad, U.; Ali, I.; Hussain, M.I. Experiments on Energy-Efficient Evaporative Cooling Systems for Poultry Farm Application in Multan (Pakistan). Sustainability 2021, 13, 2836. [Google Scholar] [CrossRef]
- Jradi, M.; Riffat, S. Experimental and numerical investigation of a dew-point cooling system for thermal comfort in buildings. Appl. Energy 2014, 132, 524–535. [Google Scholar] [CrossRef]
- Weerts, B. Coolerado and modeling an application of the maisotsenko cycle. Int. J. Energy Clean Environ. 2011, 12, 287–307. [Google Scholar] [CrossRef]
- Zhan, C.; Duan, Z.; Zhao, X.; Smith, S.; Jin, H.; Riffat, S. Comparative study of the performance of the M-cycle counter-flow and cross-flow heat exchangers for indirect evaporative cooling—Paving the path toward sustainable cooling of buildings. Energy 2011, 36, 6790–6805. [Google Scholar] [CrossRef]
- Pandelidis, D.; Anisimov, S.; Worek, W.M. Performance study of the Maisotsenko Cycle heat exchangers in different air-conditioning applications. Int. J. Heat Mass Transf. 2015, 81, 207–221. [Google Scholar] [CrossRef]
- Zhan, C.; Zhao, X.; Smith, S.; Riffat, S.B. Numerical study of a M-cycle cross-flow heat exchanger for indirect evaporative cooling. Build. Environ. 2011, 46, 657–668. [Google Scholar] [CrossRef]
- Deb, C.; Eang, L.S.; Yang, J.; Santamouris, M. Forecasting diurnal cooling energy load for institutional buildings using Artificial Neural Networks. Energy Build. 2016, 121, 284–297. [Google Scholar] [CrossRef]
- Sohani, A.; Zabihigivi, M.; Moradi, M.H.; Sayyaadi, H.; Hasani Balyani, H. A comprehensive performance investigation of cellulose evaporative cooling pad systems using predictive approaches. Appl. Therm. Eng. 2017, 110, 1589–1608. [Google Scholar] [CrossRef]
- Kiran, T.R.; Rajput, S.P.S. An effectiveness model for an indirect evaporative cooling (IEC) system: Comparison of artificial neural networks (ANN), adaptive neuro-fuzzy inference system (ANFIS) and fuzzy inference system (FIS) approach. Appl. Soft Comput. J. 2011, 11, 3525–3533. [Google Scholar] [CrossRef]
- Sohani, A.; Sayyaadi, H.; Hoseinpoori, S. Modeling and multi-objective optimization of an M-cycle cross-flow indirect evaporative cooler using the GMDH type neural network. Int. J. Refrig. 2016, 69, 186–204. [Google Scholar] [CrossRef]
- Anisimov, S.; Pandelidis, D.; Maisotsenko, V. Numerical study of heat and mass transfer process in the Maisotsenko cycle for indirect evaporative air cooling. Heat Transf. Eng. 2016, 37, 1455–1465. [Google Scholar] [CrossRef]
- Peel, M.C.; Finlayson, B.L.; Mcmahon, T.A. Updated world map of the Köppen-Geiger climate classification. Hydrol. Earth Syst. Sci. 2007, 11, 1633–1644. [Google Scholar] [CrossRef] [Green Version]
- Sola, J.; Sevilla, J. Importance of input data normalization for the application of neural networks to complex industrial problems. IEEE Trans. Nucl. Sci. 1997, 44, 1464–1468. [Google Scholar] [CrossRef]
- Lee Rodgers, J.; Nicewander, W.A. Thirteen ways to look at the correlation coefficient. Am. Stat. 1988, 42, 59–66. [Google Scholar] [CrossRef]
- Sajjad, U.; Hussain, I. A high-fidelity approach to correlate the nucleate pool boiling data of roughened surfaces. Int. J. Multiph. Flow 2021, 142, 103719. [Google Scholar] [CrossRef]
- Sajjad, U.; Hussain, I.; Hamid, K.; Bhat, S.A.; Ali, H.M.; Wang, C.-C. A deep learning method for estimating the boiling heat transfer coefficient of porous surfaces. J. Therm. Anal. Calorim. 2021, 1–13. [Google Scholar] [CrossRef]
- Jain, Y.K.; Bhandare, S.K. Min Max Normalization Based Data Perturbation Method for Privacy Protection. Int. J. Comput. Commun. Technol. 2013, 2, 45–50. [Google Scholar] [CrossRef]
- Zamanlooy, B.; Mirhassani, M. Efficient VLSI implementation of neural networks with hyperbolic tangent activation function. IEEE Trans. Very Large Scale Integr. Syst. 2014, 22, 39–48. [Google Scholar] [CrossRef]
- Gomar, S.; Mirhassani, M.; Ahmadi, M. Precise digital implementations of hyperbolic tanh and sigmoid function. In Proceedings of the Conference Record-Asilomar Conference on Signals, Systems and Computers 2017, Pacific Grove, CA, USA, 29 October–1 November 2017. [Google Scholar]
- Eide, Å.J.; Lindblad, T.; Paillet, G. Radial-basis-function networks. In Intelligent Systems; CRC Press: Boca Raton, FL, USA, 2016; ISBN 9781439802847. [Google Scholar]
- Agarap, A.F.M. Deep Learning using Rectified Linear Units (ReLU). arXiv 2018, arXiv:1803.08375. [Google Scholar]
Publisher’s Note: MDPI stays neutral with regard to jurisdictional claims in published maps and institutional affiliations. |
© 2021 by the authors. Licensee MDPI, Basel, Switzerland. This article is an open access article distributed under the terms and conditions of the Creative Commons Attribution (CC BY) license (https://creativecommons.org/licenses/by/4.0/).