Article

Changing Energy Supplier on the Market with a Strong Position of Incumbent Suppliers—Polish Example

Faculty of Economics, Maria Curie-Sklodowska University, Pl. M. Curie-Skłodowskiej 5, 20-031 Lublin, Poland
*
Author to whom correspondence should be addressed.
Energies 2021, 14(13), 3933; https://doi.org/10.3390/en14133933
Submission received: 22 May 2021 / Revised: 25 June 2021 / Accepted: 29 June 2021 / Published: 30 June 2021

Abstract

:
The purpose of the study is to identify factors affecting the intention to change an energy supplier. This is in a country, Poland, where competition in the energy market has been intensifying over several years, but incumbent suppliers still have an extremely strong position on the market, and the tendency to change an energy supplier is relatively low. The survey was conducted in 2020 on a sample of 1216 adults. The research results were used for a multigroup SEM (Structural Equation Modelling) analysis using AMOS 26. The main findings indicated a strong impact on a general image of a company, as well as the lack of importance of a green image of the current energy supplier. In the general research approach, there are no visible differences in the impact of the perceived price transparency on the intention to switch the supplier. However, taking into consideration two groups (a low energy bill vs. a high energy bill), some interesting differences are visible. In the markets with low consumers’ intention to switch, the strong position of incumbent suppliers is due to their exceptionally strong image in these markets. Spending time on maintenance is the biggest disadvantage for new energy suppliers who, when entering the market, have to look for differentiators.

1. Introduction

Over the past several years, many countries have been liberalising the electricity market, enabling consumers to choose their supplier freely. One of the first countries to reorganise the energy sector in 1987 was Chile. A typical enterprise strategy in this sector was vertical integration, where several large companies often had controlled generation, transmission, distribution and retailing of energy on domestic markets [1]. It was assumed that breaking up the vertical integration would allow enterprises to be competitive in the area of generation and retailing of energy, while transmission would retain its monopoly status. However, the reason for the reform implementation in each country was different. In the UK, it was decided to privatise the state-owned electricity utility [2]. In Central and Eastern European countries, it was the decentralisation of government control of the energy sector and partial privatisation of the industries, while in the US, increased competition between private suppliers and reduced regulation [3] was the main driving force. The Electricity Market Closeness Index calculated for a total of 55 countries shows significant progress in the liberalisation of the energy market in the most developed and developing countries in 1989–2007 [2]. The countries with the highest energy market liberalisation are the UK, Germany and Spain. As [2] confirms, the energy market liberalisation process is influenced by the industry sector, foreign financial support, and government ideology. Undoubtedly, one of the effects of energy sector reforms is the third-party access (TPA) to the electricity transmission grid. This allows each end customer to choose an electricity supplier.
The article aims to identify factors influencing the intention to change an energy supplier among customers of incumbent suppliers. The paper proceeds as follows: the next section provides a theoretical background with four research hypotheses. The sections that follow present research methodology and study results. The paper ends with the conclusions with some managerial implications and proposals for future research.

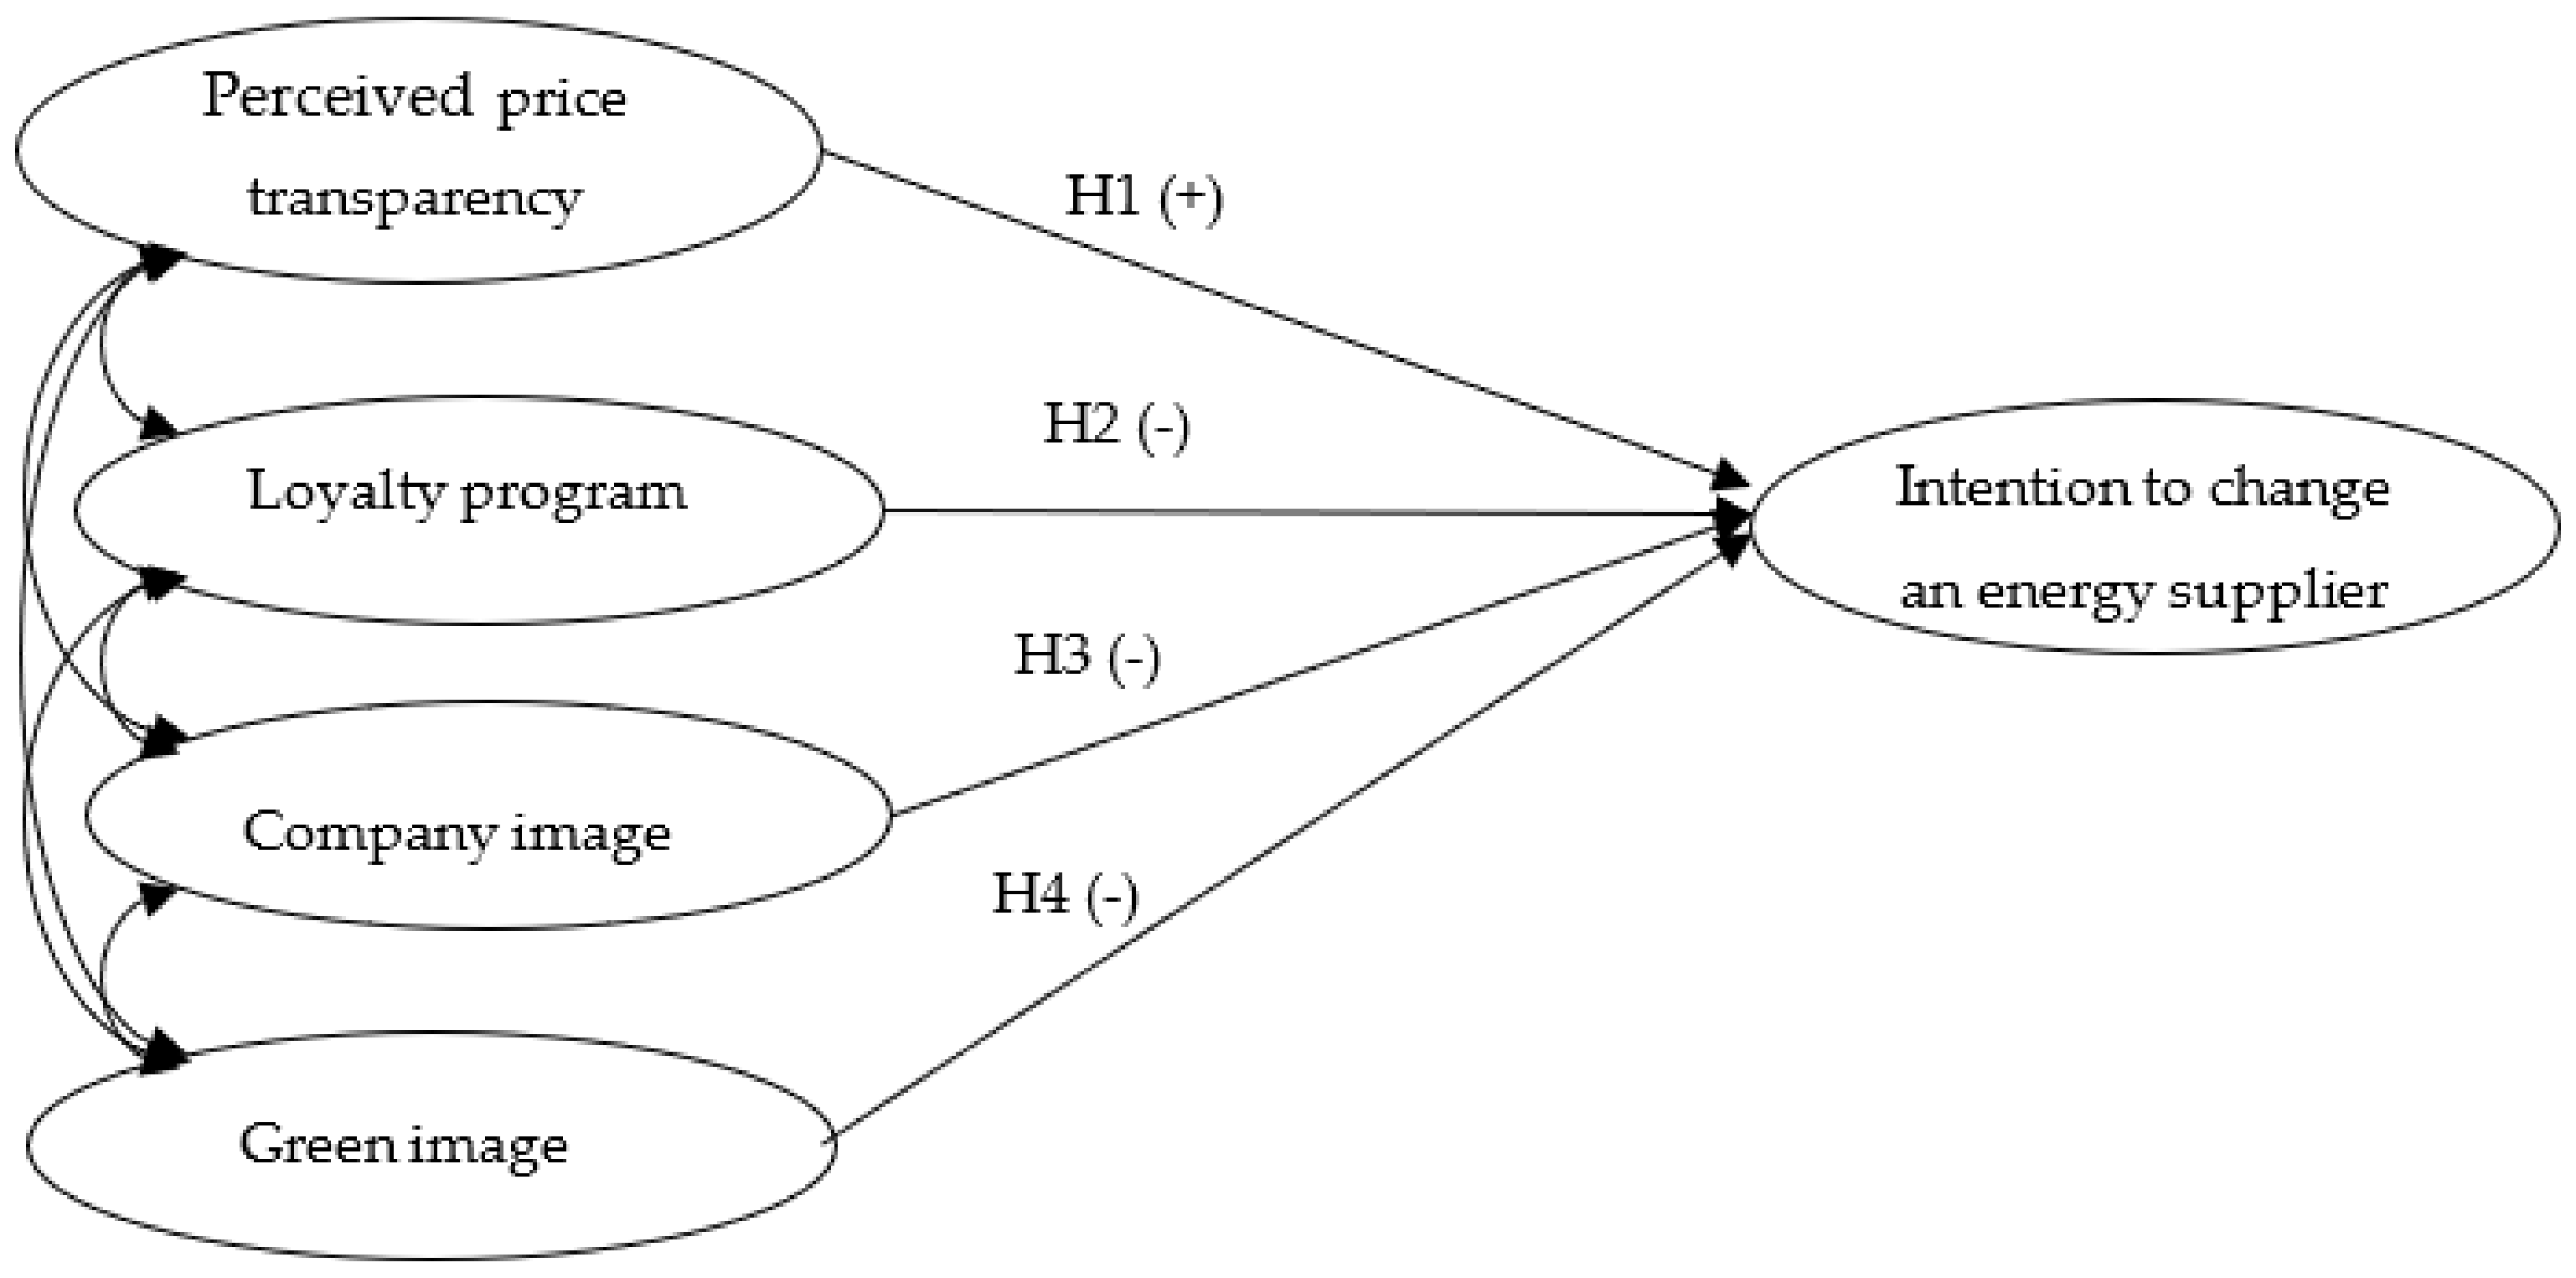
2. Theoretical Background

The most common indicators of the electricity market competitiveness refer to a change of the supplier or a change of the contract with the current (often incumbent) supplier. Unfortunately, a relatively small percentage of households decide to change their energy suppliers and, consequently, in many markets, current suppliers have a dominant market share. The data at the end of 2006 showed a relatively low tendency to switch suppliers in most European countries [4]. Since the market opening, suppliers have been changed by a few to several per cent of customers. A larger percentage of supplier changes was recorded in Sweden and Norway (around 30%) and Great Britain—47%. The situation in ten of the US states where the energy market was liberalised was similar to Europe. A supplier has been changed by approximately 12% of customers [4]. A much higher percentage of supplier changes was recorded in several Australian States—it averaged around 40%. The data from the 2016 EC Report [5] indicate that, on average, the supplier change rate among the 28 European Union countries is 14%. Among these countries, the largest percentage of inhabitants, that is 28, who changed energy suppliers was in the Netherlands, Great Britain and Ireland. The average ratio of the supplier change achieved in Portugal and Italy was 14% and 13%, respectively. Bulgaria and Romania, in turn, have the lowest percentage of people who changed the energy supplier and that is below 1%. Among EU citizens who switched suppliers, 11% did so because of the change of residence. If we exclude this part of the population, it turns out that the percentage of people voluntarily switching energy suppliers decreases to 12% (Table 1).
Additionally, the percentage of consumers who have changed the tariff of the current supplier in the last three years has been analysed. On average, in each of the 28 EU states, 13% of consumers made such a change, with the largest percentage of those recorded in the United Kingdom—28%, followed by Portugal—19% and the Netherlands—18%. The least frequent tariffs changes were performed by the inhabitants of Bulgaria—1%, Iceland—1% and Hungary—2%. As shown in the data presented in Table 1, some countries have both a high percentage of energy supplier change and tariff change (e.g., Great Britain, Netherlands, Belgium). In some countries, a relatively low percentage of energy supplier change was compensated by a high percentage of consumers changing tariffs (e.g., Estonia, the Czech Republic, Spain). There is also a clearly indicated group of countries where residents neither change their energy suppliers nor tariffs (e.g., Bulgaria, Hungary, Romania).
Customer retention is a key issue for many industries. This refers to the continuation of the transaction with the firm [6]. The research presents the service industry as being particularly sensitive to customer retention [6,7,8]. There is no doubt that such companies are exposed to high losses due to customer churn. Churn does not necessarily mean terminating the company’s services; some authors also include limiting the purchase amount [9]. The customer churn directly affects the length of the customer’s relationship with the company and the customer lifetime value (CLV) [8]. As researchers point out, churn does not always have to be a negative phenomenon. Although it is most often associated with consumer dissatisfaction with the services provided, researchers also indicate positive churn [10]. Positive churn occurs when the consumer resigns from the services provided, but the customer’s predefined objective is satisfied, or the service is obsolete [10].
In the literature, a supplier change is compared to a change of the sales channel; in both cases, there are switching barriers and opportunity costs [11]. A change of purchasing channel may or may not lead to a change of services provider. The consumer may change the channel of the same supplier during the purchase process, change the channel, and change the supplier (cross channel free-riding) [12]. Customer migration can be caused by push effects, pull effects, or mooring effects—PPM model switching [13]. An example of a push factor may be the low level of satisfaction; pull factor—the attractiveness of alternatives; and mooring effects—the high cost of change. The same three factors—satisfaction, cost of change, and alternative attractiveness—were most often analysed in the service industry research [14]. The effect of the first two factors on changing suppliers is much greater than the attractiveness of alternatives.
Poland is one of these countries where the coal market is particularly relevant as coal is the first choice to meet energy demand in this country. From 2019–2020 the percentage change of hard coal and lignite generation (bars) production was −8.0%, while the average decline for the EU was −18.0. In 2020, in Poland, 83% of electricity came from fossil fuels [15]. In Poland, the greatest share in electricity sales to final customers is still held by incumbent suppliers, which are default suppliers to households that have not selected a new supplier. In 2019, five incumbents and over 136 alternative trading companies were active in the electricity supply to final customers, including suppliers operating on the household market [16,17].
The authors of [18] pointed to the critical importance of the behaviour of incumbent energy companies for a transition to a sustainable energy system. The goal of the competitive reform of the European electricity industry was that all customers will be able to choose freely their electricity supplier [19]. There is a vast number of studies identifying the barriers for consumer switching behaviour in the energy market—for some of these research the rational choice theory is useful—while the other part of research has its roots in behavioural economics [20].
As a result of the liberalisation of the Polish energy market, competition has intensified, and one of the big concerns for incumbent suppliers is customers switching to competitors. Consumer switching can generate lower profits and higher costs [21]. Overall, in today’s highly competitive market the level of customer loyalty is declining [22]. Moreover, it costs several times more to acquire new customers than retain current ones. For this reason, research on the factors influencing the tendency to abandon an energy supplier seems justified. Loyalty program, company image and price transparency have been studied extensively on their own. However, to the best of our knowledge, no prior research integrates these domains to establish a set of factors as predictor of the intention to change the incumbent energy supplier. This is what this study seeks to do. We believe that our article follows the trend of describing and analysing the situation of incumbent energy suppliers in various European countries after energy market liberalisation [20,23,24].
According to researchers, transparency is one of the most prominent demands of consumers today [25]. Price uncertainty is a permanent element of consumers’ choice decisions and companies tend to reduce this by price communications activity [26]. Price transparency as well as other information are useful in defining a value of the offer and enables for a conscious decision making [27]. Provision of price information creates the possibility to choose where and how the customers obtain the offer they look for [28]. Price transparency is defined as “the degree to which market participants know the prevailing prices and characteristics or attributes of goods or services on offer” [29]. The issue of price transparency has been commonly analysed in the e-commerce context [29,30], transactions in the stock market [31] or health care sector [32,33,34]. The popularity of this phenomenon is strongly connected with the growing popularity of multi-channel sales when online channel plays a crucial role. As [26] stated, “the Internet represents the ideal platform for enabling price transparency to flourish”. Now consumers are armed with information provided by the Internet and in effect the information asymmetry diminishes [35]. One of vital advantages for potential buyers is the possibility to make clear price comparisons [36]. Researchers rightly noted that higher price transparency creates benefits for buyers at the expense of sellers [30,37]. The higher the perceived pricing transparency the easier the offer and price structure evaluation [38]. The authors of [39] indicated the moderating effect of the price transparency in the relationship between the purchase intention and the purchase behaviour. Price transparency is identified as one of factors that affects behavioural intention. According to [40], price transparency may decrease consumers’ intention to purchase a product in the context of green buying decision. However, there is an important element of the meaning of price transparency—when the consumer notices a price increase, price transparency can be helpful in understanding the reasons behind such a price change [41].
Therefore, we proposed the H1 hypothesis:
H1. 
Price transparency positively impacts the intention to change an energy supplier.
Today’s competitive market requires loyalty programs [42] that are seen as the state-of-the-art marketing tools [43]. Loyalty programs are a growing marketing tool for managing retention and creating switching costs [44]. According to [45], loyalty program is “any institutionalised incentive system that attempts to enhance consumers’ consumption behaviour over time.” Loyalty programs are an important marketing and strategic tool used in order to impact repurchase intention and create stronger customer relationships [46,47]. The main goal of any loyalty program is to foster and reward customer loyalty [48,49]. Technological progress creates new ways of interacting with customers and collecting rich customer data [33] as well as higher level of consumer engagement [50] that is of high interest due to considering the high costs of customer acquisition [51]. The authors of [52] emphasise the growing role of loyalty programs in shaping the overall customer experience; for this reason loyalty programs should become less transactional and provide new interaction opportunities in the customer journey. Despite the constant popularity of loyalty programs, the question of the impact on the quality of the customer’s relationship with the company is still valid [53]. Many empirical studies suggest that a loyalty program has a positive impact on customer loyalty [54,55,56], and it also alters purchasing that is customer purchase volume/frequency and share-of-wallet [48,57,58]. However, some research publications are devoted to the negative aspects of loyalty programs [59,60]. These publications noted the dark side of loyalty programs connected with negative experiences among non-member customers. According to [54], the customers’ feeling of under-rewarding can cause weaker repurchase intention due to perceptions of injustice. It means that the construction of a loyalty program requires great caution so that it does not turn out to be a harmful marketing tool.
Therefore, we proposed the H2 hypothesis:
H2. 
Loyalty programs negatively impacts the intention to change an energy supplier.
Corporate image may be defined as social or public knowledge or perceptions about a given company [61]. Earlier definitions of corporate image referred to the overall impression of the firm held by the public [62] or associations and meanings connected with an organisation [63]. An interesting review of corporate image definitions has been presented by [64]. Crucial resources (money, time, people, etc.) are used to build a strong corporate image [65]. Researchers have seen the corporate image as the decisive factor in the process of influencing consumers’ subjective perception and their subsequent behaviour. Corporate image along with customer satisfaction, and perceived value are the significant predictors of the customer behaviour intention [66]. Corporate image may be influenced by the actions of contact personnel [67]. Brand image is seen as the precondition both for value and loyalty [68,69]. As a result of establishing a strong corporate image the following phenomena may be generated: consumer preference and loyalty, company credibility and its sustainable competitive advantage [70]. Although [71] noted a “marginally significant” influence of corporate image on purchase intention and [72] identified as an insignificant impact of green image on behavioural intention, most studies indicated a positive impact of corporate image on customers’ behavioural intention [73,74].
Therefore, we proposed the H3 hypothesis:
H3. 
Corporate image negatively impacts the intention to change an energy supplier.
By analogy to corporate image, in our study the green image was also taken into consideration in our study. A green image refers to the subjective perception of clients regarding the image of the company about the environment [75]. It is the consumer’s perception of the corporate brand to be environmentally sustainable and eco-friendly [76]. According to [77], green image can be understood as the consumers perception consumers of firm’s commitment to environmental protection. The authors of [78] indicated two challenges for the organisations—to produce eco-friendly products that match if not outperform the functional performance of conventional products. The other one is to generate positive perception towards eco-friendly branding activities. According to [79], the effect of the green innovation behaviours of enterprises can be consumers’ green purchase intention. There are other studies that noted the positive impact of green image on customer re-visit intention [75,80,81]. We believe that, taking into account the industry uniqueness, it is reasonable to distinct the consideration of the environmental image of energy supplier in the research model.
Therefore, we proposed the H4 hypothesis:
H4. 
Company green image negatively impacts the intention to change an energy supplier.

3. Materials and Methods

Methodologically, our study falls under industry survey-based empirical study. As it is indicated by [82], such studies have often utilised statistical methods such as structural equation modelling. The research results were used to a multigroup SEM (Structural Equation Modelling) analysis using AMOS 26 to analyse the hypothesised relationships in the research model. Researchers indicated several reasons for choosing the structural equation modelling. In our model, where there is no indirect effect, the strongest argument relates to the fact that SEM enables evaluation of the overall construct in its entirety and examines the interrelated relationships among a set of posited constructs simultaneously, with each construct measured by one or more observed items (measures). In effect SEM makes it possible to verify our research hypotheses [82,83]. For the research purposes of this article, only a part of the research questionnaire, prepared as part of a larger project, was used. Except for the demographic part of the questionnaire, all questions were based on a 10-point Likert scale (1-strongly disagree; 10-strongly agree). In the SEM research model latent variables are expressed by several ‘manifested’ items in the questionnaire [84]. Number of points on the scale is subjected to a lot of debates and controversies [84]. The author of [85] indicated that 10-point Likert scale is comparable to 5-or 7-point scale for analytical tools such as equation models. However, research made by [86] showed that in path modelling, the 1-10 scale gives clearly better measures of model fit (in terms of its internal and external stability) compared to the 1-5 scale.
In our research model (Figure 1) four factors have been taken into consideration: perceived price transparency, loyalty program, company general image and company green image. What is vital for the research idea is that all of these factors are strongly connected with the energy supplier.
All latent variables were adapted from the literature. The behavioural intention in the research model is the customer intention to change the actual energy supplier. Behavioural intention (INT): INT1: I was considering changing my current energy supplier; INT2: I am planning to change my current energy supplier; INT3: There is a good chance that I will change the energy supplier. Perceived price transparency (PT) PT1: I know what I pay for in my energy bill; PT2: The content of energy bill is clear to me; PT3: I know how much I pay per kWh. Loyalty program (LP): LP1: I use loyalty programs from various sectors; LP2: I use my current supplier’s loyalty program; LP3: I find the rewards of the energy provider loyalty programs attractive. Company image (CI): CI1: My energy supplier cares about its image; CI2: My energy supplier is a famous brand; CI3: My energy supplier runs their business ethically; CI4: It is important to me that my energy supplier represents domestic capital. Green image (GI): GI1: I would like to use green energy. GI2: I have a positive opinion about my supplier’s environmental activity; GI3: I believe my supplier cares about the environment.

4. Results

4.1. Research Sample Characteristics

The survey was carried out at the beginning of 2020, before the SARS-CoV-2 pandemic in Poland, and the research sample consisted of 1216 adults (Table 2). The respondents were customers of one of the largest energy suppliers in Poland, an incumbent supplier. This incumbent supplier owns approximately one-third share of the domestic market (energy sold to the end users). This company serves about 5.5 million households. We used quota sampling method—the household size was an important criterion for the research sample structure. Before the formal data collection, we provided the paper questionnaires to a group of potential respondents in the two customer service offices, and then invited these people for the pretest. After some small revisions, we conducted formal data collection. Data collection was done in Poland. The formal research was carried out using a paper questionnaire, which was distributed to the respondents in customer service offices of one of the largest energy company in Poland. These customer service offices were located in 41 cities, in 8 out of 16 voivodeships in Poland. During the questionnaire distribution, it was assumed that every 10th client will be invited to the survey. There were a small number of refusals during the study. After the research, the interviewers checked the quality and completeness of each questionnaire. Incomplete questionnaires were not included in the research sample.

4.2. Study Results

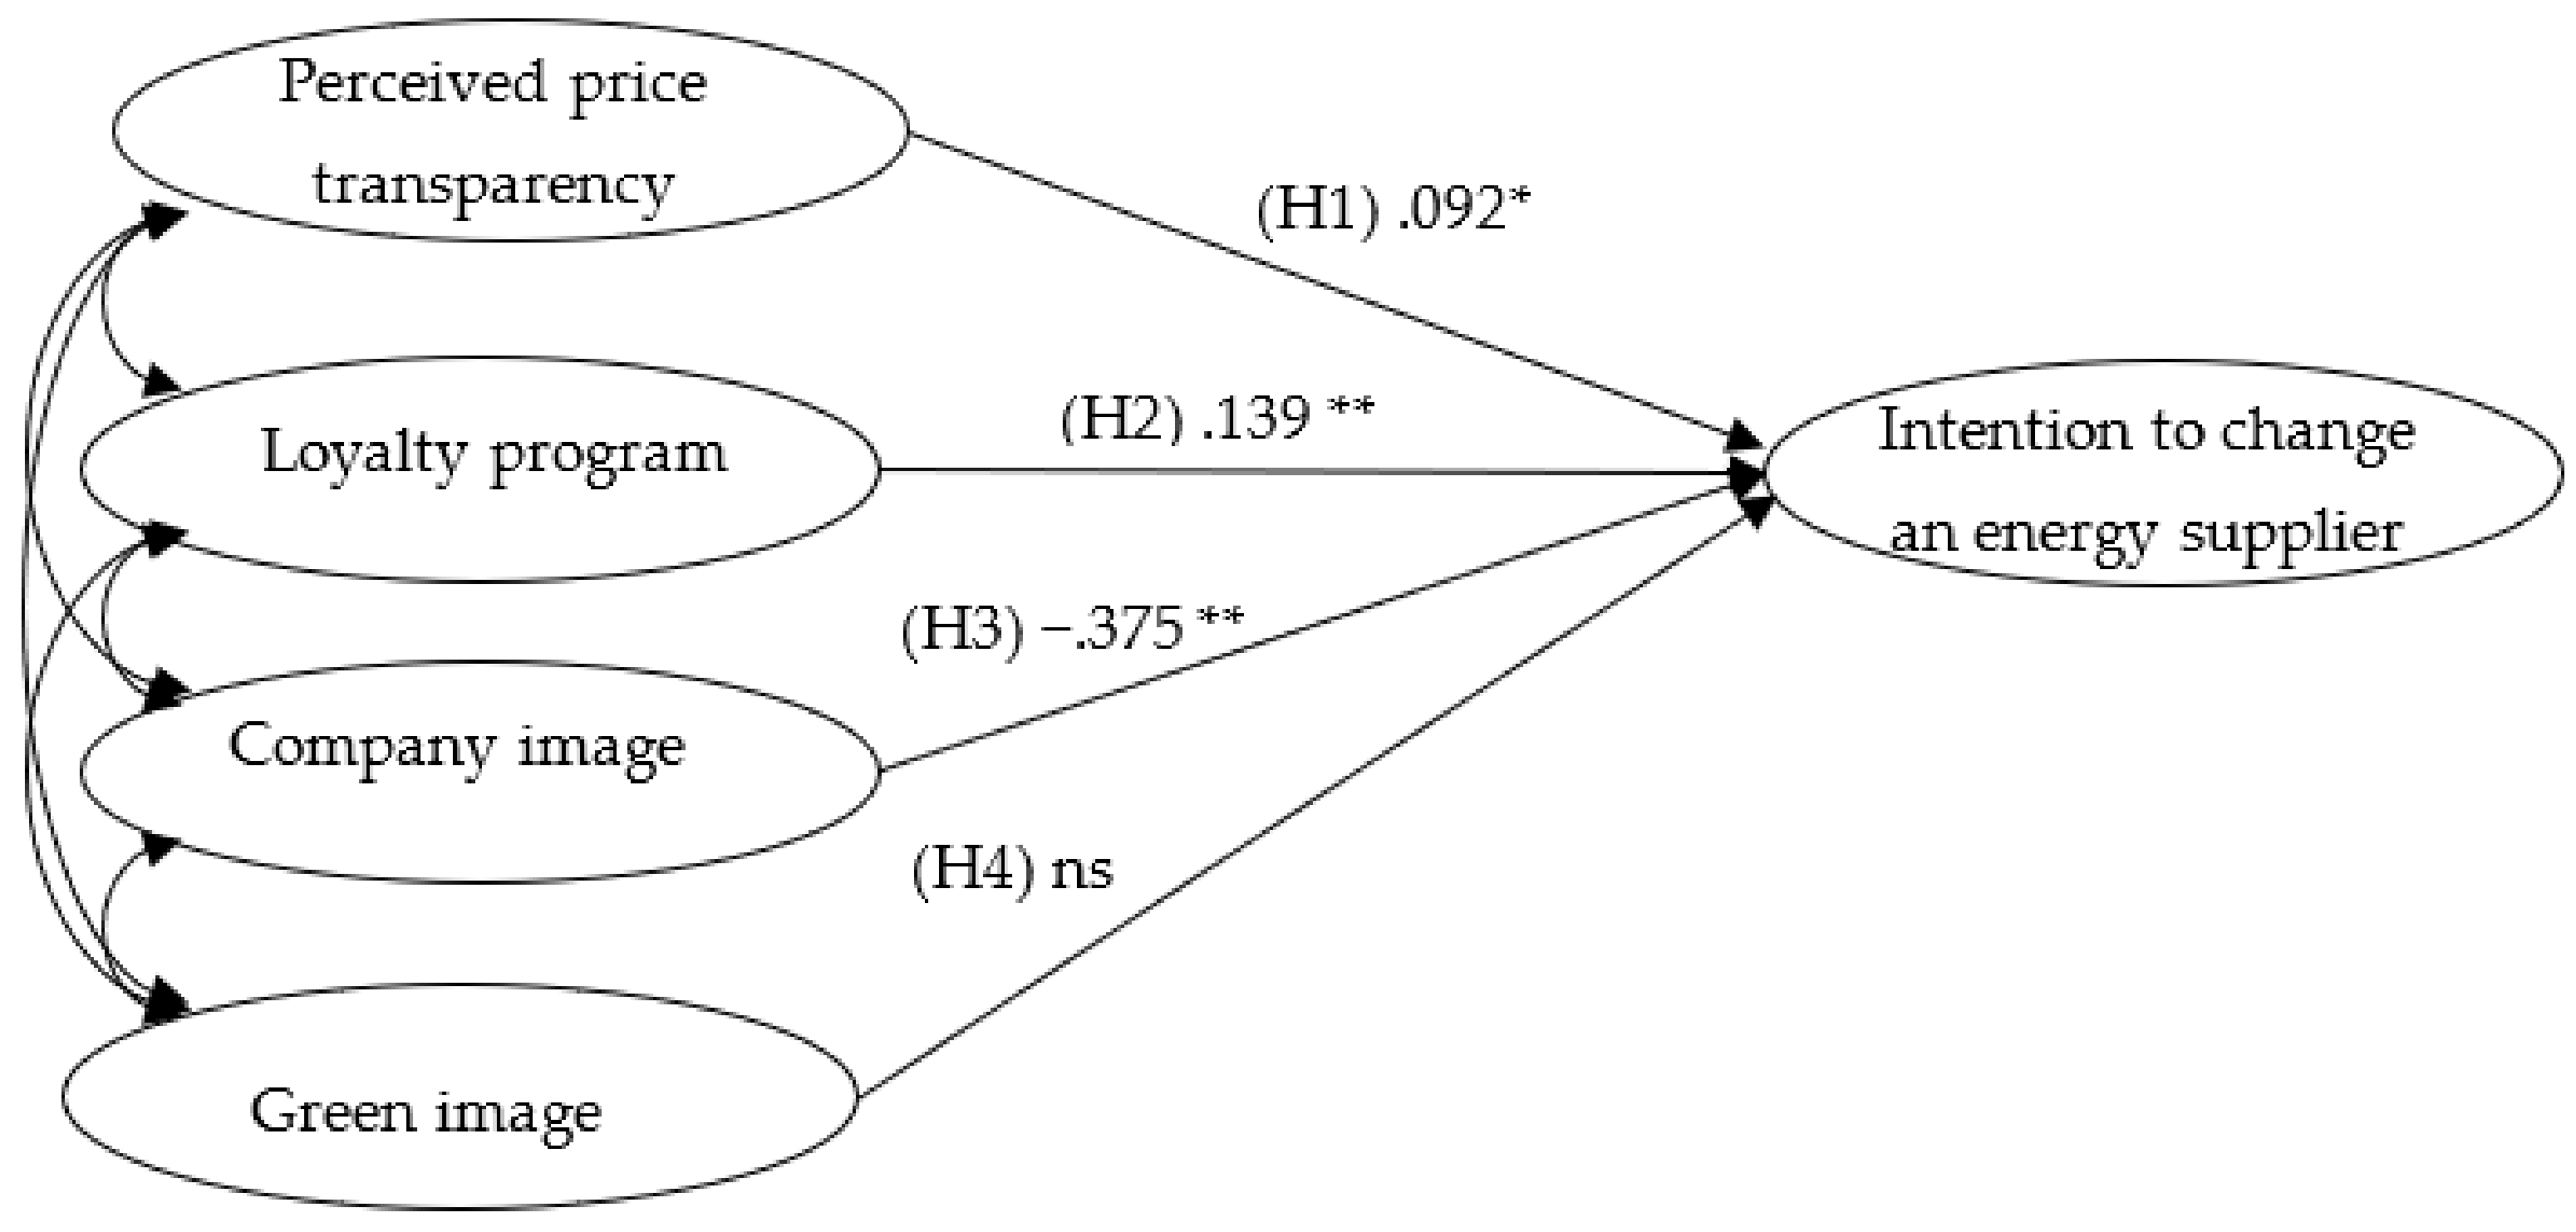
4.2.1. Research Model for the Total Sample

Our research goal was to verify the research model not only for the research group as a whole but also for both of two customer groups distinguished on the basis of the amount of the monthly bill paid for energy (low vs. high (Low energy bill (L group)—below 45 euro per month; high energy bill (H group)—above 45 euro per month.)). For this purpose, a multi group SEM (Structural Equation Modelling) analysis using AMOS 26 was conducted. The CFA models were performed using a Maximum likelihood (ML) estimation. The ML estimation method has been described as being well suited to theory testing and development [83]. The estimates presented relate to the standardised regression weights. Table 3 presents convergent validity and discriminant validity. The model fit for our research model is as follows:—CMIN/DF 2.765, GFI 0.963, AGFI 0.943, RMSEA 0.027 (LO 90 0.025—HI 90 0.030), PCLOSE 1.00.
In this study, AMOS 26.0 was used to test the goodness of fit of the model. It was generally considered that the model with root mean square error of approximation (RMSEA) less than .08 and goodness-of-fit index (GFI), and adjusted goodness-of-fit index (AGFI) greater than .9 had the better goodness of fit. All the measured variables met the requirements.
The first analysis concerns the total research sample—consumers as a whole. Both Figure 2 and Table 4 refer to the total research sample. The featured model (Figure 2) explains 9.0 per cent of the dependent variable (the intention to change an energy supplier).
The results revealed that the Cronbach’s alpha coefficients ranged from .71 to .91. The minimum acceptable value for Cronbach’s alpha considering .70 as the threshold value for already developed constructs and .60 for newly developed constructs [82]. The degree of interrelation for the measurement items of each construct was measured through convergent validity and was estimated by calculating the average variance extracted (AVE) and composite reliability (CR). A strong interrelation of items was considered based on the reference value (AVE ≥ .50 and CR ≥ .70) [80]. According to the tests of reliability and validity, it seems that adequate reliability and validity exist in this study.

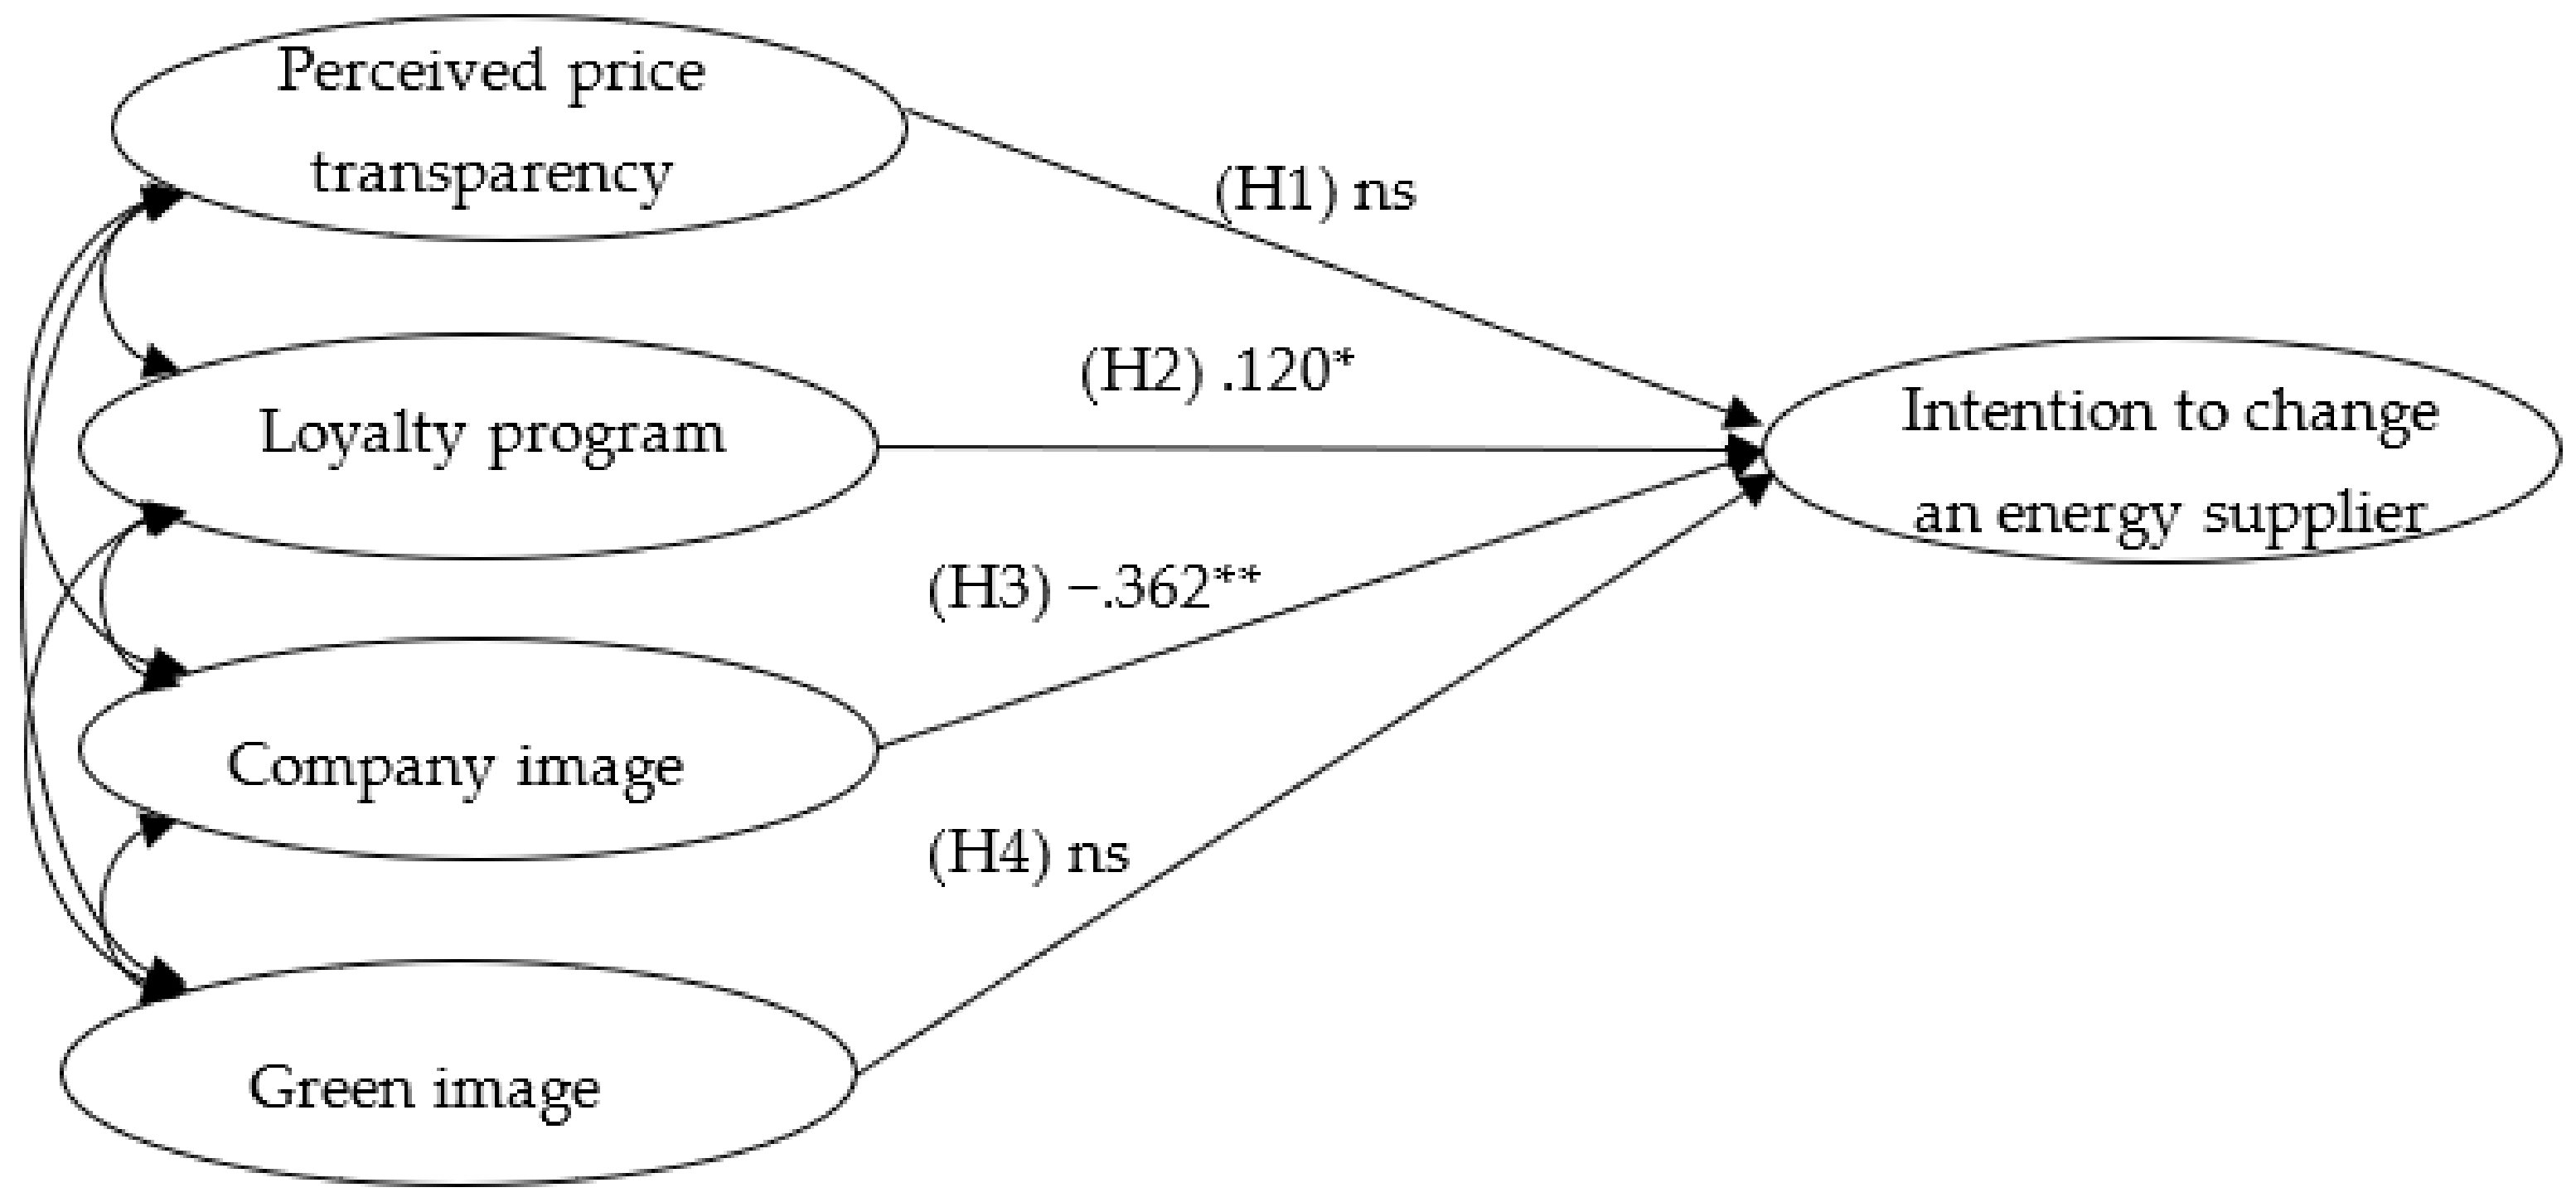
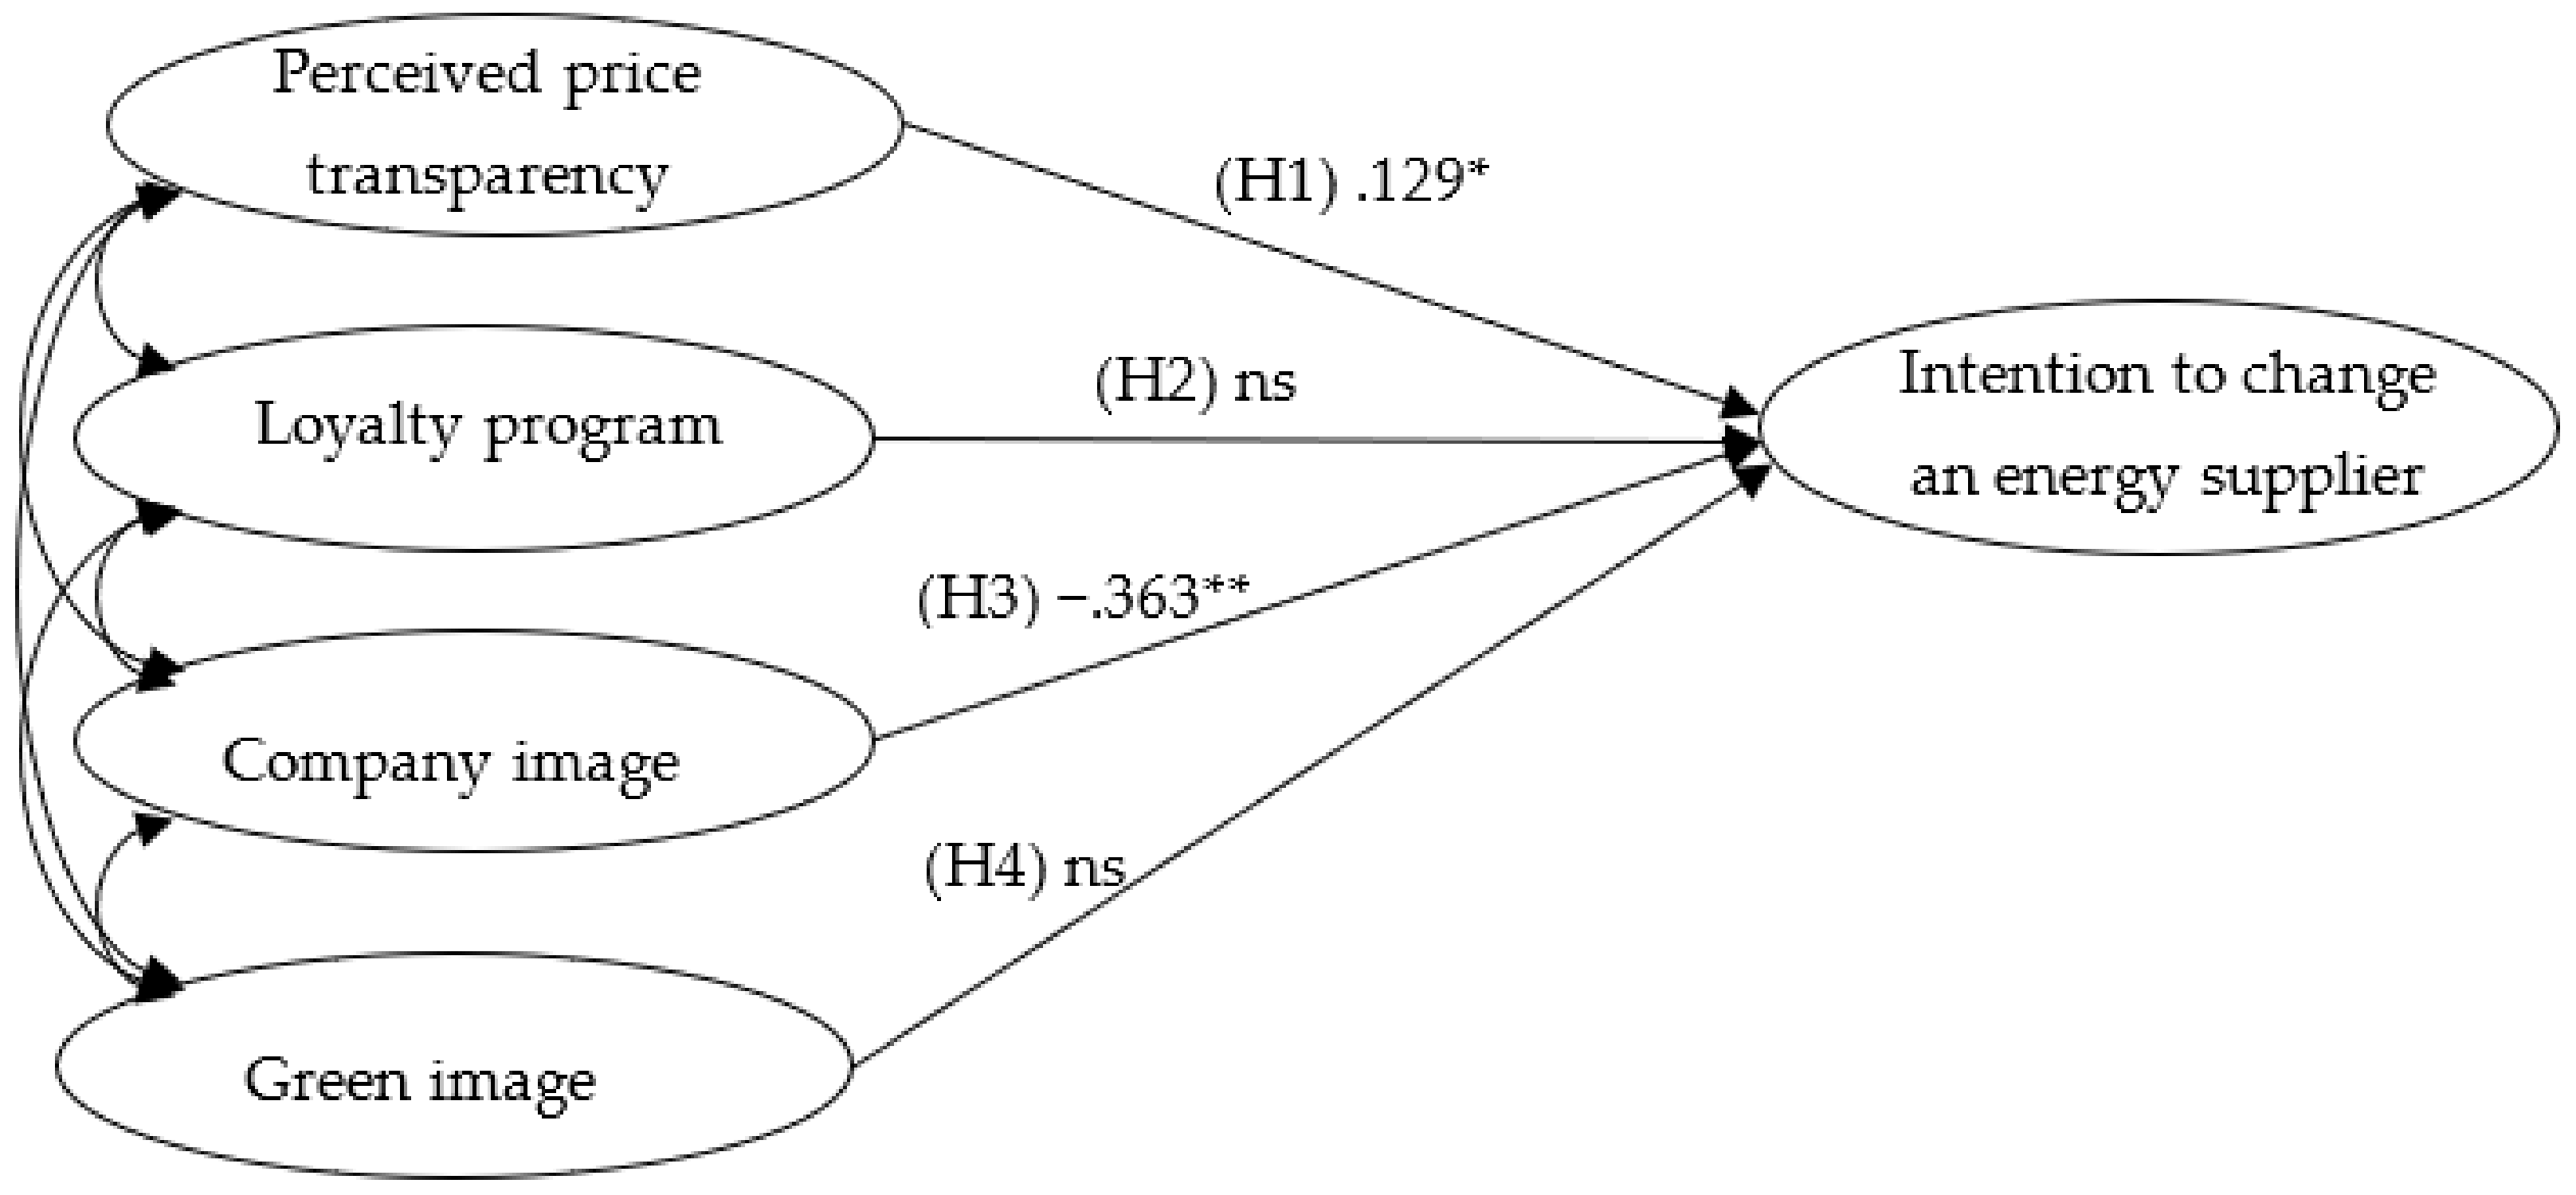
4.2.2. Research Models for Two Groups

The second analysis concerns the group paying relatively low energy bills. Both Figure 3 and Table 5 refer to the L group.
The last analysis concerns the group paying relatively high energy bills. Both Figure 4 and Table 6 refer to the H group.

5. Discussion

The overall purpose of this research study was to explore factors affecting the intention to change an energy supplier among customers of incumbent supplier in Poland. We believe that the changes taking place on the energy market in Poland justify the analysis of this market. Moreover, the presented conclusions may be valuable for other countries in Europe and beyond. The presented conclusions may be particularly important for countries where, like in Poland, the incumbent suppliers still have a high share in the energy market, e.g., Lithuania, Hungary and Romania.
The presented results allow for a formulation of several important conclusions and, consequently, suggestion of some practical recommendations. First, when analysing consumers in general, it is possible to overlook important relationships. However, some relationships are so strong and common that they are visible in both general and detailed analyses (L group vs. H group). A manifestation of such dependencies is the most significant and negative impact of the general image of an energy supplier on the clients’ intentions to change same. This shows an undoubtedly stronger position of these enterprises with a strong image on the market regarding retaining their customers. In this respect, incumbent suppliers naturally have an advantage over potential new energy suppliers. Thus, the position of existing suppliers on the market creates a barrier to market entry. Expenditures on strengthening and presenting the brand image create an entry barrier for potential new suppliers. Our finding on the impact of the brand image finds a strong confirmation in the literature [88,89]. Brand perception is helpful in understanding the competitive landscape and creating effective marketing communications [90]. Brand image is one of the components of the brand knowledge alongside brand awareness, brand recall and brand associations [91], thus it is highly recommended investing some company resources in improving not only brand image but also related elements. The brand image is linked with the associations kept in consumer’ mind [92]. Some researchers pay attention to the lower impact of brand image on consumer loyalty due to the strong competition in the market, as a result investment in corporate social responsibility (CSR) is advisable [93]. The fact that the concept of CSR includes not only environmental efforts, but also economic, legal and philanthropic efforts seem essential for understanding the next conclusion from our study.
The second important conclusion is the lack of importance of the ecological image on the intention of customers to change the energy supplier. To conclude, the influence of green image on customer behavioural intentions was found to be non-significant. Such a conclusion is consistent with the results presented by [72], who noticed that the fact of positively perceiving a firm’s green image can be a motivation for consumers to make a positive evaluation of this service provider in terms of cognitive attributes, but it does not necessarily determine their purchase decisions. The authors of [94] also indicated that consumers’ general opinions are not strong enough to pro-social acting—this is called the value-action gap [94]. In our opinion, the lack of influence of environmental issues on decisions to change the energy supplier proves the low level of ecological maturity of Polish society, for whom the ecological commitment of the energy supplier seems irrelevant to their decision to continue cooperation with this particular company. In effect, there is the lack of positive relation between consumers’ environmental beliefs and their environmental behaviours. The research was carried out in Poland where a significant part of energy is still generated from coal and only the political pressure from the European Union (EU climate policy) prompts the country to decarbonise the energy system. The awareness of the negative impact of this non-renewable energy sources on environment pollution and the related health problems for the society is still low. The more general examination of no influence of green image on customer behavioural intentions can be found in the concept of the ‘selfish altruism’ proposed by [95]. According to this concept, customers’ green purchase intentions depend on their assessment of the perceived potential beneficiaries of eco-friendly offer. Thus, there is a greater likelihood of purchasing an ecological offer if it is beneficial not only for the planet but also for that particular buyer (in reference to those that exclusively benefit the planet) [72]. This implies that individual households tend to make a specific pro-environmental purchase decision when they believe that this conduct provides a direct benefit to them.
In the general model, there are no visible differences in the effect of perceived price transparency, as indicated by the division into two groups according to the amount of the monthly electricity bill. The perceived price transparency has a significant positive impact on the intention to change the energy supplier among customers with high energy costs. What is important to them is the legibility of the electricity bill and the individual components of the total amount payable. Therefore, it can be seen that the more a user pays for something, the more he/she is interested in the details of what he/she pays for. As a consequence, the price transparency of the bill for people paying a high price for energy positively influences their willingness to change an energy supplier. Price transparency allows such people to accurately estimate possible savings / or no savings when switching a supplier. For those with low electricity bills, price transparency has no bearing on the intention to switch supplier. The intrinsically complicated energy bills attract attention and inspire the analysis of those paying larger amounts of money.
Interestingly, contrary to the authors’ expectations, for people paying low bills, the loyalty program (assessment of its attractiveness and participation in it) may increase the intention to change the energy supplier. Such conclusion is consistent with the results presented by [21], who showed that loyalty programs do not universally prevent switching behaviour. Additionally, as [96] indicated, negative consequences of loyalty programs such as customer’s expectation about greater discounts and extra privileges. Offered benefits/incentives in the loyalty program make such people aware of the possibility to take advantage of an even better offer, which prompts them to seek incentives from other energy suppliers. The authors of [97] noted that in case of hierarchical loyalty programs the effect of status demotion causes members to some negative experience feelings (frustration and social discomfort) can lead them to switch service providers. Thus, by analogy, in our study consumer in L group may perceive themselves as less important to the company and hence there is a tendency to switch to another supplier. A low bill amount does not ensure a sufficiently strong bond between the customer and the energy supplier, hence the tendency to switch current supplier. A low energy bill is a symptom of “a little investment” in the customer-energy supplier relationship made by the client. There are weak psychological bonds between individuals and energy supplier brand that creates a tendency to brand switching [98]. Thus, financial incentives under a loyalty program can generate the opposite effect of the intended—instead of consolidating the relationship with the client—they open their eyes to the possibility of obtaining even greater benefits, perhaps from another energy supplier.
Despite the apparent contradiction, a similar pattern appeared on the telecommunications services market, when mobile service providers offered their actual customers better terms during a contract extension. By such actions, service provider triggered the client’s decision-making process that often prompted the change of supplier. Similarly, clients with low energy bills participating in and gaining from the benefits of energy companies’ loyalty programs may realise the value of additional incentives and analyse them with alternative suppliers. This effect is absent in case of people paying high energy bills, when the relationship between loyalty program and tendency to change an energy supplier is insignificant.

6. Conclusions

Our proposed research model addressed the research gap by considering set of factors affecting the intention to switch and incumbent energy supplier. Provided practical implications can be useful for both the incumbent energy suppliers and the latecomers in many countries. The conclusions may be particularly useful for EU member states that have a similar structure of the energy market in terms of energy suppliers (incumbent vs. latecomers). For energy suppliers in general, the practical implications could be as follows. First, the strong position of incumbent suppliers in the markets with low consumers’ propensity to switch is due to their exceptionally strong image on these markets. Expenditure on its maintenance is the strongest barrier for new suppliers The method of obtaining energy for most recipients (clients) is not even important. New energy suppliers entering the market must perform several actions to enter the business. Firstly, they should look for differentiators and position themselves as companies offering transparent terms of cooperation (energy bills). Additionally, they should look for groups of recipients with specific needs (also those looking for green energy). New suppliers should also put emphasis on loyalty programs, which in their case may lead to the choice of a new supplier.
Although important issues emerged from this work, there are some limitations which should be taken into account as they suggest directions for further research. The first limitation concerns the inclusion of customers from one country in the survey. The subject of the study are customers from one company—a very well-known energy supplier in Poland. The second issue is connected with ignoring a potential impact of the country’s energy policy, which may affect the intention to change the supplier, e.g., by regulating prices for individual consumers. In the presented model we consciously resigned from considering the price-aspects in our analysis, due to some research indicating that price is not as significant determinant of consumer switching in deregulated electricity markets as non-price attributes [99]. It is advisable to investigate the pricing issues, however, with a different research approach. Many researchers indicate the usefulness of the game theory [100,101]. Finally, future research could also extend empirical testing to these dependencies (the impact of loyalty program and green image), which proved to be quite surprising and are not fully confirmed by the literature.

Author Contributions

Conceptualization, D.D. and M.L.; Methodology, M.L.; Software, M.L.; Validation, M.L. and I.B.; Formal Analysis M.L. and I.B.; Investigation, D.D.; Resources, I.B.; Data Curation, M.L.; Writing—Original Draft Preparation, M.L., I.B. and D.D.; Writing—Review and Editing, M.L. and I.B.; Visualization, M.L. and I.B.; Supervision, M.L.; Project Administration, D.D. and M.L. All authors have read and agreed to the published version of the manuscript.

Funding

This research received no external funding.

Institutional Review Board Statement

Not applicable.

Informed Consent Statement

Not applicable.

Data Availability Statement

Data will be available on request.

Conflicts of Interest

The authors declare no conflict of interest.

References

  1. Pfaffenberger, W.; Sioshansi, F.P. A comparison of market structure and regulation between US and European Utility markets. In Handbook Utility Management; Bausch, A., Schwenker, B., Eds.; Springer: Berlin, Germany, 2008; pp. 629–663. [Google Scholar] [CrossRef]
  2. Erdogdu, E. The political economy of electricity market liberalization: A cross-country aproach. Energy J. 2014, 35, 91–129. [Google Scholar] [CrossRef] [Green Version]
  3. Srivastava, A.K.; Kamalasadan, S.; Patel, D.; Sankar, S.; Al-Olimat, K.S. Electricity markets: An overview and comparative study. Int. J. Energy Sect. Manag. 2011, 5, 169–200. [Google Scholar] [CrossRef]
  4. Defeuilley, C. Retail competition in electricity markets. Energy Policy 2009, 37, 377–386. [Google Scholar] [CrossRef]
  5. European Commision. Second Consumer Market Study of the Functioning Retail Electricity Market for Consumers in the EU, Final Report; European Commision: Brussels, Belgium, 2016. [Google Scholar]
  6. Ascarza, E.; Iyengar, R.; Schleicher, M. The perils of proactive churn prevention using plan recommendations: Evidence from a field experiment. J. Mark. Res. 2016, 53, 46–60. [Google Scholar] [CrossRef] [Green Version]
  7. Ali, Ö.G.; Arıtürk, U. Dynamic churn prediction framework with more effective use of rare event data: The case of private banking. Expert Syst. Appl. 2014, 41, 7889–7903. [Google Scholar] [CrossRef]
  8. Neslin, S.A.; Gupta, S.; Kamakura, W.; Lu, J.; Mason, C.H. Defection detection: Measuring and understanding the predictive accuracy of customer churn models. J. Mark. Res. 2006, 43, 204–211. [Google Scholar] [CrossRef]
  9. Chen, Z.-Y.; Fan, Z.-P.; Sun, M. A hierarchical multiple kernel support vector machine for customer churn prediction using longitudinal behavioral data. Eur. J. Oper. Res. 2012, 223, 461–472. [Google Scholar] [CrossRef]
  10. DeChant, A.; Spann, M.; Becker, J.U. Positive customer churn: An application to online dating. J. Serv. Res. 2018, 22, 90–100. [Google Scholar] [CrossRef]
  11. Walsh, G.; Groth, M.; Wiedmann, K.-P. An examination of consumers’ motives to switch energy suppliers. J. Mark. Manag. 2005, 21, 421–440. [Google Scholar] [CrossRef]
  12. Chiu, H.-C.; Hsieh, Y.-C.; Roan, J.; Tseng, K.-J.; Hsieh, J.-K. The challenge for multichannel services: Cross-channel free-riding behavior. Electron. Commer. Res. Appl. 2011, 10, 268–277. [Google Scholar] [CrossRef]
  13. Bansal, H.S.; Taylor, S.F.; James, Y.S. “Migrating” to new services providers: Toward a unifying framework of consumers’ switching behaviours. J. Acad. Mark. Sci. 2005, 33, 96–115. [Google Scholar] [CrossRef]
  14. Chuang, Y.-F.; Tai, Y.-F. Research on customer switching behavior in the service industry. Manag. Res. Rev. 2016, 39, 925–939. [Google Scholar] [CrossRef]
  15. Agora Energiewende and Ember. The European Power Sector in 2020: Up-To-Date Analysis on the Electricity Transition 2021. Available online: https://ember-climate.org/project/eu-power-sector-2020/ (accessed on 25 June 2021).
  16. Energy Regulatory Office. National Report of the President of the Energy Regulatory Office 2019. Available online: https://www.ure.gov.pl/en/about-us/reports/67,Reports.html (accessed on 25 June 2021).
  17. Energy Regulatory Office. National Report of the President of the Energy Regulatory Office 2020. Available online: https://www.ure.gov.pl/en/about-us/reports/67,Reports.html (accessed on 25 June 2021).
  18. Heiskanen, E.; Apajalahti, E.-L.; Matschoss, K.; Lovio, R. Incumbent energy companies navigating energy transitions: Strategic action or bricolage? Environ. Innov. Soc. Transit. 2018, 28, 57–69. [Google Scholar] [CrossRef]
  19. Mollard, M. Switching costs and the pricing strategies of incumbent suppliers on the British retail electricity market. In Proceedings of the 4th Conference on Applied Infrastructure Research, Berlin, Germany, 15–17 November 2005. [Google Scholar]
  20. Yang, M.; Chi, Y.; Mamaril, K.; Berry, A.; Shi, X.; Zhu, L. Communication-based approach for promoting energy consumer switching: Some evidence from Ofgem’s database trials in the United Kingdom. Energies 2020, 13, 5179. [Google Scholar] [CrossRef]
  21. Thompson, F.M.; Tuzovic, S. Why organizational loyalty programs cannot prevent switching. J. Serv. Mark. 2020, 34, 207–222. [Google Scholar] [CrossRef]
  22. Ramachandran, S.; Balasubramanian, S. Examining the moderating role of brand loyalty among consumers of technology products. Sustainability 2020, 12, 9967. [Google Scholar] [CrossRef]
  23. Kungl, G. Stewards or sticklers for change? Incumbent energy providers and the politics of the German energy transition. Energy Res. Soc. Sci. 2015, 8, 13–23. [Google Scholar] [CrossRef]
  24. Salm, S.; Wüstenhagen, R. Dream team or strange bedfellows? Complementarities and differences between incumbent energy companies and institutional investors in Swiss hydropower. Energy Policy 2018, 121, 476–487. [Google Scholar] [CrossRef]
  25. Kim, N.; Kim, G.; Rothenberg, L. Is honesty the best policy? Examining the role of price and production transparency in fashion marketing. Sustainability 2020, 12, 6800. [Google Scholar] [CrossRef]
  26. Rossi, F.; Chintagunta, P.K. Price transparency and retail prices: Evidence from fuel price signs in the Italian highway system. J. Mark. Res. 2016, 53, 407–423. [Google Scholar] [CrossRef]
  27. Ahmad, N.S.; Makmor-Bakry, M.; Hatah, E. Drug price transparency initiative: A scoping review. Res. Soc. Adm. Pharm. 2020, 16, 1359–1369. [Google Scholar] [CrossRef]
  28. House, M.E.; Hunt, S.E.; Umeh, A. Improving price transparency for consumer health care services. J. Bus. Behav. Sci. 2020, 32, 126–142. [Google Scholar]
  29. Clemons, E.K.; Hann, I.-H.; Hitt, L.M. Price dispersion and differentiation in online travel: An empirical investigation. Manag. Sci. 2002, 48, 534–549. [Google Scholar] [CrossRef] [Green Version]
  30. Zhang, X.; Jiang, B. Increasing price transparency: Implications of consumer price posting for consumers’ haggling behavior and a seller’s pricing strategies. J. Interact. Mark. 2014, 28, 68–85. [Google Scholar] [CrossRef]
  31. Liang, Q.; Ling, L.; Tang, J.; Zeng, H.; Zhuang, M. Managerial overconfidence, firm transparency, and stock price crash risk: Evidence from an emerging market. China Financ. Rev. Int. 2019, 10, 271–296. [Google Scholar] [CrossRef]
  32. Whaley, C.M. Provider responses to online price transparency. J. Health Econ. 2019, 66, 241–259. [Google Scholar] [CrossRef]
  33. Kobayashi, D.; Goto, R.; Tsugawa, Y. Impact of improved price transparency on patients’ demand of healthcare services. Soc. Sci. Med. 2019, 235, 112390. [Google Scholar] [CrossRef]
  34. Zhang, A.; Prang, K.-H.; Devlin, N.; Scott, A.; Kelaher, M. The impact of price transparency on consumers and providers: A scoping review. Health Policy 2020, 124, 819–825. [Google Scholar] [CrossRef]
  35. Singh, N. Commentary: What’s behind the price tag: Understanding cost transparency? Eur. J. Mark. 2015, 49, 1987–1991. [Google Scholar] [CrossRef]
  36. Yeoman, I.S.; McMahon-Beattie, U. The turning points of revenue management: A brief history of future evolution. J. Tour. Futur. 2017, 3, 66–72. [Google Scholar] [CrossRef]
  37. Soh, C.; Markus, M.L.; Goh, K.H. Electronic marketplaces and price transparency: Strategy, information technology, and success. MIS Q. 2006, 30, 705. [Google Scholar] [CrossRef]
  38. Leinsle, P.; Totzek, D.; Schumann, J.H. How price fairness and fit affect customer tariff evaluations. J. Serv. Manag. 2018, 29, 735–764. [Google Scholar] [CrossRef]
  39. Bhutto, M.Y.; Zeng, F.; Soomro, Y.A.; Khan, M.A. Young chinese consumer decision making in buying green products: An application of theory of planned behavior with gender and price transparency. Pak. J. Commer. Soc. Sci. 2019, 13, 599–619. [Google Scholar]
  40. Minbashrazgah, M.M.; Maleki, F.; Torabi, M. Green chicken purchase behavior: The moderating role of price transparency. Manag. Environ. Qual. 2017, 28, 902–916. [Google Scholar] [CrossRef]
  41. Ferguson, J.L.; Ellen, P.S. Transparency in pricing and its effect on perceived price fairness. J. Prod. Brand Manag. 2013, 22, 404–412. [Google Scholar] [CrossRef]
  42. Xiong, L.; King, C.; Hu, C. Where is the love? Investigating multiple membership and hotel customer loyalty. Int. J. Contemp. Hosp. Manag. 2014, 26, 572–592. [Google Scholar] [CrossRef]
  43. Rehnen, L.-M.; Bartsch, S.; Kull, M.; Meyer, A. Exploring the impact of rewarded social media engagement in loyalty programs. J. Serv. Manag. 2017, 28, 305–328. [Google Scholar] [CrossRef]
  44. Baloglu, S.; Zhong, Y.Y.; Tanford, S. Casino loyalty: The influence of loyalty program, switching costs, and trust. J. Hosp. Tour. Res. 2017, 41, 846–868. [Google Scholar] [CrossRef]
  45. Henderson, C.M.; Beck, J.T.; Palmatier, R.W. Review of the theoretical underpinnings of loyalty programs. J. Consum. Psychol. 2011, 21, 256–276. [Google Scholar] [CrossRef]
  46. Chen, Y.; Mandler, T.; Meyer-Waarden, L. Three decades of research on loyalty programs: A literature review and future research agenda. J. Bus. Res. 2021, 124, 179–197. [Google Scholar] [CrossRef]
  47. Yang, M.X.; Zeng, K.J.; Chan, H.; Yu, I.Y. Managing loyalty program communications in the digital era: Does culture matter? J. Retail. Consum. Serv. 2021, 60, 102476. [Google Scholar] [CrossRef]
  48. Bijmolt, T.H.A.; Dorotic, M.; Verhoef, P.C. Loyalty programs: Generalizations on their adoption, effectiveness and design. Found. Trends Mark. 2011, 5, 197–258. [Google Scholar] [CrossRef]
  49. Brashear-Alejandro, T.; Kang, J.; Groza, M.D. Leveraging loyalty programs to build customer–company identification. J. Bus. Res. 2016, 69, 1190–1198. [Google Scholar] [CrossRef]
  50. Hwang, J.; Choi, L. Having fun while receiving rewards? Exploration of gamification in loyalty programs for consumer loyalty. J. Bus. Res. 2020, 106, 365–376. [Google Scholar] [CrossRef]
  51. Bruneau, V.; Swaen, V.; Zidda, P. Are loyalty program members really engaged? Measuring customer engagement with loyalty programs. J. Bus. Res. 2018, 91, 144–158. [Google Scholar] [CrossRef]
  52. Steinhoff, L.; Zondag, M.M. Loyalty programs as travel companions: Complementary service features across customer journey stages. J. Bus. Res. 2021, 129, 70–82. [Google Scholar] [CrossRef]
  53. Vilches-Montero, S.; Pandit, A.; Bravo-Olavarria, R.; Chao, C.-W. What loyal women (and men) want: The role of gender and loyalty program characteristics in driving store loyalty. J. Retail. Consum. Serv. 2018, 44, 64–70. [Google Scholar] [CrossRef]
  54. Söderlund, M.; Colliander, J. Loyalty program rewards and their impact on perceived justice, customer satisfaction, and repatronize intentions. J. Retail. Consum. Serv. 2015, 25, 47–57. [Google Scholar] [CrossRef]
  55. Faramarzi, A.; Bhattacharya, A. The economic worth of loyalty programs: An event study analysis. J. Bus. Res. 2021, 123, 313–323. [Google Scholar] [CrossRef]
  56. Koo, B.; Yu, J.; Han, H. The role of loyalty programs in boosting hotel guest loyalty: Impact of switching barriers. Int. J. Hosp. Manag. 2020, 84, 102328. [Google Scholar] [CrossRef]
  57. Evanschitzky, H.; Ramaseshan, B.; Woisetschläger, D.M.; Richelsen, V.; Blut, M.; Backhaus, C. Consequences of customer loyalty to the loyalty program and to the company. J. Acad. Mark. Sci. 2011, 40, 625–638. [Google Scholar] [CrossRef]
  58. Danaher, P.J.; Sajtos, L.; Danaher, T.S. Tactical use of rewards to enhance loyalty program effectiveness. Int. J. Res. Mark. 2020, 37, 505–520. [Google Scholar] [CrossRef]
  59. Stauss, B.; Schmidt, M.; Schoeler, A. Customer frustration in loyalty programs. Int. J. Serv. Ind. Manag. 2005, 16, 229–252. [Google Scholar] [CrossRef]
  60. Ding, A.; Legendre, T.S.; Han, J.; Chang, H. Freedom restriction and non-member customers’ response to loyalty programs. Int. J. Hosp. Manag. 2021, 94, 102809. [Google Scholar] [CrossRef]
  61. Wei, Y.-C.; Chang, C.-C.; Lin, L.-Y.; Liang, S.-C. A fit perspective approach in linking corporate image and intention-to-apply. J. Bus. Res. 2016, 69, 2220–2225. [Google Scholar] [CrossRef]
  62. Bitner, M.J.; Booms, B.H.; Tetreault, M.S. The service encounter: Diagnosing favorable and unfavorable incidents. J. Mark. 1990, 54, 71–84. [Google Scholar] [CrossRef]
  63. Balmer, J.M. Corporate identity and the advent of corporate marketing. J. Mark. Manag. 1998, 14, 963–996. [Google Scholar] [CrossRef]
  64. Tran, M.A.; Nguyen, B.; Melewar, T.; Bodoh, J. Exploring the corporate image formation process. Qual. Mark. Res. 2015, 18, 86–114. [Google Scholar] [CrossRef] [Green Version]
  65. Bathmanathan, V.; Hironaka, C. Sustainability and business: What is green corporate image? IOP Conf. Ser. Earth Environ. Sci. 2016, 32, 12049. [Google Scholar] [CrossRef]
  66. Yu, W.; Han, X.; Ding, L.; He, M. Organic food corporate image and customer co-developing behavior: The mediating role of consumer trust and purchase intention. J. Retail. Consum. Serv. 2020, 59, 102377. [Google Scholar] [CrossRef]
  67. Mostafa, R.B.; Lages, C.R.; Shabbir, H.A.; Thwaites, D. Corporate image: A service recovery perspective. J. Serv. Res. 2015, 18, 468–483. [Google Scholar] [CrossRef]
  68. Liu, C.-R.; Liu, H.-K.; Lin, W.-R. Constructing customer-based museums brand equity model: The mediating role of brand value. Int. J. Tour. Res. 2015, 17, 229–238. [Google Scholar] [CrossRef]
  69. Kim, B. The role of dedication-based and constraint-based mechanisms in consumers’ sustainable outcomes in the coffee chain industry. Sustainability 2018, 10, 2636. [Google Scholar] [CrossRef] [Green Version]
  70. Chen, C.-F.; Myagmarsuren, O. Brand equity, relationship quality, relationship value, and customer loyalty: Evidence from the telecommunications services. Total Qual. Manag. Bus. Excel. 2011, 22, 957–974. [Google Scholar] [CrossRef]
  71. Lee, J.; Lee, Y. Effects of multi-brand company’s CSR activities on purchase intention through a mediating role of corporate image and brand image. J. Fash. Mark. Manag. 2018, 22, 387–403. [Google Scholar] [CrossRef] [Green Version]
  72. Martínez, P.; Herrero, Á.; Gómez-López, R. Corporate images and customer behavioral intentions in an environmentally certified context: Promoting environmental sustainability in the hospitality industry. Corp. Soc. Responsib. Environ. Manag. 2019, 26, 1382–1391. [Google Scholar] [CrossRef]
  73. Kim, J.; Song, H.; Lee, C.-K.; Lee, J.Y. The impact of four CSR dimensions on a gaming company’s image and customers’ revisit intentions. Int. J. Hosp. Manag. 2017, 61, 73–81. [Google Scholar] [CrossRef]
  74. Huang, C.-C.; Yen, S.-W.; Liu, C.-Y.; Huang, P.-C. The relationship among corporate social responsibility, service quality, corporate image and purchase intention. Int. J. Organ. Innov. 2014, 6, 68–84. [Google Scholar]
  75. Melé, P.M.; Gómez, J.M.; Sousa, M.J. Influence of sustainability practices and green image on the re-visit intention of small and medium-size towns. Sustainability 2020, 12, 930. [Google Scholar] [CrossRef] [Green Version]
  76. Chen, Y.-S. The drivers of green brand equity: Green brand image, green satisfaction, and green trust. J. Bus. Ethics 2009, 93, 307–319. [Google Scholar] [CrossRef]
  77. Alonso-Almeida, M.-D.-M.; Robin, C.F.; Pedroche, M.S.C.; Astorga, P.S. Revisiting green practices in the hotel industry: A comparison between mature and emerging destinations. J. Clean. Prod. 2017, 140, 1415–1428. [Google Scholar] [CrossRef]
  78. Ng, P.F.; Butt, M.M.; Khong, K.W.; Ong, F.S. Antecedents of green brand equity: An integrated approach. J. Bus. Ethics 2013, 121, 203–215. [Google Scholar] [CrossRef]
  79. Chen, L.; Qie, K.; Memon, H.; Yesuf, H. The empirical analysis of green innovation for fashion brands, perceived value and green purchase intention—Mediating and moderating effects. Sustainability 2021, 13, 4238. [Google Scholar] [CrossRef]
  80. Lee, Y.-K. The relationship between green country image, green trust, and purchase intention of korean products: Focusing on vietnamese gen z consumers. Sustainability 2020, 12, 5098. [Google Scholar] [CrossRef]
  81. Ibe-Enwo, G.; Igbudu, N.; Garanti, Z.; Popoola, T. Assessing the relevance of green banking practice on bank loyalty: The mediating effect of green image and bank trust. Sustainability 2019, 11, 4651. [Google Scholar] [CrossRef] [Green Version]
  82. Goswami, M.; De, A.; Habibi, M.K.K.; Daultani, Y. Examining freight performance of third-party logistics providers within the automotive industry in India: An environmental sustainability perspective. Int. J. Prod. Res. 2020, 58, 7565–7592. [Google Scholar] [CrossRef]
  83. Cheng, J.-H.; Lu, K.-L. Enhancing effects of supply chain resilience: Insights from trajectory and resource-based perspectives. Supply Chain Manag. 2017, 22, 329–340. [Google Scholar] [CrossRef]
  84. Joshi, A.; Kale, S.; Chandel, S.; Pal, D.K. Likert scale: Explored and explained. Br. J. Appl. Sci. Technol. 2015, 7, 396–403. [Google Scholar] [CrossRef]
  85. Dawes, J. Do data characteristics change according to the number of scale points used? An experiment using 5-point, 7-point and 10-point scales. Int. J. Mark. Res. 2008, 50, 61–104. [Google Scholar] [CrossRef]
  86. Skowron, Ł. Wpływ szerokości skali na miary dopasowania modelu ścieżkowego. Ekonemtria Econom. 2015, 2, 23–32. [Google Scholar] [CrossRef] [Green Version]
  87. Fornell, C.; Larcker, D.F. Evaluating structural equation models with unobservable variables and measurement error. J. Mark. Res. 1981, 18, 39–50. [Google Scholar] [CrossRef]
  88. Hoeffler, S.; Keller, K.L. The marketing advantages of strong brands. J. Brand Manag. 2003, 10, 421–445. [Google Scholar] [CrossRef]
  89. Liczmańska-Kopcewicz, K.; Pypłacz, P.; Wiśniewska, A. Resonance of investments in renewable energy sources in industrial enterprises in the food industry. Energies 2020, 13, 4285. [Google Scholar] [CrossRef]
  90. Dzyabura, D.; Peres, R. Visual elicitation of brand perception. J. Mark. 2021, 85, 44–66. [Google Scholar] [CrossRef]
  91. Rust, R.T.; Rand, W.; Huang, M.-H.; Stephen, A.T.; Brooks, G.; Chabuk, T. Real-time brand reputation tracking using social media. J. Mark. 2021, 85, 21–43. [Google Scholar] [CrossRef]
  92. Hsieh, A.; Li, C. The moderating effect of brand image on public relations perception and customer loyalty. Mark. Intell. Plan. 2008, 26, 26–42. [Google Scholar] [CrossRef]
  93. Abd-El-Salam, E.M. Investigating loyalty through CSR: The mediating role of brand image and brand trust. J. Cust. Behav. 2020, 19, 252–279. [Google Scholar] [CrossRef]
  94. Gadenne, D.; Sharma, B.; Kerr, D.; Smith, T. The influence of consumers’ environmental beliefs and attitudes on energy saving behaviours. Energy Policy 2011, 39, 7684–7694. [Google Scholar] [CrossRef]
  95. Miller, G.A. Consumerism in sustainable tourism: A survey of UK consumers. J. Sustain. Tour. 2003, 11, 17–39. [Google Scholar] [CrossRef] [Green Version]
  96. Ma, B.; Li, X.; Zhang, L. The effects of loyalty programs in services—A double-edged sword? J. Serv. Mark. 2018, 32, 300–310. [Google Scholar] [CrossRef]
  97. Banik, S.; Gao, Y.; Rabbanee, F.K. Status demotion in hierarchical loyalty programs and its effects on switching: Identifying mediators and moderators in the Chinese context. J. Bus. Res. 2019, 96, 125–134. [Google Scholar] [CrossRef]
  98. Carlson, J.; Wyllie, J.; Rahman, M.M.; Voola, R. Enhancing brand relationship performance through customer participation and value creation in social media brand communities. J. Retail. Consum. Serv. 2019, 50, 333–341. [Google Scholar] [CrossRef]
  99. Ndebele, T.; Marsh, D.; Scarpa, R. Consumer switching in retail electricity markets: Is price all that matters? Energy Econ. 2019, 83, 88–103. [Google Scholar] [CrossRef]
  100. Bompard, E.; Ma, Y.C.; Ragazzi, E. Micro-economic analysis of the physical constrained markets: Game theory application to competitive electricity markets. Eur. Phys. J. B 2006, 50, 153–160. [Google Scholar] [CrossRef] [Green Version]
  101. Ray, A.; De, A.; Mondal, S.; Wang, J. Selection of best buyback strategy for original equipment manufacturer and independent remanufacturer—Game theoretic approach. Int. J. Prod. Res. 2020, 1–30. [Google Scholar] [CrossRef]
Figure 1. Conceptual research model. Note: (+) positive impact, (−) negative impact.
Energies 14 03933 g001
Figure 2. Summary of the research results (total research group). Note: ** p < .001; * p < .05, ns—nonsignificant.
Energies 14 03933 g002
Figure 3. Summary of the research results (L group). Note: ** p < .001; * p < .05 ns—nonsignificant.
Energies 14 03933 g003
Figure 4. Summary of the research results (H group). Note: ** p < .001; * p < .05, ns—nonsignificant.
Energies 14 03933 g004
Table 1. Percentage of people changing energy suppliers or tariffs among citizens of selected EU countries in 2013–2015.
Selected EU CountriesLevel of Provider SwitchingLevel of Provider Switching without Those Who Did It Because Moved Home Level of Tariff SwitchingProvider and Tariff Switching—Excluding Moved Home
Belgium BE23201838
Bulgaria BG0.20.11.01.1
Czech Republic871219
Denmark DK19161127
Germany DE25211435
Estonia EE771320
Croatia HR77411
Ireland IE28251136
Greece EL111516
Spain ES771320
France FR2257
Italy IT13121224
Lithuania LT1167
Hungary HU1123
Netherlands NL28261844
Austria AT1715924
Poland PL44610
Portugal PT14131932
Romania RO0.20.266.2
Slovenia SI18171128
Slovakia SK771118
Finland FI2017522
Sweden SE18151126
United Kingdom28232851
Norway19151126
EU 2814121325
Table 2. Research sample characteristics.
CharacteristicsNumber of RespondentsPercentage of Sample
GenderFemale61050.2
Male60649.8
Age (years)18–1915813
30–3930024.7
40–4936029.6
50–5925721.1
Over 6014111.6
Average monthly energy bills (euro)Below 22.023519.3
22.5–45.042134.6
45.5–67.031025.5
67.5–90.0 14211.7
90.5–112.0524.3
Over 112.0564.6
Household size (number of person)1978
230925.4
333527.5
432726.9
5 or more14812.2
Number of energy collection points198881.3
219115.7
3312.5
4 or more6.5
Table 3. Selected measures of contracts’ reliability and validity.
DimensionCriterion of Fornell-LarckerCronbach’s AlfaAVECR
GICILPPPTINT
Green image (GI)GI.854 .85.73.85
Company image (CI)CI.59.755 .78.57.84
Loyalty programe (LM)LP.44.32.774 .71.60.82
Perceived price transparency (PPT)PPT.40.53.33 .825 .80.68.86
Intention to change energy supplier (INT)INT−.05−.24.08 −.03.911.91.83.94
Note: The diagonal matrix contains square root values with AVE for individual constructs, while numbers beyond the diagonal are the values of the correlation coefficients between the respective constructs [87].
Table 4. Verification of research hypotheses (total research group).
Hypothesis.p-ValueEstimatesAcceptance or Rejection
H1Price transparency→ behavioural intention.029.093Acceptance
H2Loyalty program → behavioural intention.000.141Rejection
H3Company image → behavioural intention.000−.365Acceptance
H4Green image → behavioural intention.0910.062Rejection
Table 5. Verification of research hypotheses (L group).
Hypothesisp-ValueEstimatesAcceptance or Rejection
H1LPrice transparency→ behavioural intention.224.069Rejection
H2LLoyalty program → behavioural intention.023.119Rejection
H3LCompany image → behavioural intention.000−.370Acceptance
H4LGreen image → behavioural intention.183.086Rejection
Table 6. Verification of research hypotheses (H group).
Hypothesisp-ValueEstimatesAcceptance or Rejection
H1HPrice transparency→ behavioural intention.047.129Acceptance
H2HLoyalty program → behavioural intention.073.104Rejection
H3HCompany image → behavioural intention.000−.369Acceptance
H4HGreen image → behavioural intention.316.073Rejection
Publisher’s Note: MDPI stays neutral with regard to jurisdictional claims in published maps and institutional affiliations.

