Abstract
Wood chips and logging residues currently comprise the largest share of biomass fuels used for heat generation in district heating plants and are provided by a variety of suppliers. Ash and moisture contents, as well as the calorific value, may vary considerably depending on the composition of the fuel, seasonality, location, and other factors. This paper provides the summarized results of the main characteristics of wood chip moisture and ash content and calorific value, experimentally tested for a significant range of samples. Chip samples were collected from two district heating companies and tested for a significant range of samples. Chip samples were collected from two district heating companies and tested for a 3-year period. The data on fuel chip prices were taken from the electronic wood chip trading platform. The tests were performed using standard express methods, where two sub-samples were taken and analyzed from every chip sample. It was determined that the moisture content of the wood chips varied from 35% to 45%, the calorific value from 18.4 to 19.6 MJ/kg, and the ash content from 0.5% to 4.5%. The calculated relative expanded uncertainty of the moisture content measurement was ±2.1%, of calorific value—±1.5%, and of ash—±1.0%. The repeatability of the results was estimated as the pooled standard deviation.
1. Introduction
Currently, the largest share of solid biomass used for heat generation in power plants consists of forest cutting and wood processing residues, which are usually prepared and supplied in the form of wood chips. Such fuel is a heterogeneous formation and may contain not only wood chips but also many different impurities, such as leaves, needles, soil clods, or other mineral substances.
Fuel moisture can also vary widely from 5 to 55% and affect other properties, such as calorific value. Accurate information on fuel properties is important in setting prices, assessing the amount of energy planned to be produced, and selecting the correct properties of fuel for efficient combustion. Fuel suppliers and energy producers often need information on how and within what limits the main parameters of the chips change: humidity, calorific value, and ash content depending on the composition of the chips, the seasonality of preparation, and the geographical location. This is necessary in order to make the proper decisions regarding the purchase, storage, and efficient combustion of fuel. Other important wood chip parameters, such as fraction size, the fraction of fines, and Cl and S quantities are often examined together to assess the suitability of the wood chips for the combustion installations.
Measurement and evaluation methods for wood chip fuel and analyses of main characteristics, such as moisture content, calorific value, and others, were surveyed in [1]. Accurate parameter setting requires complete methodological guidelines and standards. In addition, it should be noted that a very important factor influencing the accuracy of parameter setting is the number of samples. Such studies have been performed [1]. Here, it is shown how the error of moisture determination varies from the number of samples. It is also shown how the calorific value and chemical composition depend on the type of wood and its individual parts.
In general, initial studies on biomass for energy production have shown that it is a competitive fuel vs. fossil fuels and has a dry matter calorific value of around 17–21 MJ/kg for the wood [2]. Therefore, studies on the fuel, produced from solid biomass, and their characteristics have been carried out, and procedures for their determination have been improved, including research methods and the use of equipment [3,4], which were used for the development of respective standards for fuel classification and determination of its characteristics.
The main characteristics of fast vegetation agro-waste have also been investigated as potential fuels, but wood waste products (pellets, briquettes) were defined as qualitatively better in terms of moisture, ash content, and chemical composition [5].
As wood chips became the most important commercial product for energy generation, their quality became an object of increased focus. All stages of such fuel production from tree felling, storage, and preparation for efficient combustion are important.
It is considered that the felling and wood chip production season is important for fuel quality, as, during the season between February and May, the carbon content, calorific value, total moisture content, and density of wet wood chips decrease and ash content increases due to covering the woodpiles, thus, preventing air circulation [6], and fuel parameters deteriorate in dry or deadwood [7]. To prepare chips for combustion, the cutting residues must be piled up and chipped on the roadsides. The typical ash content of such chips is between 3% and 4%. To obtain the optimal moisture content (about 30%) and, thus, increase the calorific value of the fuel, these residues must be stored for about 5–7 months in the forest site before chipping, and the lowest moisture content is achieved in September. Thus, in terms of the best characteristics of wood chips: optimal cutting is at the clear-cut area after stacking; the storage period is important to prevent deterioration of fuel quality; summer months and early autumn are the most appropriate for forest cutting. The references envisage further research of the main characteristics to improve the energy efficiency of the combustion process and reduction emissions of harmful substances [8].
Logging residue storage in ventilated piles and the effect of the particle size on the storage were investigated, as particle size is important for conveyor transportation and proper burning of the chips. This can be achieved due to proper drying and maintaining appropriate microclimate conditions [9]. Fuel storage conditions also affect fuel moisture content and calorific values. It was found that, although the wood dries after 60 days, however, when stored for more than 18 months, the fuel quality characteristics deteriorate sharply, also due to exposure to molds and fungi [10]. Chips begin to decompose fast with a very high increase of moisture content and the share of a fine fraction [11]. Preference should be given to log drying [12]. Drying logging residue first and then forwarding the material to a windrow on a landing will ensure lower moisture content and better storage characteristics [13]. The temperature of the wood stack is a good indicator of the decomposition of logging waste chips, but the ash content and calorific value of dry matter vary slightly [14]. As a whole, many factors, such as storage method, biomass origin, size and shape of the fuel, and storage time, as well as temperature and humidity, simultaneously affect dry matter losses and must all be taken into account. Logs dried for two weeks produce fewer fines while chipping compared to one-week dried logs [15].
When using wood chips or other wood fuels for cogeneration or special applications in industry, the reduction of fuel moisture by drying using various technologies has been investigated: the lower calorific value of wood fuels is 9.72 MJ/kg at 40% moisture content, however, calorific value can be increased to 14.76 MJ/kg after drying the fuel to 15% moisture content [16]. Minimization of ash content in wood chips has a significant impact on heat and fuel production economy and ash handling costs. Studies in Central European countries show that reducing ash content in wood chips is important as the storage of slag after incineration is an important environmental issue. Chip screening can improve chip quality by reducing ash content and eliminating unwanted size classes [17].
The composition of wood chips can vary considerably as this fuel is inhomogeneous and may contain significant amounts of needles, bark, and minerals [18]. The size of wood chips also depends on the density of felling waste, which can vary up to 58%. Chip size affects the movement of chips on a screw conveyor in the boiler house. The additional mechanical energy from 1 kJ/kg to 5 kJ/kg to feed chips is needed [19]. Chip additives, such as pinecones, can also improve fuel quality by increasing calorific value up to 21.16 MJ/kg for spruce and 19.41 MJ/kg for pine, which exceeds the calorific value of chips produced from these wood types [20].
In practice, the main characteristics have the greatest impact on the quality of wood chips. In a Baltpool biofuel market study commissioned for an accredited laboratory, wood chip samples to define moisture and ash content showed that the moisture content values varied between 13.5% and 19.9% and ash content values—between 1.0% and 14.4%, and those values were higher at higher outdoor temperatures and humidity [21]. The dependence of calorific value on the moisture of the same wood species was investigated, where the calorific value of dry wood at 0% humidity reached 18.802–20.224 MJ/kg, and at 50% humidity—calorific value reached only 9.74–6.36 MJ/kg [22]. Storage costs accounted for about 4.8% and transportation costs for about 23.2% [23].
Following from the review, the parameters of the chips depend on many factors, such as the composition of the raw material and the conditions and time of its preparation. Although these factors have begun to be explored, efforts are still insufficient, while their importance is growing due to the increasing need of renewable energy resources. At the same time, the importance of measurement accuracy in estimating the total cost of production and use of renewable fuels, as well as the volumes of harmful emissions to the environment [24], is increasing.
Increasing the production of wood chips from certified raw materials and using them for energy generation, as well as improving energy production technologies using biofuels of various qualities can lead to expansion of the use of bio-resources for green energy, which helps us to make progress towards a sustainable and circular economy and decarbonization of the municipal thermal energy sector [25].
Socio-economic indicators for the bioeconomy (SEIB) have been proposed to assess the sustainability of bio-economic sectors in Europe, including the bio-energy sector. They could be used to measure the impact of policy strategies on the specific performances evaluating the contribution of single bio-based sectors (especially in bio-energy). The monitoring and assessment of indicators, related with management practices, is required for European countries and would serve as example on a global scale. Lithuania, according to this evaluation of the European average, is in the middle of MS [26].
The present investigation is focused on the determination of the main characteristics (moisture content, calorific value, and ash content) of wood chips supplied to boiler houses for heat production and their changes due to seasonality and geographical location in Lithuania. Data for a period of 3 years, as well as the accuracy of their determination using express methods, are analyzed.
2. Materials and Methods
2.1. Data Collection
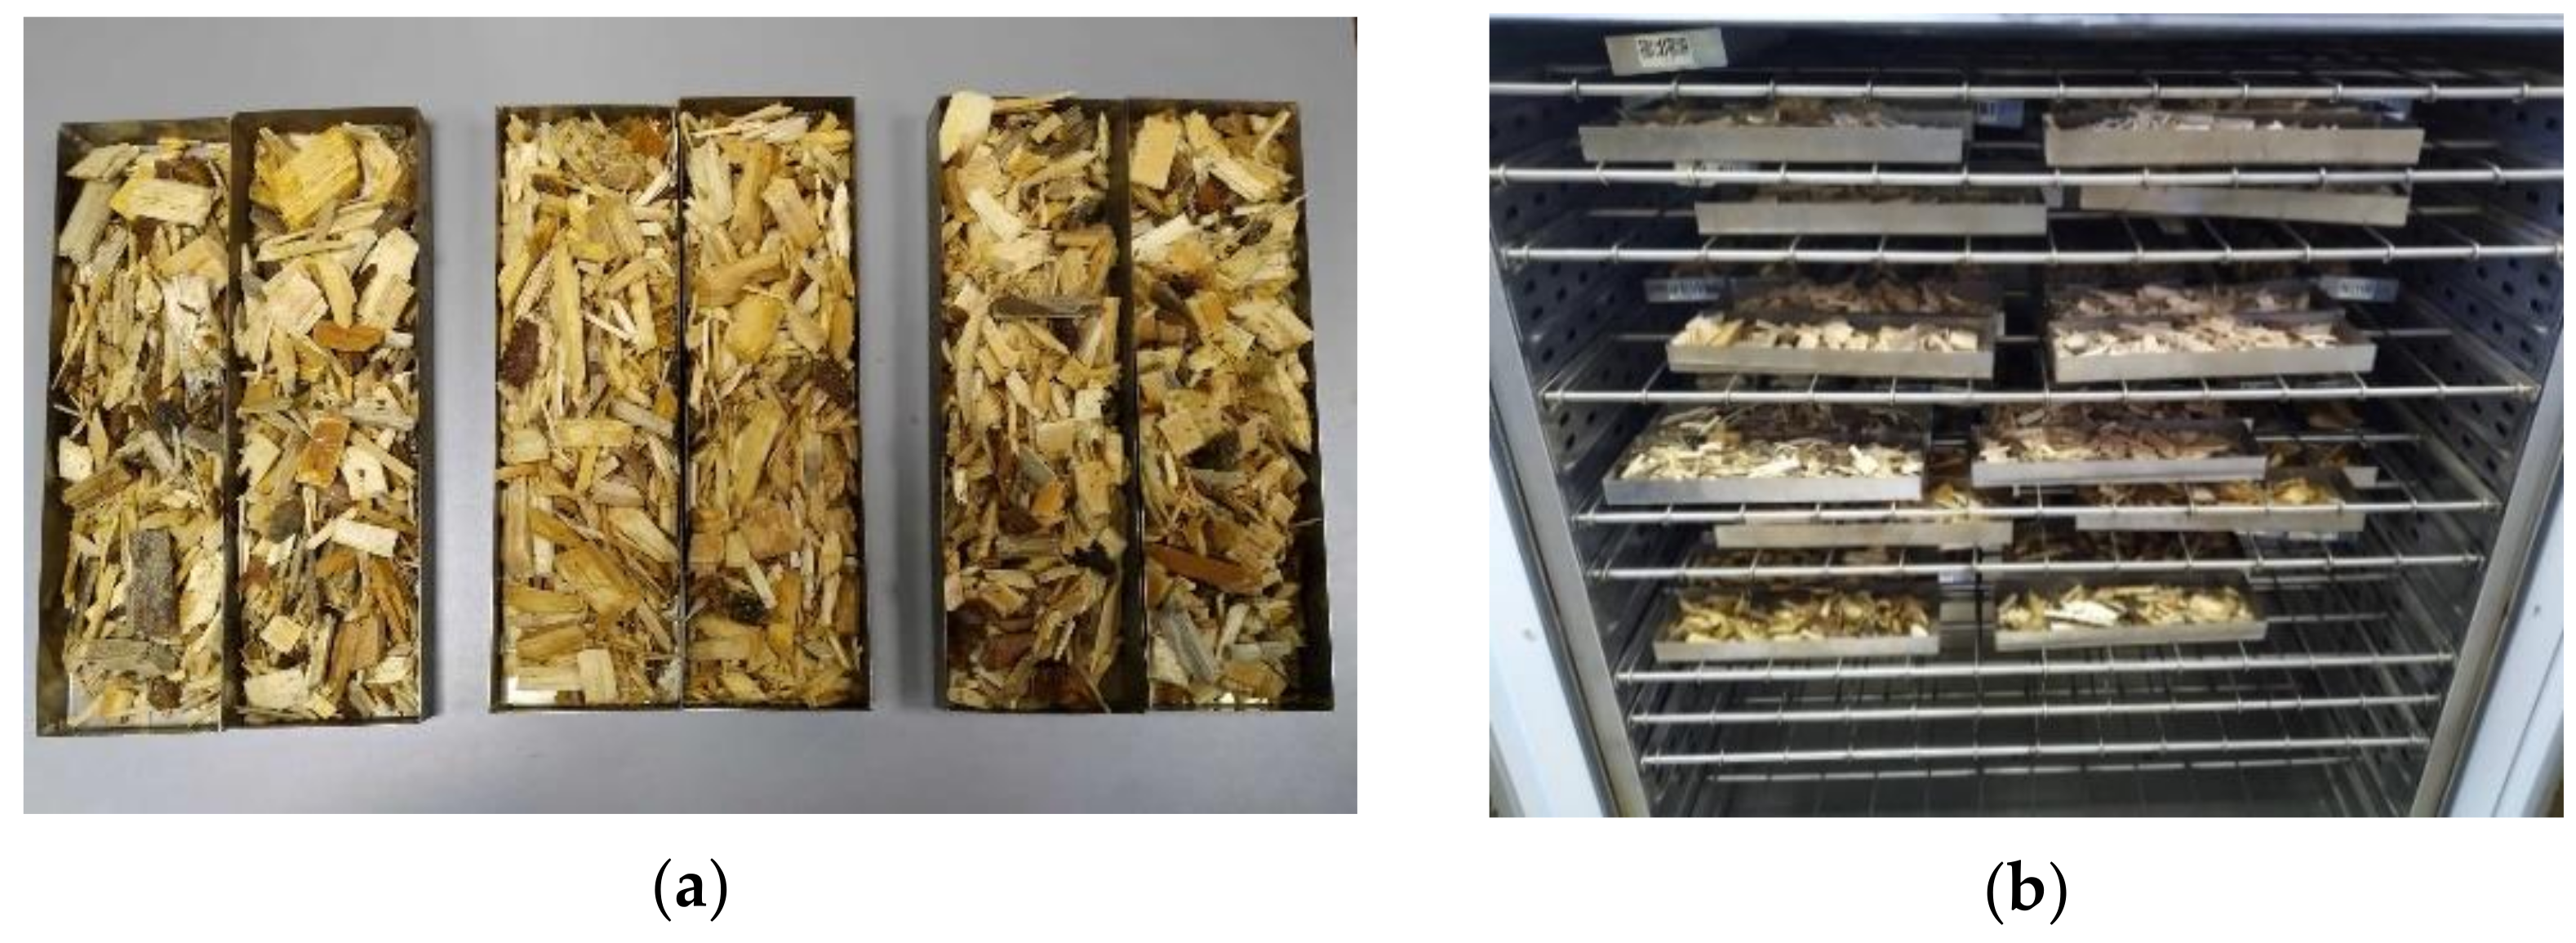
To determine the characteristics of wood chips (moisture content, calorific value, and ash content) supplied to district heating companies (DH), chip samples were selected from two district heating companies to define geographical differences. Companies were located in the northwest (Mažeikiai DH company—Company M) and southwest (Kaišiadorys DH company—Company K) of Lithuania, the distance between being about 250 km. Wood chip samples (approximately 600–700 g) were selected and submitted by the staff of the wood chip supplier and the DH company following the procedure provided in their contract. Two sub-samples from each sample were prepared for testing procedures.
Figure 1 shows two sub-samples sets (a) and samples drying in the oven (b).

Figure 1.
Examples of samples: (a) two sub-sample sets and (b) samples drying in the oven.
The elemental composition of the chips was not determined for each sample. However, a comparison of the CHNSO road measurement averages with the averages of similar elements of firewood (alder, ash wood, oak, birch) oak and black alder briquettes [5], presented in Table 1, shows that there are no large differences between the main elements, and there was no task to identify detailed differences in composition.

Table 1.
Comparison of the composition of main elements for wood chips, firewood, and briquettes, %.
The data on chip prices in two regions under investigation for the period of test performed during the years 2018–2020 were collected in statistics of Biomass Exchange—the electronic wood chip trading platform.
2.2. Testing Equipment and Methods
As in practice, the tests were performed using standard express methods, where only two sub-samples were taken and analyzed from one chip sample, and it was not possible to repeat them. Separate chapters of this paper discuss the additional uncertainty inputs introduced by this method and the application of the total standard deviation to assess the scatter.
Moisture content was determined in two sub-samples (Figure 1). Before the test wood chips sub-sample was weighed, it was sieved through the 31.5 mm sieve to homogenize the sub-sample. The total test sub-sample in a layer did not exceed 1 g of matter per cm2. Two sub-samples were dried at 105 °C until the constant mass was achieved.
Dried wood chips were ground to obtain a nominal particle top size of 1 mm. Ash content was determined in two test sub-samples, minimum of 1 g of test sub-sample. Weighed samples were placed into a furnace and heated for approximately 4 h in two steps (250 °C and 550 °C). Cooled dishes with samples were weighed.
Calorific value was determined also in two test sub-samples. The sample was tested in a pellet form. Prepared sawdust was pressed with the hydraulic press at a force of about 10 t, having a diameter of about 13 mm and a mass of (1.0 ± 0.2) g. The repeatability limit for two wood chip samples could not exceed more than 140 J/g.
The uncertainties presented in Table 2 were achieved for homogenous samples, and tests could be repeated many times to define the standard deviation of achieved results.
Table 2.
Test apparatus and methods.
2.3. Data Analysis and Processing
Due to a large number of samples and the need to determine the moisture and ash content and calorific value in a limited time, simplified procedures, so-called express methods, have been adopted in practice, where a minimum number of two samples can be analyzed. There is no regulation on the threshold of the assessment of the main characteristics of the wood chip, which is important in resolving disputes between purchasers and suppliers of the wood chip, where several laboratories may be involved to determine the moisture content of the spare chip sample, the results of which may differ.
The numbers of measurements for this investigation are as follows:
- 1317 measurements for Company M and 1453 measurements for Company K performed on moisture content during the period 2018–2020;
- 1320 measurements for Company M and 383 measurements for Company K performed on calorific value during the period 2018–2020; and
- 1498 measurements for Company M and 467 measurements for Company K were performed on ash content during the period 2018–2020.
The figures represent the total numbers of samples provided to the laboratory during the testing period, which is needed for the more precise definition of pooled standard deviation [27].
Since the moisture content of biofuels in routine tests is only determined from two sub-samples of a fuel sample, the repeatability of the results is estimated as the pooled standard deviation [28] according to Equation (1):
where Sp—pooled standard deviation;
si—standard deviation per sample assessed;
ni—number of measurements/sub-samples per sample;
N—total number of measurements;
K—number of samples.
The standard deviation per fuel sample is determined [28] according to Equation (2):
where xi—measured values of two sub-samples;
—an average of the two measured values.
Equation (1) was used for repeatability measurement of all parameters under the test.
3. Results and Discussion
3.1. Moisture Content of Wood Chips
Moisture affects the energy value of the fuel, combustion process efficiency, and temperature achievable during the combustion process. Its lower calorific value is because some of the heat released during combustion is used to evaporate the moisture. During the cooling process of flue gas, the water vapor in the fuel can condense and cause corrosion of the economizer and heat exchange surfaces. Moisture lowers the temperature in the furnace, and as a result, combustion conditions deteriorate.
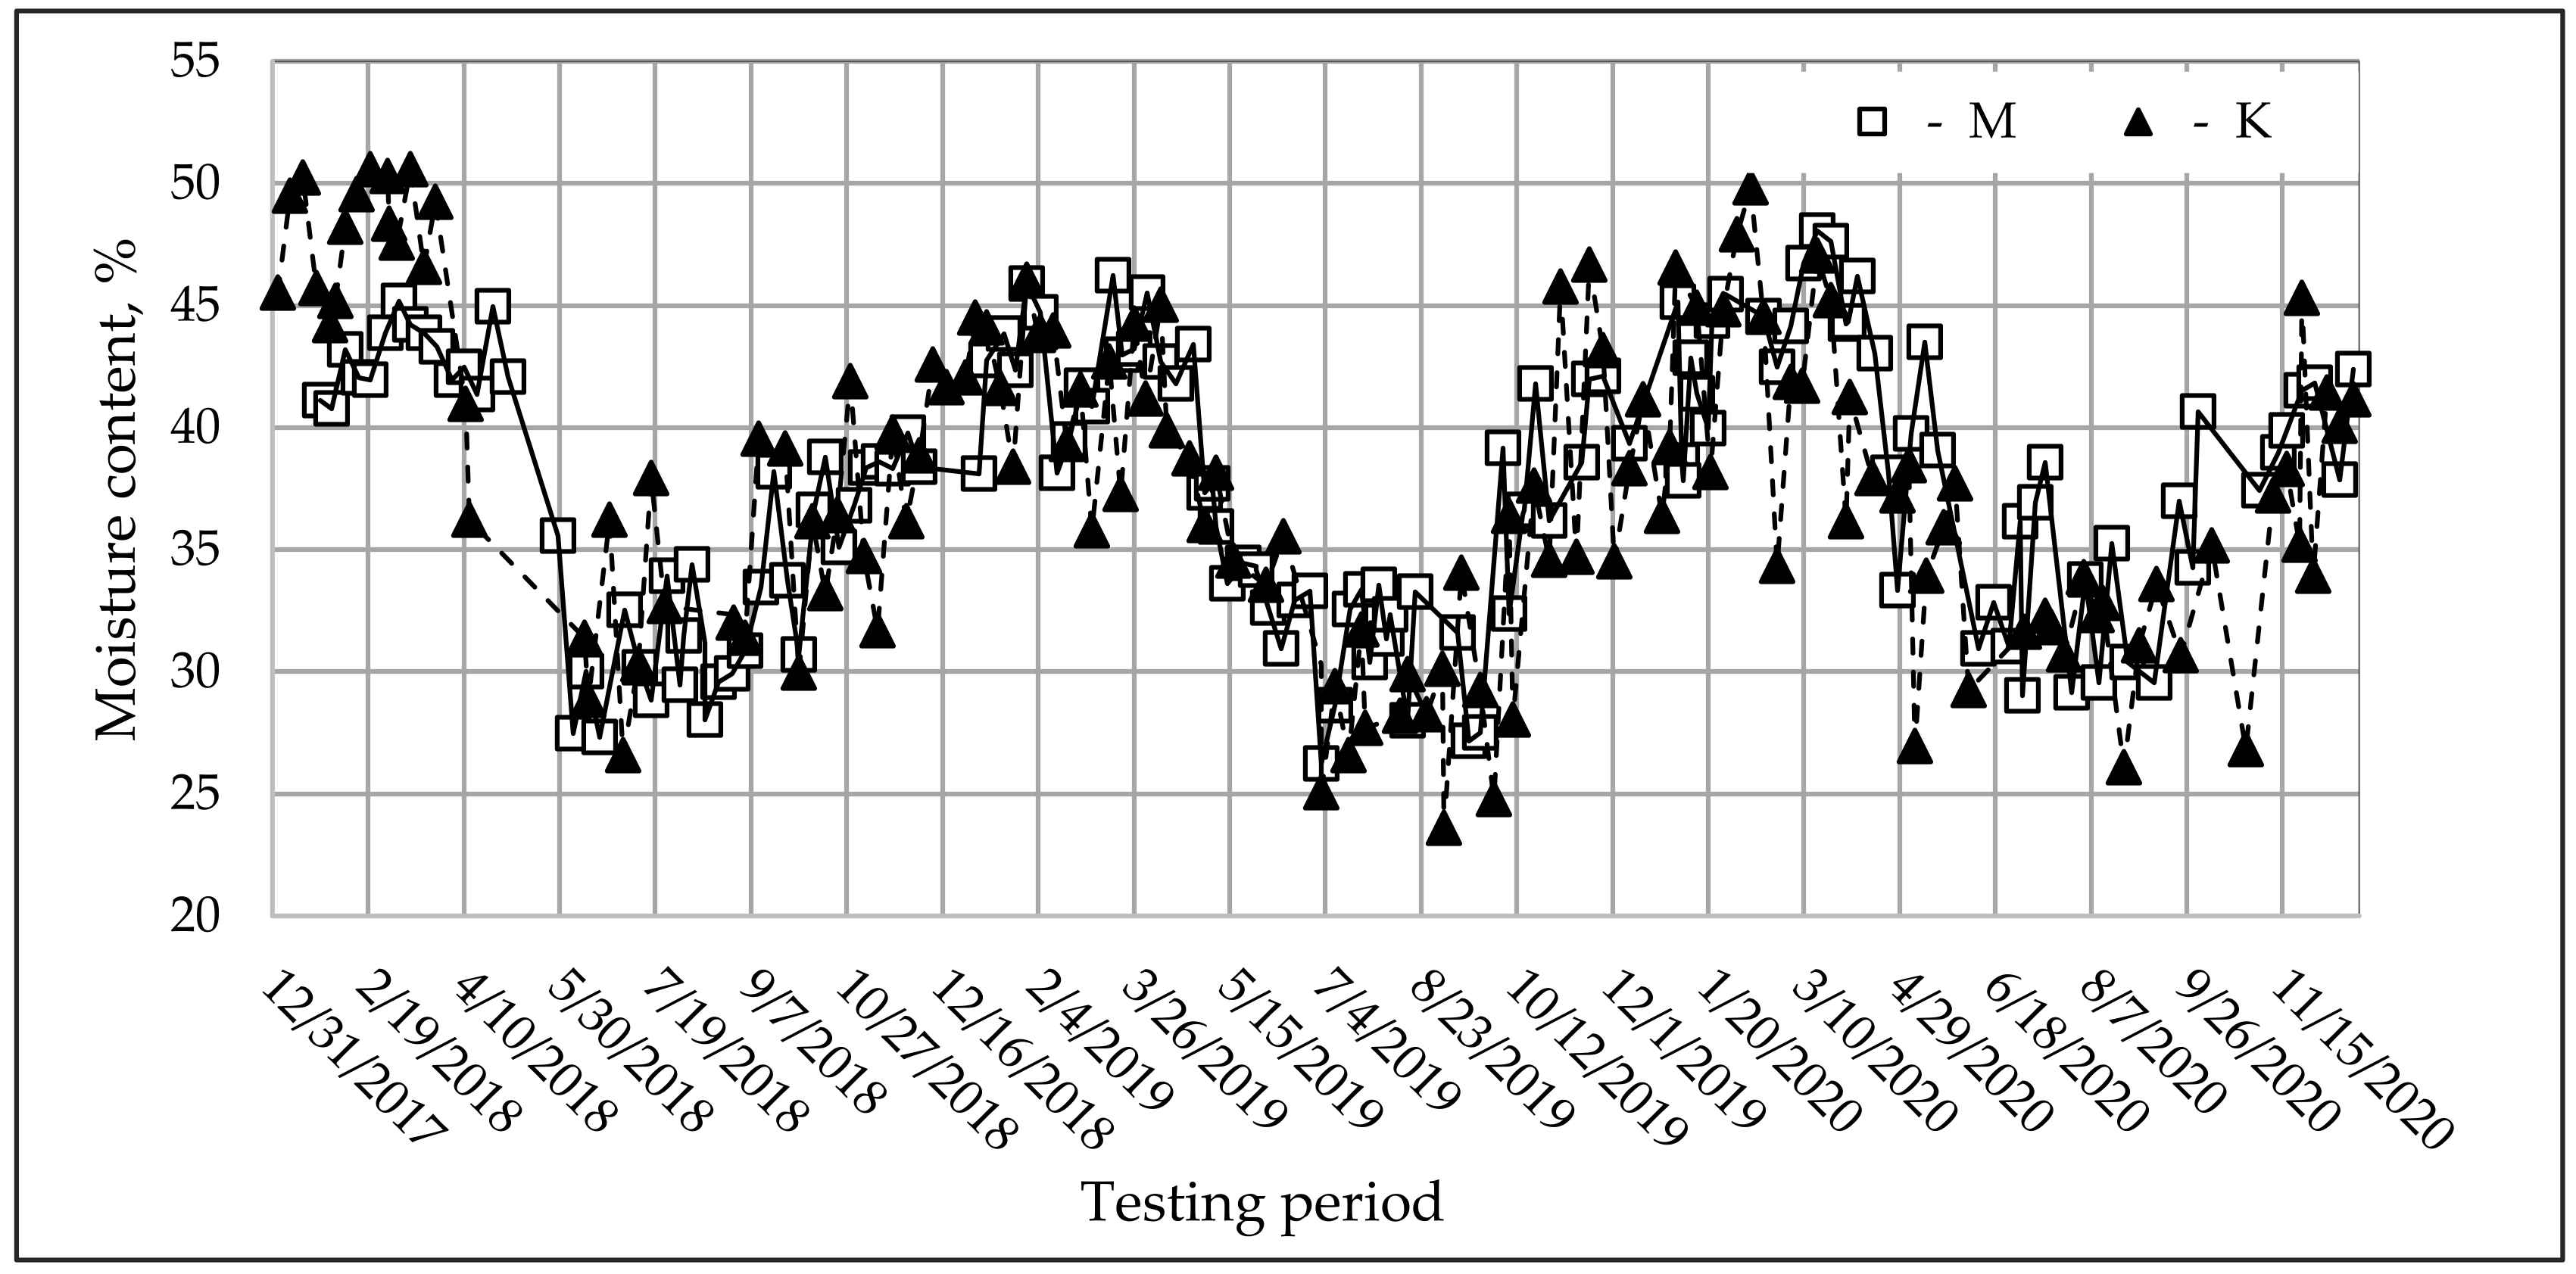
Experimental measurements of the total moisture of the chip samples provided from the heat supply companies M and K revealed that the change of this parameter correlates very well with annual seasonal changes in regional climate indicators. As is seen in Figure 2, in the summer from May to September, the minimum moisture content of the wood chips reached (30 ± 5)%. Maximum wood chip moisture up to (45 ± 5)% was observed in the period from December to April. Although only 3 years were analyzed, it can be said that the range of variation in the moisture content of the supplied wood chips varied slightly, as well as the annual changes in environmental conditions. Short-term changes in air humidity or precipitation did not change the basic pattern of wood chip moisture variation. These factors, together with the shortcomings of the express method used for moisture measurement, determined the deviations of the moisture data from the basic pattern curve and data dispersion.

Figure 2.
Daily average values of moisture content of wood chips supplied to companies M and K.
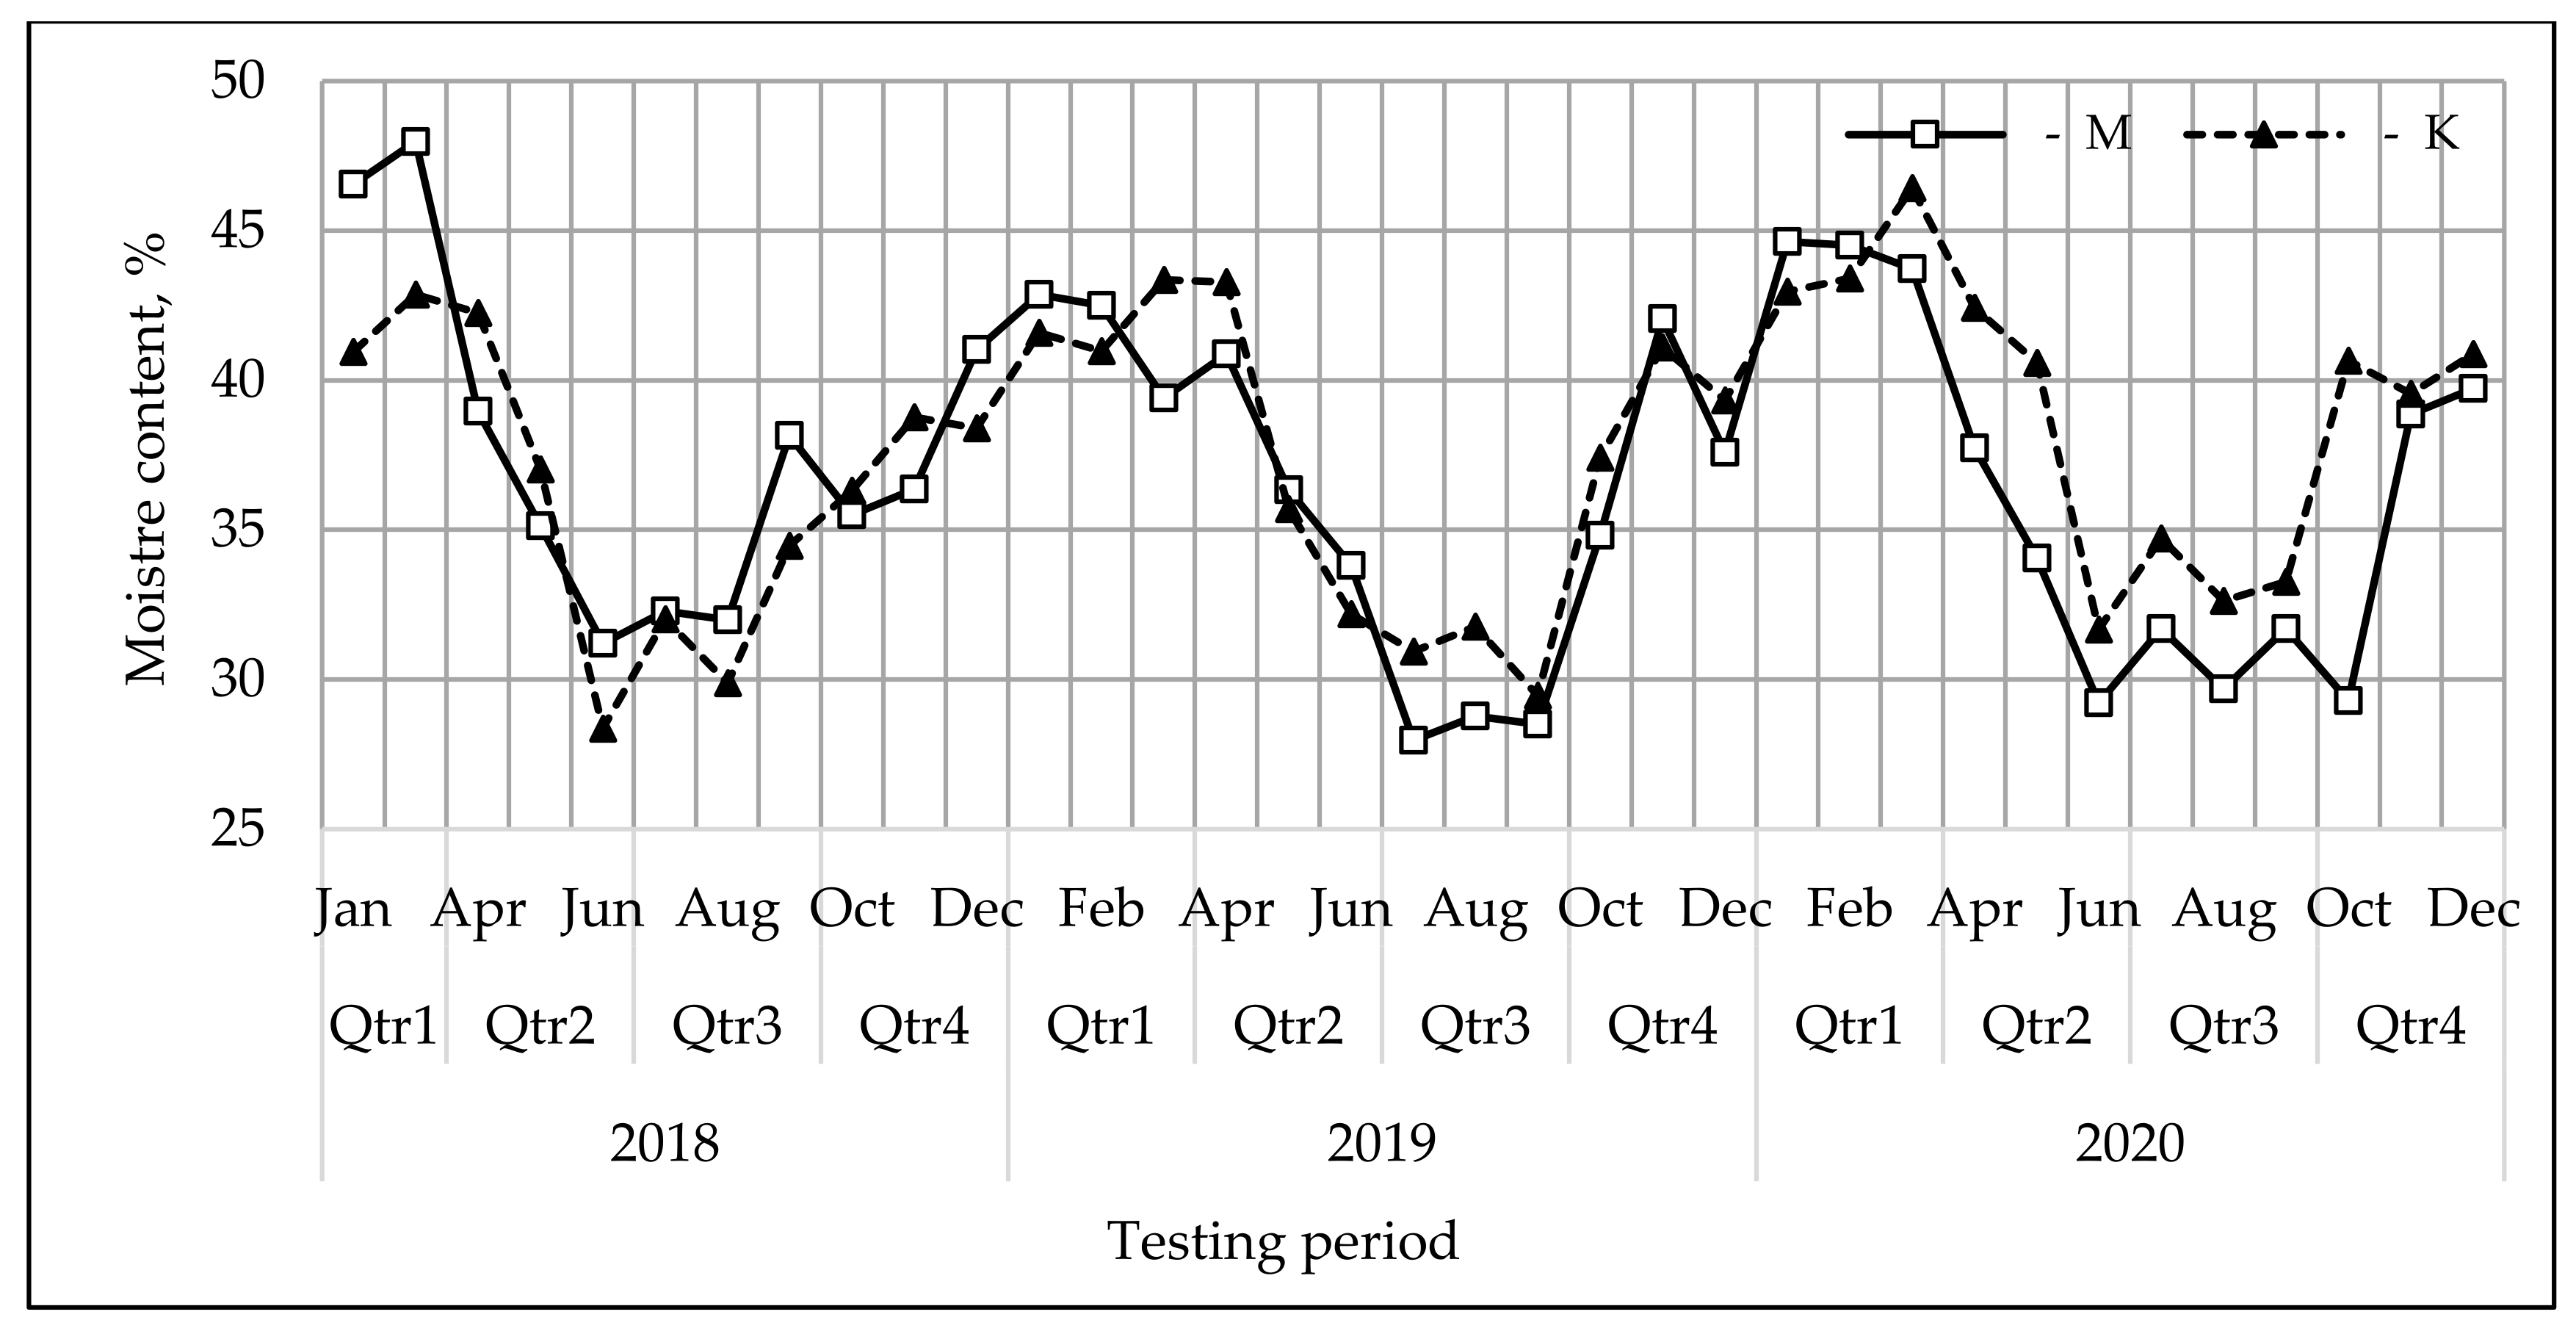
By increasing the averaging time from one day (Figure 2) to one month (Figure 3), the impacts of short-term and random factors disappeared, and the changes of the seasonal environmental conditions became more transparent and reflected the moisture content of the main share of wood chips supplied to DH.

Figure 3.
Monthly average values of moisture content of wood chips supplied to companies M and K.
As expected, the geographical location of the sites did not affect the moisture content of the chips, as the distance between the sites was only (250–300) km, and there was no strict boundary between the regions of origin of the wood chips.
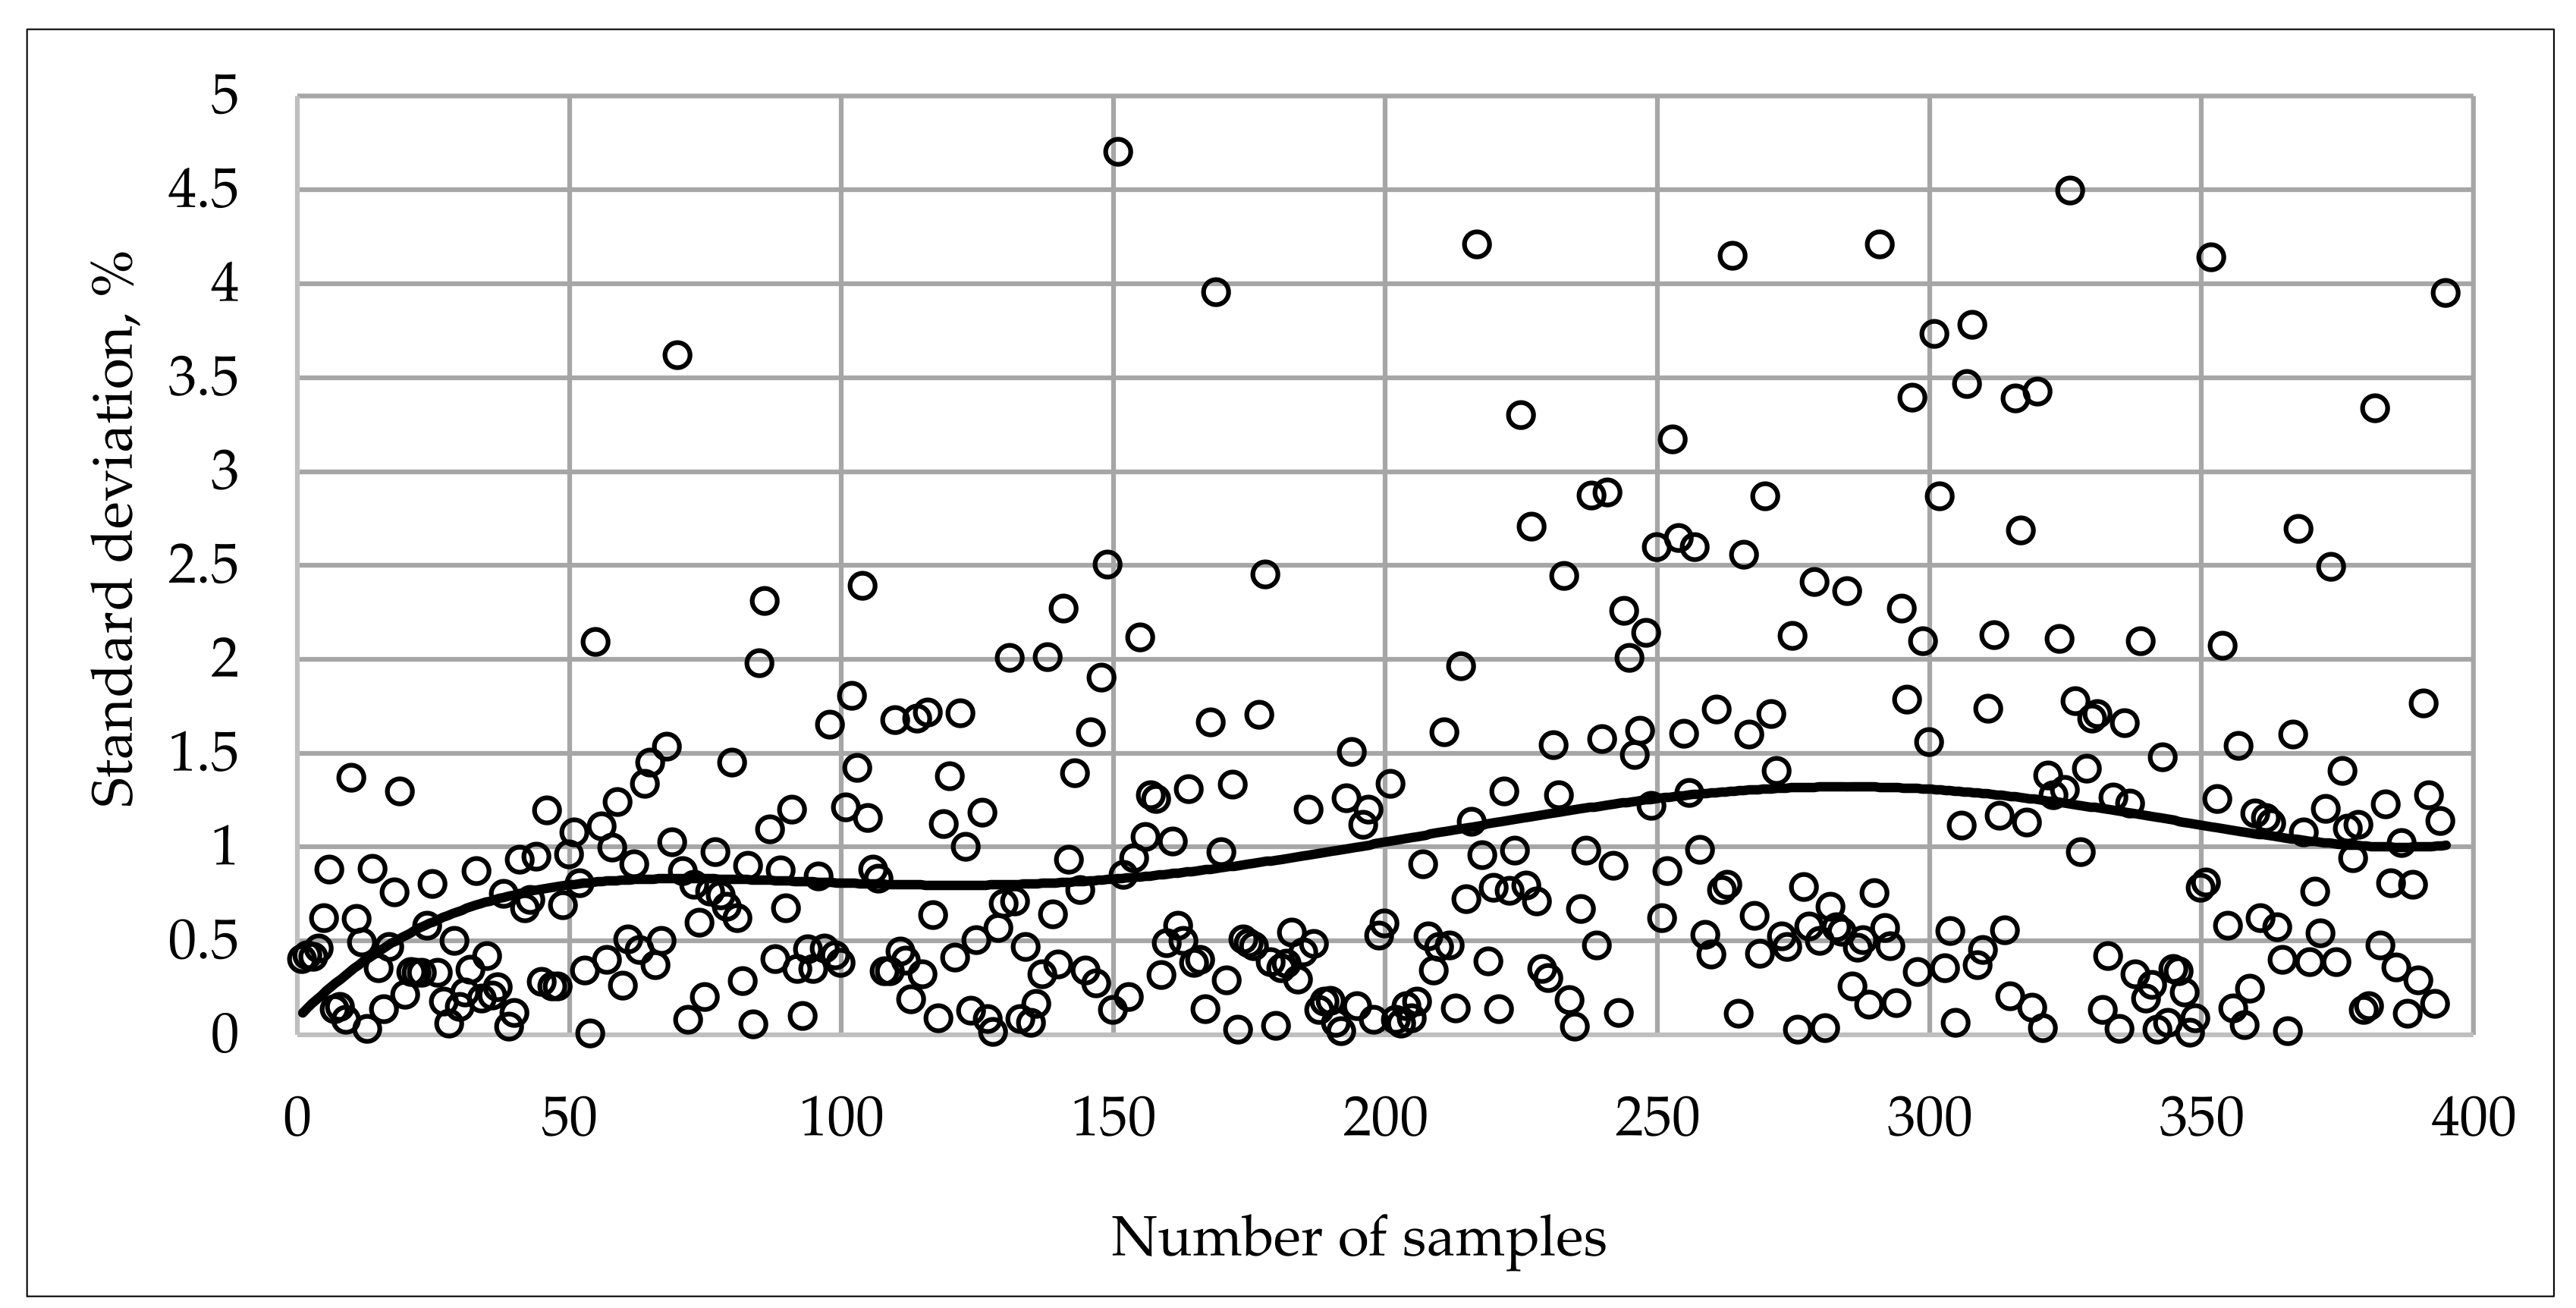
To evaluate the uncertainty on a determination of the total moisture of the wood chip sample by taking the test results of two sub-samples, an additional analysis of the results on the evaluation of the total moisture of 396 sub-samples out of 198 samples was performed. It showed (Figure 4) that the absolute values of the standard deviation of the moisture content values of two sub-samples from one sample were distributed according to the normal distribution, and at 95% confidence level, the standard deviation of these values varied within wide limits and reached up to 4.5%. This means that the total uncertainty in the determination of the total moisture content of the wood chips is strongly influenced by the sampling procedure, the inhomogeneity of the samples, and the non-uniformity of the moisture distribution in the individual fractions. These factors make an important contribution to the total uncertainty of the moisture assessment in biofuels for two sub-samples, as other contributions related to the measurement and test conditions made a smaller and constant contribution of ± 0.4% (Table 2).

Figure 4.
Standard deviation from mean values for two sub-samples of the same sample and mean trendline curve.
The data presented in Figure 4 show that the mean of the standard deviations is close to 1% and to the values of the pooled standard deviations calculated using Equation 1 and presented in Table 3.
Table 3.
The values of pooled standard deviation, calculated from the measured value of 50 samples.
Thus, when estimating the scatter of the total wood chip moisture measurement results by the total standard deviation, the expanded moisture measurement uncertainty reached ±2.1%. In this case, the contributions to the total uncertainty associated with the accuracies of the apparatus given in Table 2 and the scatter of the results are summed arithmetically, i.e., the sum of their squares is not calculated. Deviations from individual measurements to achieve 95% confidence, which is important in resolving potential legal disputes, must be considered separately.
3.2. Calorific Value of Wood Chips
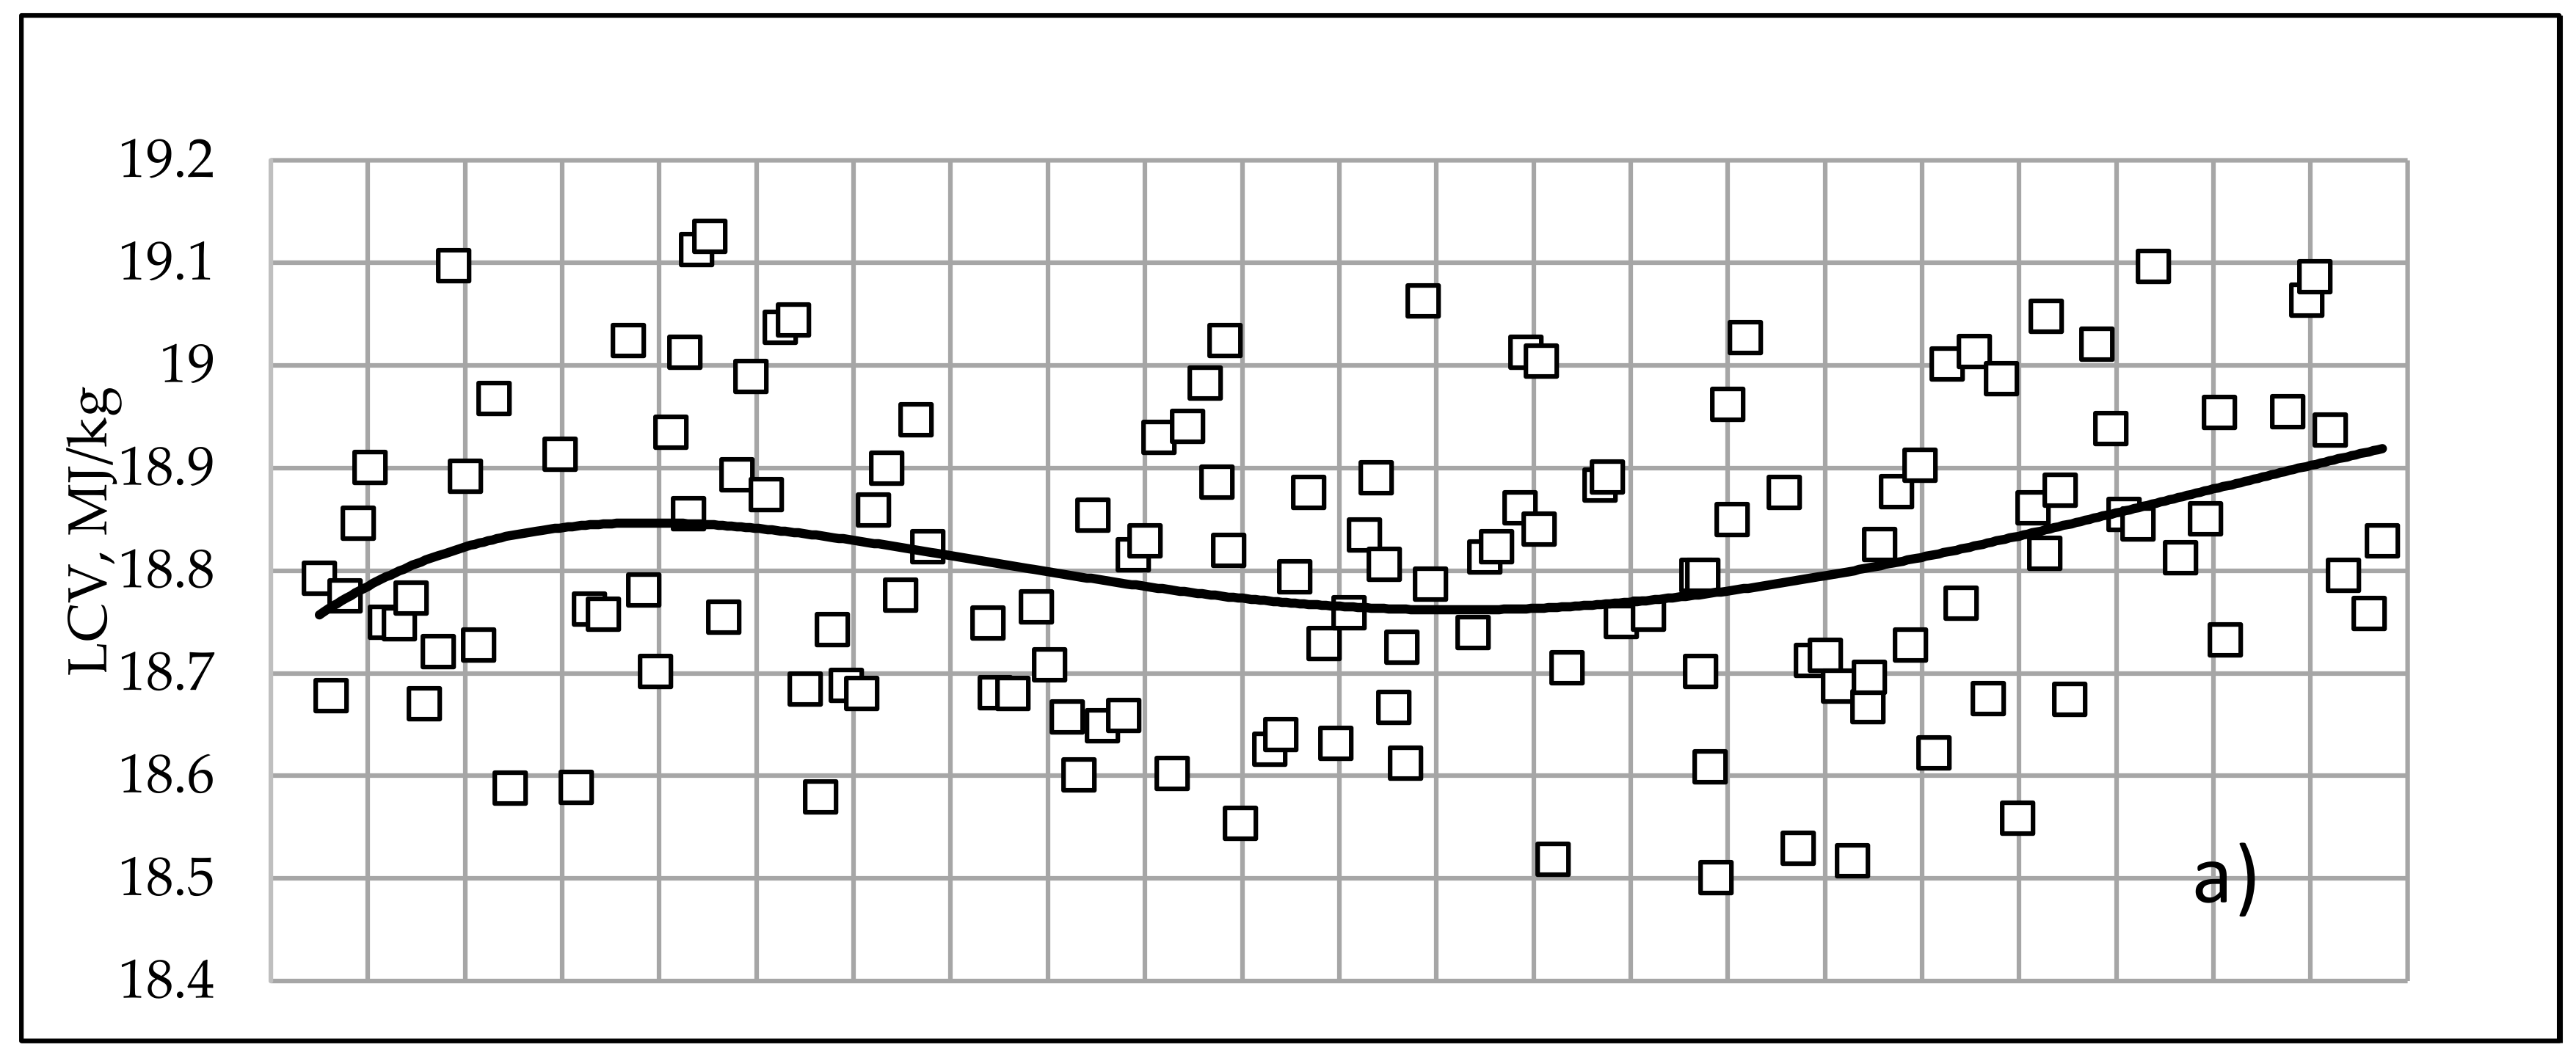
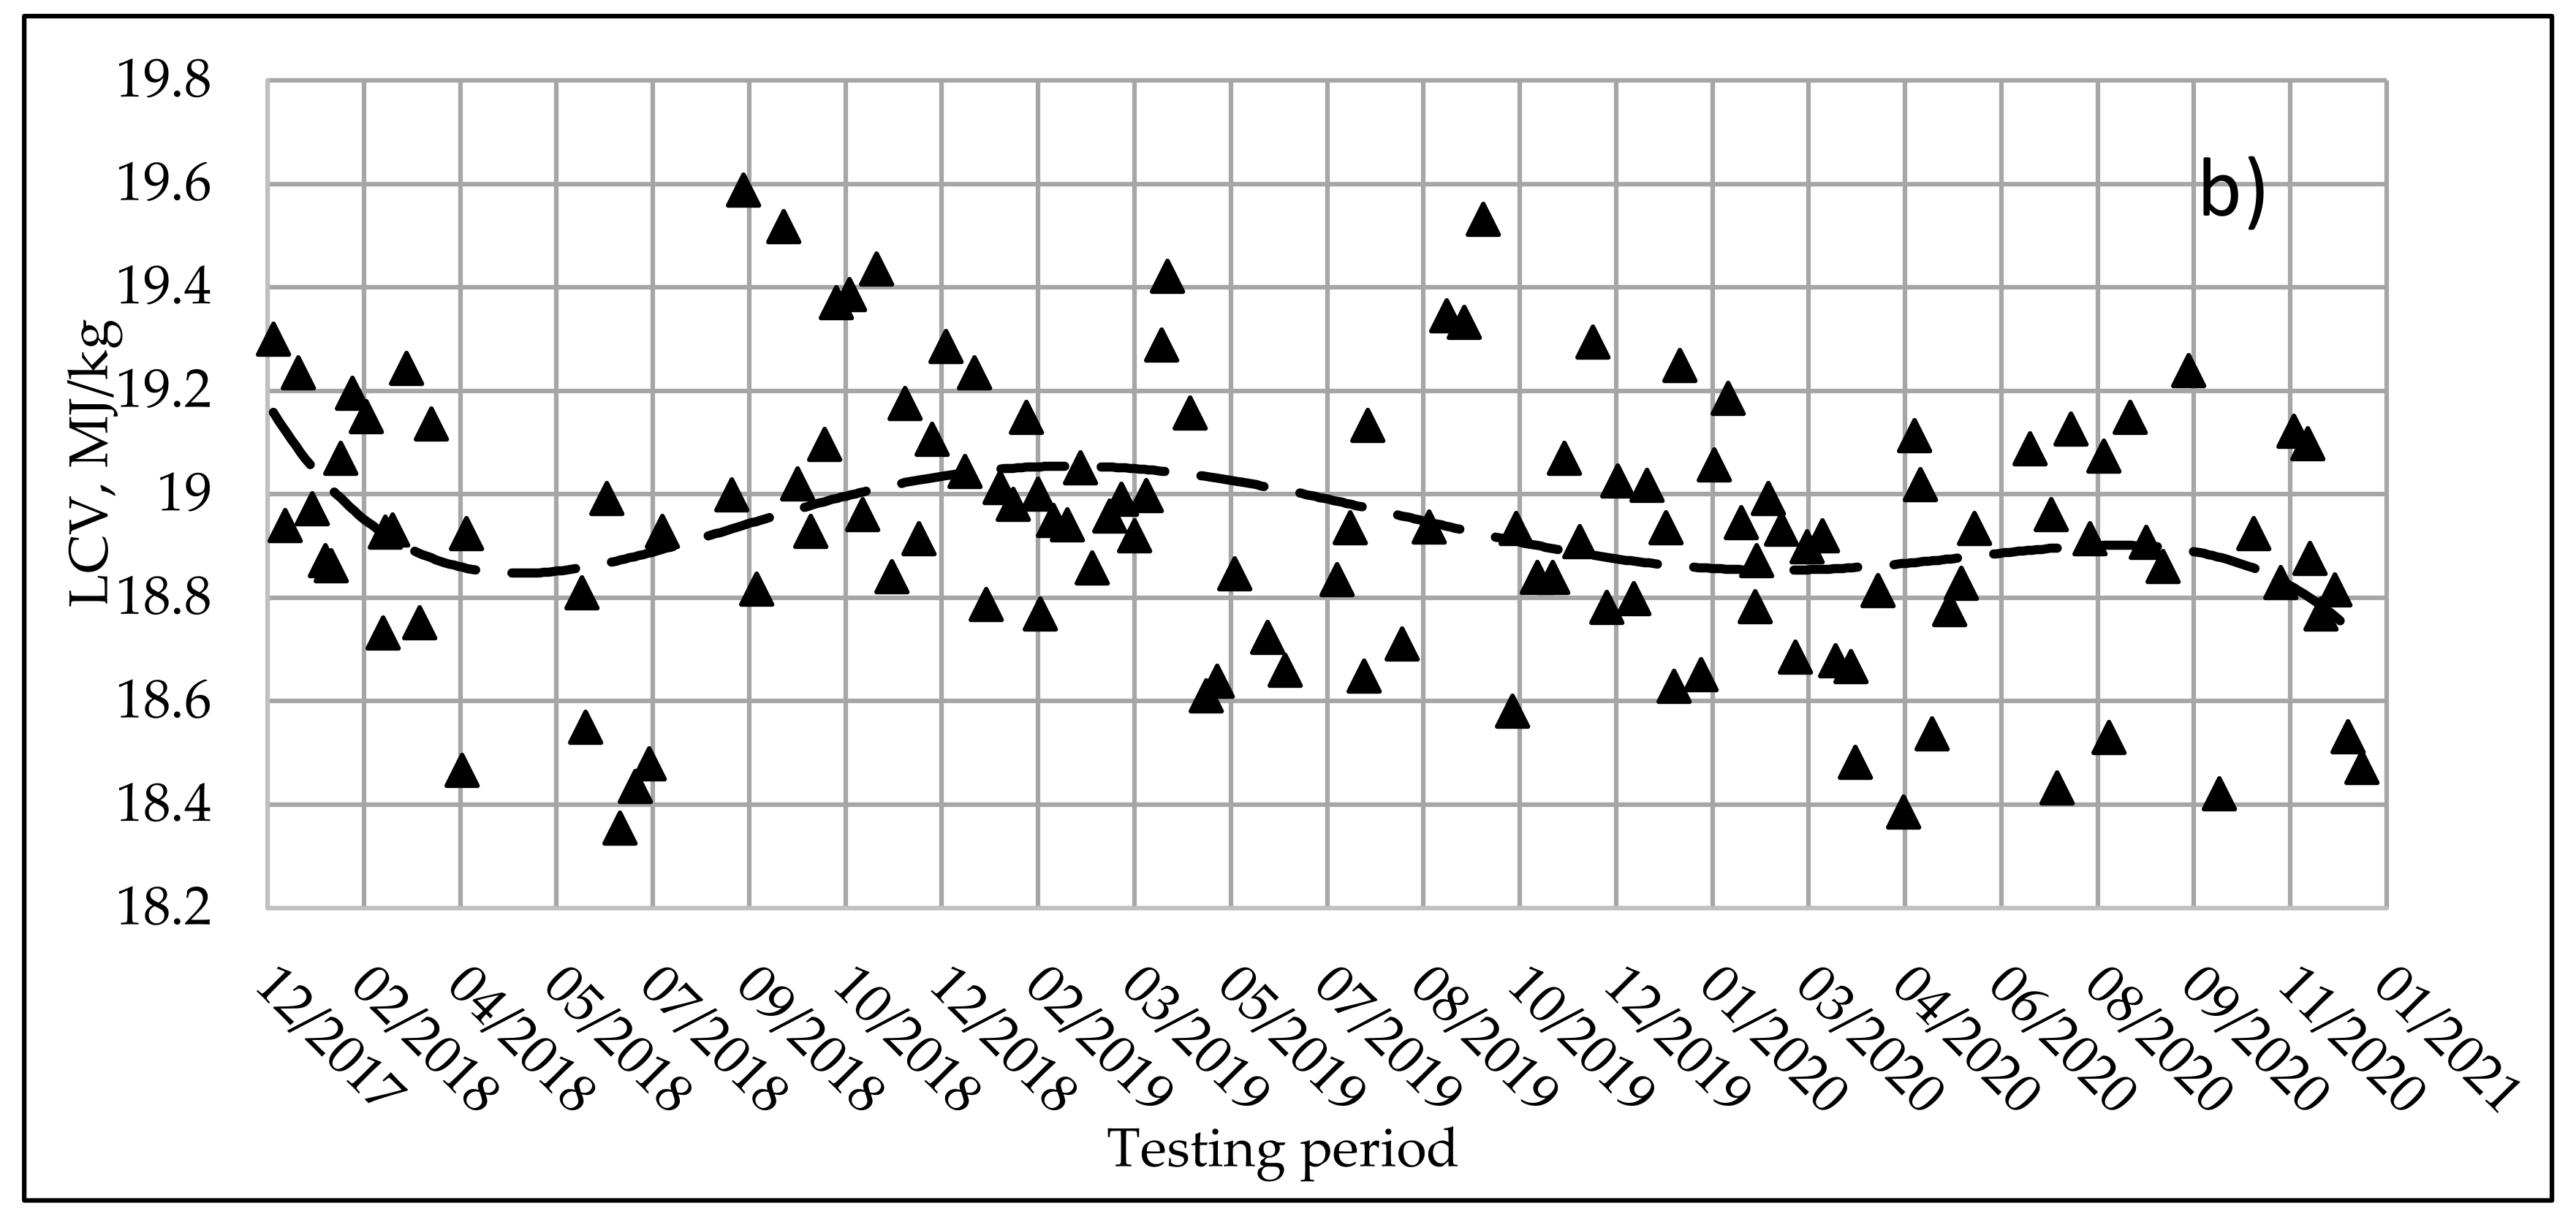
A comparison of the daily average variation of the lower (net) calorific values of dry (moisture-free) chips supplied to companies M and K in 2018–2020 is presented in Figure 5.

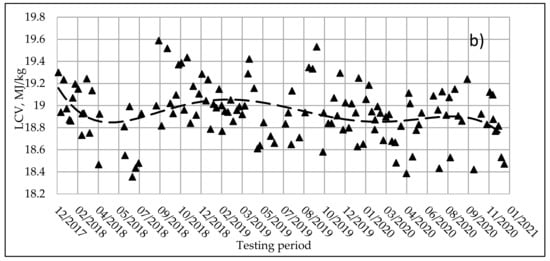
Figure 5.
Daily average lower calorific values (LCV) and mean trendlines curves: (a) company M; (b) company K.
It can be seen that the calorific value of the chips used in company M was quite stable over the whole 3-year period and reached (18.8 ± 0.3) MJ/kg. At company K, a little higher mean calorific value and dispersion were observed, that of (18.9 ± 0.4) MJ/kg. It also confirmed that the geographical location of the sites did not affect the calorific values of wood chips.
When determining the uncertainty of the calorific value measurement, it was observed that the difference between the calorific values of the two sub-samples in one sample did not exceed 0.14 MJ/kg. This value can be considered as an indicator of the scatter of measurement results on calorific value and can be considered a contribution to the total uncertainty of the measurement result, together with the contribution of 0.7% provided by the calorimeter and scales (Table 2). As the uncertainty in the determination of the moisture content of the general analysis was small compared to the two main inputs indicated, the calculated relative expanded uncertainty of the calorific value measurement was ± 1.5%.
3.3. Ash Content of Wood Chips
The ash content of pure wood is low and reaches up to 0.5%. However, logging waste often contains large amounts of various impurities, such as leaves, needles, soil, or other minerals, that increase the amount of ash, which has undesirable effects: it reduces the calorific value of the fuel and accelerates the wear of fuel combustion equipment. Higher amounts of ash increase the costs of ash storage and disposal.
The comparison of the daily average values of biofuel ash content in the companies M and K in 2018–2020 is shown in Figure 6.
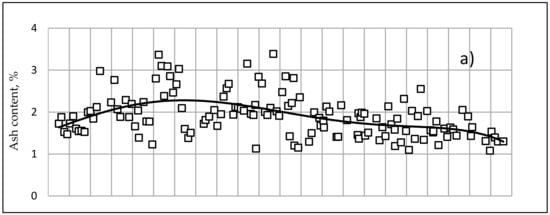
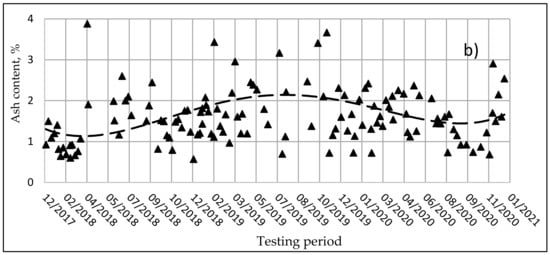
Figure 6.
Daily average of ash content values and trendlines curves: (a) company M; (b) company K.
The distribution of ash content of wood chips according to the established classes showed that up to 90% of the ashes in the analyzed samples fell in the range of biofuel ash classes from A0.7 to A3.0. The calculated relative expanded uncertainty of the ash value measurement was ±1.0%.
3.4. Biomass Fuel Prices
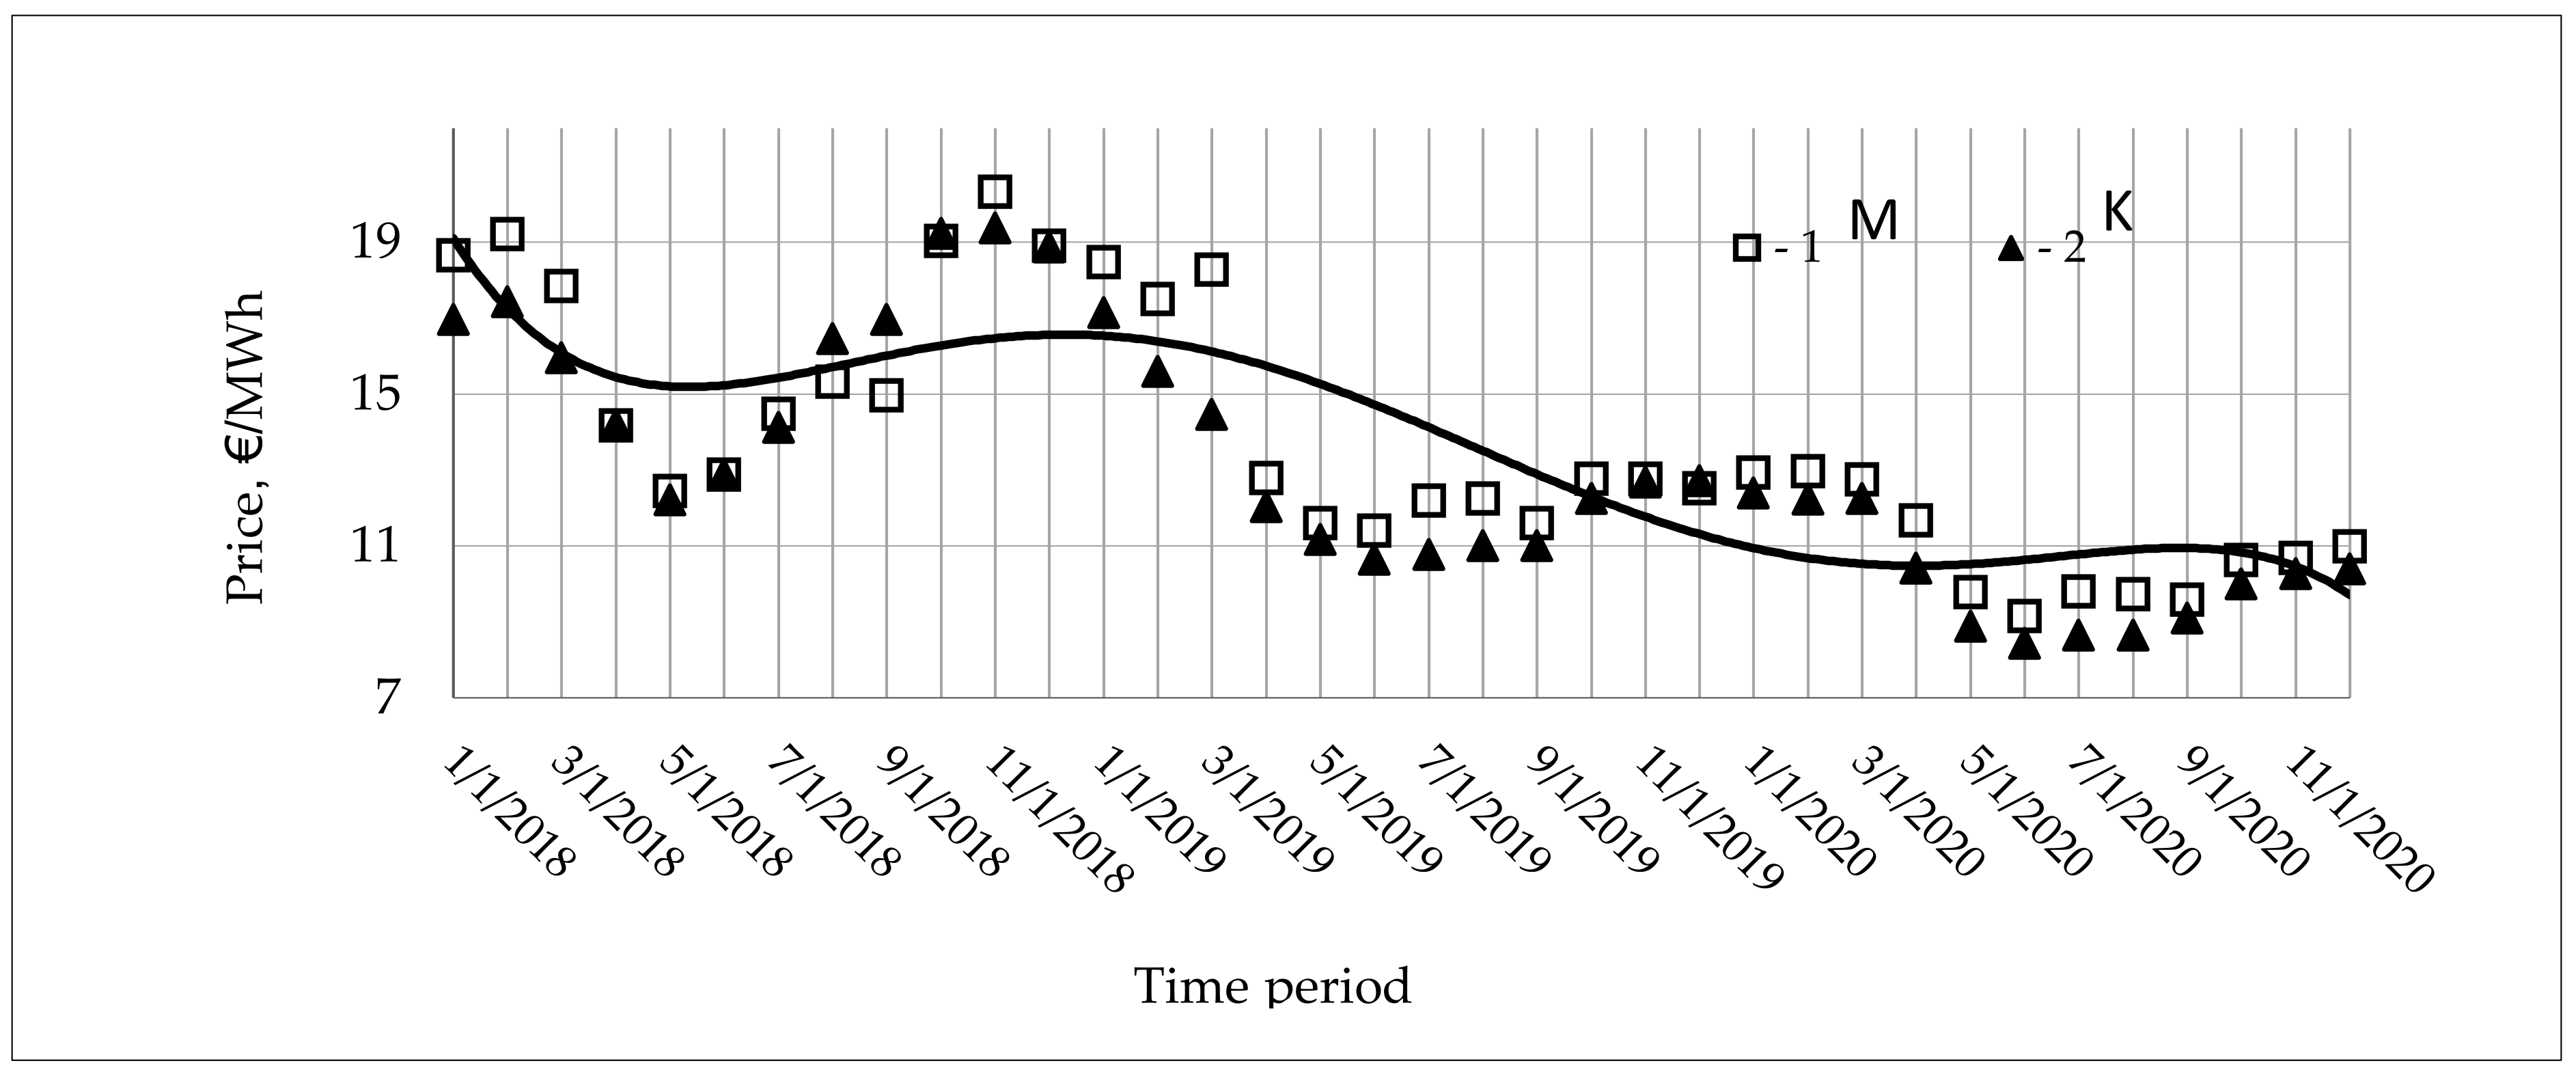
Prices of wood chips purchased at biofuel exchange auctions in regional counties, where companies M and K were located during the period 2018–2020, are presented in Figure 7.

Figure 7.
Changes of chip fuel prices at biofuel exchange during period 2018–2020 in counties, where companies M and K are located.
Auction prices showed both seasonal and slight geographical differences. The geographical differences were reflected via the prices of chips sold through the biofuel exchange and did not exceed 10%. Total tendency showed that this was related to delivery distance, not quality. Seasonal differences did not so much reflect fuel quality as seasonal fluctuations in demand and supply as prices fell during the summer when fuel consumption fell to baseline needs. During the heating season, when demand increased, biofuel prices also rose. On the other hand, prices continued to rise depending on climatic conditions—during warmer winters, the prices were lower than in cold winters.
These data also show that chip fuel prices have fallen significantly in the recent couple of years due to low-cost imported fuels. However, in terms of the prospects, the rise in the price of biomass is expected due to several reasons: the increasingly strong competition with the growing furniture and pulp industries for high-quality chips with lower moisture content, as those industries have been expanding rapidly in Lithuania over the past few years; competition due to growing demand for biomass fuel on national as well as international biomass markets.
3.5. Discussion
The presented results show that the wood chips supplied to boilers with an average capacity of up to 10 MW operating in DH systems are of relatively high and stable quality. The moisture content of such fuels changes regularly depending on seasonal climate changes and affects the calorific value of the fuel accordingly. Such impact was also observed in the study [16].
In our case, the high calorific value and low ash content of the chips were due to the fact that amounts of impurities, in the form of small particles with diameter lower than 3.15 mm, did not exceed 10% [21], and the production—storage—use time of the raw material was relatively short, usually not exceeding one year. This prevents the raw material from biodegrading. Such chips, the moisture of which can change in the prescribed pattern over the year, are the most suitable for medium-capacity boilers with furnaces adapted to wet fuels.
When wood chips with low impurities are used as fuel, their calorific value and ash content depend little on the type of wood used to produce chips in central and northern Europe [8,16,20]. However, as the practice of chip preparation in Latvia [6] showed, when storing green cutting waste in piles from half a month to 4 years and producing chips in February–May 2012, their relative moisture, calorific value, and ash content varied within the respective range (20.6–73.1)%, (15.7–19.7) MJ/kg, and (1.5–23.3)%. It is a consequence of the long storage of the raw material in piles under field conditions that determines the wider limits of variation in ash content and moisture content of the raw material.
Decreasing wood chip quality is observed in the results of our study, as high-quality local raw material resources are declining not only due to the growing needs for heating but also due to the increased use of wood for other purposes. This suggests that further intense rates of wood chip use could inevitably lead to serious violations of the sustainable use of renewable fuels based mainly on wood. Therefore, increased attention needs to be paid to the improvement of technologies for the preparation and incineration of wood waste and mixtures with other types of biofuels, as well as separate agro-wastes.
Nearly 80% of heat was produced from wood chips in 2019 in Lithuania. Transformation of bio-wastes into green municipal energy helps to make progress towards introducing circular and sistainable economies [25]. Alhough Lithuania is still considered an "in-between“ EU country according to the socio-economic indicator for the bioeconomy [26], improvement of waste management, together with renewable energy management at the regional or municipal levels, paves the way to the increase of implementation of sustainable processes based on resource circularity.
4. Conclusions
A large amount of data for a period of 3 years from 2018 to 2020 on wood chips, supplied to the two district heating companies in Lithuania, and their parameters, such as moisture, ash content, and the calorific value, were analyzed to assess the dispersion and dependence of these parameters on seasonality and geographical factors.
It was determined that the change of total wood chips moisture was fully consistent with annual seasonal changes in regional climate indicators. In the cold season, the moisture content of wood chip felling residues was about (45 ± 5)% and reached its highest values from December to April, and in the warm season, it decreased to (30 ± 5)%, reaching the minimum values in the period from May to September.
It was also determined that the mean lower calorific value of the wood chips was quite stable over the whole 3-year (2018–2020) period and reached (18.85 ± 0.35) MJ/kg.
The ash content values ranged from 0.5 to 4.0%. These parameters indicated that the wood chips used were still relatively clean, with a small content of small particles that did not exceed 10% of the total weight. Geographic locations did not show tangible differences between these parameters.
Despite the use of express methods, the relative expanded uncertainties of moisture content, lower calorific value, and ash content determination were ±2.1%, ±1.5%, and ±1.0%, respectively.
Such parameters indicated that the wood chips used were still relatively clean, with a small content of small particles that did not exceed 10% of the total weight. This was ensured by the requirements of Baltpool to provide fuel of a quality that would guarantee efficient combustion and would not adversely affect the equipment. At this stage, it could be argued that the principles of sustainability were sought to be maintained. However, it cannot be guaranteed that this will be the case in the future if chips are used for heating at such a rate. Unless the incineration of household waste occurs in modern power plants, the insulation of buildings and various energy saving measures can all make a significant contribution to reducing the incineration of wood chips and maintaining sustainability.
Current rather stable and low chip prices lead to lower heating prices for consumers, while their seasonal and geographic variations depend more on demand/supply and the distance of delivery. However, the rise in the price of biomass is expected due to the growing strong competition with the furniture and pulp industries, growing biomass fuel national and international demand, as well as changing EU policy on the role of biomass and supply-chain emissions, which include increasing atmospheric CO2 and the rated pace of global warming.
Author Contributions
Conceptualization, N.P., methodology, N.P. and M.P., investigation, M.P. and E.F.D., resources, M.P., data curation, J.P., writing—original draft preparation—N.P., M.P. J.P. and E.F.D., writing, review and editing, N.P., M.P., J.P. and E.F.D., visualization, J.P., supervision, N.P. All authors have read and agreed to the published version of the manuscript.
Funding
This research received no external funding.
Data Availability Statement
Data available on request due to privacy restrictions.
Conflicts of Interest
The authors declare no conflict of interest.
References
- Nurmi, J. Measurement and evaluation of wood fuel. Biomass Bioenergy 1992, 2, 157–171. [Google Scholar] [CrossRef]
- McKendry, P. Energy production from biomass (part 1): Overview of biomass. Bioresour. Technol. 2002, 83, 37–46. [Google Scholar] [CrossRef]
- Alakangas, E. Analysis of Particle Size of Wood Chips and Hog Fuel—ISO/TC 238. Research Report. VTT-R-02834-12. VTT: Jyväskylä, Finland, 2012. Available online: https://www.vttresearch.com/sites/default/files/julkaisut/muut/2012/VTT-R-02834-12.pdf (accessed on 14 January 2021).
- Alakangas, E.; Hurskainen, M.; Laatikainen-Luntama, J.; Korhonen, J. Properties of Indigenous Fuels in Finland; VTT Technology 272; VTT: Jyväskylä, Finland, 2016; 251p. [Google Scholar]
- Praspaliauskas, M.; Pedišius, N.; Čepauskienė, D.; Valantinavičius, M. Study of chemical composition of agricultural residues from various agro-mass types. Biomass Convers. Biorefin. 2020, 10, 937–948. [Google Scholar] [CrossRef]
- Gruduls, K.; Bārdule, A.; Zālītis, T.; Lazdiņš, A. Characteristics of wood chips from logging residues and quality influencing factors. Res. Rural Dev. 2013, 2, 49–54. [Google Scholar]
- Barrette, J.; Pothier, D.; Duchesne, I. Lumber and wood chips properties of dead and sound black spruce trees grown in the boreal forest of Canada. Forestry 2015, 88, 108–120. [Google Scholar] [CrossRef] [Green Version]
- Moskalik, T.; Gendek, A. Production of Chips from Logging Residues and Their Quality for Energy: A Review of European Literature. Forests 2019, 10, 262. [Google Scholar] [CrossRef] [Green Version]
- Jirjis, R. Storage and drying of wood fuel. Biomass Bioenergy 1995, 9, 181–190. [Google Scholar] [CrossRef]
- Gejdoš, M.; Lieskovský, M.; Slančík, M.; Němec, M.; Danihelová, Z. Storage and Fuel Quality of Coniferous Wood Chips. BioResources 2015, 10, 5544–5553. [Google Scholar] [CrossRef] [Green Version]
- Pari, L.; Scarfone, A.; Santangelo, E.; Gallucci, F.; Spinelli, R.; Jirjis, R.; Del Giudice, A.; Barontini, M. Long term storage of poplar chips in Mediterranean environment. Biomass Bioenergy 2017, 107, 1–7. [Google Scholar] [CrossRef]
- Manzone, M. Energy and moisture losses during poplar and black locust logwood storage. Fuel Process. Technol. 2015, 138, 194–201. [Google Scholar] [CrossRef] [Green Version]
- Nurmi, J. The storage of logging residue for fuel. Biomass Bioenergy 1999, 17, 41–47. [Google Scholar] [CrossRef]
- Hofmann, N.; Mendel, T.; Schulmeyer, F.; Kuptz, D.; Borchert, H.; Hartmann, H. Drying effects and dry matter losses during seasonal storage of spruce wood chips under practical conditions. Biomass Bioenergy 2018, 111, 196–205. [Google Scholar] [CrossRef]
- Van der Merwe, J.P.; Ackerman, P.; Pulkki, R.; Längin, D. The Impact of Log Moisture Content on Chip Size Distribution When Processing Eucalyptus Pulpwood. Croat. J. For. Eng. 2016, 37, 297–307. [Google Scholar]
- Lieskovsky, M.; Jankovsky, M.; Trenčiansky, M.; Merganič, M.; Dvořák, J. Ash Content vs. the Economics of Using Wood Chips for Energy: Model Based on Data from Central Europe. BioResources 2017, 12, 1579–1592. [Google Scholar] [CrossRef]
- Huber, C.; Kroisleitner, H.; Stampfer, K. Performance of a Mobile Star Screen to Improve Woodchip Quality of Forest Residues. Forests 2017, 8, 171. [Google Scholar] [CrossRef] [Green Version]
- Nurek, T.; Gendek, A.; Roman, K. Forest Residues as a Renewable Source of Energy: Elemental Composition and Physical Properties. BioResources 2019, 14, 6–20. [Google Scholar] [CrossRef]
- Rackl, M.; Günthner, W.A. Experimental investigation on the influence of different grades of wood chips on screw feeding performance. Biomass Bioenergy 2016, 88, 106–115. [Google Scholar] [CrossRef] [Green Version]
- Aniszewska, M.; Gendek, A. Comparison of heat of combustion and calorific value of the cones and wood of selected forest trees species. For. Res. Pap. 2014, 75, 231–236. [Google Scholar] [CrossRef] [Green Version]
- Baltpool (Biomass Exchange). 2017. Available online: https://www.baltpool.eu/dl/~wp-content~uploads~2017~10~Tyrimai_EN_2017-09-25.pdf/Comparative-research-of-biomass-chips-samples-2017-09-25 (accessed on 14 January 2021).
- Spirchez, C.; Lunguleasa, A.; Pruna, M.; Gaceu, L.; Forfota, R.; Dumitrache, I. Research on the Calorific Value of the Hardwood Species. Bull. Eng. 2019, 12, 111–114. [Google Scholar]
- Kofman, P.D. Wood Ash. Processing/Products No. 43. 2016. © COFORD. 2016. Available online: http://www.coford.ie/media/coford/content/publications/projectreports/cofordconnects/cofordconnectsnotes/00675CCNPP43Revised091216.pdf (accessed on 14 January 2021).
- Allen, J.; Browne, M. Logistics management and costs of biomass fuel supply Costs of biomass fuel supply. Int. J. Phys. Distrib. Logist. Manag. 1998, 28, 463–477. [Google Scholar] [CrossRef]
- D’Adamo, I.; Falcone, P.M.; Huisingh, D.; Morone, P. A circular economy model based on biomethane: What are the opportunities for the municipality of Rome and beyond? Renew. Energy 2021, 163, 1660–1672. [Google Scholar] [CrossRef]
- D’Adamo, I.; Falcone, P.M.; Morone, P. A New Socio-economic Indicator to Measure the Performance of Bioeconomy Sectors in Europe. Ecol. Econ. 2020, 176, 106724. [Google Scholar] [CrossRef]
- Statistical How To. Pooled Standard Deviation. Available online: https://www.statisticshowto.com/pooled-standard-deviation (accessed on 14 January 2021).
- Beckert, S.F.; Domeneghetti, G.; Bond, D. Use of Pooled Standard Deviation of Paired Samples in Calculating the Measurement Uncertainty by the Monte Carlo Method. In Proceedings of the 16th International Congress of Metrology, Paris, France, 7–10 October 2013; p. 03003. [Google Scholar]


Publisher’s Note: MDPI stays neutral with regard to jurisdictional claims in published maps and institutional affiliations. |
© 2021 by the authors. Licensee MDPI, Basel, Switzerland. This article is an open access article distributed under the terms and conditions of the Creative Commons Attribution (CC BY) license (https://creativecommons.org/licenses/by/4.0/).