1. Introduction
Industrial activities, electricity production, or dedicated use of mercury (e.g., gold mining) lead to anthropogenic Hg emissions into the atmosphere [
1,
2,
3,
4]. The problem of mercury emission from the power generation sector is crucial for countries that rely on coal such as China or Poland. In 2017, the share of coal in the Polish energy mix accounted for 78.1% [
5], while the Hg content in Polish bituminous coal varies from 25 to 300 μg·kg
−1, and in lignite from 100 to 450 μg·kg
−1 [
6]. Therefore, the dominant source of mercury emissions to the air in Poland is the combustion processes in the energy production sector, emitting, e.g., over 6 Mg Hg in 2017, which is around 54% of the whole mercury emissions in the country [
7]. The combustion of solid fuels is also a major source of anthropogenic mercury emissions throughout the European Union (EU), where it is responsible for more than 51% of emissions [
8].
In 2017, new best available technique (BAT) conclusions were prepared for large combustion plants (LCPs). To prevent or reduce mercury emissions into the atmosphere from coal combustion, BAT recommends special methods [
9]. If the mercury content in the flue gas is low or the composition of the flue gas is favourable, it can be removed in air pollution control devices (e.g., selective catalytic reduction (SCR)), these are so-called passive methods of removing mercury, and their effectiveness depends on the mercury speciation in the flue gas [
10]. In the situation with significant mercury content in the combusted coal and the insufficient effectiveness of passive methods of its removal, it is necessary to apply additional technologies, the so-called active methods [
11]. The BATs for the active removal of mercury from the flue gas include powdered activated carbon (PAC) injection [
12,
13]. The purpose of injecting sorbent is to promote the adsorption and oxidation of elementary mercury Hg
(0), which increases the share of Hg
2+ and Hg
(p) in the flue gas. Furthermore, PAC particles containing adsorbed Hg can be more easily removed in, e.g., electrostatic precipitator (ESP) or fabric filters (FF) [
14].
However, PACs are expensive, which is a significant barrier preventing their increased use in industry. Research has been conducted in recent years on their production from low-cost raw materials including waste biomass [
15] or industrial waste [
16,
17]. One of the ways of overcoming the price barrier of industrial application of sorbents is to use relatively cheap materials with good sorption properties designed for single use without the need for regeneration [
18,
19,
20]. Such a material may be coke dust, especially the one from dust extraction operations of coke dry quenching installations. This dust is characterised by a relatively high share of mesopores, which play a decisive role in the adsorption of organic compounds with large molecules or heavy metals such as mercury or cadmium [
13].
In addition, the literature describes the so-called activated carbon paradox, which refers to the usage of activated carbon in environmental protection, in spite of the fact that the process of its production and subsequent regeneration or disposal contributes to pollution [
21]. During the production of activated carbons, a gas called pyrolytic gas, similar in composition to coke oven gas, is emitted into the atmosphere. It contains undesirable gases from the point of view of the greenhouse—carbon dioxide and methane. Moreover, in Poland, coal for PAC production is extracted from mines where the exploitation of hard coal deposits is connected with the occurrence of natural hazards—methane. These mines belong to the so-called methane mines. This gas is characterised by a high GWP index, according to the latest GHG Protocol report, it equals 28 [
22].
Therefore, during the development of technological processes, in addition to technical and economic considerations, environmental aspects should also be taken into account. In recent years, so-called environmental footprints have been used for environmental impact assessment and are a quantitative measure of the use of the environment in various aspects. Carbon footprint (CF) analysis [
23] is a method for assessing the environmental impact of a technology (process) or product on global warming [
24]. CF is a measure of total greenhouse gas (GHG) emissions, both direct and indirect, throughout the life cycle of a product or technology.
This publication presents a CF analysis of the process of mercury removal from flue gases by injection of organic sorbents, namely, (i) powdered activated carbon (PAC) and (ii) coke dust (CD), which is a by-product of the coking process and is a potential cheaper substitute for PAC. In both cases, the following life cycle of the sorbent is considered: (i) extraction of bituminous coal as a raw material for the production of sorbents, (ii) transport to the production plants, (iii) production of PAC, (iv) acquisition of CD during the coking process, (v) transport of finished sorbents to a power plant emitting Hg, and (vi) injection of the sorbent into the flue gas and its separation in ESP. The final CF was determined for the amount of sorbent needed to remove 1 kg of mercury from the flue gas under the conditions of a lignite-fired power plant. The analysis was based on actual data of the units operating in Poland.
2. Materials and Methods
The CF analysis of mercury removal from the flue gas by injecting organic sorbents was performed according to the guidelines from Publicly Available Specification (PAS) 2050 [
25,
26] and ISO 14067 [
23].
2.1. Goal and Scope
The main objective of the analysis was to quantify the CF of carbon sorbents used for removing mercury from flue gases generated during the combustion of lignite in a power plant. Two organic sorbents were analysed: (i) commercial PAC produced in Poland and (ii) CD. The CF analysis included direct and indirect GHG emissions related to the demand for various forms of energy and the consumption of materials during coal mining; transport of coal from the mine to the production plants; preparation of raw material for technological processes; degasification and thermal activation process (for PAC) and acquisition of CD during the coking process; transport of sorbents to the power plant and their injection into flue gases.
2.2. Functional Unit
In this CF analysis, the functional unit is defined as the mass of sorbent (PAC or CD) necessary to remove 1 kg of mercury from the power plant’s flue gas. For the purpose of CF analysis, the masses of sorbents required for the process were calculated on the basis of laboratory tests and industrial injections of sorbents into the flue gas [
3]. Using the balance data of the plants, supporting functional units were established, namely, (i) 1 Mg of coal mined and transported, (ii) 1 Mg of PAC produced (yield 2.8 Mg of coal/1 Mg PAC), and (iii) 1 Mg of CD separated (yield 1.3 Mg of coal/Mg of coke).
2.3. System Boundary
The CF analysis included (i) bituminous coal mining; (ii) rail transport of coal from the mine to the sorbents plant (PAC) and coking plant (CD); (iii) preparation of raw material for technological processes; (iv) carbonisation and thermal activation process (PAC); (v) processes taking place on the coking plant (CD); (vi) transport of sorbents (PAC and CD) to the power plant; (vii) injections of sorbents into flue gases. The analysis used reliable actual balance data obtained from operating installations.
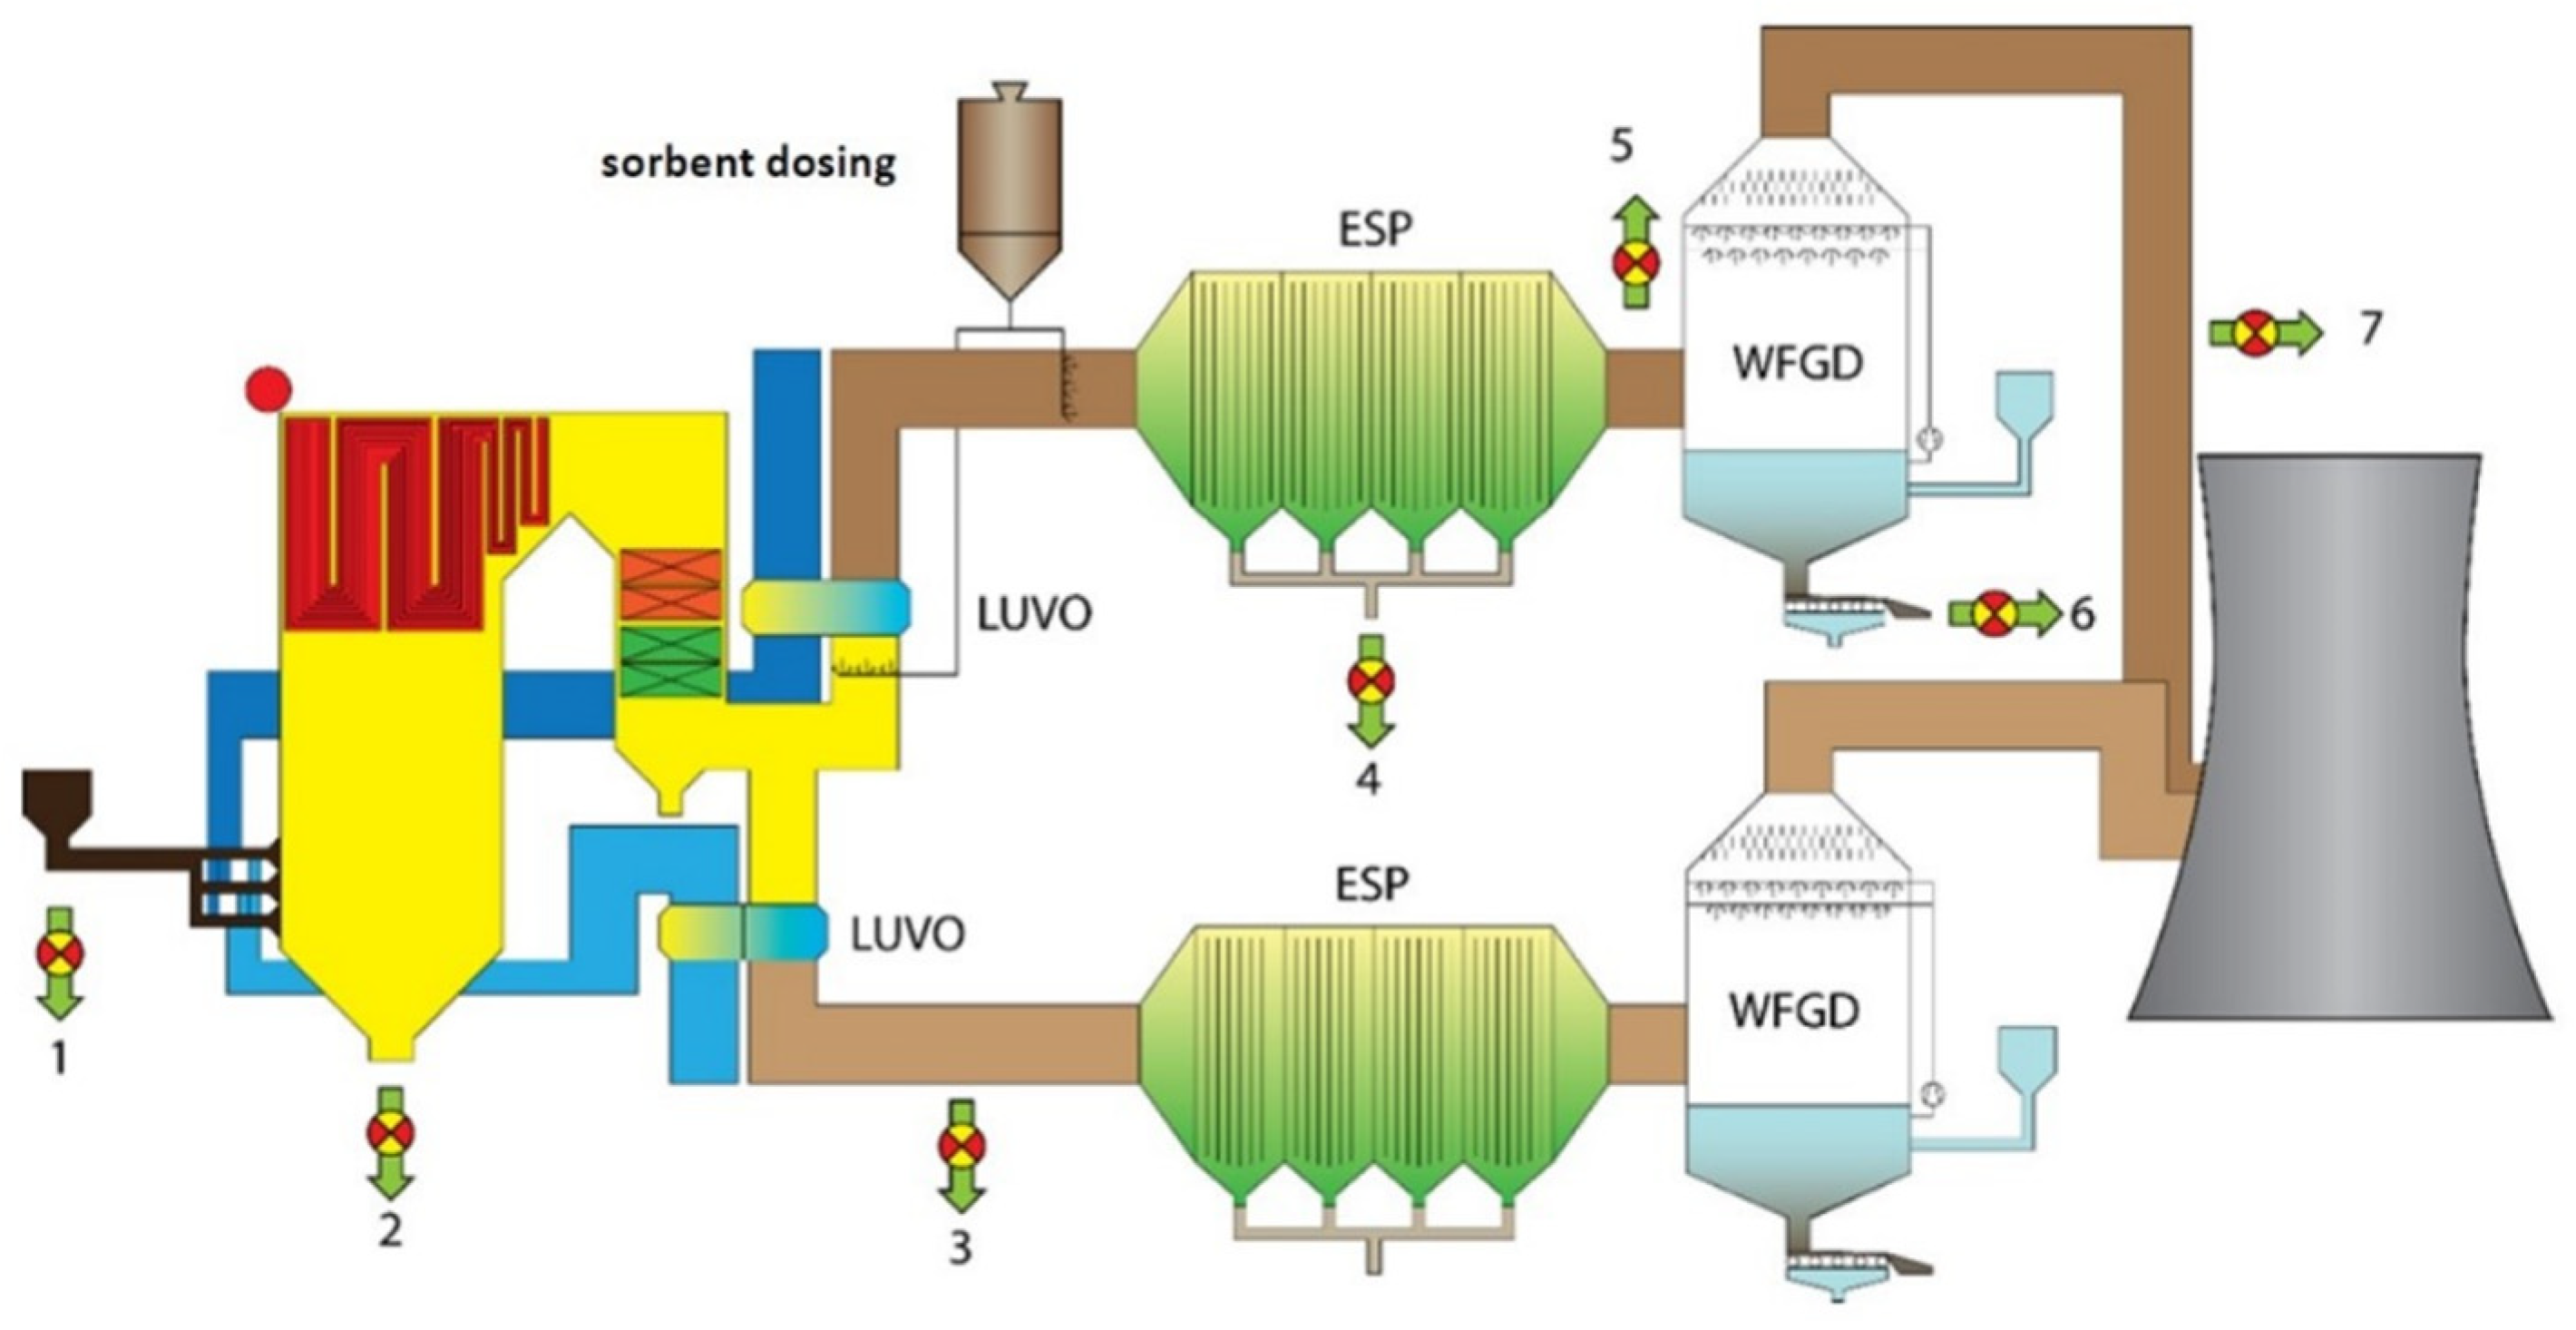
Figure 1 shows the CF system limits for both sorbents.
2.4. Data Analysis
2.4.1. Coal Mining
Table S1 (see
Table S1 in the Supplementary Materials) shows the quantities and structure of the coal mine’s electricity and heat consumption, as well as emission factors accompanying the combined heat and power (CHP) operation. Based on the obtained data, average energy consumption rates per 1 Mg of coal produced were as follows: EC = 68.015 kWh·Mg
−1, HC = 43.986 MJ·Mg
−1. Electricity coming from the Polish power grid entails emissions of 0.912 kg CO
2·kWh
−1 [
27]. On the basis of the CHP data, the production of 1 GJ of thermal energy under mining conditions in the process of methane combustion results in emissions of 63.460 kg CO
2.
The coal mine under consideration is rich in coal-mine methane (CMM), which is collected (10.653 m3·Mg−1 of coal) and burned in CHP’s own plant. The products of the CHP plant are electricity (28.431 kWh·Mg−1 coal) and heat (0.070 GJ·Mg−1 coal). These media are used fully by the mines, which reduces the amount of energy purchased from the external market. The remaining methane is emitted into the atmosphere, with ventilation air in the amount of 16.663 m3·Mg−1 of coal. The concentration of methane in the ventilation air is less than 0.5% by volume.
The mine uses 31.968 kWh·Mg−1 of electricity and −0.044 GJ·Mg−1 of heat for the extraction of 1 Mg of coal. The negative value of the heat consumption indicator means that the amount of heat produced by the CHP plant is greater than the needs of the mine. Therefore, the CO2 emissions corresponding to the production of this amount of heat were subtracted from the emissions associated with hard coal mining (the so-called avoided emissions).
2.4.2. Transport of Coal to Processing Plants and Finished Sorbents to Power Plants
On the basis of data from the Report of PKP, it was assumed that the value of the unitary index of electricity consumption for rail transport of 1 Mg of coal at a distance of 1 km is 0.079 kWh·Mg
−1∙km
−1 [
28]. Based on this index and taking into account the emissions from the production of 1 kWh under Polish conditions (0.912 kg CO
2·kWh
−1) [
27], it is possible to calculate the specific CO
2 emission index related to coal transport. According to the carrier’s data, the distances between the PAC production plant and the coking plant, and the coal mine are about 500 and 100 km, respectively. The distances between the PAC production plant and the coking plant, and the power plant are 390 and 139 km, respectively.
2.4.3. Powdered Activated Carbon (PAC)—Production
Bituminous coal for the production of PAC was subjected to a carbonisation process; then, the semi-finished product was subjected to thermal activation in order to obtain the desired porous structure and sorption properties. For the CF analysis, the configuration of the existing PAC generation system in Poland was adopted. It includes (i) preparation of the raw material (crushing, grinding, mixing), (ii) carbonisation of the raw material, (iii) thermal activation of the char with steam at a temperature of 800–1000 °C, and (iv) packaging of the produced PAC. For the considered technological configuration of PAC production,
Table S2 presents the data obtained on electricity consumption at each stage of sorbent production (see
Table S2 in the Supplementary Materials). There are direct emissions at the PAC production plant, which are the pyrolytic gas emitted into the atmosphere with the composition given in
Table S3 (see
Table S3 in the Supplementary Materials). Approximately 25% of the pyrolysis gas produced PAC plant is used for its own energy needs.
2.4.4. Coke Dust (CD)—Production
CD is one of the by-products of the blast furnace coke production process. Coke production consists of high-temperature pyrolysis of properly composed coal mixtures. For the purpose of the analysis, the variant with dry quenching was adopted. In this process, coke dust is separated in dust extraction operations located within the coke oven batteries (pushing coke out of the oven), coke dry quenching installations (dust extraction of coke loading and unloading to/from the dry cooling chamber, dust extraction of circulating gas in the inertia dust collector, boiler and cyclones), and coke transport routes and sorting plants. The plant’s balance sheet data shows that the share of CDs in total coke production ranges from 2.2 to 2.6%. A value of 18.6 kg CD per 1 Mg of wet coal stock was assumed for analysis.
In the process of coking the coal mixture, raw coke oven gas is produced alongside coke. By cooling and purifying this gas, certain products are separated from the compound mixture, namely, coal tar, benzol, sulphur produced in the Claus sulphur recovery plant, purified coke oven gas, and process waters. The coking plant’s indirect emissions related to the consumption of energy media for all these processes were calculated on the basis of unit electricity demand indicators (68.000 kWh·Mg
−1 coal) and heat (1.487 GJ·Mg
−1 coal). Part of the electricity and heat is generated in a local CHP plant, which is powered by 50% of the purified coke oven gas. The remaining 50% of the coke oven gas is directed to the heating of the coking battery. Part of the heat (in the form of steam at a temperature of 440 °C and pressure of 4.2 MPa) is collected in a recovery boiler using the physical enthalpy of the circulating gas of the dry coke cooling system. Values of energy media production indexes in relation to the unit mass of coked coal and coke produced are presented in
Table S4 (see
Table S4 in the Supplementary Material). Combustion of purified gas in the heating channels of the coke oven battery and the local CHP plant are a source of direct CO
2 emissions into the atmosphere. Assuming total and complete combustion, this process generates 1.49 kg CO
2·kg
−1 of gas.
2.4.5. Characteristics of Organic Sorbents
The proximate analysis included the determination of moisture, ash, and volatile matter by a thermogravimetric method using Eltra’s TGA Thermostep analyser. The ultimate analysis included the determination of carbon, hydrogen, and total sulphur contents. Tests were carried out with the Eltra CHS-580 analyser in accordance with ISO 10694 standard [
29]. Porous texture parameters of the tested sorbents were determined using AUTOSORB-1-C (Quantachrome Instruments, USA). The interpretation of the measurement results was carried out in accordance with the recommendations of the following publications [
30,
31,
32,
33]. The characteristics of the sorbents considered in this CF analysis are summarised in
Table S5 (see
Table S5 in the Supplementary Materials).
2.4.6. Removing Mercury from Power Plant Flue Gases
The power plant considered in the CF study generates electricity by burning lignite. A total of 29 representative samples of coal used in the unit under consideration were obtained and examined. Mercury balance sheets were prepared for the power plant. The average mercury content of lignite samples was 197 μg Hg·kg
−1. The coal samples contained on average 40 ppm of chlorine and 4 ppm of bromine. The Cl/Hg ratio was about 10. The mercury concentration in the flue gas treated in the ESP and WFGD system was 28.0 µg Hg·m
−3. Mercury emission factors for installations was 6.09 g Hg·TJ
−1 [
13].
During industrial tests carried out at the power plant (
Figure 2), sorbents were injected to remove mercury from the flue gas, namely, (i) PAC and (ii) CD. The sorbents were injected into the flue gas through or downstream the air heater. Dosing efficiency was regulated from 150 to 700 kg·h
−1 with an accuracy of ±3%. Finally, on the basis of industrial research, the need for sorbents for the process was determined. To remove 1 kg of mercury from the flue gas with PAC and CD, it is necessary to use 14.925 and 33.594 Mg of sorbents, respectively.
The compressed air required for the correct operation of the sorbent unloading system came from the compressed air production system. The main component of the compressed air production system is a compressor with a capacity of 12.7 m3·min−1 at 7.5 bar. The compressed air production system includes a buffer air receiver, fittings, an adsorption dryer, filters, and an oil separator. The total energy requirement of the system for transporting and dosing sorbents for the exhaust system is 36.5 kWh·Mg−1.
3. Sensitivity Analysis
Analysis of data from the installations included in the system under consideration (
Figure 1) showed that during the production of PAC and CD required for the implementation of the sorption process, there were indirect emissions related to energy demand and direct emissions of methane and carbon dioxide. For sorbents production processes, the greatest energy demand was identified in two stages: coal mining and the carbonisation and activation process. During these stages, methane is also emitted, which can be used to produce electricity, thus reducing the direct and indirect emissions. In order to carry out the sensitivity analysis, alternative scenarios for the management of mining, coking, and pyrolytic gases that may have a real impact on the energy demand of the units were considered.
The following scenarios were considered for the coal mining stage:
- (i)
Capture an additional amount of methane in order to fully meet the mine’s energy needs;
- (ii)
Catalytic afterburning of non-captured methane.
During the coal activation process:
- (iii)
Hypothetically increasing the amount of pyrolysis gas burned for own consumption.
For the coking process, the current option is the most ecological and economical one.
Nevertheless, it was possible to consider the following situations:
- (iv)
The coking plant does not burn excess coke oven gas in a CHP plant;
- (v)
The coking plant burns the excess amount of it on a torch, which increases direct and indirect emissions into the atmosphere.
The sensitivity analysis of CF of the transport of raw material from the mine to the sorbent plants and further to the power plant is not justified. Currently, in Poland, coal and its products are transported exclusively by rail.
4. Results of CF Analysis of Organic Sorbent Production Stages
4.1. CF of Coal Mining
The CF of 1 Mg of coal extraction is 0.328 Mg of CO2-e, of which the largest share is contributed by direct emissions (0.294 Mg of CO2-e·Mg−1). These include 0.273 Mg of CO2-e from methane emissions with ventilation air and 0.022 Mg of CO2-e from the combustion of captured methane. The CF value associated with indirect emissions is 0.036 Mg CO2·Mg−1, and it derives from electricity. In turn, the heat and compressed air produced in the CHP plant allow the reduction in indirect emissions of 0.002 Mg CO2·Mg−1 of coal (−0.002 Mg CO2·Mg−1 of coal). By capturing 10,654 m3 of methane·Mg−1 of coal (39% of the total amount of methane) and burning it in a local CHP plant, it is possible to produce 28.432 kWh of electricity·Mg−1 of coal (representing 42% of the mine’s total electricity demand), 0.070 GJ of heat·Mg−1 of coal (representing 160% of the mine’s total heat demand) and 5.1 m3 of compressed air·Mg−1 of coal. This lowers indirect CO2-e emissions of 0.031 Mg·Mg−1 of coal associated with the purchase of energy media. If the mine had not captured and used this part of methane for energy purposes, the CF value for extraction of 1 Mg of coal would have been 0.441 Mg CO2-e, which would be over 34% increase. Taking into account the mass of coal required for the production of the sorbents (1.3 Mg coal·Mg−1 CD; 2.8 Mg coal·Mg−1 PAC) and the by the sorbents under consideration, CFs of the extraction stage are 13.720 Mg CO2·kg−1 Hg for PAC and 14.337 Mg CO2·kg−1 Hg for CD.
4.2. CFs of Coal Transport and of Produced Sorbents
The indirect CO
2 emission rate related to the consumption of electricity for the transport of raw materials by rail is 0.079 kg CO
2·Mg
–1·km
–1 under Polish conditions [
28]. They include the demand for coal for the production of sorbents and the efficiency of mercury removal; CF of the transport stage from the mine to the production facilities is, respectively, 1.351 Mg CO
2·kg
−1 Hg for PAC and 0.282 Mg CO
2·kg
−1 Hg for CD. The CF of the transport of sorbents to the power plant is 0.422 Mg CO
2·kg
−1 Hg for PAC and 0.338 Mg CO
2·kg
−1 Hg for CD.
4.3. CF of the Production of PAC
The total CF of the processes carried out at the PAC production plant is 73.556 Mg CO2-e·kg−1 Hg. The electricity consumption corresponds to an indirect emission of 41.115 Mg CO2·kg−1 Hg, which is about 46% of the total CF value. The amount of direct emissions (CH4 and CO2) is an equivalent of 32.440 Mg CO2-e·kg−1 Hg, which is 36% of the total CF value. There are no purification processes for the pyrolysis gas at the plant under analysis; only 25% of it is used for its own consumption, and the rest, i.e., about 75%, is directly emitted into the atmosphere, which ultimately affects the CF of the process.
4.4. CF of the Receive of CD
The CF value of the processes conducted at the coking plant facilities is 0.220 Mg CO2-e·Mg−1 coal. The largest share in the CF value, −79.0%, is for direct emissions related to the combustion of coke oven gas used to heat the coke oven battery (0.087 Mg CO2·Mg−1 coal) and in the CHP plant (0.087 Mg CO2·Mg−1 coal). The share of indirect emissions due to the need to purchase electricity for the processes carried out in the coking plant is 13.1% (0.028 Mg CO2-e·Mg−1 coal), and indirect emissions related to the purchase of lacking steam (heat) 7.9% (0.017 Mg CO2-e·Mg−1 coal). Combustion of coke-oven gas in the plant’s own CHP helps to avoid indirect emissions associated with the purchase of electricity and heat. The plant’s own electricity produced reduces CF by 0.033 Mg CO2-e·Mg−1 coal, and the heat produced at the CHP plant reduces CF by 0.076 Mg CO2-e·Mg−1 coal.
In the analysed coking process, CF = 0.220 Mg CO2-e·Mg−1 coal and its allocation between individual products of the process, i.e., coke, coal tar, benzol, sulphur, and post-process water was made in proportion to the yield of individual products. With this approach, the CF of the individual products per 1 Mgcoal is (i) 0.185 Mg CO2-e for coke, (ii) 0.009 Mg CO2-e for coal tar, (iii) 0.002 Mg CO2 for crude benzol, and (iv) 0.023 Mg CO2 for post-process water, which consists of the moisture contained in the coal sludge and decomposition (pyrogenetic) water produced during the process of coal pyrolysis. Taking into account the assumed functional unit, i.e., 1 kg of mercury removed from the flue gas, the CF of obtaining an adequate amount of CD is 8.374 Mg CO2-e·kg−1 Hg.
4.5. CF over the Entire Life Cycle
Based on the data obtained from the power plant regarding the process of injecting sorbents into the flue gas, the CFs were determined per 1 kg of mercury removed; they are 0.497 Mg CO2·kg−1 Hg for PAC and 1.118 Mg CO2·kg−1 Hg for CD.
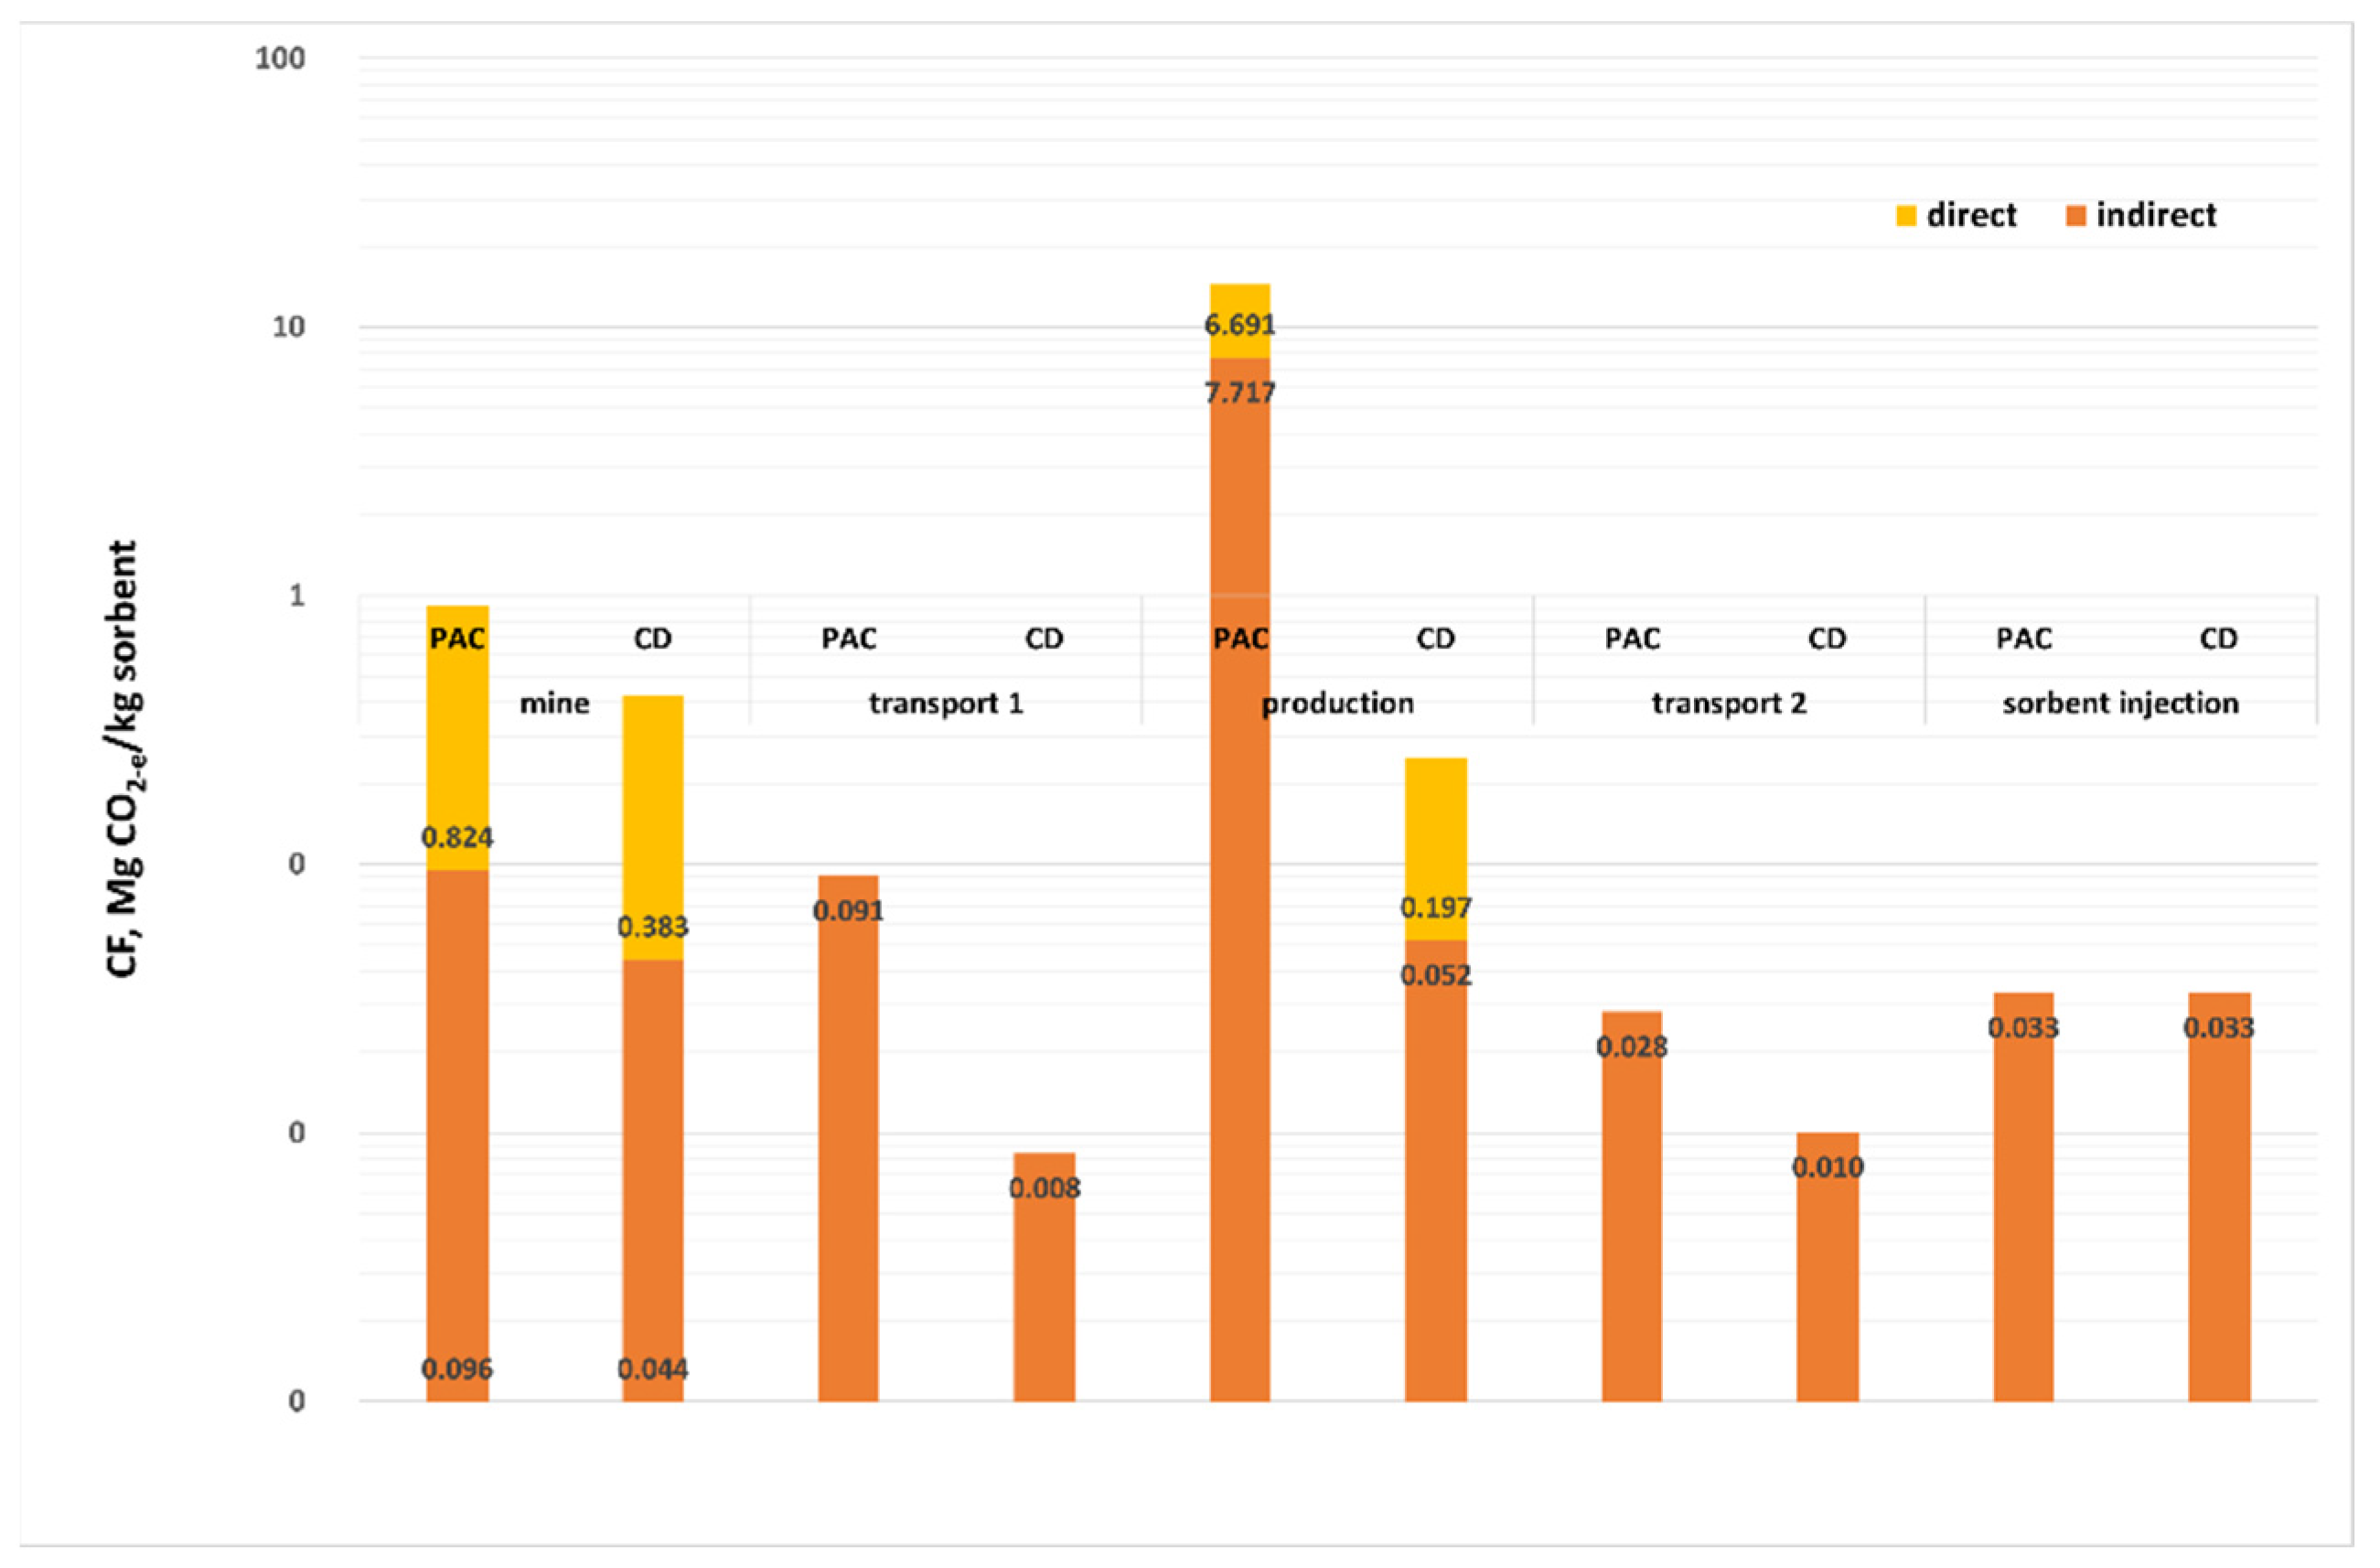
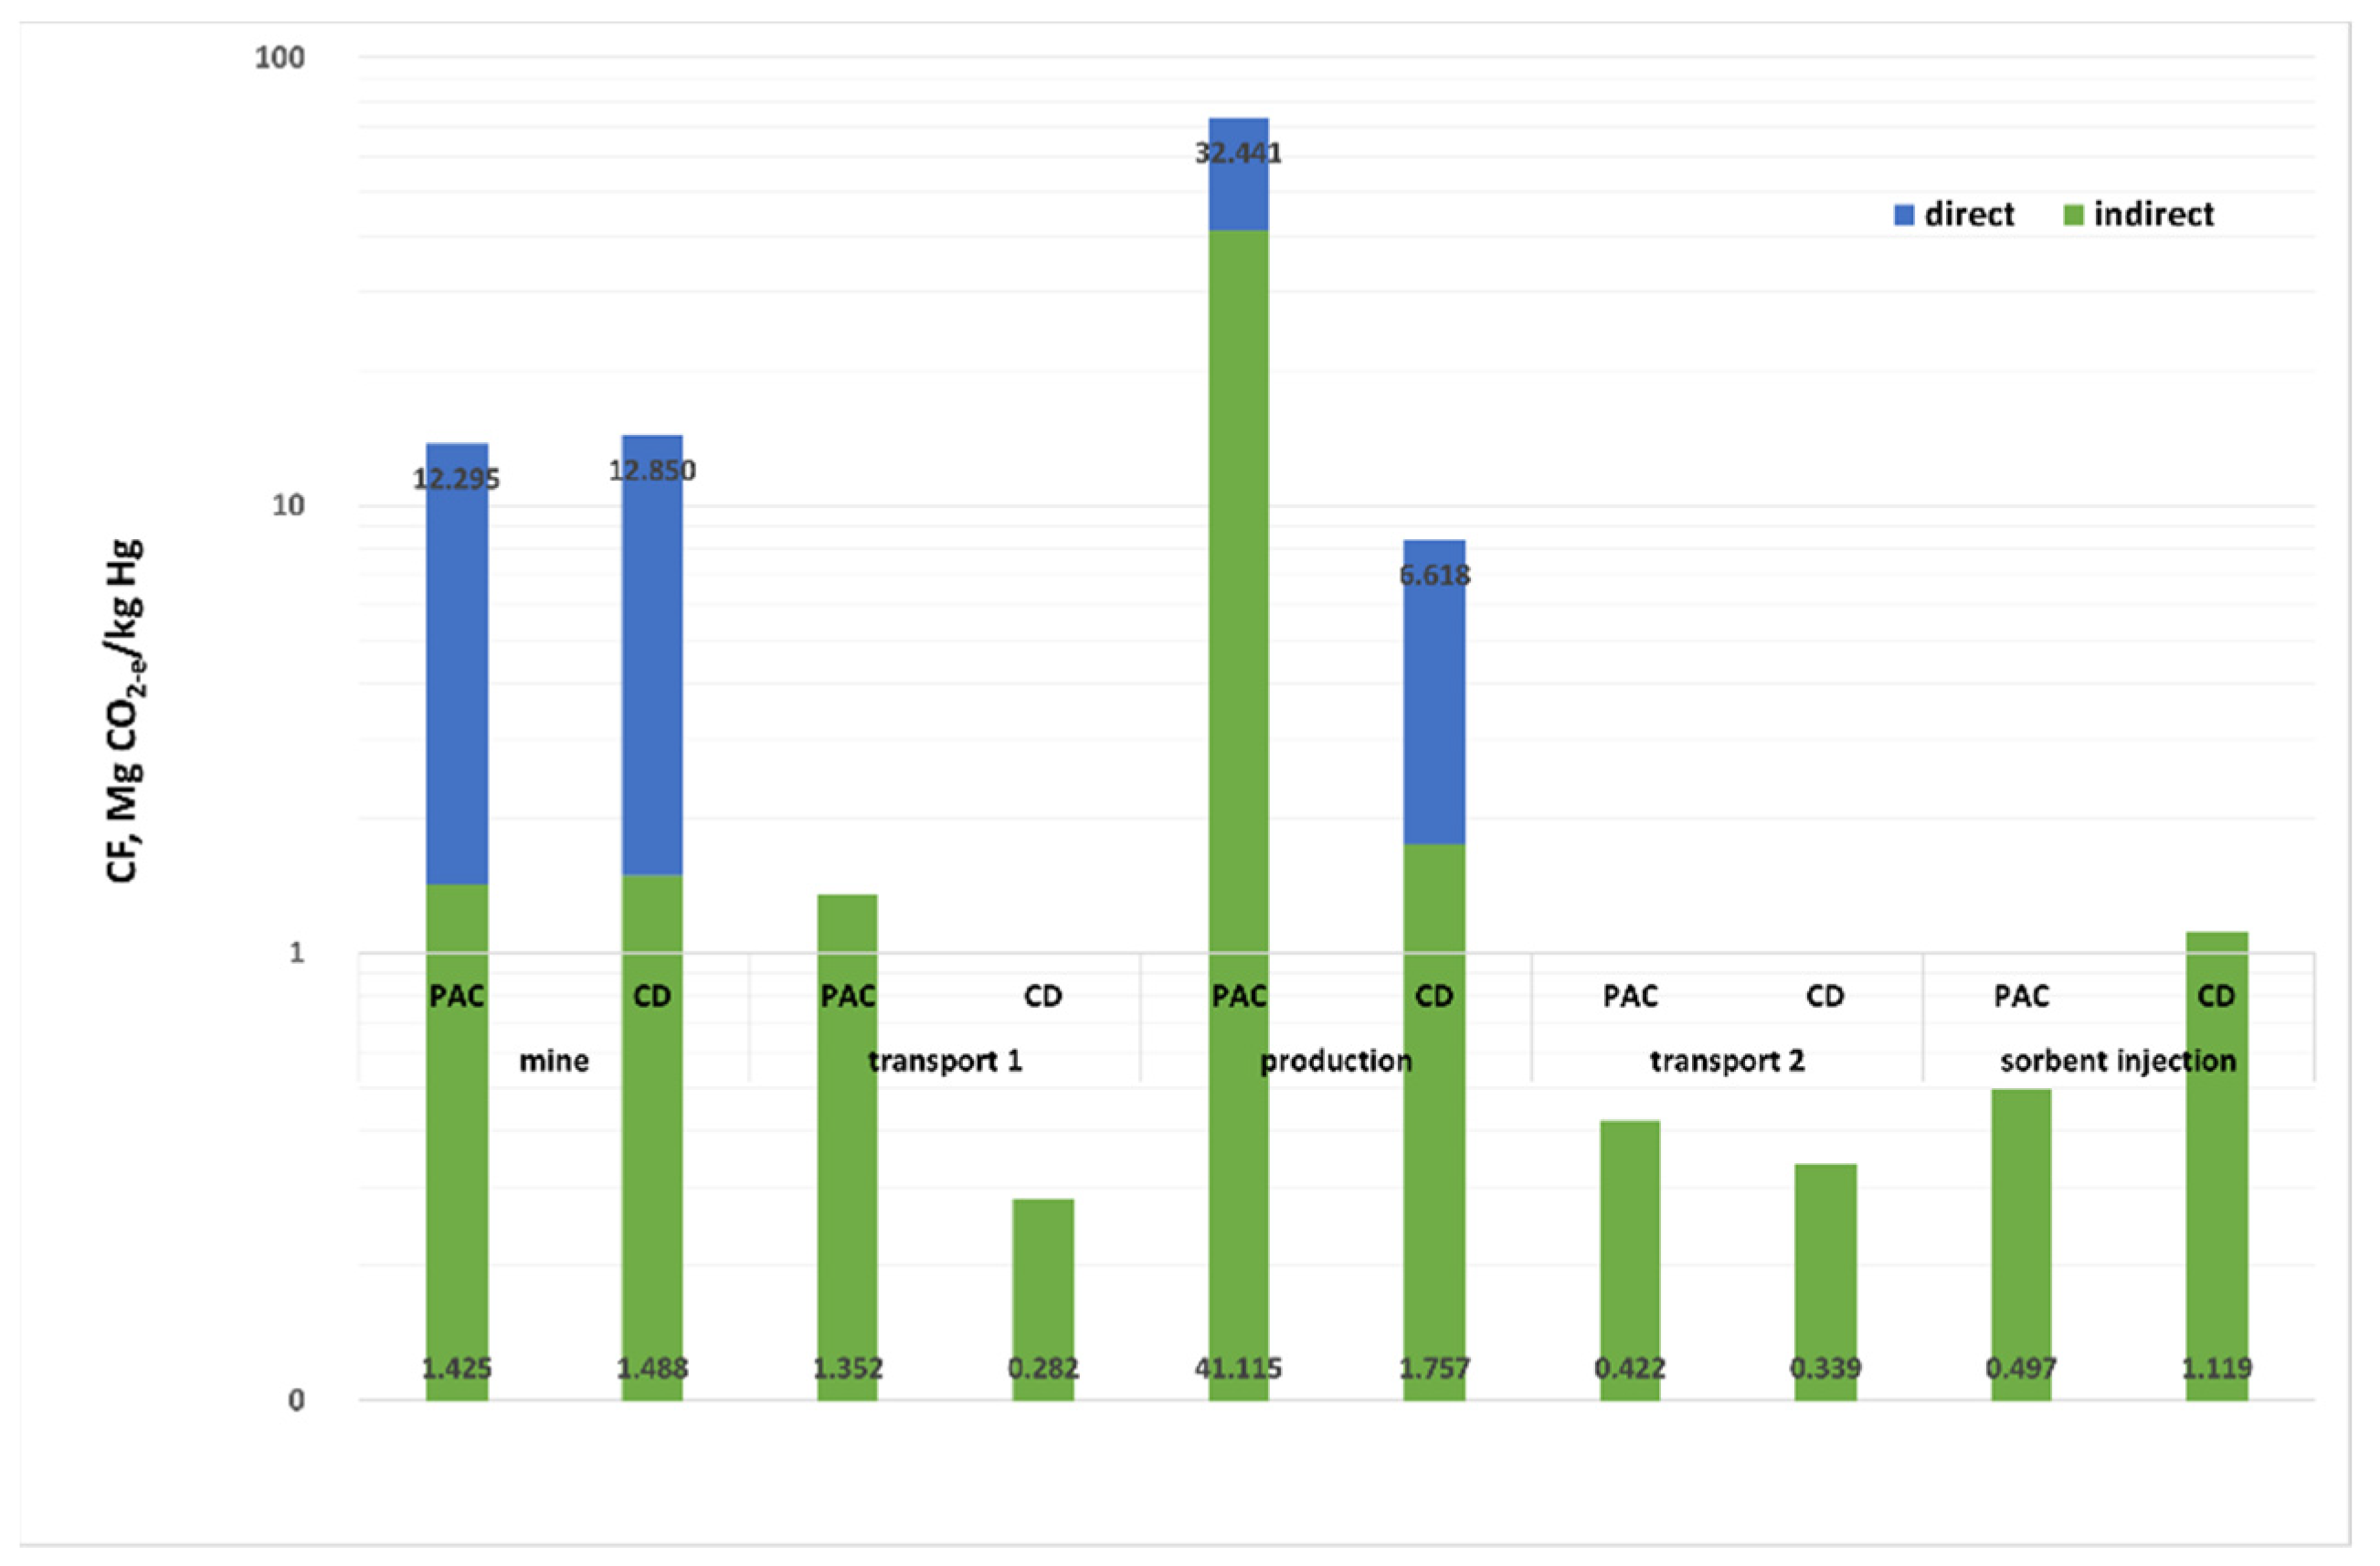
Figure 3 and
Figure 4 show the CF values in the life cycle analysis of the process under consideration, per unit mass of sorbent (
Figure 3), and per kg removed from the mercury exhaust (
Figure 4). The total value of CF is 5999.84 Mg CO
2-e for 1 kg PAC and 727.88 Mg CO
2-e for 1 kg CD. Such a large difference is generated at the sorbent production stage: 1 Mg PAC generates CF = 4928.38 Mg CO
2-e, and CD-e is about 20 times less than that (249 Mg CO
2-e). The remaining stages, such as coal extraction and its transport, transport of ready-made sorbents and their injection into the flue gas treated in the power plant generate comparable values of the CF for PAC and CD (
Figure 3). CF for PAC in 46% is generated at the sorbent production stage, while for CD its carbon footprint is only 35% in the coking plant, but coal mining has a 61% share. The high CF value for PAC production is mainly due to the use of electricity to heat the coal charge and the emission of the pyrolytic gas containing 28.26% methane and 8.17% carbon dioxide.
Converting the CF value per kg of Hg removed from the flue gas with PAC and CD results in about four times the CF value for PAC. These values are 89.548 Mg CO2-e for PAC and 24.452 Mg CO2-e for CD.
5. Results of the Sensitivity Analysis
5.1. Coal Mining
(i) Coal-mine methane-electricity (CMM-E) variant: the first potential opportunity to reduce the CF of coal mining is to capture additional methane in order to fully cover the mine’s electricity needs. Capturing an additional 14.8324 m3 of CH4·Mg−1 of coal will be sufficient to meet the demands of coal mines without the need for external energy purchases and reduce the CF of the mining stage for both sorbents to (i) 4.467 Mg CO2·kg−1 Hg (by 67%) for PAC and (i’) 4.669 Mg CO2·kg−1 Hg (by 67%) for CD.
(ii) Coal-mine methane-catalytic combustion (CMM-CC) variant: another technically easier option may be the catalytic post-combustion oxidation of methane, which has not been captured and used to generate electricity and heat. This method will allow oxidation of CH
4 to CO
2 and H
2O with close to zero energy effect of the process due to low concentration of methane in the ventilation air (below 2% by volume) [
34]. The combustion of part of the methane will reduce the extraction CF to (ii) 3.665 Mg CO
2·kg
−1 Hg (by 73%) for PAC and (ii’) 3.830 Mg CO
2·kg
−1 Hg (by 73%) for CD.
5.2. PAC Production
(iii) PAC-methane electricity (PAC-ME) variant: the PAC production installation only in 25% uses the resulting pyrolytic gas and the operation of producing electricity from its combustion. Combustion of more of this gas would reduce indirect emissions associated with its purchase and direct emissions associated with methane emissions contained in the pyrolytic gas. Assuming the efficiency of electricity generation in a gas-fired power plant at the level of 50% [
35] and the composition of gas shown in
Table S3, it turns out that it is possible to cover almost a third of the plant’s electricity needs. This results in a reduction of CF by about 44% to 39.777 Mg CO
2·kg
−1 Hg. Such a significant reduction of CF is caused by avoiding the emission of methane, which in the process of electricity generation is burned to carbon dioxide which has 28 times lower global warming potential (GWP) than methane.
5.3. CD Receive Stage
(iv) CD-methane no electricity (CD-MnE) variant: if the coking plant did not burn the excess coke oven gas in the CHP plant, then CF would increase from 1.757 Mg CO2·kg−1 Hg to 6.816 Mg CO2·kg−1 Hg due to indirect emissions associated with the purchase of the required electricity and heat. In this option, direct emissions from the combustion of coke oven gas for energy production would be replaced by direct emissions of purified coke oven gas. This emission in CO2 equivalent would be 32.133 Mg CO2·kg−1 Hg. In this case, the CF of all processes carried out at the coking plant site would increase to 38.949 Mg CO2·kg−1 Hg of which 72.7% would be the emission of purified coke-oven gas into the atmosphere; 9.8% combustion of purified coke-oven gas in the heating ducts of the coking battery; 7.0% electricity consumption and 10.5% purchase of thermal energy.
(v) CD-methane flamed (CD-MF) variant: if the coking plant is not able to use the excess coke oven gas for the production of electricity and/or heat, or to sell it, then the gas is flared, generating direct emissions of 6.618 Mg CO2·kg−1 Hg. In this case, there is no avoided emission effect due to a reduction in the amount of energy purchased, and CF will amount to 8.375 Mg CO2·kg−1 Hg.
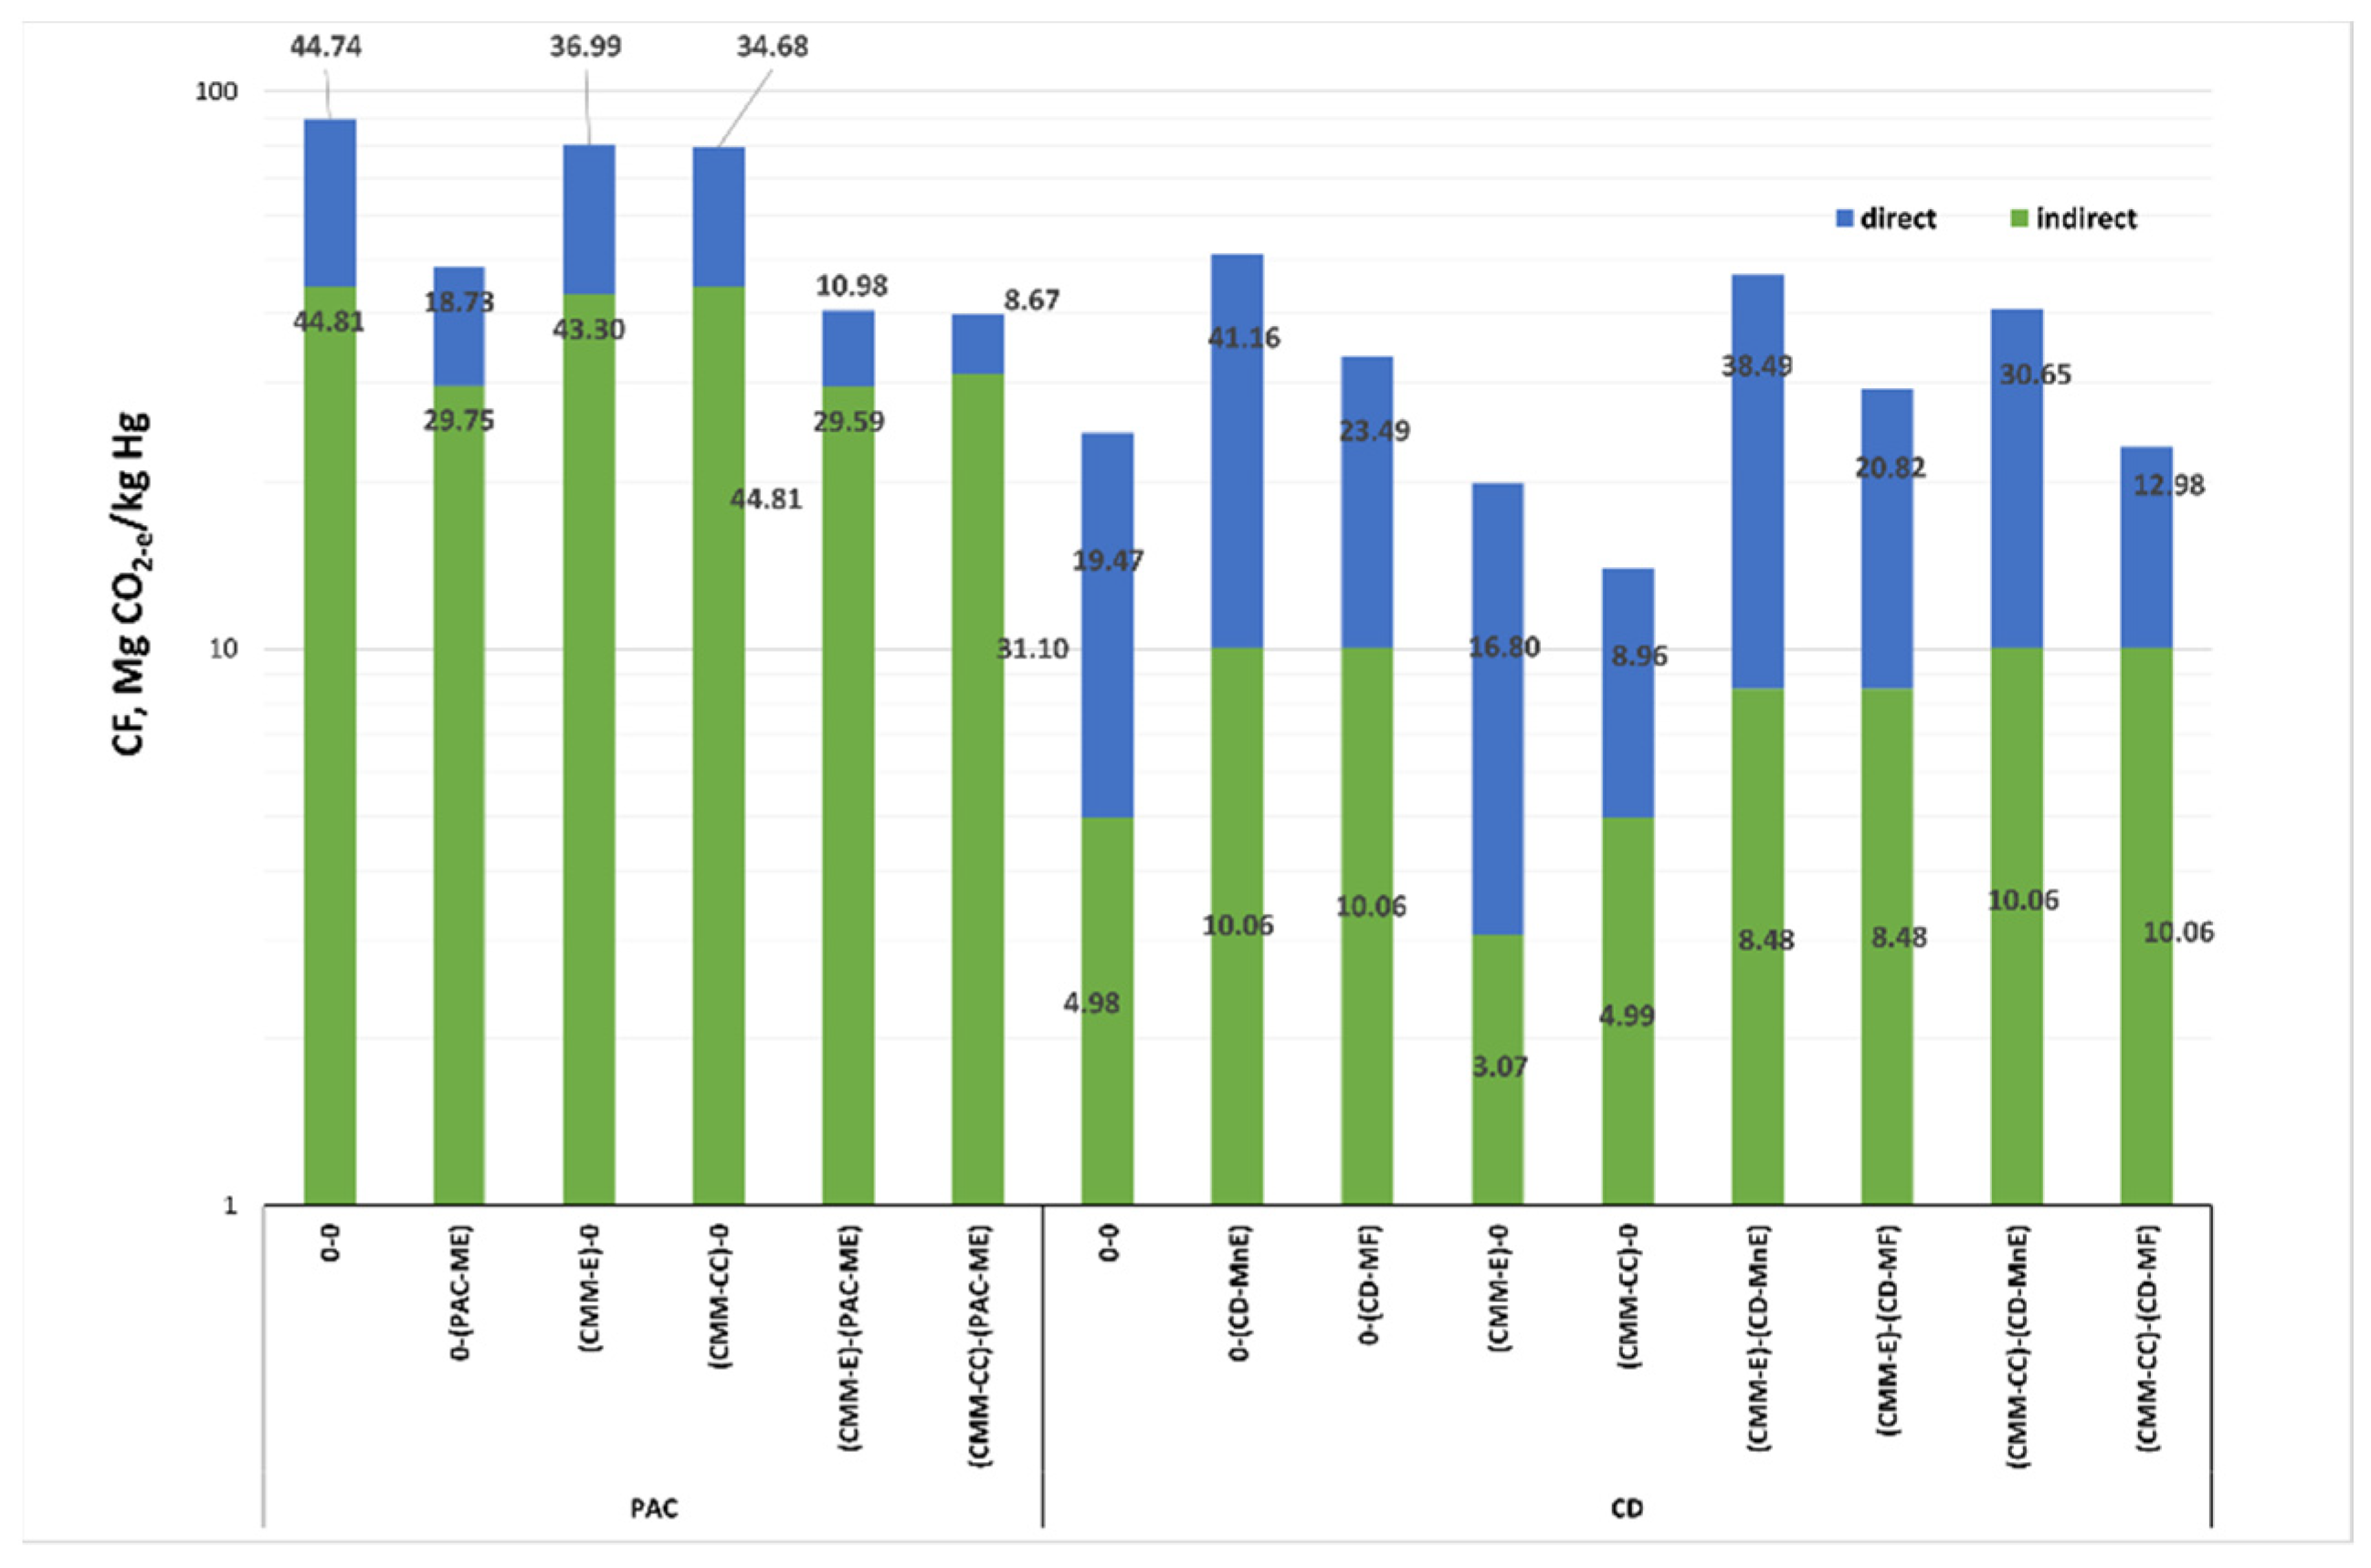
Figure 5 shows possible combinations of the whole process cycle of the coal mining process, from the extraction of raw materials to the injection of sorbents into the flue gas. The columns (0-0) for PAC and CD correspond to the CF values of the actual processes (actual state, as described in
Section 4). The other columns correspond to the variants included in the sensitivity analysis. For PAC, the lowest observed CF is for variant (CMM-CC/PAC-ME), assuming the catalytic post combustion of methane during extraction (CMM-CC) and energy management of the pyrolytic gas by the PAC plant. Such operations would reduce the CF of the mercury removal process by 49.771 Mg CO
2-e∙kg
−1 Hg, i.e., by about 44%. In the case of CD, the lowest achievable CF value is the variant using catalytic methane afterburning (CMM-CC) while maintaining basic processes at the coking plant site (B). Such operations will reduce mercury removal CF by 10.508 Mg CO
2-e∙kg
−1 Hg, i.e., by about 42%.
6. CF of Mercury Removal from the Flue Gas by Injecting Organic Sorbents
Taking into account the assumed life cycle of PAC, CF of this sorbent to remove 1 kg of mercury from the exhaust gas is 13.720 Mg CO2-e from the extraction of the raw material, 1.351 Mg CO2 generated during the transport of coal from the mine to the PAC plant over a distance of 500 km, 73.556 Mg CO2-e from the sorbent production processes, and 0.919 Mg CO2 from the transport of the sorbent to the power plant and its injection into the flue gas. Similarly, for the CD, it is 14.338 Mg CO2-e from coal mining, 0.282 Mg CO2 generated by transporting coal from the mine to the coking plant over a distance of 100 km, 8.375 Mg CO2-e from coke dust extraction processes, and 1.457 Mg CO2-e from transporting CD to the power plant and its injection into the flue gas.
Such a big difference between CF values to the detriment of PAC is due to the following reasons: (i) high demand for coal to produce a PAC mass unit (2.8 Mg of coal per 1 Mg of PAC) and (ii) lack of utilisation of the pyrolytic gas produced during the production of PAC. The relatively low value of CF for CD is due to the following factors: (i) utilisation of the excess coke-oven gas generated in the coking process by using it to produce electricity for the coking plant’s own needs; (ii) application of dry coke cooling technology, which allows the physical enthalpy of hot coke to be used to produce the heat used in the coking plant; (iii) high yields of coke in the coking process (1.3 Mg of coal mixture is needed to produce 1 Mg of coke); (iv) purification of raw coke oven gas, which allows obtaining valuable products (including coal tar, benzol, sulphur) and energy media, resulting in the sum of all direct and indirect emissions being allocated to a larger number of products, not just coke.
7. Discussion
Based on the CF analysis of mercury removal from the flue gas using an injection of PAC and CD, the following conclusions can be drawn.
Mercury removal was carried out at a lignite-fired power plant and the mean concentration of mercury in the flue gas emitted to the atmosphere is 28.0 µg Hg·m−3. To remove 1 kg of mercury from the flue gas, 14.925 Mg of PAC and 33.594 Mg of CD need to be applied.
The values of the carbon footprint associated with the removal of 1 kg of mercury, including coal mining, its transport to the sorbents plant, production of sorbents themselves, their transport to the power plant, and injection into the treated flue gases, are 89.548 Mg CO2-e·kg−1 Hg for PAC and 24.452 Mg CO2-e for CD.
In CF of PAC, the direct (34%) and indirect emissions related to the consumption of energy media, mainly electricity (46%) have comparable shares. The value of CF in the case of CD in 80.2% is related to direct emissions of CO2 and CH4, while indirect emissions are only 19.8%. Such a large difference in components as well as in the absolute value of CF of sorbents resulted mainly from the stage of their production. For PAC, CF of its production is 73.556 Mg CO2-e·kg−1 Hg (which is 82% of the total value of CF) and for CD production CF = 8.193 Mg CO2-e·kg−1 Hg (which is about 34% of the total value of CF). Such a considerable, disadvantageous PAC difference is a consequence of wasting the energy potential of the resulting pyrolytic gas.
The reduction of the CF value for CD is possible by making changes in the coal mining process for the production of this sorbent, the share of which in the CF is predominant (58.6%). The application of the technology of catalytic post combustion of methane during coal extraction for coke production would reduce the total value of CF by 42%, to 10.508 Mg CO2-e·kg−1 Hg. In the case of PAC, changes in its manufacturing technology will reduce the total CF. The use of the resulting pyrolytic gas for the heating of carbonisation furnaces and its excess for the production of electricity and heat would reduce CF by 44% to CF = 39.777 Mg CO2-e kg−1 Hg.
In the CF analysis of both organic sorbents, the stages of regeneration and utilisation of used materials were omitted, which may seem inconsistent with the LCA methodology. There is a lack of reliable data and professional literature on material and energy balances in Polish technological conditions to estimate GHG emission from regeneration and utilisation stages. Of course, it is possible to estimate such CF, for CD assuming the addition of used sorbent to the coking coal mixture, where desorbed mercury will enter into the by-products of the coking process according to the balances presented in the work of Mayor et al. [
36] and for PAC, a regeneration, technologically similar to the activation of raw coals. However, the probability of error with such a hypothetical analysis works against it, and therefore, it was not included in the CF account of sorbent application for mercury removal.


