
Evaluation of the Impact of Weather-Related Limitations on the Installation of Offshore Wind Turbine Towers

 , , ,
, , ,
Abstract
:1. Introduction
2. State of the Art
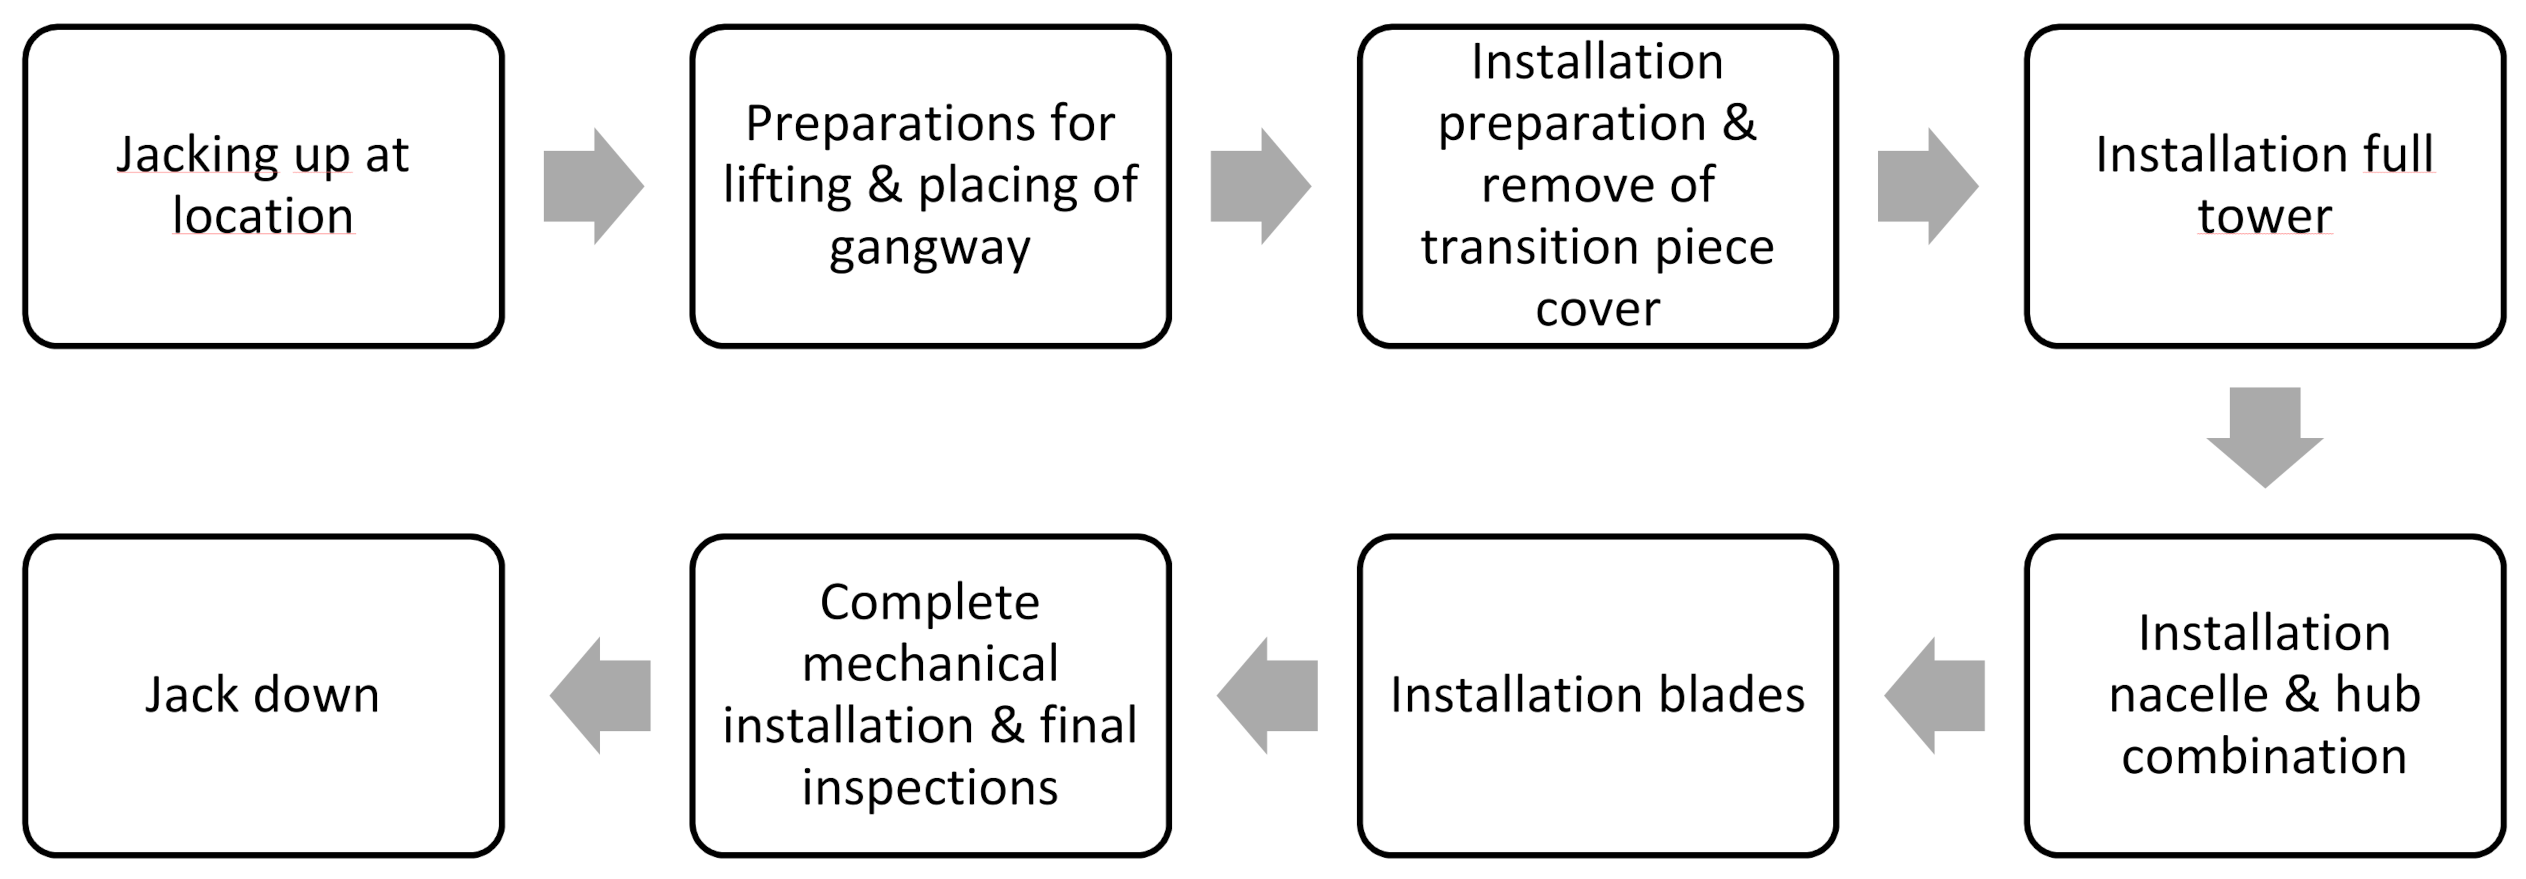
2.1. Conventional Offshore Wind Park Installation
2.2. Previous Research Regarding Offshore Wind Park Installation
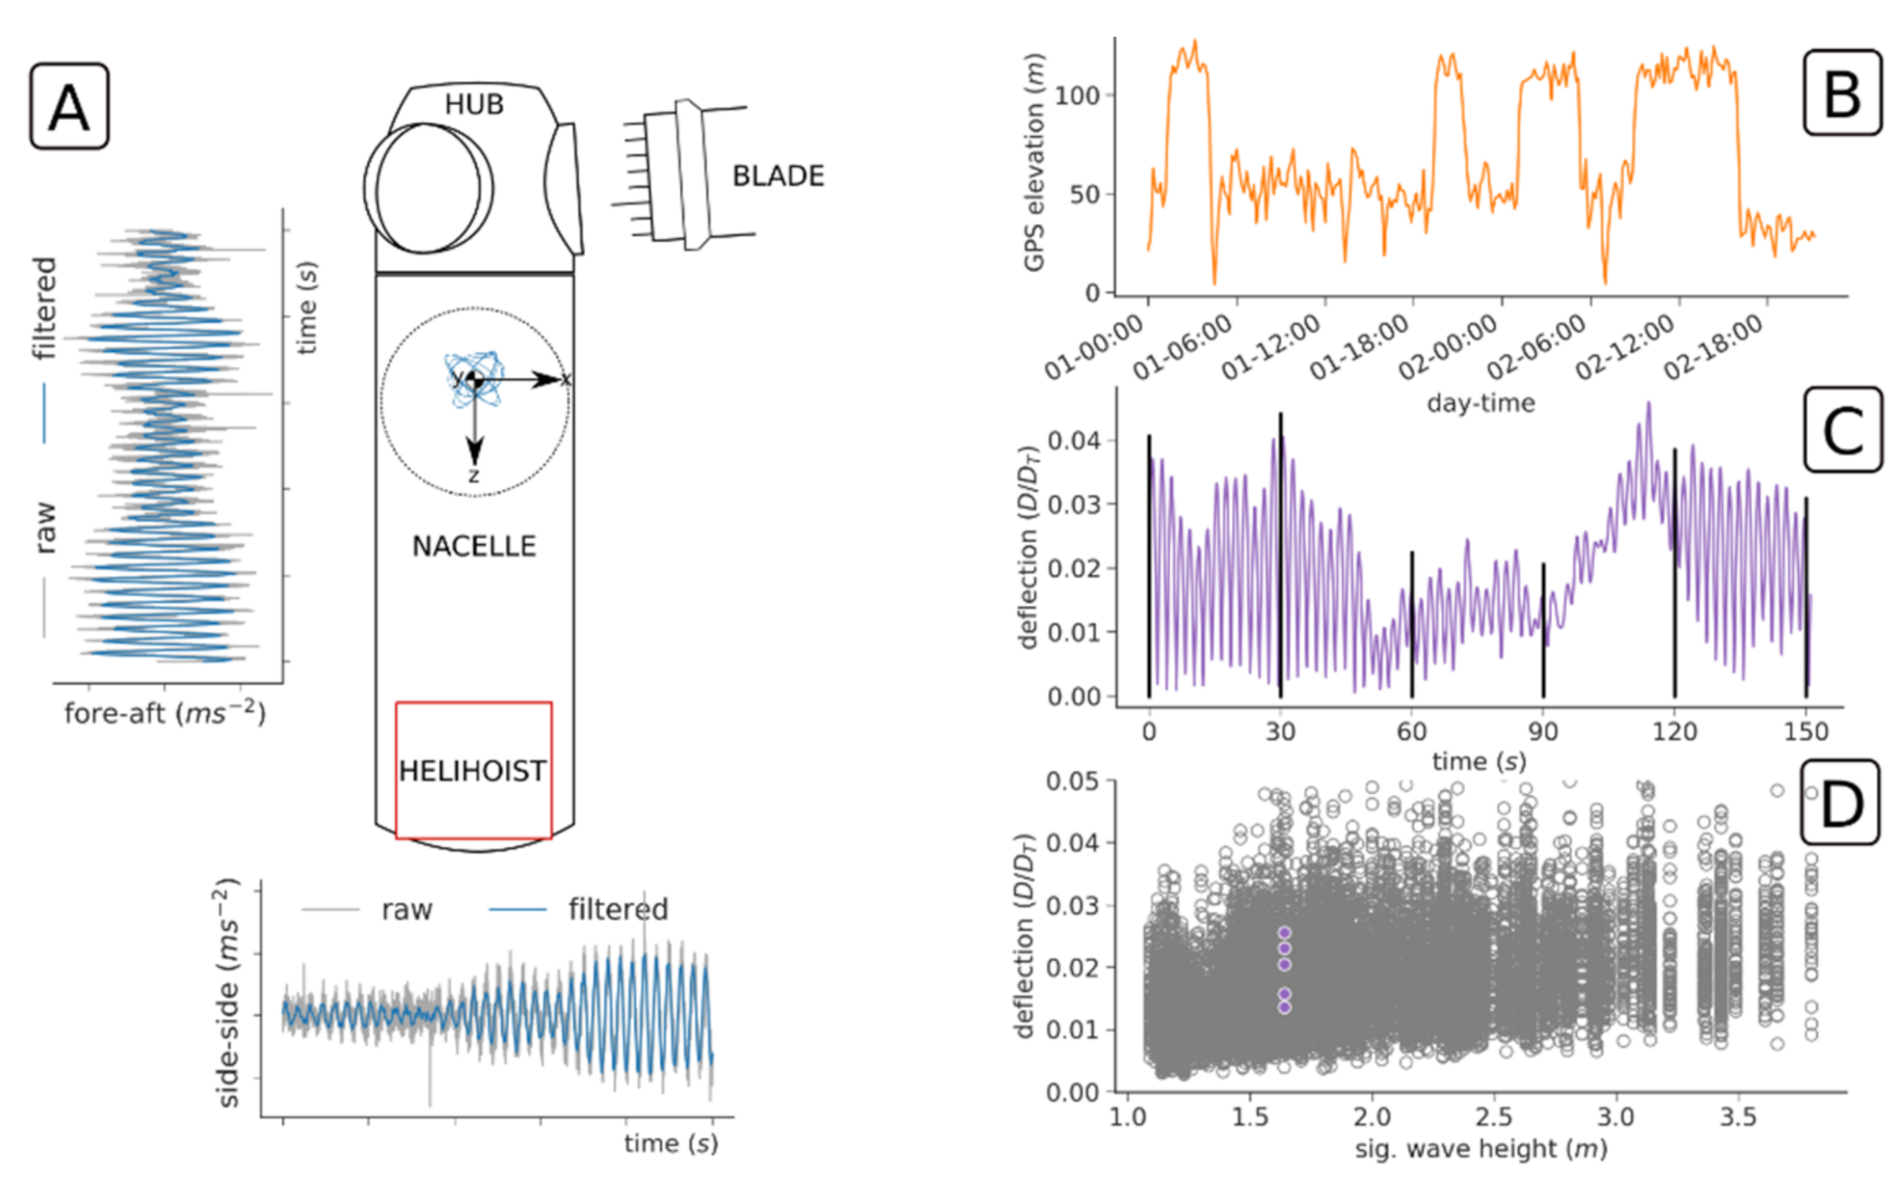
2.3. Field and Simulation Data
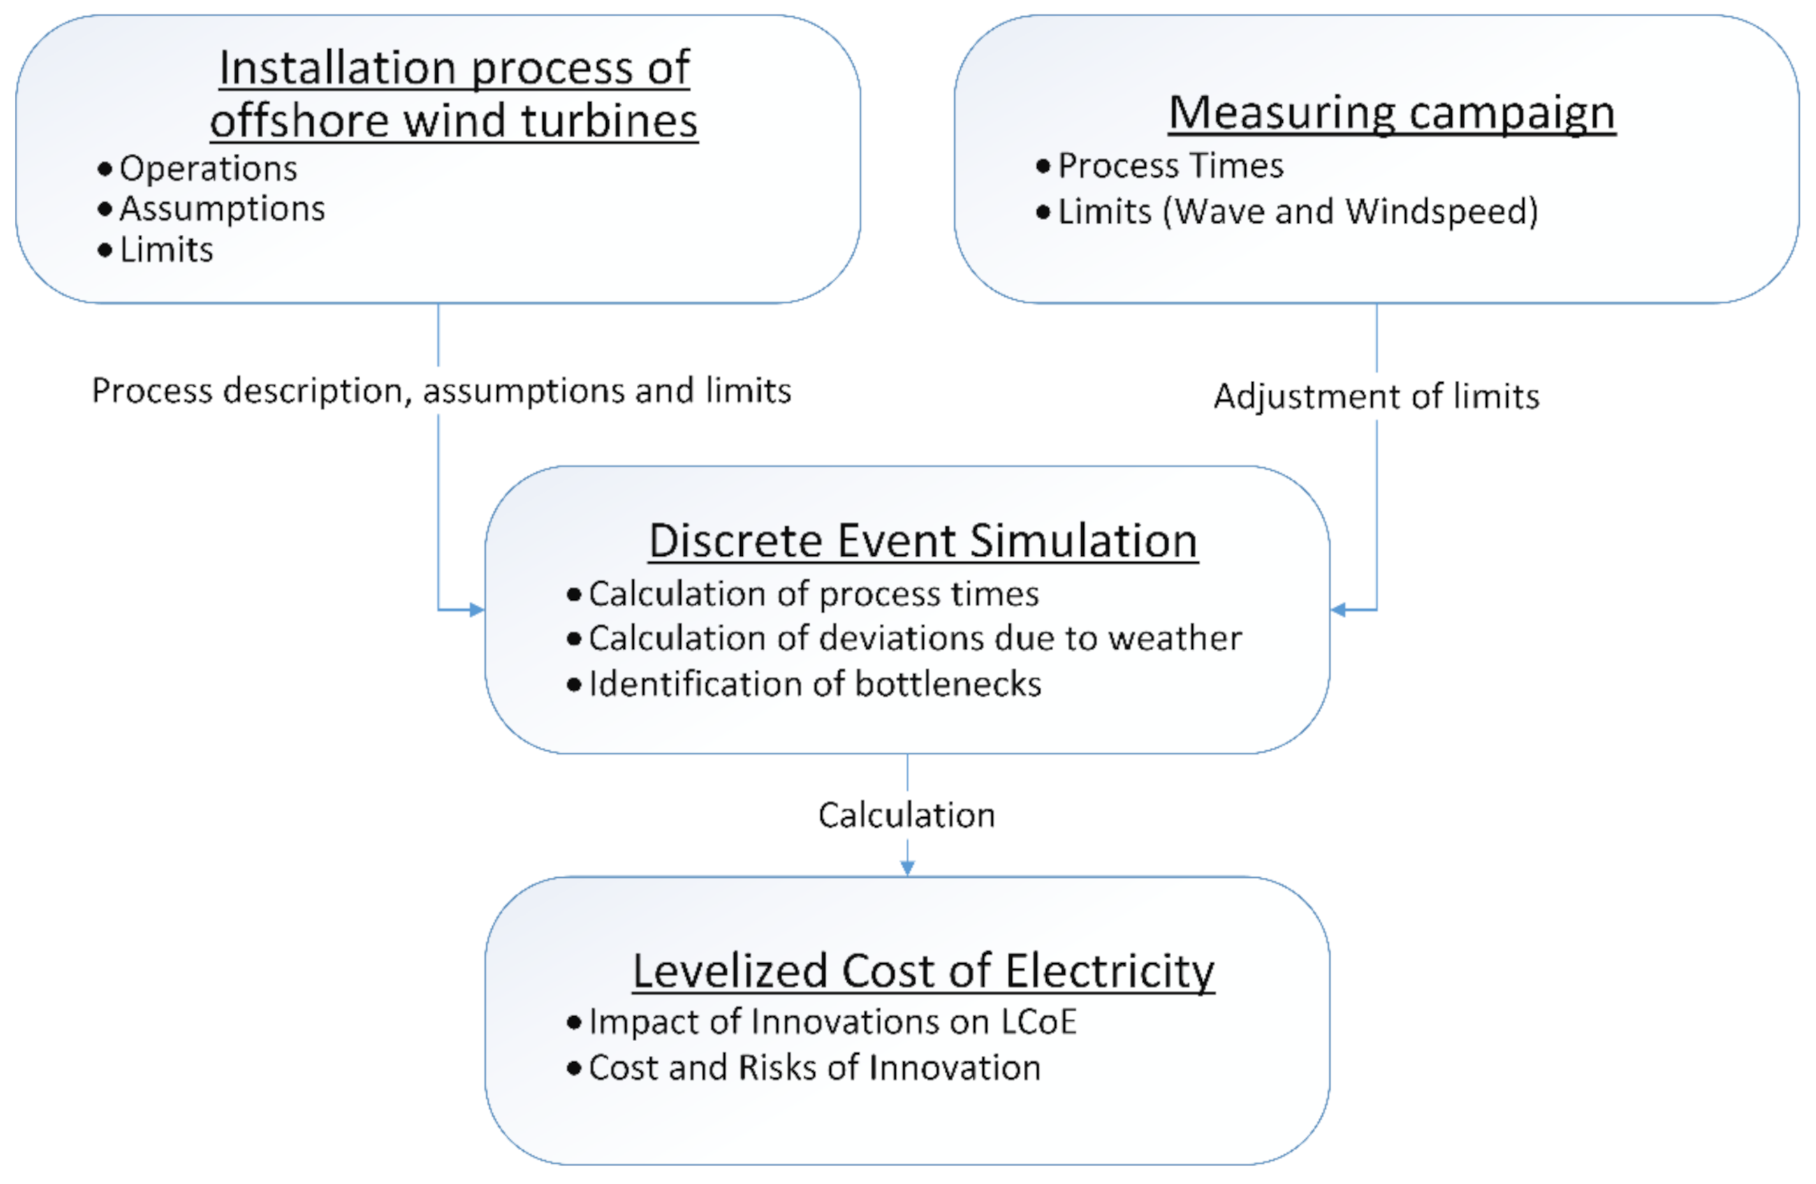
3. Material and Methods
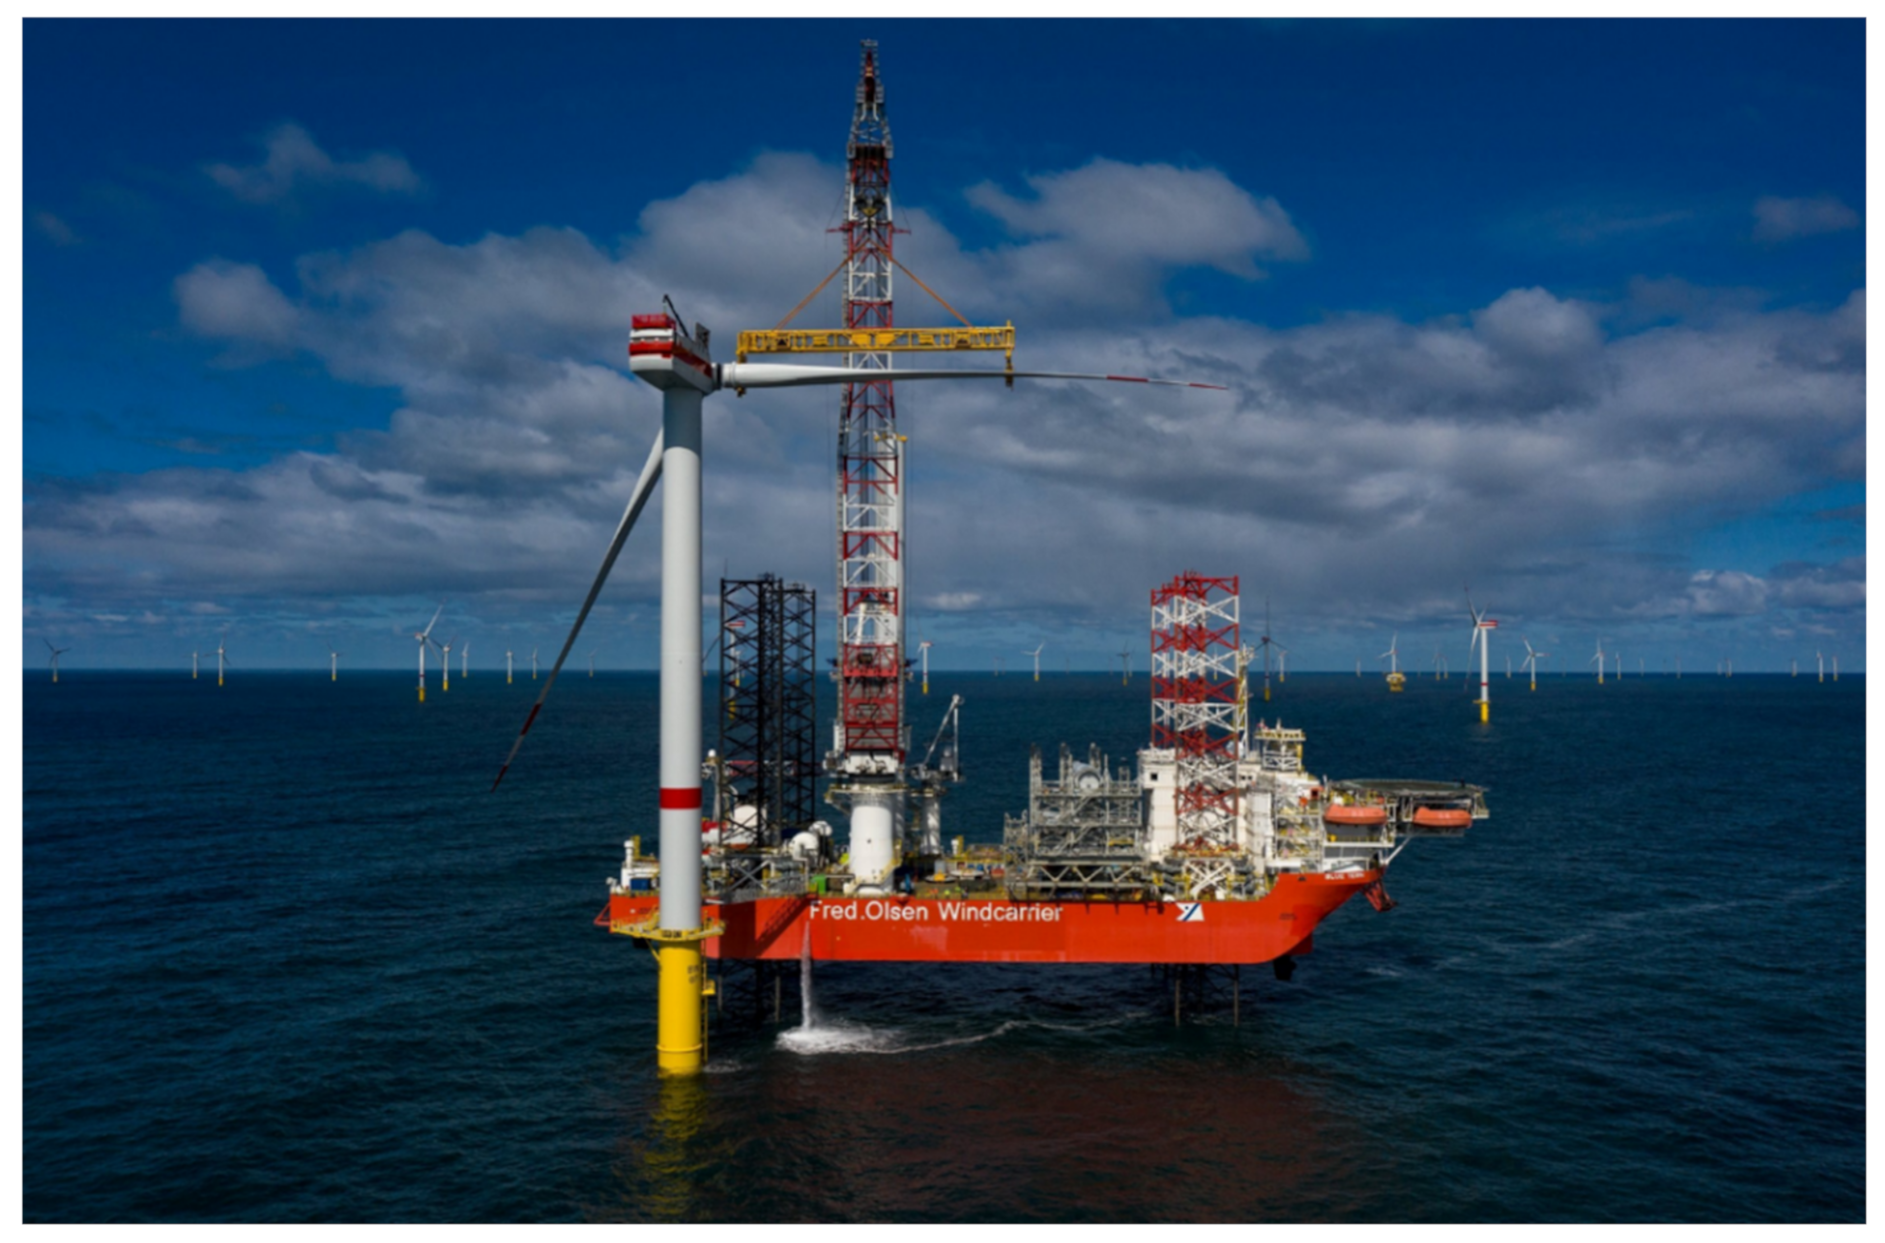
3.1. Trianel Windpark Borkum II Installation
3.2. Simulation Scenario for the Discrete Event Simulation
4. Results and Discussion
Discrete Event Simulation
5. Conclusions and Outlook
Author Contributions
Funding
Institutional Review Board Statement
Informed Consent Statement
Data Availability Statement
Conflicts of Interest
References
- Kausche, M.; Adam, F.; Dahlhaus, F.; Großmann, J. Floating offshore wind—Economic and ecological challenges of a TLP solution. Renew. Energy 2018, 126, 270–280. [Google Scholar] [CrossRef]
- Barlow, E.; Tezcaner Öztürk, D.; Revie, M.; Boulougouris, E.; Day, A.H.; Akartunalı, K. Exploring the impact of innovative developments to the installation process for an offshore wind farm. Ocean. Eng. 2015, 109, 623–634. [Google Scholar] [CrossRef] [Green Version]
- Barlow, E.; Tezcaner Öztürk, D.; Revie, M.; Akartunalı, K.; Day, A.H.; Boulougouris, E. A mixed-method optimisation and simulation framework for supporting logistical decisions during offshore wind farm installations. Eur. J. Oper. Res. 2018, 264, 894–906. [Google Scholar] [CrossRef] [Green Version]
- Beinke, T.; Ait Alla, A.; Freitag, M. Resource Sharing in the Logistics of the Offshore Wind Farm Installation Process based on a Simulation Study. Int. J. e-Navig. Marit. Econ. 2017, 7, 42–54. [Google Scholar] [CrossRef]
- Byon, E.; Pérez, E.; Ding, Y.; Ntaimo, L. Simulation of wind farm operations and maintenance using discrete event system specification. SIMULATION 2011, 87, 1093–1117. [Google Scholar] [CrossRef]
- Oelker, S.; Ait Alla, A.; Lütjen, M.; Lewandowski, M.; Freitag, M.; Thoben, K.D. A simulation study of feeder-based installation concepts for offshore wind farms. In Proceedings of the Twentyeighth International Ocean and Polar Engineering Conference, Sapporo, Japan, 10–15 June 2018; Chung, J.S., Hyun, B.S., Matskevitch, D., Wang, A.M., Eds.; pp. 578–583. [Google Scholar]
- Sander, A.; Haselsteiner, A.F.; Barat, K.; Janssen, M.; Oelker, S.; Ohlendorf, J.H.; Thoben, K.-D. Relative Motion during Single Blade Installation: Measurements from the North Sea. In Proceedings of the 39th International Conference on Ocean, Offshore and Arctic Engineering; ASME Digital Collection, Virtual, Online, 3–7 August 2020; Volume 9, pp. 1–10. [Google Scholar]
- Sander, A.; Meinhardt, C.; Thoben, K.-D. Monitoring of offshore wind turbines under wave and wind loading during installation. In Proceedings of the EURODYN 2020 XI International Conference on Structural Dynamics, Athens, Greece, 22–24 June 2020. [Google Scholar]
- Sander, A. Oscillations of Offshore Wind Turbines undergoing Installation I: Raw Measurements (Version 2). 2020. Available online: https://zenodo.org/record/4498779#.YNFg7kwRWM8 (accessed on 8 June 2021).
- Bhattacharya, S. Challenges in Design of Foundations for Offshore Wind Turbines. Inst. Eng. Technol. 2014, 1. [Google Scholar] [CrossRef]
- Musial, W.; Butterfield, S.; Ram, B. Energy from Offshore Wind. In Proceedings of the Offshore Technology Conference, Houston, TX, USA, 1–4 May 2006. [Google Scholar] [CrossRef]
- Ait Alla, A.; Oelker, S.; Lewandowski, M.; Freitag, M.; Thoben, K.D. A Study of new Installation Concepts of Offshore Wind Farms by Means of Simulation Model. In Proceedings of the 27th International Ocean and Polar Engineering Conference, San Francisco, CA, USA, 25–30 June 2017. [Google Scholar]
- Jiang, Z. Installation of offshore wind turbines: A technical review. Renew. Sustain. Energy Rev. 2021, 139. [Google Scholar] [CrossRef]
- Jiang, Z. The impact of a passive tuned mass damper on offshore single-blade installation. J. Wind Eng. Ind. Aerodyn. 2018, 176, 65–77. [Google Scholar] [CrossRef]
- Jiang, Z.; Skrudland, T.K.; Karimirad, M.; Machiladies, C.; Shi, W. Effect of a Passive Tuned Mass Damper on Offshore Installation of a Wind Turbine Nacelle. In Proceedings of the ASME 2020 39th International Conference on Ocean, Offshore and Arctic Engineering, American Society of Mechanical Engineers Digital Collection, Virtual, Online, 3–7 August 2020. [Google Scholar] [CrossRef]
- Verma, A.S.; Jiang, Z.; Gao, Z.; Vedvik, N.P. Effects of a passive tuned mass damper on blade root impacts during the offshore mating process. Mar. Struct. 2020, 72, 102778. [Google Scholar] [CrossRef]
- Ait Alla, A.; Quandt, M.; Lütjen, M. Simulation-based aggregate installation planning of offshore wind farms. Int. J. Energy 2013, 72, 23–30. [Google Scholar]
- Irawan, C.A.; Jones, D.; Ouelhadj, D. Bi-objective optimisation model for installation scheduling in offshore wind farms. Comput. Oper. Res. 2017, 78, 393–407. [Google Scholar] [CrossRef] [Green Version]
- Rippel, D.; Jathe, N.; Lütjen, M.; Freitag, M. A Mixed-Integer Formulation to Optimize the Resupply of Components for the Installation of Offshore Wind Farms. In Proceedings of the 2020 Winter Simulation Conference, Orlando, FL, USA, 14–18 December 2020; Bae, K.-H., Feng, B., Kim, S., Lazarova-Molnar, S., Zheng, Z., Roeder, T., Thiesing, R., Eds.; IEEE: New York, NY, USA, 2020; pp. 1420–1431. [Google Scholar]
- Tekle Muhabie, Y.; Rigo, P.; Cepeda, M.; de Almeida D’Agosto, M.; Caprace, J.D. A discrete event simulation approach to evaluate the effect of stochastic parameters on offshore wind farms assembly strategies. Ocean. Eng. 2018, 149, 279–290. [Google Scholar] [CrossRef]
- Vis, I.F.; Ursavas, E. Assessment approaches to logistics for offshore wind energy installation. Sustain. Energy Technol. Assess. 2016, 14, 80–91. [Google Scholar] [CrossRef] [Green Version]
- Rippel, D.; Jathe, N.; Becker, M.; Lütjen, M.; Szczerbicka, H.; Freitag, M. A Review on the Planning Problem for the Installation of Offshore Wind Farms. IFAC PapersOnLine 2019, 52, 1337–1342. [Google Scholar] [CrossRef]
- Maes, K.; De Roeck, G.; Lombaert, G. Motion tracking of a wind turbine blade during lifting using RTK-GPS/INS. Eng. Struct. 2018, 172, 285–292. [Google Scholar] [CrossRef]
- Qiu, Y.; Feng, Y.; Tavner, P.; Richardson, P. Wind turbine SCADA alarm analysis for improving reliability. Wind Energy 2012, 15, 951–966. [Google Scholar] [CrossRef]
- Feng, Y.; Qiu, Y.; Crabtree, C.; Long, H.; Tavner, P. Use of SCADA and CMS signals for failure detection and diagnosis of a wind turbine gearbox. EWEA 2011. [Google Scholar] [CrossRef] [Green Version]
- Kim, K.; Parthasarathy, G.; Uluyol, O.; Foslien, W. Use of SCADA data for failure detection in wind turbines. In Proceedings of the Energy Sustainability Conference and Fuel Cell Conference, Washington, DC, USA, 7–10 August 2011. [Google Scholar]
- Wang, Y.; Infield, D. Supervisory control and data acquisition data-based non-linear state estimation technique for wind turbine gearbox condition monitoring. IET Renew. Power Gener. 2012, 7, 350–358. [Google Scholar] [CrossRef]
- Verma, A.S.; Jiang, Z.; Ren, Z.; Gao, Z.; Vedvik, N.P. Response-Based Assessment of Operational Limits for Mating Blades on Monopile-Type Offshore Wind Turbines. Energies 2019, 12, 1867. [Google Scholar] [CrossRef] [Green Version]
- Shankar Verma, A.; Jiang, Z.; Ren, Z.; Caboni, M.; Verhoef, H.; van der Mijle-Meijer, H.; Castro, S.G.; Teuwen, J.J. A probabilistic long-term framework for site-specific erosion analysis of wind turbine blades: A case study of 31 Dutch sites. Wind Energy 2021, 1–22. [Google Scholar] [CrossRef]
- Jiang, Z.; Gao, Z.; Ren, Z.; Li, Y.; Duan, L. A parametric study on the final blade installation process for monopile wind turbines under rough environmental conditions. Eng. Struct. 2018, 172, 1042–1056. [Google Scholar] [CrossRef]
- Ren, Z.; Jiang, Z.; Gao, Z.; Skjetne, R. Active tugger line force control for single blade installation. Wind Energy 2018, 21, 1344–1358. [Google Scholar] [CrossRef] [Green Version]
- Freiheit, T. Installationskosten von Offshore-Windenergieparks: Einfluss eines Schwingungstilgers auf die Rotorblattinstallation (Bachelor of Science); University of Bremen: Bremen, Germany, 2021. [Google Scholar]
- Helmholtz-Zentrum Geesthacht, Zentrum für Material- und Küstenforschung GmbH. coastDat-1 Waves North Sea wave spectra hindcast (1948–2007). World Data Center for Climate (WDCC) am DKRZ. Available online: https://doi.org/10.1594/WDCC/coastDat-1_Waves (accessed on 7 June 2021).
- Fraunhofer Institut for Solar Energy Systems. Stromgestehungskosten erneuerbarer Energien—Studie. 2018. Available online: https://www.ise.fraunhofer.de/content/dam/ise/de/documents/publications/studies/DE2018_ISE_Studie_Stromgestehungskosten_Erneuerbare_Energien.pdf (accessed on 7 June 2021).


| Parameter | Value |
|---|---|
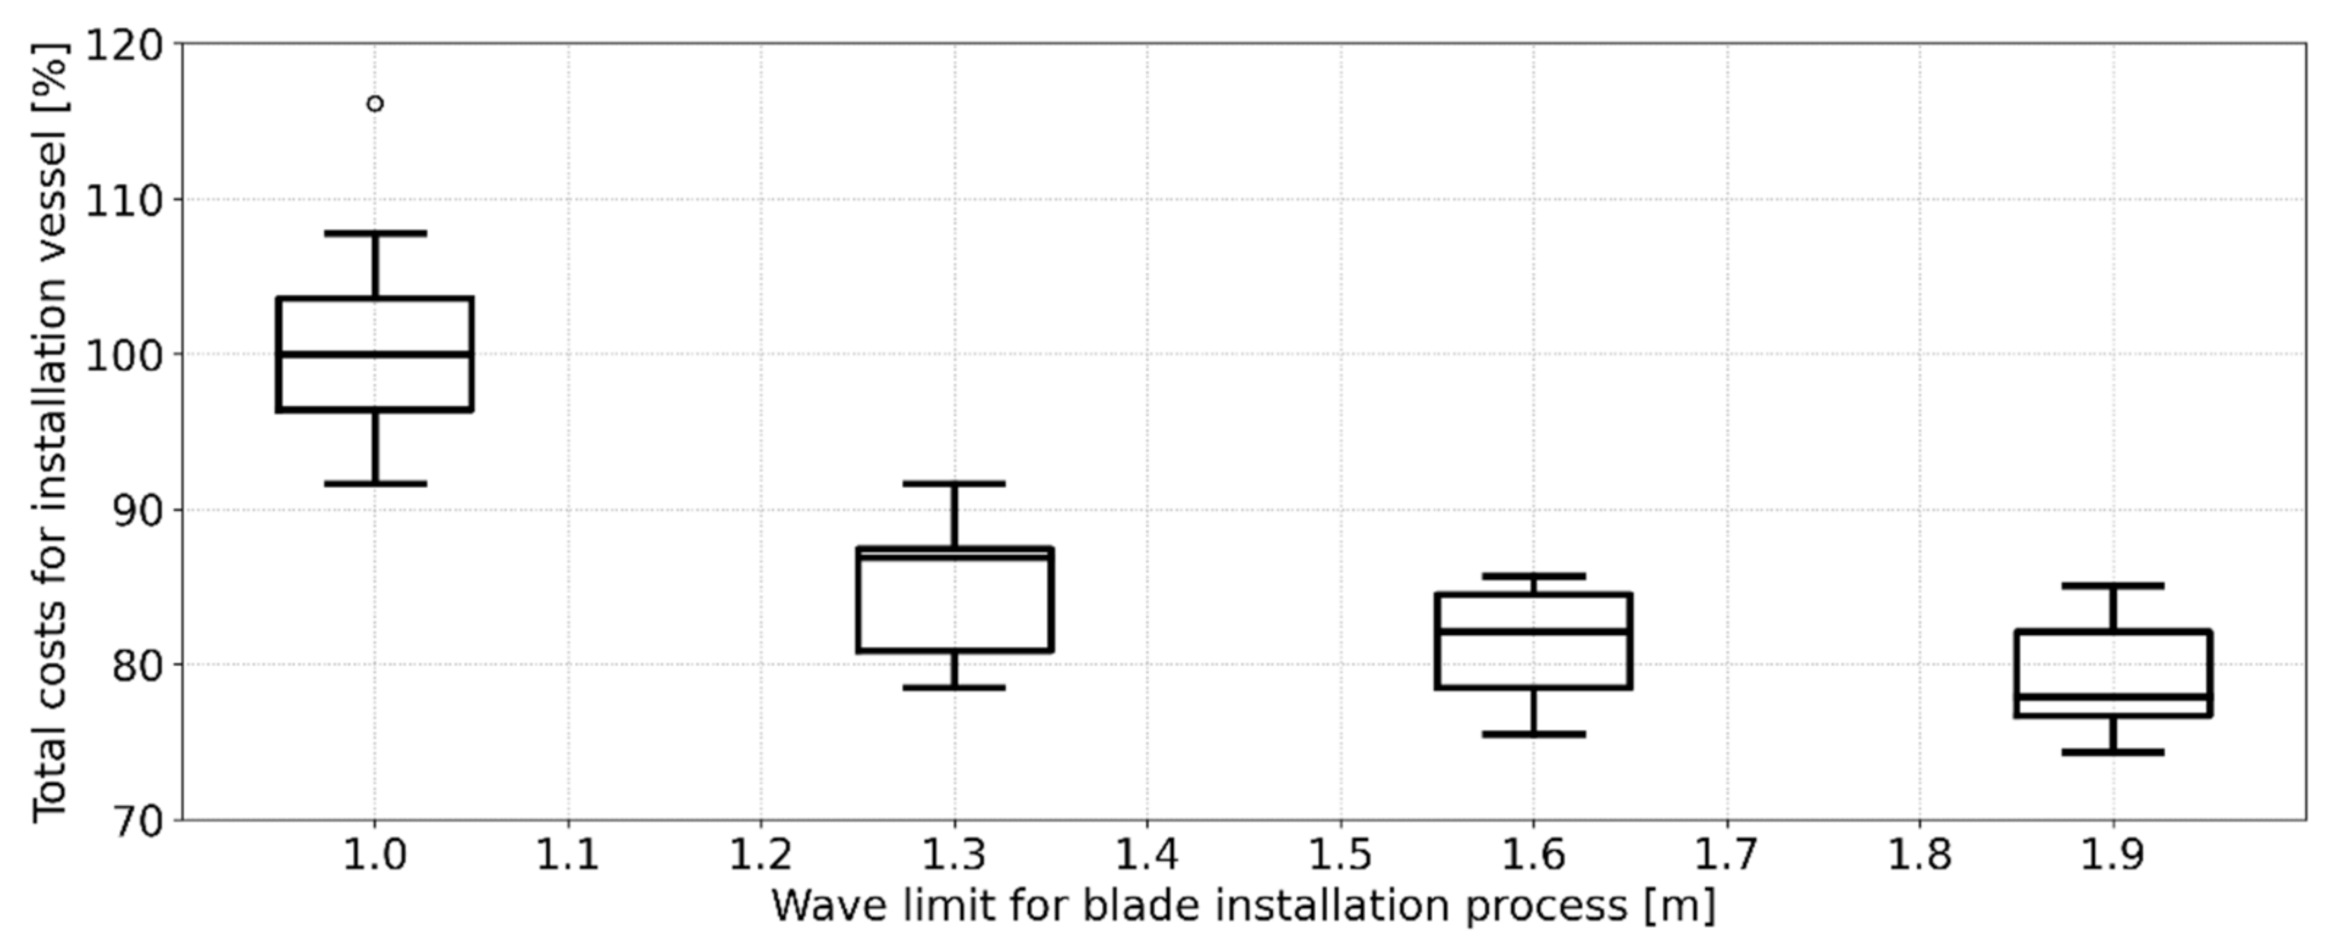
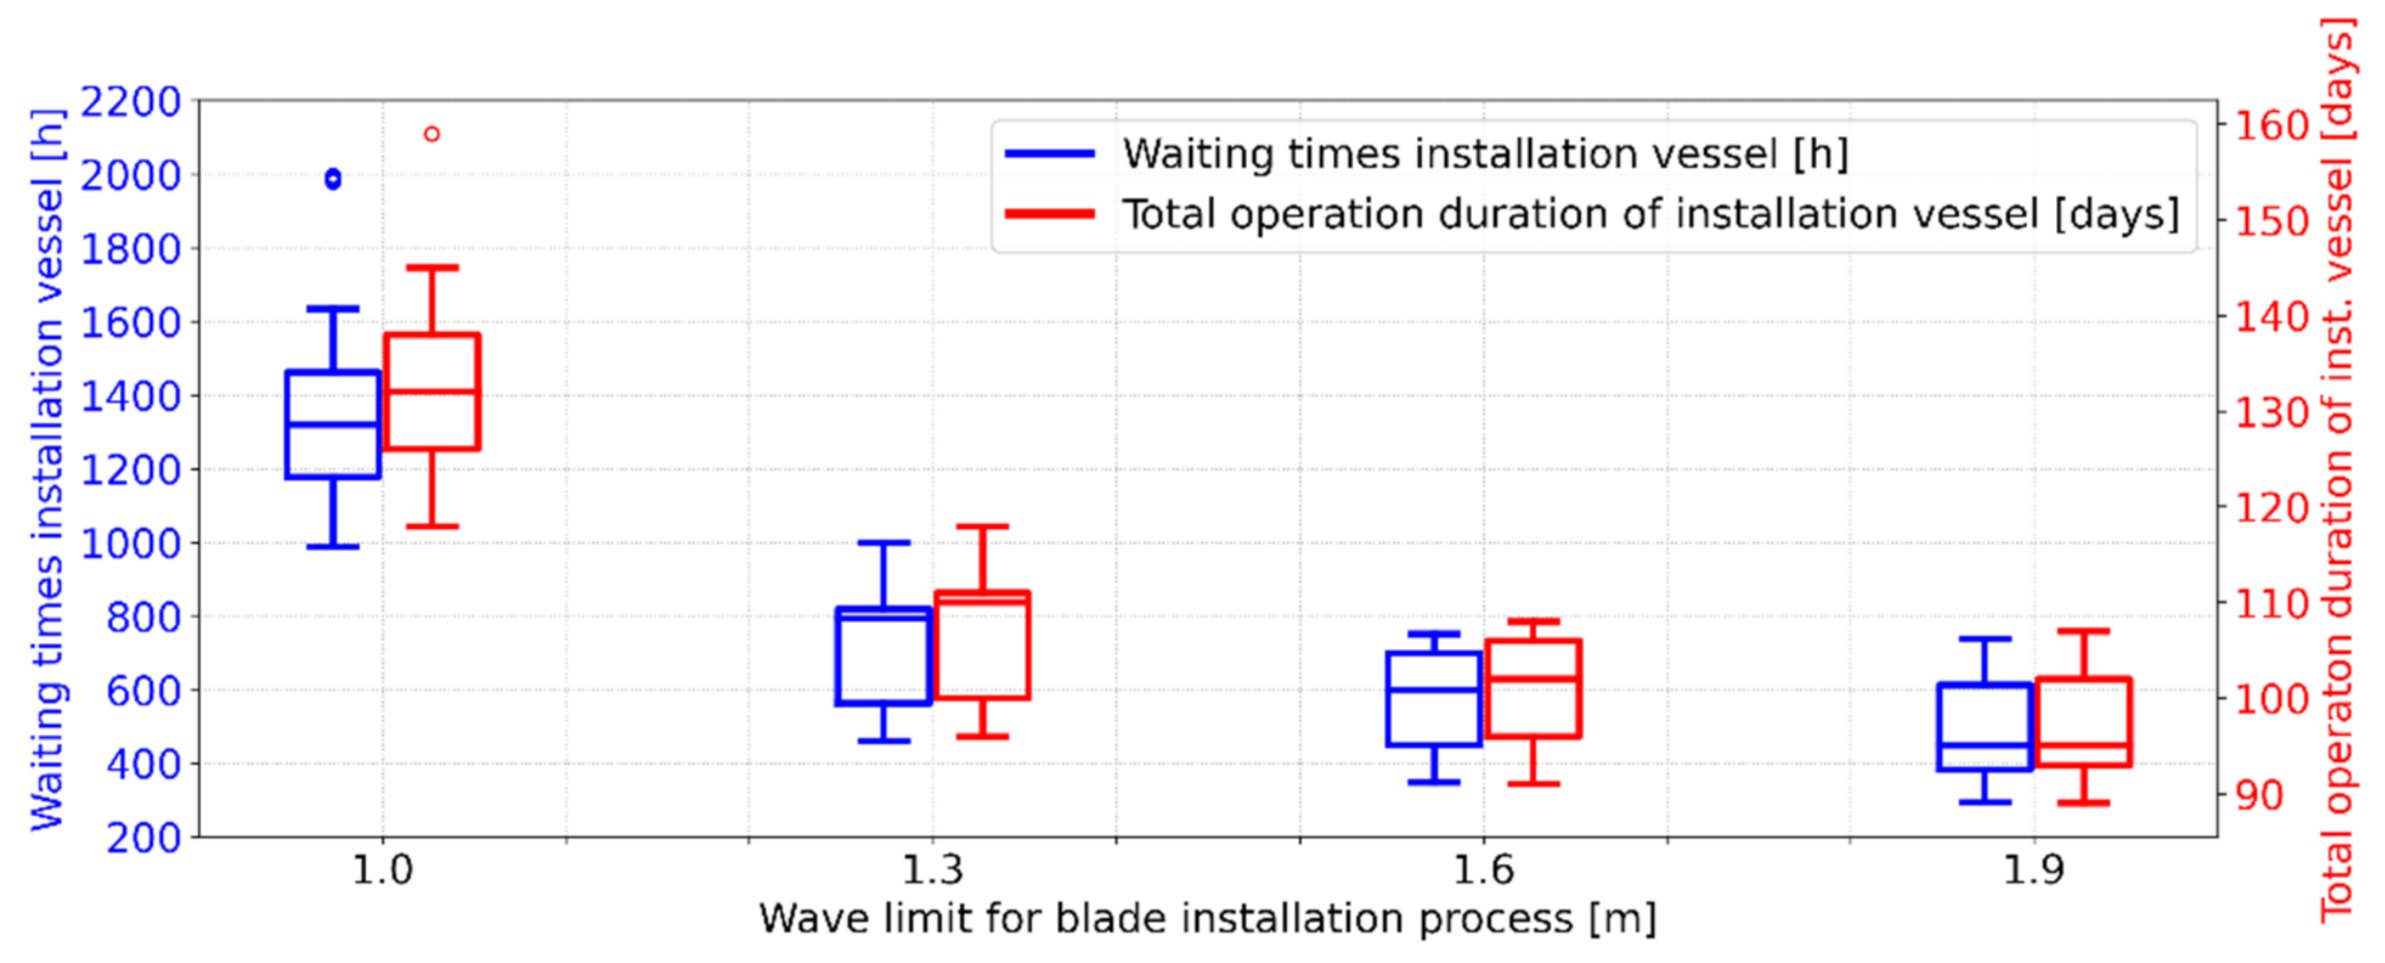
| Limit wave height | 1.0, 1.3, 1.6 and 1.9 m |
| Limit wind speed | 12.0 m per second |
| Mean installation time | 4.0 h |
Publisher’s Note: MDPI stays neutral with regard to jurisdictional claims in published maps and institutional affiliations. |
© 2021 by the authors. Licensee MDPI, Basel, Switzerland. This article is an open access article distributed under the terms and conditions of the Creative Commons Attribution (CC BY) license (https://creativecommons.org/licenses/by/4.0/).
Share and Cite
Oelker, S.; Sander, A.; Kreutz, M.; Ait-Alla, A.; Freitag, M. Evaluation of the Impact of Weather-Related Limitations on the Installation of Offshore Wind Turbine Towers. Energies 2021, 14, 3778. https://doi.org/10.3390/en14133778
Oelker S, Sander A, Kreutz M, Ait-Alla A, Freitag M. Evaluation of the Impact of Weather-Related Limitations on the Installation of Offshore Wind Turbine Towers. Energies. 2021; 14(13):3778. https://doi.org/10.3390/en14133778
Chicago/Turabian StyleOelker, Stephan, Aljoscha Sander, Markus Kreutz, Abderrahim Ait-Alla, and Michael Freitag. 2021. "Evaluation of the Impact of Weather-Related Limitations on the Installation of Offshore Wind Turbine Towers" Energies 14, no. 13: 3778. https://doi.org/10.3390/en14133778
APA StyleOelker, S., Sander, A., Kreutz, M., Ait-Alla, A., & Freitag, M. (2021). Evaluation of the Impact of Weather-Related Limitations on the Installation of Offshore Wind Turbine Towers. Energies, 14(13), 3778. https://doi.org/10.3390/en14133778