Article

The Internal Residual Gas and Effective Release Energy of a Spark-Ignition Engine with Various Inlet Port–Bore Ratios and Full Load Condition

1
School of Mechanical Engineering, University of Ulsan, San 29, Mugeo2-dong, Nam-gu, Ulsan 44610, Korea
2
Faculty of Automobile Technology, HaNoi University of Industry, No.298, Cau Dien Street, Bac Tu Liem District, Ha Noi 100000, Vietnam
*
Author to whom correspondence should be addressed.
Energies 2021, 14(13), 3773; https://doi.org/10.3390/en14133773
Submission received: 30 April 2021 / Revised: 3 June 2021 / Accepted: 22 June 2021 / Published: 23 June 2021

Abstract

:
This paper presents the effect of inlet port diameter–bore ratios (IPD/B) on the effective release energy and internal exhaust residual gas of a spark-ignition engine. To investigate the exhaust residual gas in the combustion chamber, a simulation model is setup based on AVL-boost software, and to validate the simulation model an experimental model is also setup. The results of the research show that: the IPD/B ratios have a large effect on the residual gas and effective release energy. When the IPD/B ratio increases from 0.3–0.5, the residual gas increases from 0.11% to 0.14%, and the effective release energy increases from 0.33 KJ to a maximum value of 0.45 KJ, and after that decreases. The engine shows the maximum effective release energy at IPD/B ratio is 0.4. The emission of HC and CO is decreased, but the NOx is increased until a maximum value after that decreased.

Graphical Abstract

1. Introduction

In the historical trend of improving engine performance and emission formation, the combustion engine has developed innovative combustion systems that are able to improve the CO2 and also the NOx–soot trade-offs. Systems such as the specific bowl design [1], innovative fuel injection systems (2750+ bar of injection pressure) and injection strategy [2] have been presented as effective methods. On the other hand, the exhaust residual gas (ERG) is known as an affective factor, which shows sensitive effect on engine emission formation and helps to reduce the NOx emission of diesel engines. In the exhaust stroke, some amount of burned gases are trapped inside the combustion chamber. This internal ERG will take place and premix with the fresh air of the next stroke. A high level of trapped ERG will cause for misfiring and a knock can occur. A good method for determining the effect of effective release energy (ERG) and ERE on the engine efficiency and emission characteristics is necessary.
In the history of improvements of engine efficiency and reduction of toxic emissions, there are many effective methods that have been introduced through optimization engine hardware and software factors, such as optimized cam profiles [3], optimized intake pipe configuration [4], optimized combustion duration [5], and optimized ignition timing [6].
Binqi Li et al. [7] presented the effect of the intake/exhaust ports cross-sectional area and the matching degree of intake/exhaust ports on the swirl of air-flow coefficient. The results reported that a higher intake port diameter presents a more stable intake-flow swirl coefficient with an intake port diameter that is bigger than 83 mm, and that the flows swirl is more stable at the higher intake port diameter of 88 mm. The flow coefficient is optimal with an intake port diameter of 88.6 mm.
Zhang et al. [8] presented a research to control auto-ignition combustion by changing valve timing and cam lift. When the valve lift was decreased from 9.5 to 0.3 mm, the decrease of heat release rate and cylinder pressure decreased as a result. Yungjin Kim et al. [9] studied the influence of inlet-port configurations on the swirl flow in the combustion chamber. They found that: with the helical port type, the increase of air flow rate and the slight decrease of swirl ratio can be observed. The increase of distance between the two intake ports leads to a slightly increased mass flow rate.
Raghu et al. [10] analyzed the effect of the intake valve diameter and valve seat angle of a diesel engine on the characteristics of air motion. The results of the research showed that the combustion chamber’s geometries and the inlet-port obtain sensitive influence from the cylinder’s air-flow. The inlet-port diameter’s increase from 43 to 55 mm led to a decrease in swirl ratio of 27.6% and 17.65% with a directed port and helical port, respectively. Yasar et al. [11] also presented that the intake-port shapes had influence on the intake air flow motion in the cylinder, with a valve lift of 7 mm and 30 degrees of valve seat angle. The axial direction provided the most air-flow direction and the reverse flow direction followed the cylinder side wall. Qi et al. [12] setup a computational model to investigate the effect of inlet port configuration on the characteristics of air-flow into the cylinder. In their search, an SI-engine was conducted and CFD software was used to build the simulation model. They found that the inlet port configuration has significant influence on air-fuel-flow. A suitable inlet-port configuration increases air-flow tumble and reduces recirculation to improve the air-fuel homogeneity and combustion stability. Latheesh et al. [13] also analyzed the intake and exhaust valve port designed on air-fuel flow characteristics of a compression ignition engine based on a CFD simulation model. The number of exhaust ports was increased from 2 to 4 valves. They reported that the swirl motion of air-fuel inside the combustion chamber was largely affected by the position of the helical and tangential inlet ports.
From the review of previous research, there are many articles that have presented the effect of inlet–port configuration on the air-fuel characteristics in the cylinder. There is no article that has mentioned the effect of the inlet-port diameter–bore ratio on the internal exhaust residual gas, effective release energies and emission characteristics of a spark-ignition engine. This gap of the inlet-port design research trend will be filled by the work presented in this paper.

2. Methodology

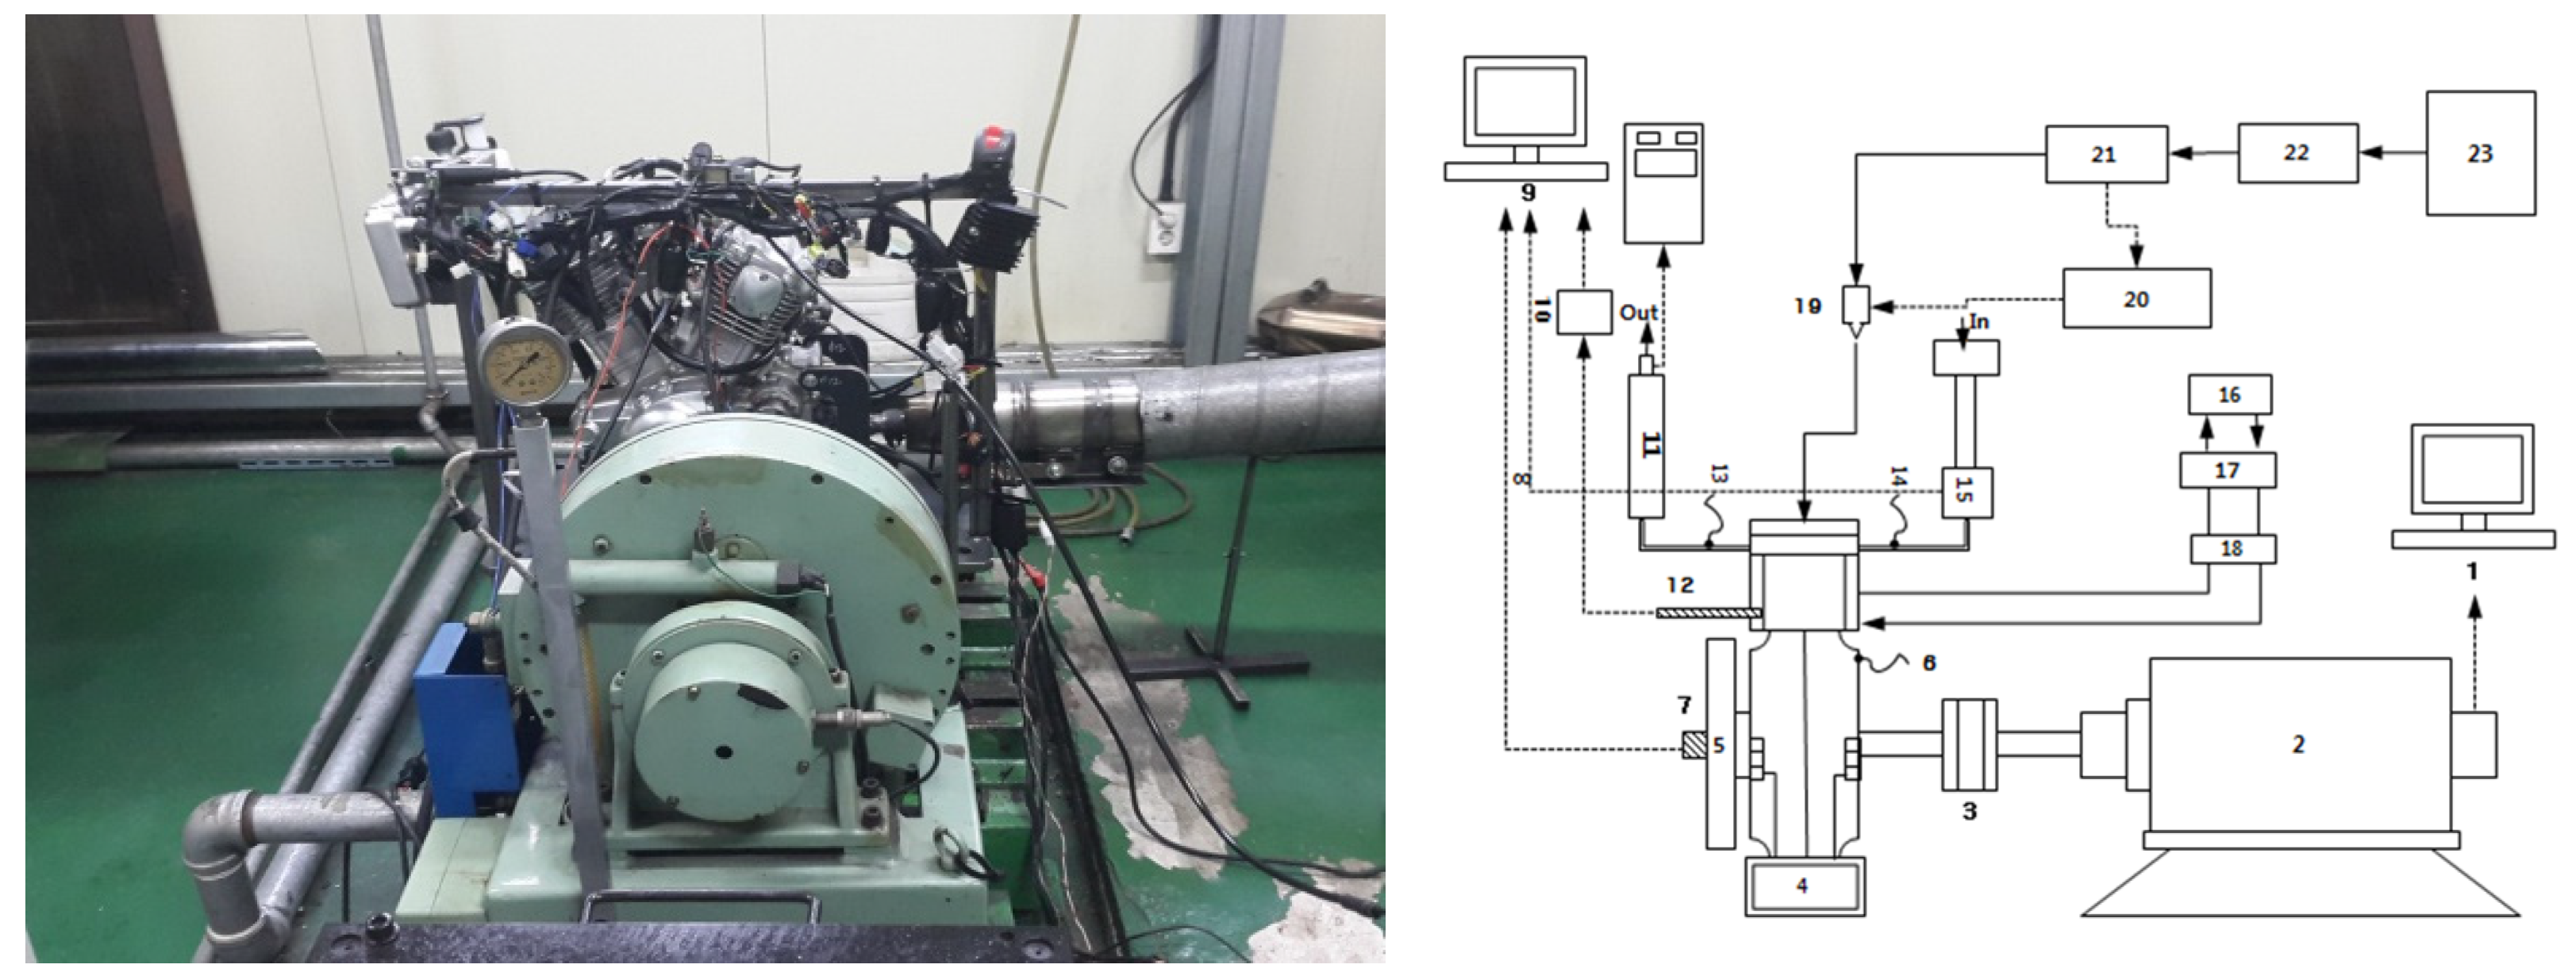
2.1. Experiment Setup

In this research, a spark-ignition engine was employed to estimate the engine performance with various testing conditions. The block diagram of the experimental system is shown in Figure 1. The engine speed was 3000–8000 rpm, and the air-fuel ratio and compression ratios were 13.6 and 11.8:1, respectively. The temperature of the intake air and engine oil was maintained at 29 and 80 °C, respectively. All of the experimental equipment is calibrated. The testing engine was at a steady state and the throttle angle was opened at 90° for all of the test engine speeds. The purpose of the experimental was to investigate the basic engine output data such as: air mass flow, ignition timing, peak temperature, peak pressure, engine torque, NOx and HC emission. The experimental output data will be used to validate the engine simulation model.

2.2. Experimental Engine

In this research, experiments were carried out on a V-twin engine. Table 1 describes the engine specifications.

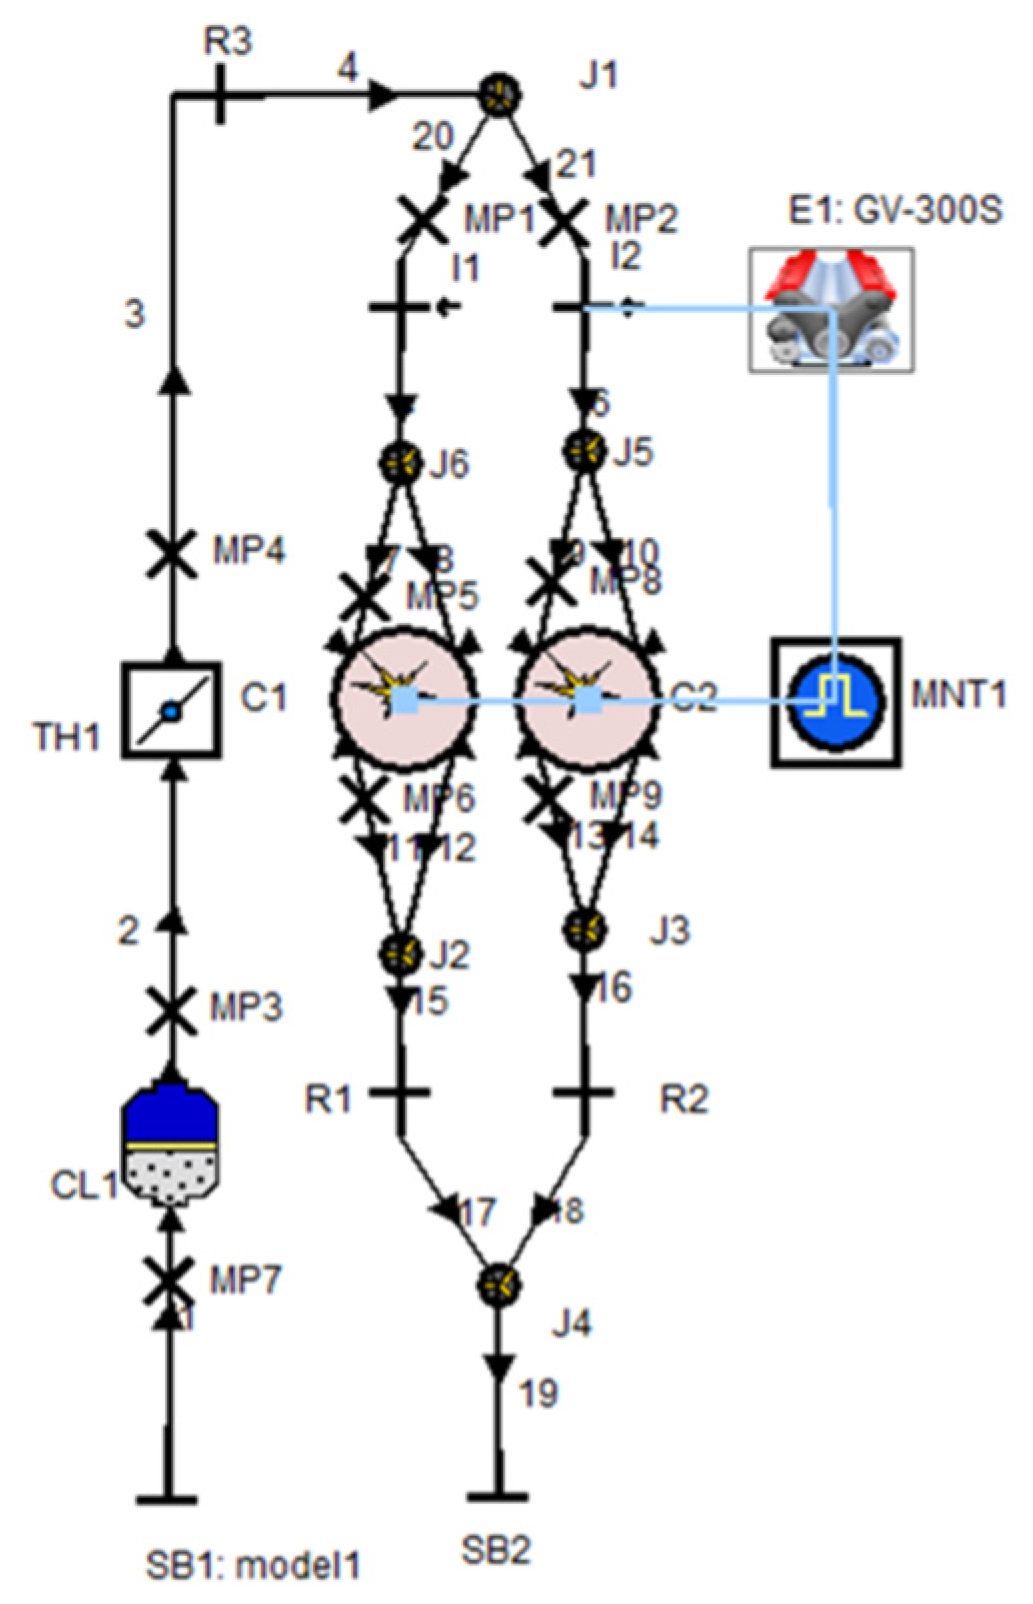
2.3. Simulation Model Setup

It is difficult to determine the ERE and ERG through the experiments due to the various IPD/B conditions. The AVL-boost software is an effective tool to determine the ERE and ERG of the combustion engine. Researchers are able to use this software to build all engine type models: SI engines [14,15], compression ignition (CI) engines [16,17], turbocharged diesel engines [18,19] and alternative fuels engine [20].
Figure 2 shows the simulation model; where—E1: engine; MNT1: monitor; SB1, SB2: system boundary; CL1: air cleaner; TH1: throttle; R1, R2, R3: restriction on the tube; J1, J2, J3, J5, J6: junction on the tube; MP1, MP2: measuring point; I1, I2: injector; C1, C2: cylinder; 1, 2, 3-21: intake and exhaust pipes. The throttle angle is open 100% throughout the simulation process. The restriction elements R1, R2, and R3 are used to investigate pressure loss on the piping system by setting measuring point elements (MP1, MP2, …) on the pipes to measure parameters of the flow in the pipes such as temperature, pressure, velocity, mass flow, etc.
Combustion model:
The heat release is calculated through Equation (1) [21]:
d x d α = α Δ α ( m + 1 ) y m . e α . y ( m + 1 )
d x = d Q h Q h ; y = α α 0 Δ α c
The mass faction burned ε:
ε = d x d α d α = 1 e α · y ( m + 1 )
Heat transfer in combustion chamber:
Q T = A · q c o e f f · ( T c T w )
The air mass flow rates:
d m d t = A e f f · P 1 . 2 R 0 T 1 · C
C = K K 1 [ ( P 2 P 1 ) 2 K ( P 2 P 1 ) K + 1 K
The N2O and NO emission production were calculated by Equations (5) and (6):
C N 2 O = 1.1802 · 10 6 · T 0.6125 · e 9471.6 T · C N 2 · P O 2
r N O = 2 · C p · C K · [ 1 λ 2 ] · r 1 1 + λ · R 1 · r 4 1 + R 2
The CO production rate was calculated by the Equation (7):
r C O = C C o n s t · ( r 1 + r 2 ) · ( 1 φ ) φ = C N O , a c t C N O , e q u
The HC emission was determined by Equation (8)
m H C = P C · V c r e v i c e · M R · T p i s t o n
Equations (9) and (10) show how the intake port diameter affects the air mass flow into the cylinder [22].
Flow coefficient (Cf):
C f = Q A s e a t · V 0
V 0 = 2 · Δ P ρ ;
A s e a t = π 4 D 2 s e a t ;
Coefficient of discharge (Cd):
C d = Q A V · V 0
A V = n · π · D 2 · L D · cos ϕ ( 1 + L D sin ϕ · cos ϕ )

3. Results and Discussion

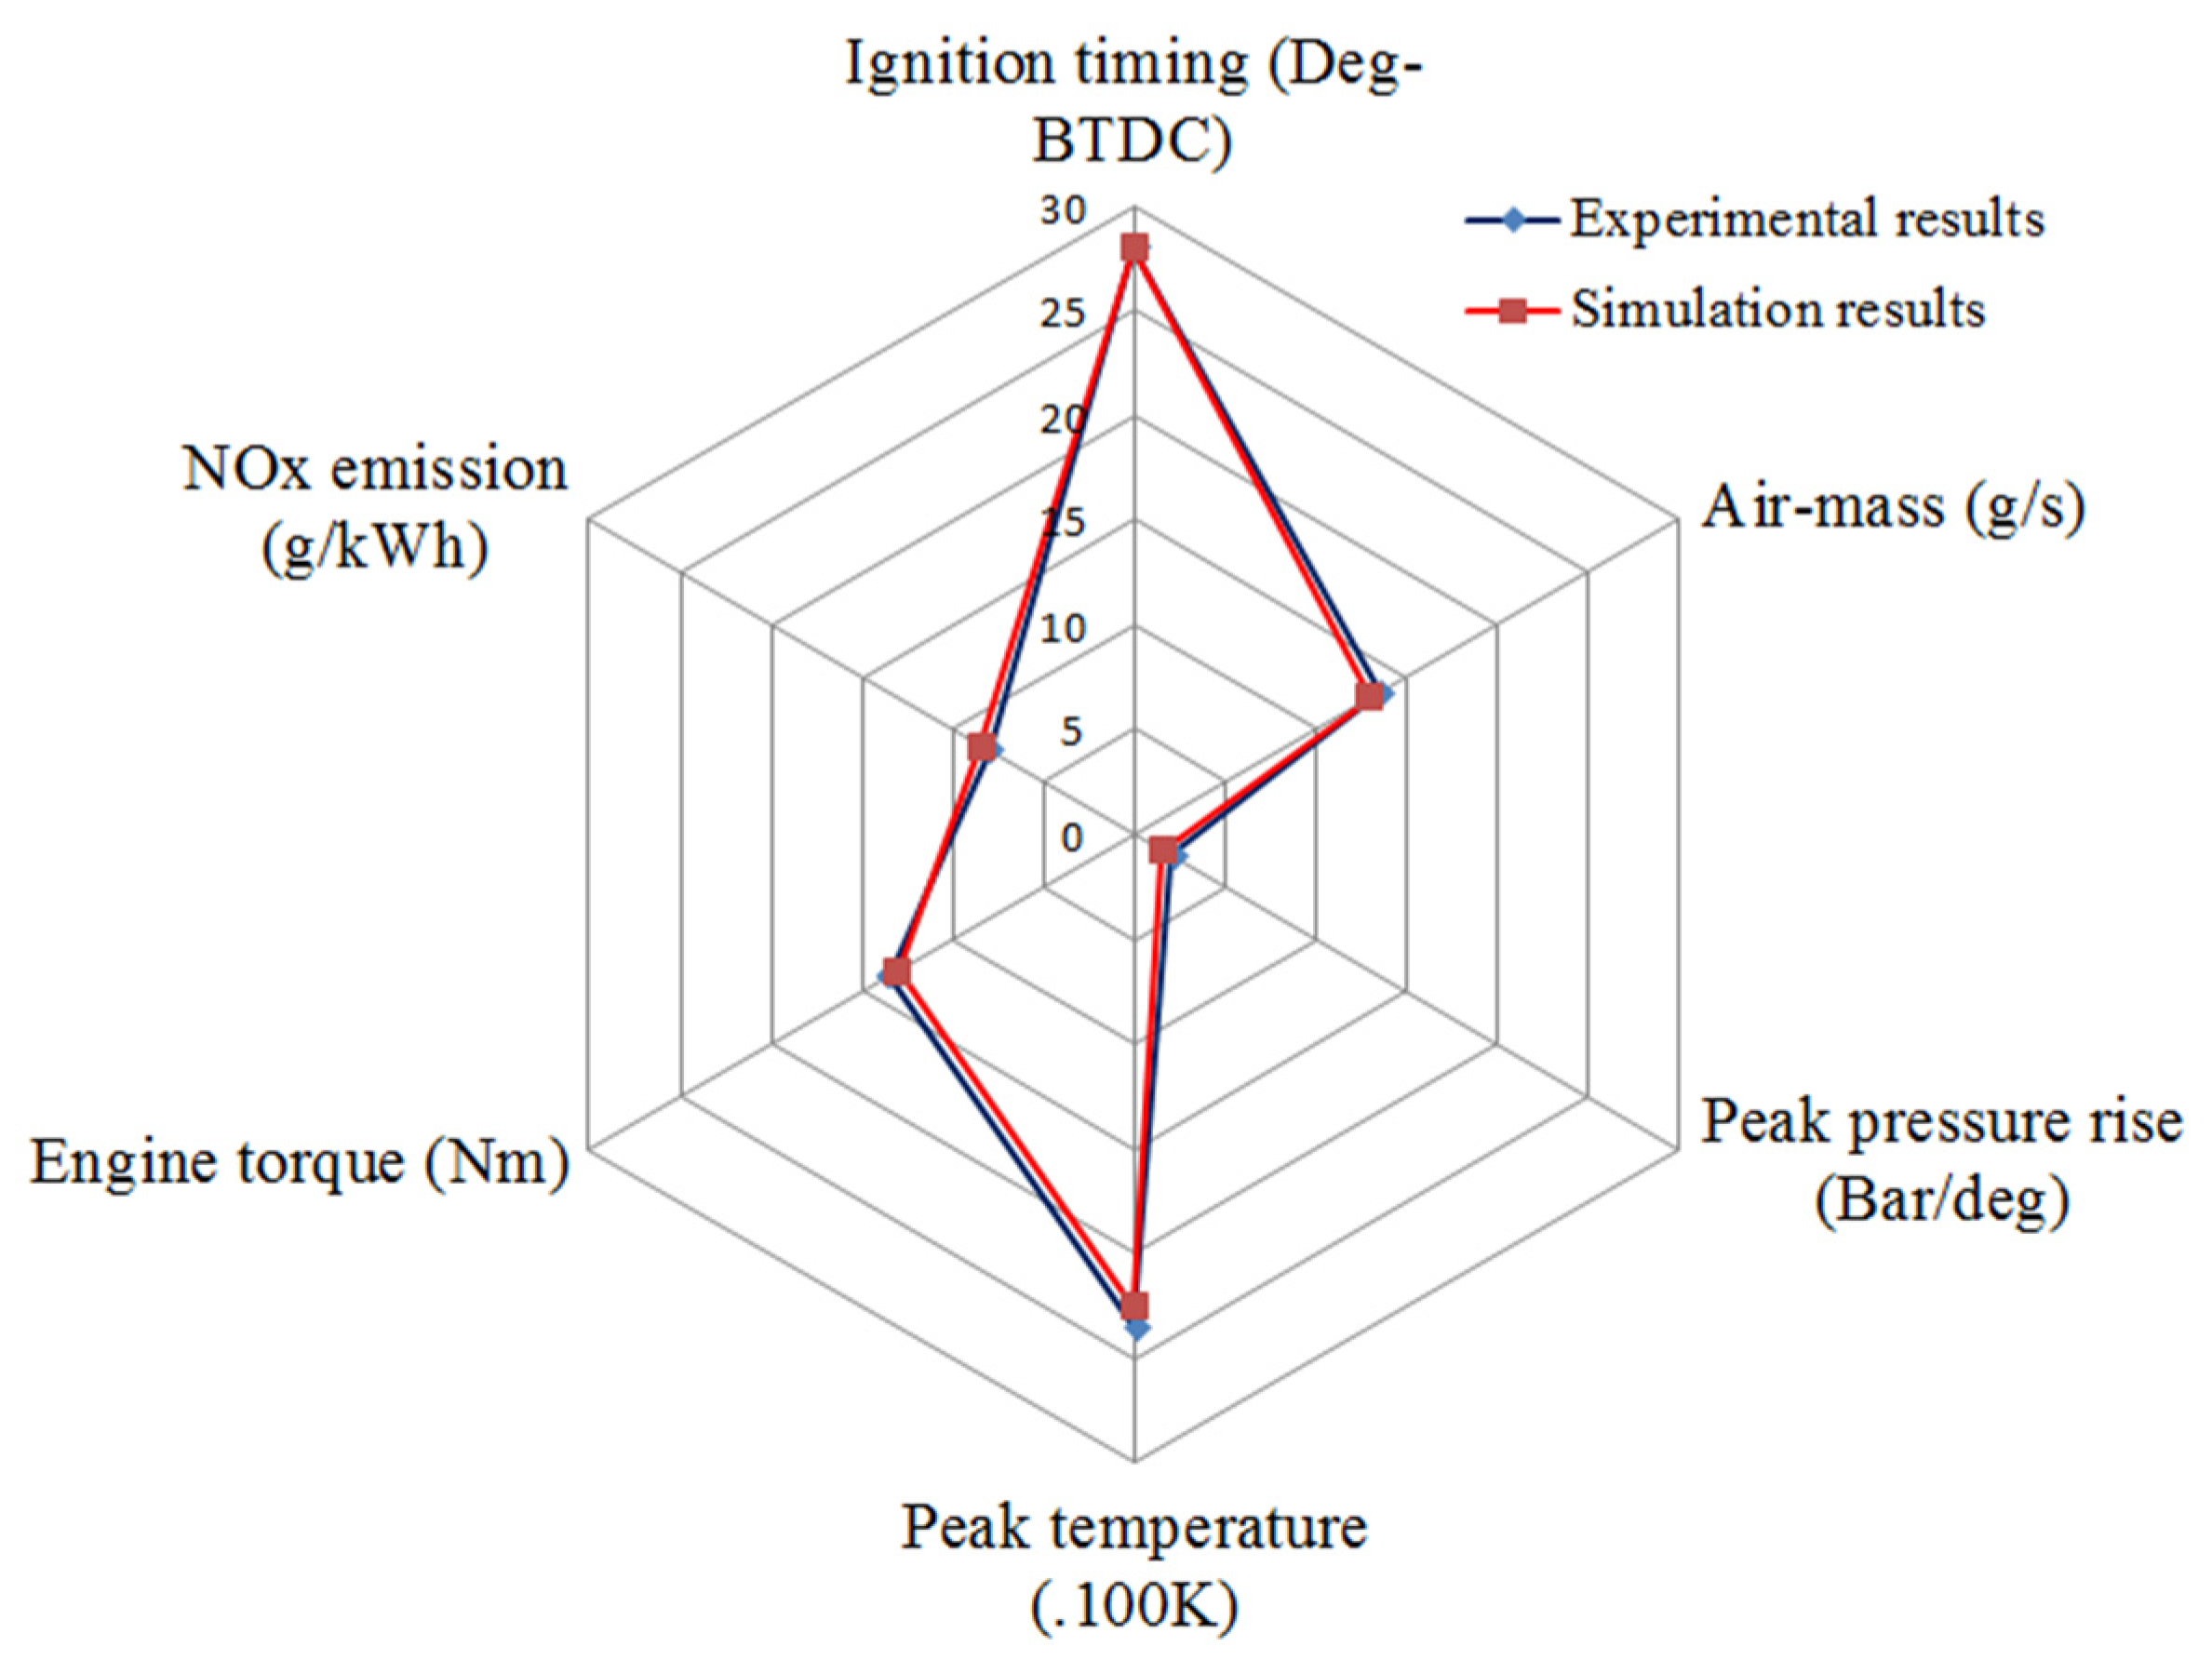
3.1. Model Validation

In this study, the basic experimental output data were used to validate the simulation model. The result of the experimental and simulation models are compared and are depicted in Figure 3. The results of the experiment are expressed by black curves; the results of the simulation are expressed by red curves.
Figure 3 represents the ignition timing in both cases for 3000 rpm engine speed. Regarding the ignition timing, the values of the experiment were very close to the values of the simulation model. Regarding the air mass flow, a comparison between the results of the experimental and simulation models is depicted. Based on the comparison between the experimental and simulation output data, the maximum reached difference was 0.9% in engine torque. The results from comparing the two cases support the simulation model: the simulation model had good accuracy in terms of predicting engine performance and in estimating the ERG and ERE.

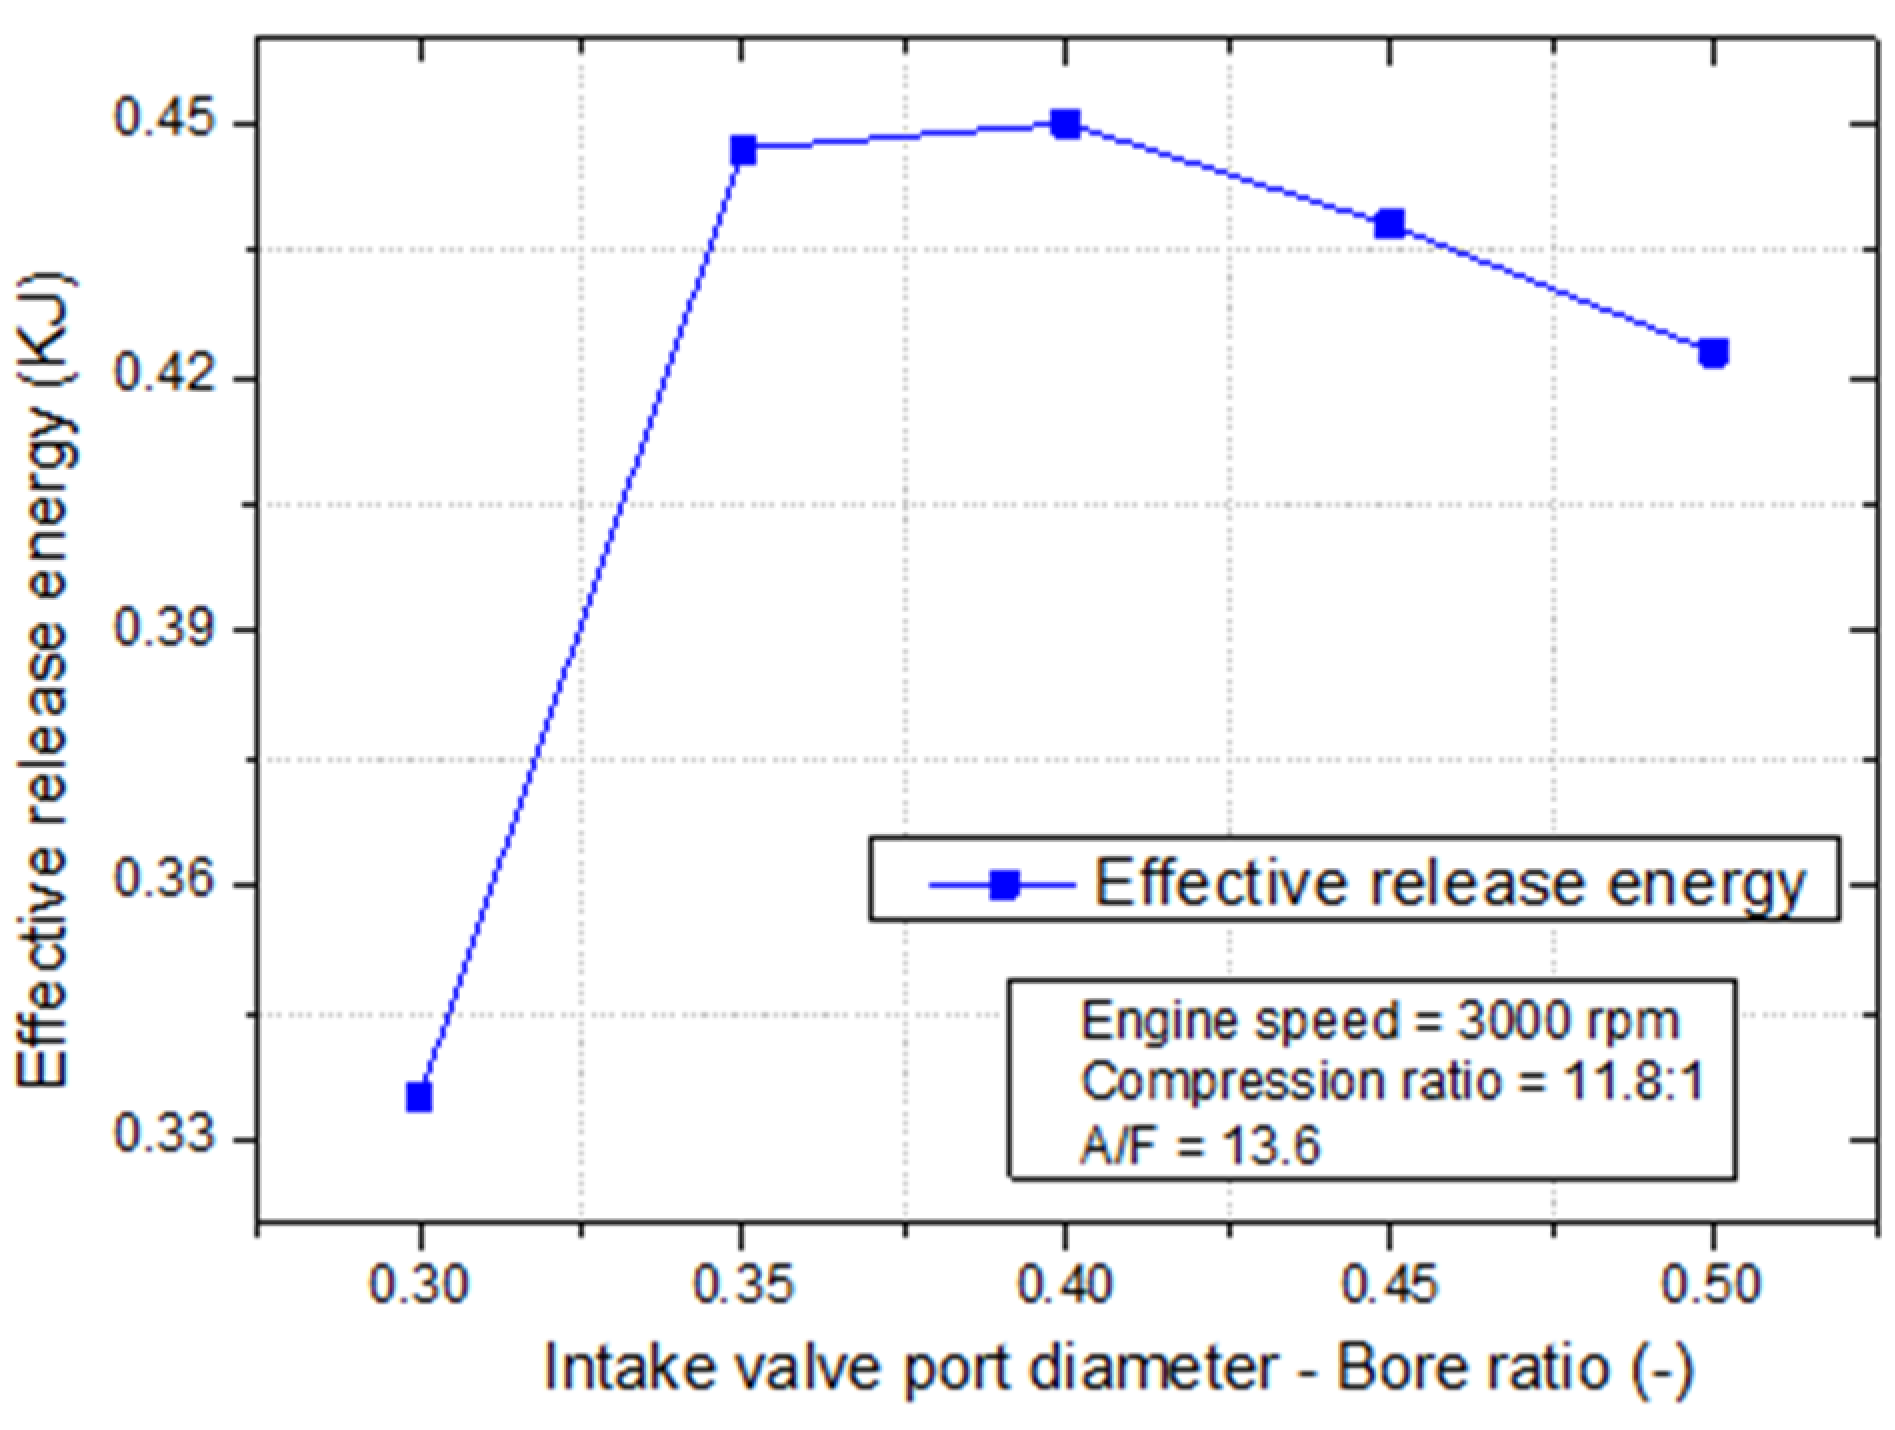
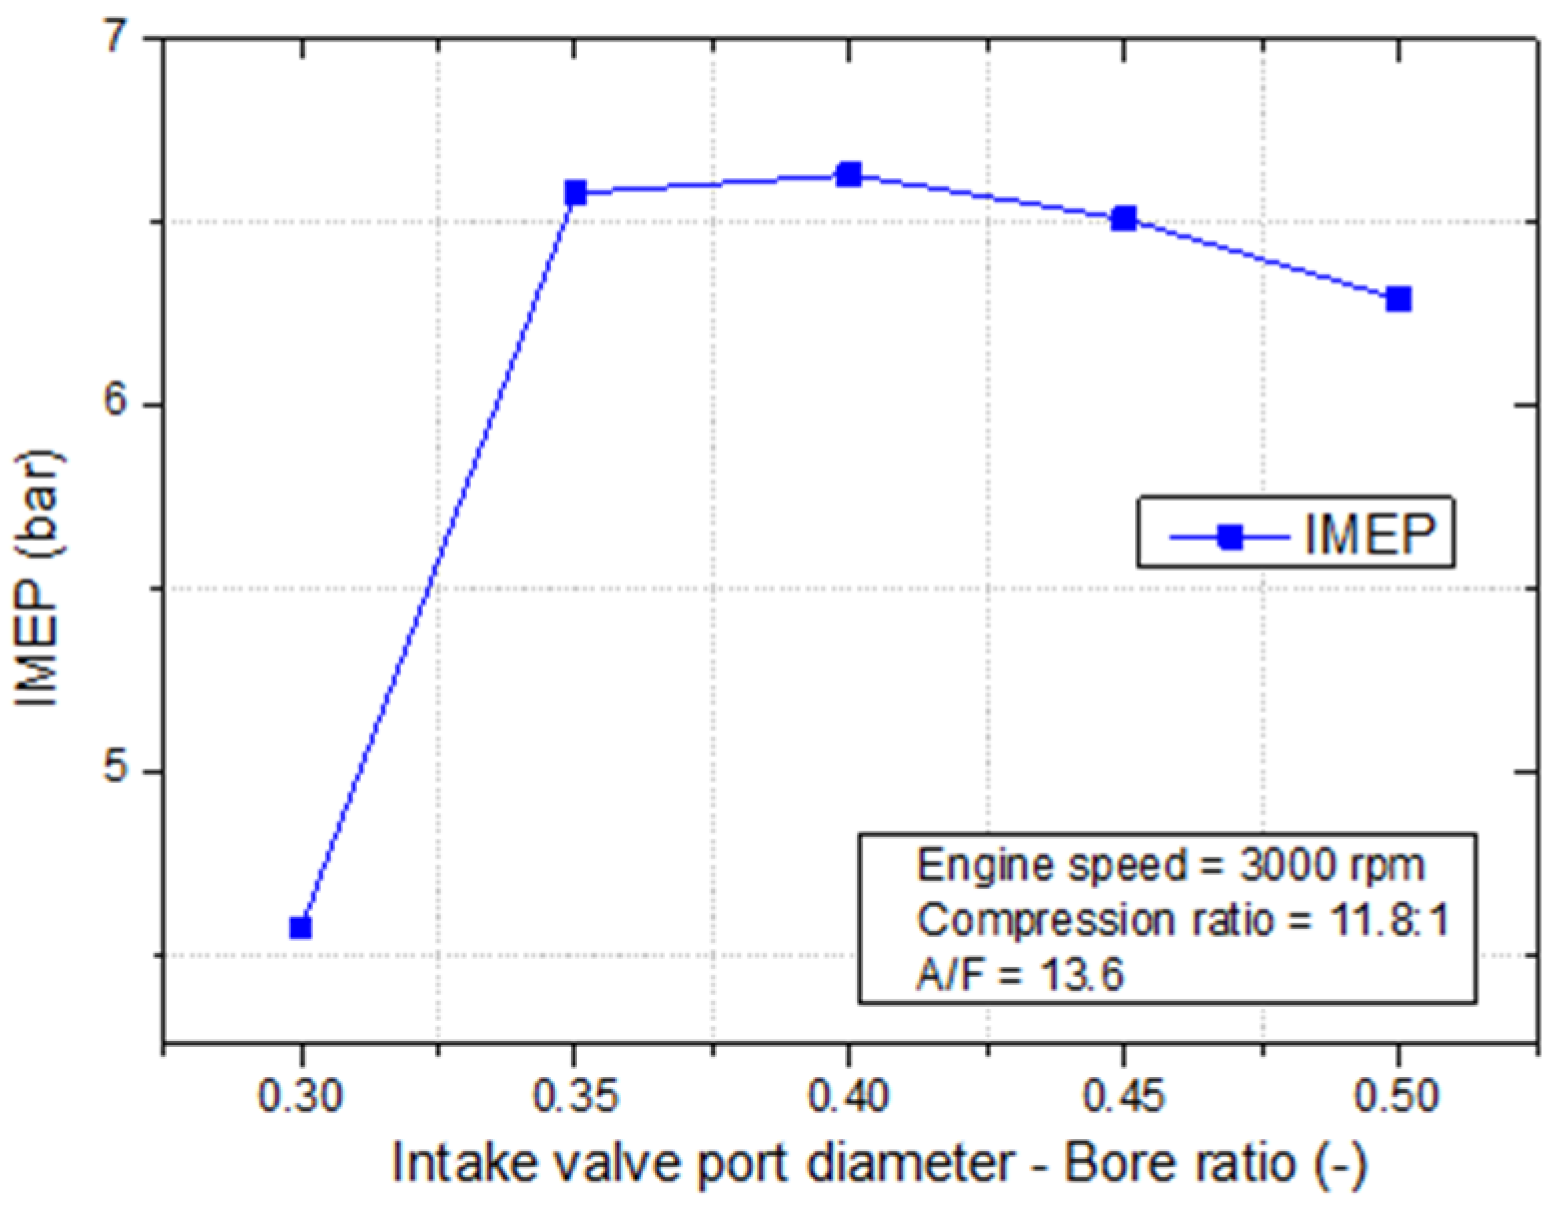
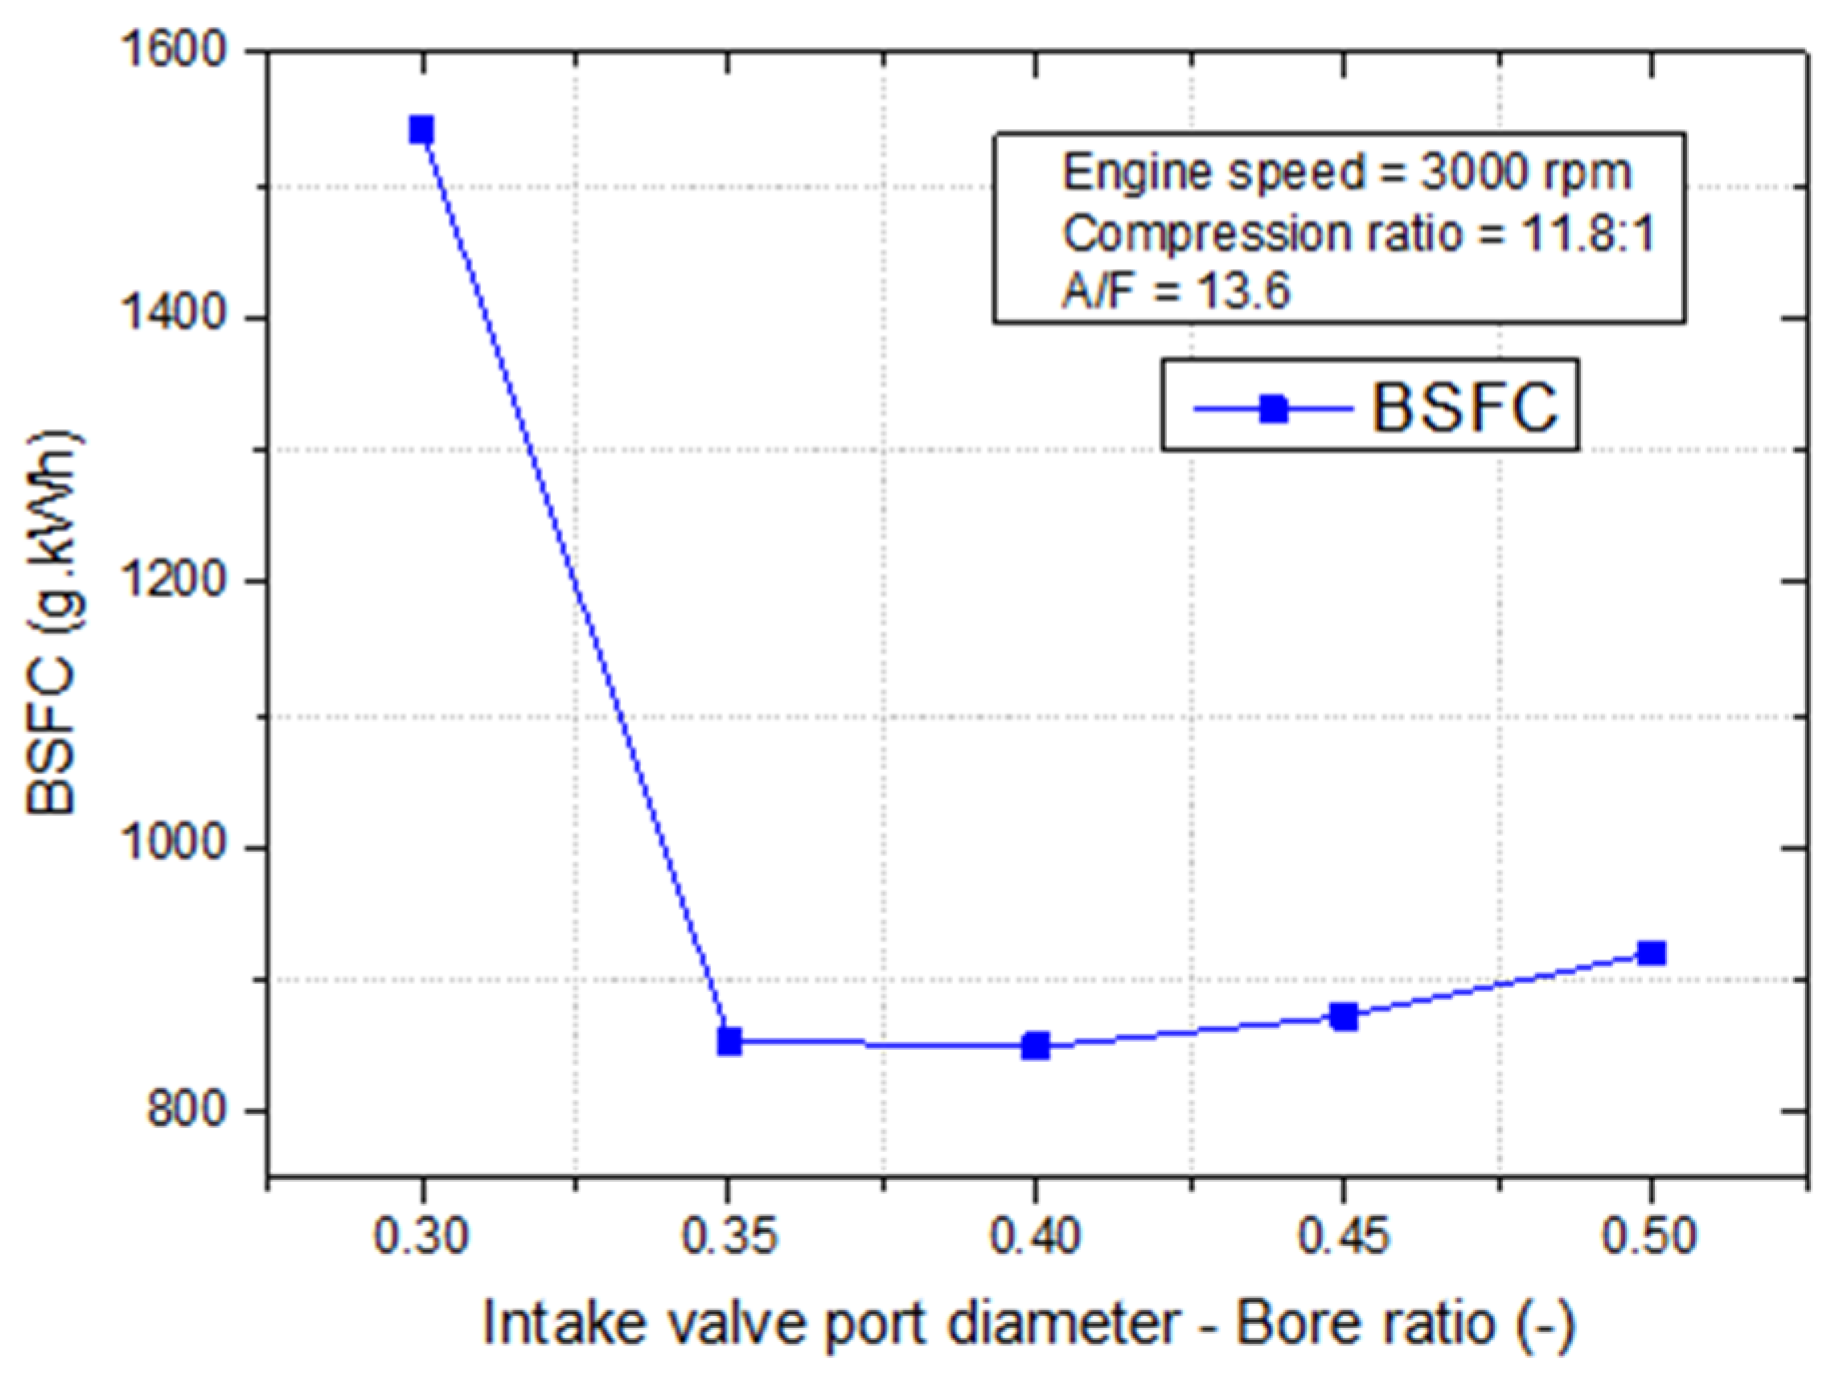
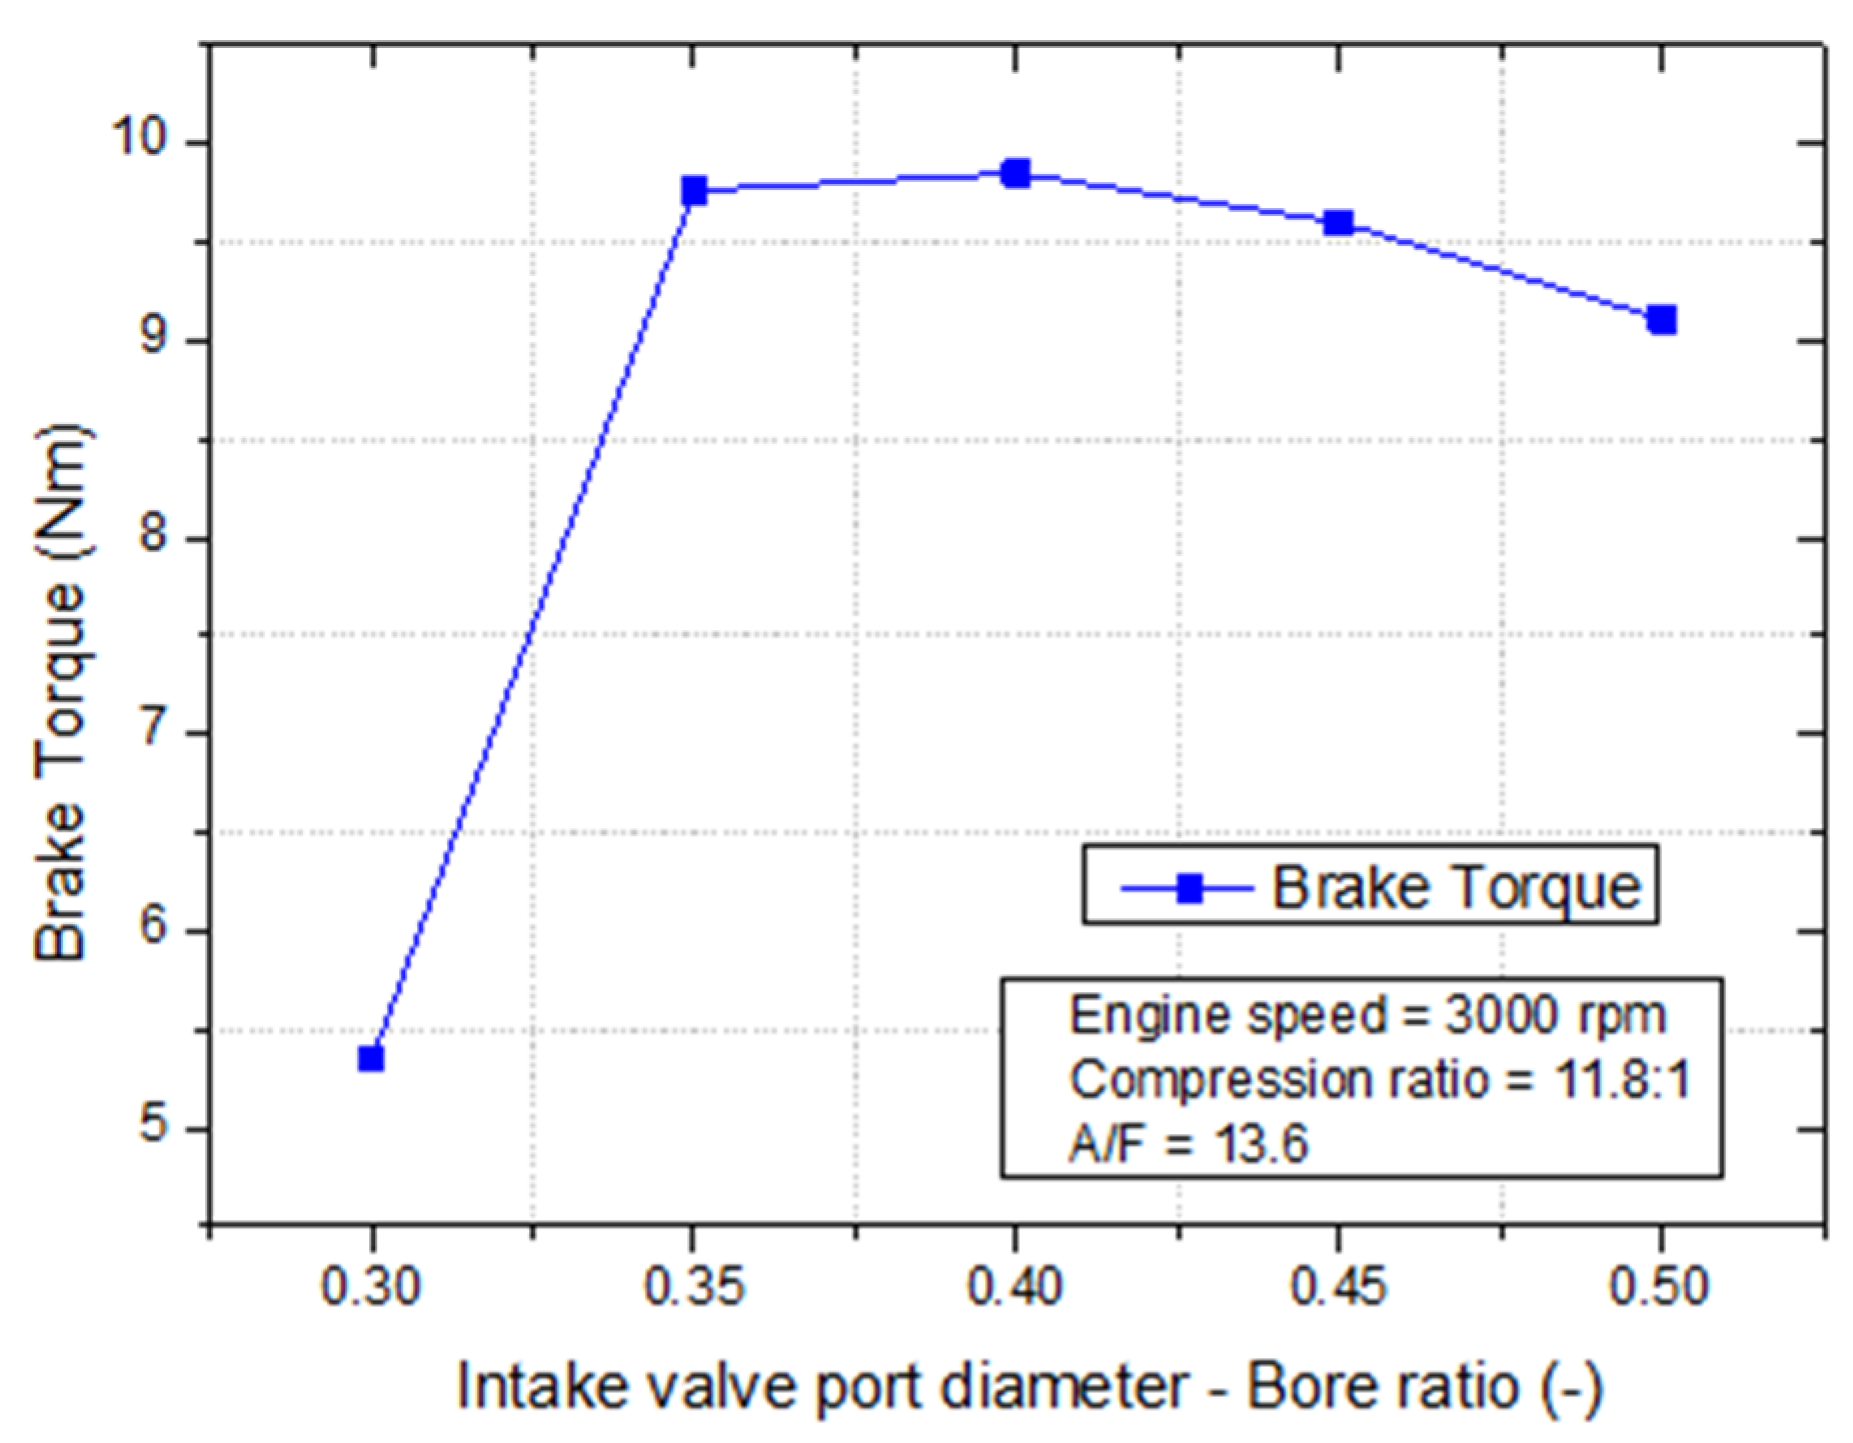
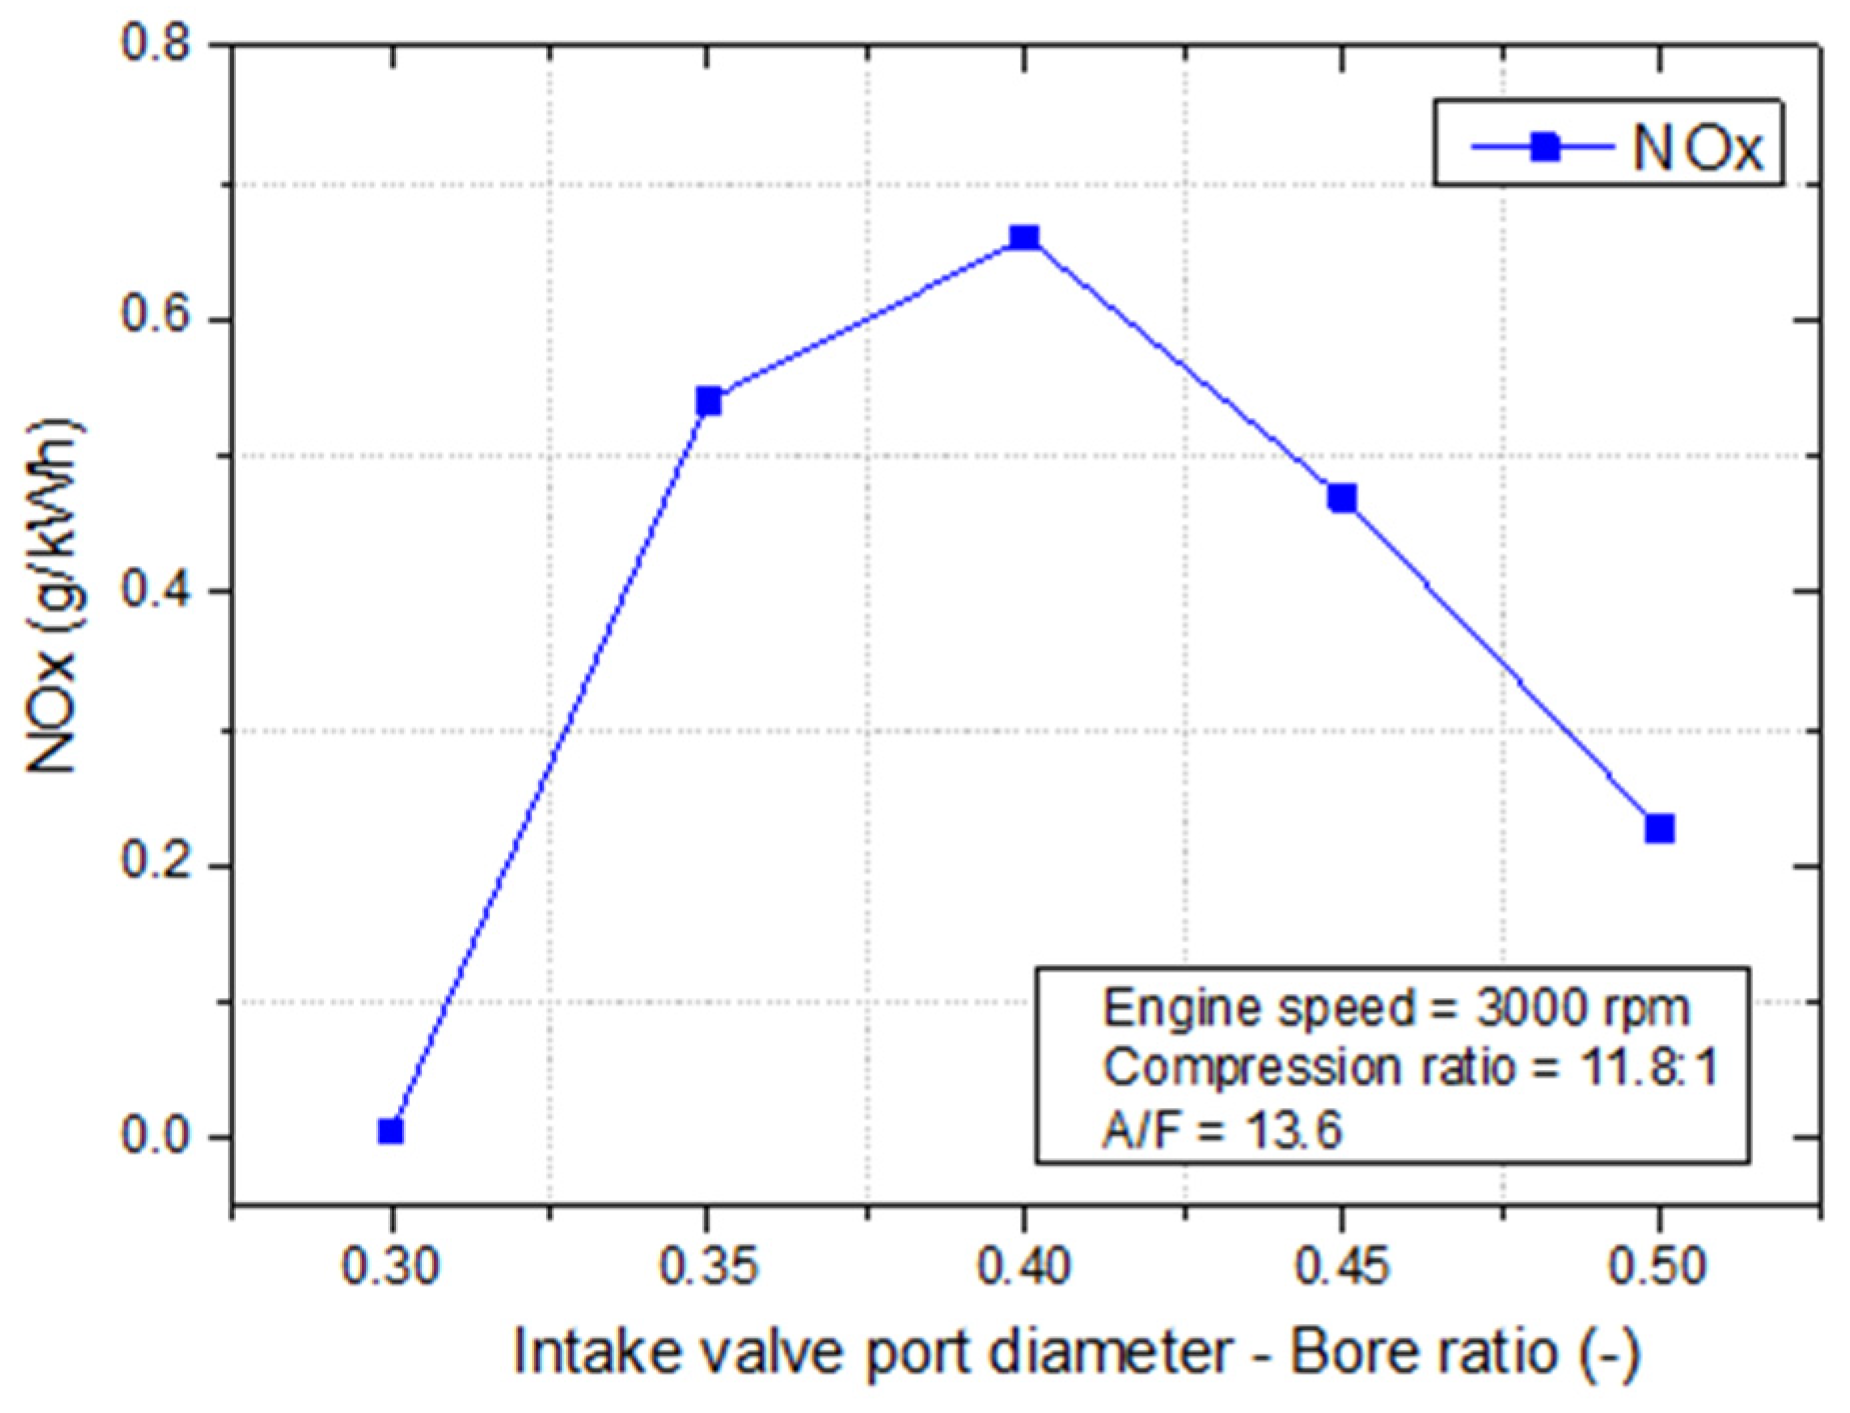
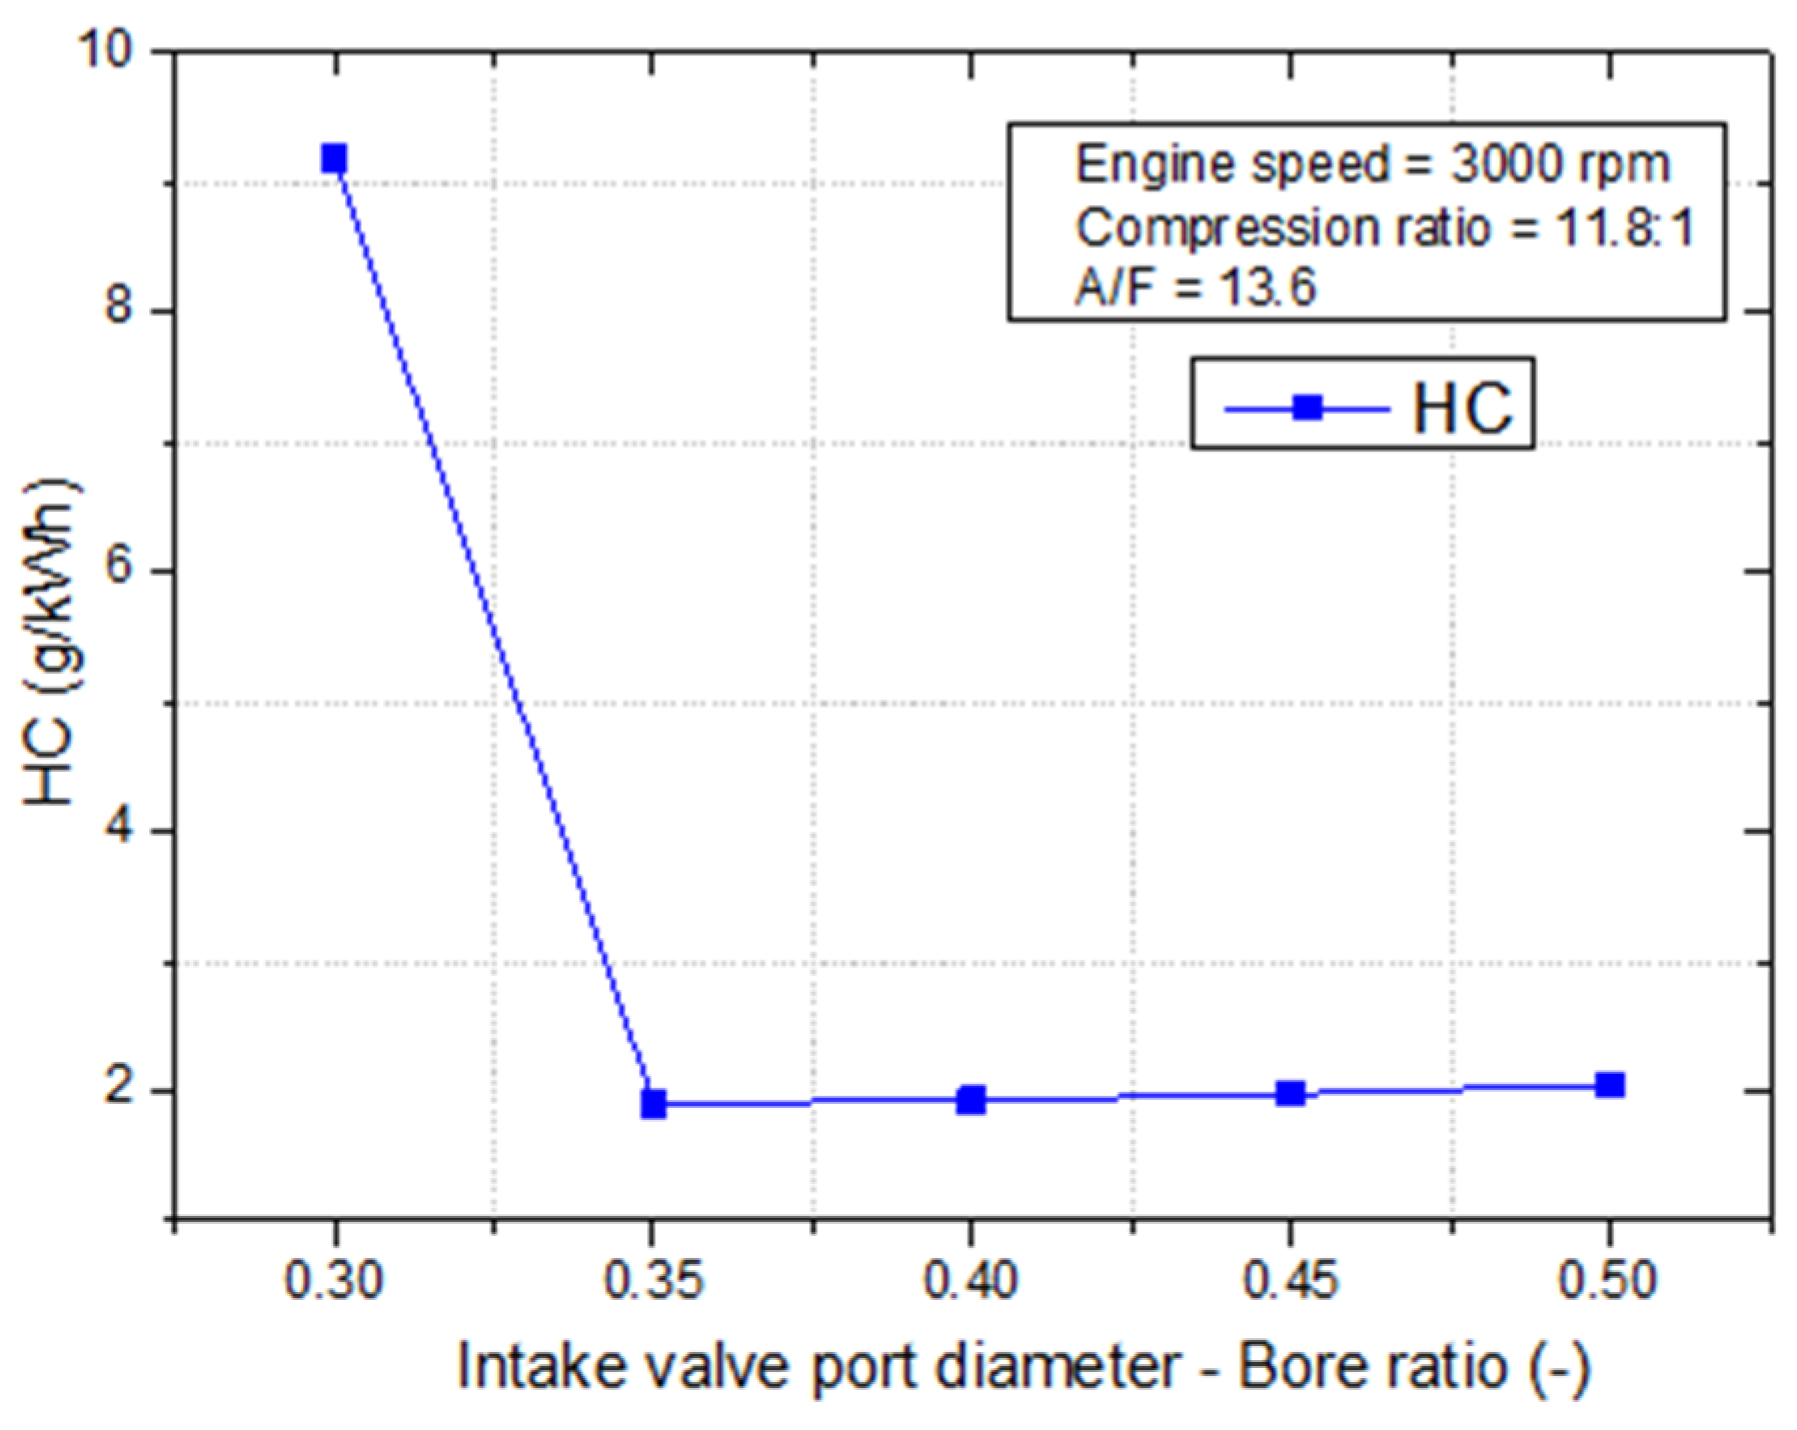
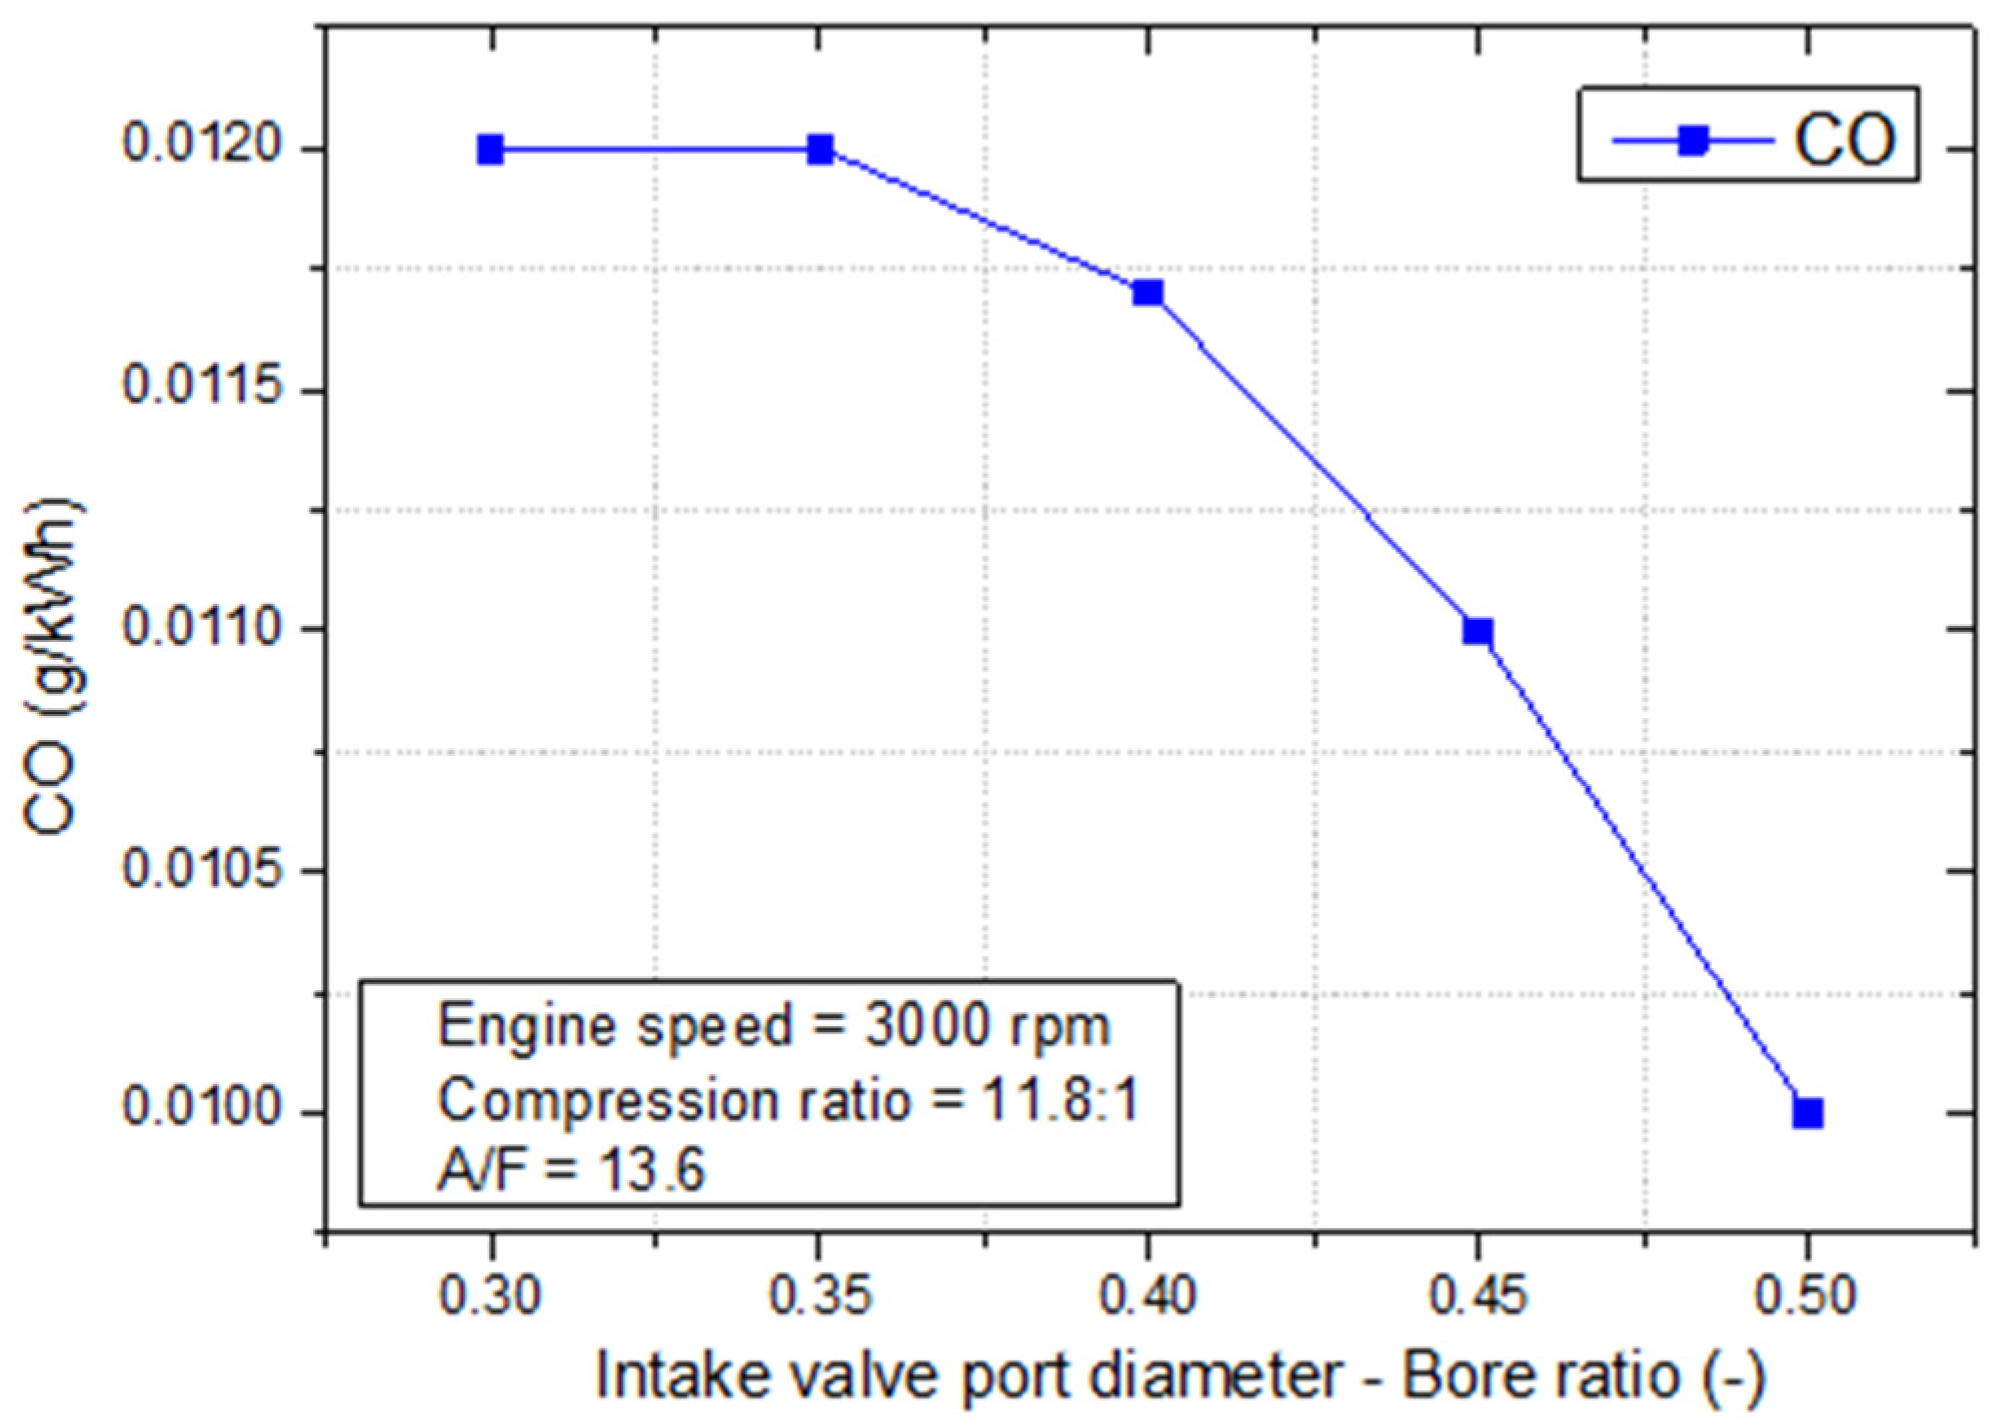
3.2. The Effect of Various IPD/B on ERE, ERG and Emission Characteristics

Figure 4 depicts the volume efficiency as a function of IPD/B ratio. A downward trend of volume efficiency can be observed when the IPD/B ratio was raised from 0.3 to 0.5. The maximum of the volume efficiency was 0.695 at an IPD/B of 0.3. This is because a bigger IPD/B causes reduction in intake air-flow acceleration and swirl ratio [9]. The decrease of intake air-flow acceleration leads to a decrease in the amount of fresh air fill into the cylinder to sweep burned gases to the outside through the exhaust port. This account also explains why the bigger IPD/B led to an increase in exhaust residual gas (Figure 5). At the 0.3 IPD/B ratio, the minimum of ERG was 0.107%.
Figure 6 and Figure 7 show that the peak firing temperature and peak pressure rise present a similar trend. With the increase of the IPD/B ratio, the peak firing temperature and peak pressure rise increase until a maximum value, and after that it decreases. This phenomena is due to the increase in IPD/B ratio that leads to a raise in the residual gas (Figure 5). A suitable amount of ERG with high temperature help increased air-fuel mixture evaporation and homogeneity to improve the thermal efficiency (Figure 8). However, when too much ERG was trapped in the combustion chamber it may cause poor combustion and happen to reduce the peak pressure and temperature in the cylinder. This explains why, as the peak firing pressure rises, the peak firing temperature and ERE decreased after achieving a maximum value. In this research, the IPD/B ratio was 0.4, the maximum value of peak firing temperature, peak pressure rise and ERE was 2047.62 K, 0.87 bar and 0.45 KJ, respectively.
The influence of IPD/B ratio on IMEP and BMEP is presented in Figure 9 and Figure 10. Because the IMEP was influence by cylinder pressure (Equation (11)), a similar moving trend of cylinder pressure, IMEP, BMEP and ERE are presented.
I M E P = 1 V D P c . d V
At 0.4 IPD/B ratio, the engine shows the maximum value of IMEP and BMEP is 6.63 bar and 4.5 bar respectively.
Smaller specific fuel consumption (BSFC) value with bigger IPD/B values can be observed in Figure 11. The influence of BMEP on BSFC is described in Equation (12):
B S F C = m a i r · n c · 2.16 · 10 9 A F R · B M E P · V D · n
The opposite trends of BMEP and BSFC are observed in Figure 10 and Figure 11. The minimum BSFC (849.5 g/kWh) is at the 0.4 IPD/B ratio. It can be seen that, as the IPD/B ratio value is smaller than 0.35 the missing firing occurred, and because of this the bands of IPD/B ratio, BSFC value, and HC emission were high and the NOx emission was almost zero (Figure 12). So, if the IPD/B ratio values are smaller than 0.35 it is an engine operation condition.
The same moving trend of BMEP and engine torque is presented in Figure 10 and Figure 12. This also is proved through Equation (13).
T e f f = B M E P · V D k c y c l e · π
Figure 12 shows that at 0.4 IPD/B ratios, 9.85 Nm is the maximum value of engine torque.
The NOx formation is strong depending on the peak temperature in the combustion chamber, because the increase of peak temperature ranges from 1647.62 to 2047.62 K, and after that decreases to 1951.22 K. As a result, the NOx emission tends to increase until achieving a maximum value of 0.66 g/kWh, and after that decrease even the IPD/B ratio was still increasing (Figure 13).
Figure 14 shows that with an IPD/B ratio smaller than 0.35, high HC emission was observed because of the occurrence of poor combustion. In contrast, with an IPD/B ratio bigger than 0.35, the HC emission increased slightly. This is because a higher ERG hindered the air-fuel flow into the cylinder such that there was lack of oxygen for complete combustion of the HC. The increase of the HC emission also led to a decrease in CO emission, as observed in Figure 15.

4. Conclusions

The results of this research can be summarized as:
(1) The IPD/B ratio has a large effect on the ERG, ERE and emission characteristics. With the increase from 0.3 to 0.5 of the IPD/B ratio, the ERG increases 27.3% and the ERE increases from 0.33 KJ to 0.45 KJ.
(2) The ERG also gets affected on ERE. If the ERG increases, then the ERE was decreased.
(3) The peak temperature and peak rise increase until a max-value is achieved before the downward trend can be observed. This max-values were 2047.62 K and 0.87 bar, respectively.
(4) The optimal values of ERE and BSFC were achieved at the same ratio value of 0.4 IPD/B. At this IPD/B ratio value, the maximum ERE was 0.45 KJ and the minimum BSFC was 849.5 g/kWh.
(5) The research results show that: the engine does not operate well with IPD/B ratio values smaller than 0.35, because poor combustion potentially occurs in this band of IPD/B ratios.
(6) The NOx formation tends to increase until a maximum-value of 0.66 g/kWh, after which it decreases even as the IPD/B ratio is still increasing. With the IPD/B ratio smaller than 0.35, the high HC emission was presented. In contrast, with an IPD/B ratio bigger than 0.35, the HC emission slightly increased. The CO emission had a downturn with the increase of IPD/B ratio.

Author Contributions

Conceptualization, N.X.K.; methodology, N.X.K.; software, N.X.K.; validation, N.X.K.; resources, N.X.K.; writing—original draft preparation, N.X.K.; writing—review and editing, N.X.K.; supervision, O.L.; project administration, O.L.; All authors have read and agreed to the published version of the manuscript.

Funding

This research is financially supported by the individual basic research project by the National Research Foundation of Korea (NRF-2021R1F1A1048238, Reliability Improvement of Ammonia-Diesel Dual-Fuel Combustion Model regarding Optimized Combustion Strategy for Improved Combustion Efficiency and Emission Characteristics).
This research is financially supported by the Shipbuilding and Offshore Industry Core Technology Development Business by the Ministry of Trade, Industry and Energy (MOTIE, Korea) [Development of Low Print Point Alternative Fuel Injection System for Small and Medium Vessel Engines for Ships Hazardous Emission Reduce]. (20013146).

Institutional Review Board Statement

Not applicable.

Informed Consent Statement

Not applicable.

Data Availability Statement

Not applicable.

Conflicts of Interest

The authors declare no conflict of interest.

Nomenclature

ERGExhaust residual gas KThe ratio of specific heat;
EREEffective release energyCpDenotes post processing multiplier;
Teff Engine effective torque, NmCKDenotes kinetic multiplier;
KcylceSimulation cycle paremeter, cylceriDemotes reaction rates (mole/cm3s);
Qh The total fuel heat input (W);mHCThe mass of unburned charge in the crevices (kg);
α The crank angle (deg);PcThe cylinder pressure (Pa);
α0 The start of combustion (deg);VcreviceThe total crevice volume (m3);
Δ α c The combustion duration (deg);MThe unburned molecular weight (kg/kmol);
m The shape parameter (-);TpistonThe piston temperature (K);
a The Vibe parameter (-)θ Cam angle, deg
QT The heat lost to the wall (W/m2);CdCoefficient of discharge
A The total surface area of the cylinder head, piston, QMeasured volume flow rate, m3/sec
qcoeff The heat transfer coefficient (W/m2 K);AseatInner seat area, m2
Tc The combustion gas temperature (K);Av Orifice are between valve head and seat, m2
Tw The wall temperature of the cylinder (K);VDDisplaced volume, m3
d m d t The air mass flow rate;CfFlow coefficient
Aeff The effective flow area (-);V0Velocity dead, m /s
P1 The upstream stagnation pressure (Pa);DseatIntake valve seat diameter, m.
T1 The upstream stagnation temperature (K);LValve lift, m
R0The gas constant (J/kg.K);φ Valve seat angle, deg
P2The downstream static pressure (Pa);

References

  1. Belgiorno, G.; Boscolo, A.; Dileo, G.; Numidi, F.; Pesce, F.C.; Vassallo, A.; Ianniello, R.; Beatrice, C.; Di Blasio, G. Experimental Study of Additive-Manufacturing-Enabled Innovative Diesel Combustion Bowl Features for Achieving Ultra-Low Emissions and High Efficiency. SAE Int. J. Adv. Curr. Pr. Mobil. 2021, 3, 672–684. [Google Scholar] [CrossRef]
  2. Di Blasio, G.; Vassallo, A.; Pesce, F.C.; Beatrice, C.; Belgiorno, G.; Avolio, G. The Key Role of Advanced, Flexible Fuel Injection Systems to Match the Future CO2 Targets in an Ultra-Light Mid-Size Diesel Engine. SAE Int. J. Engines 2019, 12, 129–144. [Google Scholar] [CrossRef]
  3. Cinar, C.; Uyumaz, A.; Solmaz, H.; Topgul, T. Effects of valve lift on the combustion and emissions of a HCCI gasoline engine. Energy Convers. Manag. 2015, 94, 159–168. [Google Scholar] [CrossRef]
  4. Suhaimi, S.; Mamat, R.; Abdullah, N.R. Investigation of the effects of inlet system configuration on the airflow characteristics. IOP Conf. Ser. Mater. Sci. Eng. 2013, 50, 012009. [Google Scholar] [CrossRef] [Green Version]
  5. Khoa, N.X.; Lim, O. The effects of combustion duration on residual gas, effective release energy, engine power and engine emissions characteristics of the motorcycle engine. Appl. Energy 2019, 248, 54–63. [Google Scholar] [CrossRef]
  6. Jung, D.; Iida, N. An investigation of multiple spark discharge using multi-coil ignition system for improving thermal efficiency of lean SI engine operation. Appl. Energy 2018, 212, 322–332. [Google Scholar] [CrossRef]
  7. Li, B.; He, Y.-P.; Qian, Z.-Y.; Hu, J.; Zheng, H.; Ma, J.; Fang, Y.; Lin, Q. Research on performance matching of intake and exhaust ports of marine medium speed dual fuel engine. Energy Rep. 2021, 7 (Suppl. 1), 72–83. [Google Scholar] [CrossRef]
  8. Zhang, Y.; Zhao, H.; Xie, H.; He, B.-Q. Variable-valve-actuation-enabled high-efficiency gasoline engine. J. Automob. Eng. 2010, 224, 1081–1095. [Google Scholar] [CrossRef]
  9. Nora, M.D.; Lanzanova, T.D.M.; Zhao, H. Effects of valve timing, valve lift and exhaust backpressure on performance and gas exchanging of a two-stroke GDI engine with overhead valves. Energy Convers. Manag. 2016, 123, 71–83. [Google Scholar] [CrossRef] [Green Version]
  10. Kim, Y.; Han, Y.; Lee, K. A study on the effects of the intake port configurations on the swirl flow generated in a small D.I. diesel engine. J. Therm. Sci. 2014, 23, 297–306. [Google Scholar] [CrossRef]
  11. Raghu, M.; Mehta, P.S. Influence of intake port design on diesel engine air motion characteristics. Indian J. Eng. Mater. Sci. 1999, 6, 53–58. [Google Scholar]
  12. Yasar, A.; Sahin, B.; Akilli, H.; Aydin, K. Effect of inlet port on the flow in the cylinder of an internal combustion engine. Proc. Inst. Mech. Eng. Part C: J. Mech. Eng. Sci. 2006, 220, 73–82. [Google Scholar] [CrossRef]
  13. Qi, Y.L.; Dong, L.C.; Liu, H.; Puzinauskas, P.V.; Midkiff, K.C. Optimization of intake port design for SI engine. Int. J. Automot. Technol. 2012, 13, 861–872. [Google Scholar] [CrossRef]
  14. Latheesh, V.M.; Parthasarathy, P.; Baskaran, V.; Karthikeyan, S. Design and CFD analysis of intake port and exhaust port for a 4 valve cylinder head engine. IOP Conf. Series: Mater. Sci. Eng. 2018, 310, 012122. [Google Scholar] [CrossRef]
  15. Khoa, N.X.; Nhu, Y.Q.; Lim, O. Estimation of parameters affected in internal exhaust residual gases recirculation and the influence of exhaust residual gas on performance and emission of a spark ignition engine. Appl. Energy 2020, 278, 115699. [Google Scholar] [CrossRef]
  16. Falfari, S.; Bianchi, G.M.; Cazzoli, G.; Forte, C.; Negro, S. Basics on Water Injection Process for Gasoline Engines. Energy Procedia 2018, 148, 50–57. [Google Scholar] [CrossRef]
  17. Petranović, Z.; Sjerić, M.; Taritaš, I.; Vujanović, M.; Kozarac, D. Study of advanced engine operating strategies on a turbocharged diesel engine by using coupled numerical approaches. Energy Convers. Manag. 2018, 171, 1–11. [Google Scholar] [CrossRef]
  18. Teo, A.; Chiong, M.; Yang, M.; Romagnoli, A.; Martinez-Botas, R.; Rajoo, S. Performance evaluation of low-pressure turbine, turbo-compounding and air-Brayton cycle as engine waste heat recovery method. J. Energy 2019, 166, 895–907. [Google Scholar] [CrossRef]
  19. Rubio, J.A.P.; Vera-García, F.; Grau, J.H.; Cámara, J.M.; Hernandez, D.A. Marine diesel engine failure simulator based on thermodynamic model. Appl. Therm. Eng. 2018, 144, 982–995. [Google Scholar] [CrossRef]
  20. Melaika, M.; Rimkus, A.; Vipartas, T. Air Restrictor and Turbocharger Influence for the Formula Student Engine Performance. Procedia Eng. 2017, 187, 402–407. [Google Scholar] [CrossRef]
  21. Khoa, N.X.; Lim, O.T. Effective release energy, residual gas, and engine emission characteristics of a V-twin engine with various exhaust valve closing timings. J. Mech. Sci. Technol. 2020, 34, 477–488. [Google Scholar] [CrossRef]
  22. Praptijanto, A.; Muharam, A.; Nur, A.; Putrasari, Y. Effect of ethanol percentage for diesel engine performance using virtual engine simulation tool. Energy Procedia 2015, 68, 345–354. [Google Scholar] [CrossRef] [Green Version]
Figure 1. Experimental system setup: 1—dynamometer controller; 2—AVL dynamometer (AVL AG150, 150 kW); 3—coupling; 4—engine (V-twin engine); 5—fly wheel; 6—oil thermocouple; 7—encoder (E40S8-1800-3-T-24); 8—output signal; 9—Horiba combustion analyzer (MEXA-7100DEGR); 10—amplifier; 11—exhaust plenum; 12—pressure transducer; 13—exhaust thermocouple (L36C-18-8G1); 14—intake thermocouple; 15—throttle (89452-22090); 16—oil; 17—pump; 18—filter; 19—injector (16450-C12-235); 20—injector controller; 21—fuel pump; 22—flow meter; 23—fuel tank.
Energies 14 03773 g001
Figure 2. Simulation model.
Energies 14 03773 g002
Figure 3. Model validation.
Energies 14 03773 g003
Figure 4. Volume efficiency versus IPD/B.
Energies 14 03773 g004
Figure 5. Residual gas versus IPD/B.
Energies 14 03773 g005
Figure 6. Peak temperature versus IPD/B.
Energies 14 03773 g006
Figure 7. Pressure rise versus IPD/B.
Energies 14 03773 g007
Figure 8. ERE versus IPD/B.
Energies 14 03773 g008
Figure 9. IMEP versus IPD/B.
Energies 14 03773 g009
Figure 10. BMEP versus IPD/B.
Energies 14 03773 g010
Figure 11. BSFC versus IPD/B.
Energies 14 03773 g011
Figure 12. Brake torque versus IPD/B.
Energies 14 03773 g012
Figure 13. NOx trend versus IPD/B.
Energies 14 03773 g013
Figure 14. HC trend versus IPD/B.
Energies 14 03773 g014
Figure 15. CO trend versus IPD/B.
Energies 14 03773 g015
Table 1. Engine specifications.
ParameterUnitValue
Engine model-Four stroke, Spark ignition
Number of cylinder-2(V-Twin)
Compression ratio-11.8:1
Boremm57
Strokemm53.8
Connecting rodmm107.9
Intake valve-2
Exhaust valve-2
Cooling system-Air cooled
Publisher’s Note: MDPI stays neutral with regard to jurisdictional claims in published maps and institutional affiliations.

