1. Introduction
Despite enhanced efforts to increase energy access in sub-Saharan Africa (SSA) and an estimated overall investment of over
$1.4 bn for off-grid electrification in the global South [
1], the number of people without access to electricity in the region has remained largely unchanged [
2]. This means that around 600 million people still lack access to energy in SSA. Over 80% of the people without electricity access living in rural areas [
3]. Decentralised renewable energy (RE) systems such as solar PV mini-grids (MGs) are considered to be central solutions to enhance access to clean energy in rural SSA [
4] and are estimated to provide connections to 75% of the rural SSA population in a universal energy access scenario by 2030. This scenario translates into roughly 100 to 120 million additional MG household connections, or around 350,000 MGs to be implemented within the next decade [
3]. Consequently, questions related to the planning and implementation of RE MGs and their sustainability dimensions have gained substantial public and academic interest [
5,
6] resulting in two conflicting major overall findings. The first is that RE MGs have the potential to significantly contribute to the achievement of the Sustainable Development Goals (SDGs) in rural SSA. The second is that they face substantial sustainability challenges which hamper their widespread adoption and market-take-off [
7] in many rural areas. Hence, the significant capital investment and scaling of RE systems that might cease operation if operation expenses permanently exceed revenues and maintenance costs is a substantial long-term threat to enhance energy access in the Global South.
To assess opportunities to scale the implementation of RE mini-grids to achieve the UN Sustainable Development Goals including clean and reliable energy access for all by 2030, a systematic understanding of the specific sustainability challenges of RE MGs is required to enhance implementation strategies for sustainable off-grid solutions. Previous learning lessons and insights gained during the implementation and operation of RE mini-grids that have been implemented in a developmental context are of pivotal significance in this context but are often performed in silos, either focusing on technical—or financial or socio-cultural aspects of MG implementation or operation.
The goal of this article is to examine factors and their interdependencies that determine the sustainability of decentralised off-grid systems in a developing context from a multi-disciplinary perspective. Based on a comprehensive data analysis, the study aims to extract key learning lessons and strategic recommendations for scaling MG implementation through an interdisciplinary review process that integrates the three interrelated dimensions of MG implementation. These include the technical design, MG finance and economics as well the end-user perspective in the community context.
A systematic analysis of RE mini-grid case studies published between 2010 and 2020, the evaluation of over 1200 community surveys performed in Uganda and Zambia and a longitudinal, in-depth evaluation of two solar PV mini-grid projects in Zambia are the basis of this research. The analysis aims to provide detailed insights on the technical and economic challenges for MG systems and suggests technical, financial and operational solutions to address them in the context of scalability of decentralised energy solutions.
The analysis is guided by three research questions which also structured the research approach: First, how can sustainability of RE MGs be defined and which dimensions need to be taken into consideration when assessing the sustainability of a RE mini-grid? Secondly, what determines or influences the longer-term sustainability of MGs in a rural developmental context and which learning lessons can be derived from previous cases? Thirdly, which strategic implications can be generated from such an analysis for the scaling of RE mini-grid projects? The study aims to derive specific approaches for sustainable MG planning and implementation approaches in developing contexts.
This article is structured into five main sections. The overview of the discussion about the sustainability of RE MGs and the related dimensions in the following section will lead to the presentation of the methods applied to answer the research questions in section three which are a comprehensive literature review on MG sustainability, community surveys to understand the consumer perspective and an in-depth analysis of two case studies from solar PV MGs in Zambia. The findings for each approach, which will be presented in section four will be contextualised and discussed in section five under the aspect of implications for MG project development and operation as well as the scaling of MGs in SSA. The final section six summarizes key conclusions for a way forward to enhance the sustainability of MGs in developing countries.
The study is mainly focused on a rural sub-Saharan African context but includes findings from other regional developmental settings in Asia and Southern America. The data generated from the Zambian case study evaluation and the scale-up implications are mainly focused on solar PV mini-grids. However, the findings also bear implications for other types of RE MGs such as hydro MGs which have a substantial potential to achieve SDG 7 [
8,
9,
10] and hybrid MGs as well, which however display different system-economics than solar PV MGs [
11,
12].
2. Background & Hypothesis: The Sustainability of RE Mini-Grids in a Rural African Context
2.1. Renewable Energy (RE) Mini-Grids (MGs) in the Developing Context: Definitions, Trends, Challenges
In the context of this article, a mini- or microgrid is understood as interconnected loads and distributed energy resources that are grouped and controlled as a single entity within a set area and which can operate interconnected to the national electrical grid or as a decentralised island solution [
13]. The terms mini- and micro-grid are used interchangeably in this study as both terms are commonly used in the relevant literature [
14]. MGs provide connections to a number of customers in villages or towns that are located far from the main electrical grid and which can be owned and operated by utilities, cooperatives, village electrification projects or private sector companies [
15]. The size of these systems and number of household connections can range significantly but lies usually between five kWp up to two MWp of installed capacity and can either be a hybrid system combining two or more sources of energy, for example, diesel and solar PV or based on a single energy source such as hydropower or solar PV, normally in combination with a battery system for energy storage [
16]. Due to their sizing and capacity, MGs are usually considered to be more suitable for productive uses of energy than solar home systems (SHS) which are usually sized between 10 Wp and 250 Wp installed capacity [
17,
18].
To date, the overall majority of RE mini-grid projects in developing countries are financed through a mix of private sector investment and donor-funded grants of 50, 70 or in some cases even 100% of the total initial investment [
19,
20]. This model is designed to mitigate some of the financial risks associated with the implementation and operation of MGs in rural areas and to attract private investment. In theory, the blending of grant and private financing should help deliver quality energy services at an affordable cost for the consumer but the overall question has been raised [
21,
22], whether this is actually the case and whether MGs co-financed by grants provide ‘cheaper electricity’, trigger energy consumption in low-income areas and contribute to the overall financial and social sustainability of MGs.
Despite acknowledging the significance of decentralised RE MGs for enhancing access to clean energy in developing regions and the demonstrated positive impacts on rural livelihoods [
23] in sub-Saharan Africa (SSA), the sustainable operation of these systems is challenging and largely remains an unresolved issue, especially if the systems are required to operate in a market environment that requires cost-reflective energy tariffs [
24]. Despite a number of commonly reported issues such as technical faults [
25,
26], limited local capacity for maintenance and operation [
27], inappropriate financing models or inadequate operational models that lead to limited affordability of energy and payment defaults [
7,
28,
29,
30] the availability of case studies presenting comprehensive financial, technical and operational data and their systematic review focusing on the sustainability of RE MGs is still limited [
31]. However, comprehensive case studies of MGs can substantially enhance the understanding of their successful implementation and operation [
32]. Hence, the need for qualitative research to understand the drivers of MG sustainability incorporating the demand and supply side have been widely formulated [
33,
34] and are embedded in the overall discussion of sustainability scenarios and parameters for MGs in rural developmental settings. While specific data revealing details of the technical design, investment including capital expenses (CAPEX), operating expenses (OPEX) and electricity tariff-models can potentially provide essential learning lessons to overcome barriers to the sustainable operation of decentralized renewable energy solutions [
34] they are closely connected to the question of how sustainability is defined in that specific context which shall be discussed in the next section.
2.2. Dimensions of RE Mini-Grid Sustainability
The main simple baseline question of this study is, which factors are essential to operate MGs over the desired lifespan, usually twenty to twenty-five years, at optimal capacity without generating significant financial losses which shall be understood as ‘operational sustainability’ in this context.
While the literature offers various concepts of defining and assessing the sustainability of MGs [
9,
18,
35,
36] the overall conclusion is, that only a few MGs currently exist that are operating sustainably and constitute more than ‘boutique electrification’ [
35] establishing a photo opportunity for a foreign donor or a local politician [
18] such success-cases, however, are scarcely documented and could not be retrieved for this study.
In many cases, RE MGs in developing countries show deficits with regard to their technical, social and/or financial sustainability [
37,
38] which shall be discussed in more detail in this section. Hence an evaluation of MG sustainability requires the incorporation of these three interrelated dimensions and to be considered within the local context which has a decisive impact on the operational logic and the sustainability of an MG [
18,
36].
The aspect of technical sustainability is comprised of four main components which are service reliability, service availability, safety and meeting the demand capacity of the consumers [
37]. This means that the technical design and operation are optimised to a degree that outages are limited, efficient maintenance measures are in place to allow high service quality [
32,
39]. The technical sustainability of MGs can potentially be approached and optimised through comprehensive technical and operational planning processes which can be highly standardised across various regions but is potentially prone to a limited number of unexpected external events such as natural disasters or unexpected system failure which requires contingency plans to limit power outages as much as possible.
The question of social sustainability is slightly more complex than the technical dimension but is a yet under-researched dimension [
40]. The social sustainability of MGs can be viewed from two perspectives: the end-user perspective [
41] and the wider community perspective which relates to socio-economic development including health and education as well as power—and gender structures. In the context of the baseline question of this paper, the most central elements of the social sustainability dimension are issues regarding affordability and income, the social acceptance of the energy services which is closely related to willingness to pay (WTP) and energy justice [
18,
42]. These dimensions are contextualised by the local livelihoods, understood as the wider community ecosystem outlined in
Figure 1 which establishes specific system requirements, challenges and opportunities such as productive uses to any rural infrastructure solution including energy and water [
43,
44,
45].
The financial sustainability of an MG in this context can be understood with regard to the initial investment costs, referred here as capital expenses (CAPEX), and the operating expenses (OPEX) of the system over its lifespan. In the ideal case, the minimum financial sustainability of an MG means that the non-grant financed share of the CAPEX and the OPEX over the lifespan of the asset would be retrieved by its revenue.
The financing approach of a system including certain levels of grant funding define to which extent CAPEX needs to be recovered over the lifespan of the system. In the SSA context, three MG financing models are prevalent, auction programs in which developers bid for construction and, most often also the operation of MGs at pre-determined sites, usually coupled with a capital subsidy which ranges between 60–80% of the initial costs versus results-based financing (RBF) in which developers are either paid a subsidy per connection, usually
$350–500 [
46] or a blend of both.
The tariff schemes applicable to the MGs are usually laid out in the sectoral national regulatory frameworks as illustrated in
Table 1. In a Uniform National Tariff, the regulator standardizes national MG tariffs which are equal to the on-grid sector and are usually subject to subsidies. In a ‘Bid-Tariff Scheme’, which has been piloted for the off-grid sector in Uganda, the MG tariffs are determined through an auction aiming at the lowest price while individual tariff limits are determined by the regulator in an ‘Individualized Cost-Based Tariff Scheme’ which are cost-reflective. In a ‘Willing Buyer/Willing Seller Scheme’, tariffs are agreed between the MG developer and the customers and are usually cost-reflective and approved by the regulator [
47]. In Zambia for example, the regulator introduced a three-tiered system for off-grid solutions based on the size of the systems and generally require cost-reflective energy tariffs while tariffs in the on-grid sectors remain subsidised.
The study suggests that the three sustainability dimensions of RE MGs presented in this section are closely interrelated. This means that financial sustainability depends on a well-operated and -maintained, optimised solution that is reliable and meets the demands and affordability levels of its customers who can socioeconomically benefit from the solution and are able and willing to pay the energy tariffs required [
48]. Hence, the sustainability assessment and development of MGs need to account for the interdependency of these three sustainability dimensions and in the context of the community ecosystem, but these variables are yet not fully understood due to a lack of longitudinal detailed data and in-depth case studies which account for these interdependencies applying a systemic approach.
3. Materials and Methods
The study aims to provide a better understanding of the specific interrelations between the financial, social and technical sustainability dimensions of decentralised energy systems based on empirical survey data and MG case studies. The novelty of the approach presented lies in its interdisciplinary by evaluating financial—technical—and consumer-based aspects of RE MG operation and revealing their interdependencies.
The country focus of the analysis is Zambia as it shares central features in terms of energy access and socio-economic challenges with other countries in the region and the data generated from Zambia will be contextualised with a regional perspective to discuss its validity for other countries in the region.
Consequently, the research aims to derive strategic implications to enhance the operational sustainability of MGs in a developmental context which are highly relevant for further scaling of MGs in developing countries. The study also aims to shed light on the question, whether substantial grant financing of MG CAPEX in an environment of cost-reflective tariff requirements is the right option to implement MGs that operate sustainably and provide reliable and affordable energy to rural households in the specific context.
Based on the understanding of the functioning of rural infrastructure solutions determined by the community ecosystem, the study approaches these questions through a three-step approach: a comprehensive literature review of MG case studies in a developmental context, the evaluation of empirical data on the socio-economic conditions and energy demands of rural communities in Uganda and Zambia which is mirrored by an in-depth evaluation of OPEX and CAPEX data of two solar PV MGs in Zambia.
The methodological approach is limited by three factors. The first is, that the focus on Zambia as the country context establishes certain specifics, for example with regard to currency fluctuation, energy markets and—supply chain which has specific impacts on energy pricing and which might be different in other developing countries. Secondly, the overall number of respondents who are existing MG customers in Uganda and Zambia is relatively low which however also presents an opportunity for enhancing comparative empirical research on different types of energy consumer perspectives in developing countries. Finally, it has proven to be challenging to gather specific financial data on the MG operation in Zambia including detailed revenues and costs due to the absence of comprehensive and systematic recording of this data by the operators. Consequently, some of the financial calculations presented in this study are based on assumptions that are highlighted and discussed in the results section.
3.1. Systematic, Integrated Literature Review
The aim of the integrated literature review [
49] is to identify the general availability of case studies and in-depth data including on OPEX—and CAPEX of RE MGs as well as identified specific challenges for the operation of these systems in rural, developmental contexts. The analysis is based on a number of categories such as the type of study and data presented and indications with regard to the system sustainability in relation to the overall research questions and are presented in
Table A1.
In total, 26 studies published over the last decade have been evaluated. The studies have been selected on the basis of the technology (RE) and energy system-type (MG) presented, the regional focus (developing country) and the search was based on the keywords “sustainability”, “financial sustainability”, “technical optimisation” and “consumer perspective”. The search was mainly focused on studies published between 2017 to 2021 to capture the most recent findings. The review included academic papers as well as acknowledged reports and academic theses of either specific MG case studies or feasibility studies of RE off-grid systems including solar PV and mini-hydro in a rural developing context mainly in Africa and Asia. The review was focused on the sustainability parameters applied in the studies, identified challenges of the systems, operational data and applied tariff schemes. It was also analysed whether the wider community context has been taken into account in the studies evaluated. The aim of the analysis is to detect MG data gaps and sustainability trends from a cross-regional perspective.
3.2. Empirical Data: Community Surveys, Stakeholder Interviews, Focus Group Discussions
The results from the literature review data inform the evaluation of empirical survey data from Zambia which will be mirrored with survey data from Uganda. This data has been generated through a mixed-method approach of qualitative interviews, focus group discussions, rural household surveys and on-site data collection to gain a comprehensive understanding of rural household energy needs [
50] and their socio-economic conditions as essential attributes of the community ecosystem and to account for the specific importance of local end-user perspectives for the sustainability of rural energy solutions [
51].
The household surveys were rolled out in two stages. The first round of surveys (N = 1016) was deployed in rural communities in Uganda and Zambia focused on the general socio-economic situation, energy needs and demands which were captured through 106 questions. Based on the findings gathered in this round, the surveys in round two (N = 50) were focused on gaining a deeper understanding of the potential value chain opportunities for the productive use of energy and were rolled out in two rural communities in the Southern Province of Zambia. For the evaluation, the survey data presented in this study has been clustered into various energy-consumer subgroups which are presented in
Table 2.
The data of MG users has been collected within the communities of the 30 kWp Sinda solar PV MG in Zambia which is presented as a detailed case study in this analysis and for Ugandan MG users of the 1.6 MWp solar-thermal hybrid MG in Kalangala [
52].
The survey rounds were complemented by site-visits and focus group discussions with representatives of different community groups such as members of cooperatives and parent-teacher associations (PTAs), local women self-help groups (SHGs), local businesses as well as public representatives such as councillors, health workers and school staff in five rural communities in the Southern Province of Zambia.
The physical data was collected through the lens of a potential RE project development in cooperation with a local energy project developer to gain a better understanding of site selection strategies [
53] and included existing local infrastructure, population density, present social or economic groups and environmental conditions including soil erosion and deforestation. The evaluation also included a review of findings from 45 qualitative interviews with off-grid energy companies and public sector stakeholders to embed the community-level perspective into the wider energy policy-making and governance context to derive strategic implications based on previously identified current energy governance structures in Uganda and Zambia [
54].
3.3. Mini-Grid Case Studies: Context and Selection
Based on identified data gaps through the integrated literature review, the study incorporates detailed technical, financial and operational data from two existing solar MGs in Zambia located in Mpanta and Sinda. This embedment of in-depth MG case studies aims to support the closing of existing data and knowledge gaps with regard to MG operation and the generation of important strategic learning lessons for rural electrification processes [
55]. The MG data has been collected through a number of site visits performed by researchers of the University of Zambia resulting in a technical and financial assessment [
56], stakeholder interviews and desk-based research. The technical and financial evaluation of the Mpanta MG complements previous local studies on community-level engagement and energy transition [
41,
57].
3.4. Country Context: Energy Access and Governance in Zambia
Zambia shares central features in terms of energy access and the socioeconomic structure of rural communities with a number of SSA countries. This includes a low density of the main electrical grid which leaves the majority of rural Zambia unelectrified with off-grid RE systems being the preferred solution to enhance energy access in these areas [
58]. The rural electrification rate in Zambia is significantly below ten per cent. Although specific energy access data is currently lacking according to the Rural Electrification Authority’ (REA), this rate is well below the average rural electrification rate in SSA, which is estimated at around 22.59% [
59,
60].
Following the establishment of REA Zambia in 2003, which is mandated to enhance access to electricity in rural areas to 51% by 2030, planning and policy approaches to increase energy access in Zambia have originally been dominated by grid-expansion projects mainly in peri-urban areas and in cooperation with the parastatal national utility ZESCO Ltd. The ‘Rural Electrification Masterplan’ (REMP) which has been developed with significant support from the Japan International Cooperation Agency (JICA) and which was adopted in 2008 identified 1217 Regional Growth Centres that were clustered in 180 project packages to be electrified by 2030 [
61]. According to the ‘REMP’, a total investment of around
$1.1 bn would have been required for the realization of all project packages which amounts to a required annual investment of roughly
$50 million per year between 2008 and 2030 to achieve the electrification target [
62]. However, due to the slow progress of project implementation, national budget constraints, the high costs of grid extension projects and the emergence of more cost optimised solutions [
63], REA began to review the electrification strategy laid out by the REMP [
64] and explored a potential shift towards emphasizing decentralized energy solutions like solar PV MGs. Consequently, these off-grid energy solutions have been gaining more and more interest in Zambia since 2011/2012, a process that was increasingly pushed by foreign donor organisations who started to develop and implement off-grid procurement programs, some of these programs in cooperation with REA and other institutional partners in Zambia.
This resulted in the implementation of off-grid electrification projects now being largely ‘outsourced’ to the private sector and foreign donor organisations [
43]. In the course of this strategic shift, RE MGs have become an emerging technology for rural electrification alongside SHS in the country. Over the last seven years, more than 20 MGs have been implemented through partnerships between private sector companies and foreign donor organisations with dozens of more projects in the pipeline of being deployed for example through the EU-funded Increased Access to Electricity and Renewable Energy Production (IAEREP) Project.
According to REA, as of February 2021, around 29 solar PV MGs with installed capacities between ten and 50 kWp and two mini-hydro MGs with an installed capacity of 640 kWp and 750 kWp have been operational in Zambia with two additional PV MGs currently under construction. These MGs have largely been implemented through tender-based procurement processes with CAPEX grant-funding levels of around 70 to 80% supported through various foreign initiatives including the Beyond the Grid Fund for Zambia (BGFZ), the Mohammed bin Rashid Initiative for Global Prosperity and U.S. African Development Foundation (USADF)/Power Africa.
Most of the Zambian MGs are applying mixed tariff schemes but shifting from subsidised towards ‘Individualised Cost-Based Tariff’ schemes in alignment with the regulatory framework for MGs introduced in 2018 by the Energy Regulation Board Zambia (ERB). The framework defined certain technical, financial and operational requirements for MGs including the requirement of cost-reflective tariffs while energy tariffs in the on-grid sector remain subsidised in Zambia [
65].
Although the challenges of enhancing rural electrification have been acknowledged by leading national and foreign stakeholders, recent research has evidenced that the energy policy framework yet lacks a clear integrated strategy for on- and off-grid electrification and energy access governance structures are still highly top-down oriented and largely lack the inclusion of community-level representatives [
54].
4. Results
4.1. The Sustainability of MG Documented in the Literature
The literature review revealed three major types of scientific resources: single case studies, reviews of multiple case studies and feasibility studies including simulations for potential project locations. The analysis shows that, despite a substantial overall number of studies on MG sustainability, the presentation of specific financial data including OPEX, CAPEX, details on revenues and tariff models is yet very limited, even in those studies which focused explicitly on the financial sustainability of MGs.
Secondly, 18 out of 21 case studies reported substantial financial sustainability challenges for all regions due to various combinations of low energy affordability, poor revenue collection and high operation and maintenance costs. The reported financial challenges in the case studies evaluated outweigh other issues such as consumer behaviour and acceptance (14), policy-related or legal challenges (11) or technical problems (8). With regard to MG revenues covering its OPEX, none of the case studies presented specific data for the operational sustainability of the MG. Only six case studies revealed some information regarding the tariff models of the MGs applied which indicates a data gap and evidence to perform a comparative analysis of the connection between cost-reflective vs. subsidised MG tariff models and operational sustainability.
The review also shows that although financial, technical and end-user focused sustainability dimensions have been included to some extent in most of the case studies, the focus on economic community-impact including the productive use of energy in the context of a comprehensive community eco-system approach which includes analysis and understanding of local income patterns and community value-chains is clearly underrepresented. None of the case studies reviewed correlate technical—financial—and community-based approaches or integrate these dimensions but focus mainly on technical and financial analyses instead with the availability of detailed data however being generally limited. The few studies that include the community—or end-user context either lack a specific technical or a financial evaluation.
The reviewed feasibility studies largely follow that pattern of selected modelling usually incorporating technical and financial calculations based on an LCOE approach. They generally demonstrate the tendency of an economic and technical advantage of RE MG systems over grid connections in the rural context and more clearly over fossil fuel alternatives [
30,
66,
67]. The feasibility studies evaluated however usually do not account for potential community eco-system impact factors illustrated in
Figure 1 on energy systems including fluctuating income, sensitivity to exogenic effects or existing socio-economic structures. Consequently, the optimised theoretical financial and operational projections of the feasibility studies reviewed are in stark contrast to the actual case studies.
The literature review evaluation a clear gap between theoretical modelling presented in feasibility studies and the operational reality of RE MG operation in a developmental context which substantiates the necessity of the inclusion of the community ecosystems-setting into MG planning and modelling processes. The evaluation also reveals specific MG data gaps and highlights the important links between financial sustainability, technical management and end-user behaviour which informs the requirement of combined research approaches aiming for an understanding of the complex socio-economic community settings for the evaluation of the sustainability of RE MGs in the developing context from which strategic implications can be derived to improve their overall operational long-term sustainability.
4.2. Survey Data: Community Ecosystems—Central Features
While the literature review has pointed toward the necessity of including the community context for an interdisciplinary research and implementation approach of sustainable decentralised energy systems, the following section aims to illustrate how the community context facilitates or limits the operational sustainability of RE MGs.
The empirical survey data as a basis for this evaluation focuses on four main aspects which are relevant with this regard: (1) the income situation of rural households, (2) the current use of energy, (3) the potential creation of added value through energy demands and (4) end-user experience. The data is presented for Uganda and Zambia to increase the applicability and validity of data for generalisable outcomes [
68] and has been detailed for the national, regional and community levels in Zambia to account for eventual local and regional variations.
4.2.1. Socio-Economic Characteristics and Rural Income Situation
The financial and hence operational sustainability of MGs is directly interlinked with the income situation of its potential and actual customers as it determines levels of energy affordability, consumption levels and overall MG revenues. Hence, the full utilisation of the energy generated from the energy system and steady cash flow are central to cover at least the operating expenses of the system.
The empirical data presented in
Figure 2 indicates, that well over 80% of the respondents in Zambia are self-subsistence farmers with a high dependency on seasonal rainfalls and reported low average household spending levels of around ZMW 288 as of 2020. This amount lies significantly below the reported average rural household income levels of ZMW 810 reported in 2015 [
69] and translates into around
$13 per month under currency exchange rates of spring 2021 as
Figure 3 illustrates. For Uganda, the data suggests higher average household incomes and monthly spending levels of around
$86 per month.
It must be noted, however, that capturing income data has proven to be challenging due to high variations of income levels stated by the respondents in Zambia for example between ZMW 5000 to ZMW 20 monthly. This is also due to the fact that many respondents only generate an income once or twice annually as they rely on the sales of seasonal farming produce, mainly maize, with no or just very little other income. Hence capturing actual local income levels is challenging and needs local verification. Furthermore, the calculation in $vs local currency is subject to significant fluctuations. The Zambian Kwacha for example lost over 60% value over the US Dollar between 2019 and 2021.
The high prevalence of over 95% of income generation through some form of self-employment including self-subsistence farming and low levels of wage labour are interrelated with high degrees of income intermittency in Uganda and Zambia. Close to 80% of the respondents in Uganda, where the proportion of income generation through small businesses is slightly higher than in Zambia, and around 90% of respondents in Zambia reported a significant income variation throughout the year. Interestingly, MG or SHS access does not impact or reduce the income variation in both countries. This indicates either a low or no use of productive use appliances or their limited impact to generate stable income throughout the year.
The causes of income fluctuation have been evaluated in more detail on community level in Zambia among non-MG users and are mainly related to the direct and indirect dependency on seasonal rainfall patterns due to the absence of irrigation solutions and low degrees of agri-processing which requires small scale industrialisation and affordable energy supply. Climate change-induced droughts as experienced in the rainy season of 2018/2019 in Southern Zambia seriously threaten the socio-economic fragility of these communities and seriously threaten food security in the region.
4.2.2. Energy Access and Usage-Patterns
To gain a better understanding of the end-user adaptation to utilising different energy sources and the conditions of how to facilitate the productive use of energy to generate a stable demand and potentially positive economic impacts in the community, different energy access situations, energy consumption patterns and payment models have been compared. This evaluation is guided by two questions that are central to understand local adaption and the impact of decentralised energy systems. Firstly, what type of energy sources are currently most used by rural communities? Secondly, how does the source of energy influences energy usage patterns?
Figure 4 illustrates respondents with different connection types in Uganda and Zambia and points towards higher access rates to the national grid, Solar Home Systems (SHS) and MGs in Uganda. While this is partially due to the selection process of respondents as for Uganda, also respondents with access to the national grid have been selected during the survey rounds, the data illustrates a clear tendency to higher energy access rates in rural Uganda compared to Zambia which correlates with World Bank data which presents a rural electrification rate of around 10% for Zambia compared to 38% in Uganda [
60]. This data, however, is mainly focused on connections to the national grid. Around two-thirds of the respondents in Uganda have access to MGs, the national grid or SHS, in Zambia however, this figure stands at only around 20% with 80% of the Zambian respondents originally claiming to have no electricity access at all. A further survey round that focused on rural community members in Southern Zambia revealed, however, that despite a high share of respondents originally claiming to have no electricity access at all, granular data from two communities showed that over 80% of the respondents use some kind of energy sources like portable solar panels or car batteries.
In both countries, the most prevalent energy source for rural households is SHS with ‘Pay-as-you-go’ (PAYG) or Rent-to-Own (RTO) purchase models to be seemingly more widespread in Uganda while one-off purchases seem to be more common in rural Zambia which is also due to yet limited availability of these solutions which have been acknowledged as the most favoured type of financing and electricity access model for the Zambian respondents.
With regard to the second question focusing on energy usage pattern it could be hypothesised, that the ownership of appliances and the utilisation of the energy provided, including its productive use, are potentially diversifying and growing in the course of enhanced connectivity. The data presented in
Figure 5 and
Figure 6 partially supports this hypothesis to some extent for MG and SHS users in both countries but the data also illustrates the yet limited productive use of energy across all connection levels despite the fact that over 80% of the respondents are self-employed entrepreneurs or farmers. The national-level data indicates similar energy usage patterns for Uganda and Zambia with energy being mostly used for lighting, communication including charging devices and entertainment.
The availability of MG systems does not automatically trigger the possession of a wider array of appliances among the respondents such as fridges and the productive use of energy but reveals visible national differences instead. While Ugandan MG users have a higher but still limited tendency towards productive energy, this is of less significance to Zambian MG users which could be due to higher income and energy affordability levels as well as better access to appliances in Uganda. Users of the Ugandan Kalangala mini-grid for example pay between 0.18 and 0.22
$ per kWh as of 2019 [
70] while Zambian mini-grid users in Sinda pay around 0.26
$ per kWh with income levels in rural Zambia being less than half compared to Uganda as illustrated earlier.
4.2.3. Energy Demands, ‘Willingness to Pay’ (WTP) and Productive Uses
The majority of the respondents in both countries indicated, that their current energy source is limited and not sufficient to meet their energy needs for example with regard to lighting, productive use or the connection of additional appliances. Consequently, the data presented in
Figure 7 suggests a general desire of the respondents to upgrade their current energy supply especially in Zambia, where 100% of respondents indicated their willingness to upgrade while this figure is less pronounced in Uganda, especially among MG users. This might indicate, that the Ugandan MG has the tendency to better fulfil the energy demands of its customers while the Sinda MG in Zambia does not meet the energy- needs of the customers to large extent. Data from Southern Zambia also suggest that consumers would not automatically prefer an MG connection over an SHS as around 55% of the respondents in Southern Zambia stated their preference of an SHS based on a rent-to-own model, independently from their current source of electricity. This dataset also indicated limited popularity of grid-connection provided by the national utility (Zambia Electricity Supply Corporation—ZESCO) as none of the respondents preferred that connection type which might partially be due to the high amount of national power-cuts of up to 12 h daily Zambia experienced in 2018/2019 due to a serious drought in the hydropower-dependent country. The expression of consumer preferences however does not eradicate the question of the impact of national grid-arrival in a market offering subsidised energy tariffs for on-grid connections versus the requirement of cost-reflectiveness in the off-grid sector.
The desire for an upgraded energy supply is largely mirrored by the willingness to pay for better energy access which is high in both countries as illustrated in
Figure 8. With regard to the intended use of an upgraded energy connection, the responses show a wide array of preferences with significant variations among consumer groups with regard to cooking and cooling. Lighting, charging devices and productive uses and to some extent entertainment, however, are desired by the majority of all respondents in each consumer group as
Figure 9 shows which indicates a yet untapped consumer demand in many areas.
As the productive use of energy is still limited among all consumer groups in both countries, the majority of all respondents confirmed their demand to use energy more productively.
Figure 10 illustrates the diversity of the forms of desired productive energy use between various consumer groups and communities. While the data suggests demand-trends for cooling, lights and charging of devices, the demands in other areas are much more diverse between various groups of respondents. Despite these variations, respondents expressed a strong demand for improved access to productive appliances including financing mechanisms that would be based on ‘Rent-to-Own’ or ‘Pay-Go’ models which were the preferred solution over one-off purchases which appears yet to be a challenge.
A direct comparison of two rural communities in Western Uganda and Southern Zambia that share similar features like energy access via SHS, low and intermittent income and the absence of wage labour level included presented in
Figure 10 reveals that the demands for productive energy use vary despite their similarities. The data suggests that manufacturing and crafts activities are underrepresented, especially in Uganda and the clear trend towards using energy for service provision in both countries. Since most services depend on income patterns of ‘their’ customers, the data implicate the opportunity of training, capacity building and appliance financing mechanisms coupled with MG development to diversify local business structures to create local added value and positively impact the income situation in local communities.
4.2.4. Impacts of Electrification on Consumer Finance
Since low and intermittent income levels in the rural communities surveyed establish substantial challenges for the financial MG sustainability, the question for impacts of energy availability in the communities arises and more specifically whether energy availability did directly contribute to local income generation to stabilise MG cashflow. Although the overall majority of respondents reported the general improvement of life quality after getting a connection, either through SHS or MG as shown in
Figure 11, the data on income change does not draw a conclusive picture with this regard.
As
Figure 2 showed earlier for both countries, spending levels between MG users versus respondents without energy connection are generally higher with greater significance in Zambia where spending levels of MG users are almost double as high as those of non-connected respondents. For SHS users this correlation is less visible as SHS users in Uganda reported similar spending levels compared to non-connected respondents in Uganda while the spending levels for SHS users in Zambia are around 40% higher compared to non-connected respondents. Since the data presented in
Figure 2 does not provide a blanket indication of energy access automatically generating higher incomes or whether merely consumers who already have a higher income can afford an MG or SHS connection, respondents have been specifically asked for the impact of getting electrified on their income. The responses presented in
Figure 12 clearly indicate a positive impact on the income situation for MG and SHS users in Uganda while interestingly about two-thirds of the Sinda MG users in Zambia stated, that their income remained the same or has even decreased after getting electrified. This response pattern seems to replicate for SHS users in Zambia and is largely mirrored by the number of respondents reporting difficulties in energy payment among SHS users and to a larger extend MG users in Zambia as shown in
Figure 13.
The impact of electrification on income, however, becomes inconsistent when respondents have been asked about their ability to pay for school fees before and after electrification. While a clear majority of MG users in Uganda and around 53% of SHS users in Zambia confirmed an increased ability to pay school fees after getting electrified, the majority of SHS users in Uganda and MG users in Zambia stated no or negative impact of electrification on the ability to pay for school fees.
Another indicator for the financial community impact of electrification is the development of business activity in the community. The response patterns with this regard reflect positive income development to some extend with the biggest perceived growth of business activity in the community after electrification for MG and SHS users in Uganda, to some extent among SHS users in Zambia but with no perceived positive impact among the respondents from the MG users in Zambia.
A clear majority of respondents across all consumer groups reported increased studying time of children after getting connected which indicates a positive impact on education in both countries.
These variations among the different indicators related to electrification and end-user income illustrate the complexity of this dimension and highlight the importance of a multidimensional approach of measuring the financial impact of energy systems on community level through a systematic evaluation of various indicators as a sole focus on household income when measure impact might not reflect the complex reality of rural communities. For exhaustive coverage, it would also require a measurement system that includes the non-direct monetary value components such as the ability to purchase certain goods, increase of months with income, ability to generate savings etc. which could be a result of changes in end-user income due to electrification.
4.2.5. Experienced Reliability, Technical—And Environmental Issues
As illustrated, the majority of the respondents reported positive impacts of electrification in their communities which is largely mirrored by the question of the negative effects of electrification. Around two-thirds of the respondents using an MG- or SHS-connection in Uganda as well as MG-users in Zambia report no negative effects which are in contrast to 60% of Zambian SHS-users reporting negative effects of electrification in their community. However, experienced energy problems vary among user groups and country as shown in
Figure 14. In congruence with the data on consumer finance and energy payment, Zambian SHS users reported problems with regard to affordability and cost as most significant, followed by limited energy supply and reliability issues. These concerns are shared with SHS users in Uganda who, however, see safety issues as their most central problem. Differences can also be observed among MG users in Uganda and Zambia. While respondents connected to the Sinda MG mostly reported issues with regard to reliability and energy cost, MG users in Kalangala overwhelmingly stated certain safety problems such as severe injuries and death due to electrical shocks as well as electric fires as the biggest problems. Possible explanations for these reports from Uganda can be the cases of electricity theft and tampering with the system, as users reported that two or more households are sharing an electric meter which is clearly dedicated to one household only, instead of a general lack of technical quality of the installation. While the environmental impact of the energy connection has been considered low by the respondents in both countries, social problems, especially conflicts between community members with—and without energy access seem to be of some concern to SHS users both in Uganda and Zambia.
4.3. Mini-Grid Case Studies Zambia
The literature review presented earlier revealed substantial gaps with regard to the available technical and financial data in MG studies and limited inclusion of community context data while the previous section illustrated end-user perceptions and socio-economic conditions that heavily impact mini-grid operation. Consequently, in the third analytical step of this study, the implementation and operation of two Zambian solar PV MGs located in Mpanta and Sinda are evaluated in more detail to complement and mirror the analysis of community—and consumer perceptions. The goal is to analyse the interdependencies of the technical- financial and socio-economic sustainability components in more detail and illustrate how the community ecosystem impacts MG operation.
4.3.1. Community and System Context: Socioeconomics and Geography
The solar MG in Mpanta developed and commissioned in 2013 by the REA Zambia was the first solar PV MG in Zambia. With an installed capacity of 60 kWp, it was initially designed to provide street lighting in the village as well as basic electricity services to about 450 private households to power small appliances such as radios, lights, TV sets or mobile phone charging, to schools, a rural health centre, small businesses, harbour facilities and churches. The original design of the MG was comprised of 300 × 200 Wp mono-crystalline solar PV modules, 720 × 650 A/2 V deep cycle batteries, 4 × 15 kVA inverters and 4 × 100 A/240 V DC charge regulators. The whole system operates at 240 V DC to AC and electricity is distributed through two 0.4 kV lines within a distance of 1 km. A re-wiring of the whole system, the exchange of all inverters and charge controllers was necessary in 2015 after lightning hit the system a few times causing high voltage surges which led to the failure of the components. During the reconfiguration, the string size has been increased from 10 to 14 panels per string to optimize the voltage requirement of the controllers. The number of panels was reduced from 300 to 224 which resulted in a reduction of energy output by 15.2 kW or 25.3% compared to the former configuration leading to an average energy output of around 209 kWh per day. Accordingly, the number of charge controllers and inverters was also reduced from four to two providing a 45 kVA instead of a 60 kVA power output which was sufficient due to the low energy demand. With the downsizing of the system, the daily power supply is rationed and power is now available only at certain times and for 14 h a day. The estimated annual energy output is 76,500 kWh based on a projected local energy yield of around 1700 kWh per kWp installed [
71] excluding transmission and distribution losses per year. The battery system, which is the largest cost position in an off-grid solar system is currently sized at 720 batteries each 2 V and 650 Ah capacity, i.e., total energy storing capacity of 720 × 2 V × 650 Ah = 936 kWh in Mpanta. This configuration if fully operational, would allow two days of battery autonomy so that the users can enjoy uninterrupted power during cloudy days.
The 30 kWp mini-grid in Sinda village, commissioned in 2017, was developed as a pilot project to enhance private sector investment in the RE sector in Zambia and has been developed and owned by the Zambian developer Muhanya Solar Ltd. It is the first MG in Zambia that has been established as a public-private partnership project and is operated by a private company in cooperation with the community. The system is comprised of a 30 kWp solar PV generator, one 20 kW inverter and 140 kWh of battery storage capacity which is connected to four 100 A charge controllers. The 2.5 km overhead distribution network with a voltage of 230 V currently connects around 60 households and 5 businesses.
The implementation of Mpanta in 2013 was part of a wider
$4.78 million energy access programme rolled out by REA and funded by the United Nations Industrial Development Organization (UNIDO) with an investment volume for Mpanta MG estimated at around
$1.3 m which was 100% grant-funded [
72,
73]. The CAPEX for the Sinda MG stands at approximately
$350,000 based on approximately 70% grant funding from Power Africa Off-Grid Energy Challenge and Musika Development Initiatives which was complemented by 30% equity provided by Muhanya Solar Ltd. [
74]. Hence both MGs were implemented with significant grant investment with CAPEX per kWp installed being almost twice as high for Mpanta compared to Sinda.
Table 3 presents an overview of the technical specifications of both MGs.
4.3.2. MG Operation and Tariffs
The socioeconomic conditions in both communities pose critical challenges for the operation of the MGs which have been outlined in the previous section. Low energy affordability and high-income fluctuation throughout the year directly impact the revenue and cash flow of both MGs.
The implementation of the energy tariff system in both locations was independent of the Zambian regulatory MG framework which was introduced a few years after the commissioning of the MGs and which now requires cost-reflectiveness in the MG sector. Before the commissioning of Mpanta MG, members of the community discussed the options of a pre-paid metering system and a fixed fee. During the consultation processes, few members raised concerns with regards to trust in a pre-paid system and a vote among community members revealed a decision towards a fixed fee which was introduced, based on the size and type of the connected properties. After an introduction period in Mpanta which allowed free connections, basic fees of around
$5 for the connection and
$1.5 for wiring were introduced and the management including revenue collection was handed over to the Kafita Cooperative Society (KCS) while REA retains ownership of the plant which operates on an interim generation and distribution license issued by the Energy Regulation Board (ERB). The introduction of the connection fee caused complaints and irritation among the Mpanta community. The perception among the community was that the project was brought by the government as a grant without the requirement for end-users to pay. Additionally, the transition from free to prepaid connections was not well communicated to the community [
41].
While Sinda MG also applies a monthly fixed rate, the tariffs are uniform at ZMW 150 (
$6.5) per customer per month translating into ZMW 5 (
$0.21) per day and are significantly higher than in Mpanta where households pay a monthly fixed fee of between ZMW 30 (
$1.3) to ZMW 70 (
$3.1). Consequently, the majority of respondents surveyed in Sinda reported difficulties in paying for the electricity and less available income than before getting electrified as
Figure 12 and
Figure 13 in the previous section illustrated. The fixed load in Sinda per household is limited to 300 W and the average customer consumption in 2018 has been estimated at 55 kWh per month but is probably lower due to outages. The tariff system in Sinda has created complaints especially among low-consuming customers as consumers operating a single electric bulb for example are paying the same price as customers running more appliances including fridges, etc. leaving them with a feeling that clients with low consumption were subsidising those with higher energy consumption.
Table 4 provides an overview of the tariff structures in both locations and also reflects the currency fluctuation of the tariffs charged in Zambian Kwacha compared to the US-Dollar.
In Mpanta, 450 users were initially connected for free in 2013. As of 2020, more than 260 of these users had been disconnected as they were unable to pay the monthly fixed fee. In addition to these figures, over 60 users were disconnected for various reasons including due to the collapse of their traditionally built, grass-thatched houses during a heavy rainy season while 4 users were removed for illegal connection. As a consequence, more than 50% of the households in Mpanta still rely on pollutant fuels for lighting and over 95% for cooking. During the operation, community complaints emerged at scale about miscommunication regarding the tariff scheme when households were initially connected or a lack of notification of affected customers about an imminent disconnection when they were unable to pay [
41].
While the Sinda MG operates through a pre-paid metered systems which allow for some efficiency of revenue collection, the tariff collection is not efficient in Mpanta as local site visits revealed. As of 2020, the average estimated total monthly collection was only about ZMW 6000 to 8000 which translates into
$300 to 400 applying an average exchange rate of
$1 = ZMW 20 for 2020 or an annual average total of around ZMW 84,000 (or
$4200). These inefficiencies in tariff collection are partially caused by local management problems but are also rooted in high levels of customer dissatisfaction due to reported power outages, restricted system capacity and limited understanding of the operation of the system [
41]. The current OPEX for Mpanta MG according to REA is ZMW 108,000 for the two staff salaries. However, there are other costs like office space, materials and equipment, vehicles and travel which are not included here. Hence, the total annual costs are more likely to be around ZMW 300,000 which is calculated without component replacement costs according to a UNZA assessment in 2019. Consequently, the annual OPEX exceeds the collected revenue by around ZMW 24,000 (
$1200) in terms of staff costs or ZMW 216,000 or
$10,000 based on 2019 currency values. Although these values are only rough estimations as this type of data collection has been proven challenging and may fluctuate over time, the plant is currently generating a significant annual deficit. These costs are currently covered to large extent by the Zambian Rural Electrification Authority (REA) that subsidizes the mini-grid. The OPEX deficit is even higher when replacement costs for system components such as charge controllers, inverters or batteries are becoming part of the equation as they are a substantial component of OPEX calculation.
Table 5 presents an approach to calculate the current assumed OPEX for Mpanta MG based on information provided by the operators and market-price estimation for the components installed which however can vary. The cost estimation of the current system is enhanced by an optimisation scenario which shall be discussed in the following section.
Although the OPEX costs for the Mpanta mini-grid are very high and mainly driven by a battery bank that is designed to provide two days of energy back-up supply when fully charged as well as high overhead costs, the analytical approach illustrates the importance of a thorough evaluation during energy project development to determine realistic OPEX costs and energy tariffs within the local socio-economic context which defines the sustainability of an off-grid system. It must be noted at this point that the calculation presented does not contain any cost of capital as the project was 100% grant-funded. The analysis also illustrates the interdependency between technical—financial—and community-context parameters and highlights the necessity of holistic project planning approaches that account for these interdependencies.
In addition to that, the calculation of OPEX, tariff and revenue reveal the impact of the significant currency depreciation of the Zambian Kwacha vs. the US-Dollar over the last years, a problem that most African countries encounter. This poses a serious problem jeopardising the sustainability of future investments in the whole industry as imports for components and spare parts as well as the cost of capital payments are usually made in US-Dollar while local revenues are generated in local currency.
The OPEX for the Sinda MG shown in
Table 6 reveals significant differences in the cost per kWh to the Mpanta MG. But like in Mpanta, the analysis discloses a financial sustainability gap of around
$0.04 per kWh based on an assumed energy retail price of around
$0.26 per kWh and OPEX costs of 0.30 kWh. Taking into account both CAPEX and OPEX, this gap widens to
$0.57 per kWh under a scenario that is assuming a price of
$0.83 per kWh LCOE based on the grant and debt funding ratio. The annual revenue in year one has been estimated at around
$11,000 which results in an annual loss of approximately
$5100 with regard to OPEX only. These figures do not include currency depreciation of around 20% per annum between 2018 and 2021.
5. Discussion
The case study analysis presented in this article widely reflects the financial key issues that have been reported in the literature [
7,
73,
74] but extend the existing scope of the studies reviewed by the community perspective. The study illustrates the fundamental impact of the socio-economic community characteristics on off-grid energy systems and vice versa. Although the community- and consumer perspective have been included in RE MG system reviews [
7,
30,
75] or were the sole focus of MG implementation reviews [
41], it has been of limited consideration yet, as to what extend the consumer economics influence MG operation and how MG operation can specifically contribute to enhance and stabilise the income situation of MG customers as part of a planning approach.
Secondly, while the relation between technical and financial sustainability has been evaluated in the literature [
25,
35,
74,
76], approaches how to implement RE off-grid systems that combine qualitative energy services at affordable tariffs and potential trade-offs, or how to optimise existing systems that are not yet financially sustainable have received less attention with few exceptions [
77].
These findings have specific implications for the planning- and development of MGs from the project-level perspective as well as for the scaling of MGs across SSA. Both implications will be discussed in the following subsections.
5.1. The Interdependency of Financial—Technical—and Socio-Economic Sustainability
5.1.1. Towards Break-Even: Optimisation Potential for PV Mini-Grids
As the operation of Mpanta MG is currently seriously financially unsustainable, a projection has been developed to model a potential improvement of the financial and operational sustainability of the system. The following projection, which can be applied to a variety of MG systems, illustrates potential energy availability trade-offs and the conjunction of technical, financial and socio-economic sustainability. Hence, the analysis presents one possible approach shown in this section to counter some of the key sustainability issues of RE MGs detected in developing countries.
Table 5 compares the current system OPEX for Mpanta to an optimized system OPEX for the current 45 kW system configuration and a 60 kW system which would utilize the current installed capacity to the full extent but would face the challenge of local energy demand and affordability to avoid under-usage. The new cost estimates are based on updated price estimations for the system components and a remodelled battery backup system. The figure illustrates that the system OPEX could be significantly reduced by more than a third under a new calculation scheme. In addition to the cost analysis of the system components, the position ‘Miscellaneous’ as reported by the operator needs a further assessment as it is quite high. We further note that the battery system is the largest cost item. This cost could potentially be reduced through some balancing of cost vs. benefit. The optimisation of the battery size by implementing one-day battery autonomy instead of two days. Secondly, it is assumed that one-third of the total load is being used in the daytime and therefore does not need storage. This could be achieved through an incentivisation of energy use during the day. These two measures reduce the battery size to less than one-third of the current size. Furthermore, the use of modern Li-Ion batteries can potentially be suggested, but the higher cost of this technology needs to be accounted for in relation to the advantages including a much longer life span and higher depth of discharge, which make their lifetime cost often cheaper compared to that of lead-acid batteries.
These measures reduce OPEX significantly as
Table 5 suggests. However, this new configuration has some trade-offs as end-users will potentially have limited power supply during cloudy days, especially during the rainy season. These issues would have to be addressed upfront in cooperation with the community to discuss the balance of energy supply, service quality and energy tariffs. In series wiring configurations it is advisable, that each battery should have the same load status which can be achieved through conditioning the batteries. If batteries are not conditioned or at full capacity, the different battery strings do not have the same capacity and can display a significant deviation up to minus 30% or more to the full capacity, especially when they operate under challenging temperature conditions, for example in heat with no cooling system. Conditioning the batteries would require re-wiring the battery system including an option to remove single batteries from the string from time to time to fully charge and recharge that battery, understood as conditioning the battery, and then add it to the string to ensure that all batteries have the same condition. In an optimal case, the remodification of the battery system would also entail introducing temperature balancing and recording of charging/discharging of the batteries.
These optimisation measures could achieve significant OPEX reduction as shown in
Table 7. A more in-depth technical and financial analysis for example through a HOMER-simulation [
78] or similar software could potentially further refine the optimisation.
Although reduction of operating costs as illustrated for the Mpanta case might reduce the price per kWh to be paid in order to cover operation costs, the utilization of the energy produced by the mini-grid is a second key element of the financial sustainability of these systems. A closer look at the socio-economic context in relation to MG financials reveals severe disparities.
5.1.2. Household Income and Energy Affordability vs. Energy Tariffs
Although the equation presented in
Table 5 is based on a number of assumptions, it can roughly be estimated, that based on the current number of consumers and a total annual OPEX of
$43,343 an average payment of monthly ZMW 437 or
$19 per connection would be necessary to cover the costs of operation which is more than half of the average reported household income in Mpanta. Translating this scenario which has been discussed as the ‘energy poverty penalty’ [
79] to Europe in order to illustrate the financial burden for the consumer, the average UK household with an annual income of £29,900 [
80] would have to spend around £1245 or
$1474 on electricity per month. In a similar translation to illustrate the relation between income and expenditure, an average UK household would have to pay around £31.8 or
$37.74 per kWh if affordability and consumption levels of MG users in rural Zambia are translated in a UK scenario.
The average monthly household income in rural areas of Zambia in 2015 was estimated at
$77 but appears to be lower according to the survey data presented earlier. This limits the disposable income of private households for electricity to
$6–7 US per month when applying an estimation of 10% of potential energy expenditures per household and month. Applying a tariff of around 0.30
$ per kWh that would at least cover the OPEX would allow Sinda customers for example the consumption of approximately 23 kWh which is far below the projected energy consumption per month and rural customer of 49 kWh according to the Rural Electrification Master Plan of 2008 [
62] and is unlikely to trigger the productive use of energy. These considerations reveal the extent to which the community context determines the technical and financial parameters of an off-grid system and that the understanding of local energy needs and demands is essential for energy system implementation [
81].
A more detailed onsite assessment using household surveys could reveal the actual income situation and the potential consumption levels at the MG sites evaluated in this article as well as other locations. The identification of current barriers for customers of getting and staying connected and their actual energy needs and demands as well as opportunities for productive uses of energy based on local value chains as discussed earlier can be key to enhance the operational sustainability of MGs in three ways: First, they could provide a basis for a tariff scheme that is more adjusted to the consumer needs including options for prepaid-meters based on actual consumption or schemes that incentivize certain private and commercial user profiles in terms of volume and timing. Secondly, evaluating consumer behaviour and satisfaction could also reveal under which conditions an increase in the numbers of connections could be achieved. Thirdly, a focus on aspects of productive use in connection with innovative financing schemes for small business owners or farmers could provide the basis for economic development, income generation and enhance energy consumption in the area.
5.1.3. The End-User Perspective and a Community-Ecosystem Approach
The data presented previously revealed high energy-demand levels and a substantial willingness to pay for upgraded energy services among communities in Uganda and Zambia. The large majority of respondents within all consumer subgroups, including MG users in Sinda, confirmed improved living conditions in the community after electrification. Community surveys in Mpanta also revealed the positive effects of electrification on household and community level [
41] as respondents in Mpanta reported positive impacts enhanced security (street lighting), better availability of medical supplies, higher levels of education and growing business opportunities as a result of MG energy access. The number of communal gatherings increased, people feel better connected and informed due to higher accessibility of TV and radio and local women emphasized that household work became much easier due to improved light sources. A significant impact on the use of traditional fuel, however, such as reduced collecting of firewood or use of charcoal has not been observed by the researchers in Mpanta [
41] and Sinda.
The response patterns on negative and positive energy impacts presented are only a snapshot of different energy consumer perspectives due to the limited number of respondents in each group but they potentially indicate certain key interdependencies and trends: Low-patterns of productive energy use and energy affordability are closely interrelated but the uptake of energy and its productive use are not necessarily linked to a specific type of connection. The Zambian case illustrates, that connecting users to an MG does not automatically have a greater potential to generate income and business growth compared to SHS. The consumer perspective partially confirms the trend of financial and technical sustainability challenges for MGs as the most dominant problems but their significance varies according to the rural national context. The data also indicates that technical sustainability needs to be considered along with energy generation, transition and distribution of an energy system including the end-user connection.
Reported social tensions and the potential tendency of higher-income households being more likely to obtain a connection as indicated by the data suggests that a further increasing promotion and uptake of decentralised energy systems in rural areas needs to incorporate strategies for inclusive approaches to also reach lower-income groups in the communities to ensure that ‘no-one is left behind’.
A lack of community involvement during the planning stage of the mini-grid main probably has contributed to the challenges of the Mpanta mini-grid since the actual energy needs, affordability and social barriers have not been assessed extensively. The planning and implementation process thus did not address sufficiently the potential payment issues or promoted a pre-paid metering system which might have been more suitable for the local economic conditions. In this light, the Mpanta situation the importance of early-stage community involvement for energy project planning which can potentially lead to a system design that meets community energy demands and better matches the income structure. The review of MG case—and feasibility studies has revealed that the socio-economic community context only finds limited consideration and is mirrored in ‘top-down’ energy access governance approaches and limited strategic community engagement for RE project development [
50,
54]. Consequently planning and operation of decentralised energy systems such as solar PV MGs must be based on this context and follow an interdisciplinary approach that takes into account financial, socio-economical, cultural, technical and environmental aspects, not only of the mini-grid itself—but the wider community that is expected to use the mini-grid and benefit from the provision of clean energy.
For the operational phase, tracking customer satisfaction, issues with regard to monthly payments and the evaluation of opportunities to introduce other services such as the provision of clean water, irrigation, communication or media appliances—powered by the mini-grid could potentially enhance the utilization of the electricity from the mini-grid, increase revenue and mitigate the current financial losses the system produces.
The low- and seasonal income levels create a volatile financial situation for these households which makes the payment of a monthly fixed fee often challenging. Although around 20 refrigerators are currently in use by businesses and households in Mpanta to cool soft drinks and produce ice blocks to preserve fish, the access to energy has not yet generated an increased productive use that would help to utilise energy generated and stabilise cashflows of the system.
This finding correlates with the survey data shown in the previous section which indicates that electrification, either via SHS or MG does apparently not create an automatism for income increase, particularly in Zambia. This data also indicates the need for cross-national, comparative analyses of the specific socio-economic impact of electrification via SHS and MG on rural communities to filter best practices and strategic cornerstones which can enhance the income situation of rural consumers and stabilise the financial sustainability of off-grid solutions.
The socio-economic environment of rural communities in SSA establish complex demands for energy systems delivery models [
41,
76,
82] but can also create opportunities that are substantial for the longer-term sustainability of the energy system for example with regard to the productive use of energy, modern energy cooking [
83] and the local creation of local added value. The project in Mpanta demonstrates the importance of demand utilization and a steady cash flow as conditions for a sustainable mini-grid operation. As most communities in rural Zambia and other African countries face similar challenges like Mpanta village, such as the dependency on seasonal rainfalls, small-scale farming or fishing as well as limited access to productive appliances, solutions are required to strengthen community resilience and overcome seasonality in income. The provision of clean water, internet access, training, innovative and sustainable farming methods coupled with financing schemes for low energy appliances that extend the opportunities to process agricultural products to be explored at the project planning stage. The baseline of this approach is the local value chain and the evaluation of potential added-value creation [
84]. These added services can add to an integrated infrastructure service concept that goes beyond the provision of electricity but sees energy [
85].
5.2. Implications for the Scalability of Off-Grid Systems in Africa
The literature review illustrated the substantial sustainability challenges that RE MGs face in the developing world. The in-depth evaluation of two Zambia MGs largely confirmed these challenges for the cases evaluated by providing detailed technical and financial as well as consumer-centric data which is largely missing in most case studies. The data on socio-economic community parameters and energy demands in Uganda and Zambia reveals significant challenges for the implementation of off-grid systems and contributes to the debate of the scalability of electrification efforts in SSA [
86].
5.2.1. Off-Grid Planning Approaches
Although the market—and socio-economic conditions vary among SSA countries and the development of MGs in Zambia with regard to scale is still at a rather early stage, an energy project that aims to be sustainable requires an individual extensive planning process that closely involves the local communities [
25]. These processes are complex and cost- and capacity-intensive which in turn have significant cost implications for the project development and the energy tariffs of the system that have to be charged to achieve financial sustainability which is often unaffordable for the local rural consumers. The tariff overview of Mpanta and Sinda MGs reveals significant differences in the energy tariff structures. While Sinda MG applies a pre-metered flat fee for all customers, Mpanta has a staggered tariff scheme. Despite the average household tariffs being much lower in Mpanta, the reports of payment problems and customers getting disconnected are much higher in Mpanta and in Sinda which might be due to variations in the socio-economic parameters of the community and indicate high in-country discrepancies between rural communities with regard to energy affordability.
This finding generates two important implications. First, energy research and data collection are usually focused on urban versus rural divides in developing contexts. This analysis however shows, that for community energy research, a more granular analysis of inter-community conditions in rural settings can provide important insights for the deployment and function logic of decentralized energy systems as socio-economic rural community structures are not homogenous in a country. Secondly, in the context of energy system development, this data can serve as a baseline for the sizing of the RE systems and the energy tariffs that can be charged in rural contexts. The size of the MG system must be based on the energy-utilisation potential of the energy generated as unsold kWh are revenue losses. The stocking of spare parts instead can reduce downtime and limit revenue losses if maintenance is required and the system can be upsized if energy demand and income situation improve in the future, for example through the productive use of energy [
25]. However, the technical and financial optimization potential is limited and even the bundled deployment of MGs which can further reduce maintenance costs to some extent might not achieve substantial kWh retail price reductions to match affordability levels. Interviews among developers revealed that the current average solar PV MG tariff in Zambia charged is between 0.40 to 0.49
$ per kWh. A cost-reflective RE MG tariff for a system of the Mpanta or Sinda size below 0.30
$ per kWh appears to be unrealistic, even with a further decrease in component prices at least for the near future and in similar contexts.
5.2.2. Energy Affordability Benchmarking
A detailed energy-affordability benchmarking on a national or regional level for rural SSA is essential to include in future MG scale-up strategies and can be based on data for national disposable rural household income, which however might vary between different locations. Based on the community survey data presented in this study and regional benchmarking data [
87], it can be assumed that the total disposable income for non-housing costs ranges from 1 to 2
$ per day in rural Eastern Africa. In rural Zambia, it is significantly lower.
Table 8 provides a scenario for affordable energy tariffs at the Sinda and Mpanta sites based on the current number of connected customers, MG energy output and local household income and spending levels. The calculation which has been made in local currency illustrates the significant gap between affordable and cost-reflective tariffs at both sites. It also indicates that a desired further increase in consumption, for example through the productive use, would require a further tariff reduction or careful calculation of added value and income generation through these activities as an automatic increase in household income through energy access cannot automatically be assumed at all locations as the survey data indicates. The affordability context in this scenario however is purely based on a financial calculation and does not include the dimension of energy justice. If we transfer this scenario to an average UK household connected to Sinda mini-grid, this calculation would reveal an energy tariff of around 9£ per kWh which would be hard to communicate to a UK customer. These scenarios also emphasise that energy affordability does not automatically contribute to energy justice.
5.2.3. Off-Grid Energy Tariffs
With this regard, it is generally questionable whether MG development at scale is desirable and realistic under the requirement of cost-reflective tariff setting, also in the light of energy justice. In Zambia for example, private consumers in the on-grid sector currently pay between ZMW 0.56 or
$0.02 and ZMW 2.31 or
$0.10 per kWh after a heavily debated price increase in September 2020 as on-grid energy tariffs remain subsidized in Zambia. These households represent around 31% of the Zambian population of around 5.5 million people and are mainly located in the urban areas with an average monthly income of ZMW 3152 or around
$142 [
69]. A tariff adjustment towards cost reflectiveness suggested by the Zambian Energy Regulation Board was axed by the Zambian President after serious public outcry [
88] but further tariff increases are on the horizon. Over 95% of rural households with an average household income of ZMW 810 and below or
$36 do not currently have access to the electrical grid. Interviews with project developers revealed that Zambian mini-grid customers in rural areas are currently paying around ZMW 10 per kWh under the latest MG deployment scheme [
89]. Hence, within the further roll-out of MGs in rural areas due to the limited feasibility of scaling on-grid connections exhaustively within the next decade [
54], the majority of the rural population in Zambia could be potentially facing energy tariffs that are up to 20 times higher than in grid-connected urban areas despite them having a much lower household income. This is not simply unjust or questionable with regard to economic feasibility, it also bears the potential of future political or civil rifts as the energy sector is a highly debated and critical topic in Zambia [
88].
A more just approach could either integrate on- and off-grid energy planning and implementation under a national tariffing scheme which, if scaled, must also address specific requirements in terms of energy distribution and demand-side management which will require significant technology investment in developing countries [
90,
91,
92,
93]. The management of a potential future integration of MGs in the national electricity grid upon grid arrival should be a component during the MG planning stage and must also be sufficiently addressed by the regulatory frameworks to avoid decommissioning of the MG upon grid-arrival due to limited tariff competitiveness. On national level, strategic energy planning scenarios should account for the projected or potential integration of solar PV MGs and other decentralised energy sources such as wind- or hydropower into the national grid in terms of infrastructure investment—as well as demand-management planning, to avoid future drawbacks on the grid if this is going to be further extended in the future [
94,
95].
Alternatively and since off-grid electrification is heavily driven by foreign donor engagement [
43], funding strategies could shift from a purely OPEX-based approach to a blended model that includes a tariff subsidy component to trigger energy consumption and include longer-term results-based funding (RBF) components [
83] that are focused on MG operation and utilisation of electricity generated. This model would then ideally include a scenario of shifting towards cost-reflectiveness after a certain period of time when the targeted measures implemented alongside the MG deployment to increase income through productive use of energy, irrigation or improved farming methods for example triggered the desired income generation and stabilisation. This strategy could also potentially incentivise the implementation of financially and technically more optimised solutions, encourage CAPEX-reduction and incentivise the longer-term sustainable operation of the MG.
6. Conclusions
This study presents an interdisciplinary approach to evaluate the sustainability of RE mini-grids in SSA incorporating the technical, financial and communal dimensions. A comprehensive literature review, community survey data from Uganda and Zambia as well as the in-depth evaluation of two MG case studies from Zambia reveals the interdependency of financial—technical—and social sustainability.
The study has shown that an off-grid system is operationally sustainable if it can provide affordable energy access and deliver the desired outcomes over its estimated lifespan and that these interdependencies, however, exist partially in tension with each other. Social sustainability which includes affordable tariffs, for example, can bear trade-offs for example with financial sustainability in terms of recovering MG development—and operation costs. Consequently, sustainable off-grid electrification in sub-Saharan Africa requires an approach that goes beyond a top-down planning process that is solely focused on the provision of electricity.
Actual community energy needs and demands as well as the socio-economic structure are critical components for the long-term sustainability of energy systems and must be taken into account when an MG is going to be developed and implemented.
The interdisciplinary study allows five general conclusions with regard to the implementation of RE MGs in developing contexts:
Current MG energy tariffs are often yet far beyond local affordability levels which is also related to the requirement of tariff cost-reflectiveness in most SSA countries, high equipment costs and oversized systems. Consequently, local affordability levels should function as a key baseline for MG-planning- as well as wider electrification processes and design the systems based on local income and energy demand levels. This approach also includes close monitoring and benchmarking of system costs (CAPEX), especially if projects are donor-funded, the realistic sizing of the system as well as the acknowledgement of key community challenges that trigger low and intermittent incomes. These considerations also open the general debate whether it is realistic to achieve national energy access goals for low-income, rural areas until 2030 through the application of cost-reflective tariff schemes or whether rural energy consumption can only be triggered through mid- to longer-term energy tariff subsidies.
The complex challenges for rural African communities that are dependent on small-scale farming or fishing undermine the longer-term financial sustainability of MGs and are likely to be exacerbated by the effects of climate change. In addition to that, limited access to productive appliances, a of local know-how, decency on seasonal rainfalls and a lack of local capital often restrict rural communities from the uptake of the energy provided through off-grid systems.
Integrated planning approaches that flank energy system development and which focus on overcoming these specific challenges, for example through providing irrigation, training or access to appliances including financing schemes. Consequently, this paper calls for a change of the energy-access narrative from the focus of systems deployed or connections provided to the consideration of energy as a tool to support rural socio-economic development through the creation of added value and as one infrastructure component to be implemented alongside bundled measures that target key challenges for rural communities. The access to affordable and good quality appliances for private or commercial use in rural areas is still a major challenge and the establishment of affordable supply—and maintenance systems in the appliance sector are thus key to the utilisation of energy.
From a policy level, the findings suggest the promotion of feasibility studies that realistically benchmark local income—and projected energy tariff levels during the project planning and -application stage, support mechanisms for enhanced community engagement beyond the sole local approval of energy projects and the promotion of integrated infrastructure solutions. Projects publicly funded by donors or local government need to be closely evaluated in terms of CAPEX and prospected CAPEX in terms of realistic market pricing.
The scaling of sustainable RE mini-grids requires innovative financing approaches that go beyond pure upfront CAPEX grant-financing. Infrastructure solutions in rural settings of developing countries must be considered in the context of their operational environment, the community ecosystem which determines the sustainability of these solutions. The current trend of implementing largely grant financed, CAPEX intensive solutions with very limited community involvement does neither incentivize the productive use of energy through lower tariffs nor facilitate long-term sustainability and operation of these systems. The clustering of mini-grids can help in lowering down CAPEX and OPEX which can create a positive impact on energy tariffs and consumption. The provision of electricity is only one element of mini-grid planning and need to be aligned with energy uptake and added-value generating productive use of energy. Results-based financing approaches and carbon-credit financing that focus on longer-term mini-grid operation and energy uptake can be a key element of future financing approaches with this regard but require further research in terms of practical applicability.
The scaling of sustainable off-grid energy systems also requires adequate regulatory frameworks that technical quality, frictionless project implementation, strategic energy planning scenarios that integrate the on-and off-grid sectors flanked by investigating future grid-distribution strategies.
The danger of creating ‘White Elephants’ at scale, grant financed projects that are unsustainable and will be abandoned if operation costs permanently exceed revenues, is very real. The $1.3 million Mpanta mini-grid, which was commissioned in 2013, is currently on the brink of being decommissioned as the national electrical grid is now just about two km away from the village and due to replace the mini-grid very soon. According to REA Zambia, the solar PV mini-grid will be decommissioned. Batteries will be sold to a recycling plant. There are currently no plans available for utilising other assets of the mini-grid.


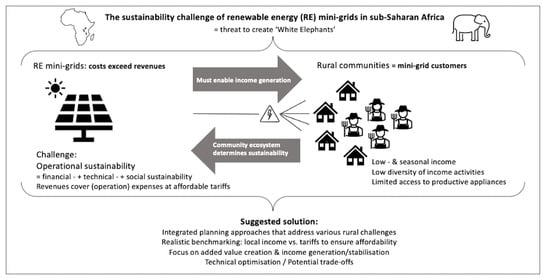

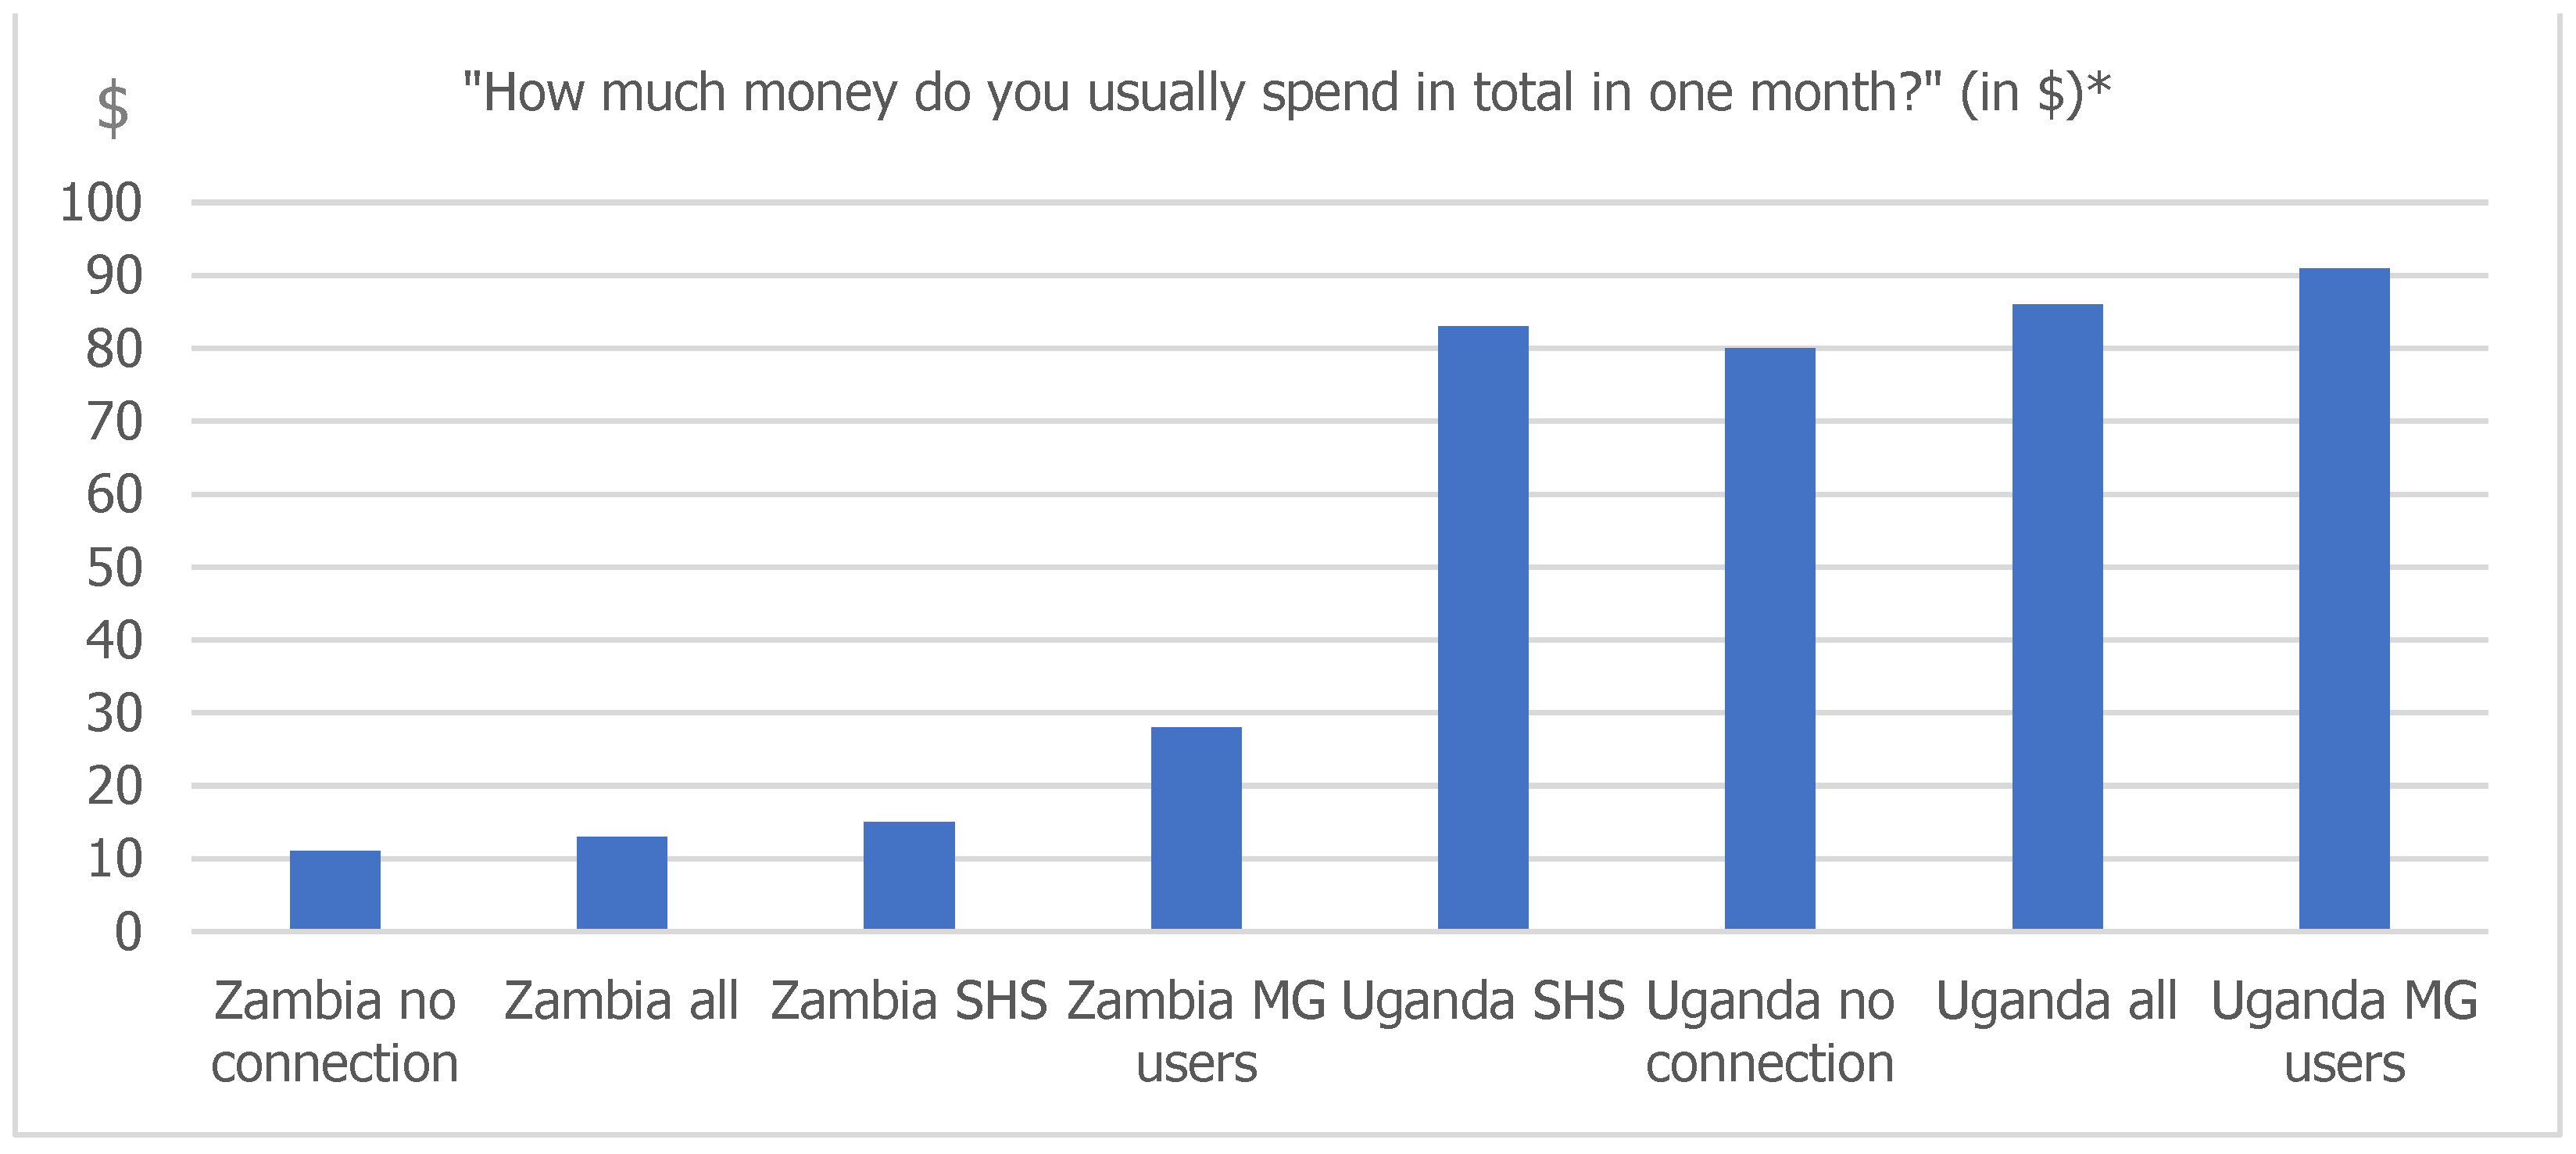
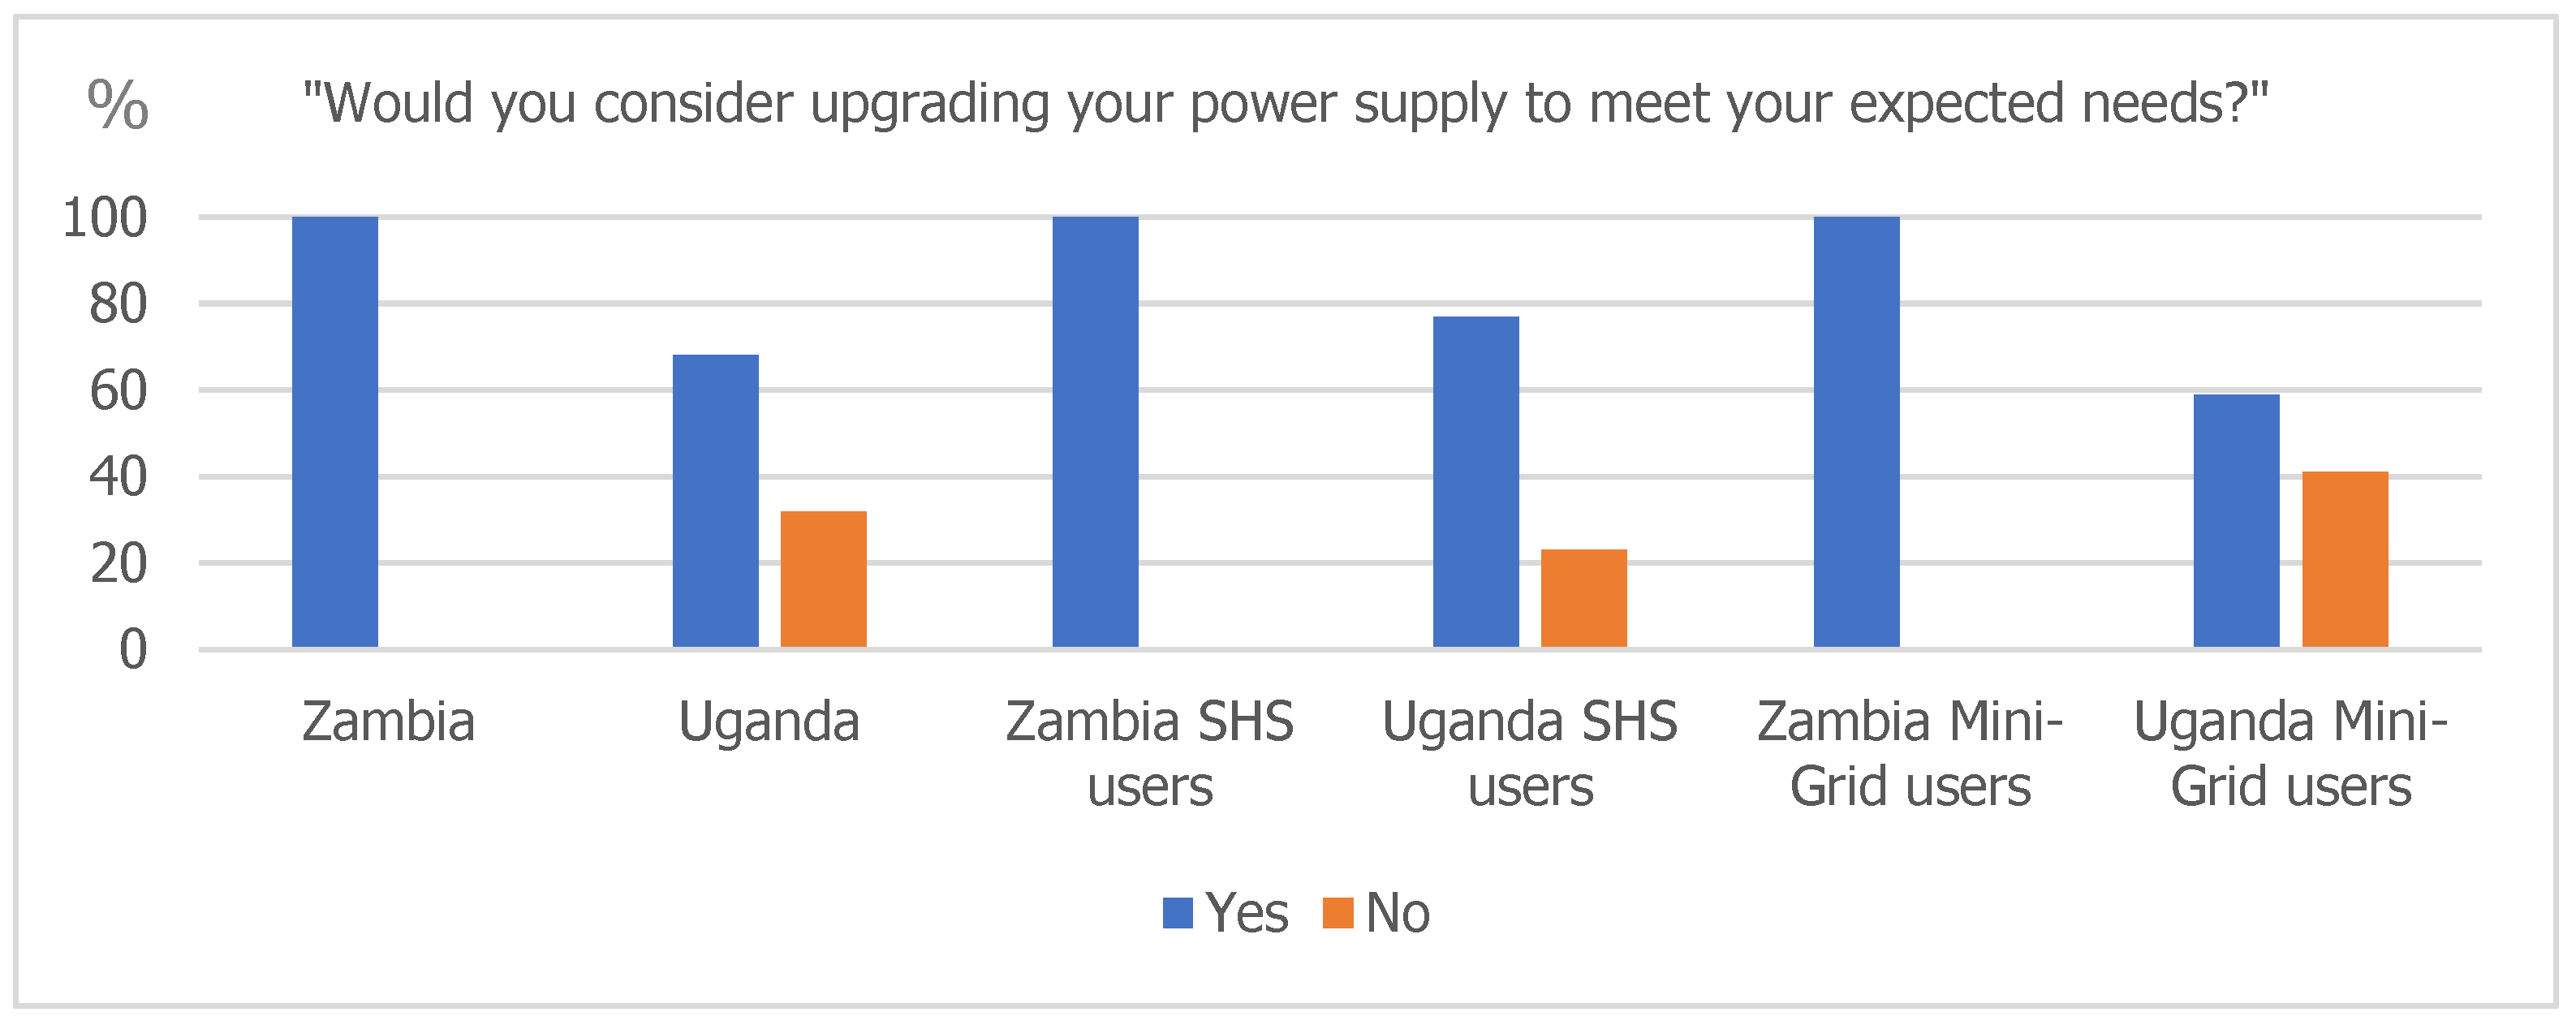
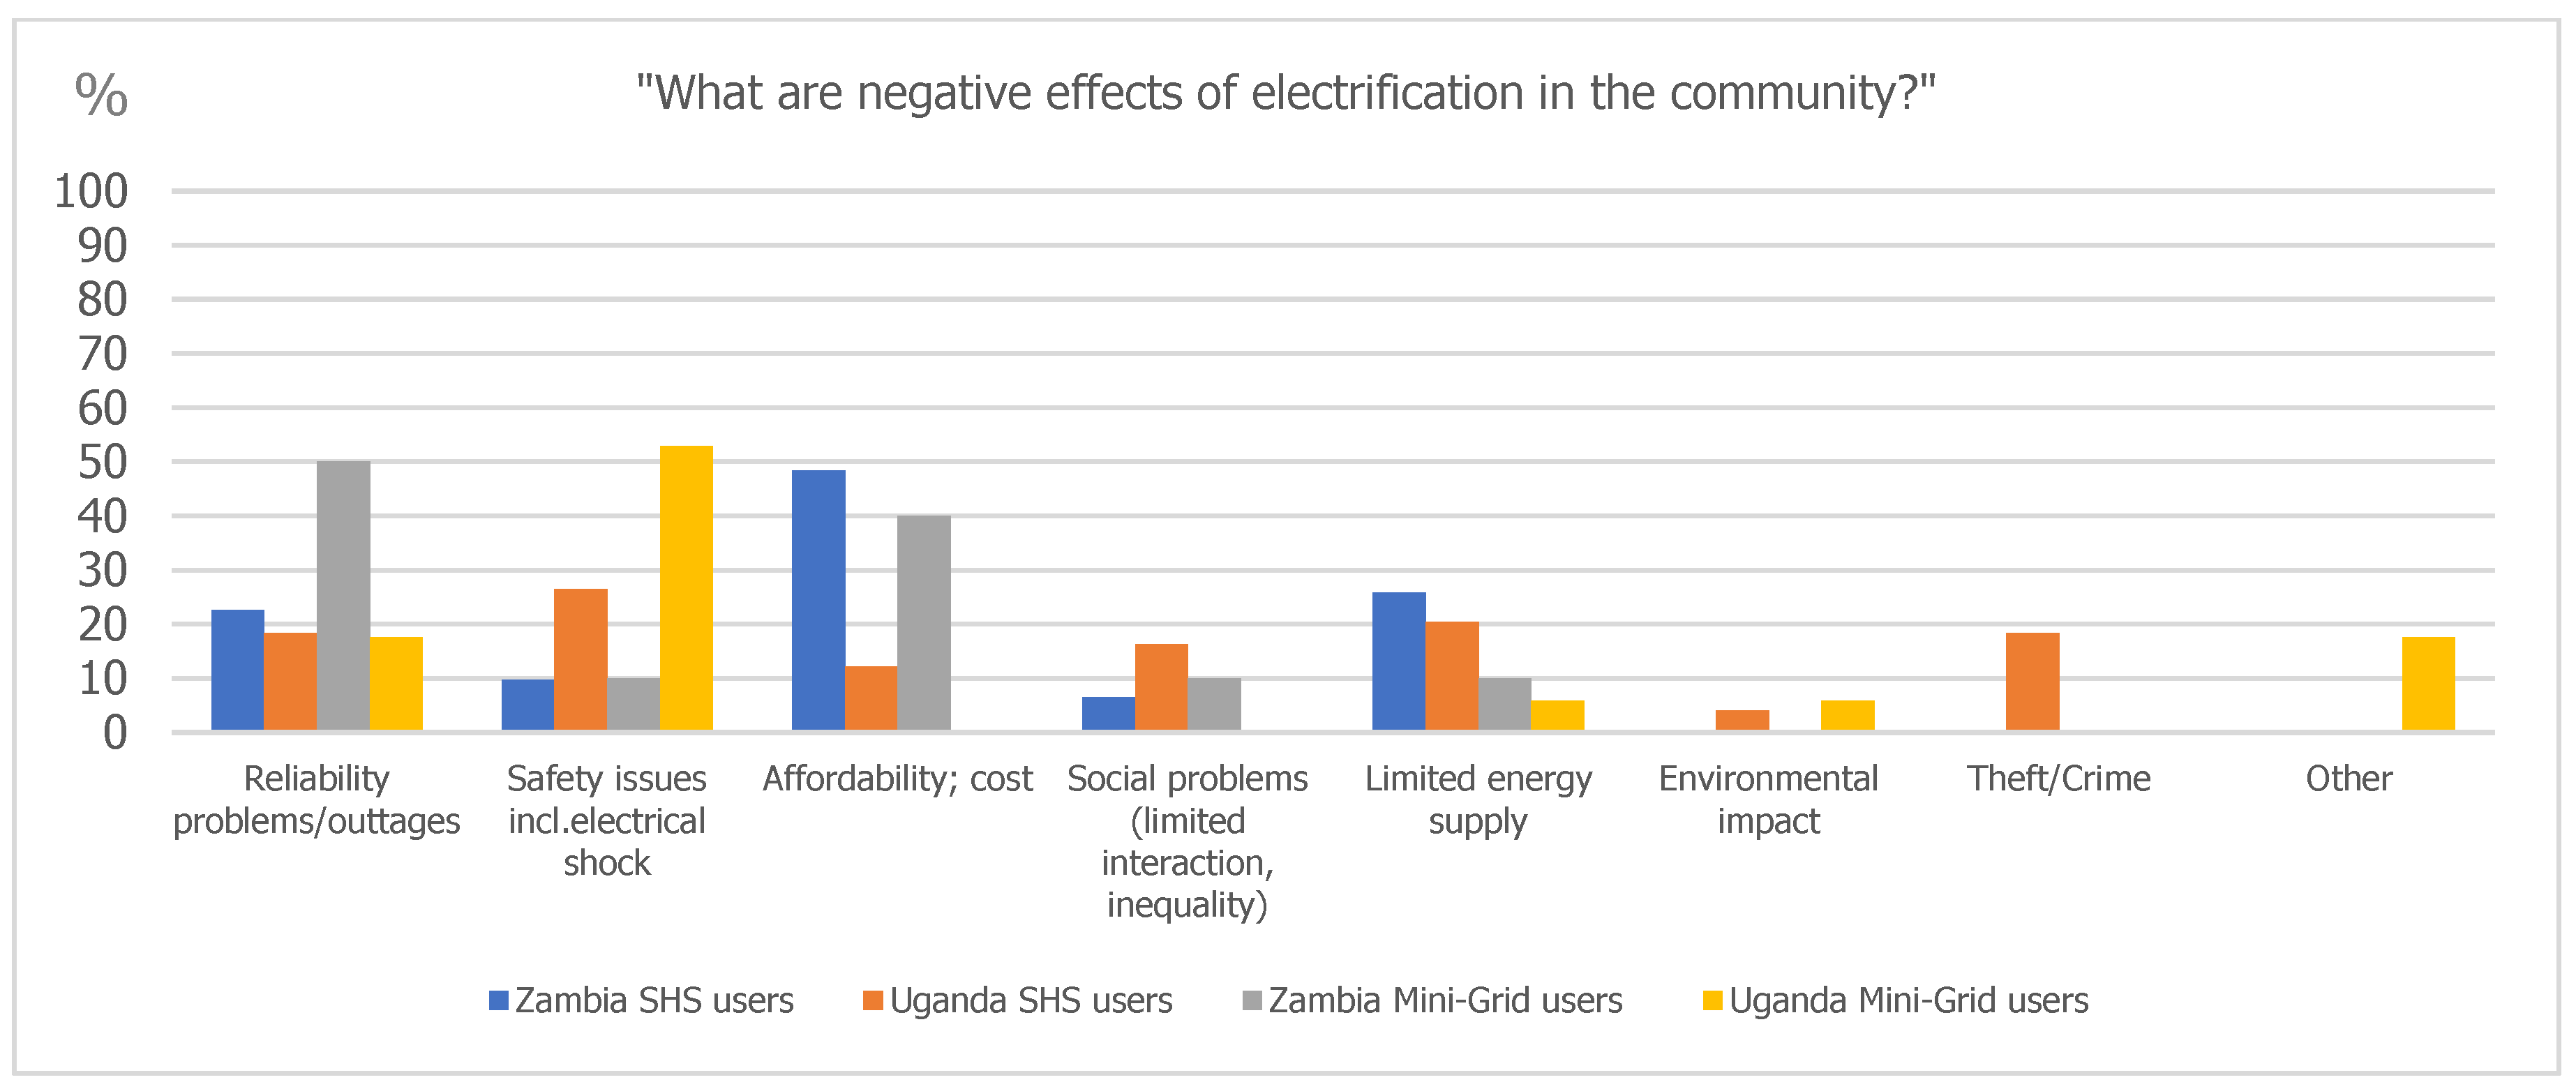
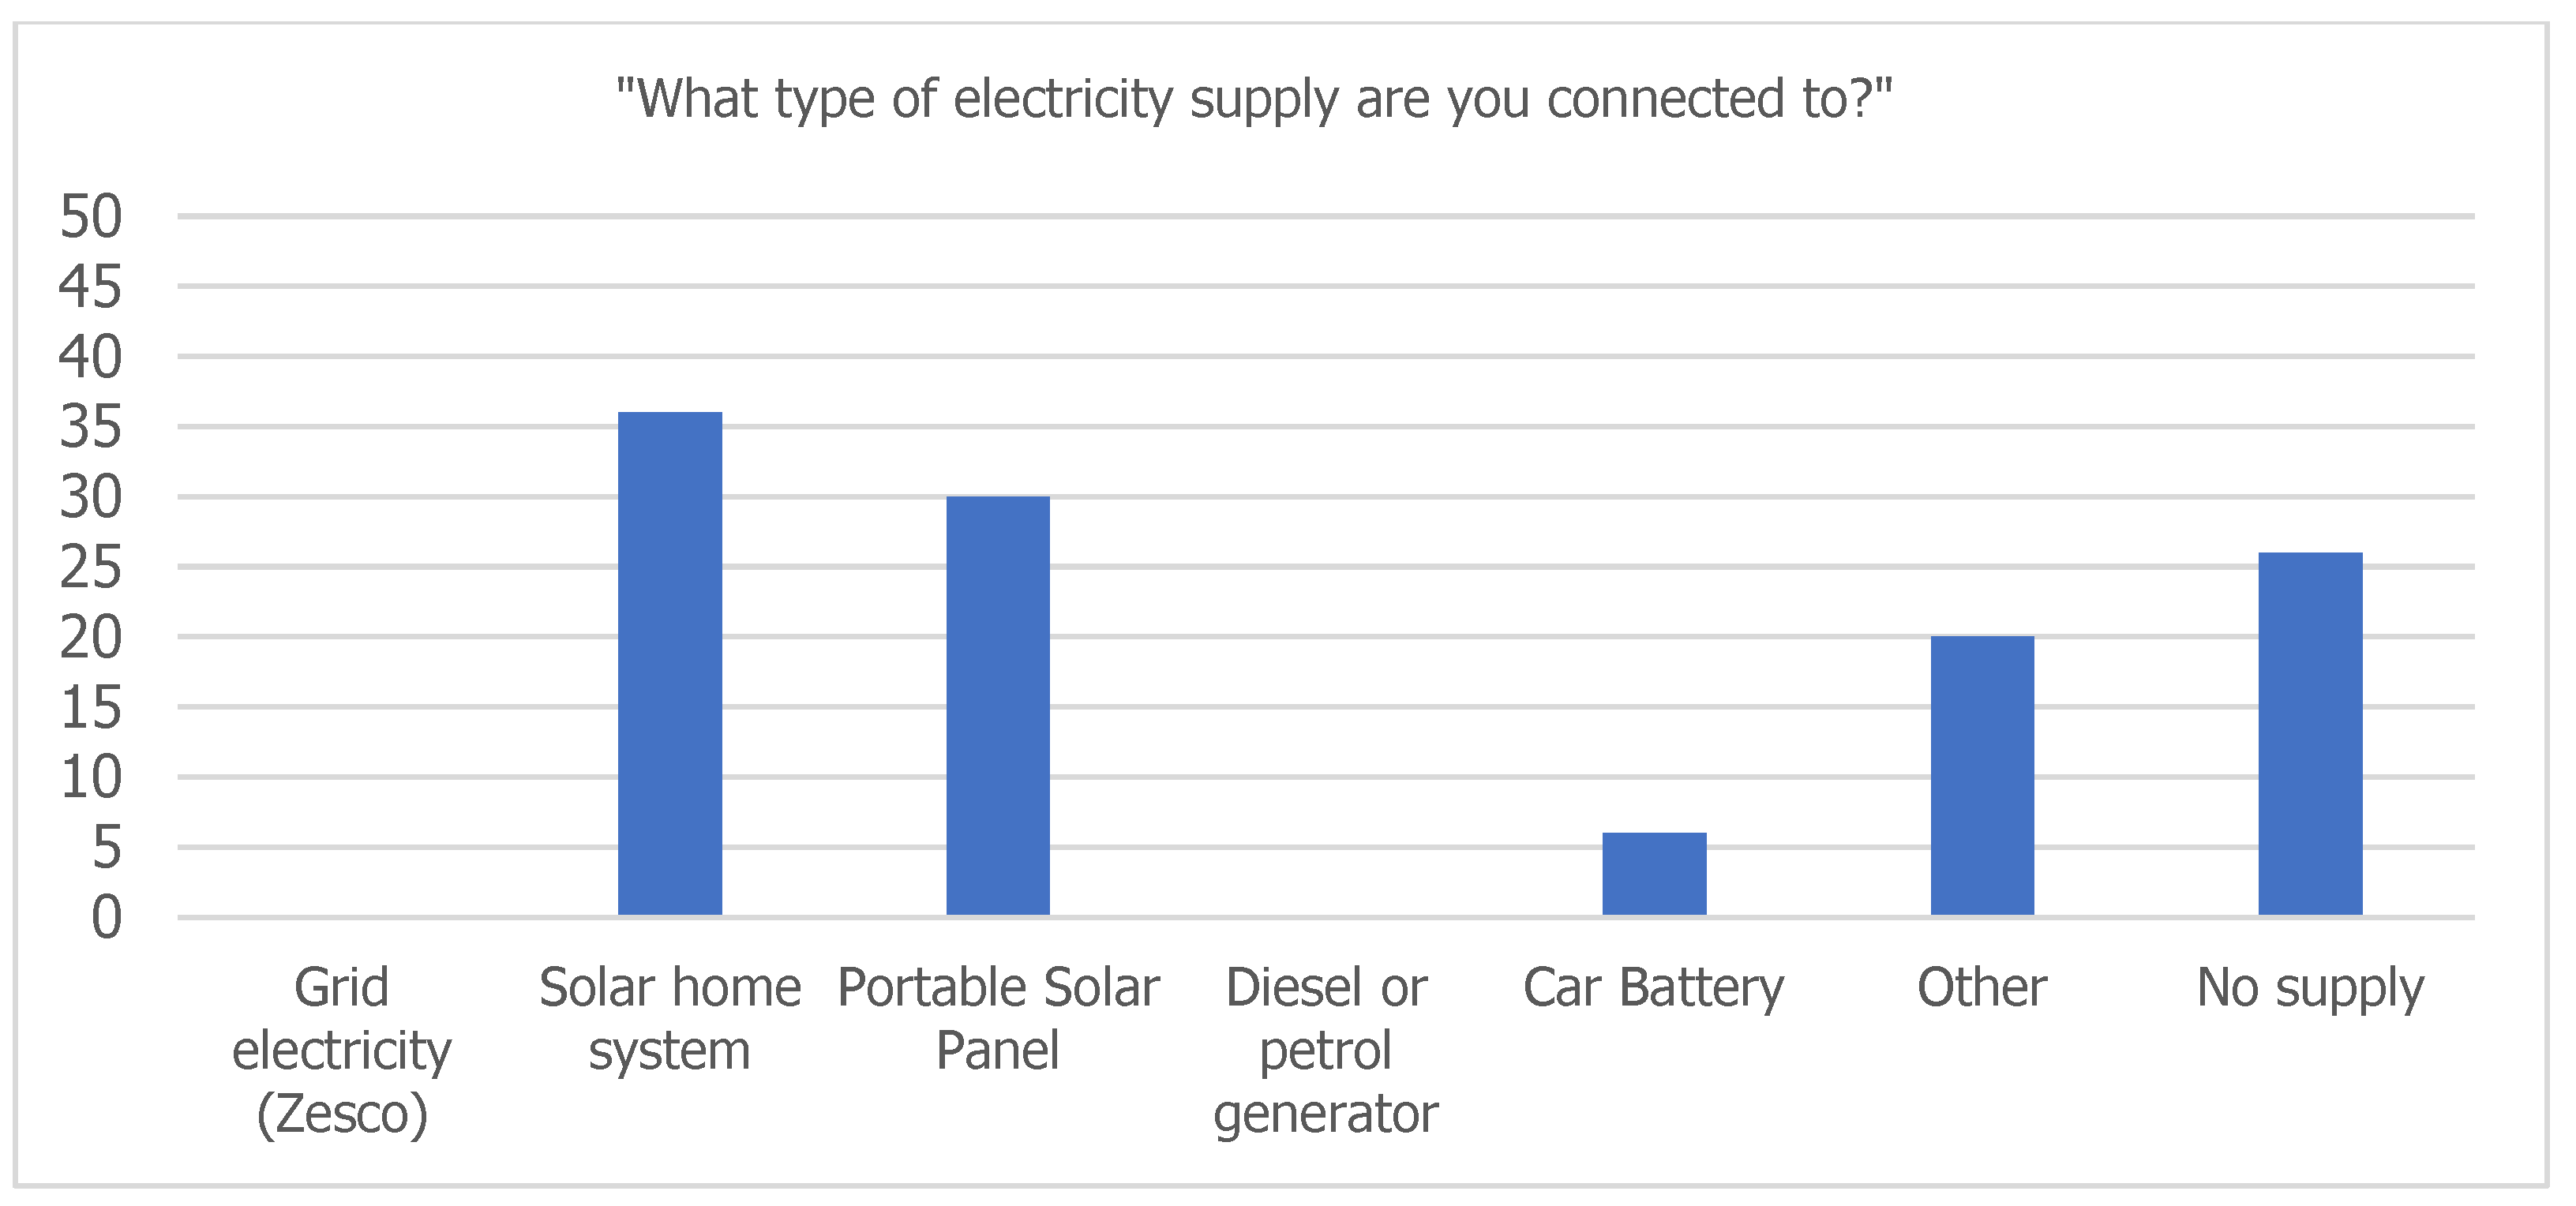
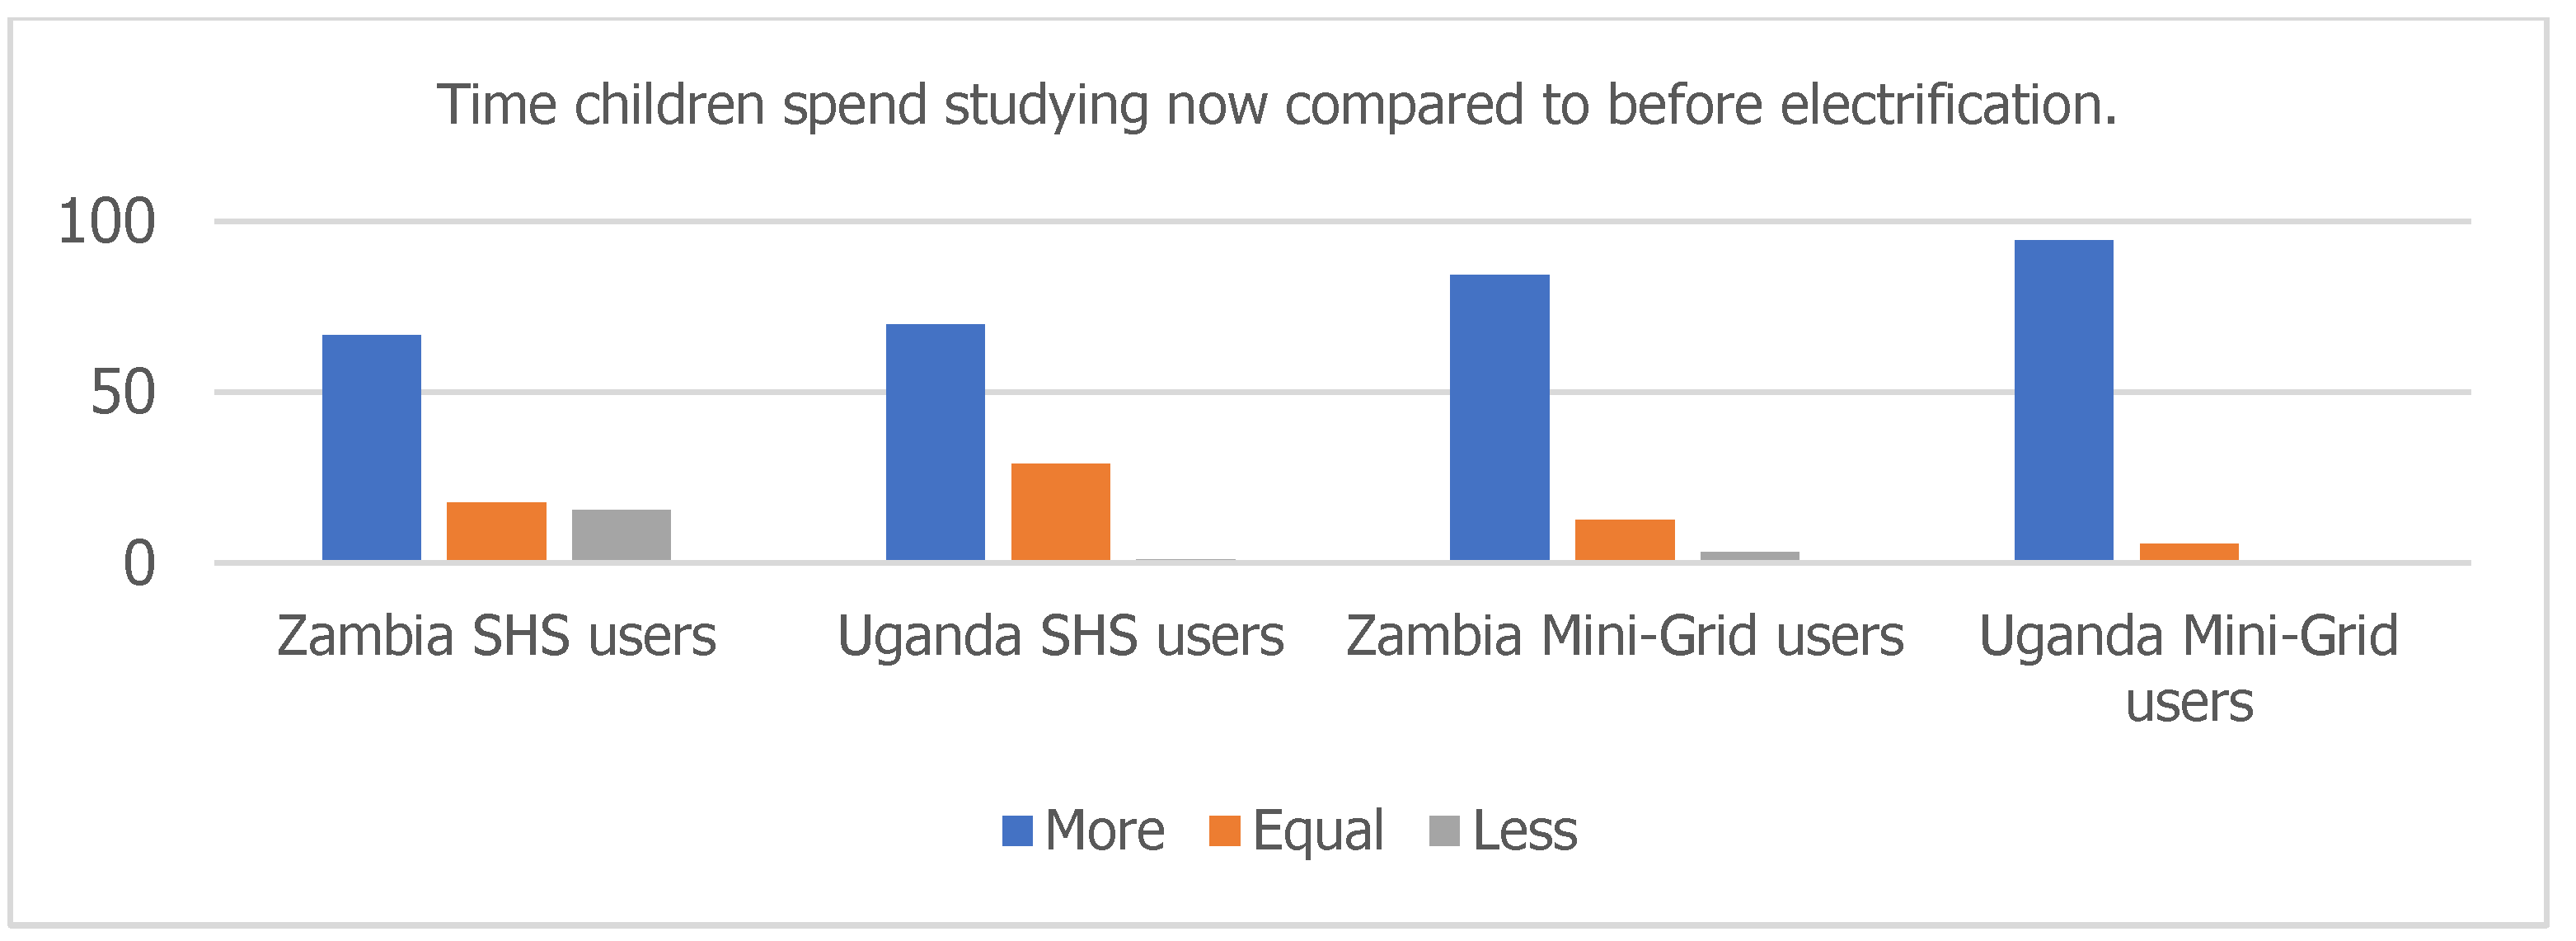
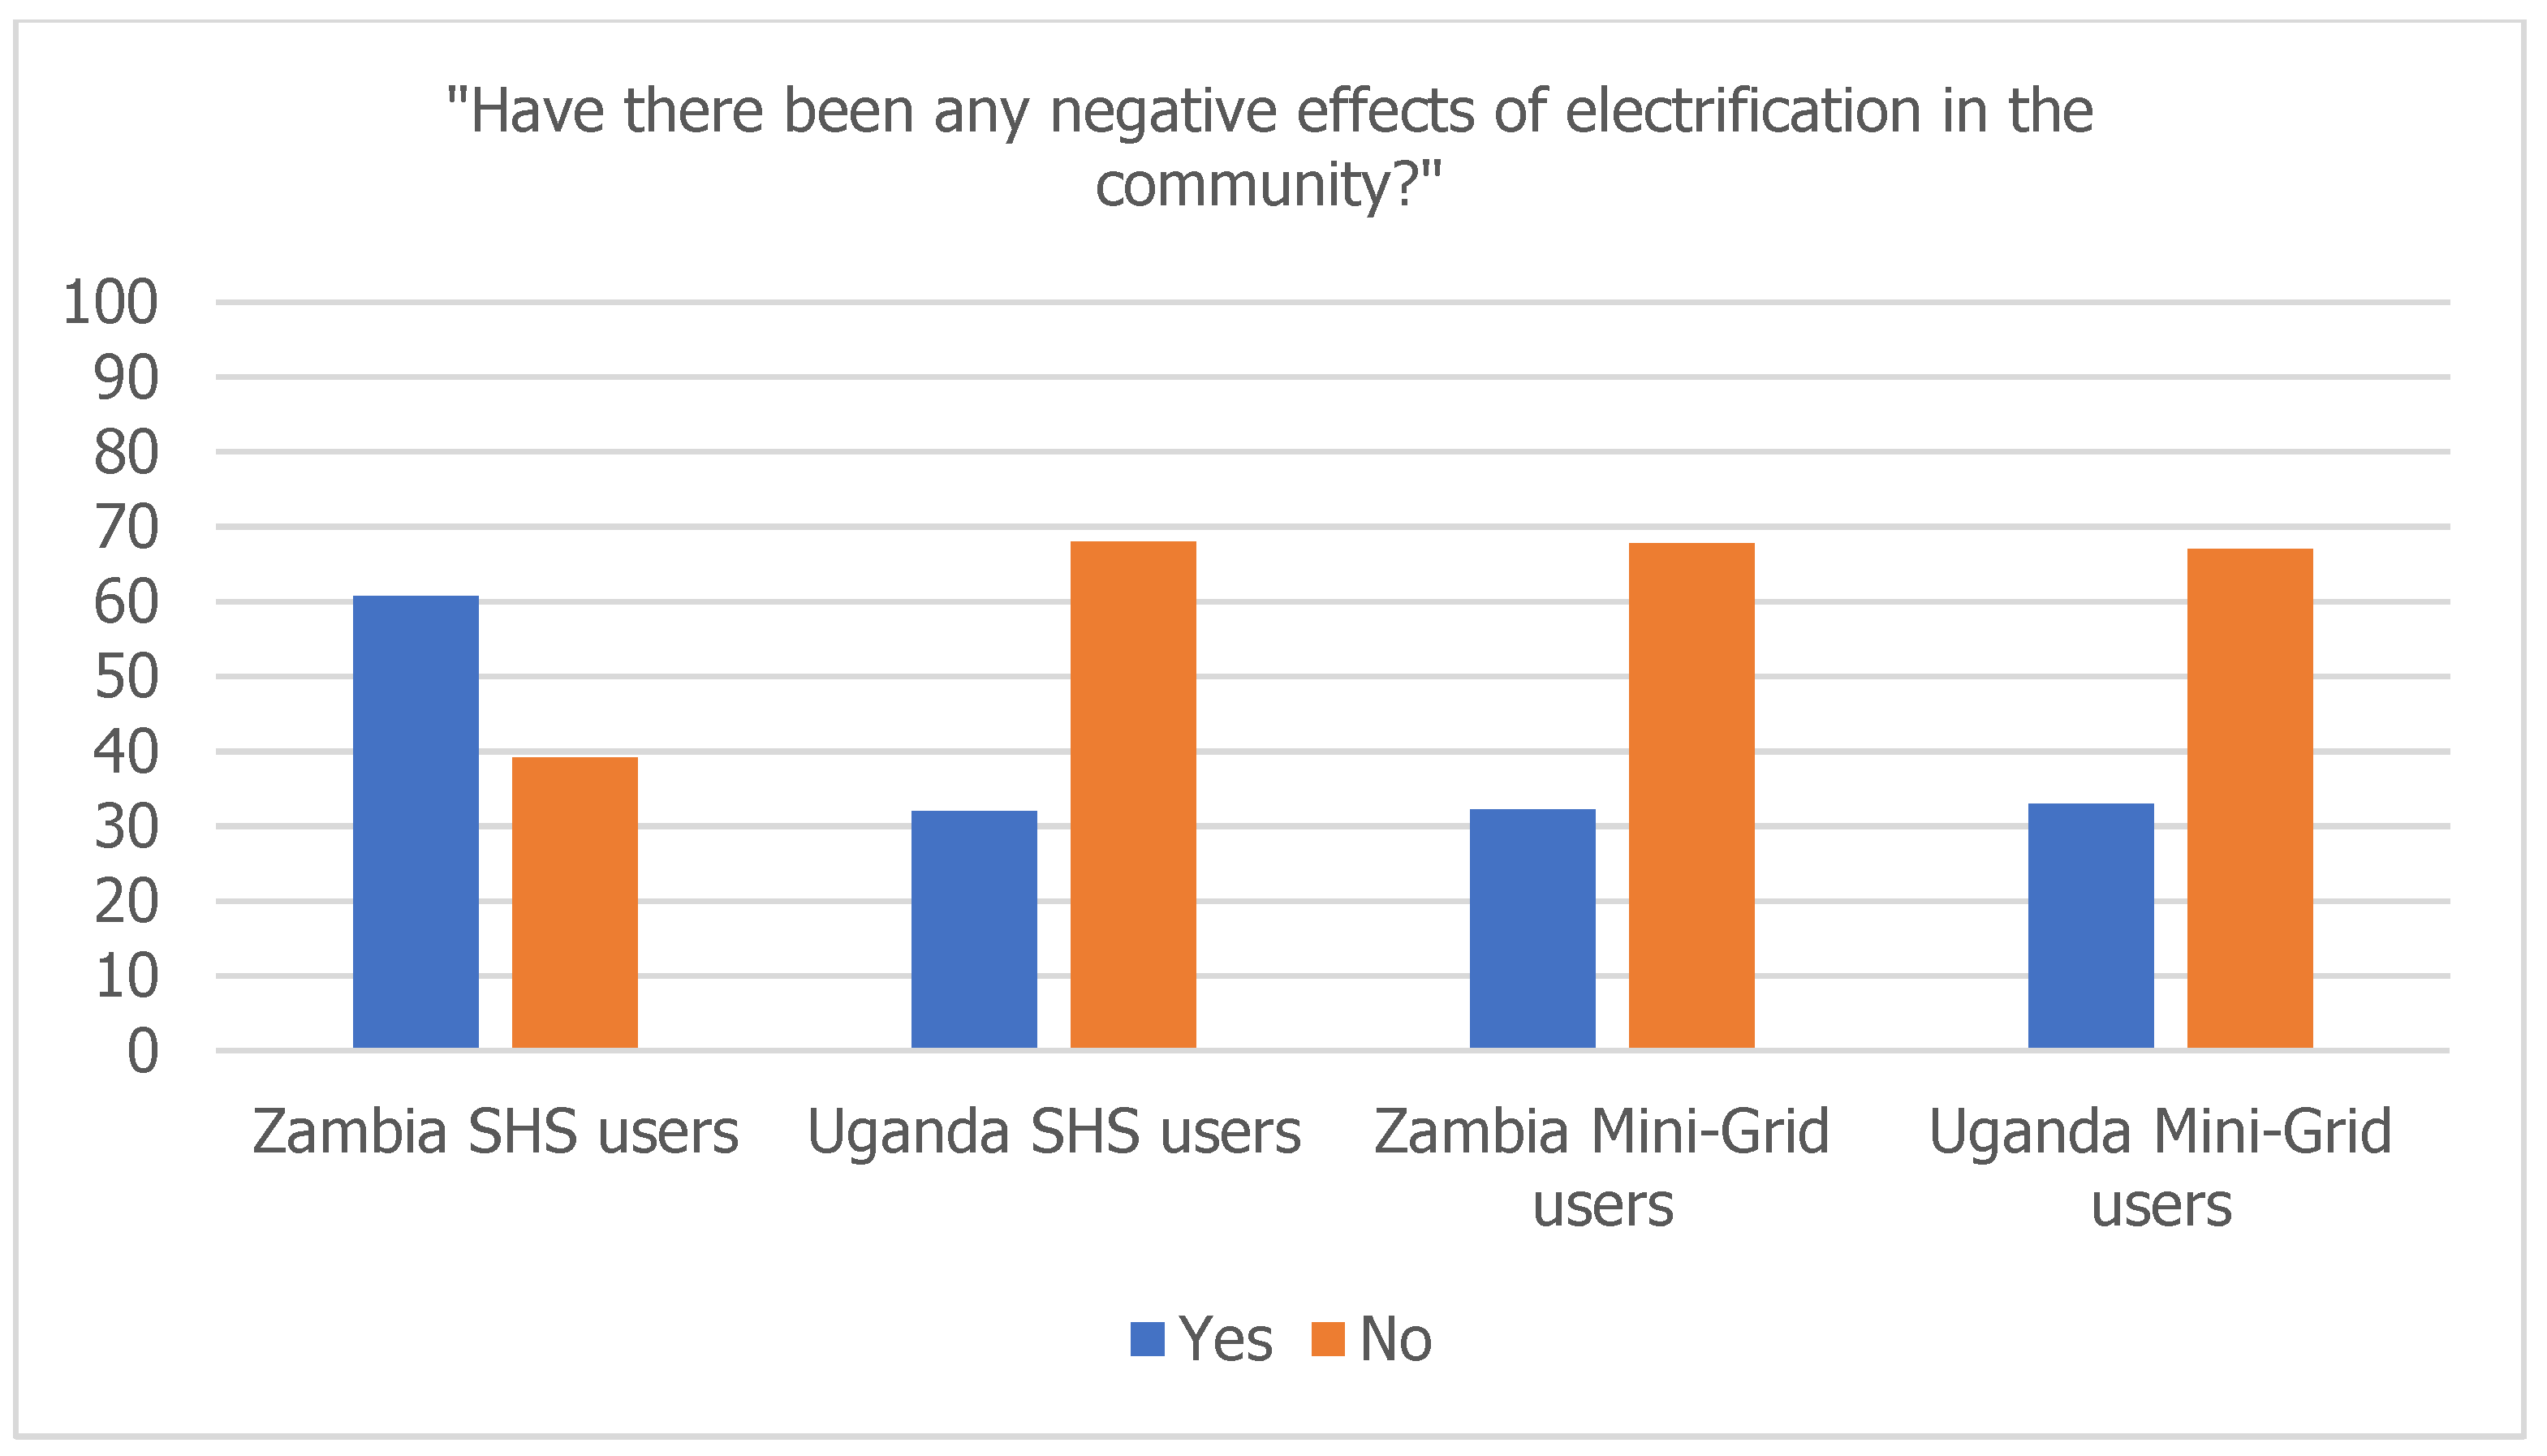


