
Simulations of Airflow in the Roof Space of a Gothic Sanctuary Using CFD Models


Abstract
:1. Introduction
2. Materials and Methods
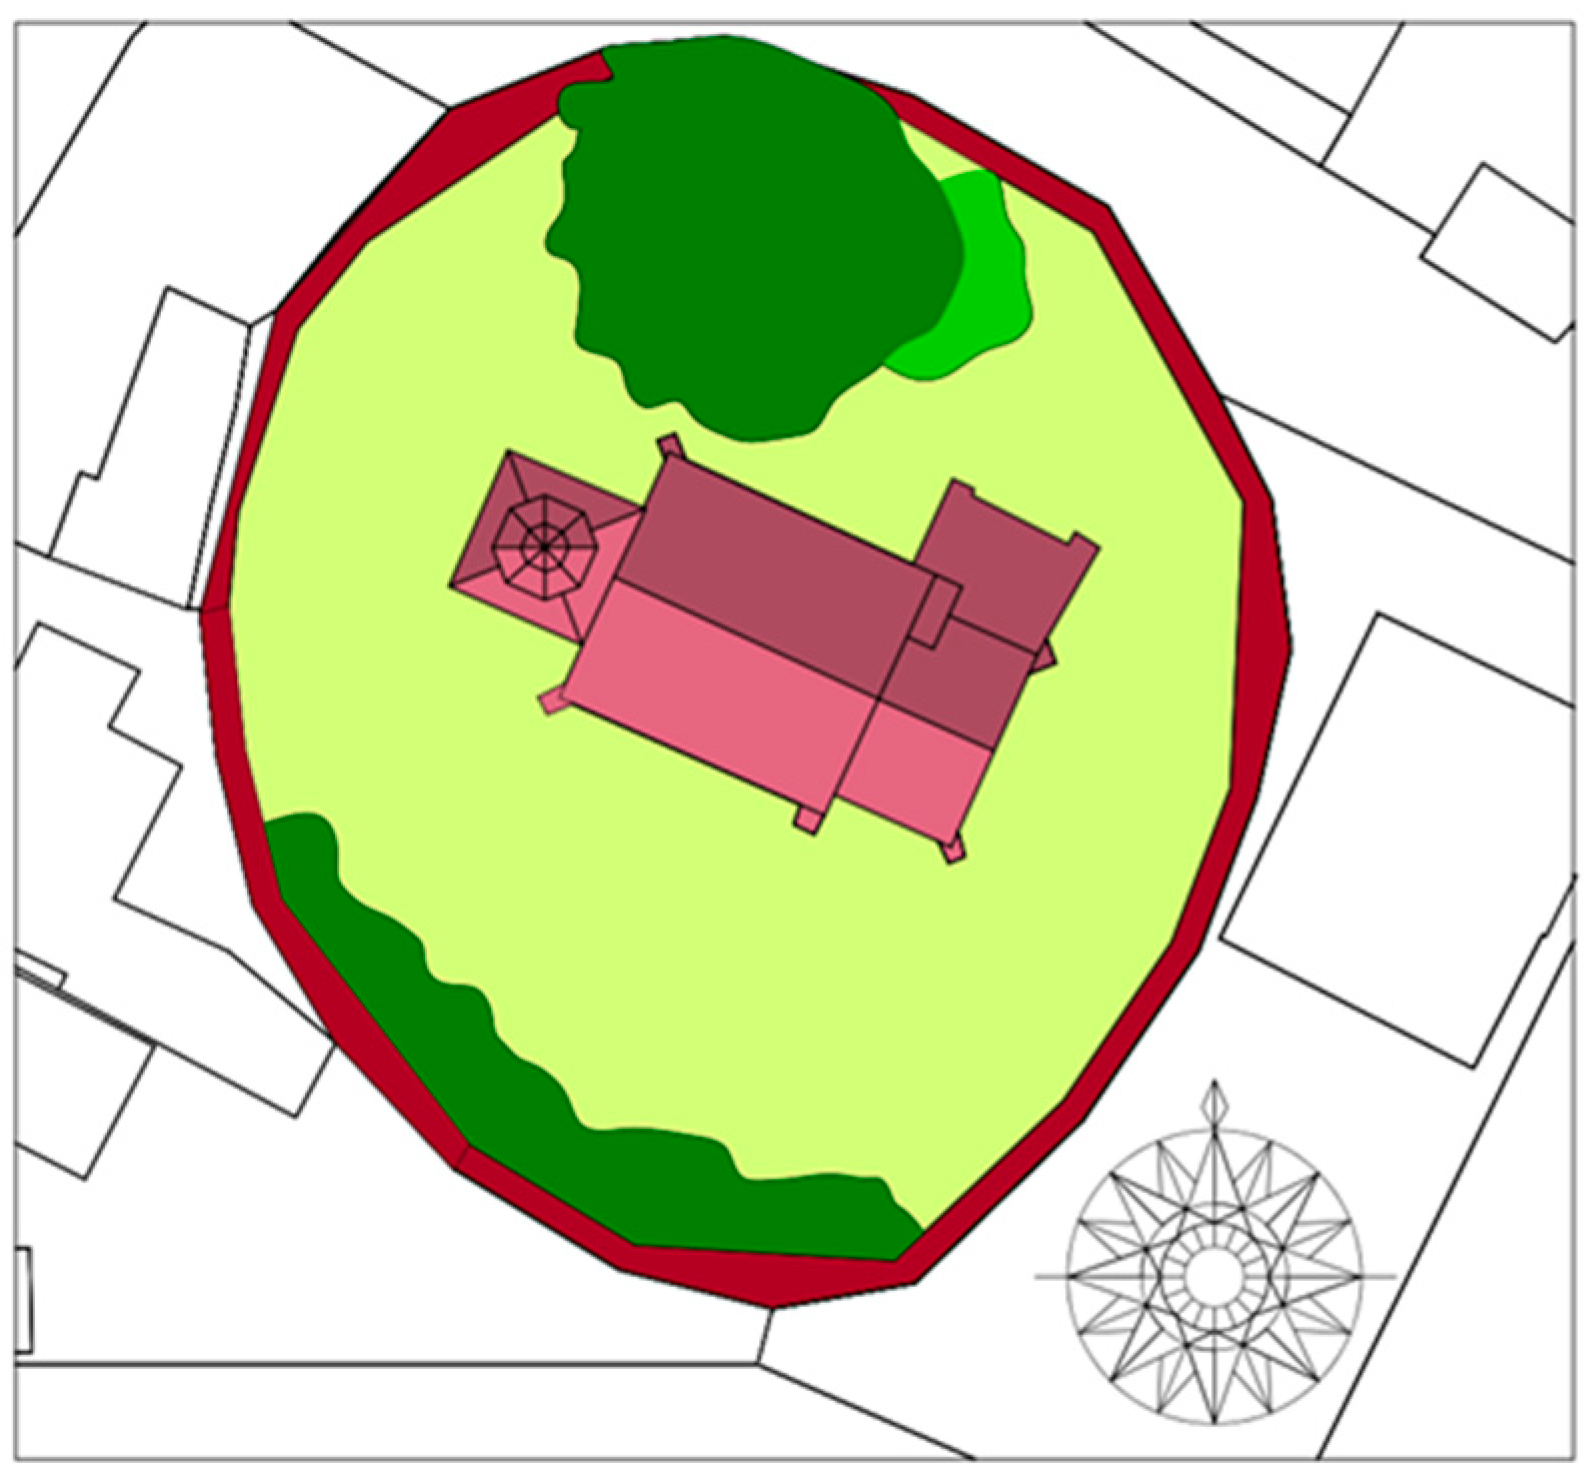
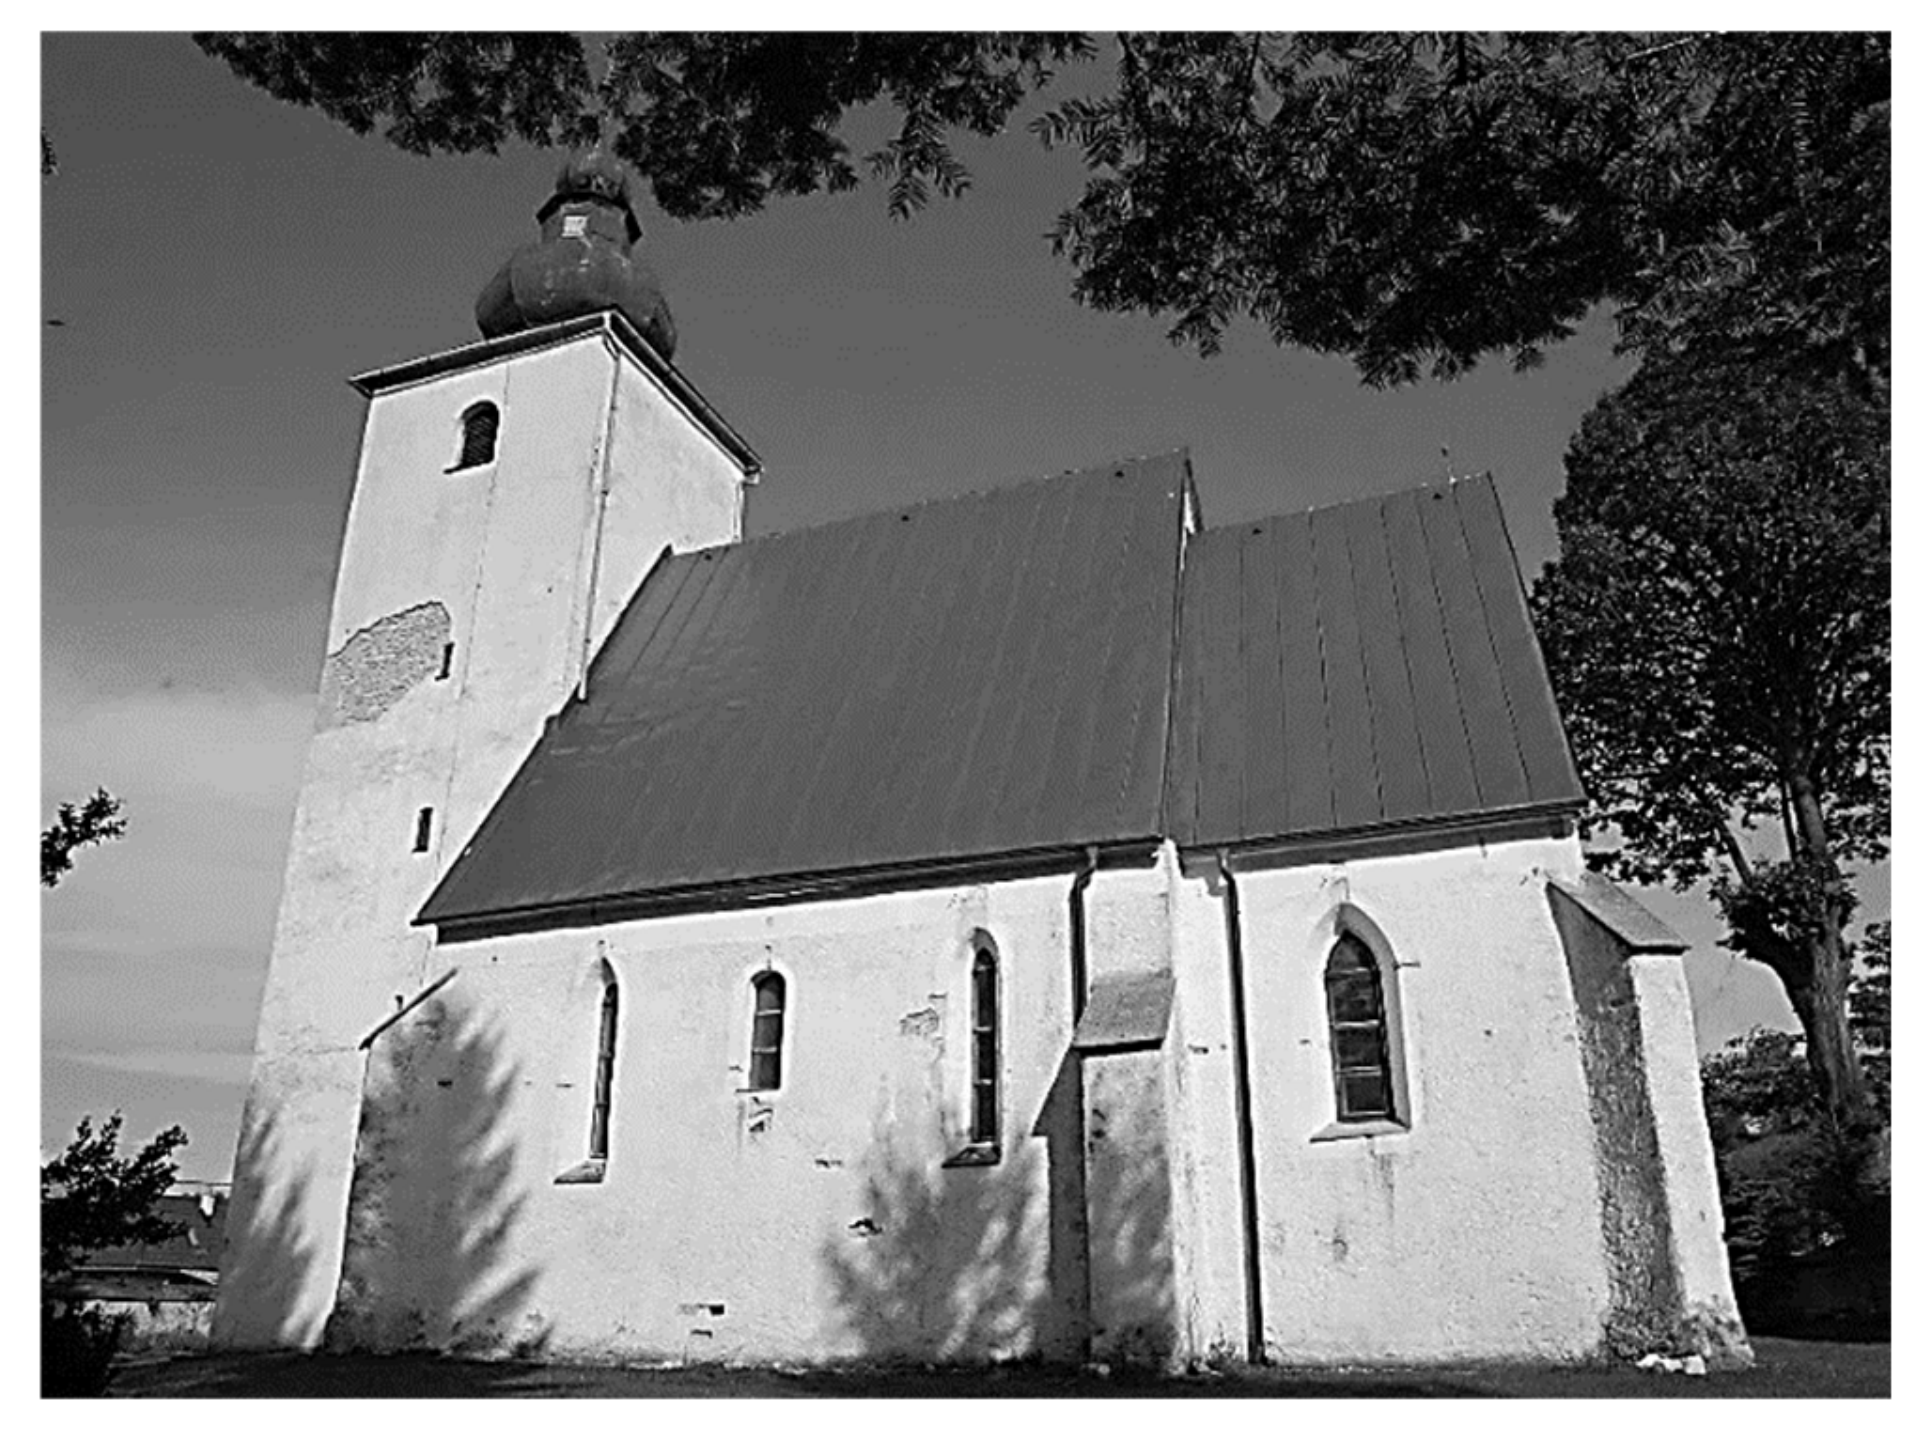
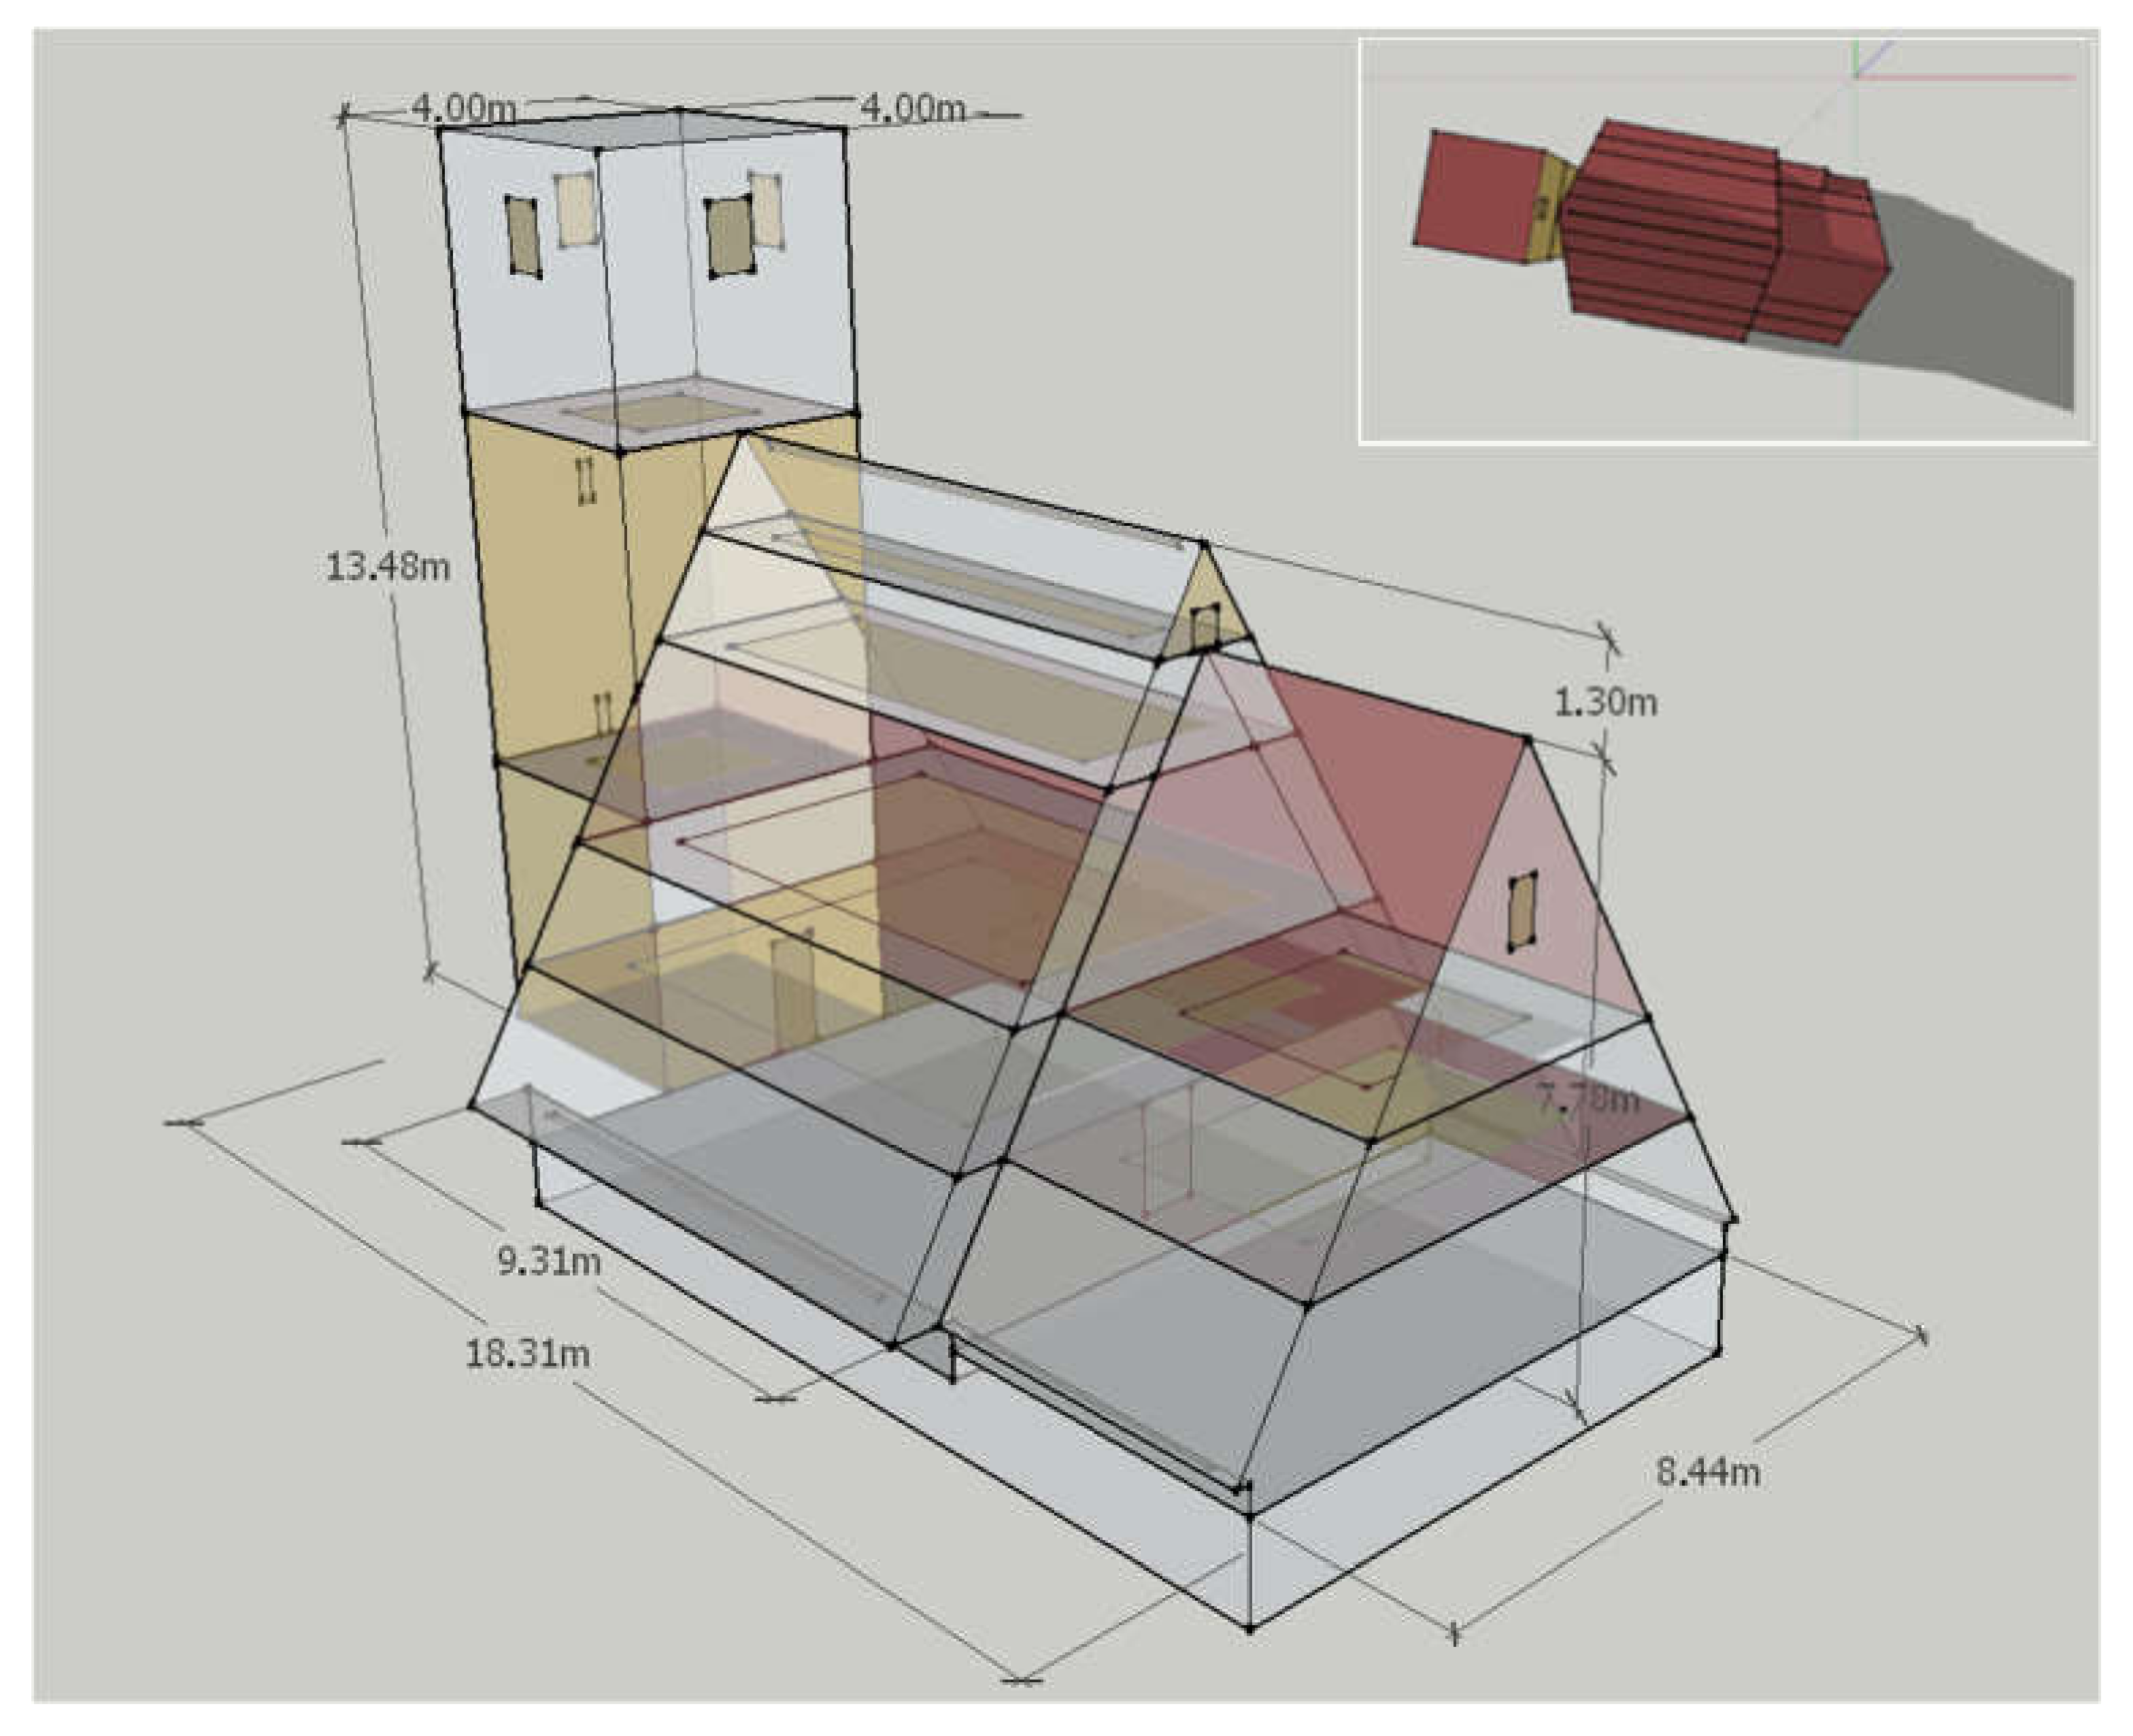
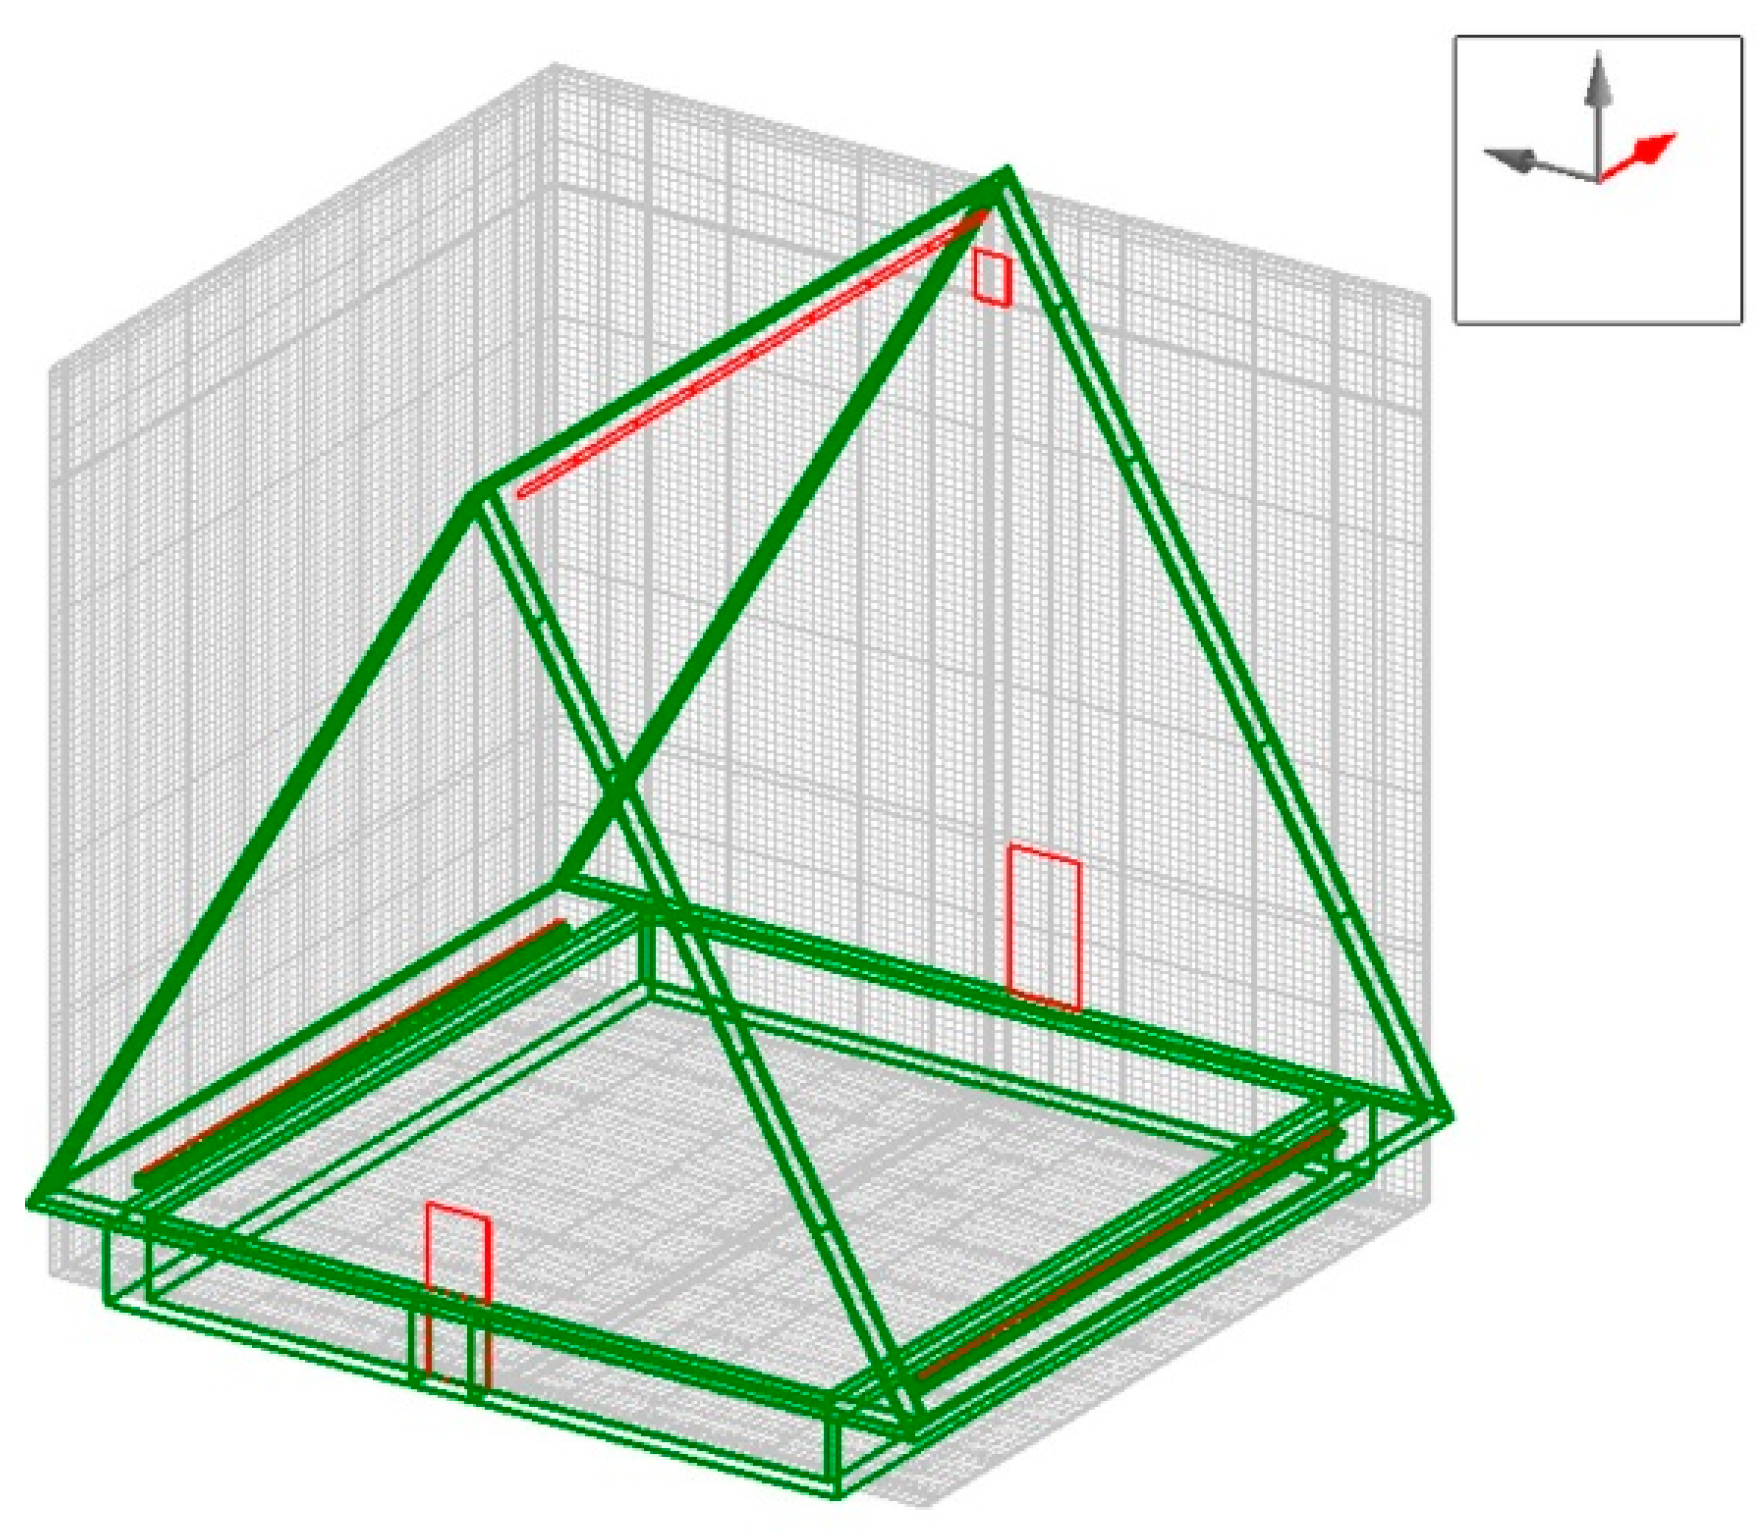
2.1. Examined Truss Roof Space
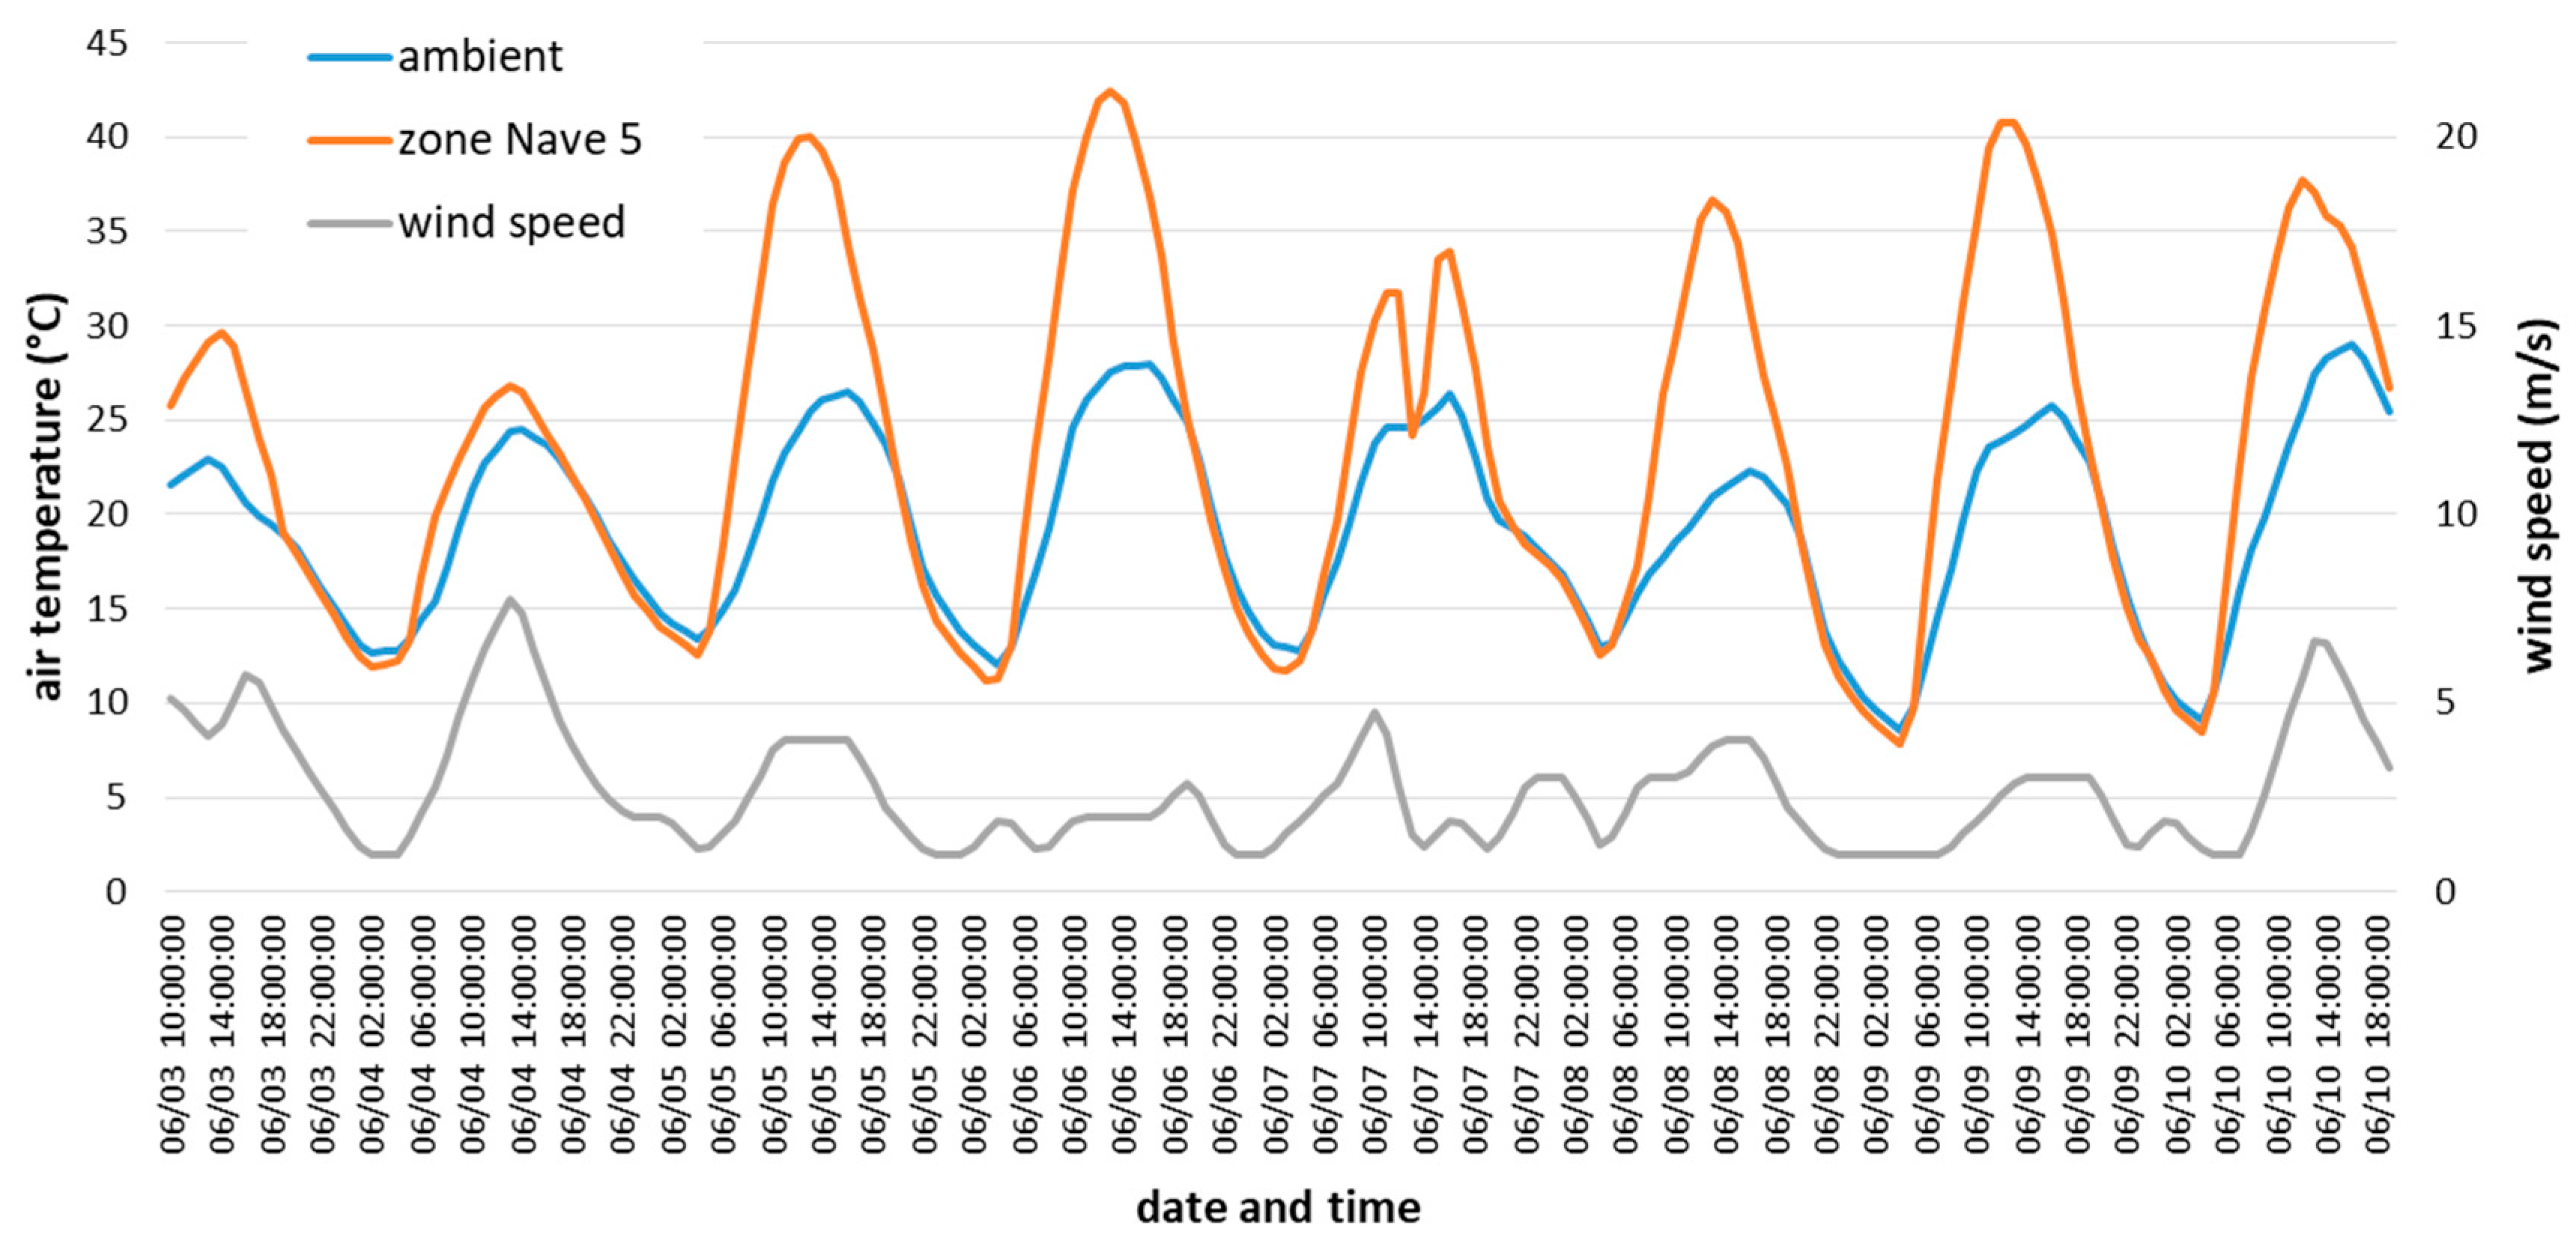
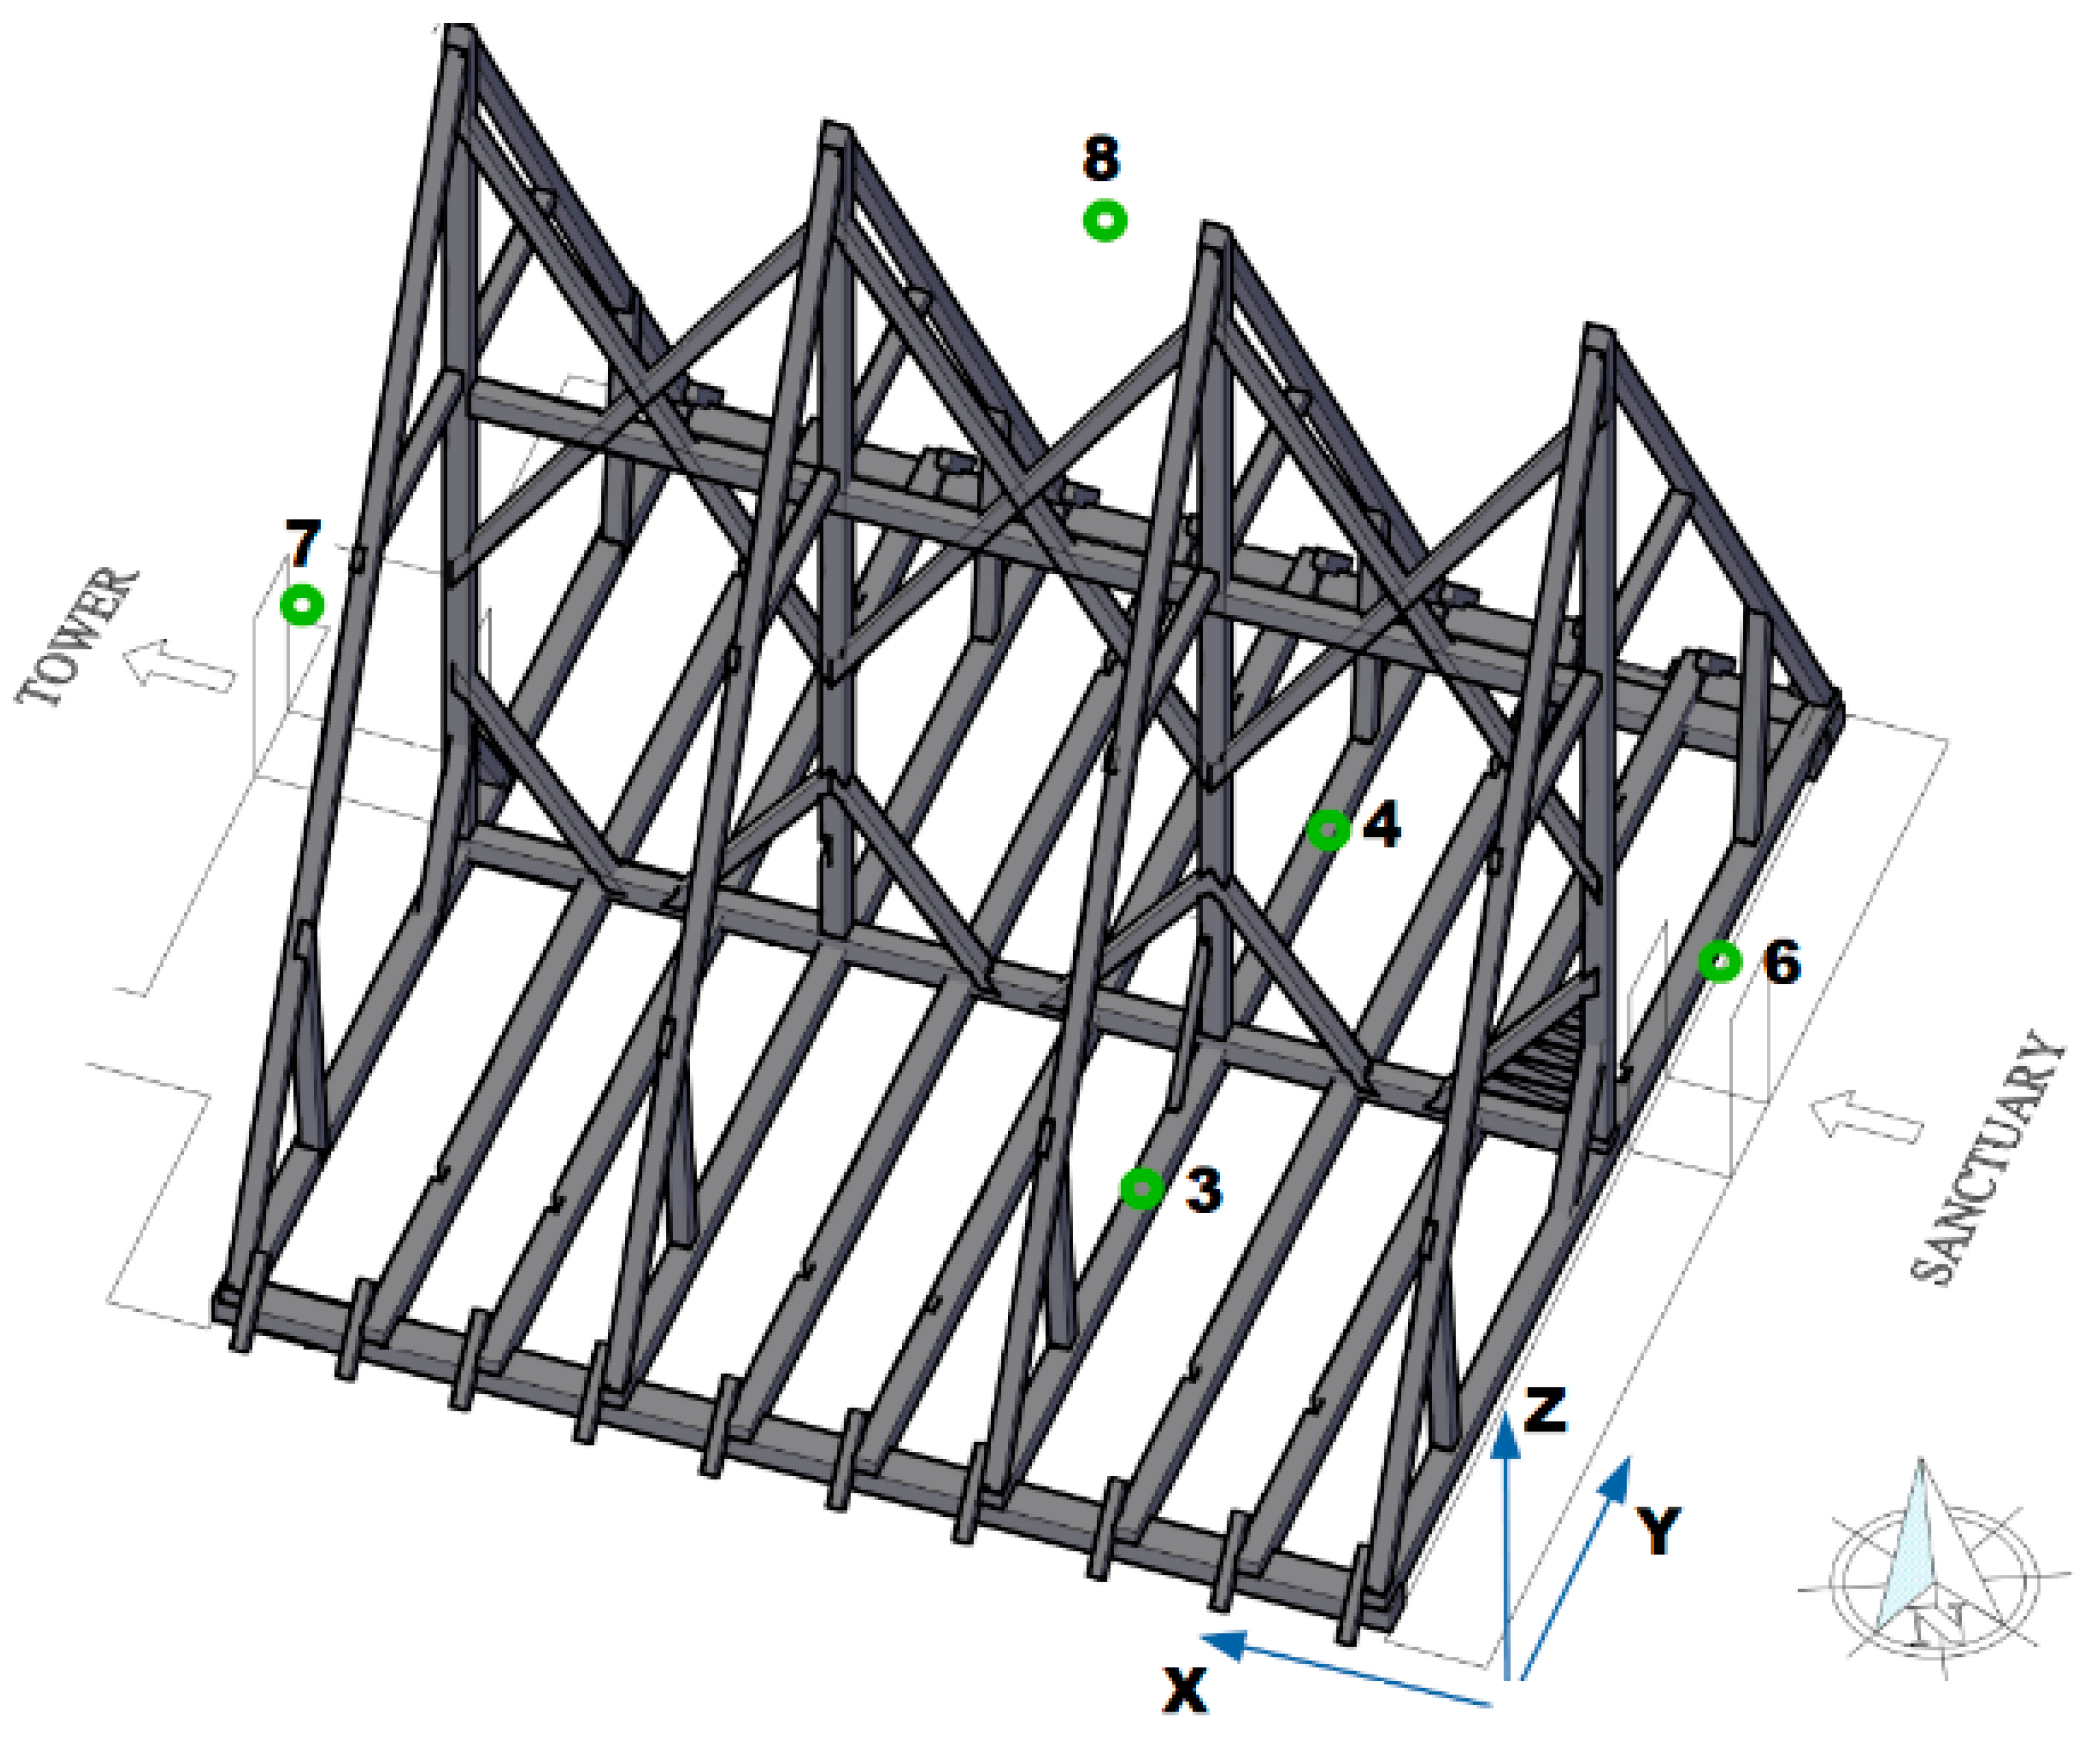
2.2. Measuring System
2.3. Dynamic BPS Model
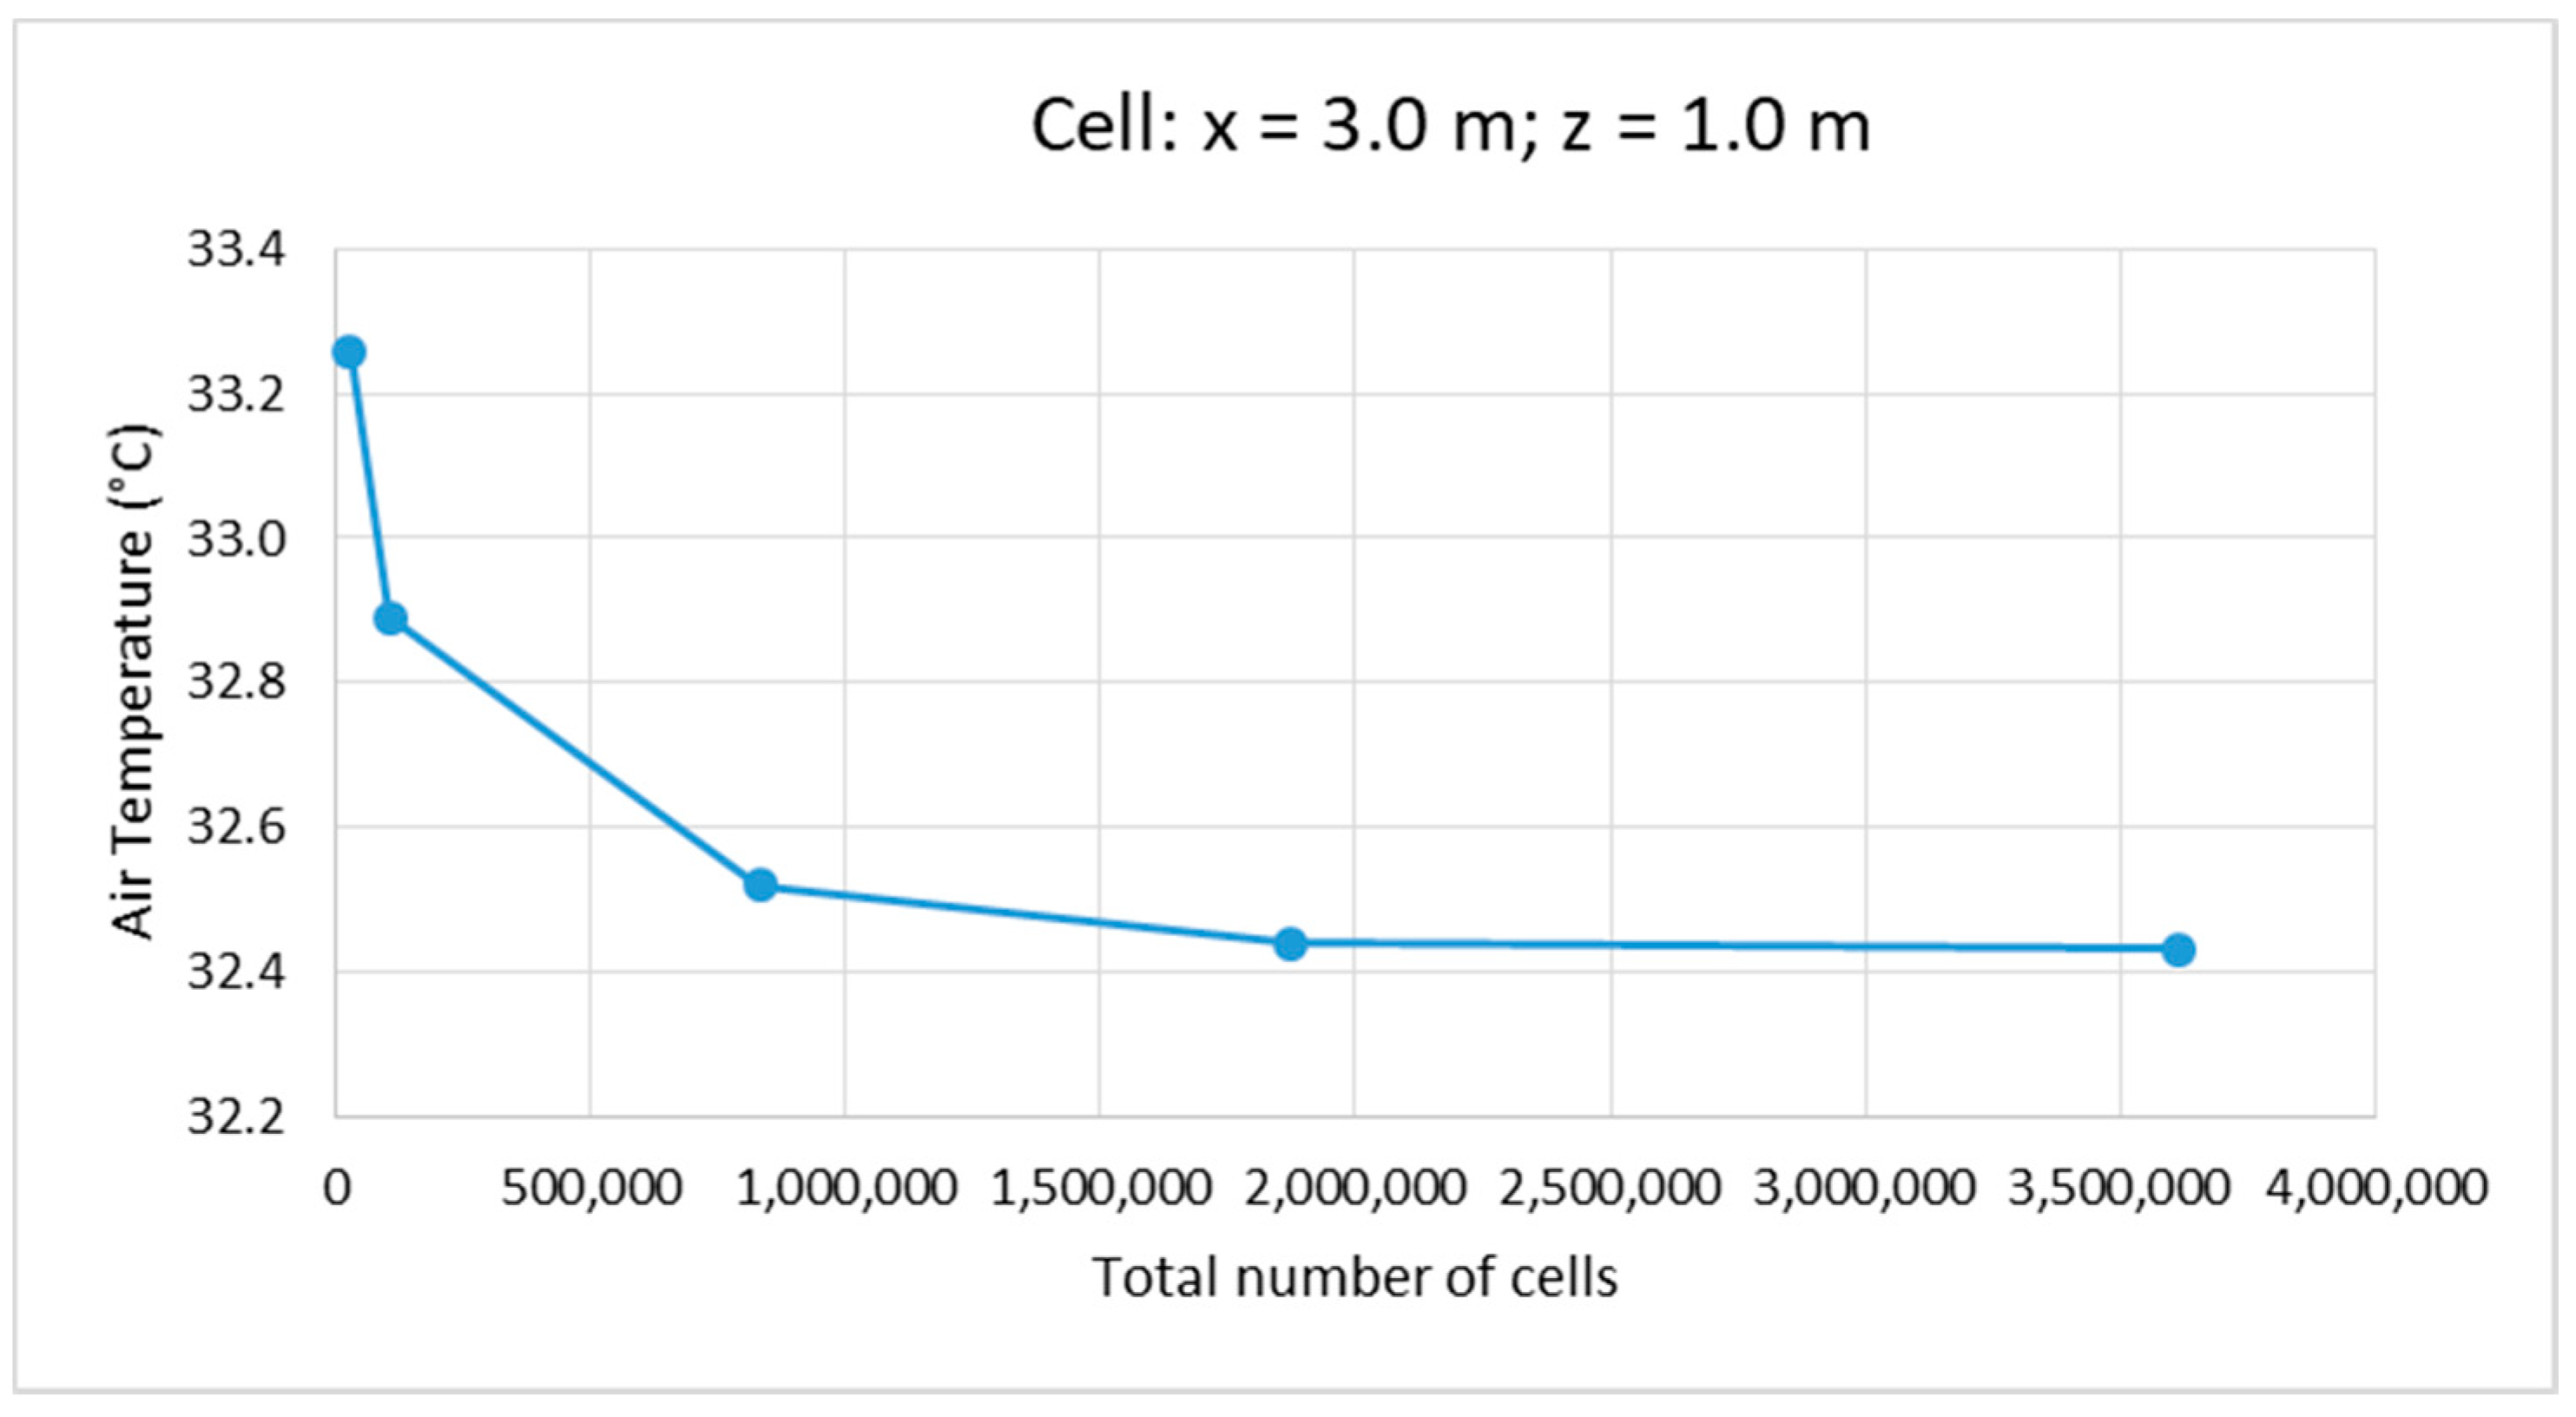
2.4. CFD Airflow Model
3. Results
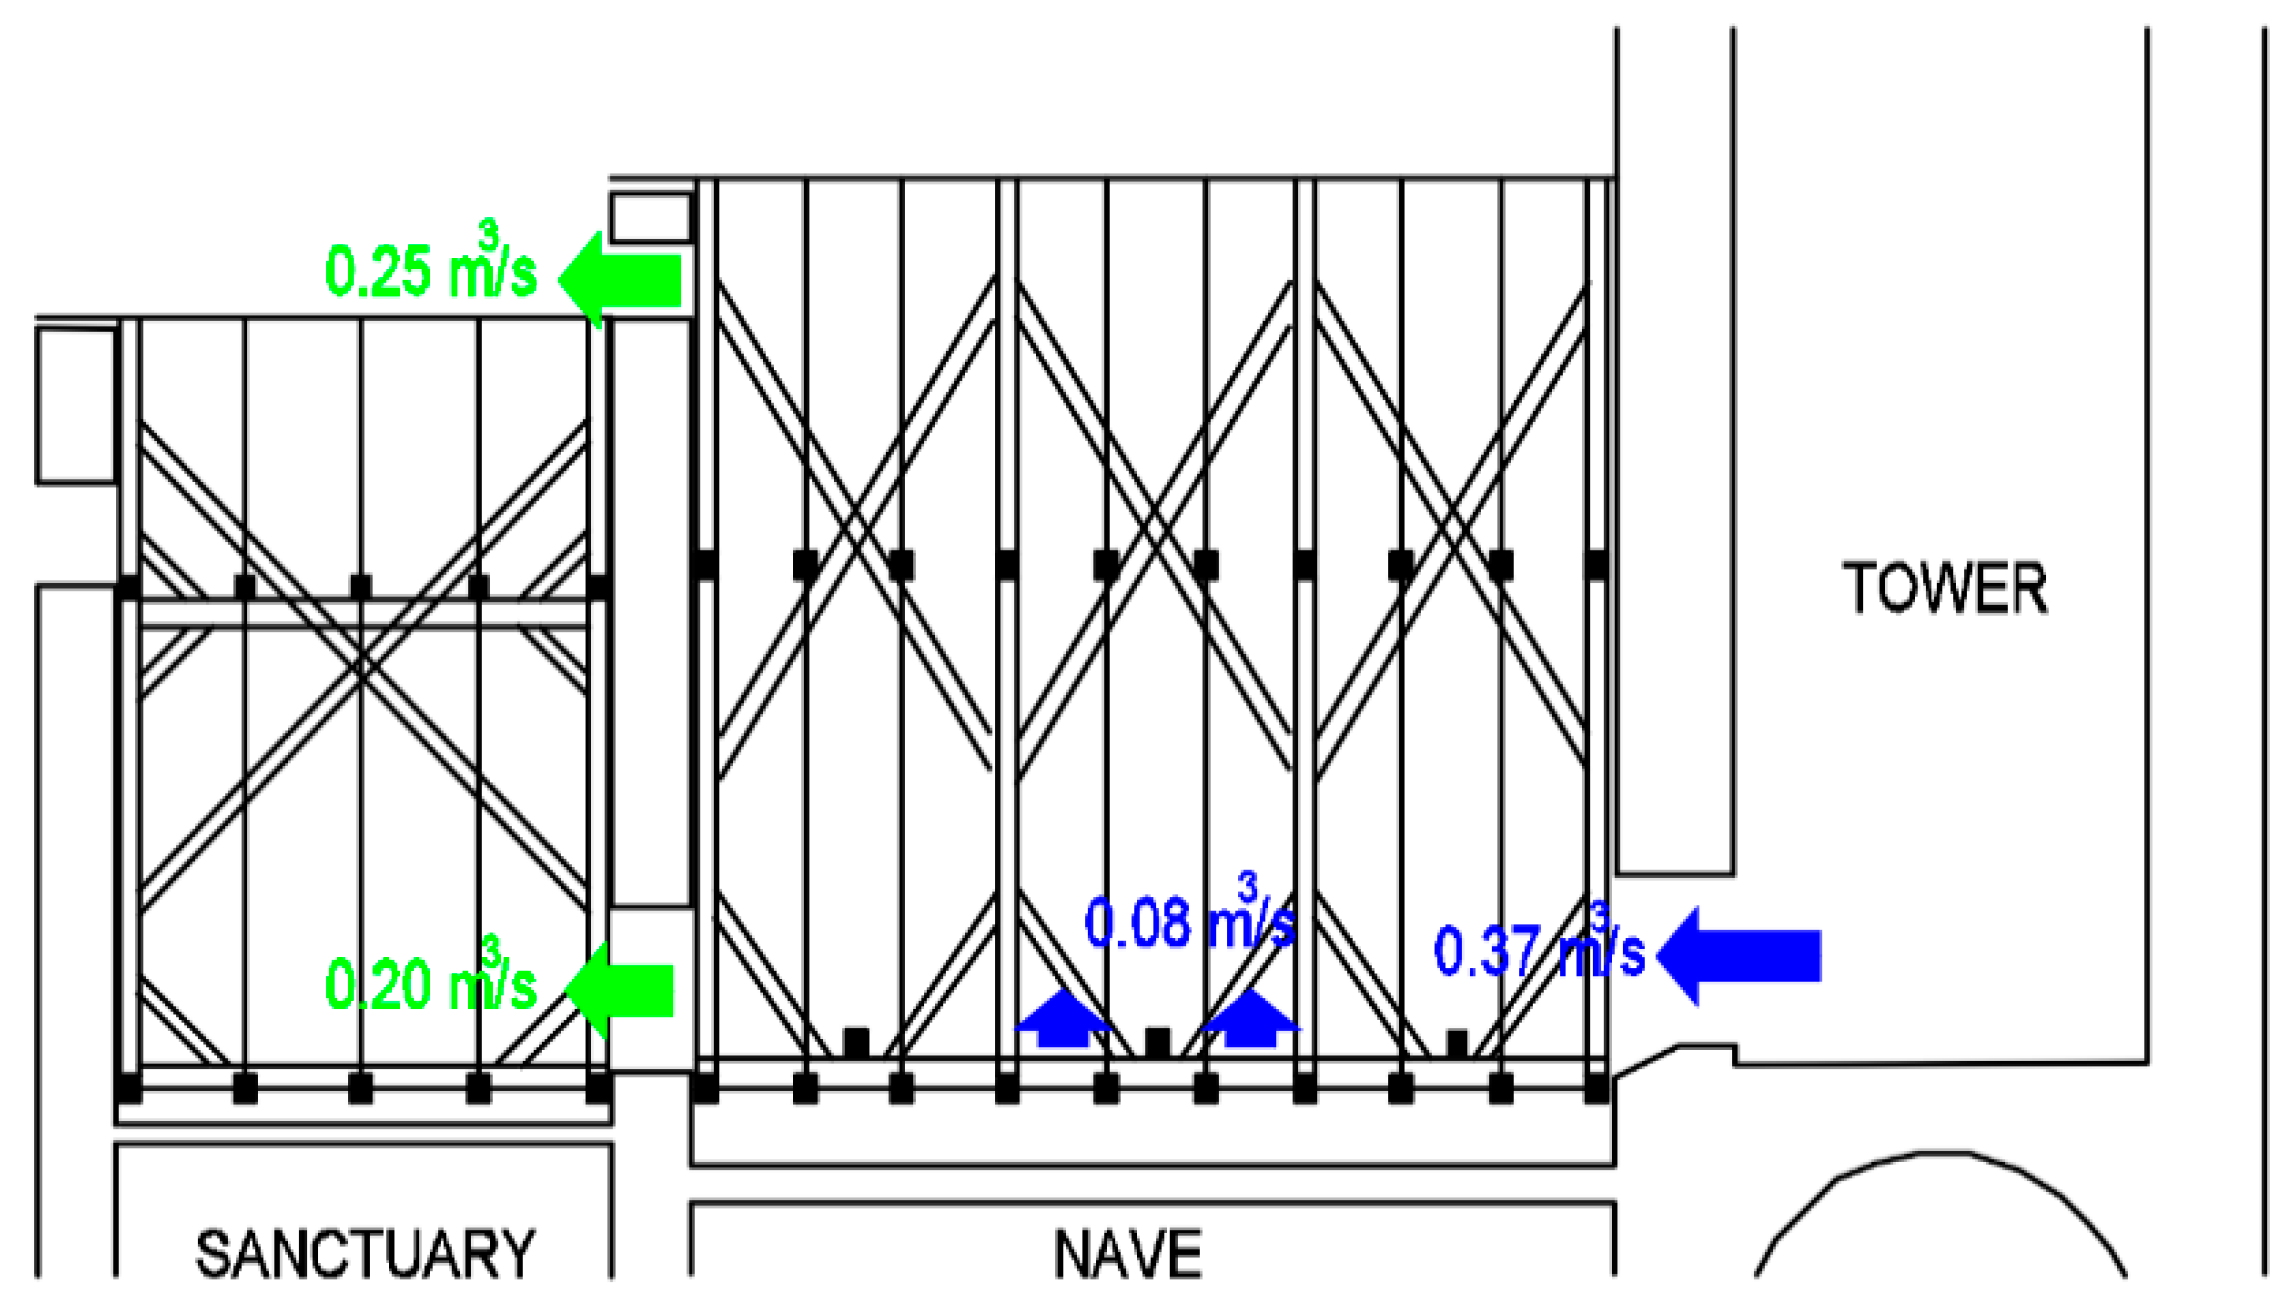
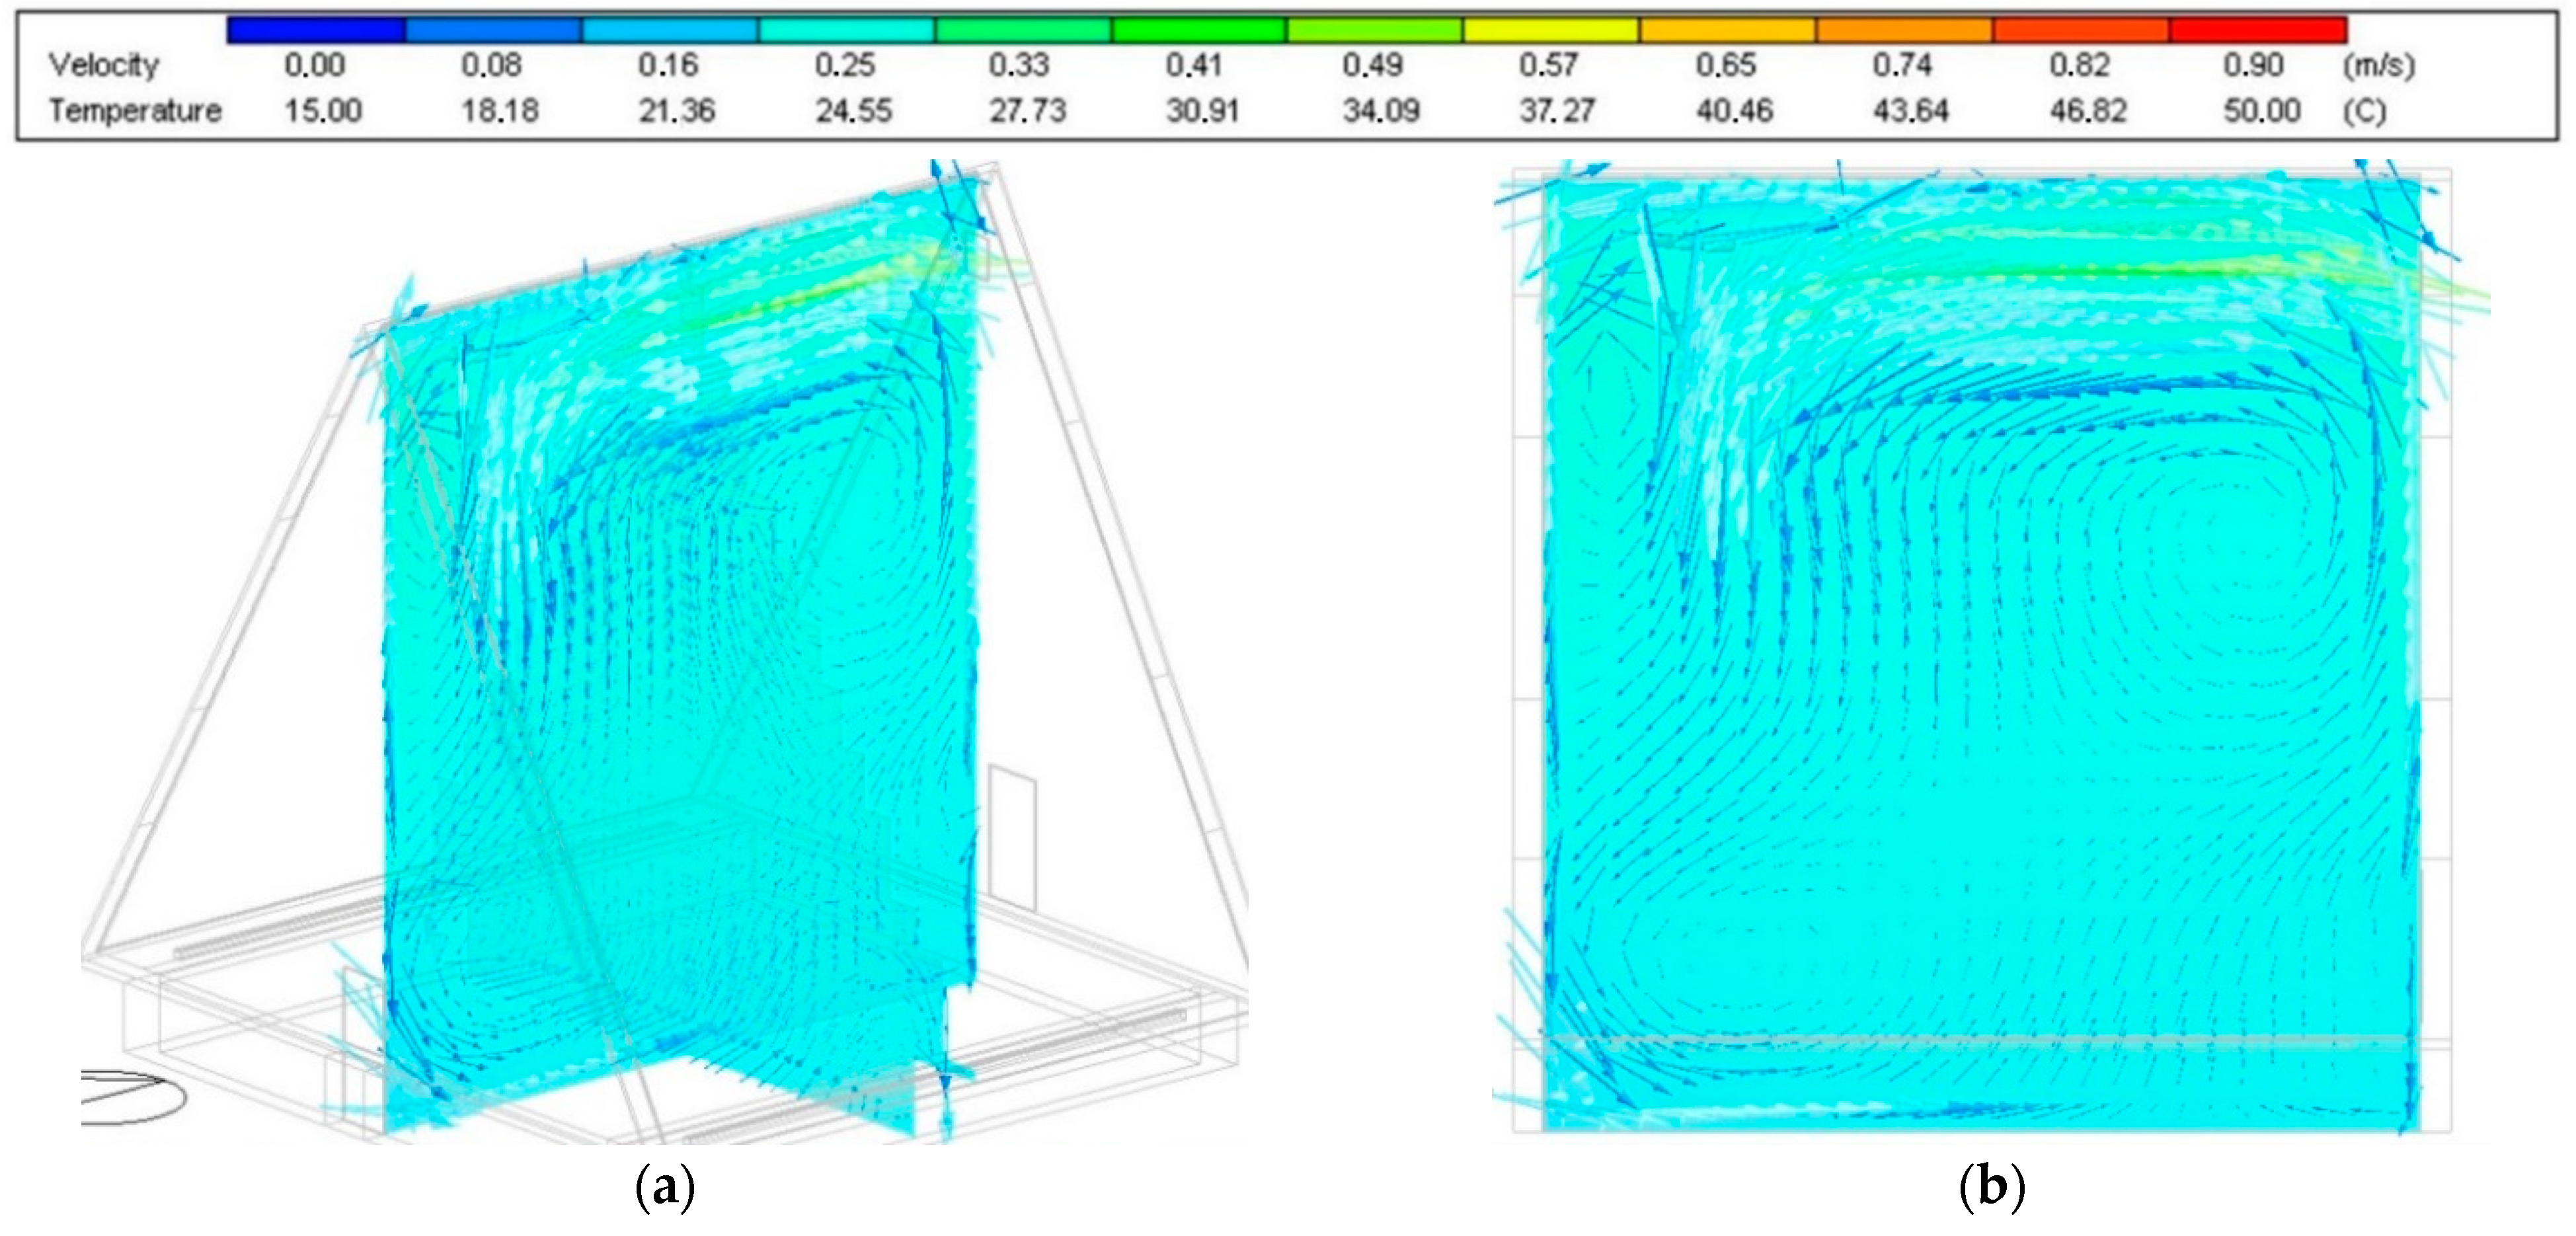
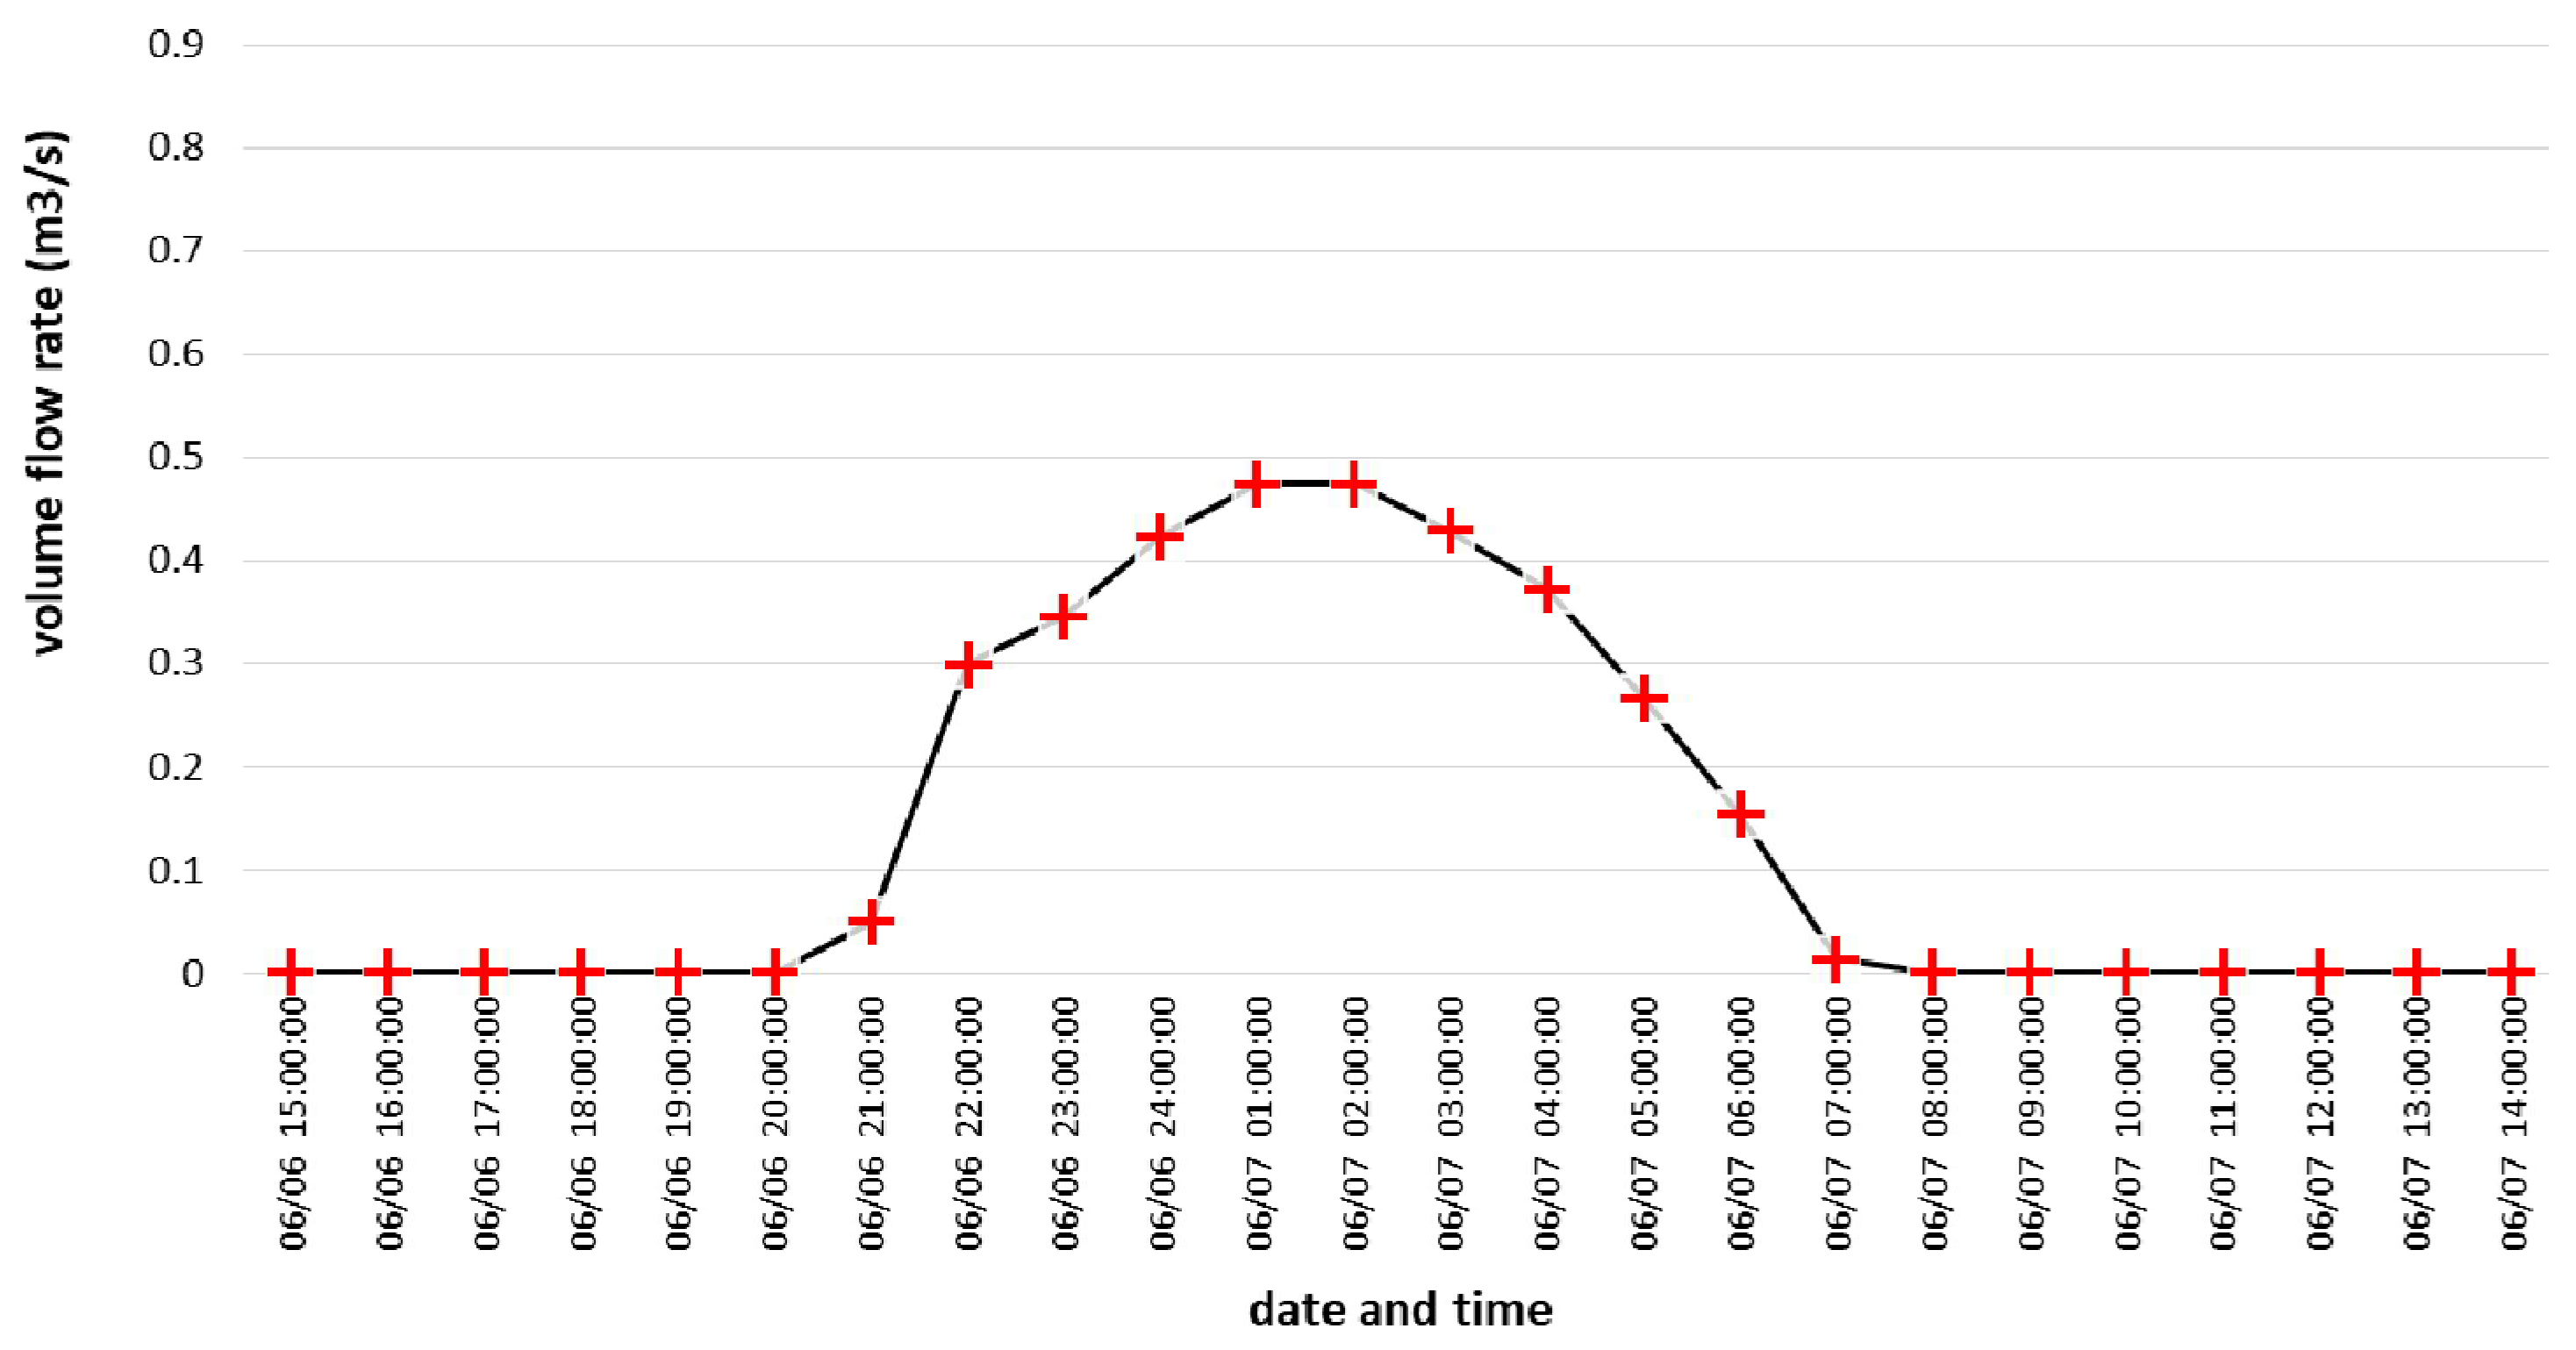
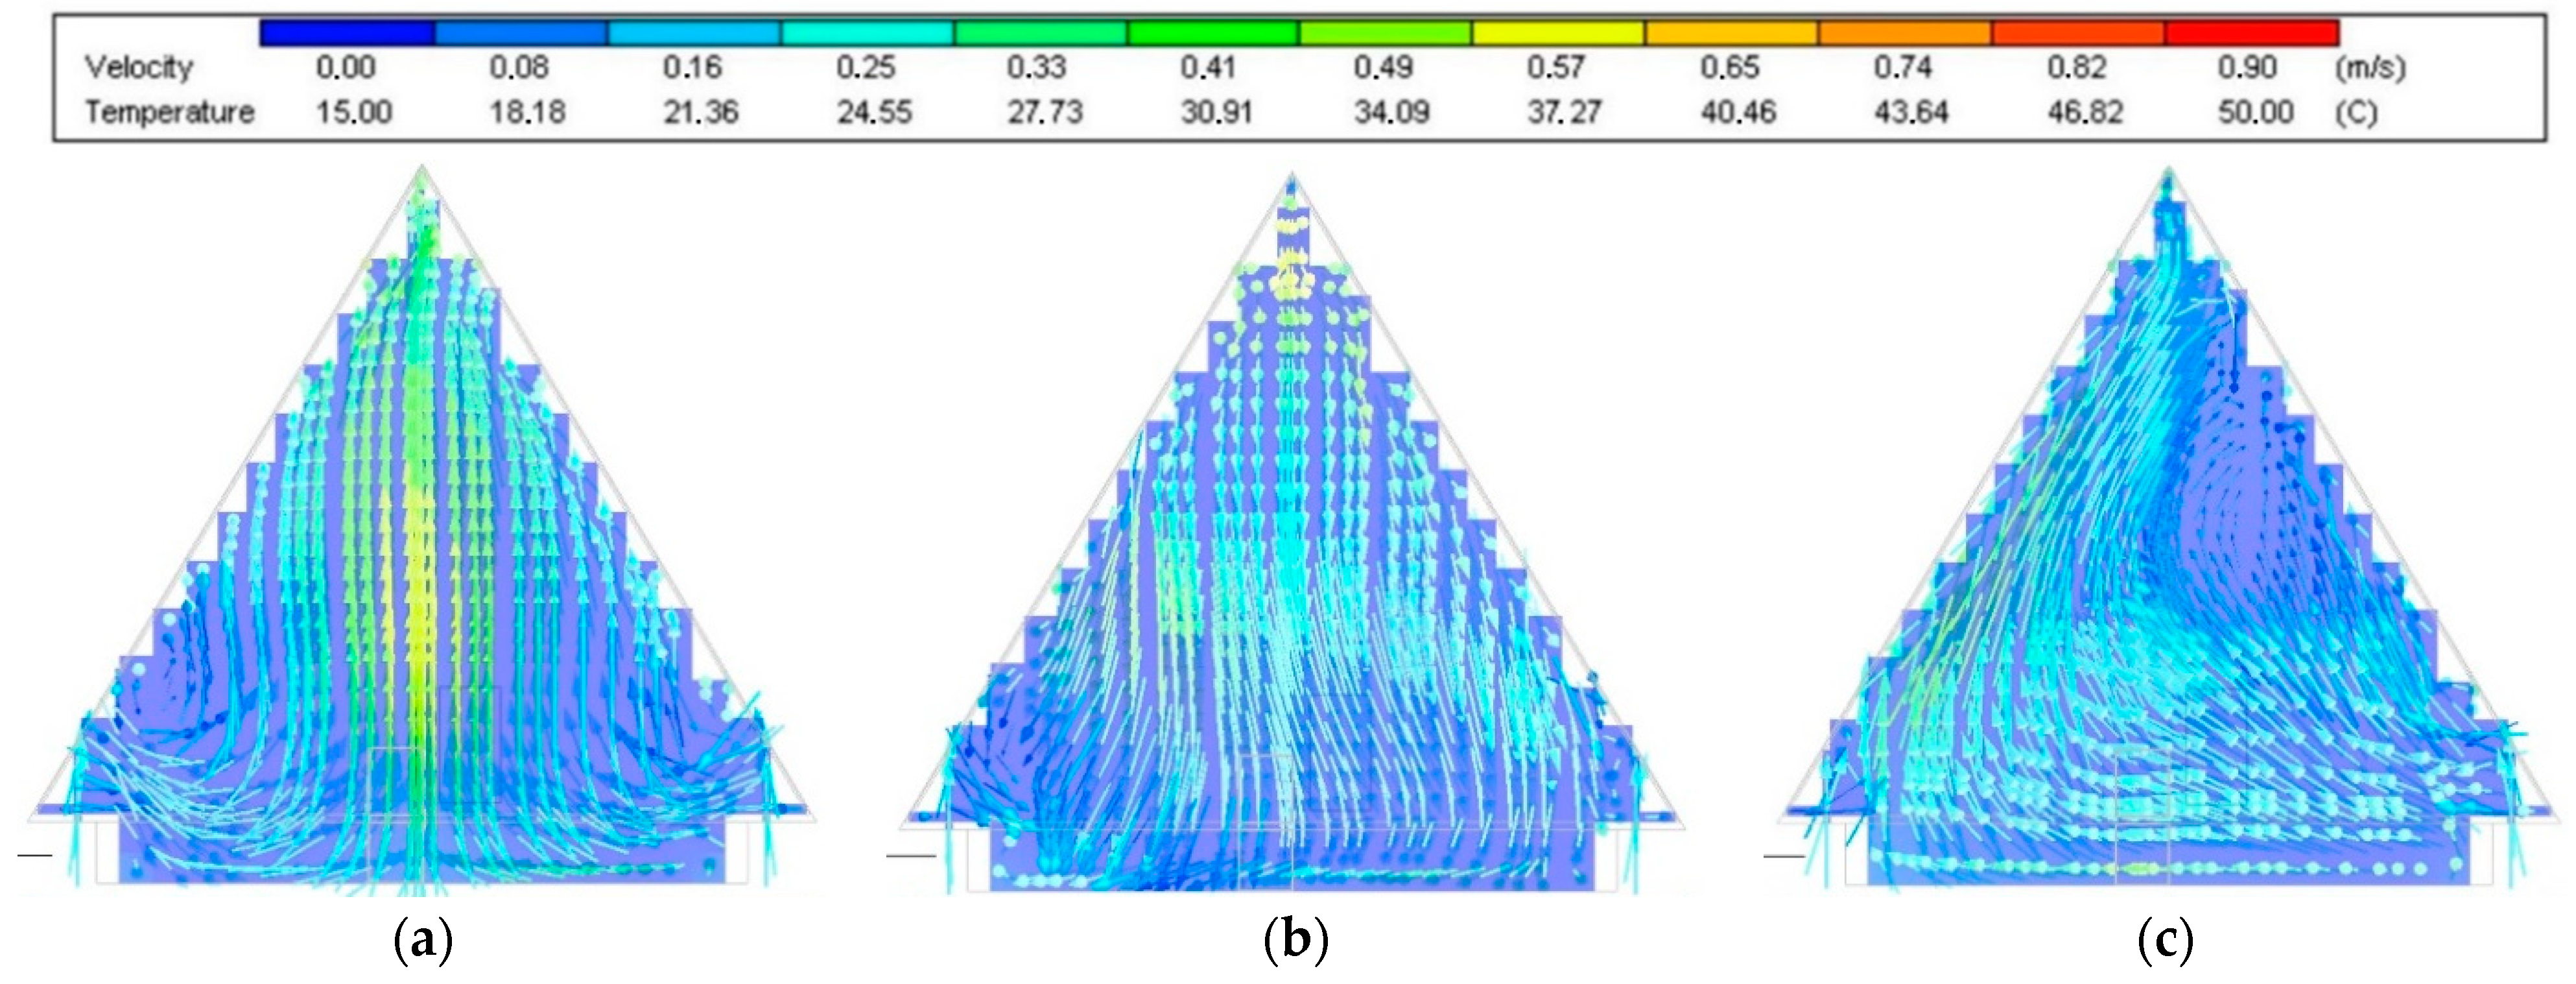
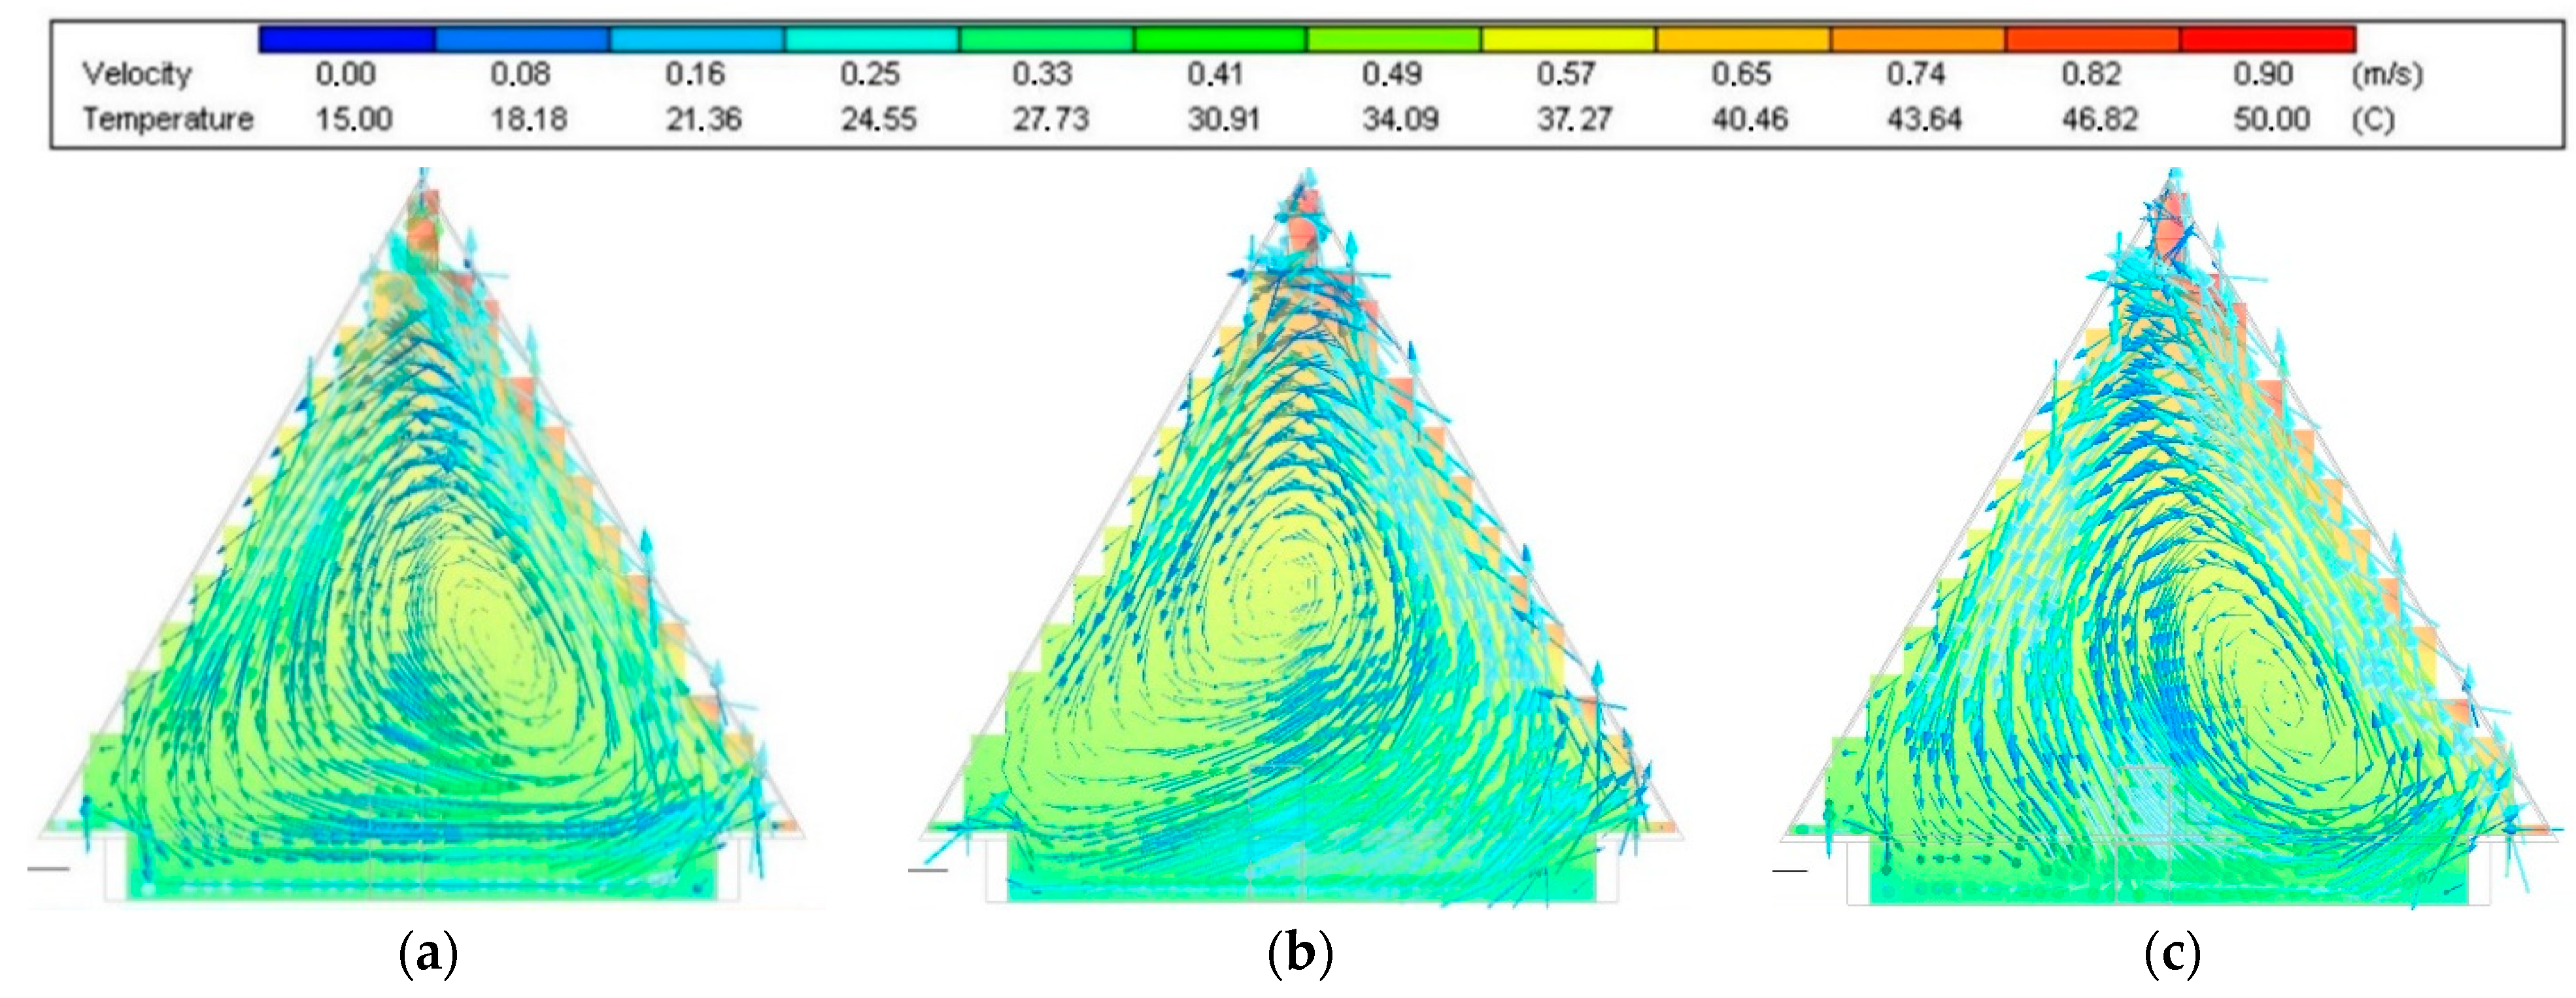
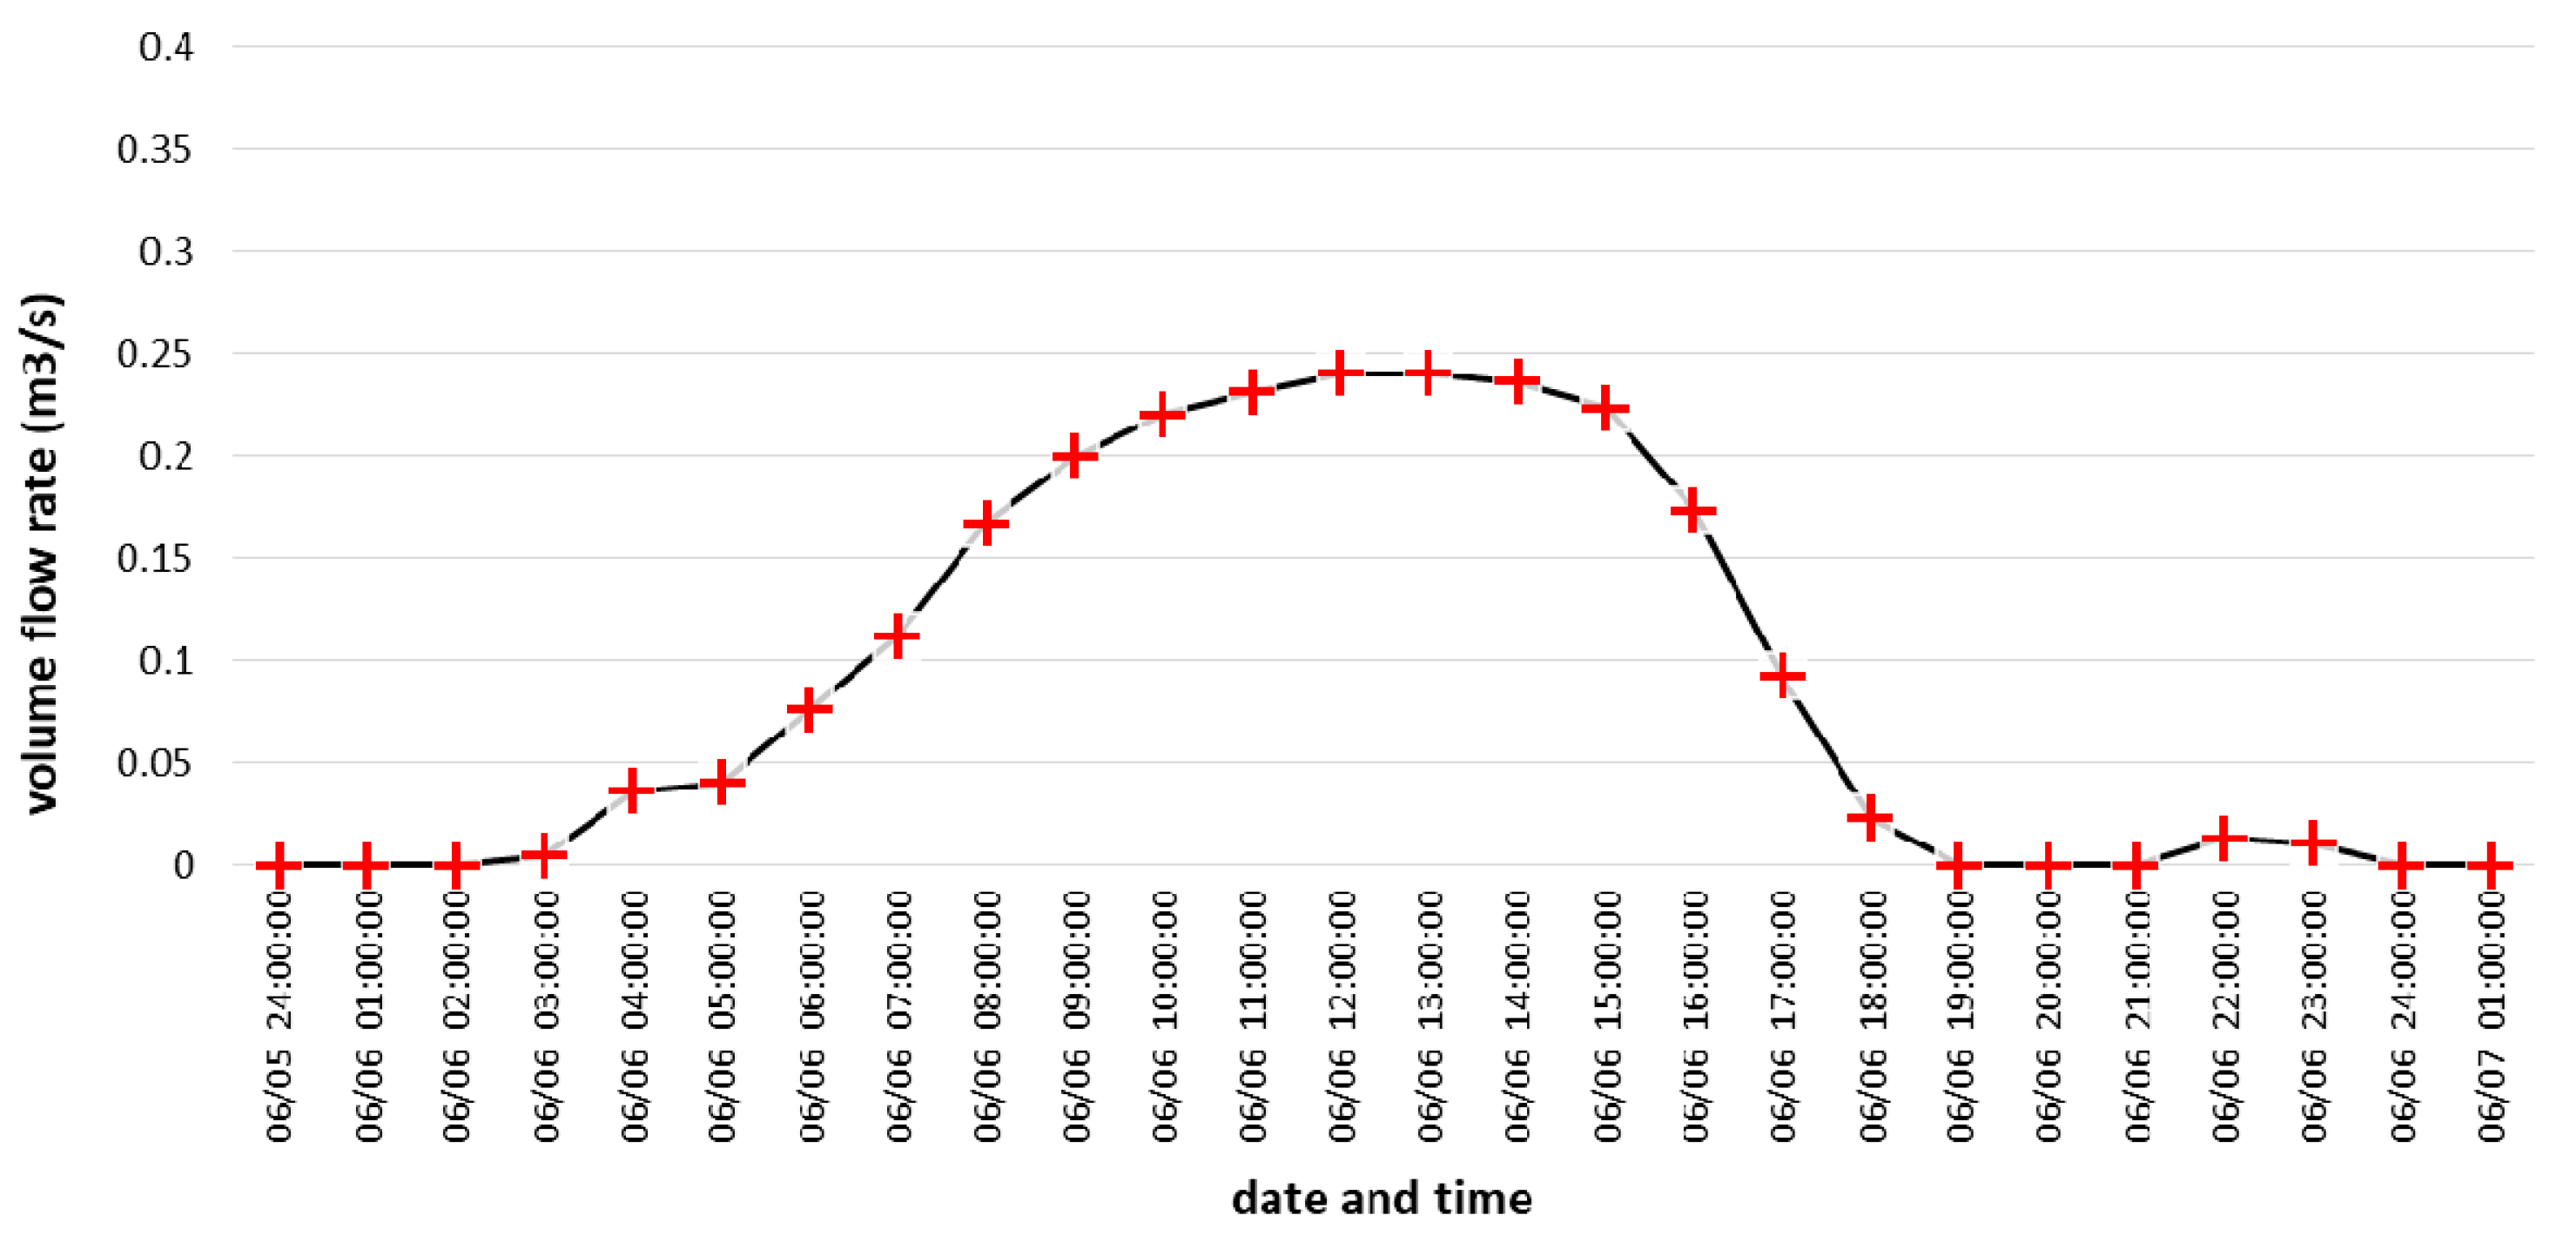
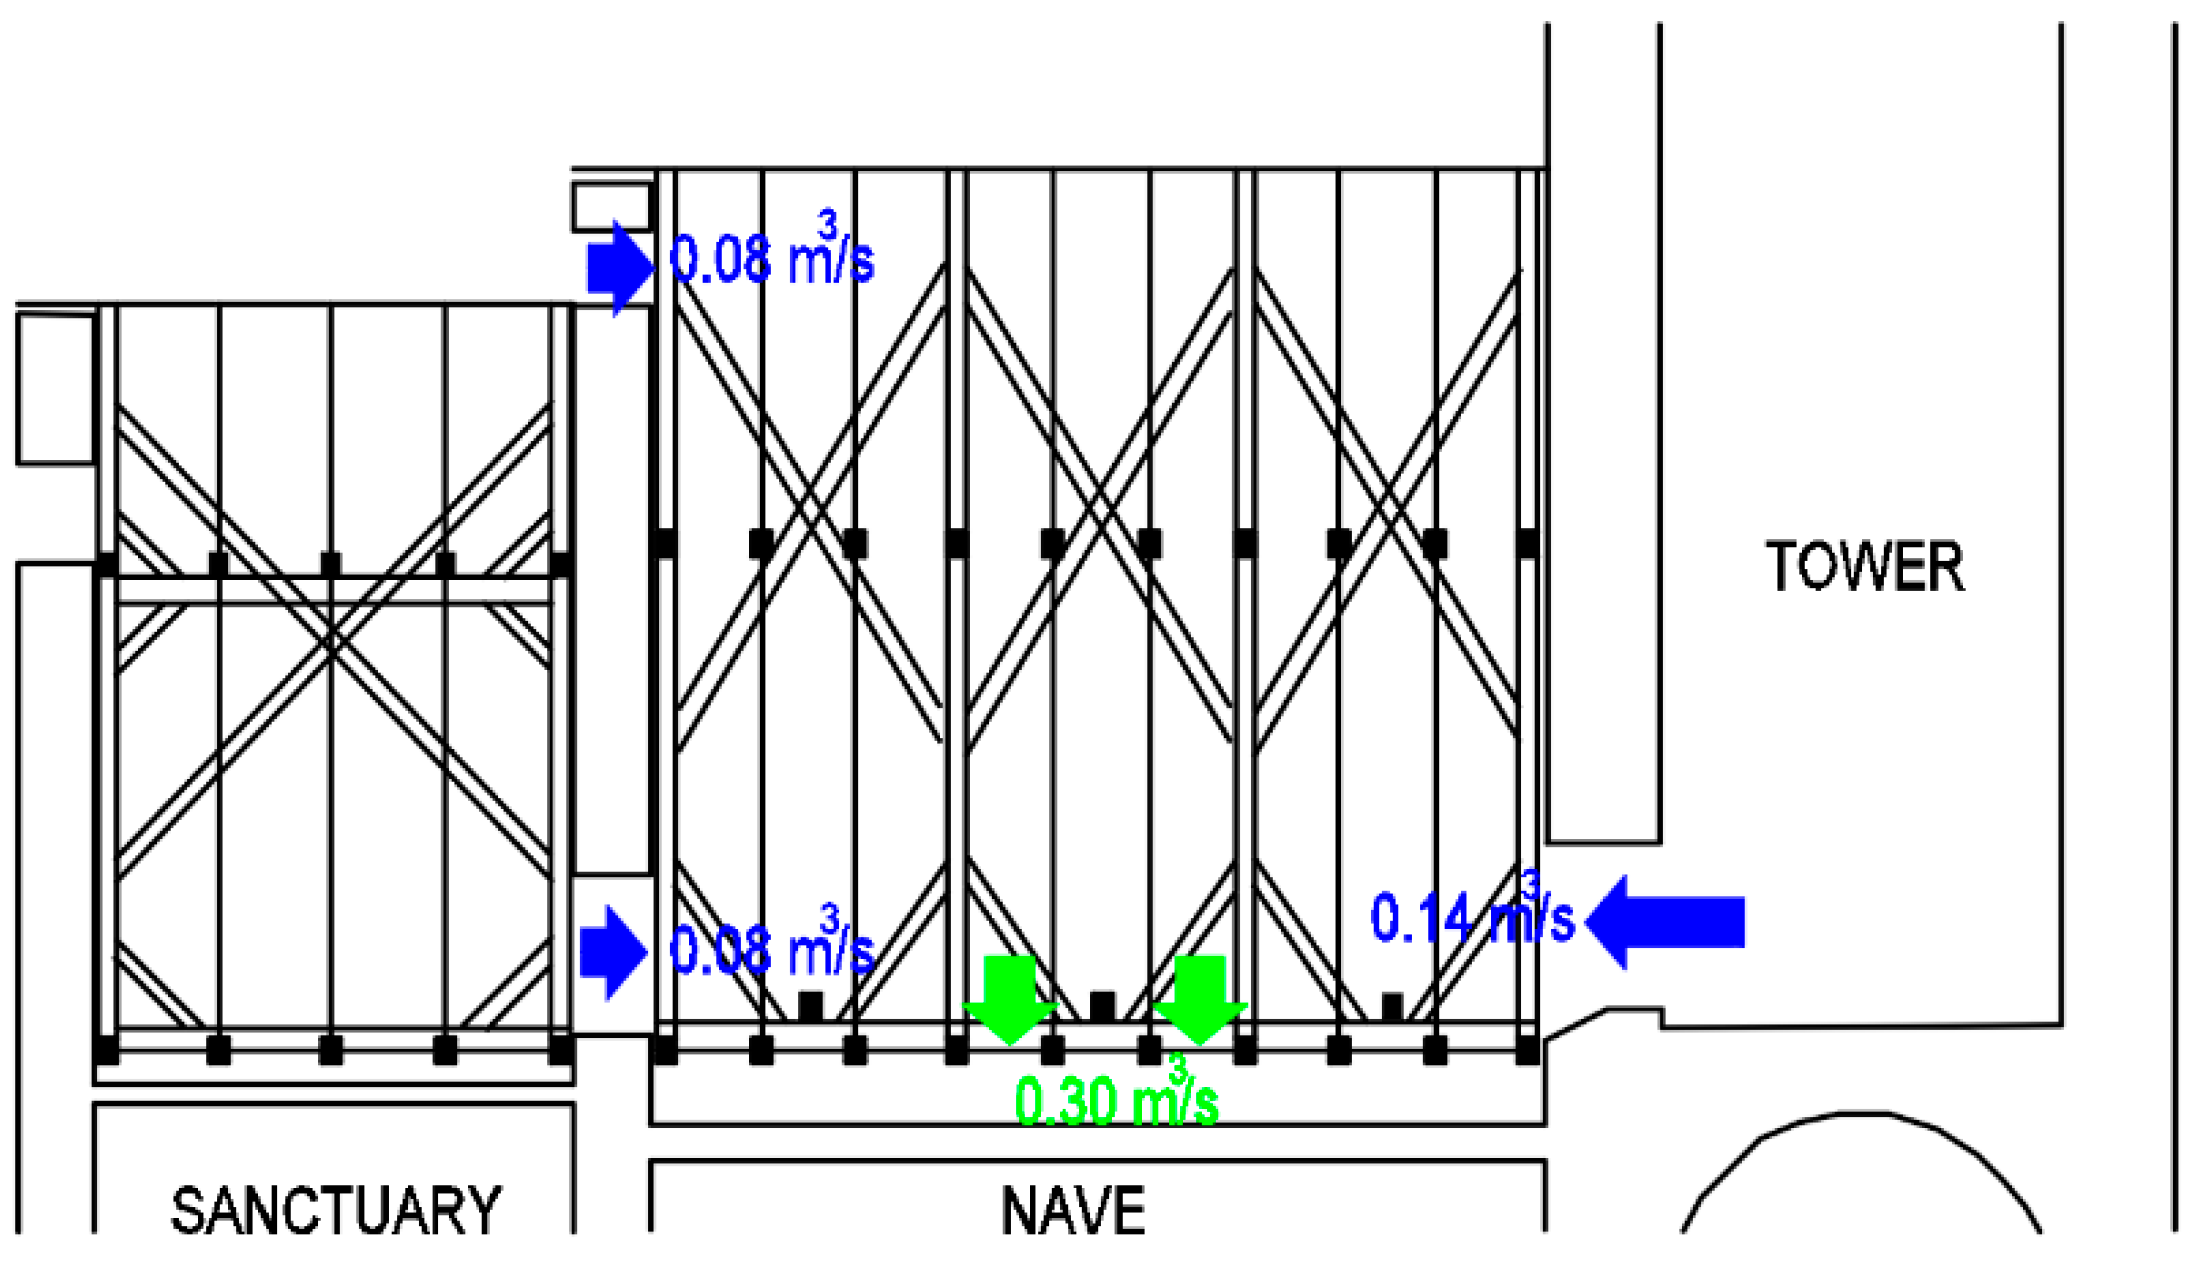
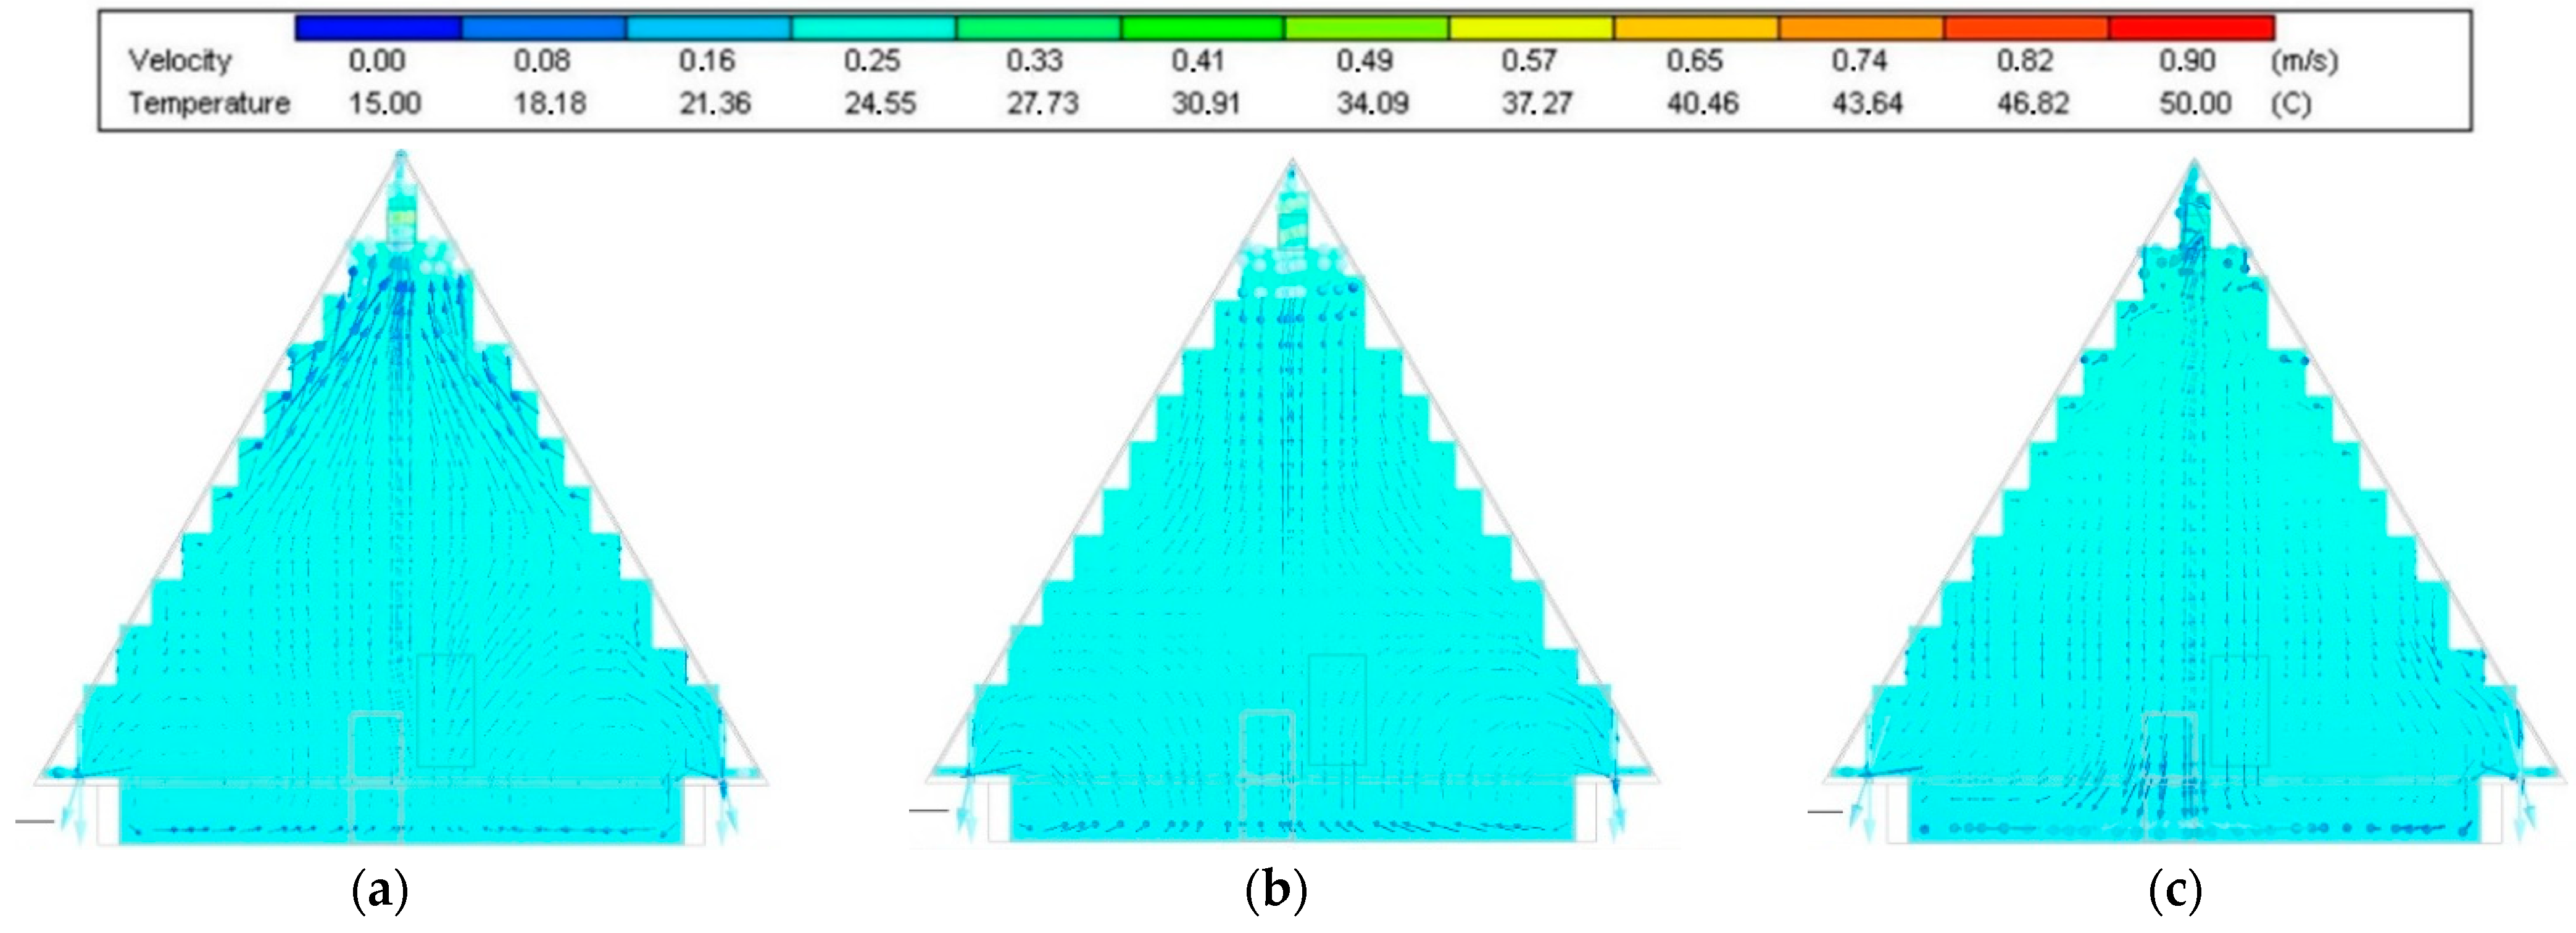
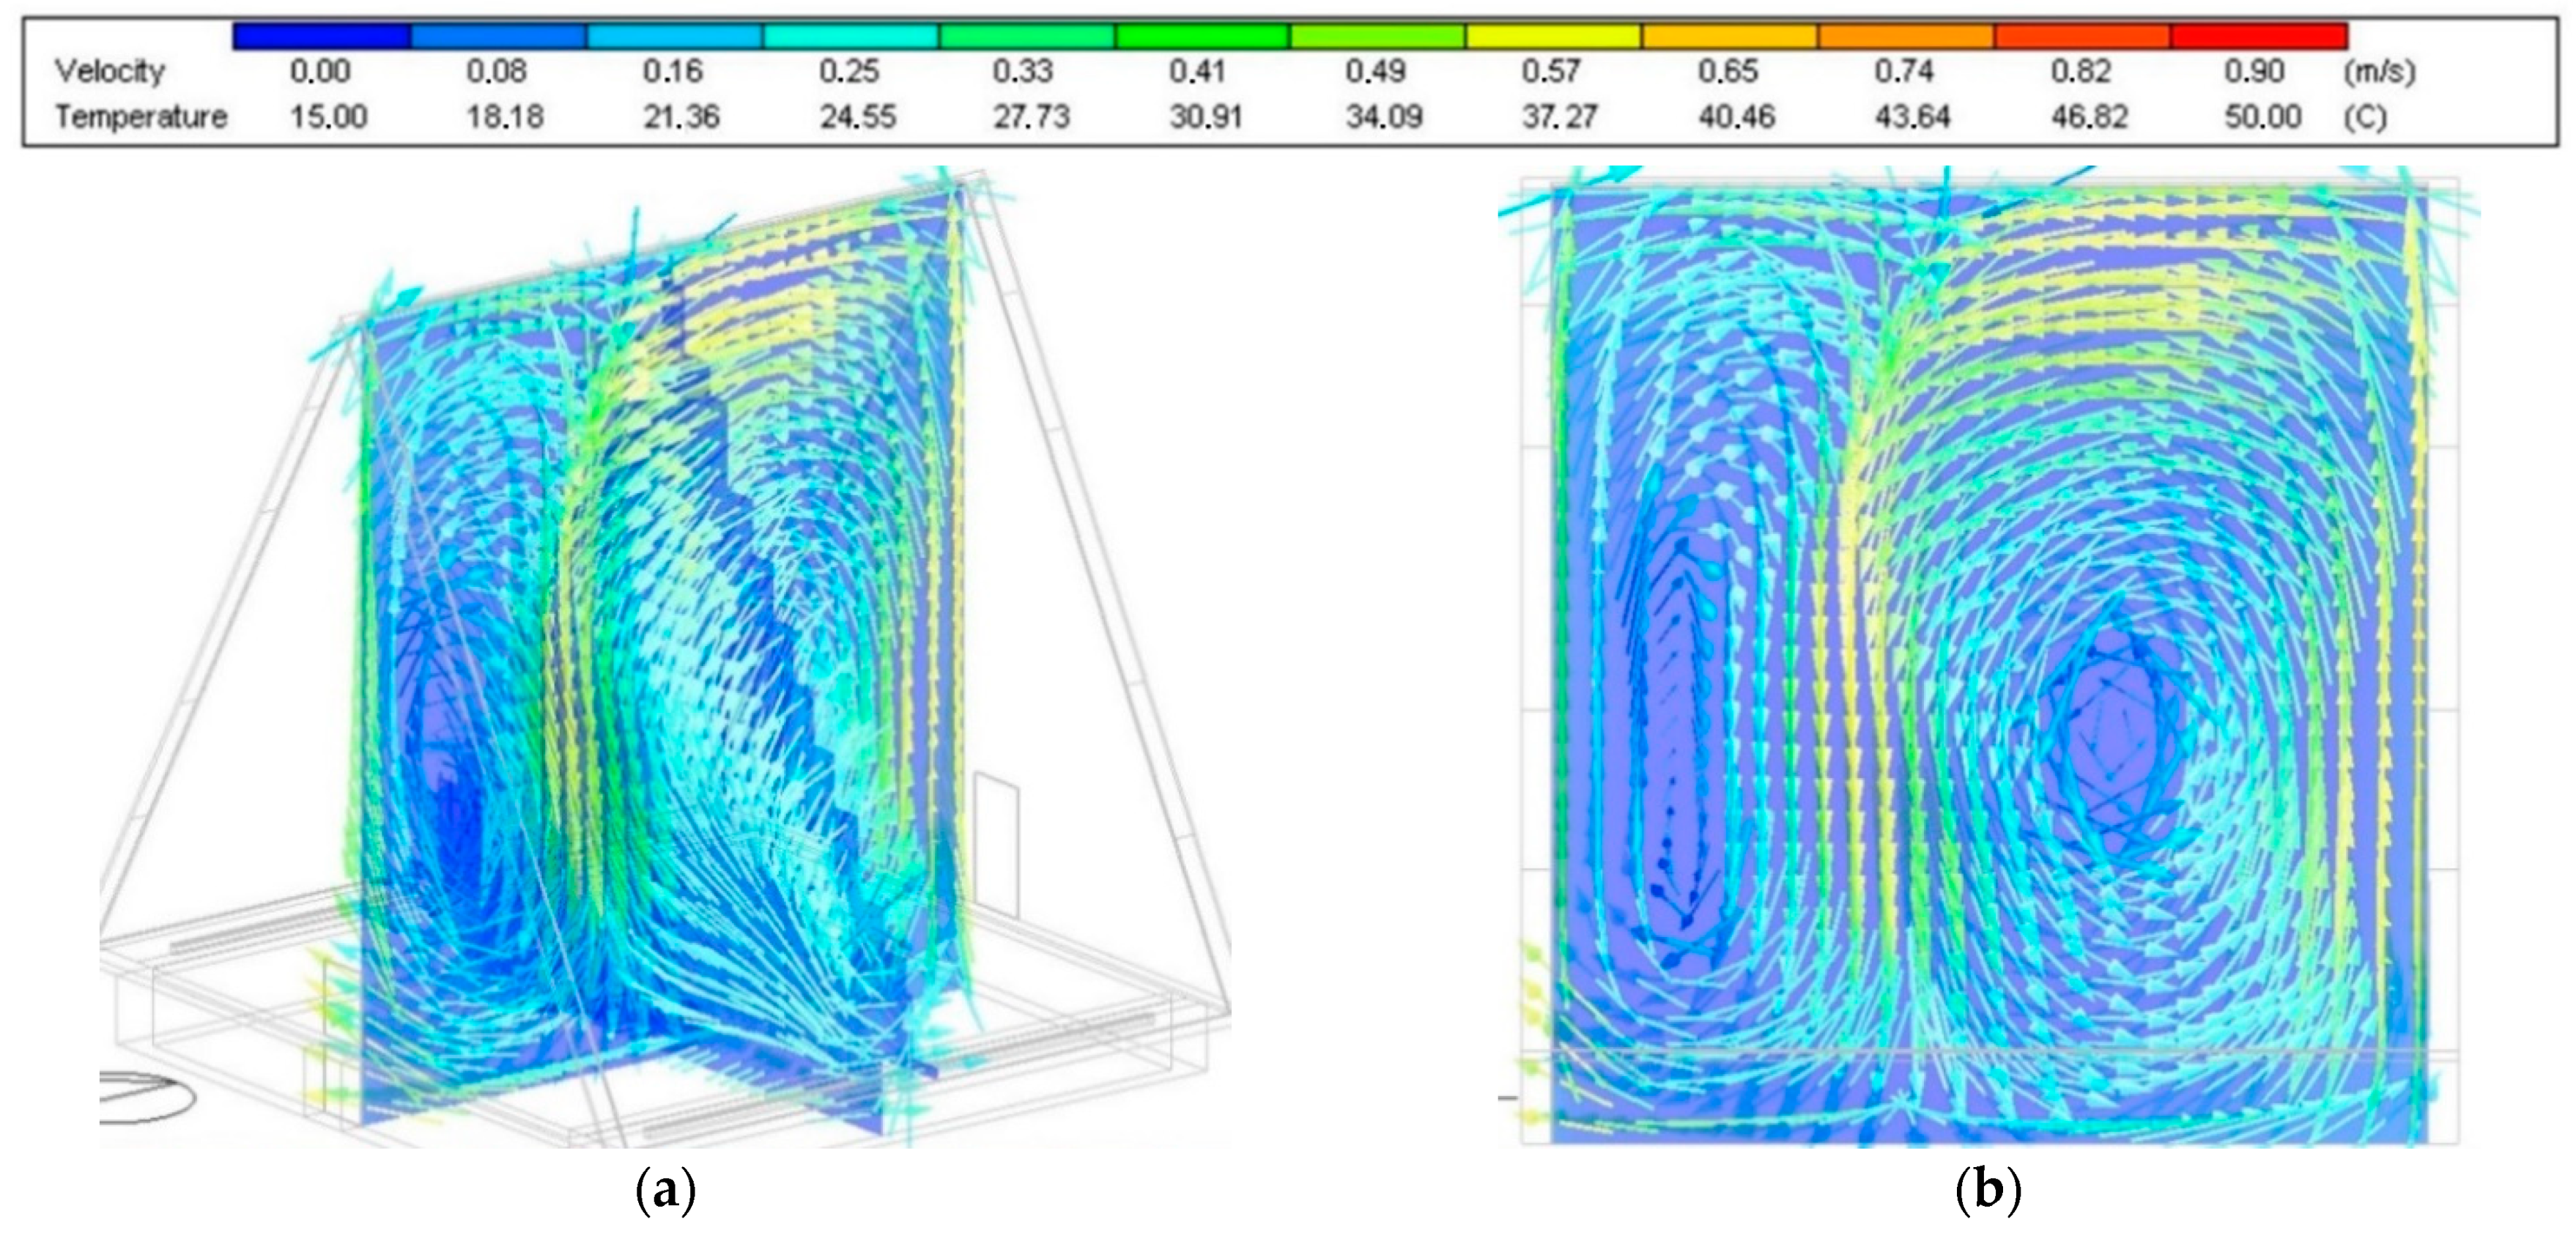
3.1. Airflow Simulation Results at Noon
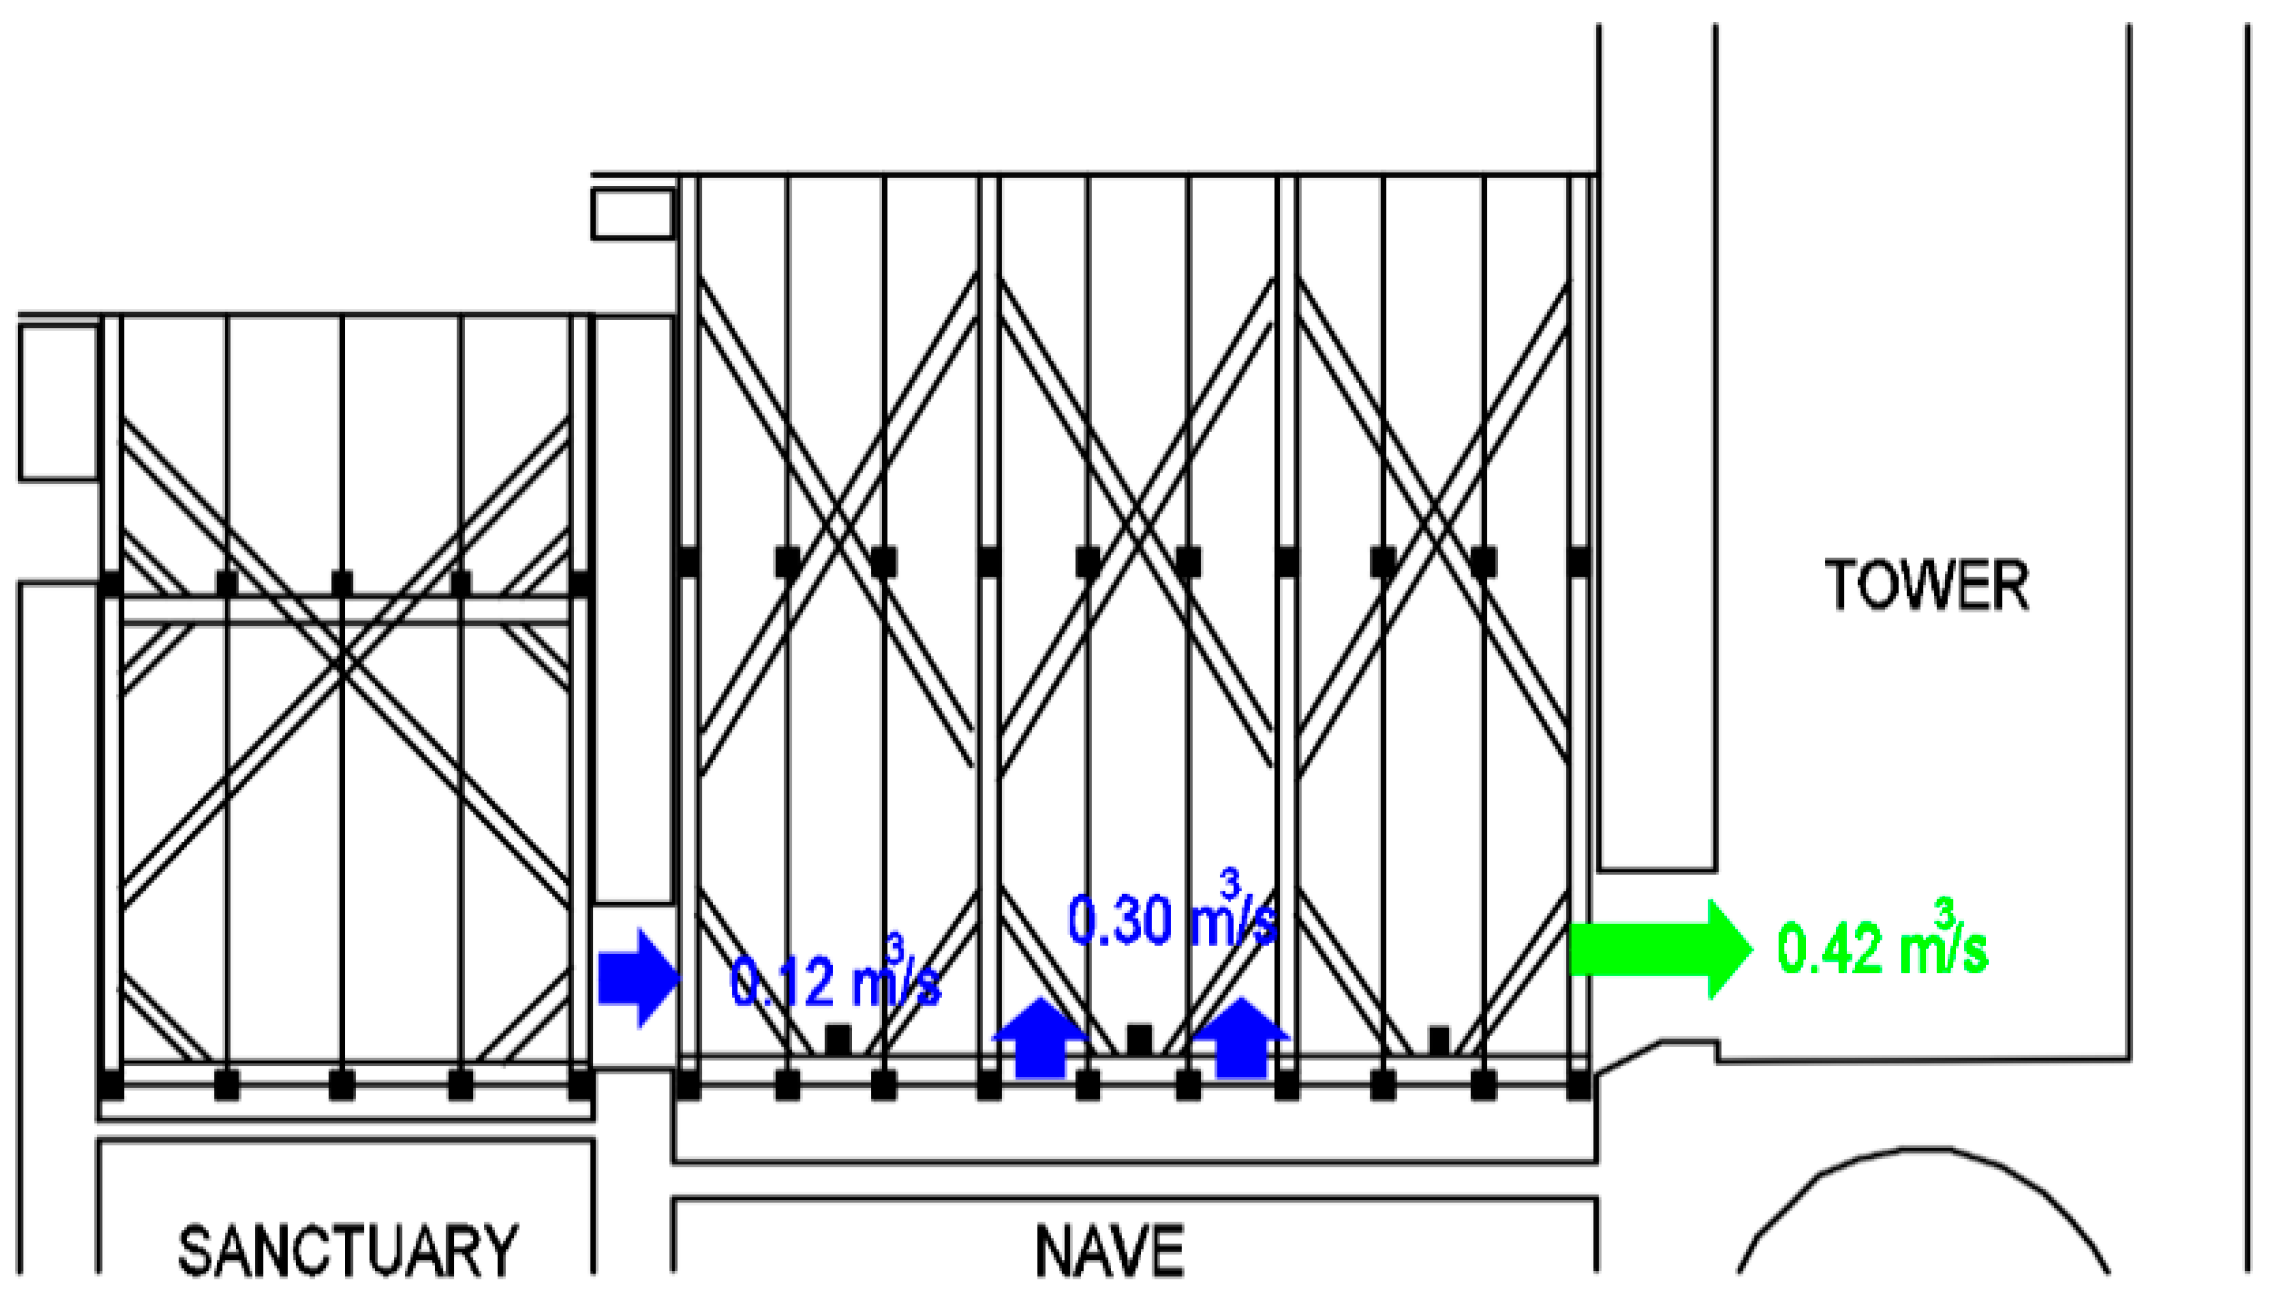
3.2. Airflow Simulation Results in the Evening
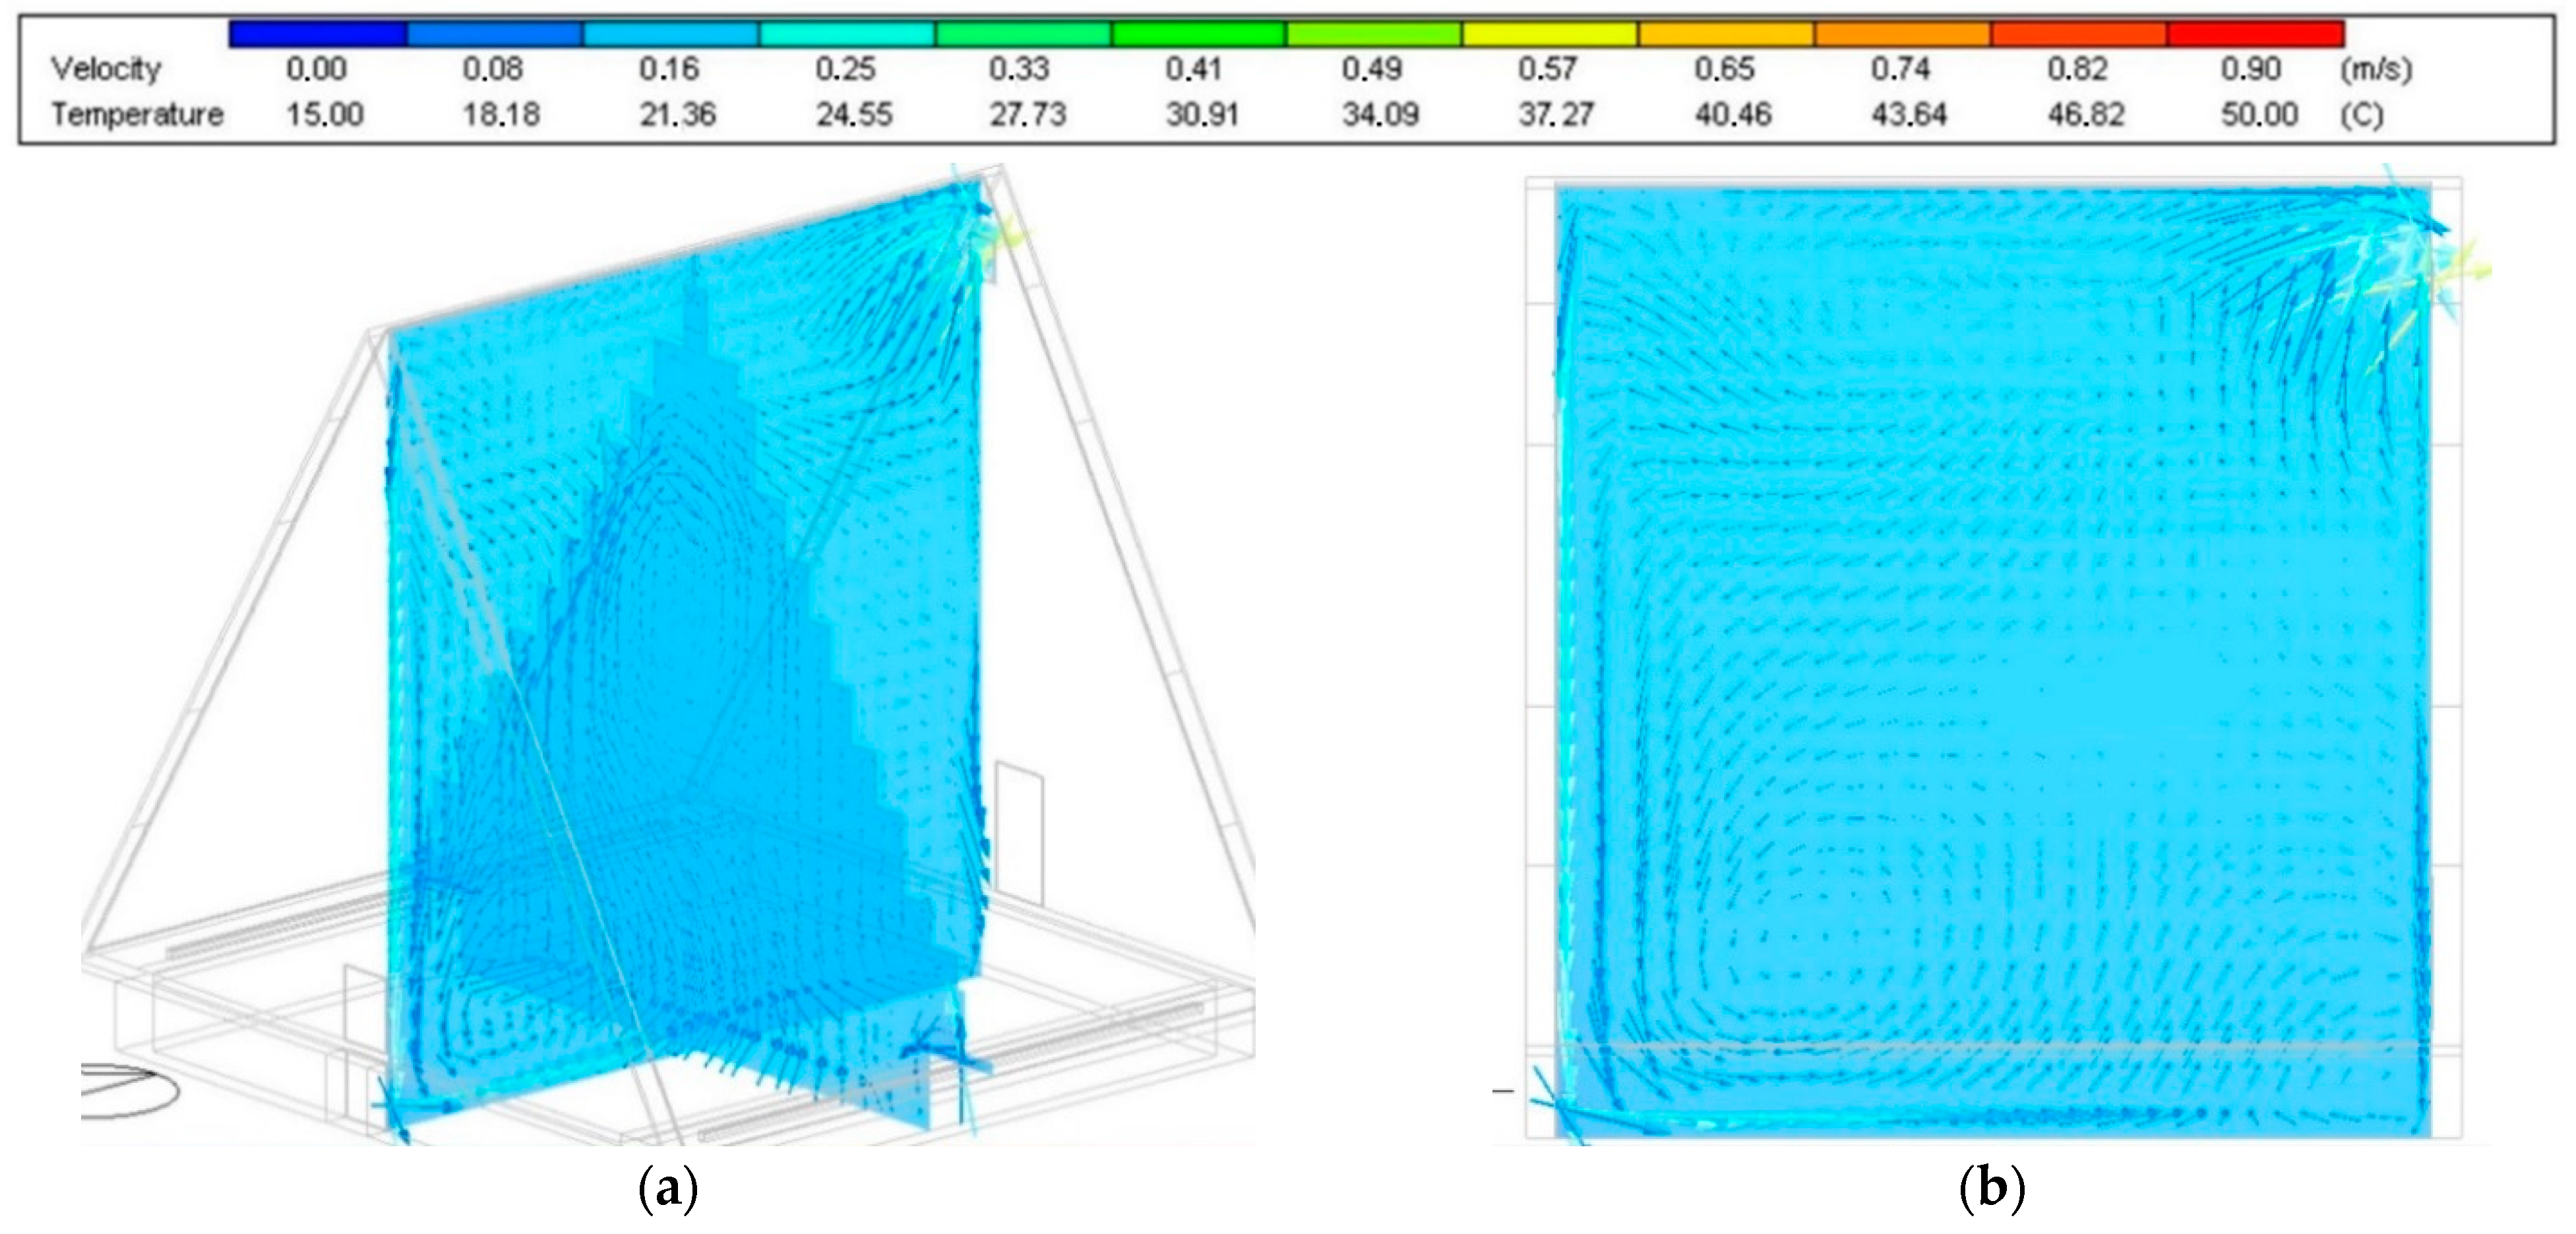
3.3. Airflow Simulation Results at Midnight
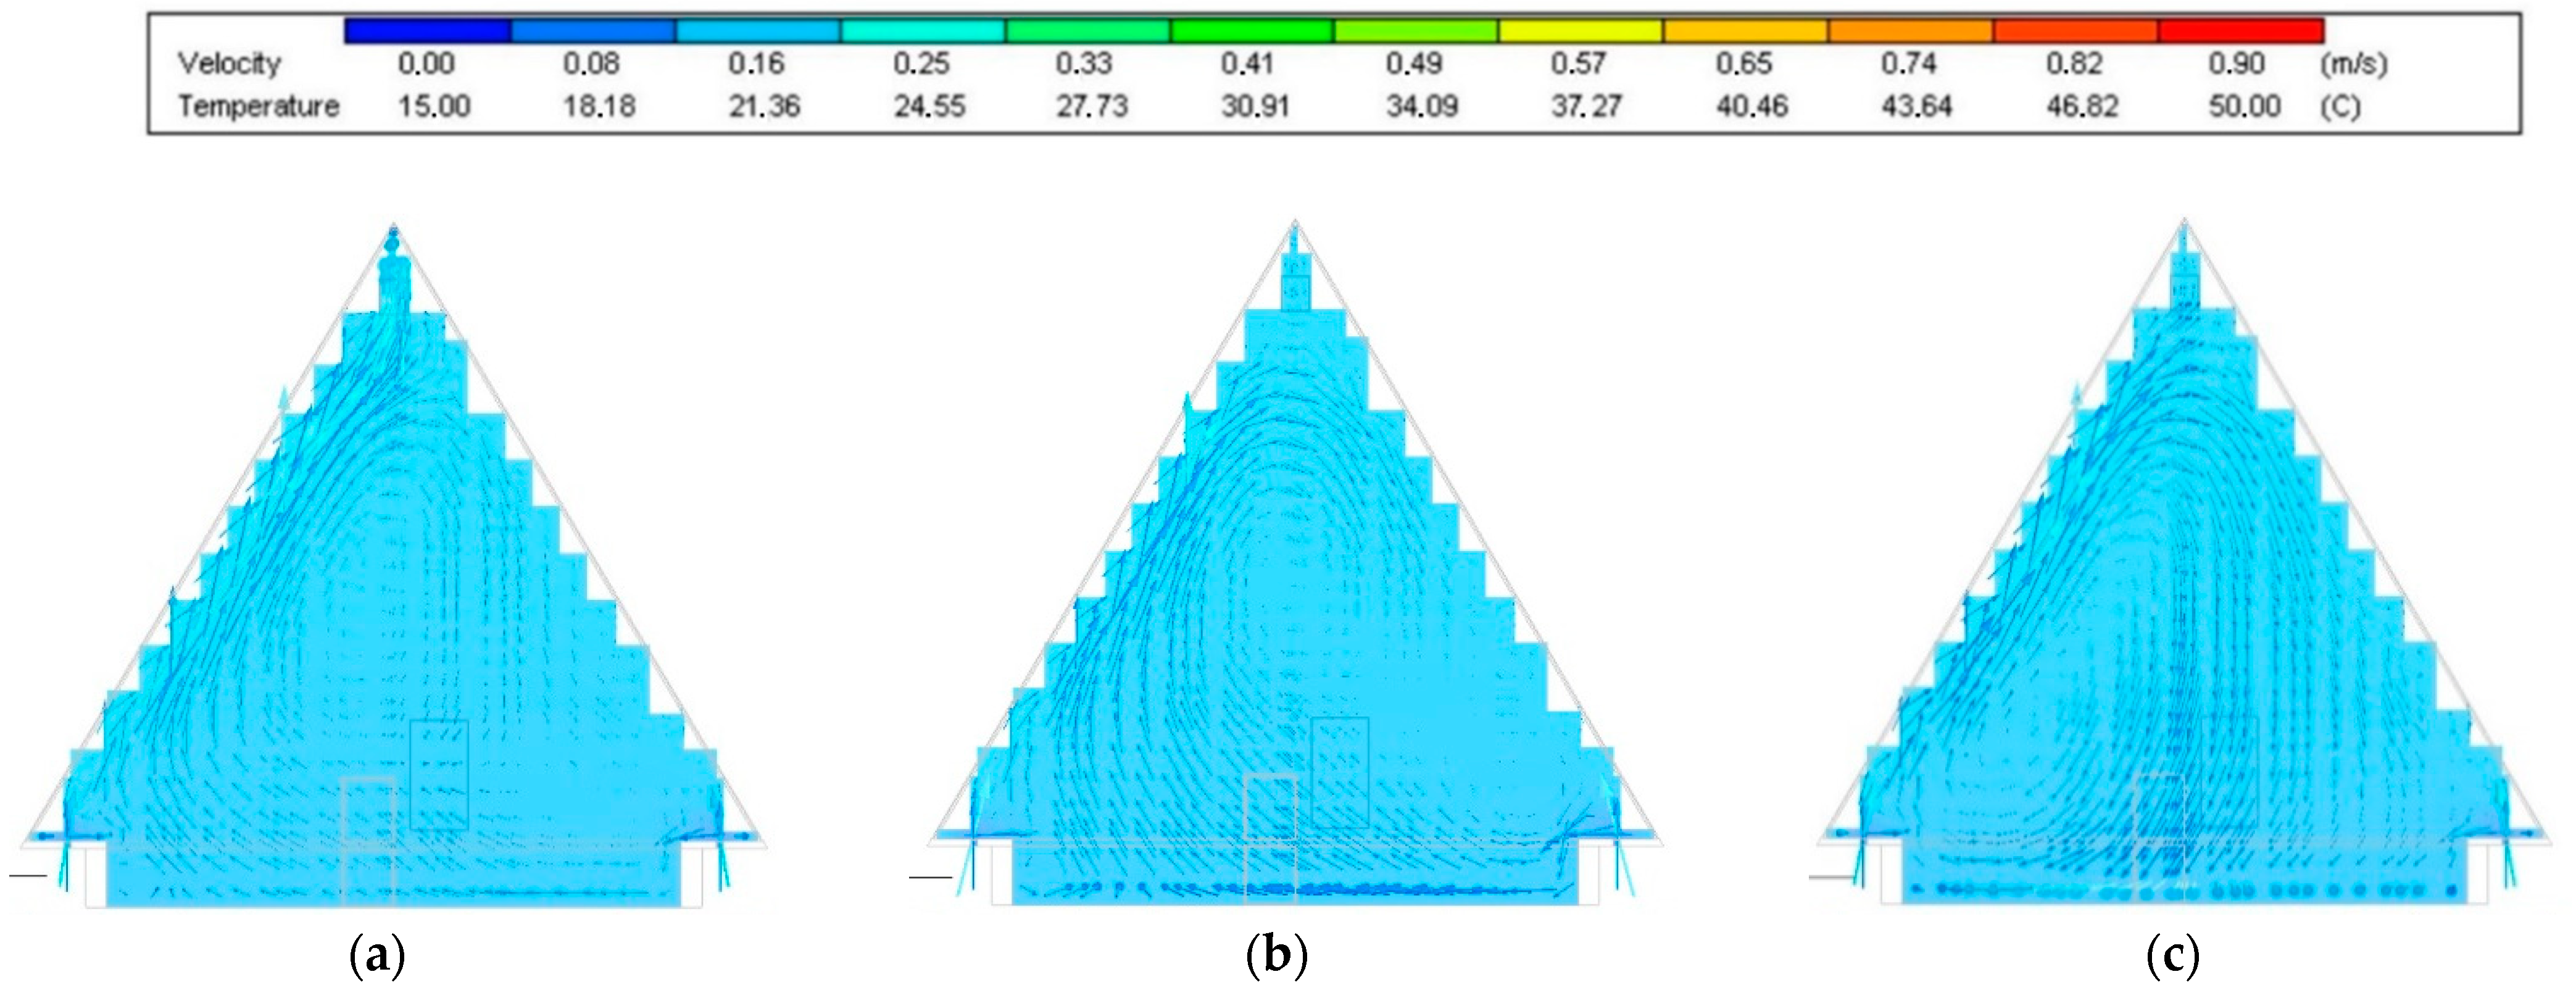
3.4. Airflow Simulation Results in the Morning
4. Conclusions
Author Contributions
Funding
Conflicts of Interest
Simulation Software
References
- Walker, I.S.; Forest, T.W. Field measurement of ventilation rates in attics. Build. Environ. 1995, 30, 333–347. [Google Scholar] [CrossRef]
- Kain, G.; Idam, F.; Federspiel, F.; Réh, R.; Krišťák, Ľ. Suitability of wooden shingles for ventilated roofs: An evaluation of ventilation efficiency. Appl. Sci. 2020, 10, 6499. [Google Scholar] [CrossRef]
- Gullbrekken, L.; Kvande, T.; Jelle, B.; Time, B. Norwegian pitched roof defects. Buildings 2016, 6, 24. [Google Scholar] [CrossRef] [Green Version]
- Nik, V.M.; Kalagasidis, A.S.; Kjellström, E. Assessment of hygrothermal performance and mould growth risk in ventilated attics in respect to possible climate changes in Sweden. Build. Environ. 2012, 55, 96–109. [Google Scholar] [CrossRef]
- Hnilica, O.; Bichlmair, S.; Plášek, J. Indoor Climate in Jesuit Church of Holy Name of Jesus in Telc. In Proceedings of the CLIMA 2019, E3S Web of Conferences, Bucharest, Romania, 26–29 May 2019; Volume 111, p. 03056. [Google Scholar]
- Wang, S.; Shen, Z.; Gu, L. The Impact of roof pitch and ceiling insulation on cooling load of naturally-ventilated attics. Energies 2012, 5, 2178–2196. [Google Scholar] [CrossRef] [Green Version]
- Tariku, F.; Iffa, E. Temperature and air flow patterns in attic roofs. J. Archit. Eng. 2017, 23, 04017014. [Google Scholar] [CrossRef]
- Tsilingiris, P.T. Thermal flywheel effects on the time varying conduction heat transfer through structural walls. Energy Build. 2003, 35, 1037–1047. [Google Scholar] [CrossRef]
- Ponechal, R.; Staffenova, D. Insulation thickness versus dynamic thermal parameters of external walls with regard to the thermal stability. Commun. Sci. Lett. Univ. Zilina 2017, 19, 102–108. [Google Scholar]
- Richter, J.; Staněk, K.; Tywoniak, J.; Kopecký, P. Moisture-safe cold attics in humid climates of Europe and North America. Energies 2020, 13, 3856. [Google Scholar] [CrossRef]
- Hagentoft, C.-E.; Sasic Kalagasidis, A. Drying potential of cold attic using natural and controlled ventilation in different Swedish climates. Procedia Eng. 2016, 146, 2–7. [Google Scholar] [CrossRef] [Green Version]
- Sparavigna, A.C. The solar orientation of the gothic cathedrals of France. Int. J. Sci. 2014, 3, 6. [Google Scholar] [CrossRef] [Green Version]
- Gibson, M.D. The Didascalia Apostolorum in English; C.J. Clay: London, UK, 1903. [Google Scholar]
- Lerma, C.; Borràs, J.G.; Mas, Á.; Torner, M.E.; Vercher, J.; Gil, E. Evaluation of hygrothermal behaviour in heritage buildings through sensors, CFD modelling and IRT. Sensors 2021, 21, 566. [Google Scholar] [CrossRef]
- Bartak, M.; Drkal, F.; Hensen, J.L.M.; Lain, M.; Matuska, J.; Schwarzer, J.; Sourek, B. Simulation to Support Sustainable HVAC Design for Two Historical Buildings in Prague. In Proceedings of the 18th Conference on Passive and Low Energy Achitecture, PLEA, Florianópolis, Brazil, 7–9 November 2001; pp. 903–908. [Google Scholar]
- Balocco, C.; Grazzini, G. Numerical simulation of ancient natural ventilation systems of historical buildings. A case study in Palermo. J. Cult. Herit. 2009, 10, 313–318. [Google Scholar] [CrossRef]
- D’Agostino, D.; Congedo, P.M. CFD modeling and moisture dynamics implications of ventilation scenarios in historical buildings. Build. Environ. 2014, 79, 181–193. [Google Scholar] [CrossRef]
- Balocco, C.; Petrone, G.; Cammarata, G. Numerical multi-physical approach for the assessment of coupled heat and moisture transfer combined with people movements in historical buildings. Build. Simul. 2014, 7, 289–303. [Google Scholar] [CrossRef]
- Wang, S.; Shen, Z.; Gu, L. Numerical simulation of buoyancy-driven turbulent ventilation in attic space under winter conditions. Energy Build. 2012, 47, 360–368. [Google Scholar] [CrossRef] [Green Version]
- Oetelaar, T. CFD, Thermal Environments, and Cultural Heritage. Two Case Studies of Roman Baths. In Proceedings of the 16th International Conference on Environment and Electrical Engineering (EEEIC) (IEEE, 2016), Florence, Italy, 7–10 June 2016; pp. 1–6. [Google Scholar]
- Grau-Bové, J.; Mazzei, L.; Strlic, M.; Cassar, M. Fluid simulations in heritage science. Herit. Sci. 2019, 7, 12. [Google Scholar] [CrossRef]
- Lu, Y.; Dong, J.; Wang, Z.; Wang, Y.; Wu, Q.; Wang, L.; Liu, J. Evaluation of stack ventilation in a large space using zonal simulation and a reduced-scale model experiment with particle image velocimetry. J. Build. Eng. 2021, 34, 101958. [Google Scholar] [CrossRef]
- Albuquerque, D.P.; Mateus, N.; Avantaggiato, M.; da Graça, G.C. Full-scale measurement and validated simulation of cooling load reduction due to nighttime natural ventilation of a large atrium. Energy Build. 2020, 224, 110233. [Google Scholar] [CrossRef]
- Stachnik, M.; Jakubowski, M. Multiphase model of flow and separation phases in a whirlpool: Advanced simulation and phenomena visualization approach. J. Food Eng. 2020, 274, 109846. [Google Scholar] [CrossRef]
- Korenkova, R.; Krusinsky, P.; Pisca, P. Analysis of the impact of microclimate in a roof space on a gothic truss construction. Commun. Sci. Lett. Univ. Zilina 2013, 15, 27–31. [Google Scholar]
- Ponechal, R.; Krusinsky, P.; Pisca, P.; Korenkova, R. Simulation and Measurement of Microclimate in Roof Space on a Gothic Truss Construction. In Proceedings of the 27th R-S-P Seminar, Theoretical Foundation of Civil Engineering. MATEC Web Conference, Rostov-on-Don, Russia, 7—21 September 2018; Volume 196, p. 02044. [Google Scholar]
- Degelman, L. A Statistically-Based Hourly Weather Data Generator for Driving Energy Simulation and Equipment Design SoftWare for Buildings. In Proceedings of the 2nd International IBPSA Conference Building Simulation, Nice, France, 20–22 August 1991; pp. 592–599. [Google Scholar]
- Walton, G.N. Airflow network models for element-based building airflow modeling. ASHRAE Trans. 1989, 95, 613–620. [Google Scholar]
- Zhai, Z.; Chen, Q.; Klems, J.H.; Haves, P. Strategies for Coupling Energy Simulation and Computational Fluid Dynamics Programs. In Proceedings of the 7th International IBPSA Conference Building Simulation, Rio de Janeiro, Brazil, 13–15 August 2001; pp. 59–66. [Google Scholar]
- Koronthalyova, O.; Mihalka, P.; Matiašovský, P. Model for complex simulation of HAM-transfer in a single thermal zone building. Build. Res. J. 2004, 52, 199–217. [Google Scholar]
- Moravčíková, K.; Janák, M. Experimental and Theoretical Thermal Analysis of the Transparent Naturally Ventilated Double Skin Facade. In Proceedings of the Junior Scientist Conference 2010, University of Technology, Vienna, Austria, 7–9 April 2010; pp. 373–374. [Google Scholar]
- Flack, R.D.; Witt, C.L. Velocity measurements in two natural convection air flows using a laser velocimeter. J. Heat Transf. 1979, 101, 256–260. [Google Scholar] [CrossRef]
- Suchý, L.; Krušinský, P.; Babjaková, Z.; Ďurian, K. Historical Trusses of the Sacral Buildings in the Region of Turiec; M. Gibala: Kysucke Nove Mesto, Slovakia, 2008. (In Slovakian) [Google Scholar]
- Krušinský, P.; Capková, E. Geometric analysis of the truss above the nave and presbytery of the roman-catholic church in village Bela Dulice. Adv. Mater. Res. 2014, 1020, 736–740. [Google Scholar] [CrossRef]
- Krušinský, P.; Capková, E.; Gocál, J. Comparison of Two Medieval Trusses from the Viewpoint of Geometric and Static Analysis. Adv. Mater. Res. 2014, 1122, 243–248. [Google Scholar] [CrossRef]
- Baharvand, M.; Ahmad, M.H.B.; Safikhani, T.; Majid, R.B.A. DesignBuilder verification and validation for indoor natural ventilation. J. Basic Appl. Sci. Res. 2013, 3, 182–189. [Google Scholar]
- Patankar, S.V. Numerical Heat Transfer and Fluid Flow; Taylor and Francis: Boca Raton, FL, USA, 1980. [Google Scholar]
- Harris, D.J.; Helwig, N. Solar chimney and building ventilation. Appl. Energy 2007, 84, 135–146. [Google Scholar] [CrossRef]
- Montazeri, H.A. Experimental and numerical study on natural ventilation performance of various multi-opening wind catchers. BuildEnviron 2011, 46, 370–378. [Google Scholar] [CrossRef]
- Hughes, B.R.; Calautit, J.K.; Ghani, S.A. The development of commercial wind towers for natural ventilation: A review. Appl. Energy 2012, 92, 606–627. [Google Scholar] [CrossRef]
- Lau, J.; Niu, J.L. Measurement and CFD simulation of the temperature stratification in an atrium using a floor level air supply method. Indoor Built Environ. 2003, 12, 265–280. [Google Scholar] [CrossRef]
- Katona, Á.L.; Xuan, H.; Elhadad, S.; Kistelegdi, I.; Háber, I. High-resolution CFD and in-situ monitoring based validation of an industrial passive air conduction system (PACS). Energies 2020, 13, 3157. [Google Scholar] [CrossRef]


| Sensor No. | X Direction (m) | Y Direction (m) | Z Direction (m) | Maximum of Daily Air Temperature (°C) | Minimum of Daily Air Temperature (°C) |
|---|---|---|---|---|---|
| 3 | 3.8 | 2.5 | 0.3 | 27.7 | 15.5 |
| 4 | 3.8 | 5.9 | 0.3 | 27.4 | 10.7 |
| 6 | 0 | 4.4 | 1.5 | 25.0 | 14.9 |
| 7 | 9.4 | 4.7 | 1.5 | 25.4 | 15.4 |
| 8 | 4.7 | 4.2 | 8.4 | 47.7 | 14.4 |
| Zone | Volume (m3) | Zone | Volume (m3) | Zone | Volume (m3) |
|---|---|---|---|---|---|
| Sanctuary_1 | 89.20 | Nave_1 | 216.65 | Tower_1 | 66.88 |
| Sanctuary_2 | 45.38 | Nave_2 | 105.78 | Tower_2 | 84.80 |
| Sanctuary_3 | 47.97 | Nave_3 | 114.33 | Tower_3 | 64.00 |
| Nave_4 | 30.78 | Church | 137.66 | ||
| Nave_5 | 9.29 |
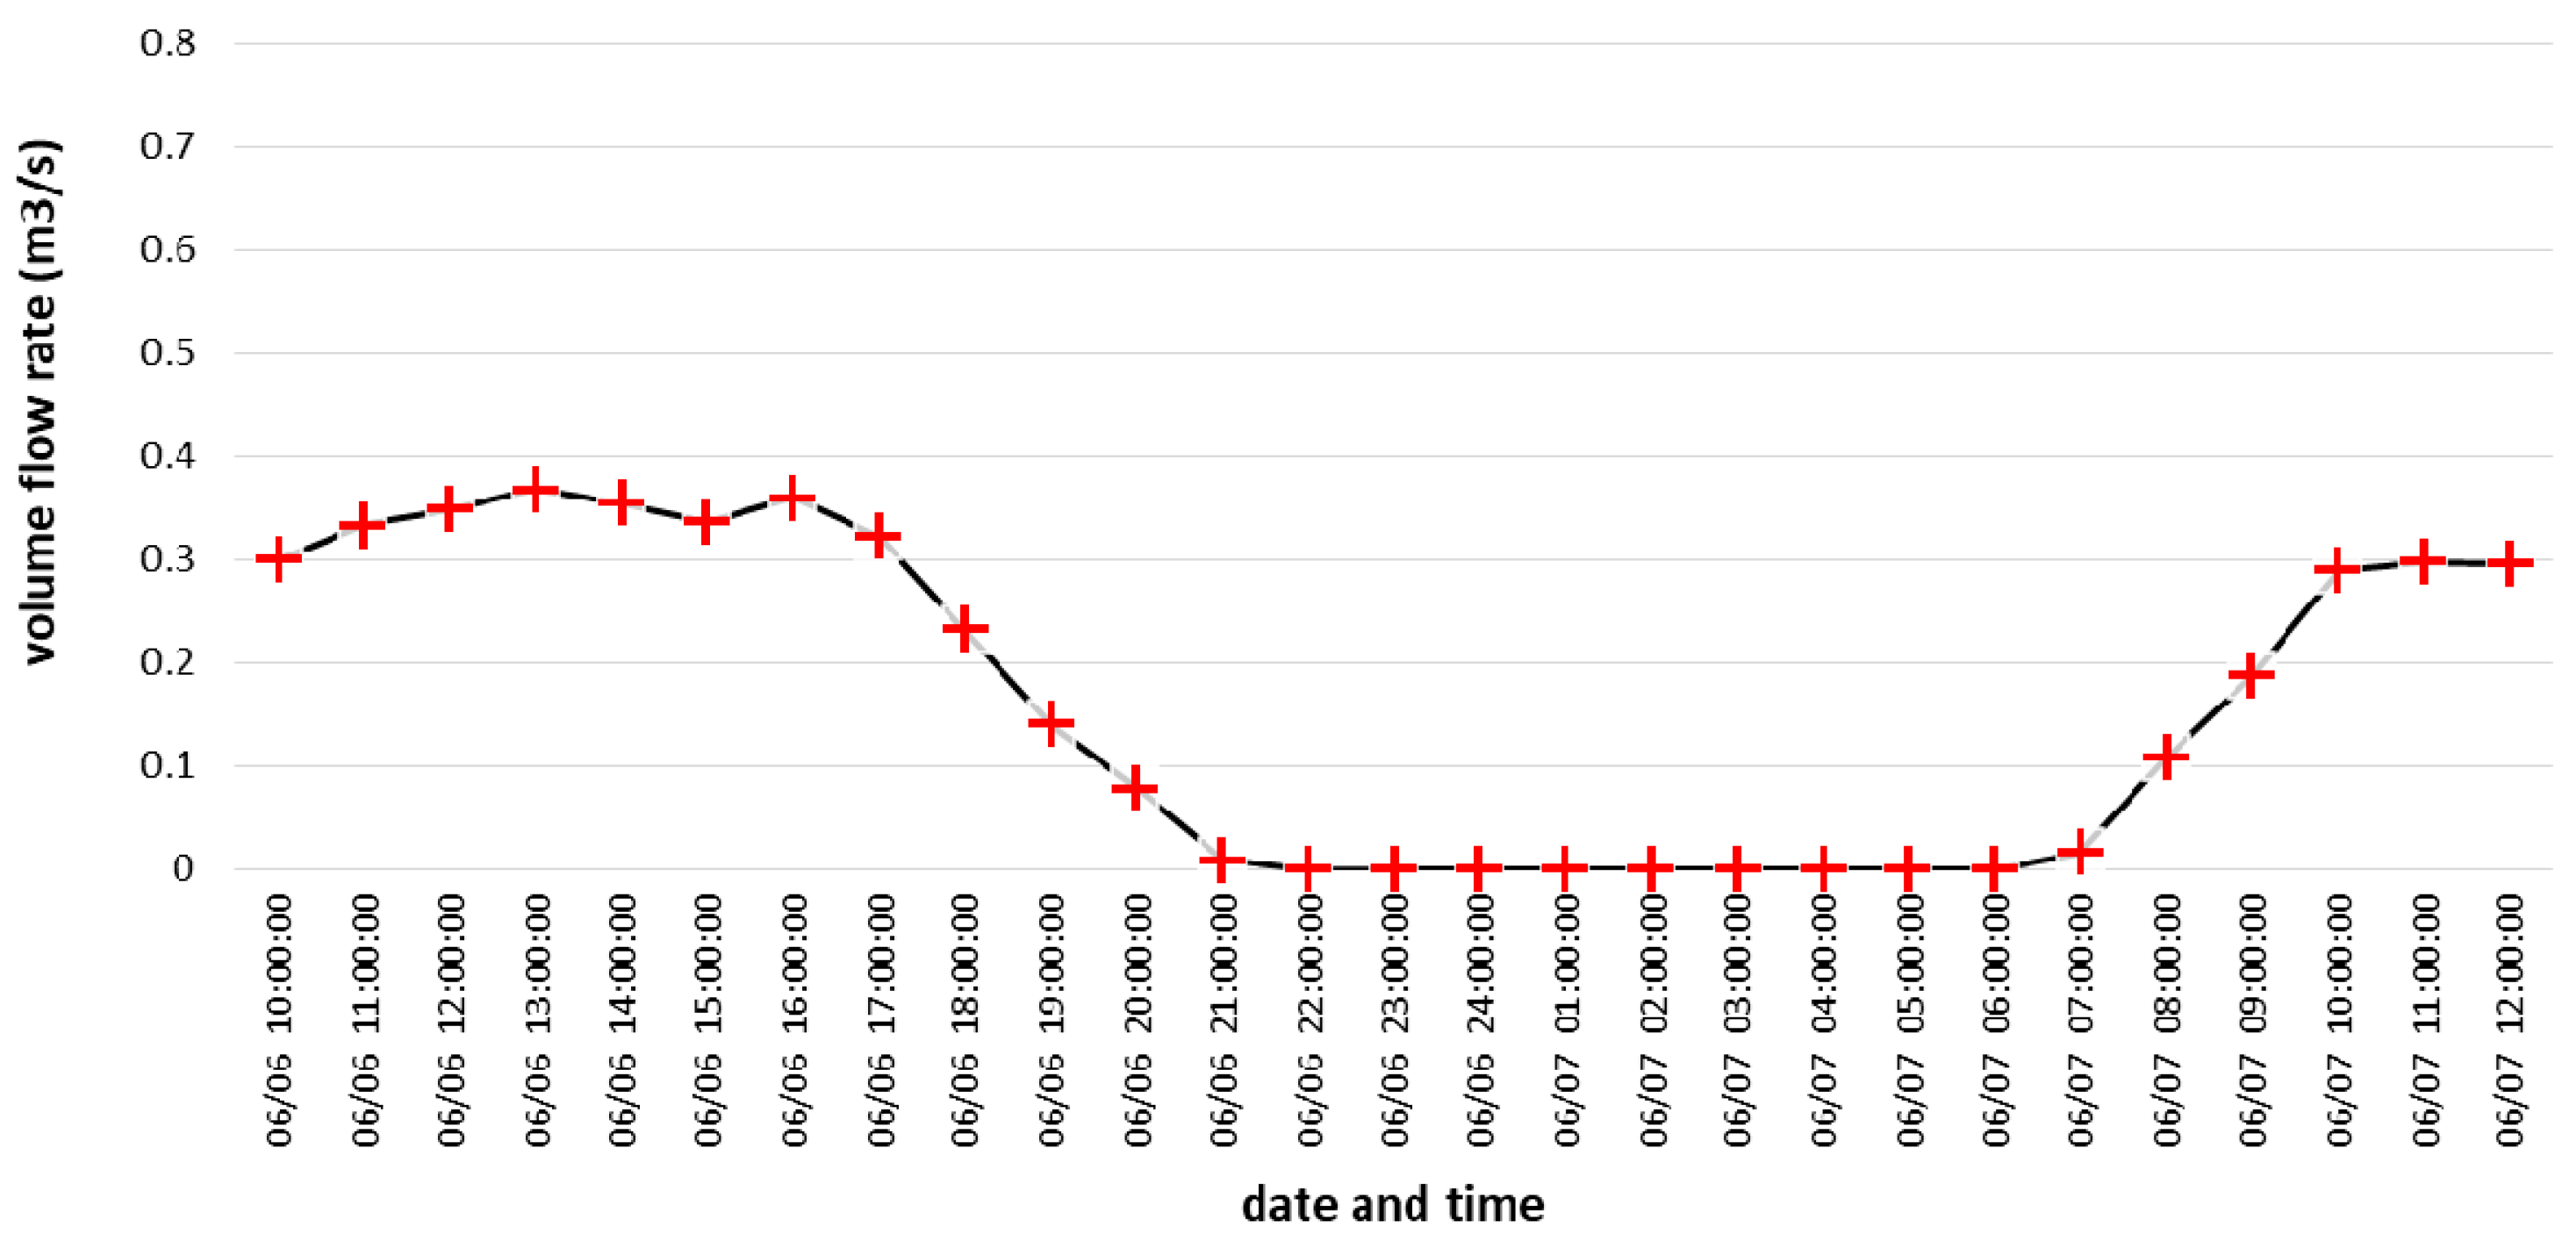
| Opening | Area (m2) | Airflow (m2·s−1) | Velocity (m·s−1) | Air temperature (°C) |
|---|---|---|---|---|
| door to the tower | 1.260 | 0.37 | 0.29 | 24 |
| slots in the soffit—south side | 0.731 | 0.04 | 0.05 | 27.5 |
| slots in the soffit—north side | 0.731 | 0.04 | 0.05 | 27.5 |
| Surface | Temperature (°C) | Surface | Temperature (°C) |
|---|---|---|---|
| roof—north side roof—south side | 32–39 | attic floor | 23 |
| 57–61 | stone masonry walls | 23–33 |
| Opening | Area (m2) | Airflow (m3·s−1) | Velocity (m·s−1) | Air Temperature (°C) |
|---|---|---|---|---|
| door to the tower | 1.260 | 0.14 | 0.11 | 22 |
| door to the next loft | 1.232 | 0.08 | 0.06 | 24 |
| upper opening | 0.200 | 0.08 | 0.40 | 25 |
| Surface | Temperature (°C) | Surface | Temperature (°C) |
|---|---|---|---|
| roof—north side roof—south side | 24 | attic floor | 23 |
| 23–25 | stone masonry walls | 23–27 |
| Opening | Area (m2) | Airflow (m2·s−1) | Velocity (m·s−1) | Air Temperature (°C) |
|---|---|---|---|---|
| door to the next loft | 1.232 | 0.12 | 0.10 | 16 |
| slots in the soffit—south side | 0.731 | 0.15 | 0.21 | 13 |
| slots in the soffit—north side | 0.731 | 0.15 | 0.21 | 13 |
| Surface | Temperature (°C) | Surface | Temperature (°C) |
|---|---|---|---|
| roof—north side roof—south side | 10–12 | attic floor | 20 |
| 10–12 | stone masonry walls | 19–20 |
| Opening | Area (m2) | Airflow (m2·s−1) | Mean Velocity (m·s−1) | Air Temperature (°C) |
|---|---|---|---|---|
| door to the tower | 1.260 | 0.01 | 0.01 | 18 |
| slots in the soffit—south side | 0.731 | 0.10 | 0.14 | 17 |
| slots in the soffit—north side | 0.731 | 0.10 | 0.14 | 17 |
| Surface | Temperature (°C) | Surface | Temperature (°C) |
|---|---|---|---|
| roof—north side roof—south side | 21–22 | attic floor | 20 |
| 21 | stone masonry walls | 19–21 |
Publisher’s Note: MDPI stays neutral with regard to jurisdictional claims in published maps and institutional affiliations. |
© 2021 by the authors. Licensee MDPI, Basel, Switzerland. This article is an open access article distributed under the terms and conditions of the Creative Commons Attribution (CC BY) license (https://creativecommons.org/licenses/by/4.0/).
Share and Cite
Ponechal, R.; Krušinský, P.; Kysela, P.; Pisca, P. Simulations of Airflow in the Roof Space of a Gothic Sanctuary Using CFD Models. Energies 2021, 14, 3694. https://doi.org/10.3390/en14123694
Ponechal R, Krušinský P, Kysela P, Pisca P. Simulations of Airflow in the Roof Space of a Gothic Sanctuary Using CFD Models. Energies. 2021; 14(12):3694. https://doi.org/10.3390/en14123694
Chicago/Turabian StylePonechal, Radoslav, Peter Krušinský, Peter Kysela, and Peter Pisca. 2021. "Simulations of Airflow in the Roof Space of a Gothic Sanctuary Using CFD Models" Energies 14, no. 12: 3694. https://doi.org/10.3390/en14123694
APA StylePonechal, R., Krušinský, P., Kysela, P., & Pisca, P. (2021). Simulations of Airflow in the Roof Space of a Gothic Sanctuary Using CFD Models. Energies, 14(12), 3694. https://doi.org/10.3390/en14123694