Article

Cascaded Centered Moving Average Filters for Energy Management in Multisource Power Systems with a Large Number of Devices

1
IREENA, Nantes University, CRTT 37 Bd de l’Université, CEDEX, 44600 Saint-Nazaire, France
2
ESEOTECH, 10 Bd Jeanneteau-CS 90717, CEDEX 2, 49107 Angers, France
*
Author to whom correspondence should be addressed.
Energies 2021, 14(12), 3627; https://doi.org/10.3390/en14123627
Submission received: 15 April 2021 / Revised: 8 June 2021 / Accepted: 14 June 2021 / Published: 18 June 2021

Abstract

:
Hybrid systems constitute one of the solutions for supplying isolated applications. Such systems are classically based on clean energy sources. When the renewable energy sources have intermittent productions, they are associated with storage systems. This makes the system economically more interesting. Economically speaking, hybrid energy systems using multiple energy sources are often expensive and their cost must be optimized. This optimization can be done for the system sizing or for its energy management. However, optimizing one does not guarantee the optimization of the other. Indeed, previous studies optimize either the design and apply it with a simple energy management strategy, or the energy management with predetermined sizing supposed optimized, while minimizing the number of sources that contain the hybrid system. In this paper, an energy management and sizing algorithm, applicable to multisource systems, composed of a large number of sources, is proposed. The method is based on a modified centered moving average filters architecture for energy management, which permits one to consider and to automatically balance the forecasting errors in solar and load profiles. The energy management is then limited to a small number of parameters, which are the averaging horizon and weight coefficients. It is then possible to optimize, at the same time, the sizing and the energy management of such power systems. The proposed optimization criterion is based on a techno-economic approach, by considering acquisition and operation costs, as well as the ageing of the different devices. The main novelty of this approach is the use of energy management formulation that is able to manage an architecture with a high number of controlled devices. An original formulation of centered moving average filters also permits one to automatically balance the power bias due to forecasting errors on the renewable resources and the load profile. The method is applied to five devices, including photovoltaic panels, a fuel cell, two batteries with different technologies (Li-ion and lead-acid) and supercapacitors.

1. Introduction

From the 1920s to the 1970s, a new electrical load-feeding procedure was introduced consisting of separating the loads and supplying them with various generators [1]. This technique brought a lot of advantages, especially in terms of construction cost per kW. Since the 1970s, large generating resources such as tidal stream generators have been added to these systems [1]. On the other hand, the benefits of these applications have been progressively reduced because of environmental laws that have been issued by governments and international organizations. All of this has forced companies to motivate their scientists and engineers to look for new solutions.
One of these solutions was the construction of independent power generating units of small sizes. Then, at the end of this period, these units were developed in such a way as to be able to integrate renewable energy sources, which are mainly based on wind turbines and photovoltaic panels [2]. Starting in the 1970s, governments were gradually moving towards policies and laws that encourage the reduction of the use of carbon-based sources. As a result, the land has become ready for the emergence of decentralized electricity generation units that do not emit gas. This solution began in the late 1990s with the introduction of small networks for power-isolated applications, which contain energy sources and energy storage systems (ESS) that communicate locally. These systems are called multisource systems or hybrid systems.
The use of renewable energy generation systems is one of the possible solutions for powering applications in remote or isolated areas. Many examples of actual and operational multisource systems can be presented. Indeed, in [3], a desalination unit located in Noubarya, Egypt, was powered by a multisource system consisting of solar panels, wind turbines, batteries as a storage system and diesel group as an auxiliary energy source. Similarly, in [4], a multisource system consisting of wind turbines, electrochemical batteries and a diesel group, was designed to supply households and schools located in a remote site in Cameroon. With the same idea, a typical isolated village in Malaysia was powered by a multi-source system with the same devices [5]. Additionally, a hybrid system consisting of photovoltaic panels, wind turbines and batteries was used to power a small remote community in Palestine [6]. The application of this technique is again developed, to feed larger loads like whole islands, as in [7], where the authors used a multisource system including a fuel cell, a marine current turbine managed by a permanent magnet synchronous generator, all supported by a LiFePO4 battery system to meet the electrical energy requirements of an island of residential loads.
According to Navigant Research Report [8], the total power produced by micro-arrays including at least one renewable energy source, will reach 7.6 GW by 2024. Additionally, it divides the application domains of multisource systems into several segments according to the total power deployed in 2016: isolated sites (54%), public services (13%), residential (13%), institutional (9%), military (6%) and commercial/industrial (5%). With emphasis on residential applications in isolated sites, particular attention should be paid to the variability of the load profiles to be satisfied and to the effect of renewable resource intermittency on the service level, as well as the maintenance required to maintain system operation [1]. The works [9,10,11,12] represent some examples of research on hybrid systems based on renewable energy, supplying isolated residential loads. In terms of energy management in autonomous systems, the strategies fall into three categories: The first one groups the strategies based on linear programming, also called rule-based strategies, such as fuzzy logic [13,14,15,16,17], wavelet transform [18,19,20] and flowchart-based strategies priority [5,21,22,23]. A second group uses energy management strategies based on intelligent techniques such as neural networks [24,25]. A third category is also represented by control strategies based on optimization, such as dynamic programming [26,27,28] and predictive control (MPC) [29,30,31,32].
All the strategies mentioned in the previous paragraph have been applied to multisource systems of an architecture composed of up to four sources and/or energy storage devices. This can be explained by the fact that coupling energy sources in a power system makes the energy management hard to optimize, due to a large number of freedom degrees. It is the reason why many works limit the studies to power systems with a limited number of sources (less than two), coupled with a single storage system, to try to reduce the system complexity through a limited degree of freedom [33,34,35].
Several works study another side of the subject, namely sizing. During the design phase of the elements of a multisource system, three sizing indicators can be adopted: financial, technical or techno-economic [36,37]. Financial indicators are key factors in determining the size of a device in a multisource system. Among the advantages of this criterion is that there is a common unit, which is the currency, making the comparison between several solutions possible. There are also several kinds of financial indicator, such as the time value of money [38], the commercial benefit of the inclusion of the device in the system [39], etc. As for technical indicators, they are represented in the form of constraints and requirements to be respected by the power profile supplied/stored by the source [37]. Additionally, there is a third indicator that combines the first two. It consists of determining the minimum size of the system that respects the technical constraints and then setting the technology that minimizes the financial indicator [40]. Energy management and sizing are two very connected phases and directly affect the optimization of the total cost of the system. Generally, the authors study the optimization, either of energy management with the preliminary setting of the sources sizing, or sizing devices with a simple management strategy [41]. Compared to previous works, in this article, a new energy management strategy is proposed. It is inspired from frequency separation algorithms [19,42], that allow one both to manage energy flows between sources and storage systems and to determine the sizing of each device, to optimize the total system cost.
The proposed strategy has a generic structure and is based on a frequency separation with centered moving average (CMA) filters, which gives an adapted power profile for each device. An issue of such filter structure is the need for an estimation of the power profile. The CMA filter is a special case of FIR filters, where the weight coefficients are all equal to each other. As it is an acausal structure, it permits one to consider future states and past states to generate the power profile of a source or storage device. Obviously, future states are not known but only estimated. It is the reason why some forecasting errors can appear. In case of overly large forecasting errors, deviations on the power profiles at the output of CMA filters can lead to high power and state of charge deviations, that have to be balanced. In this work, we propose an original version of CMA filters, which automatically compensate the forecasting errors to ensure that they keep the expected dynamics of the power profile supply by each device.
Moreover, this structure can easily be applied to hybrid systems composed of a large number of energy sources or storages, with different technologies, which is an important step forward for such multi-source application. With the same idea, it is also proposed here to extend the concept of cascaded filters to reach a more general architecture of control, with series-parallel filters. It permits one to include a large choice of device technologies, to try to reach an optimal control, while allowing redundancy, which finally improves the reliability of the power system. In addition, the energy management is set by a limited number of parameters, which then also allows the optimization of the sizing of the different devices. In this work, we consider the minimization of the total cost of the multisource power system. This criterion permits one to evaluate the effect of several phenomena such as the lifetime of the different devices, as well as acquisition, maintenance and operation costs.
The paper is organized as follows: Section 1 explains the principle of the proposed algorithm. In Section 2, the algorithm will be applied to a multisource system consisting of solar panels as a renewable source, a PEM fuel cell, two batteries of different technologies and a bench of supercapacitors as energy storage systems. The results obtained, in terms of energy management, sources technologies and sizing will be presented in Section 3. Finally, the main conclusions will be given in Section 4.

2. Proposed Energy Management Approach

Algorithms based on frequency separation and wavelet transform inspire the proposed algorithm. Figure 1 illustrates its general architecture based on a series-parallel architecture of blocks called “device controllers”. Each of them is responsible for calculating the reference power (the set point) of one power source. The algorithm is based on centered moving average (CMA) filters [13]. The idea is to consider a predicted profile of the requested power over a defined future time horizon. Based on this predicted profile, the algorithm determines the profile, the sizing and the technology of a power device. By then cascading these CMA filters, it becomes easy to distribute the power profile on all the sources and storage devices of the multi-source system. A classic cascading architecture consists of organizing the components from the slowest (first stages) to the fastest (last stages). From the output of one stage, the residual power is computed and used as input of the next stage (see Figure 1). It is common to find research works using these cascaded CMA filters, but considering only one component per stage. A first evolution that is proposed in this paper is to consider the possible connection of several components on one stage. Each component is then associated to a CMA filter with a given time horizon and given weighting coefficients. The only constraint on weighting coefficient is that the sum for one stage is equal to unity:
i = 1 N a k i = 1
With k the stage number and N the total number of components for this stage. The serialization of the blocks has several advantages. Firstly, it allows the easy management of energy in hybrid systems composed of several and different natures of sources. Secondly, thanks to the notion of residual power, the power demanded by the customer is completely provided. Additionally, it guarantees the non-divergence of the states of charge of the energy storage systems over the operation time. Finally, it allows an automatic compensation behavior of prediction errors that can affect the predicted input of the algorithm when the hybrid system is turned on. These last two findings are mathematically demonstrated in the following sections. In addition, the paralleling of the controllers allows the possibility of managing energy between sources of identical or similar technologies.
Now that the global architecture of the energy management is presented, it is possible to focus on the structure of a CMA controller. Figure 2 represents the internal structure of such a controller. It consists of four main functions: a CMA filter [13], a power limit supervision function, an energy limit supervision function and a state of charge controller for storage devices [42].
The previous architectures correspond to the optimization phase for which the algorithm will need only the future estimate of the requested power to estimate the optimal distribution, as well as the optimal dimensions and technologies of devices. On the other hand, after the installation of the system, a second entry will be added, which represents the data measured in the past of the requested power. This allows for the inclusion of forecast errors that may be present.

2.1. Centered Moving Average Filter

The moving average filter is the fundamental function of each device controller [33,42,43]. The output of a filter represents the reference power of the energy source associated with it. When the system is turning on, the reference power is calculated in real time from the data measured in the past of the requested power (measures), noted P i n _ k i , and predicted future data of the same requested power, noted P ^ i n _ k i (to highlight the predicted nature of this power profile). The next equation gives a mathematical expression of such a CMA filter [33,34]:
P k i ( t n ) = a k i H k i t n H k i 2 t n + H k i 2 P i n k ( t )   d t
with P k i ( t n ) the output power of the filter at time t n , H k i the calculation horizon of the filter k i , a k i a weighting coefficient. This filter can be seen as a convolution between the input power Pink and a centered rectangular window with a total length of Hki. The main interest of such a filter is the small number of degrees of freedom (weighting coefficient and filtering horizon) and the possibility of taking into account, in a balanced way, the power profile in the future and in the past, and then without adding any delay in the generated output power profile. However, it is then obvious that such a filter is acausal and it must be modified to be implemented on real applications. Then, a first modified version consists of separating the history of the measurements and the predictions, such as:
P k i ( t n ) = a k i H k i [ t n H k i 2 t n P i n k ( t )   d t + t n t n + H k i 2 P ^ i n k ( t ) d t ]
where P ^ i n k is the predicted input power of the Stage k . This filter version is now causal, but because of possible prediction errors, an additional compensation stage must be added to ensure that long-term errors are balanced. Practically, without such compensation, the power profile supplied by the storage stages could lead to a state of charge deviations, due to a non-zero mean value of the power.
Here, an original formulation of a causal CMA filter is proposed to automatically balance the prediction errors. This formulation is the next one:
P k i ( t n ) = a k i H k i [ t n H k i 2 t n 2 P i n k ( t ) P ^ i n k ( t )   d t + t n t n + H k i 2 P ^ i n k ( t ) d t ]
The form of the first part of the Equation (2) is not obvious, but is justified by the presence of the estimation errors, which have to be balanced. The rest of the section presents and demonstrates the results obtained with this new CMA filter formulation.
Each filter is only set by the width of its filtering horizon H k i . This horizon is linked to the dynamic possibilities of the source. A larger time horizon leads to lower dynamics at the filter output. Then, slow sources are controlled by CMA filters with large time horizons. It is the reason why it is expected that the first stages have time horizons larger than the next one. Moreover, for the controllers of the same level, the calculation horizons of the filters can be different, but should remain in the same range. As a synthesis and in order to explain the operating principle of the algorithm, we present below a simple example of application through which the mathematical findings will be demonstrated.
If we consider P L o a d ( t ) as a function which represents the profile of the power that a residential load will consume over a week and P ^ L o a d ( t ) as a forecast of the evolution of this profile. Added to that, we also consider P P V ( t ) as a function that represents the profile of the power that some solar panels will generate over a week, and P ^ P V ( t ) a forecast of the evolution of this profile. Two other profiles Δ P and   Δ ^   P are also created. They respectively represent the power difference to be satisfied by the multi-source system (supply it if Δ P ( t ) > 0 or store it if Δ P ( t ) < 0 ) and a future forecast of this difference, expressed as follows:
Δ P ( t ) = P L o a d ( t ) P P V ( t ) Δ ^ P ( t ) = P ^ L o a d ( t ) P ^ P V ( t )
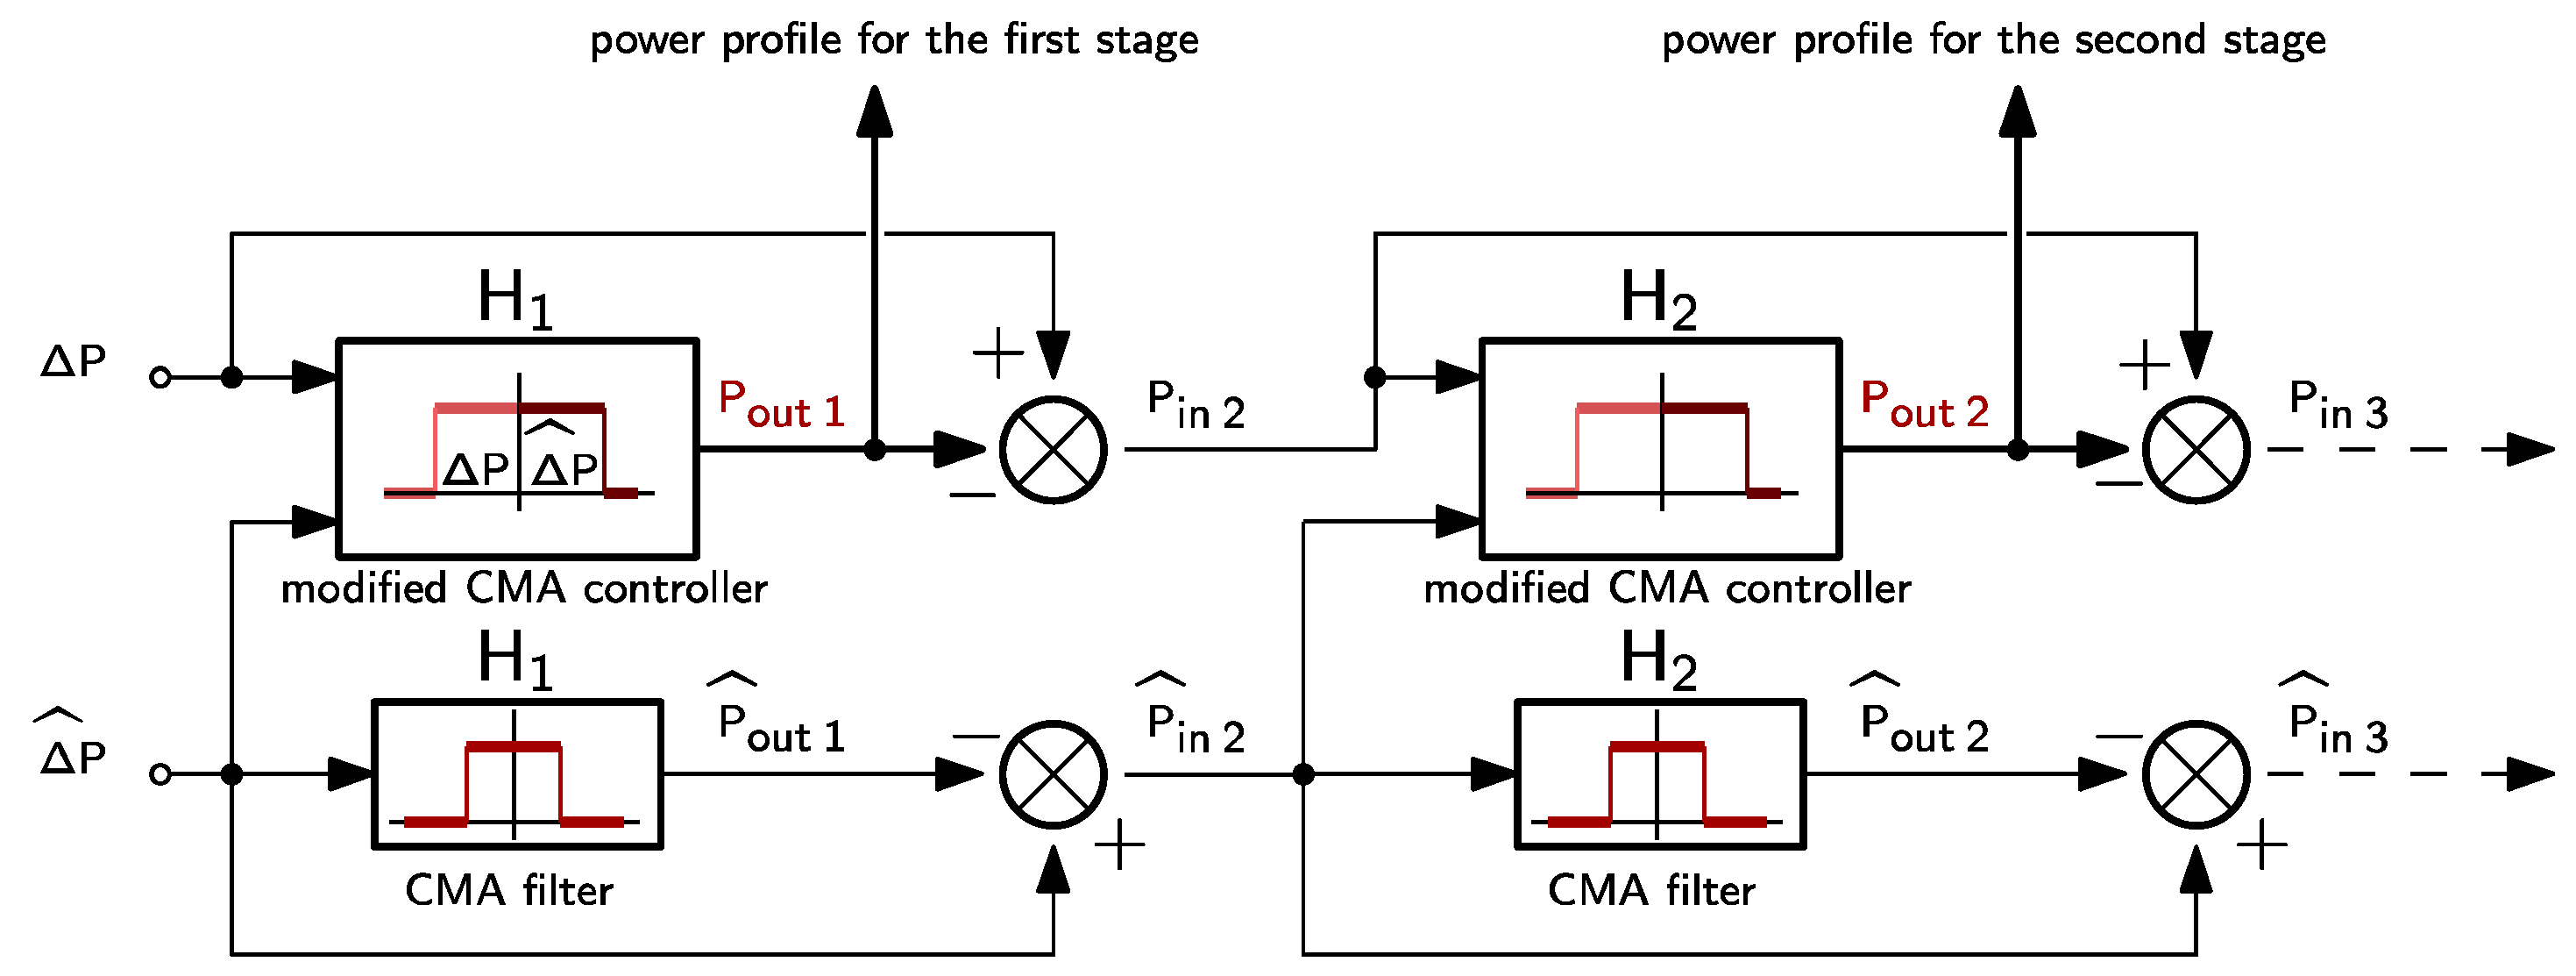
These two profiles are supposed to be the two inputs, measured and predicted, respectively, of the algorithm. The expected energy source profile is not really defined. It can come from historical data or simulations. In the worst case, if no historical data exists, it can be replaced by the power expectancy. It is also considered that a multisource system is composed of a slow dynamic primary energy source, a first storage system with a moderate dynamic and a second storage system with a fast dynamic. Figure 3 shows the architecture of the corresponding algorithm. At this stage, two situations may exist. The first case considers no prediction errors, which leads to Δ P ( t ) =   Δ ^   P ( t ) . At first, we suppose that our forecasts of the consumed and generated powers (and therefore Δ P ) will coincide perfectly with what will be really consumed and generated. Then, if the actual power Δ P is replaced by its estimated value   Δ ^   P , the output of the first CMA filter is given by:
P o u t   1 ( t n ) = a 1 H 1 t n H 1 2 t n + H 1 2 Δ ^ P ( t )   d t
As the stage 1 is here composed of a single controller, it leads that a 1 = 1 . For the second stage, if the actual power Δ P ( t ) is also replaced by estimated future power   Δ ^ P ( t ) and if we consider a weight factor a 2 = 1 , the output of the second CMA filter is given by:
P o u t   2 ( t n ) = 1 H 2 t n H 2 2 t n + H 2 2 [   Δ ^ P ( t ) 1 H 1 t n H 1 2 t n + H 1 2   Δ ^ P ( t ) d t ] d t
Developing Equation (4) permits one to express the output of the filter with two different average calculations:
P o u t   2 ( t n ) = 1 H 2 t n H 2 2 t n + H 2 2   Δ ^ P ( t ) d t 1 H 1 H 2 t n H 2 2 t n + H 2 2 t n H 1 2 t n + H 1 2   Δ ^ P ( t ) d t
To help to understand this result, we can consider the mean value of signals. Indeed, it is obvious that the average value of CMA filter over an arbitrary horizon H s is equal to the average value of the input signal, over the same horizon. Noting x H s the average value of a signal x ( t ) over a time horizon H s , it can be deduced that the average value of the output y ( t ) of CMA filter with horizon H i is equal to the average value of the input u ( t ) :
y H s = u H i H s u H s
where H s > > H i . If we applied this relation to Equations (3) and (4), it is obtained for the first stage:
P o u t   1 H s =   Δ ^ P H 1 H s   Δ ^ P H s
and then, for the second stage:
P o u t   2 H s =   Δ ^ P H 2   Δ ^ P H 1 H 2 H s 0
In other words, only the first energy source provides the average value of the profile of the requested power. Thus, P i n   2 , the input power of the second stage, will have a zero-average value on H s . These null values over an operating period guarantee the non-divergence of their states of charge. However, for this first demonstration, it is considered that the future power inbalance between renewable sources and power consumption is perfectly predicted. It is obvious that in reality, this power can have deviations from those that will actually be measured. These deviations are called forecasting errors, classically defined as follows:
Δ P =   Δ ^ P ε
In order to show the effectiveness of the algorithm in dealing with these forecasting errors, it is assumed that our future predictions of P P V and P L o a d are affected by errors compared to the powers that will actually be measured. Considering Equation (2), the calculation of the new reference powers gives the following results:
P o u t   1 ( t n ) = 1 H 1 [ t n H 1 2 0 2 Δ P ( t ) Δ ^ P ( t ) d t + 0 t n + H 1 2 Δ ^ P ( t ) d t ]
With the formalism given by Equation (9), it is obtained:
P o u t   1 ( t n ) = 1 H 1 [ t n H 1 2 t n + H 1 2 Δ ^ P ( t )   d t 2 t n H 1 2 0 ε ( t )   d t ]
If it is assumed that the error ε has stationary properties at the CMA horizon scale and over, it results that:
2 ε H 1 2 = ε H 1
The average value for any time horizon H s , longer than H 1 , is then:
ε H 1 H s = ε H s
Finally, the average value of the output power calculated by the first stage is equal to the average value of the measured requested power:
P o u t   1 H s = Δ ^ P H s ε H s = Δ P H s
It results that all the other stages have then a null average value, as for the case without forecasting error. What may be different are the actual power variations for each stage, which can lead to an over- or under-sizing of the device. However, this dynamic forecasting error is distributed among the different stages of the hybrid system while respecting the dynamics of each of them. In summary, even in the presence of forecasting errors, since it has a certain degree of stationarity, the average value of the reference powers of the different energy stages remained zero. This is essential, since it allows potential storage devices to have no divergence of their state of charge. In accordance, their presence modifies the magnitude of the powers supplied or stored. This must be taken into account in the sizing phase. It should be noted that all the results and previous findings remain valid regardless of the number of parallel controllers in a stage. This has been verified.

2.2. Additionnal Control Loops and Supervision

The power distribution is not affected by the state of the different devices. Due to unbalance and inaccuracy in the state measurement and control, it is necessary to maintain the state of charge (SoC) of storage devices toward a reference value. Then, taking into account the dynamics of the energy storage systems, a proportional control of the SOC using CMA filters is used, as illustrated in Figure 2. The SoC can be easily obtained through charge counting or open circuit voltage methods. The reference power sent to the source is obtained by summing the output power of the filter and a part of the deviation of SOC from its setting point. The idea is classical in energy management with frequency separation and considers that the average SOC value of a stage k is ensure by the previous (and slower) stage k 1 . The equations that define this control are as follows:
S O C k + 1 ( t n ) H k = 1 H k [ t n H k 2 t n 2 S O C k + 1 ( t ) S O C ^ k + 1 ( t ) d t + t n t n + H k 2 S O C ^ k + 1 ( t ) d t ]
and the power correction is obtained with:
P c o r r ( t n ) = K c o r r ( S O C a v g   k + 1 ( t n ) S O C k + 1 * )
where H k the calculation horizon of the filter, S O C k + 1 a history of the SOC of the source whose SOC is to be regulated, S O C ^ k + 1 a prediction of the future state of charge, K c o r r is the proportional gain and S O C k + 1 * the reference of the state of charge. The proportional gain K c o r r is calculated according to the technical characteristics of the source whose SOC is to be regulated. It should be noted that in the actual system, the SOC is a measured parameter, and it is not necessary to to calculate it. However, by simulation, these states are just estimated from a charge counting method.
Thanks to the Formulation (10), the presence of the forecasting errors generates an automatic rise of the reference powers in order to compensate them. This increase may result in a reference power that is greater than the power limits of the source and therefore may lead to equipment damage or even danger. In order to remedy this problem, the output of each filter is bound by the maximum and minimum limits of the source by saturation bloc, as shown in Figure 2. On the other hand, the saturation of the filter output signal causes a change in its average value over the operating horizon. However, as explained in the previous section, the hypothesis given by Equation (6) is fundamental in achieving the results and findings that came after. Indeed, it can be assumed that the average power over the operating horizon of the filter output is the actual one. Any inequality between these two averages leads to a divergence of the SOCs of the energy storage systems and consequently the instability of the system.
In order to remedy this problem, a block is added just at the saturation output, which detects the saturations if they exist, accumulates the suppressed powers and adds them, if the accumulated power is positive, or subtracts them, if the accumulated power is negative, of the reference power of the source as soon as possible. In this way, the total energy supplied on the operating horizon remains unchanged, even in the presence of saturation, and consequently, the average value on this same horizon always remains equal to that of the measured input of the filter.
Finally, the moving average filter can cause a power profile on a source involving the exceeding of energy limits. To solve this problem, an energy supervision loop has been added. At each time step, and before sending the command to the source, a saturation is applied on the power, to avoid energy overruns.

2.3. Optimization Process

In this study, the considered application which illustrates this energy management strategy is a habitat, with photovoltaic panels already installed and whose owners want to be disconnected from the grid to switch to self-consumption. Thus, the sizes of the renewable source and load profiles are input parameters that are initially imposed. At this stage, by knowing the size of the renewable source and the geographical position of the studied habitat, a profile of the power that will be produced by this source over a year is estimated. Additionally, considering technical and sociological criteria (size of the habitat, number of people living there, loads, etc.), a profile of the power that will be consumed over a year is estimated.
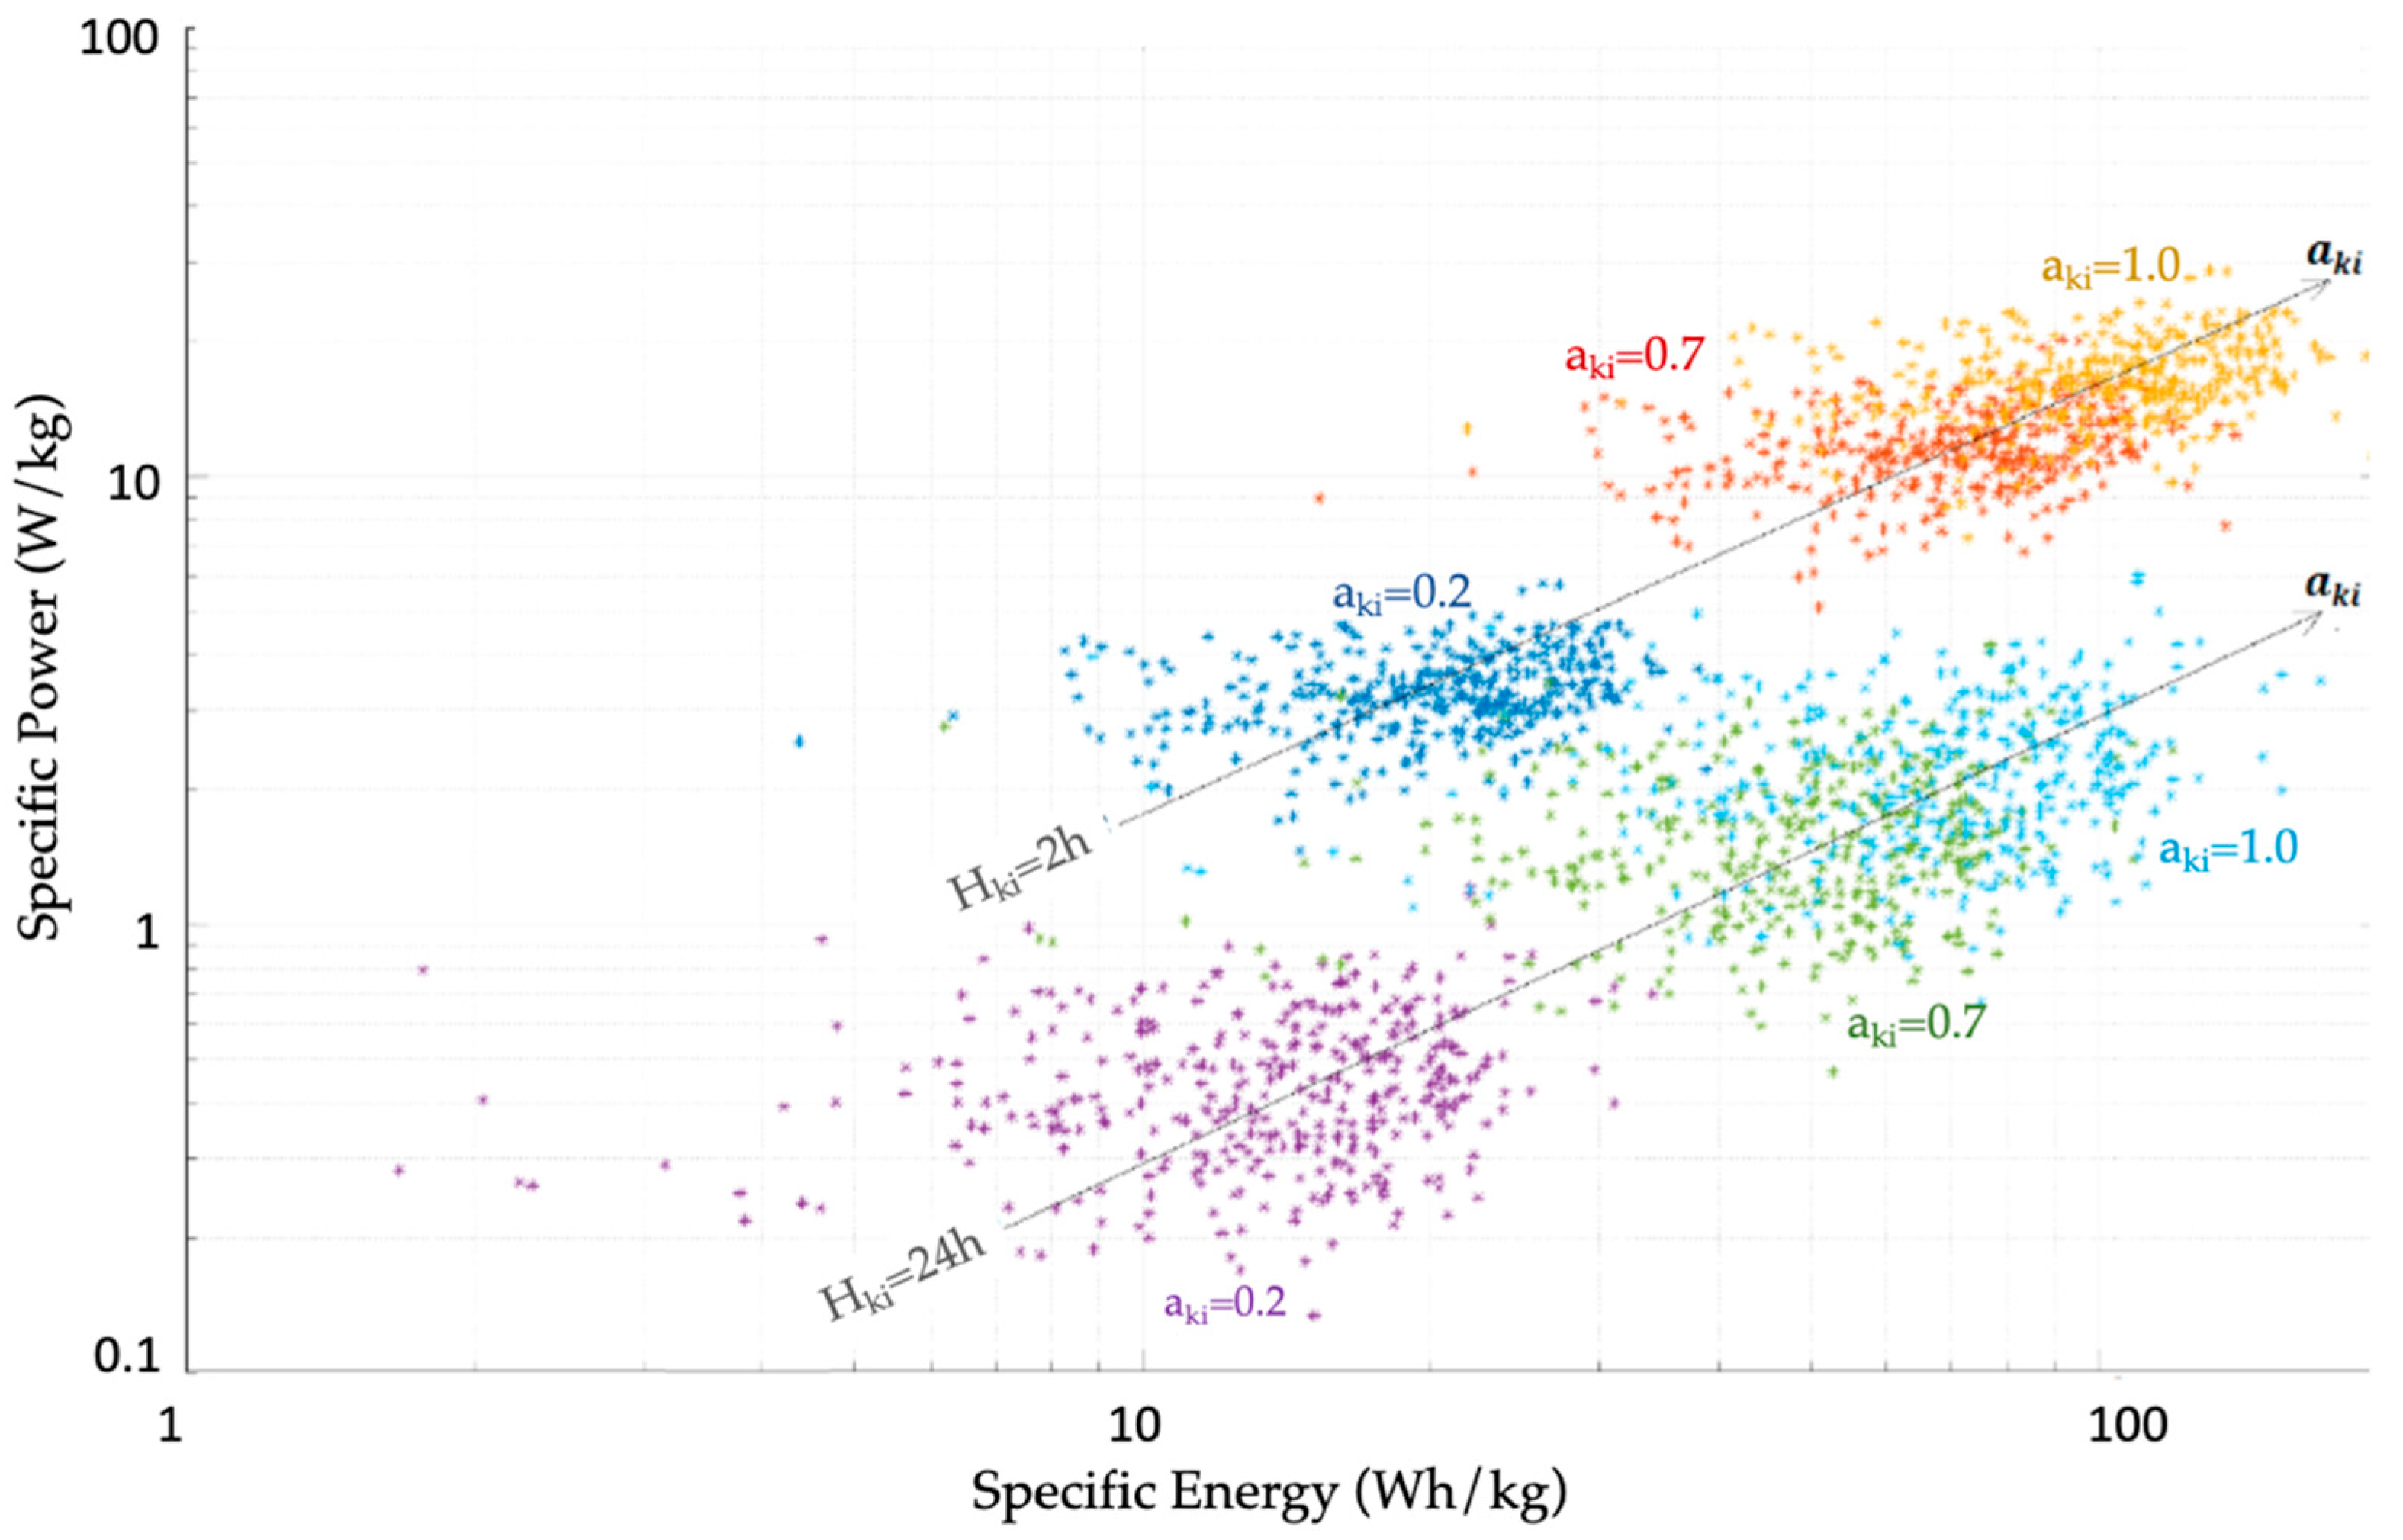
From the PV production and load consumption estimations, an estimated unbalance power profile   Δ ^ P is created. The actual profile Δ P is then built as and when. Based on the dynamics and magnitude of the profile   Δ ^ P , architecture of a multisource system should be defined. This definition consists of specifying the types of sources or energy storage systems, there number and the parameters of the energy management (i.e., the power profile distribution according to the dynamics of each device). This joint sizing energy management optimization is made possible thanks to the very simple form of energy management based on CMA filters. There are only two additional optimization variables per device. Then, based on a predicted load and solar profile unbalance   Δ ^ P and using an optimization algorithm, all the pairs ( a k i ; H k i ) associated with the different CMA controllers of the series-parallel structure (see Figure 1) are optimized at the same time as the sizing. To help to understand the role of these filter parameters, Figure 4 illustrates their effects on a Ragone diagram. It is done for a given power profile and for different values of weight coefficient ( a k i ) and time horizon ( H k i ). This figure shows that if the horizon H k i becomes larger, the energy of the profile increases and its maximum power decreases. In other words, the reference power of slow dynamics sources (also known as energy sources) must use controllers with CMA filters operating with wide horizons. As for a k i , it allows one to adjust the power and energy demand to the size of the device. Indeed, the higher the coefficient, the larger the source size. It can be seen as a parameter that reflects the size of the source, unlike H k i , which rather reflects its dynamic.
Here, the objective function is the total cost of the power system. It combines the total investment, operation, replacement (which depends on the lifetime of the components and therefore their power profiles) and maintenance costs:
C ^ T o t = C ^ i n i t + C ^ o p + C ^ r e p + C ^ m a i n
Each cost of Equation (17) depends on many assumptions and on the techno-economic hypothesis. For instance, the replacement cost of a device depends on its health degradation rate, which needs a lifetime function, linked to the operation modes of the device (number of full-charge and discharge cycles for a battery, total supplied energy for the fuel cell, etc.). A full description of these costs and the degradation functions for each device are presented in Section 3.
As explained, a time horizon value depends on the capabilities of the connected device. For the first stage controllers ( 1 i ), in order to obtain a smooth profile, the horizons H 1 i * must be large enough. It is chosen to be around at least a few days. The horizons H 3 i * are in the order of minutes. This last horizon is chosen to ensure a balance between the characteristics of the connected device and the residual power profile which must be adapted to sources with low specific energy. Then, the following constraints could be defined:
1   day   H 1 i * 15   days 1   h   H 2 i * 1   day 5   min   H 3 i * 1   h 0   a k i * 1 i = 1 N a k i * = 1 ,     k
The optimization algorithm tries to find the right combination of pairs ( a k i ; H k i ), which, at the same time, respects the previous constraints and optimizes the predefined objective function. The optimization steps are described below. For each pair ( a k i ; H k i ) of a tested combination, the following steps are performed:
  • Calculation of the corresponding power profile according to Equation (2).
  • Calculation of the maximum energy and the maximum power of this profile.
  • Based on the results of the step b and on a database containing specific powers and specific energies of the various technologies whose source k i can be built with a power sizing and an energy sizing of this source, these are calculated for each technology. These dimensions represent the minimum sizes to be respected for the source k i to be able to supply/store the energy and power calculated in b. For each technology, the largest dimensioning (between that in power and that in energy) is considered.
  • Based on a database containing approximate lifetimes (in hours, in complete cycles, etc.) of the different technologies whose source can be built with, and on the power profile calculated in step a, an approximate lifetime of the source is calculated for each possible technology.
  • Based on the results of step c and on a database containing the provided Wh price for the different technologies whose source k i can be built with an initial investment cost of the source is calculated for the different possible technologies.
  • Using the lifetimes calculated in step d, a replacement cost is assigned to each technology.
  • A maintenance cost is associated with each technology.
  • Based on lifetimes calculated in d and costs e, f and g, the total cost (investment + replacement + maintenance) over the lifetime of the multisource system, of each technology that the source k i can be built with, is calculated. The power system lifetime is assumed to be equal to the lifetime of the renewable source.
  • The technology that corresponds to the lower cost is chosen as the optimal technology of the source k i . We go back to step c to know the minimum dimension that must be considered for this technology.
These steps are done for all couples at each iteration. In the end, the algorithm gives an optimal solution for each device, through the optimal couple ( a k i ; H k i ) which corresponds to an optimal power profile calculated by Equation (2).

3. Application on a Hybrid Power System

3.1. Hybrid Power System Description

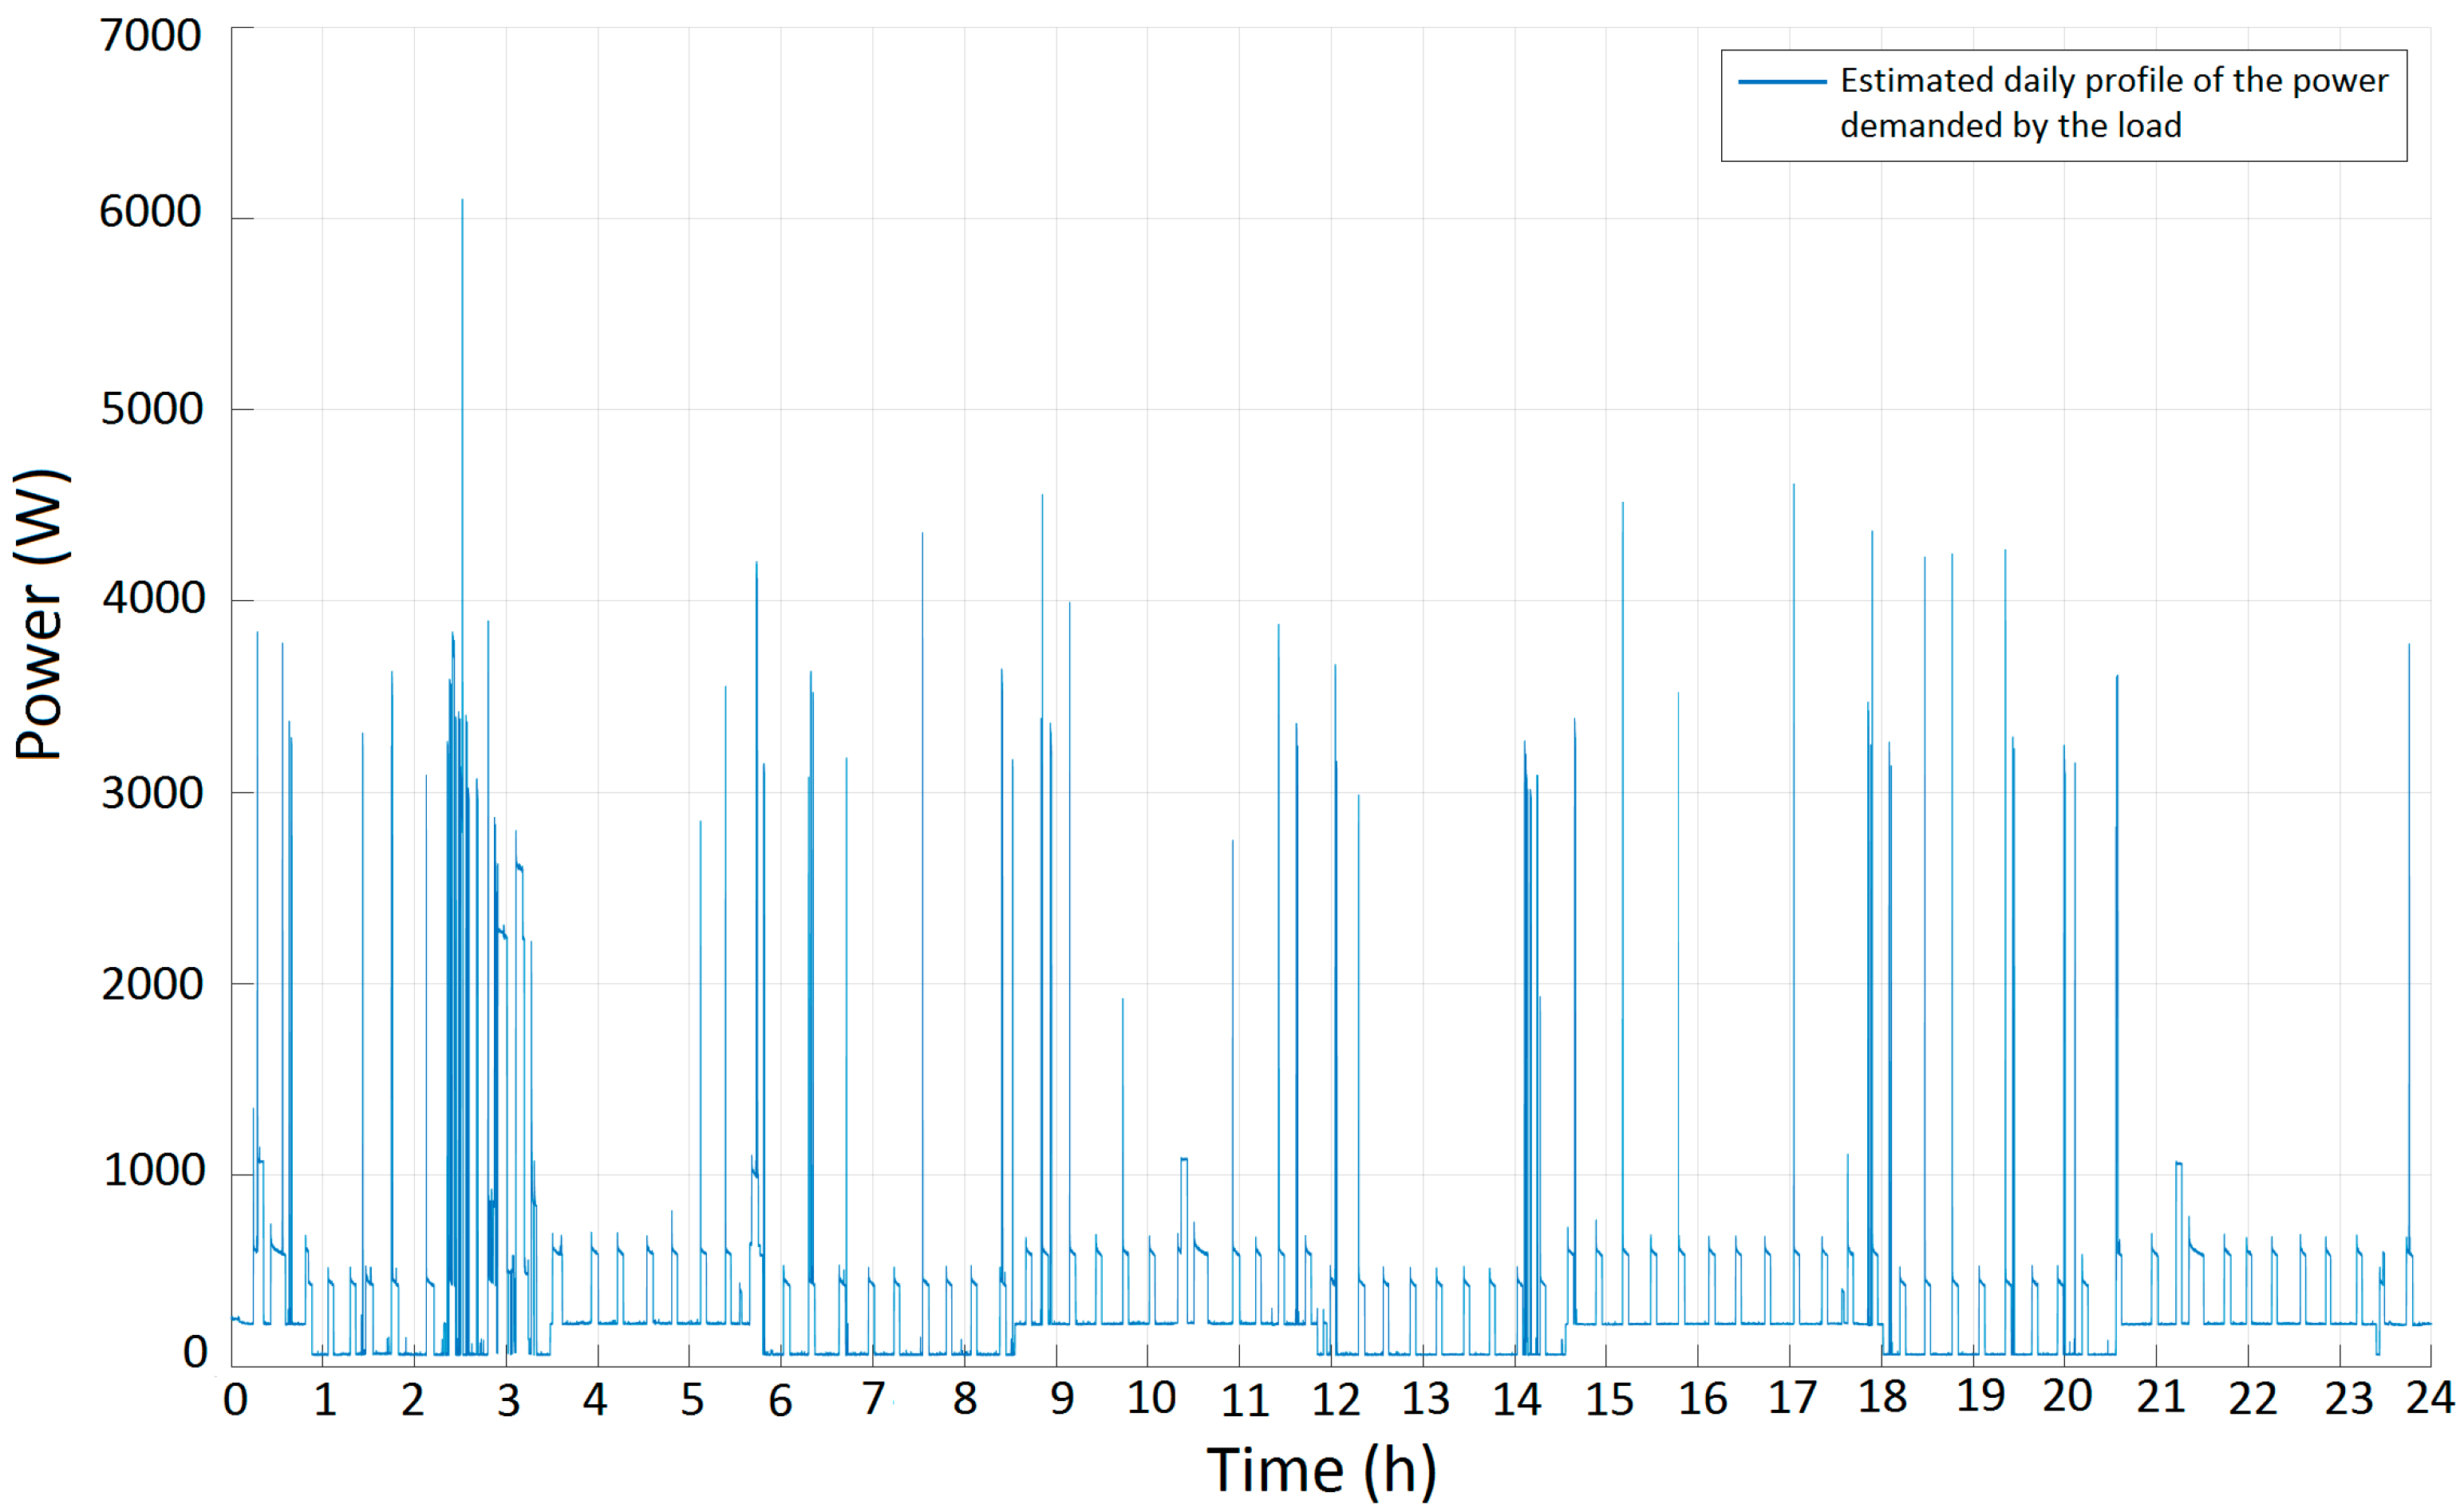
The REDD (Reference Energy Disaggregation Data Set) provides a database containing measurements of the total power consumed by six different houses [44]. The data is recorded at a sample time of 1 second. It is the power profile of the House 1, that is used in this study. The load profile includes the consumption of lighting, an oven, a refrigerator, a microwave, a stove, a dishwasher, a washer dryer and kitchen outlets. Figure 5 shows the daily pace of this profile. We consider this profile as the forecast of the total consumption of the house over the coming year, P ^ L o a d .
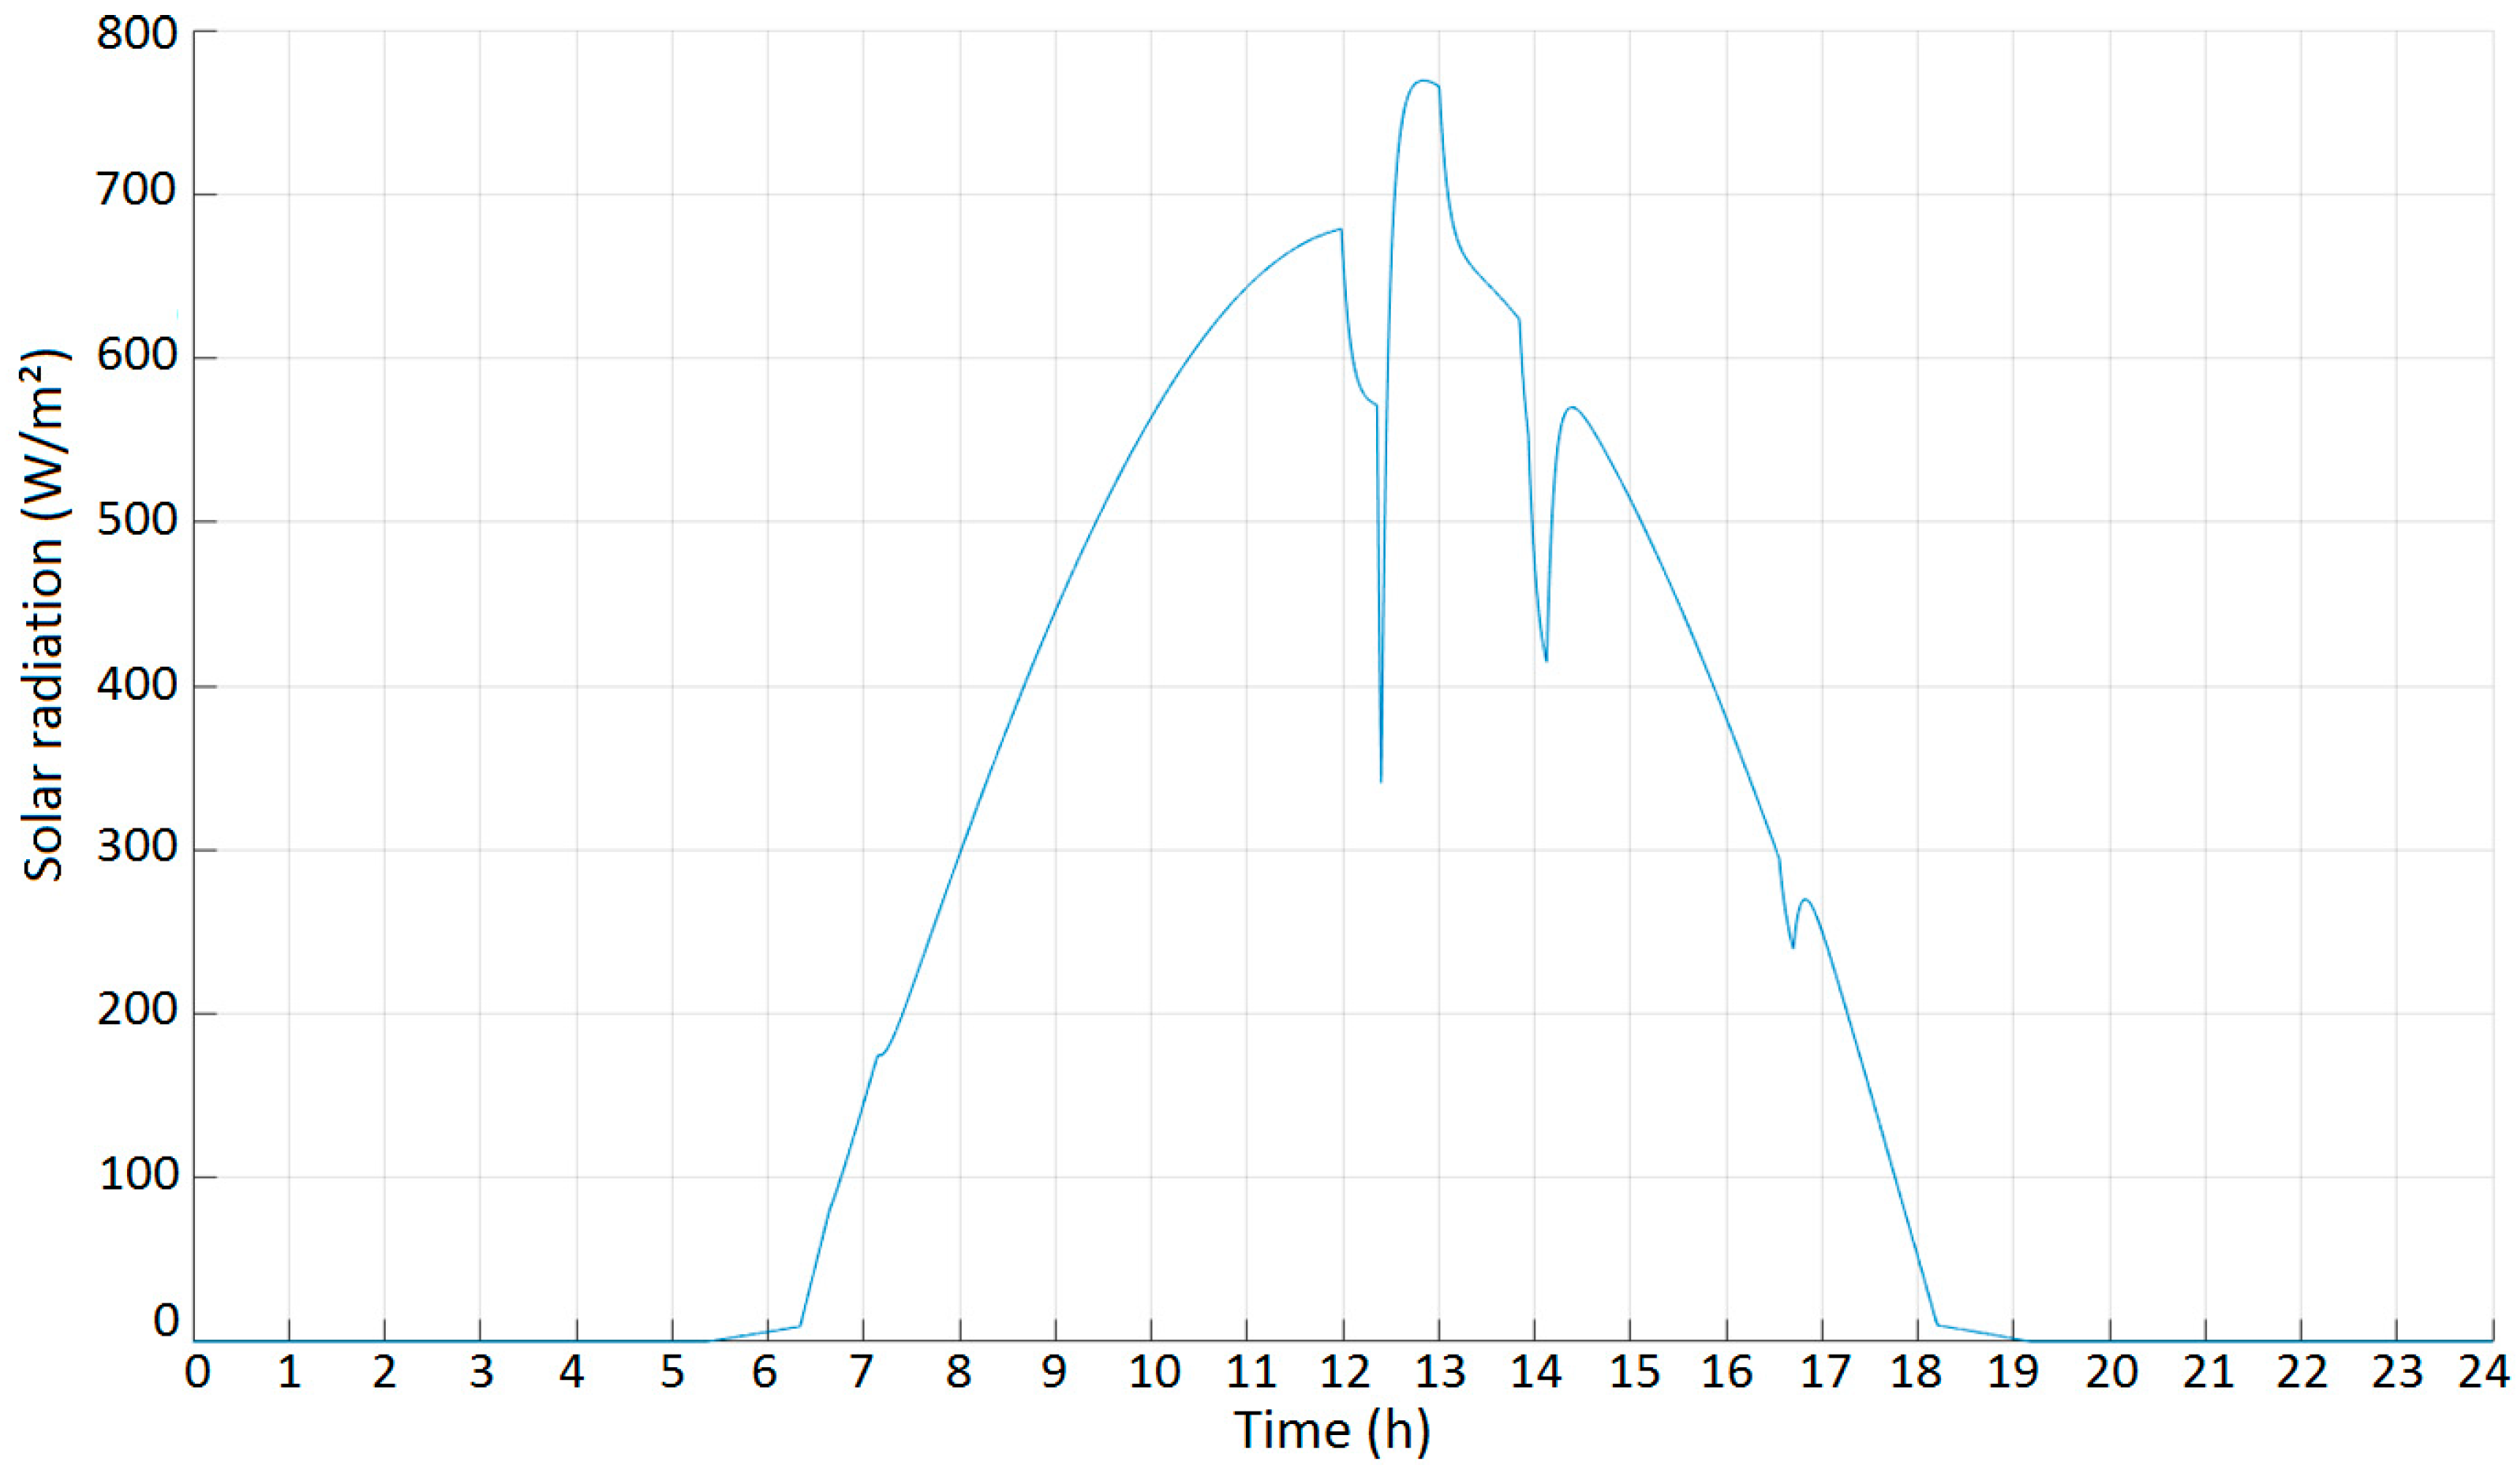
We also assume that this house is located in Saint-Nazaire, France, and equipped with 5 m2 of solar panels. As for the estimated photovoltaic power profile, an estimated solar radiation profile G ^ is generated by a solar profile generator [41]. This generator uses a Markov matrix to simulate the cloud cover. Then, from the inclination angle of the PV panels, the geographical coordinates of the studied habitat (longitude and latitude) and a sample step, a solar radiation profile can be generated. Figure 6 shows a daily pace of the profile G ^ . Table 1 summarizes the inputs used for the profile used in this study.
The photovoltaic panels available to the consumer are supposedly made of polycrystalline silicon. The efficiency of this material is estimated at 10% and assumed to be constant throughout the operating period. The power produced by the panels is proportional to the solar radiation and is calculated according to Equation (18):
P ^ P V = S P V   η P V   G ^
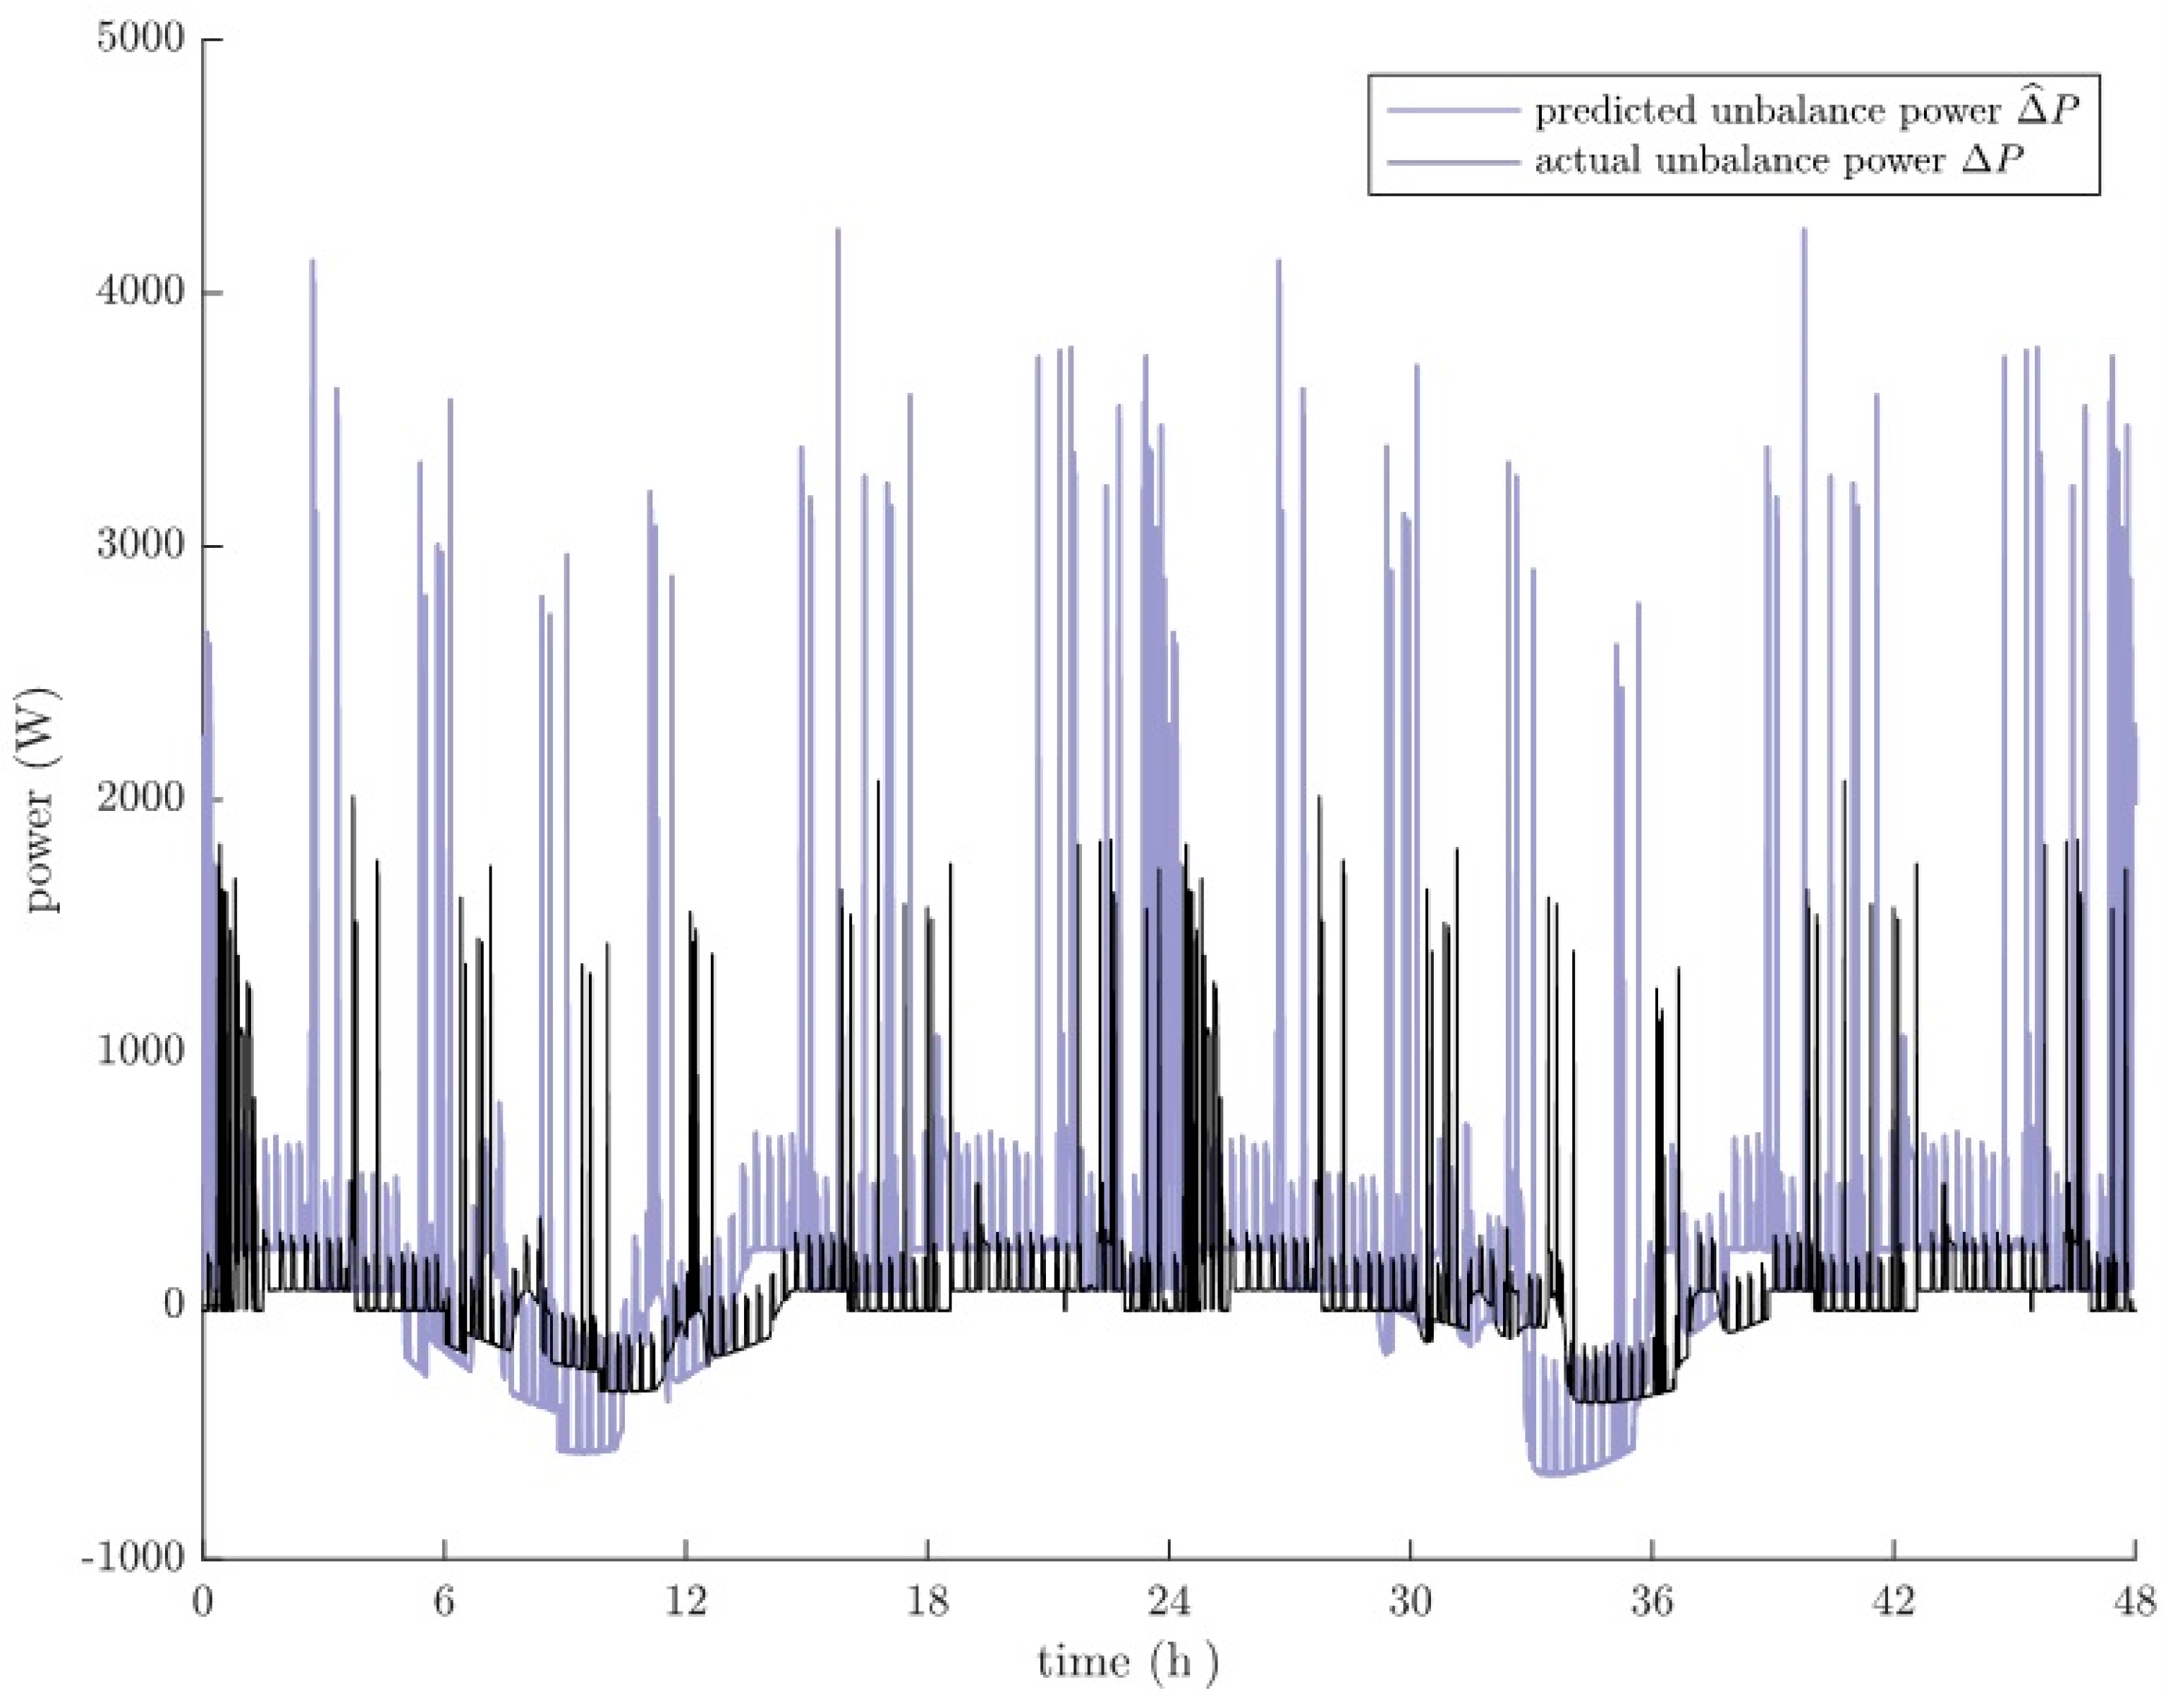
with S P V the surface of the photovoltaic panels, η P V their efficiency. From the two previous profiles, an estimated profile   Δ ^ P is created. It represents the unbalance power that the multisource system is expected to store and/or provide in the coming year. Figure 7 shows one day of this power profile. On the other hand, differences will most likely be found between the actual profile Δ P that will be measured over the coming year and the predicted profile   Δ ^ P . These differences will represent the forecasting errors. These errors come from a bad prediction of either the load demand or the production of solar panels. As shown in the same figure, a profile Δ P is defined, which is supposed to be the unbalanced power that will be actually measured over the coming year. In this work, the estimates of the unbalance power Δ P are assumed to be 20% lower than the actual profile.
Now, based on the estimated profile   Δ ^ P , the architecture of a multisource system must be defined. Indeed, the power profile   Δ ^ P has power peaks of short durations (at the scale of the second) as between 2:00 a.m. and 3:00 a.m. in Figure 7. To meet these sudden and fast demands, we need a fast dynamic power source. We choose supercapacitors (SC), which is a fast device, with high efficiency in short time energy transfers [45]. According to Section 2.1, the average of the measured input profile Δ P will be provided by one (or more) source(s) controlled by the first stage controllers. In other words, it must have a slow dynamic. If the forecasts coincide perfectly with the profile Δ P that will be actually measured, this source will supply the annual average power of   Δ ^ P (equal to 137 W in this case). Given that the value of the power is not very high, a fuel cell (FC) is chosen as an auxiliary source. This choice involves, for the unbalanced power ∆P, a positive average value, to be compatible with the behavior of a fuel cell (the power cannot be negative). Indeed, if the annual average of   Δ ^ P is negative, it is necessary to consider another solution, such as the addition of an electrolyzer.
For the second and third stage controllers, while the average power is supplied by the first stage (a fuel cell in this application), the average power of the other stages is null and then the corresponding devices can be storage solutions. Here, it is considered to use two different dynamic batteries, one for stage 2 (the slowest) and one for stage 3 (the fastest). Figure 8 shows the architecture of this energy management. In each stage, there is only one controller, so that:
a 11 * = a 21 * = a 31 * = a 41 * = 1
Finally, particular swarm optimization algorithm (PSO) is used to determine the optimum energy distribution through the determination of the optimal values of horizons H 11 , H 21 and H 31 and to obtain the optimal size and technology of each source. The objective function considered in this study is presented in the following section.

3.2. Obective of Optimization

The optimal values of the calculation horizons H 11 , H 21 and H 31 of the filters of controllers 11, 21 and 31, respectively, must correspond to:
An optimal distribution of energy between the fuel cell, the two batteries and the supercapacitors. The optimal reference power should respect the dynamics, the power and the energy limits of each source.
An optimal size and an optimal technology of each source.
A minimum power system cost.
Here, the optimization is based on the total cost of the power system. It includes the capital, operation, replacement and maintenance costs. As the lifetime of the different devices is not the same, the annualized cost is considered in this work. To estimate the lifetime of the fuel cell, a degradation function Δ FC is considered. It only depends on the supplied energy over a simulation horizon H S [12]:
Δ FC ( t ) = 0 H s ( t ) d t
where
( t ) = 0 3600 [ 1 + α P F C   n o m 2 ( P F C * ( t ) P F C   n o m ) ² ]
with 0 and α two empirical coefficients and P F C   n o m (in W) the nominal power of the fuel cell (80% of P F C   m a x ). The lifetime is then calculated as follows:
L T F C = H s Δ F C ( H s )   [ in   years ] .  
The consumption of hydrogen is linked to the efficiency and to the power supplied by the fuel cell. The volume V H 2 _ a n n ( m 3 ) of the annualized hydrogen consumption is calculated as follows [13]:
V H 2 _ a n n = H S P F C * H s E H 2 η F C
with P F C * H s the average value of the power supplied by the fuel cell along the horizon H S [kWh], η F C the FC efficiency and E H 2 is the energy supplied by a volume of hydrogen [kWh/m3].
For electrochemical batteries, the health degradation over the time is noted Δ Bat . It depends on the energy exchanged by the battery. The simplest function is a parabolic relationship between the health degradation and the depth of charge and discharge [23,40,41]. In this case, the health degradation is proportional to the exchanged energy. With this assumption, Δ Bat is given by [9]:
Δ Bat ( t ) = 1 / E T o t 0 H s | P E x c h a n g e d ( t ) | d t
With P E x c h a n g e d the power supplied by the battery during the simulation horizon H s and E T o t the maximum energy exchange of the battery. This energy is deduced from the energy capability and the maximum number of cycles. The end of life is finally obtained when the degradation function Δ Bat reaches unity. The estimated lifetime of the battery can then be calculated:
L T B a t = H s Δ Bat ( H s )   [ in   years ]
To finish, the degradation function of the supercapacitor bank is noted Δ SC . This function depends on the state of charge of the supercapacitors (SoCsc) [14,15]:
Δ SC ( t ) = 0 H s ( t ) d t
where
( t ) = µ S C   2 12 , 5 ( S o C s c ( t ) 1 )
Additionally, with µ S C nominal aging of SC per year [ % / s ] (1.5%/year in this study). Thus, the estimated lifetime is deduced as follows:
L T S C = H s Δ SC ( H s ) [ years ]
The renewable sources, such as wind turbine or photovoltaic panels, generally have the longest lifetime among the other devices. For photovoltaic panels, the expected lifetime is 25 years. It is this duration which is considered for the multi-sources power system.
The previous health degradation function permits one to estimate the lifetime of each device [9]. Then, the annualized costs can be calculated from equations summed up in Table 2. The PV panels need additional installation and acquisition costs. These costs are 40% of the acquisition cost [41,46]. Finally, the system cost is given by (22):
C ^ t o t   s y s a n n = C ^ t o t   P V a n n + C ^ t o t   F C a n n + C ^ t o t   B a t   1 a n n + C ^ t o t   B a t   2 a n n + C ^ t o t   S C a n n
In addition to the time horizon range for the optimization of the energy management and sizing, the storage devices must respect the following constraints:
20 % SOC Bat   1 80 % 5 % SOC Bat   2 95 % 5 % SOC SC 95 %
with
S O C B a t ( t ) = 1 E B a t P B a t * d t S o C S C ( t ) = 1 E S C   m a x   P s c * d t
where E B a t and E S C represent the storage energy of the battery and the supercapacitors, respectively. Supercapacitors can theoretically support large charges and discharge limits. Here, the discharge threshold is imposed to 5%, to not generate a too high current of the supercapacitor.

3.3. Optimisation Results

Based on the estimated profiles P ^ L o a d and P ^ p v mentioned in the previous section, the optimization results are given in Table 3. Firstly, it is assumed that the real-time measurements made during the coming year, of the photovoltaic power as well as that demanded by the load, will coincide perfectly with what has been predicted (without forecasting errors). The obtained sizing is in accordance with the assumptions done on the expected horizon values for the different devices. For the fuel cell, the filtering horizon is of the order of several days, to obtain a very smooth power profile, which permits the fuel cell to not have to supply high power spikes and to have then a smaller and cheaper sizing. For the batteries, the main one (battery 1, with lead-acid technology) ensures the range of dynamics of the order of the day, while the second (battery 2, with LiFePO4 technology) is used to fill the gap between the battery 1 and the residual power supplied by the supercapacitors. It is not easy to compare these sizing and dynamic results because the use of 4 different sources in the same system. Nevertheless, in [47,48], similar dynamics are obtained for the storage devices (battery and supercapacitors), as for the power-energy ratio of these devices. In [47], an equivalent system is used, but with only the first battery and the supercapacitors. The time horizon to share the power profile between the battery and the supercapacitors is a few minutes, which leads to an equivalent sizing result than in this work. Figure 9 shows daily patterns of the supplied/stored power of the different energy sources. Firstly, it shows the evolution of the power supplied by the fuel cell over one year. Each point of this profile is the result of the sum of about 5 days of Δ P in the past and 5 days points of the   Δ ^ P , to respect the optimal horizon H 11 * , which is equal to 10 days. Thanks to the large horizon H 11 * , this profile is characterized by a very slow dynamic and a total absence of sudden changes or power peaks. The maximum power of this profile is lower than 200 W, which goes with the sizing mentioned in Table 3. The second and third plots represent, respectively, the evolutions of the reference powers of the second and third stages, which control, respectively, the lead acid and LiFePO4. It is obvious that the dynamic of the power profile for theLiFePO4is higher than those for lead-acid battery. This difference in dynamics is explained by the difference of technologies, result of the optimization. The last plot of Figure 9 illustrates the daily evolution of the residual power, ensured by the supercapacitors. A zoom is made on an hour. Power peaks characterize this profile over short periods.
Figure 10 shows the annual evolution of the state of charge of the various storage elements. It can be seen that the SoC of lead acid and Li-ion batteries respect the maximum and minimum constraints (22) and (23). On the other hand, the annual evolution of the SOC of the supercapacitor bank, where forecasting errors (FE) are considered, shows over charges. It is due to forecasting errors that lead to a larger power profile for this device. Concerning the influence of forecasting errors, it can be seen that the algorithm automatically modifies the reference powers to compensate it. Indeed, when the predictions are different than the reality, the controllers increased or decreased the power profile until reaching the balance with the actual ΔP power. This process is carried out on all four devices, while always respecting the dynamics of the energy sources.
Nevertheless, the sizing mentioned in Table 3 may no longer be sufficient if the forecasting errors are too large. For this reason, the optimized sizing represents a no margin result. To improve the reliability of the system, oversizing can be considered. In this case, the total costs of the energy sources will increase and therefore the cost of the provided energy. This leads us to say that to have the costs shown in Table 2, it is necessary to optimize our predictions: the better we predict, the closer we are to the minimum cost.
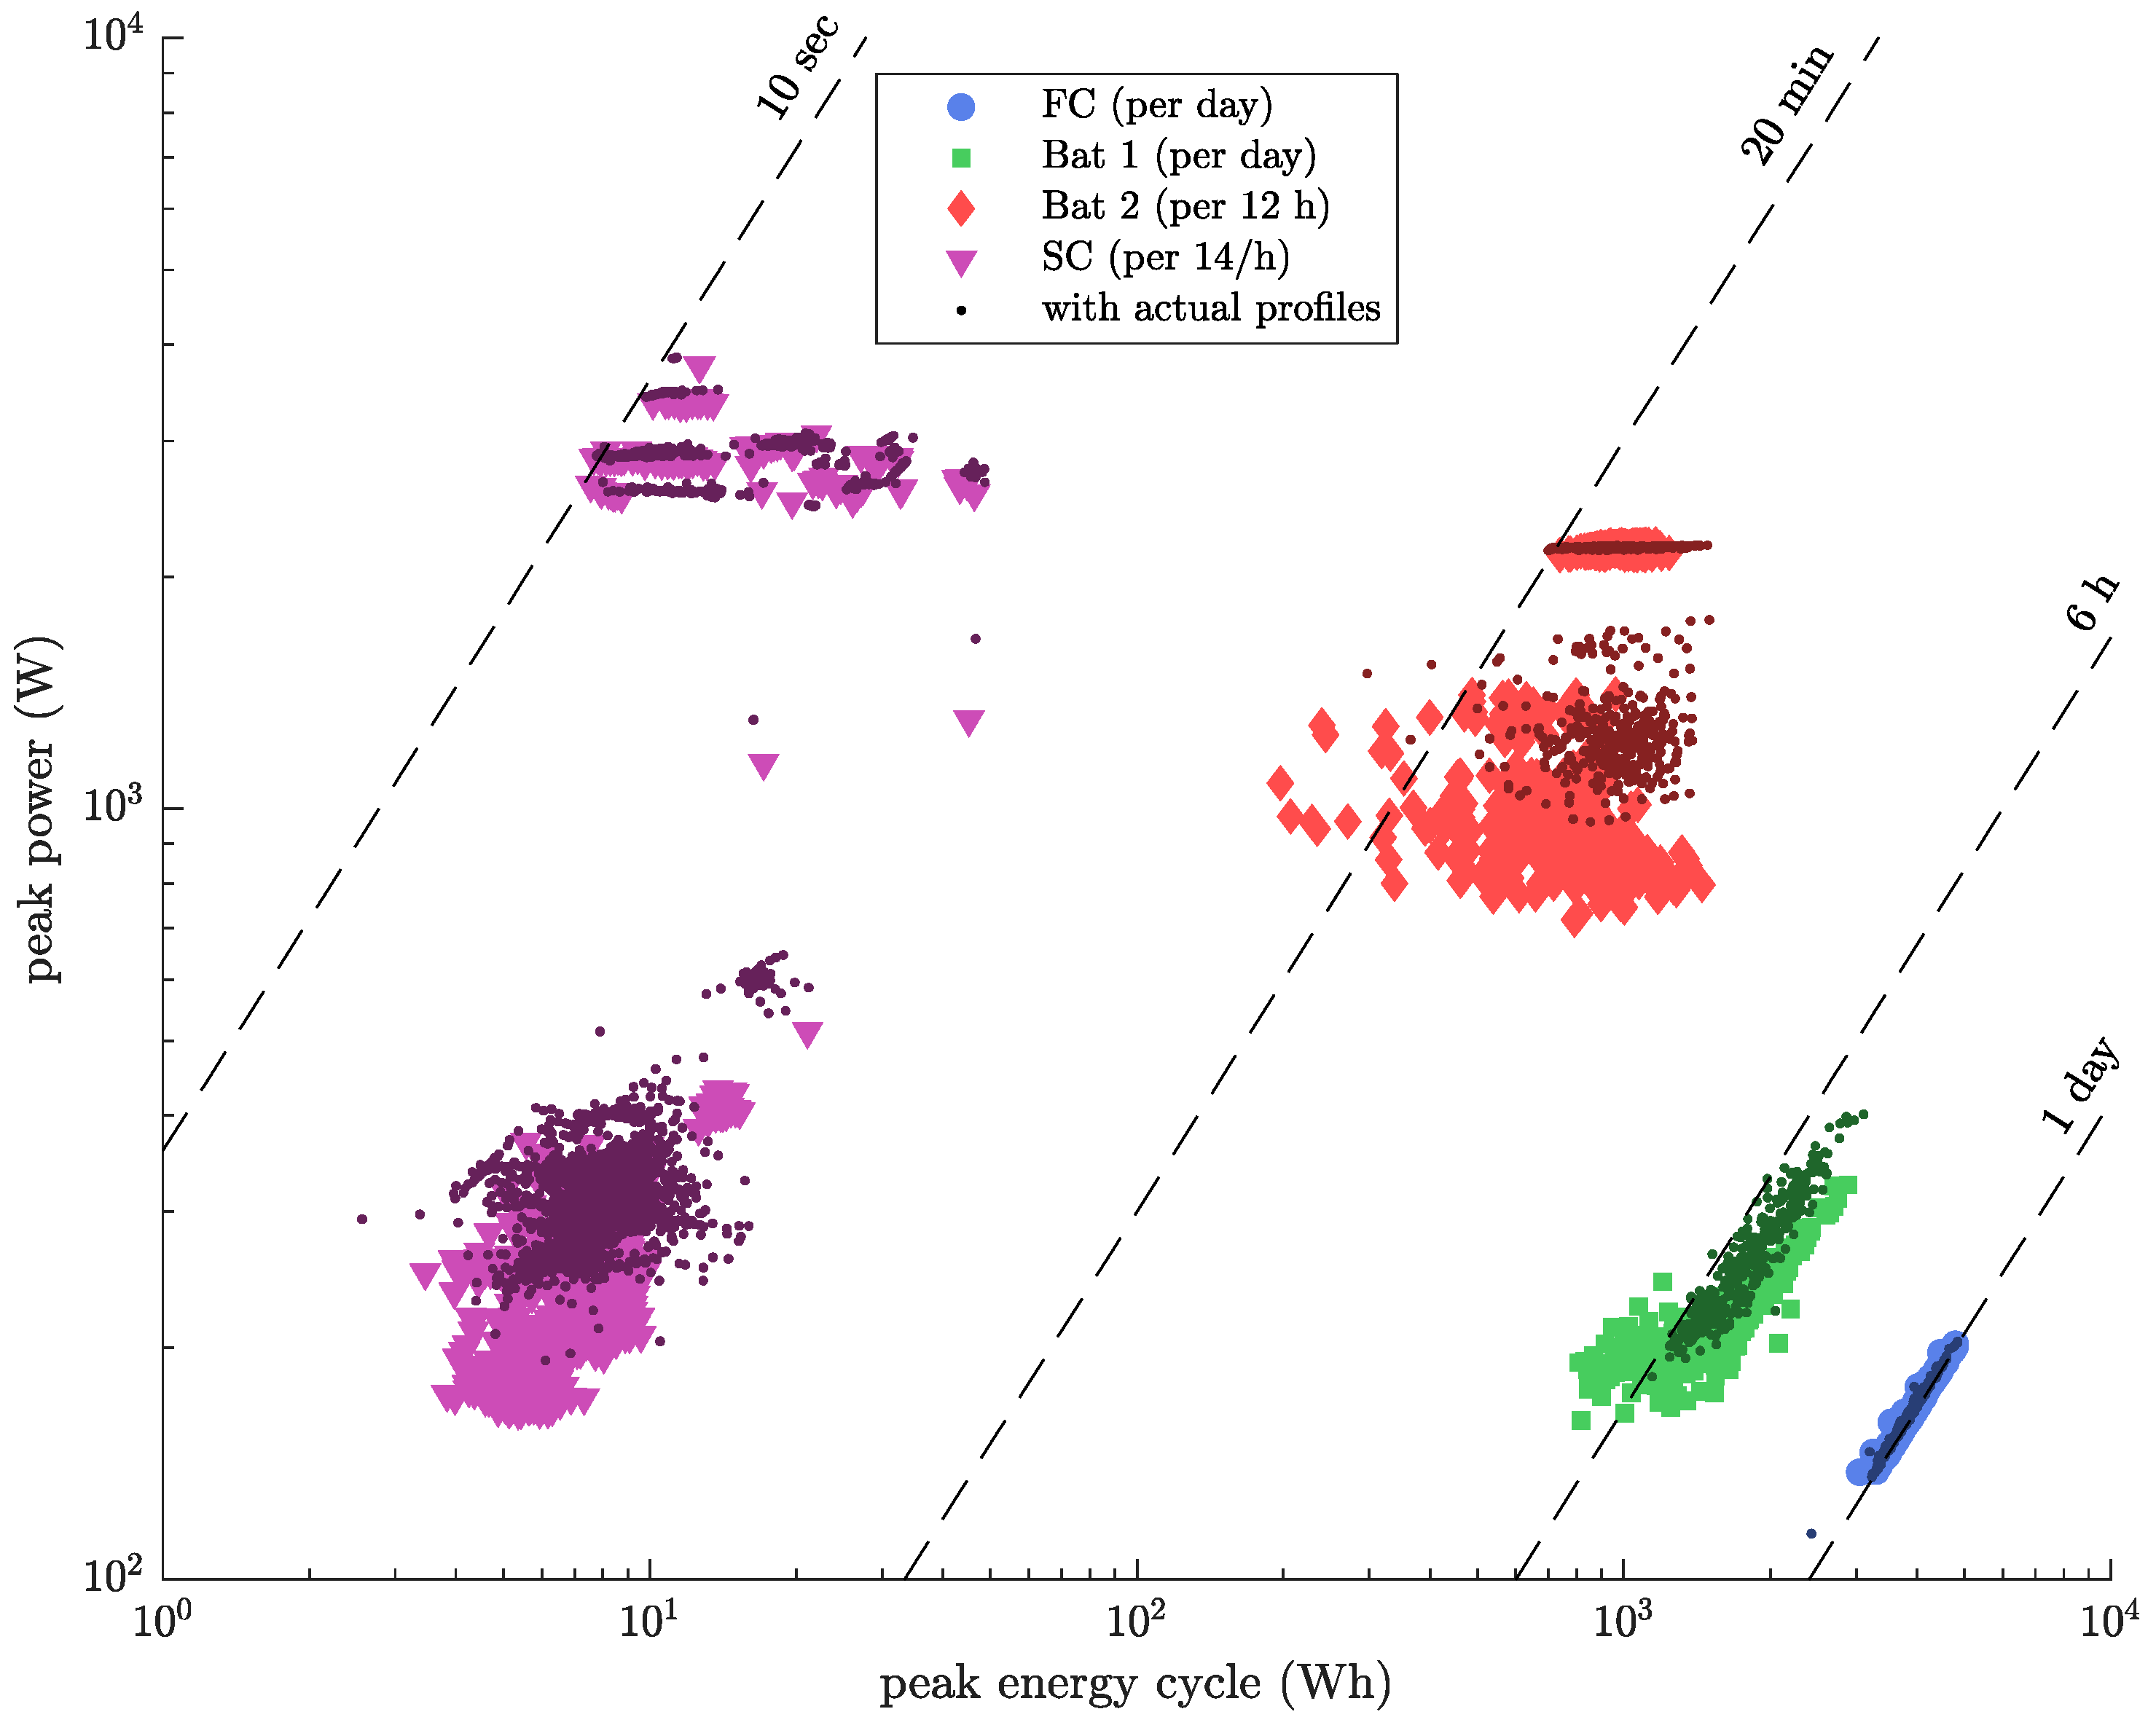
Figure 11 shows a representation on the Ragone diagram of the different power profiles, with and without Forecasting errors. It shows that a relatively high-power with a low energy characterizes the reference profile dedicated to supercapacitors. Conversely, the profile provided by the fuel cell has a relatively low power, while its energy is high. Both batteries are in the middle. The power profile of the LiFePO4 battery is of higher power and energy than the lead acid battery profile.
To easily analyze these results of this energy management, iso-time lines are added on the figure. It permits one to demonstrate that, even in presence of forecasting errors, the specific energy-power ratio is always respected. It is then clear that the CMA filters approach makes it possible to achieve efficient separation in the dynamics, with good compliance with the specific characteristics of each device.

4. Conclusions

In this paper, an algorithm for the energy management and sizing of multisource systems was presented. Its particularity is in its generic aspect that allows it to manage energy in multisource systems composed of a large number of sources of different natures and technologies, without resorting to complex resolutions. Its architecture is a series-parallel arrangement of CMA filters. Based on the prediction of the load profile and the renewable power, the output of each filter represents the reference power of a specific energy source. The dynamics as well as the order of magnitude of this power depend, respectively on the calculation horizon of the filter and its weighting coefficient. A mathematical approach has shown an ability of the algorithm to automatically compensate for prediction errors. In addition to energy management, optimal sizing and technology choice are made for each source of the multisource system. To do this, the algorithm uses a database containing technical-economic characteristics of the most widely used technologies of sources and energy storage systems on the market. An application was made on a multisource system feeding an isolated habitat. This system consists of a fuel cell and three storage systems. An optimization was launched to know the optimal distribution of energy as well as the nature and the optimal technology of the devices. The results obtained showed the effectiveness of the proposed algorithm to respect the different power and energy constraints of the sources and to behave in the face of forecast errors.

Author Contributions

Conceptualization, R.S., J.-C.O., M.M. and E.C.; methodology, R.S.; software, R.S. and J.-C.O.; validation, R.S.; formal analysis, R.S.; investigation, R.S.; resources, J.-C.O. and M.M.; data curation, J.-C.O. and R.S.; writing—original draft preparation, R.S.; writing—review and editing, J.-C.O.; visualization, J.-C.O.; supervision, J.-C.O., M.M.; project administration, M.M.; funding acquisition, M.M., J.-C.O. and E.C. All authors have read and agreed to the published version of the manuscript.

Funding

This research was funded by the WISE program, Pays de la Loire, grant number 2015-02376.

Institutional Review Board Statement

Not applicable.

Informed Consent Statement

Not applicable.

Data Availability Statement

Not applicable.

Conflicts of Interest

The authors declare no conflict of interest.

References

  1. Hirsch, A.; Parag, Y.; Guerrero, J. Microgrids: A review of technologies, key drivers, and outstanding issues. Renew. Sustain. Energy Rev. 2018, 90, 402–411. [Google Scholar] [CrossRef]
  2. Hoff, T.E.; Wenger, H.J.; Farmer, B.K. Distributed generation: An alternative to electric utility investments in system capacity. Energy Policy 1996, 24, 137–147. [Google Scholar] [CrossRef]
  3. Tawfik, T.; Badr, M.; El-Kady, E.; Abdellatif, O. Optimization and energy management of hybrid standalone energy system: A case study. Renew. Energy Focus 2018, 25, 48–56. [Google Scholar] [CrossRef]
  4. Nfah, E.M.; Ngundam, J.M. Modelling of wind/Diesel/battery hybrid power systems for far North Cameroon. Energy Convers. Manag. 2008, 49, 1295–1301. [Google Scholar] [CrossRef]
  5. Bhatti, A.R.; Salam, Z. A rule-based energy management scheme for uninterrupted electric vehicles charging at constant price using photovoltaic-grid system. Renew. Energy 2018, 125, 384–400. [Google Scholar] [CrossRef]
  6. Ismail, M.S.; Moghavvemi, M.; Mahlia, T.M.I. Design of an optimized photovoltaic and micro-turbine hybrid power system for a remote small community: Case study of Palestine. Energy Convers. Manag. 2013, 75, 271–281. [Google Scholar] [CrossRef]
  7. Barakat, M. Development of Models for Inegrating Renewables and Energy Storage Components in Smart Grid Applications. Ph.D. Thesis, Université de Caen Normandie, Caen, France, 2018. [Google Scholar]
  8. Navigant Research. Press Rel. March 2016. Available online: https://www.navigantresearch.com/news-and-views/global-microgrid-capacity-is-expected-to-grow-from-14-gw-in-2015-to-76-gw-in-2024 (accessed on 19 November 2020).
  9. Naval Facilities Engineering Command. Technology Transition Final Public Report: Smart Power Infrastructure Demonstration for Energy Reliability and Security (SPIDERS); U.S. Department of Defense, Naval Facilities Engineering Command: Washington, DC, USA, 2015. Available online: https://apps.dtic.mil/sti/pdfs/AD1074742.pdf (accessed on 15 April 2021).
  10. Khalilpour, R.; Vassallo, A. Leaving the grid: An ambition or a real choice? Energy Policy 2015, 82, 207–221. [Google Scholar] [CrossRef]
  11. Bronski, P.; Creyts, J.; Guccione, L.; Madrazo, M.; Mandel, J.; Rader, B.; Seif, D. The Economics of Grid Defection: When and Where Distributed Solar Generation Plus Storage Competes with Traditional Utility Service; Rocky Mountain Institute: Basalt, CO, USA, 2014. [Google Scholar]
  12. Rodriguez-Diaz, E.; Vasquez, J.C.; Guerrero, J.M. Intelligent DC homes in future sustainable energy systems: When efficiency and intelligence work together. IEEE Consum. Electron. Mag. 2015, 5, 74–80. [Google Scholar] [CrossRef] [Green Version]
  13. Arcos-Aviles, D.; Guinjoan, F.; Marietta, M.P.; Pascual, J.; Marroyo, L.; Sanchis, P. Energy management strategy for a grid-tied residential microgrid based on Fuzzy Logic and power forecasting. In Proceedings of the IECON 2016—42nd Annual Conference of the IEEE Industrial Electronics Society, Florence, Italy, 24–27 October 2016; pp. 4103–4108. [Google Scholar]
  14. Gao, C.; Zhao, J.; Wu, J.; Hao, X. Optimal fuzzy logic based energy management strategy of battery/supercapacitor hybrid energy storage system for electric vehicles. In Proceedings of the 12th World Congress on Intelligent Control and Automation (WCICA), Guilin, China, 12–15 June 2016. [Google Scholar]
  15. Shiwei, Y.; Shuangshuang, Z.; Shuhong, Z.; Zhenxi, L.; Lancui, L. Developing an optimal renewable electricity generation mix for China using a fuzzy multi-objective approach. Renew. Energy 2019, 139, 1086–1098. [Google Scholar]
  16. Erdinc, O.; Vural, B.; Uzunoglu, M. A wavelet-fuzzy logic based energy management strategy for a fuel cell/battery/ultra-capacitor hybrid vehicular power system. J. Power Sources 2009, 194, 369–380. [Google Scholar] [CrossRef]
  17. Hassan, T.U.; Abbassi, R.; Jerbi, H.; Mehmood, K.; Tahir, M.F.; Cheema, K.M.; Khan, I.A. A novel algorithm for MPPT of an isolated PV system using push pull converter with fuzzy logic controller. Energies 2020, 13, 4007. [Google Scholar] [CrossRef]
  18. Vural, B.; Boynuegri, A.R.; Nakir, I.; Erdinc, O.; Balikci, A.; Uzunoglu, M.; Dusmez, S. Fuel cell and ultra-capacitor hybrid-ization: A prototype test bench based analysis of different energy management strategies for vehicular applications. Int. J. Hydrogen Energy 2010, 35, 11161–11171. [Google Scholar] [CrossRef]
  19. Wang, K.; Wang, W.; Wang, L.; Li, L. An Improved SOC Control Strategy for Electric Vehicle Hybrid Energy Storage Systems. Energies 2020, 13, 5297. [Google Scholar] [CrossRef]
  20. Tayab, U.B.; Zia, A.; Yang, F.; Lu, J.; Kashif, M. Short-term load forecasting for microgrid energy management system using hybrid HHO-FNN model with best-basis stationary wavelet packet transform. Energy 2020, 203, 117857. [Google Scholar] [CrossRef]
  21. Salman, B.; Salem, S.O.; Song, H. Project-Level Sustainable Asphalt Roadway Treatment Selection Framework Featuring a Flowchart and Analytic Network Process. J. Transp. Eng. Part B Pavements 2020, 146, 04020041. [Google Scholar] [CrossRef]
  22. Moghaddam, M.J.H.; Kalam, A.; Nowdeh, S.A.; Ahmadi, A.; Babanezhad, M.; Saha, S. Optimal sizing and energy management of stand-alone hybrid photovoltaic/wind system based on hydrogen storage considering LOEE and LOLE reliability indices using flower pollination algorithm. Renew. Energy 2019, 135, 1412–1434. [Google Scholar] [CrossRef]
  23. Torreglosa, J.P.; García-Triviño, P.; Fernández-Ramirez, L.M.; Jurado, F. Control based on tech-no-economic optimization of renewable hybrid energy system for stand-alone applications. Expert Syst. Appl. 2016, 51, 59–75. [Google Scholar] [CrossRef]
  24. Ibrahim, M.; Jemei, S.; Wimmer, G.; Hissel, D. Nonlinear autoregressive neural network in an energy management strategy for battery/ultra-capacitor hybrid electrical vehicles. Electr. Power Syst. Res. 2016, 136, 262–269. [Google Scholar] [CrossRef]
  25. Ates, Y.; Erdinc, O.; Uzunoglu, M.; Vural, B. Energy management of an FC/UC hybrid vehicular power system using a combined neural network-wavelet transform based strategy. Int. J. Hydrogen Energy 2010, 35, 774–783. [Google Scholar] [CrossRef]
  26. Lee, H.; Song, C.; Kim, N.; Cha, S.W. Comparative Analysis of Energy Management Strategies for HEV: Dynamic Programming and Reinforcement Learning. IEEE Access 2020, 8, 67112–67123. [Google Scholar] [CrossRef]
  27. Torres-Moreno, J.L.; Giménez-Fernández, A.; Pérez-García, M.; Rodriguez, F. Energy Management Strategy for Micro-Grids with PV-Battery Systems and Electric Vehicles. Energies 2018, 11, 522. [Google Scholar] [CrossRef] [Green Version]
  28. Jafari, M.; Malekjamshidi, Z. Optimal energy management of a residential-based hybrid renewable energy system using rule-based real-time control and 2D dynamic programming optimization method. Renew. Energy 2020, 146, 254–266. [Google Scholar] [CrossRef]
  29. Elmouatamid, A.; Ouladsine, R.; Bakhouya, M.; El Kamoun, N.; Zine-Dine, K.; Khaidar, M. A Model Predictive Control Approach for Energy Management in Micro-Grid Systems. In Proceedings of the International Conference on Smart Energy Systems and Technologies (SEST), Porto, Portugal, 9–11 September 2019. [Google Scholar]
  30. Villalón, A.; Rivera, M.; Salgueiro, Y.; Muñoz, J.; Dragičević, T.; Blaabjerg, F. Predictive Control for Microgrid Applications: A Review Study. Energies 2020, 13, 2454. [Google Scholar] [CrossRef]
  31. Golchoubian, P.; Azad, N.L. Real-Time Nonlinear Model Predictive Control of a Battery–Supercapacitor Hybrid Energy Storage System in Electric Vehicles. IEEE Trans. Veh. Technol. 2017, 66, 9678–9688. [Google Scholar] [CrossRef]
  32. Chen, H.; Xiong, R.; Lin, C.; Shen, W. Model predictive control based real-time energy management for a hybrid energy storage system. CSEE J. Power Energy Syst. 2020. [Google Scholar] [CrossRef]
  33. Saidi, R.; Olivier, J.C.; Machmoum, M.; Chauveau, E. Energy management strategy for hybrid power systems based on mov-ing average filters and power forecasting. In Proceedings of the 2018 IEEE International Conference on Industrial Technology (ICIT), Lyon, France, 20–22 February 2018; pp. 966–971. [Google Scholar]
  34. Saidi, R.; Olivier, J.C.; Chauveau, E.; Machmoum, M. Méthode Générique de Gestion de L’énergie des Systèmes Multisources par Filtres à Moyenne Glissante; Symposium de Génie Electrique: Nancy, France, 2018. [Google Scholar]
  35. Adefarati, T.; Bansal, R. Reliability, economic and environmental analysis of a microgrid system in the presence of renewable energy resources. Appl. Energy 2019, 236, 1089–1114. [Google Scholar] [CrossRef]
  36. Trieste, S.; Hmam, S.; Olivier, J.C.; Bourguet, S.; Loron, L. Techno-economic optimization of a super-capacitor-based energy storage unit chain: Application on the first quick charge plug-in ferry. Appl. Energy 2015, 153, 3–14. [Google Scholar] [CrossRef]
  37. Yang, Y.; Bremner, S.; Menictas, C.; Kay, M. Battery energy storage system size determination in renewable energy systems: A review. Renew. Sustain. Energy Rev. 2018, 91, 109–125. [Google Scholar] [CrossRef]
  38. Chen, C.; Duan, S.; Cai, T.; Liu, B.; Hu, G. Optimal allocation and economic analysis of energy storage system in microgrids. IEEE Trans. Power Electron. 2011, 26, 2762–2773. [Google Scholar] [CrossRef]
  39. Khorramdel, H.; Aghaei, J.; Khorramdel, B.; Siano, P. Optimal Battery Sizing in Microgrids Using Probabilistic Unit Commitment. IEEE Trans. Ind. Inform. 2016, 12, 834–843. [Google Scholar] [CrossRef]
  40. Saidi, R.; Olivier, J.; Machmoum, M.; Chauveau, E. Energy management and sizing algorithm applied on a hybrid power system suppliying an isolated residential application. In Proceedings of the IECON 2018—44th Annual Conference of the IEEE Industrial Electronics Society, Washington, DC, USA, 21–23 October 2018; pp. 1783–1788. [Google Scholar]
  41. Bouabdallah, A.; Olivier, J.-C.; Bourguet, S.; Houari, A.; Machmoum, M. Robust sizing of a stand-alone multi-sources power system. In Proceedings of the 2016 IEEE International Conference on Industrial Technology (ICIT), Costa da Caparica, Portugal, 3 July 2016; pp. 448–453. [Google Scholar]
  42. Pascual, J.; Barricarte, J.; Sanchis, P.; Marroyo, L. Energy management strategy for a renewable-based residential microgrid with generation and demand forecasting. Appl. Energy 2015, 158, 12–25. [Google Scholar] [CrossRef]
  43. Arcos-Aviles, D.; Pascual, J.; Guinjoan, F.; Marroyo, L.; Sanchis, P.; Marietta, M.P. Low complexity energy management strategy for grid profile smoothing of a residential grid-connected microgrid using generation and demand forecasting. Appl. Energy 2017, 205, 69–84. [Google Scholar] [CrossRef]
  44. Kolter, J.Z.; Johnson, M.J. REDD: A Public Data Set for Energy Disaggregation Research; Workshop on Data Mining Applications in Sustainability (SIGKDD): San Diego, CA, USA, 2011; Available online: http://citeseerx.ist.psu.edu/viewdoc/download?doi=10.1.1.454.5796&rep=rep1&type=pdf (accessed on 19 November 2020).
  45. Demir, M.; Ashourirad, B.; Mugumya, J.H.; Saraswat, S.K.; El-Kaderi, H.M.; Gupta, R.B. Nitrogen and oxygen dual-doped porous carbons prepared from pea protein as electrode materials for high performance supercapacitors. Int. J. Hydrogen Energy 2018, 43, 18549–18558. [Google Scholar] [CrossRef]
  46. Ma, S.; Lin, M.; Lin, T.-E.; Lan, T.; Liao, X.; Maréchal, F.; Van Herle, J.; Yang, Y.; Dong, C.; Wang, L. Fuel cell-battery hybrid systems for mobility and off-grid applications: A review. Renew. Sustain. Energy Rev. 2021, 135, 110119. [Google Scholar] [CrossRef]
  47. Luta, D.N.; Raji, A. Optimal sizing of hybrid fuel cell-supercapacitor storage system for off-grid renewable applications. Energy 2019, 166, 530–540. [Google Scholar] [CrossRef]
  48. Wen, S.; Lan, H.; Yu, D.C.; Fu, Q.; Hong, Y.-Y.; Yu, L.; Yang, R. Optimal sizing of hybrid energy storage sub-systems in PV/diesel ship power system using frequency analysis. Energy 2017, 140, 198–208. [Google Scholar] [CrossRef]
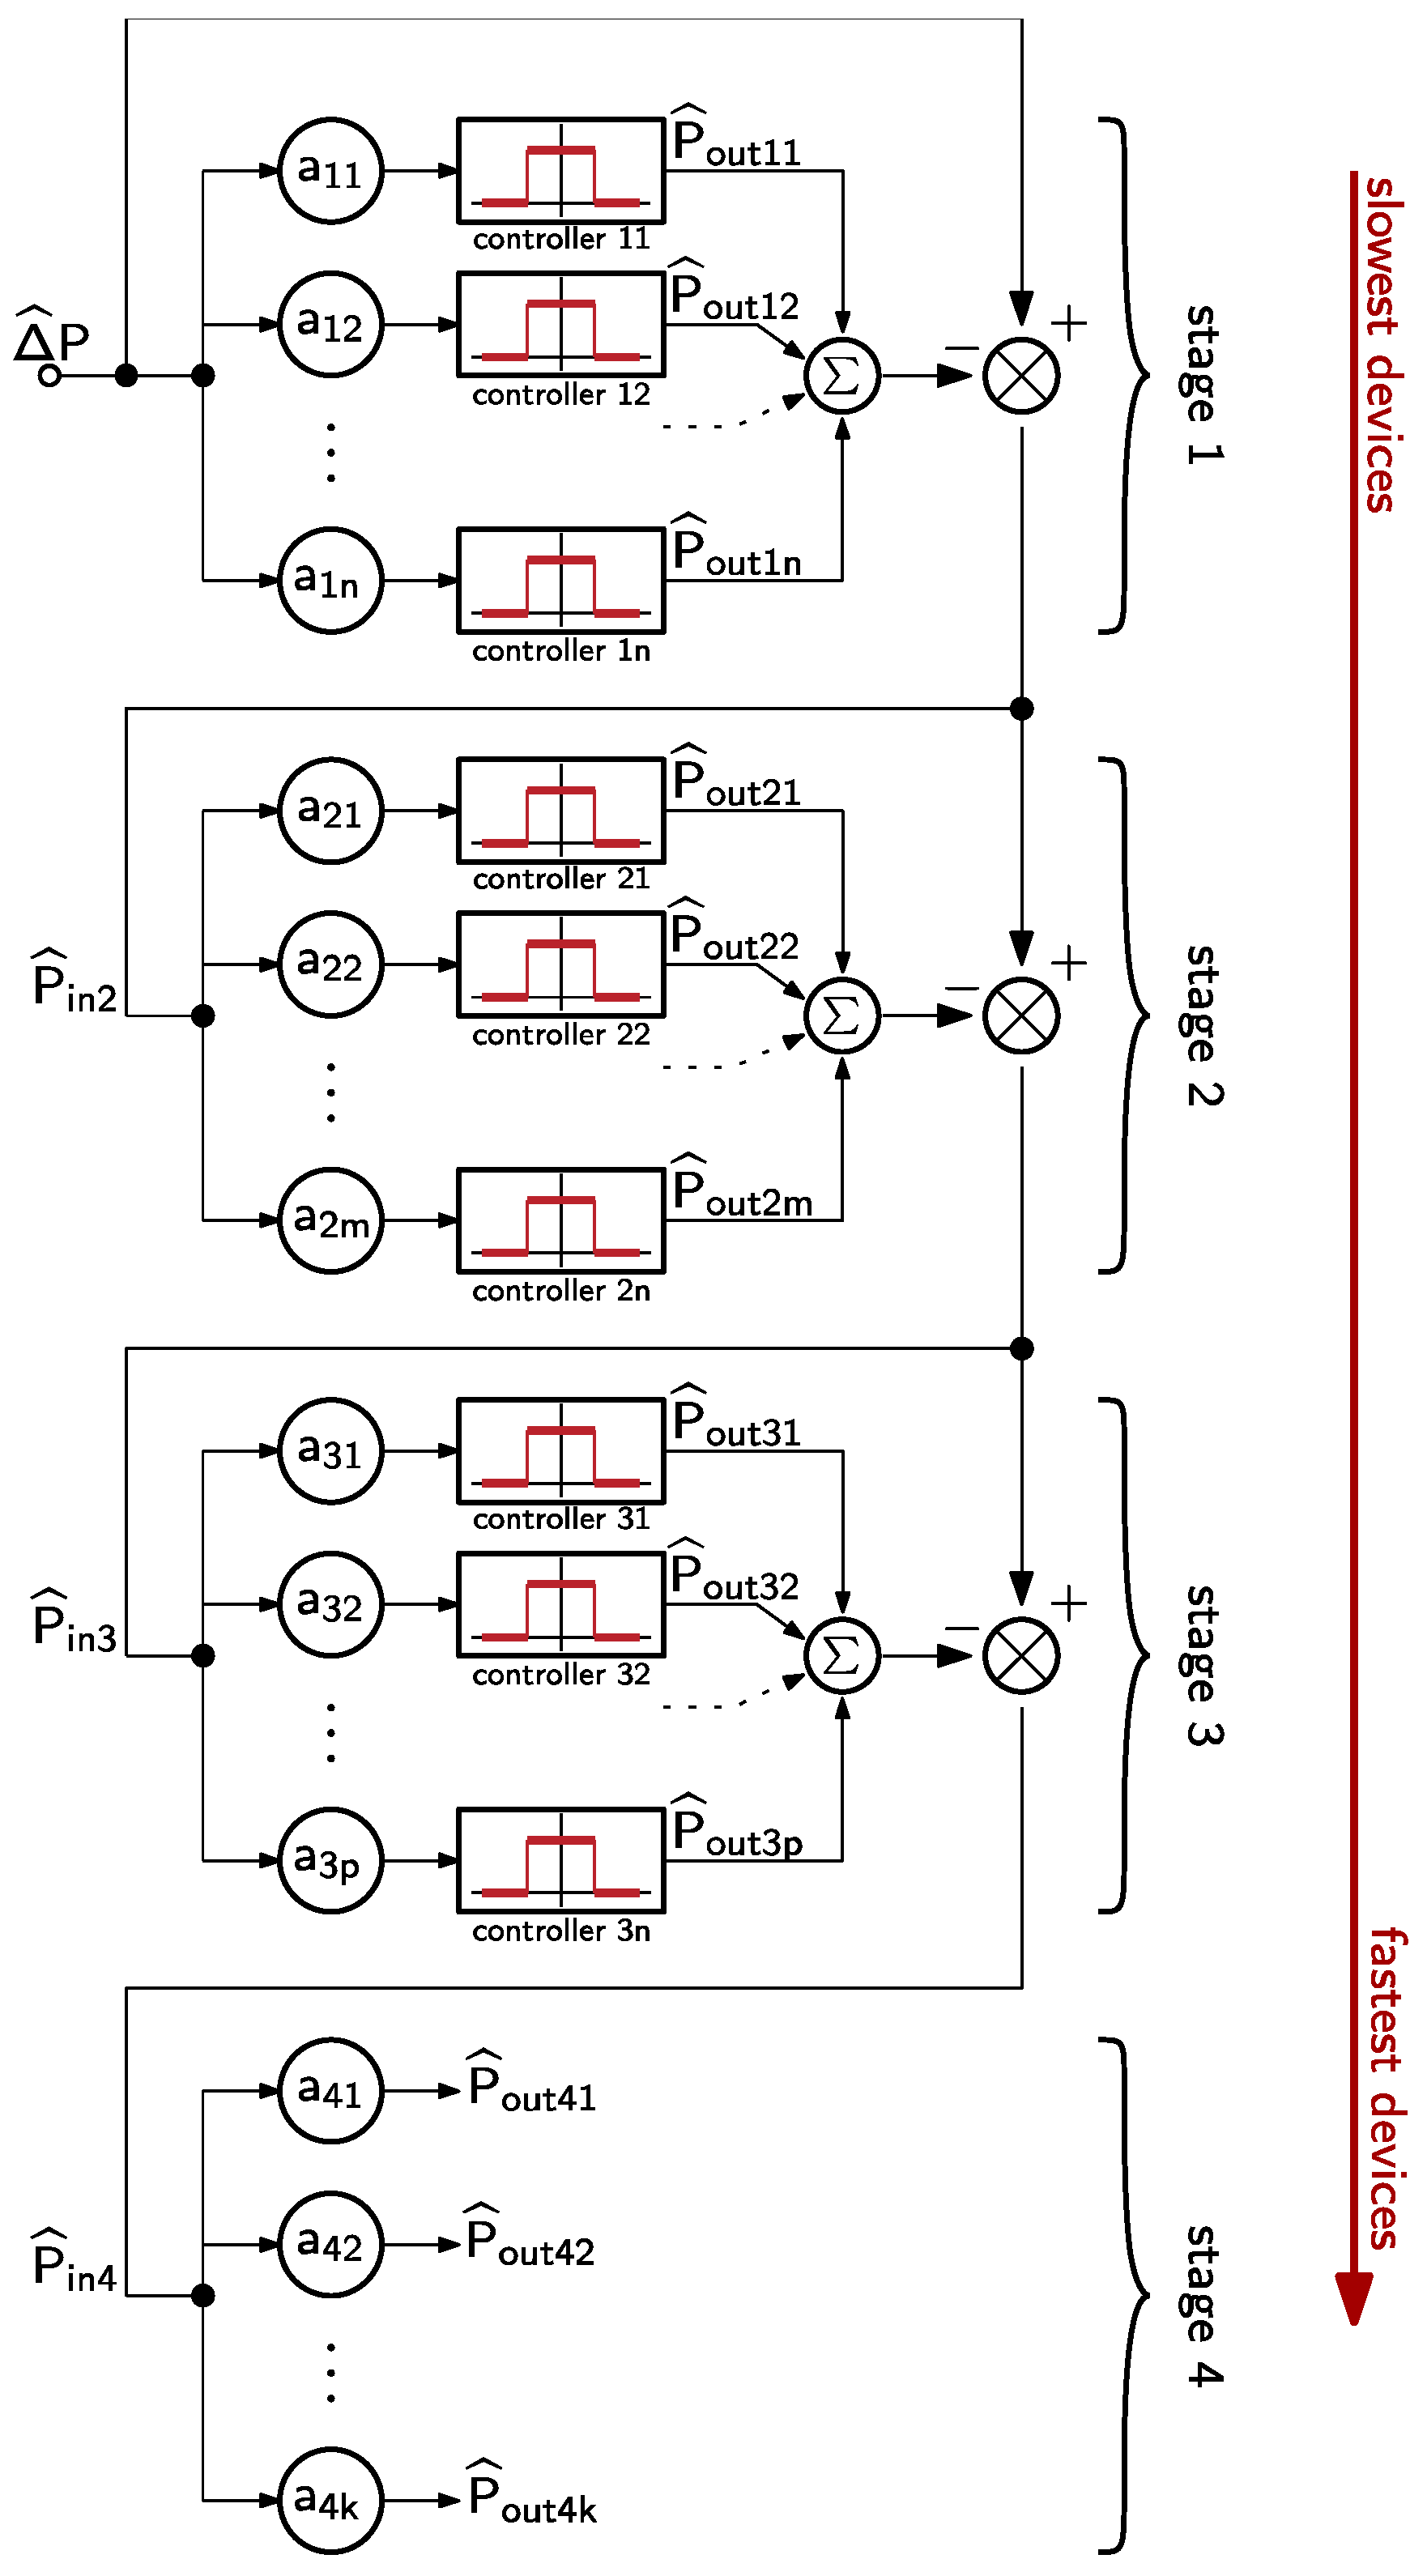
Figure 1. Generic architecture of the proposed algorithm. Δ ^ P is the unbalance power managed by the power system, a k i are weighting coefficients, P o u t   k i and P ^ o u t   k i are the expected power and actual power references of each devices and P ^ i n   k the input power of each stage.
Energies 14 03627 g001
Figure 2. Internal structure of a device controller. a k i is a weighting coefficient, P ^ i n   k the input power of the stage k , H k i the time horizon of the CMA filter, P k i m a x ,   m i n are the maximum and minimum power limits of the device k i , P c o r r the balance power to compensate the measurement errors, S o C k *   and S o C k are respectively the setting and actual state of charge of the storage device k .
Energies 14 03627 g002
Figure 3. Architecture of the algorithm corresponding to the hybrid system taken as an example. Δ ^ P and Δ P are the expected and actual unbalance power respectively, P ^ o u t   k and P o u t   k are the expected and actual output power profile of the stage k respectively, P ^ i n   k and P i n   k are the expected and actual input power profile of the stage k respectively, H k are the time horizon of the CMA filter k .
Energies 14 03627 g003
Figure 4. Effect of the coefficient a k i and of the scale H k i on the position of the power profile on the Ragone diagram.
Energies 14 03627 g004
Figure 5. Estimated daily profile of the power demanded by the load.
Energies 14 03627 g005
Figure 6. Estimated daily solar radiation.
Energies 14 03627 g006
Figure 7. Estimate of a daily power to be managed by the hybrid system and power that will actually be managed.
Energies 14 03627 g007
Figure 8. Architecture of the algorithm corresponding to the defined hybrid system.
Energies 14 03627 g008
Figure 9. Daily reference power profiles with (blue) and without (black) forecasting errors.
Energies 14 03627 g009
Figure 10. Annual Evolutions of States of charge.
Energies 14 03627 g010
Figure 11. Representation in a Ragone plot of the power and energy profiles for the Fuel Cell (FC), lead acid battery (battery 1), LiFePO4 battery (battery 2) and supercapacitor.
Energies 14 03627 g011
Table 1. Data of the photovoltaic panels used for the simulation.
InputValue
PositionSaint Nazaire, X: 47.283329° Y: −2.2°
PV Tilt angle50°
Sampling step1 s
Simulation horizon1 year
Table 2. Annualized costs of the multisource power system [40,46].
PV Panels
Annualized Initial cost C ^ init   PV ann = ( C ^ inv   PV + 0.4 C ^ inv   PV ) / 25
Annualized operation cost-
Annualized replacement cost-
Annualized maintenance cost C ^ main   PV ann = 0.01 C ^ init   SC   ann
Annualized total cost C ^ tot   PV ann = C ^ init   PV ann + C ^ main   PV ann
Fuel cell
Annualized Initial cost C ^ init   FC ann = C ^ inv   FC / LT FC
Annualized operation cost C ^ op   FC ann = V H 2 _ ann   C m 3 _ H 2
Annualized replacement cost C ^ rep   FC ann = 0.04 C ^ init   FC ann
Annualized maintenance cost C ^ main   FC ann = 0.04 C ^ init   FC ann
Annualized total cost C ^ tot   FC ann = C ^ init   FC ann + C ^ op   FC ann + C ^ rep   FC ann + C ^ main   FC ann
Batteries
Annualized Initial cost C ^ init   Bat ann = C ^ inv   Bat / LT Bat
Annualized operation cost-
Annualized replacement cost C ^ rep   Bat ann = 0.03 C ^ init   Bat ann
Annualized maintenance cost C ^ main   Bat ann = 0.03 C ^ init   Bat ann
Annualized total cost C ^ tot   Bat ann = C ^ init   Bat ann + C ^ rep   Bat ann + C ^ main   Bat ann
SC bank
Annualized Initial cost C ^ init   SC ann = C ^ inv   SC / LT SC
Annualized operation cost-
Annualized replacement cost C ^ rep   SC ann = 0.03   C ^ init   SC ann
Annualized maintenance cost C ^ main   SC ann = 0.03   C ^ init   SC ann
Annualized total cost C ^ tot   SC ann = C ^ init   SC ann + C ^ rep   SC ann + C ^ main   SC ann
Table 3. Optimization results without forecasting errors.
( a i 1 * , H i 1 * ) SizingTechnologyTotal Cost over 25 YrsAnnual Cost
PV panels 6 m2Monocrystalline SiEUR 2121EUR 84.84
Fuel Cell(1, 10.3 days) P F C _ m a x = 212 W_EUR 51,220.40EUR 2048
Battery 1(1, 11.9 h)23.1 kWhLead acidEUR 13,754.16EUR 550.16
Battery 2(1, 328 s)1.78 kWhLiFePO4EUR 9109.46EUR 364.37
Supercapacitors_175 F–50 V_EUR 51.04EUR 2.04
Converters IGBT 1200 VEUR 10,000EUR 400
Total System CostEUR 86,256EUR 3450
Cost of one kWhEUR 1.23 (2798 kWh provided per year)
Publisher’s Note: MDPI stays neutral with regard to jurisdictional claims in published maps and institutional affiliations.