Article

Quantifying the Effects of Wave—Current Interactions on Tidal Energy Resource at Sites in the English Channel Using Coupled Numerical Simulations

Renewable Energy Group, College of Engineering, Mathematics and Physical Sciences, University of Exeter, Penryn Campus, Penryn TR10 9FE, UK
*
Author to whom correspondence should be addressed.
These authors contributed equally to this work.
Energies 2021, 14(12), 3625; https://doi.org/10.3390/en14123625
Submission received: 20 May 2021 / Revised: 12 June 2021 / Accepted: 16 June 2021 / Published: 18 June 2021
(This article belongs to the Special Issue Tidal Turbines)

Abstract

:
Numerical modeling of currents and waves is used throughout the marine energy industry for resource assessment. This study compared the output of numerical flow simulations run both as a standalone model and as a two-way coupled wave–current simulation. A regional coupled flow-wave model was established covering the English Channel using the Delft D-Flow 2D model coupled with a SWAN spectral wave model. Outputs were analyzed at three tidal energy sites: Alderney Race, Big Roussel (Guernsey), and PTEC (Isle of Wight). The difference in the power in the tidal flow between coupled and standalone model runs was strongly correlated to the relative direction of the waves and currents. The net difference between the coupled and standalone runs was less than 2.5%. However, when wave and current directions were aligned, the mean flow power was increased by up to 7%, whereas, when the directions were opposed, the mean flow power was reduced by as much as 9.6%. The D-Flow Flexible Mesh model incorporates the effects of waves into the flow calculations in three areas: Stokes drift, forcing by radiation stress gradients, and enhancement of the bed shear stress. Each of these mechanisms is discussed. Forcing from radiation stress gradients is shown to be the dominant mechanism affecting the flow conditions at the sites considered, primarily caused by dissipation of wave energy due to white-capping. Wave action is an important consideration at tidal energy sites. Although the net impact on the flow power was found to be small for the present sites, the effect is site specific and may be significant at sites with large wave exposure or strong asymmetry in the flow conditions and should thus be considered for detailed resource and engineering assessments.

1. Introduction

Tidal energy holds the potential to be part of the effort to de-carbonize and transform the global electricity generation sector. Numerous locations are being investigated as potential sites for tidal stream energy. Globally, it has the potential for significant contribution to world-wide electricity generation. In the UK alone, there is significant tidal stream resource, with an estimated potential of 95 TWh/year [1]. Several pilot projects and small-scale generators have been demonstrated successfully, with 36.6 MW of of tidal stream energy installed cumulatively up to the end of 2020, producing over 60 GWh [2]. Tidal energy has yet to develop into a large-scale commercial industry on the scale of offshore wind generation. The viability of large-scale deployments will be defined by the ability of the industry to produce electricity at competitive costs, a challenge that is largely governed by the tidal energy resource, the technical plant availability, and the capital investment and operational cost. For the development of economically viable commercial scale arrays to be successful, accurate and reliable data on the resource, conditions, and expected generation are essential. Tidal energy projects often utilize numerical simulations to provide information about site conditions. Flow and wave models are used to understand the resource, calculate power outputs, and assess the operational conditions.
Site data can be acquired from both in situ measurements and computational simulations. While data measurement campaigns will always be an important feature of offshore projects, the deployment of current and wave measurement devices is costly and carries significant risk. Numerical simulations can provide key meteorological and oceanographic parameters to a project at multiple locations without the spatial and time constraints of physical offshore deployments. Simulated results also offer the benefit of long-term datasets that may not be otherwise possible. Analysis of extreme events requires many years of data which, for most sites, will only be available from numerical modeling. Developing a resource quantification strategy that makes the best use of both techniques is essential for project success.
Tidal flow models of some form have been used to assist offshore operations for centuries. For tidal energy projects in the modern supercomputer age, the complexity of these models is much greater and many dozens of parameters can be simulated. Deciding which processes to calculate is a key challenge for modelers and often involves a trade-off between accuracy and computational time and resources. Numerical simulations are able to provide flow speed, water level variation, and other key resource parameters without the need for costly and risky offshore operations. Once calibrated and validated against in situ data, numerical simulations can also provide a long-term dataset, necessary for the assessment of the conditions at the site.
An accurate understanding of the expected power output from a tidal energy installation is essential for assessing its financial viability. Given that, for tidal stream generation, power is proportional to the cube of the flow velocity, a small error in calculating the flow may result in a larger error in power generation calculations and hence there would be a significant difference to the project energy production and costs. Levelized Cost of Energy (LCOE) is a measure used to calculate the average cost of energy over a project lifetime and is regularly used to compare the cost of generation across different energy sources. Where the LCOE of a tidal project is predicted using resource data from numerical simulations, it is important to have confidence in the modeling to ensure that the project LCOE will be accurate.
Many tidal energy resource assessment studies have been undertaken in the past with a number of different objectives. Many studies investigate the flow regime and energy potential at specific sites and may be attached to a particular tidal energy project, e.g., Pentland Firth [3], Ramsey Sound [4], Channel Islands [5], and several sites in Canada [6,7,8]. All these studies employ some form of numerical simulation to resolve the flow velocities and calculate the resource. Site resource studies have also been completed that rely on solely measured data [9,10]. Other studies produce a more general classification of the tidal energy on a regional scale. Lewis et al. [11] used a ROMS model to assess the tidal resource throughout the Irish Sea. Campbell et al. [12] used simulated output from a MARS2D model to identify the tidal power resource around the whole of France with the aim of identifying the best sites.
The wave conditions are often not included in models of tidal flow when conducting resource assessment of potential tidal energy sites. Previous studies have suggested that waves may have a significant effect on the flow resource, with possible reductions in flow speed of 10–20% [13,14] at tidal energy sites. Wave energy resource studies sometimes include wave–current interactions; however, it is less common in tidal flow assessments.
Several mechanics for waves interacting with currents have been shown to affect the mean flow through the water column. Orbital velocities exist throughout the water column whenever waves are present. Wiberg and Sherwood [15] showed that the wave induced velocities can be calculated from measured wave parameters. The existence of these velocities has been shown to influence the tidal resource [14,16]. Bottom friction and sediment transport rates are both increased in the presence of wave motions; both these parameters are important for the underlying calculations of the flow model. Lewis et al. [17] used a coupled flow–wave model to investigate wave heights in the Irish Sea. They showed that up to a 20% increase in wave height can be seen when flow is included in the calculations.
A detailed review in [18] identifies and evaluates the main sources of uncertainty for tidal energy resource assessments:
  • Instrument measurement uncertainties are reasonably small and well understood if best practices are followed during instrument deployment and data analysis.
  • Extrapolation procedures for tidal energy data are established, but the correct evaluation in site conditions with asymmetric tidal flows is challenging. Incorporating and quantifying wave–current interactions when measuring and predicting the tidal resource is a key uncertainty factor for wave exposed sites.
Commercial tidal energy projects critically require a good understanding and quantification of the energy yield. The uncertainty in the pre-construction resource and yield estimate is a significant project and hence investment risk component, affecting all tidal energy projects. A robust understanding of those uncertainties will increase investor confidence [19,20]. Variations in energy yield directly translate to variations in revenue and thus the project viability.
The aim of this paper is to investigate the differences in flow resource parameters between a fully coupled flow-wave model and a stand alone flow model which does not account for wave action at three tidal energy sites (see Table 1). We use the D-Flow FM (Flexible Mesh) flow model [21] coupled to the SWAN wave model [22]. The flow speed (and hence potential for energy generation) is compared between the two model runs and differences are analyzed. Mechanisms for wave–current interaction within the modeling code are discussed and quantified. At present, the outputs from the numerical models have not been validated against in situ measurements. As such, the results are not intended to be interpreted as precise resource estimates. The objective of the study is to provide insight into the effect that waves have on tidal flow within a numerical simulation and to provide the sector with useful output that will assist in the design of future projects.
A description of the flow modeling code used for the study is provided in Section 2 in addition to a detailed explanation of the set-up of the simulation. The results are presented in Section 3, which includes an overview of the flow and wave conditions at the sites of interest as well as the various wave–current parameters. Finally, the discussion and conclusions are presented in Section 4 and Section 5, respectively.

2. Modeling

D-Flow FM (Flexible Mesh) is the flow solver of the Delft3D: Flexible Mesh modeling suite. Delft3D is a long established modeling code with many well validated applications [21]. D-Flow FM has been available since 2016 and enables simulations on an unstructured computational domain. The model is a finite-element solver which resolves the hydrodynamics by numerically solving the shallow water equations derived from the Navier–Stokes equations expressing conservation of mass and momentum, which in 2D are given by (1) and (2), respectively.
h t + · ( h u ) = 0
h u t + · ( h u u ) = g h ζ + · ( ν h ( u + u T ) ) + τ c u r + τ w i n d ρ
where u = [ u x , u y ] is the horizontal flow velocity comprising the components in the x and y directions, respectively; h is the water depth; ζ is the water level; ν is the kinematic viscosity; ρ is the water density (assumed constant in the current study); and the superscript T denotes the transpose. The terms τ c u r and τ w i n d represent the shear stress due to bottom friction and wind friction respectively. The numerical approach and a full conceptual description are give in the technical literature [21,23].
A D-Flow FM model of the English Channel was constructed to simulate flow across the region. The domain (shown in Figure 1) has three open boundaries. To the west, the model domain reaches into the Atlantic Ocean where the largest boundary comprises a north–south line running from the southwest coast of Ireland to a latitude south of the Brittany peninsular; the boundary then runs west–east to the French coast. The other two shorter open boundaries run east–west and cover the Irish Sea and North Sea, respectively. The model is constructed with a blended mesh constituting rectangular and triangular cells. Offshore areas of low interest are built from 5 km square cells. Around the coast and in areas of higher interest, the mesh comprises triangular cells of varying resolution increasing to approximately 20 m in the areas of most interest. To ensure the model was able to operate as accurately as possible, the domain was unstructured to satisfy two key parameters: orthogonality and smoothness. Grid orthogonality, defined as having the cell edges perpendicular to the line joining the grid centers, is an important property to enable D-Flow FM to implement the numerical discretization of the shallow water equations. Grid smoothness is important to ensure accuracy, so the mesh was designed so that the resolution did not change rapidly. The completed unstructured mesh provides the flexibility to balance computational efficiency with high resolution output on a single model domain [24,25] while satisfying the D-Flow FM constraints. The computational time-step is calculated by the solver based on a Courant condition. However, it is limited to a maximum value of 30 s, which is sufficient to capture all the physical processes in the model.
Table 1. Selected tidal energy sitesin the English Channel.
SiteDescription
PTEC, Isle of WightLocated 2.5 km off the southern tip of the Isle of Wight the site runs east–west for approximately 5 km and is approximately 1 km across. Spring peak flows are up to 4 ms 1 . As of 2021, a 30 MW tidal array demonstration project is currently in the planning stages. The site has a potential capacity of 300 MW [26,27]. The mean water depth at the model output point used in this study is 65 m.
AlderneyLe Raz Blanchard is the highly energetic race between the island of Alderney and the Normandy coast. With spring peak flows of over 5 ms 1 [28]. It is one of the most powerful tidal stream sites in Europe. An initial 7–20 MW array is planned to begin in 2021-2022 with up to 2–3 GW of tidal turbines are planned in the future [29]. It is estimated in [5] that the potential resource is as high as 5.10 GW. The mean water depth at the model output point used in this study is 38 m.
GuernseyThere are several areas around Guernsey with fast flows that could be suitable for tidal energy extraction. This study looks at Big Roussel, the race between the two small islands of Sark and Herm. It has peak flows of up to 3 ms 1 [30]. Coles et al. [5] estimated that there is a maximum capacity of 0.12–0.24 GW. The mean water depth at the model output point used in this study is 40 m.
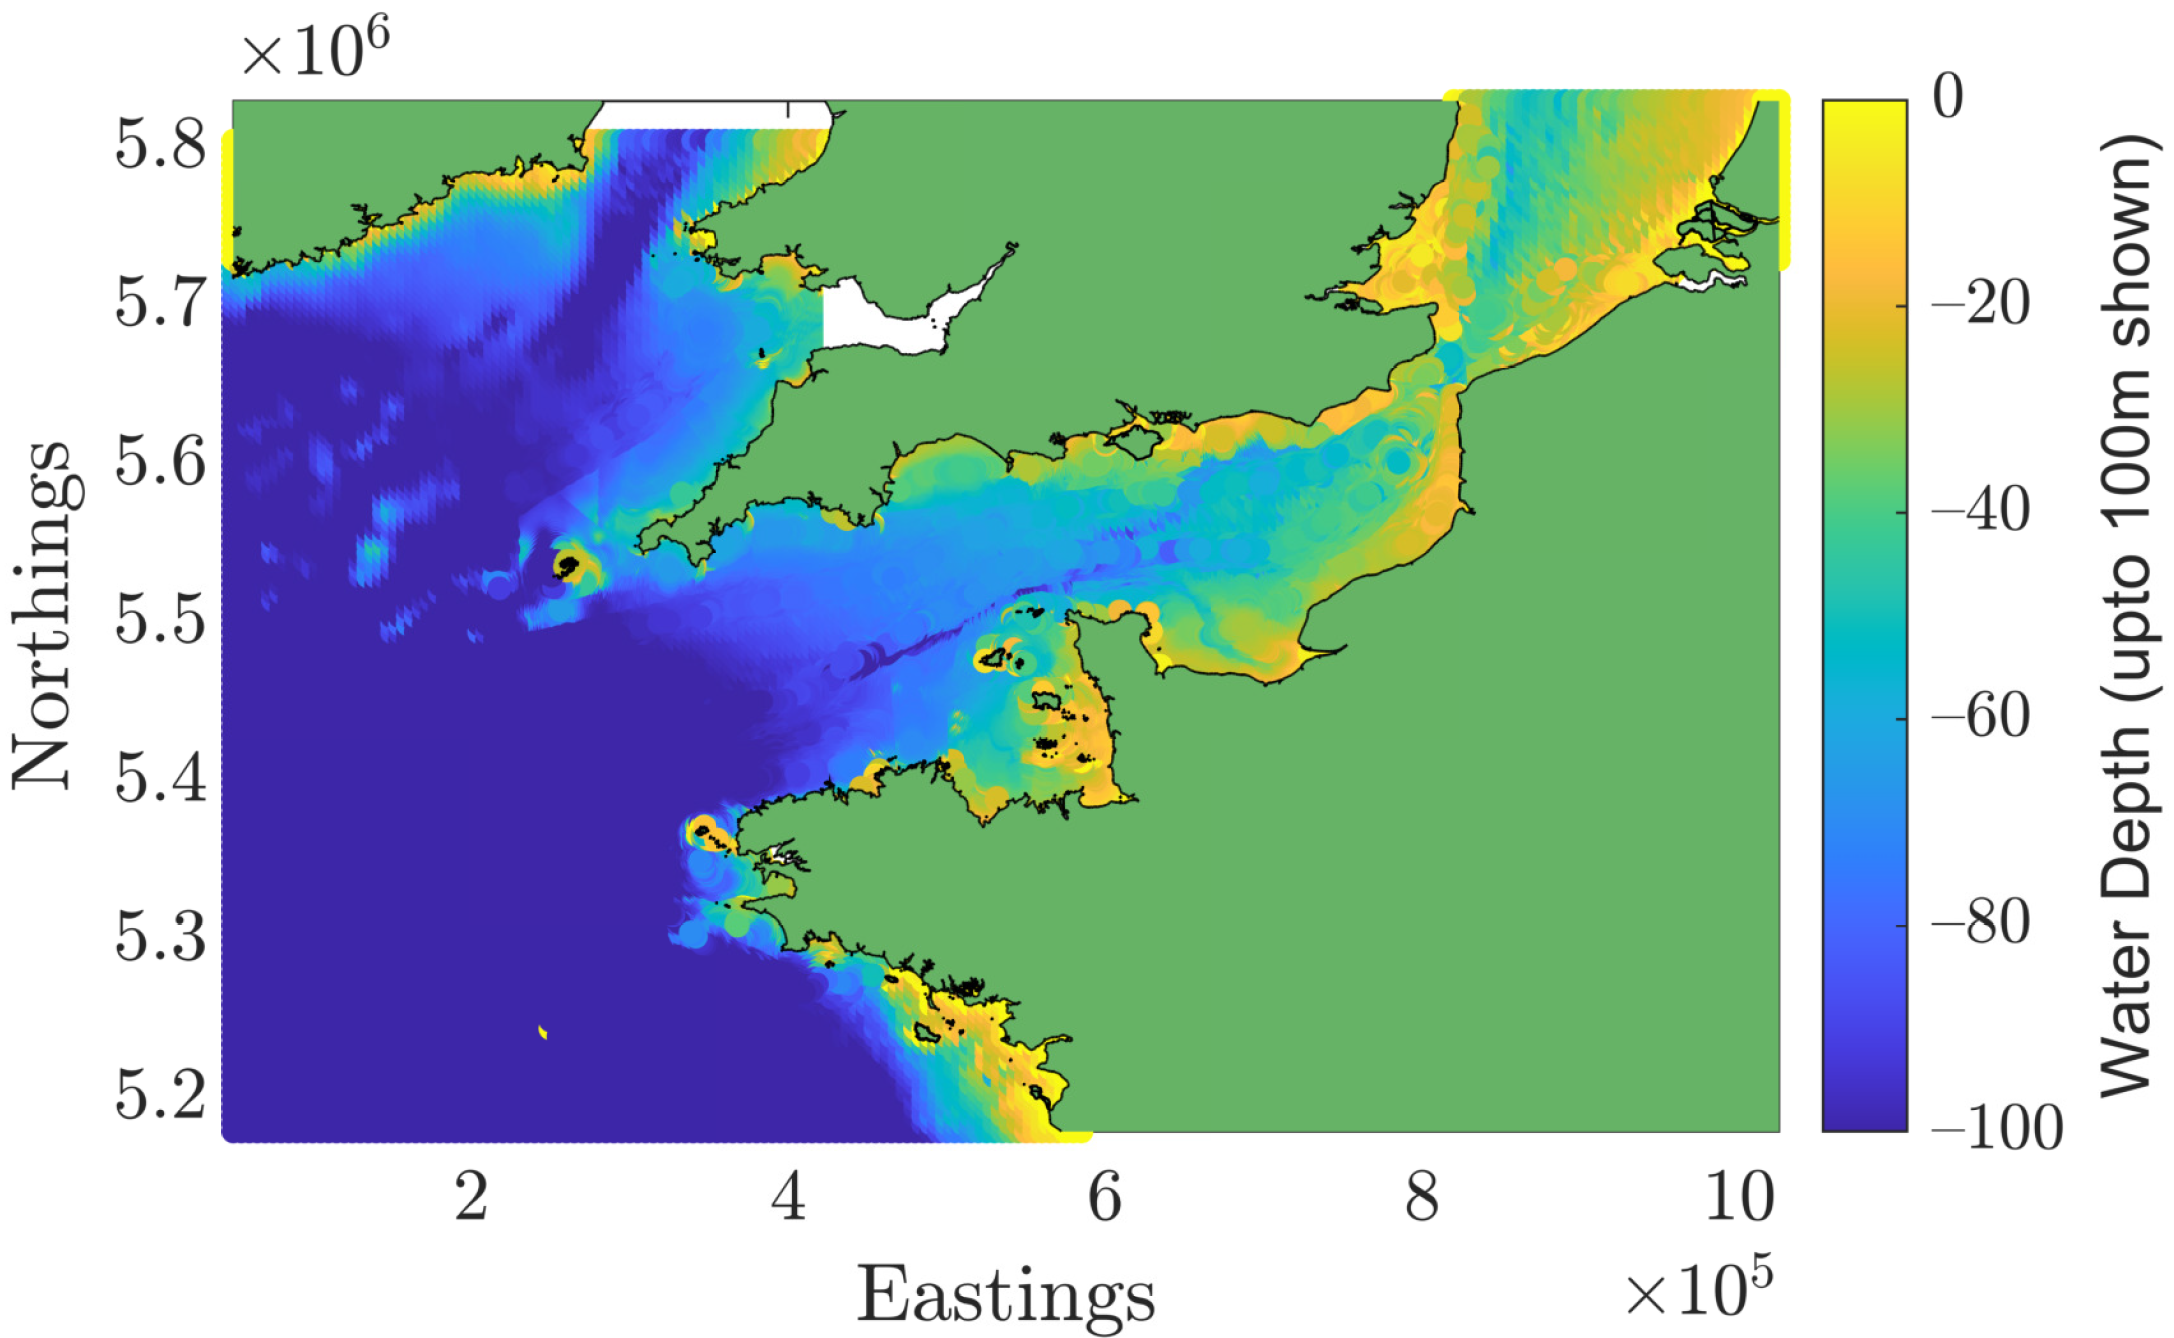
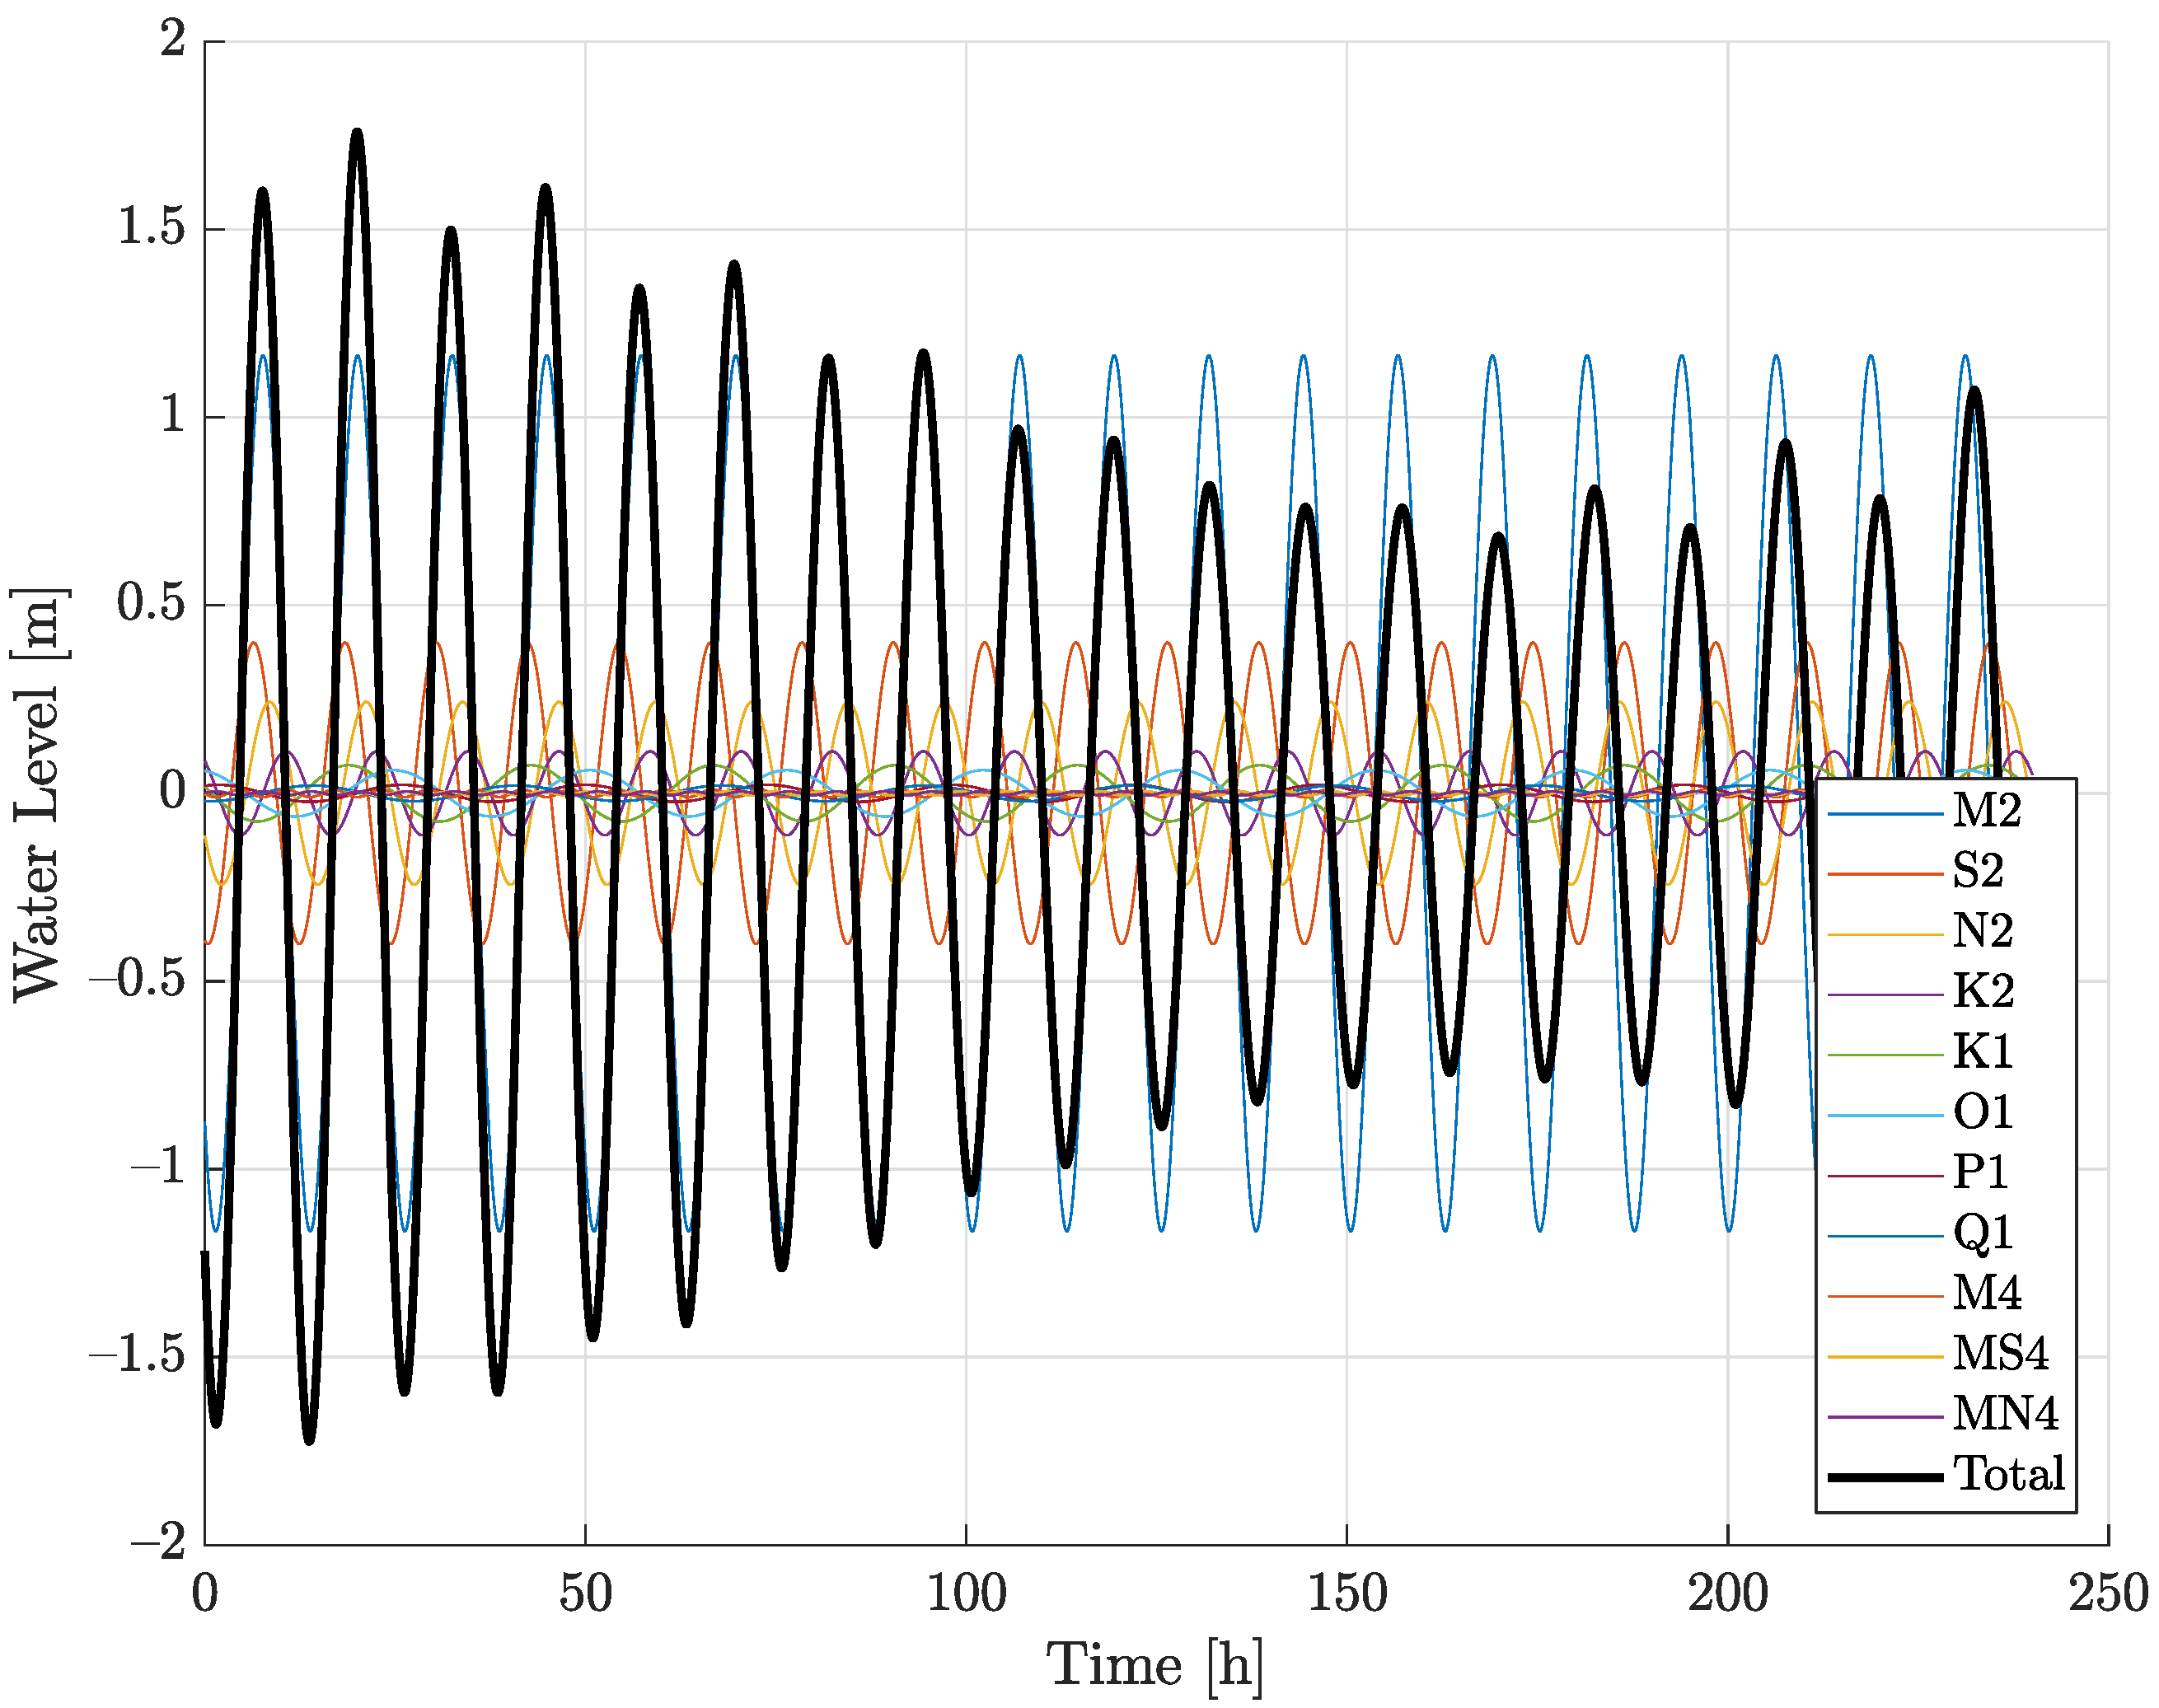
Bathymetry for the model is drawn from a combination of sources. Areas around the UK are sourced from Digimap at 1 arc-second resolution [31]. In waters around France, the bathymetric data are from the French Hydrographic office (SHOM) [32] also at 1 arc-second and are compiled as part of the HOMINIM project. A small part of the southwest corner of the grid was outside the limits of both datasets; this was filled from the GEBCO 2020 global bathymetry map [33]. The bathymetry is shown in Figure 2. The model is forced at the open boundaries by varying the water level with a series of astronomical harmonic constituents, M 2 , S 2 , N 2 , K 2 , K 1 , O 1 , P 1 , Q 1 , M 4 , M S 4 , M N 4 . The harmonic amplitude and phase data are produced from the TPXO global model [34]. As the open boundaries of the model domain are in the open ocean, there are no measured data available at the boundary points. Tidal gauge data are available at points inside the domain; however, these are at mostly at coastal locations. TPXO is widely used to provide harmonic boundary conditions in coastal flow models (see, e.g., [5]). An example of the water level variation used to force the boundary is shown in Figure 3. The grid was sufficiently large that an accurate reproduction of flow velocities is available with water level variation only. The domain boundary was sufficiently far from the sites of interest that pressure gradients and fluid acceleration can balance and an acceptable solution can be found [21]. A constant bottom friction coefficient is applied throughout the grid, although this may not be ideal in areas of very high tidal velocity which are likely to have a different bottom structure than the rest of the English Channel. This will be investigated as part of future validation and calibration studies.
Model outputs at three sites were selected for analysis. All three sites are in various stages of planning for tidal stream energy projects. At the time of writing, none of the sites have turbines deployed. The sites are summarized in Table 1. Output parameters, including flow velocity, at each of these sites are saved at 20 min resolution. Mapped data are also produced of the entire grid domain. Due to computational storage constraints, the mapped data are only output at 6 h intervals and are therefore not used in this analysis.
A spectral wave model was also constructed of the Channel region using the SWAN modeling code [35]. SWAN (referred to as D-WAVE in the Delft3D FM software package) is a popular 3rd-generation wave model, used in many academic and industrial studies. This model is meshed on a regular rectangular 2 km grid which covers the complete area of the D-Flow FM domain, shown as the yellow box in Figure 1. SWAN is set to run in 3rd-generation mode with white capping, wave breaking, diffusion, quadruplet, and triad interaction all activated. For explanation of the underlying equations and numerical schemes employed by SWAN, the reader is directed to the technical documentation [22]. The wave spectrum is discretized into 24 frequency and 36 directional bins. The wave model is forced by wind speed data and boundary wave conditions from the ERA-5 global re-analysis dataset from the European Centre for Medium Range Weather Forecasts (ECMWF), which are freely available data with excellent validation and documentation. ERA-5 is availableto download via the EU Copernicus data store available at [36]. It contains a large number of atmospheric and wave parameters from 1959 to the present. The wind data are input to the SWAN model as a regular grid with a spatial resolution of 20 km and a temporal resolution of 1 h. At the open boundaries, the model is forced by wave parameter values from the ERA-5 dataset, interpolated along the boundary points at 1 h resolution. The ERA-5 data (and its predecessor ERA-Interim) are commonly used as boundary inputs to a number of coastal wave models (see, e.g., [37,38,39]) (a full description of the boundary input wave data from ERA-5 is given at [40] ). SWAN provides wave parameters at each time step to the D-Flow FM flow model and receives flow data in return. The data are shared by a communication file which is updated and read by both models. The data are combined with the flow data output file to provide parameters at the same 3 locations as the flow model.
The models were run from 1 January to 14 May 2019 (134 days). This period was chosen to capture multiple spring–neap cycles as well as a range of wave conditions. It was decided that the study should cover a long enough time-frame to get reasonable coverage of different conditions, including multiple storm events. The winter of 2019 was chosen as a suitable period. The flow model was run twice, first as a stand-alone flow simulation without any wave inputs and then fully coupled to the SWAN wave model. The outputs from the coupled and uncoupled flow modeling are compared and analyzed.

2.1. Effects of Waves on Currents

The hydrodynamic calculations in the D-Flow FM model are affected by wave action. In addition to the headline parameters, the wave model also generates a number of physical quantities which are incorporated into the hydrodynamic calculations of the flow model. Without the inclusion of wave model data, these processes are not accounted for and there may be increased uncertainty in the flow simulation output. Soulsby et al. [41] and Groeneweg [42] provided detailed descriptions of the different mechanisms for wave–current interaction. The main mechanisms are briefly summarized in the following subsections.

2.1.1. Stokes Drift and Mass Flux

In linear wave theory, there is no net displacement of water due to wave motion. However, second-order effects result in a small net displacement in the direction of wave propagation. Essentially, this is because a fluid particle in the crest of a wave moves further forward than it moves backwards when it is in the trough. This effect is known as Stokes drift. The depth-averaged Stokes drift current, u S , is given by:
u S = g 32 π k m T m H s 2 h ,
where k m = 2 π / λ m is the wavenumber vector; λ m is the wavelength vector evaluated at the mean wave period, T m ; H s is the significant wave height; h is the water depth; and g is the acceleration due to gravity. The velocities are calculated by SWAN and provided to the flow model.

2.1.2. Streaming

Streaming is a wave-induced current in the bottom boundary layer, which results from the fact that the wave-induced horizontal and vertical orbital velocities are not exactly 90 out of phase [43]. Since the effect decreases away from the sea bed and is assumed to act only in the wave boundary layer, the effect of streaming on the mean flow velocities is currently only implemented in the 3D model. Since the present study is limited to the use of the 2D depth-averaged model, the effect of streaming is not considered.

2.1.3. Wave Induced Turbulence

The dissipation of wave energy (due to white-capping, bottom friction, and depth-induced breaking) causes increased turbulence. For wave breaking and white-capping, this increased turbulence is close to the free surface, whereas, for bottom friction, the effect is in the bottom boundary layer. As the effects are localized, the increase in turbulence due to wave action is currently only implemented in the 3D model, so is not considered as part of this study.

2.1.4. Forcing by Radiation Stress Gradients

Wave action results in non-zero net forces through the water column, known as radiation stresses. Dingemans et al. [44] showed that the radiation stresses which drive currents are related to the wave energy dissipation from white-capping, depth-induced breaking, and bottom friction. These quantities are calculated and output by the SWAN wave model. The radiation stress is implemented as a shear stress term in the momentum Equation (2), with the value given by
F = D k m ω m ,
where ω m is the mean wave angular frequency and D is the energy dissipation rate. For the current study, the water depths at the sites of interest are such that the dissipation due to depth-induced breaking is negligible and can be ignored. For the present study, the white-capping model of Komen et al. [45] was used in the SWAN model. In this model, the energy dissipation rate from white-capping can be approximated as
D w = C d s s s P M 4 H s 2 T e ,
where T e is the intrinsic energy period (measured in the frame of reference moving with the current), s is the spectrally-averaged wave steepness, s P M = 0.055 is the wave steepness for a Pierson–Moskowitz spectrum, and C d s is a tunable dissipation coefficient, set to the default value of C d s = 2.36 × 10 5 for the present work.
For the present study, bottom friction was modeled using the JONSWAP model [46], with the dissipation rate given by
D b = C b | u o r b | 2 g 2 ,
where C b = 0.038 m 2 s 3 and u o r b is the wave orbital velocity on the sea bed, which can be approximated as
u o r b = ω m H s 2 sinh ( k m h ) .

2.1.5. Enhancement of the Bed Shear Stresses

The bed shear stress is a key quantity impacting the flow dynamics. The wave and current boundary layers at the sea bed interact non-linearly to cause a net increase in the shear stress. Various models for the combined shear stress due to waves and currents were discussed by Soulsby et al. [41]. For the present work, we used the default settings in the D-Flow FM 2D model, which uses the model of Fredsøe [47]. The bed shear stress due to the current is given by
| τ c u r | = ρ g | u | 2 C 2 D 2 ,
where C 2 D is the current drag coefficient for depth averaged flow, given by Manning’s formulation C 2 D = h 1 / 6 / n , where the coefficient n is set at the default value of n = 0.023 . The bed shear stress due to waves is given by
| τ w a v e | = 1 2 ρ f w | u o r b | 2 ,
where f w is the bottom friction coefficient, given by
f w = 0.00251 exp 5.21 α 0.19 , α > π / 2 , 0.3 , α π / 2 ,
where α = | u o r b | / ω k s and k s is the Nikuradse roughness length scale. In the present work, we set k s to the default value of 0.01.
The way in which the wave and current shear stress terms are combined is complex and the reader is referred to the D-Flow FM technical documentation for details. In general, the mean bed shear stress due to waves and currents is greater than the sum of | τ c u r | and | τ w a v e | .

3. Results and Analysis

3.1. General Characterization

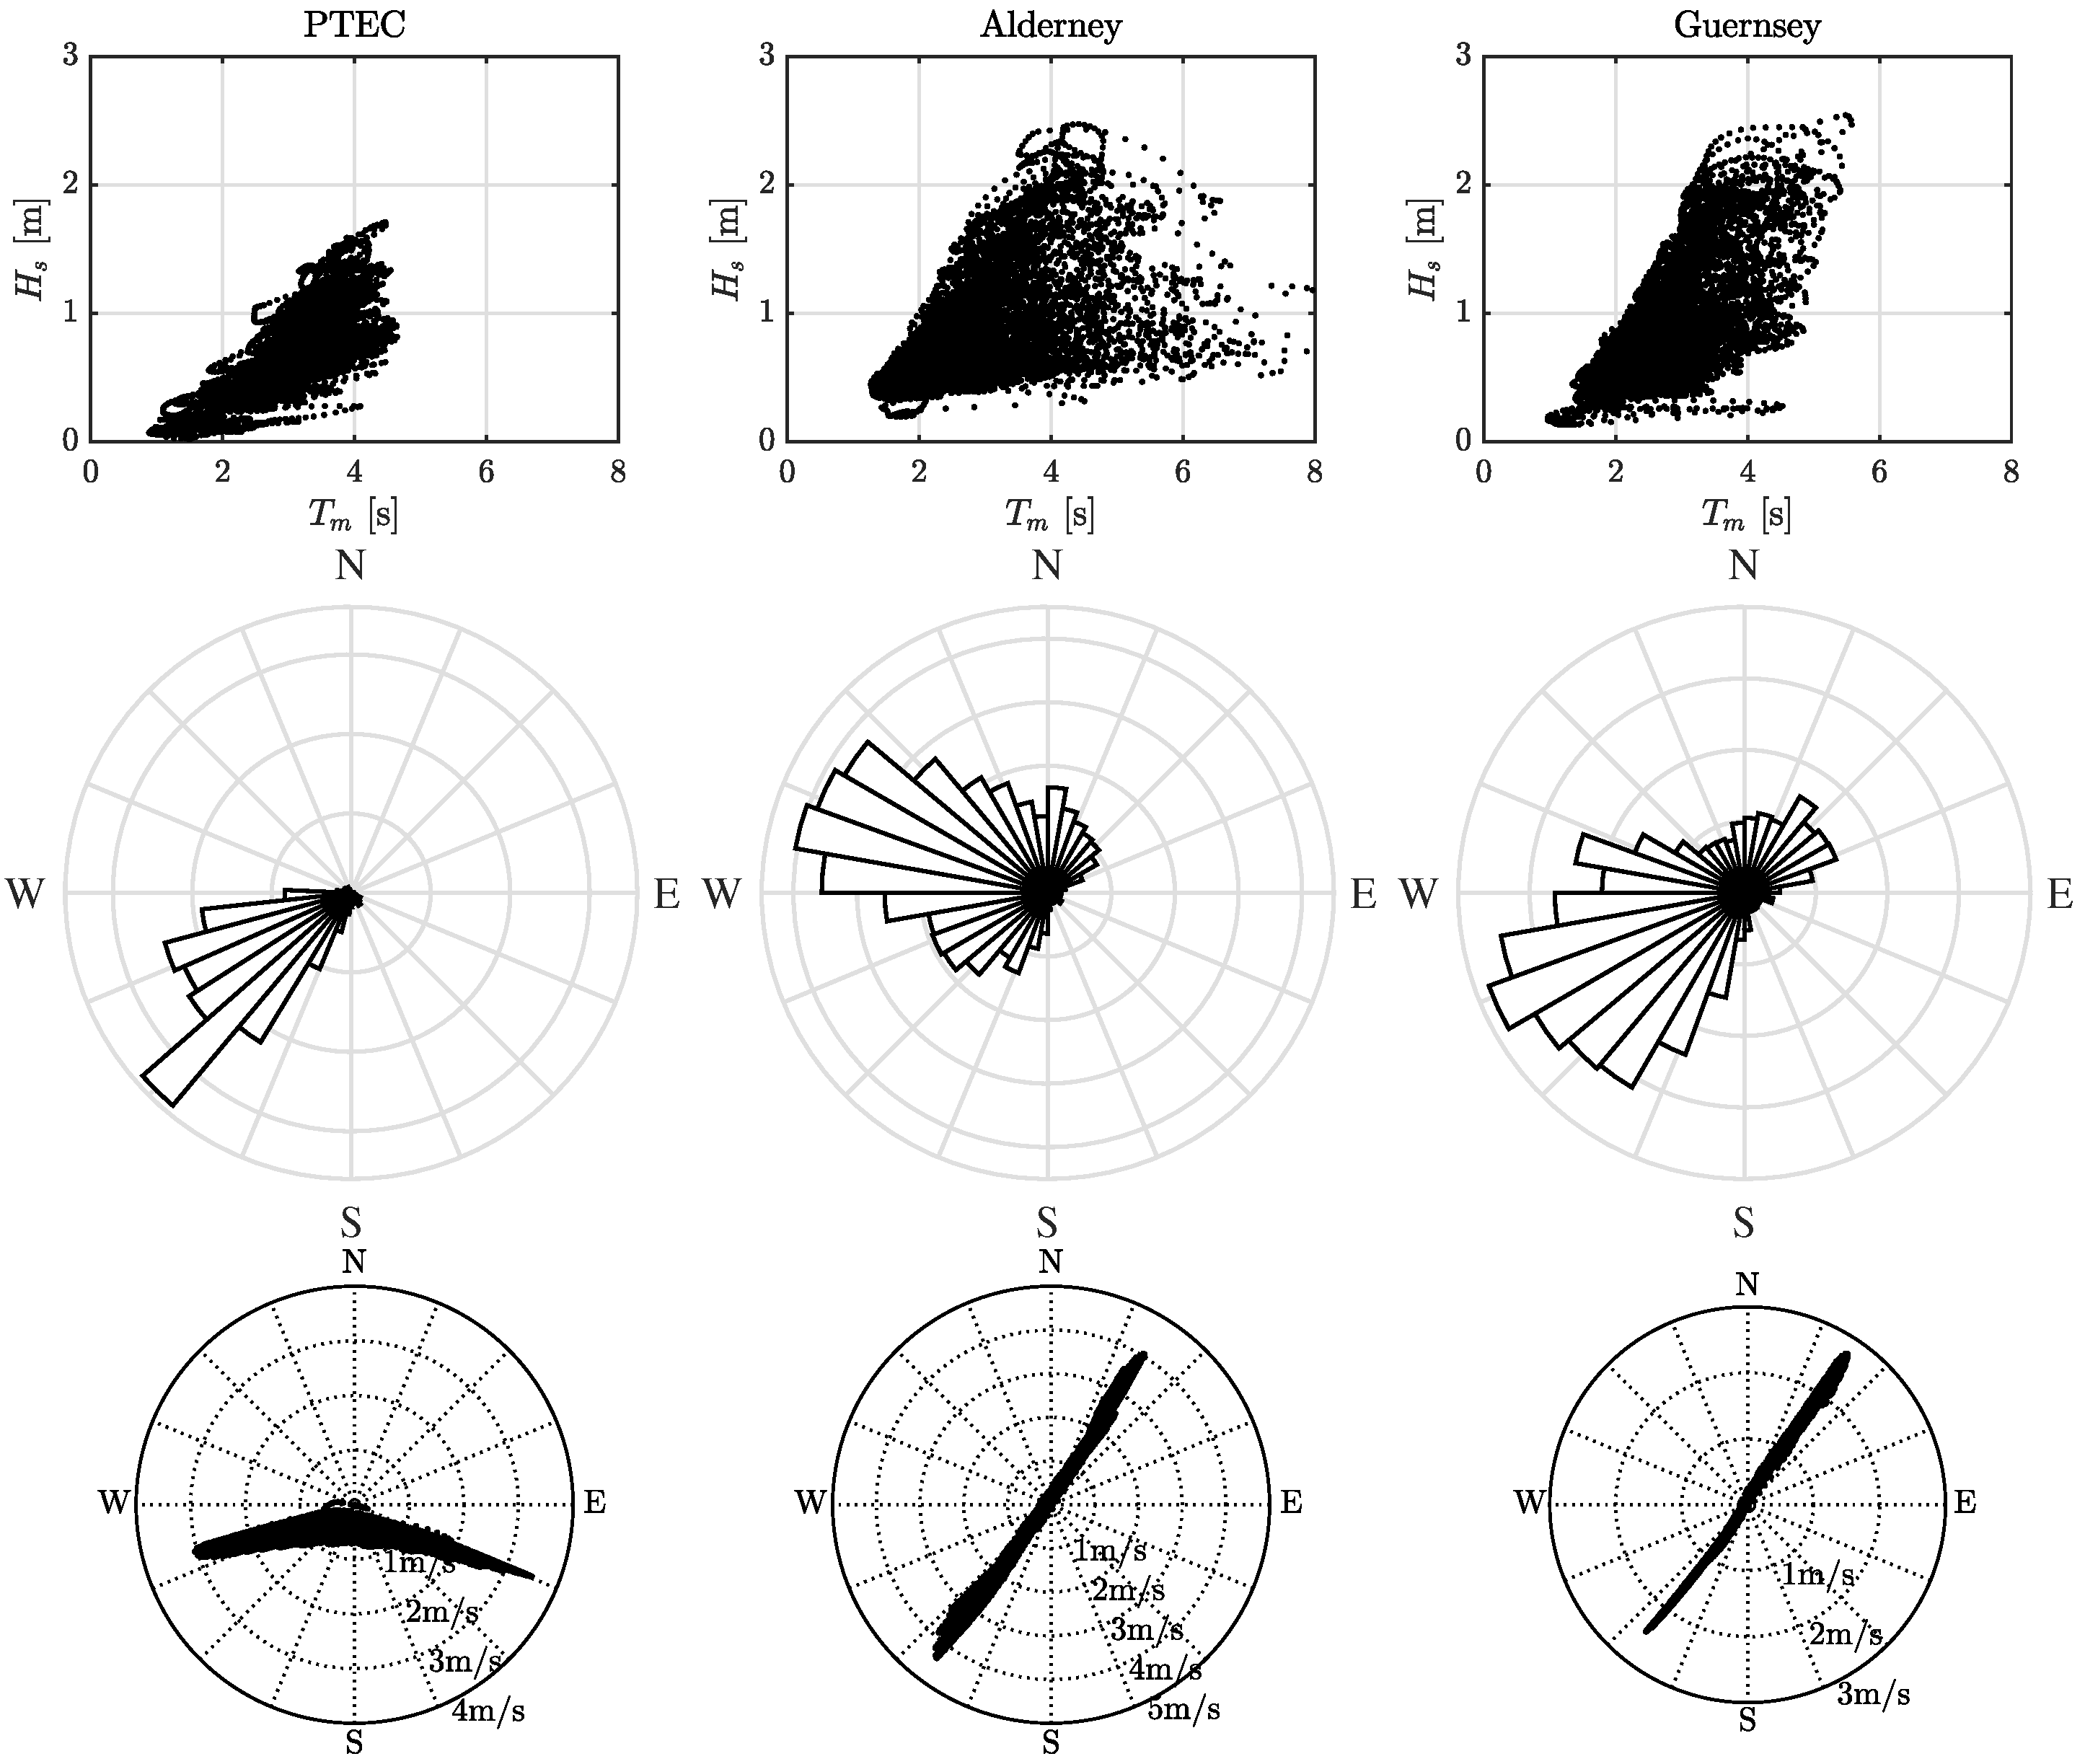
The wave and current conditions at the three sites are summarized in Figure 4. At PTEC, the current direction distribution is slightly asymmetric, due to the flow around the headland at the southern tip of the Isle of Wight. Flow directions are approximately east-southeast to west-southwest, with peak flow speeds from the model are around 3.5 m/s in the easterly direction, and around 3.0 m/s in the westerly direction. Over the period of the study, the wave conditions at PTEC are slightly smaller than at the other two sites, with a mean H s of 0.7 m and a maximum observed value of 1.7 m. The wave conditions are predominantly from the southwest. This means that waves are typically propagating against the current when the flow is westerly, and with the current when the flow is easterly (note that, following standard conventions, the wave direction is that which the wave is coming from, whereas the current direction is the direction that the current is travelling towards).
The distribution of flow and wave conditions at Alderney and Guernsey are qualitatively similar. The flow is approximately bi-directional between northeast and southwest. Alderney has the highest peak flow speeds, of 4.4 m/s in the southwest direction and 4.1 m/s in the northeast direction. Guernsey has lower peak flows of 2.5 m/s in the southwest direction and 2.7 m/s in the northeast direction. The mean and maximum observed wave heights are similar at both locations, with a mean H s of 0.85 m at Alderney and 0.89 m at Guernsey, and maximum values of 2.5 m at both locations. There is a wider spread of wave directions than at PTEC, but the largest waves come from between west and southwest at both locations.

3.2. Difference in Flow between Coupled and Uncoupled Runs

The flow power density is defined as P = 1 2 ρ | u | 3 . Figure 5 shows a scatter plot of the difference P u P c against P u , where the subscripts u and c denote estimates from the uncoupled and coupled models, respectively. The points are colored according to the direction of the flow, with the blue points indicating that the easterly component of the flow is positive and green points indicating that the easterly component is negative (although the directionality of the flow is different at each site, the sign of the easterly component can be used as an indicator of the flow direction for all three sites). A common trend is observed at the three sites. When the flow is easterly, the coupled model indicates an increase in the flow power compared to the uncoupled model.
Table 2 lists the mean power density from the uncoupled model (denoted P u ) for each site, broken down into times when the flow is easterly, westerly, and the average over all conditions. Due to the cubic relation between flow speed and power density, the small asymmetry in the peak flow speeds in each direction leads to larger changes in the power density. The pattern in the percentage difference in the flow power density from the coupled model, relative to the uncoupled model, is similar at each site. At PTEC, there is an increase of +7.0% in the power from the coupled model when the flow is easterly and a reduction of −8.4% when the flow is westerly. At Alderney, the figures are similar, with an increase and reduction of +7.0% and −9.6% for easterly and westerly flows, respectively, while at Guernsey the figures are +2.6% and −9.0%. Whether the overall mean power from the coupled model is higher or lower than from the uncoupled model, varies between sites. At PTEC, since the easterly flows have higher mean power density, the net result of running the coupled model is an increase in power of 0.7%. At Alderney, the situation is reversed, with a net reduction in power density from the coupled model of −2.5%. At Guernsey, despite the easterly flows having higher mean power density, the larger reduction in the power density for westerly flows in the coupled model leads to a net reduction of −1.5% overall.
As discussed in the previous subsection, for the three sites considered, when the current direction is westerly, it is more likely to be following the wave propagation direction, and, when the current is easterly, it is more likely to be opposing the wave direction. We now examine this in more detail. Figure 6 shows the difference in the flow speed from the uncoupled model, | u u | , to the coupled model, | u c | , against | u c | × sign ( u x , c ) (i.e., positive values on the abscissa indicates a positive easterly component of the flow). The color of each point indicates the concurrent value of significant wave height. A similar pattern is observed at the three sites. The uncoupled model tends to give larger flow speeds when the flow is westerly and smaller flow speeds when the flow is easterly. The magnitude of the difference is largest at low flow speeds, with the waves having decreasing influence with increasing flow speed. As would be expected, the largest differences between the coupled and uncoupled models tend to occur with the largest waves.
To assess the influence of the wave height on the difference in velocities, we can define a relative wave height as the component of the wave height in the direction of the current: H r e l = H s cos ( θ c θ w ) , where θ c and θ w are the current and wave directions (adjusted appropriately so that both are either ‘going to’ or ‘coming from’). Although H r e l does not have a concrete physical interpretation, the definition is intended to account for the potential misalignment between wave and current directions. Figure 7 shows the difference in the flow speeds between the uncoupled and coupled models against H r e l , with the color of the points indicating the flow speed from the coupled model, | u c | . A consistent pattern is observed between the three locations. When H r e l is negative (i.e., currents and waves are in opposing directions), the uncoupled model predicts larger flow speeds. The trend is reversed when H r e l is positive. As indicated in Figure 6, the difference between the coupled and uncoupled models is larger at low-flow speeds.

4. Analysis

The results presented in the previous section indicate that there is a strong correlation between the wave height, the relative direction between the waves and currents, and the difference in flow speeds computed by the coupled and uncoupled models. In this section, we analyze the relative importance of each mechanism by which the wave conditions influence the mean flow, to assess the relative importance of each contribution.

4.1. Stokes Drift

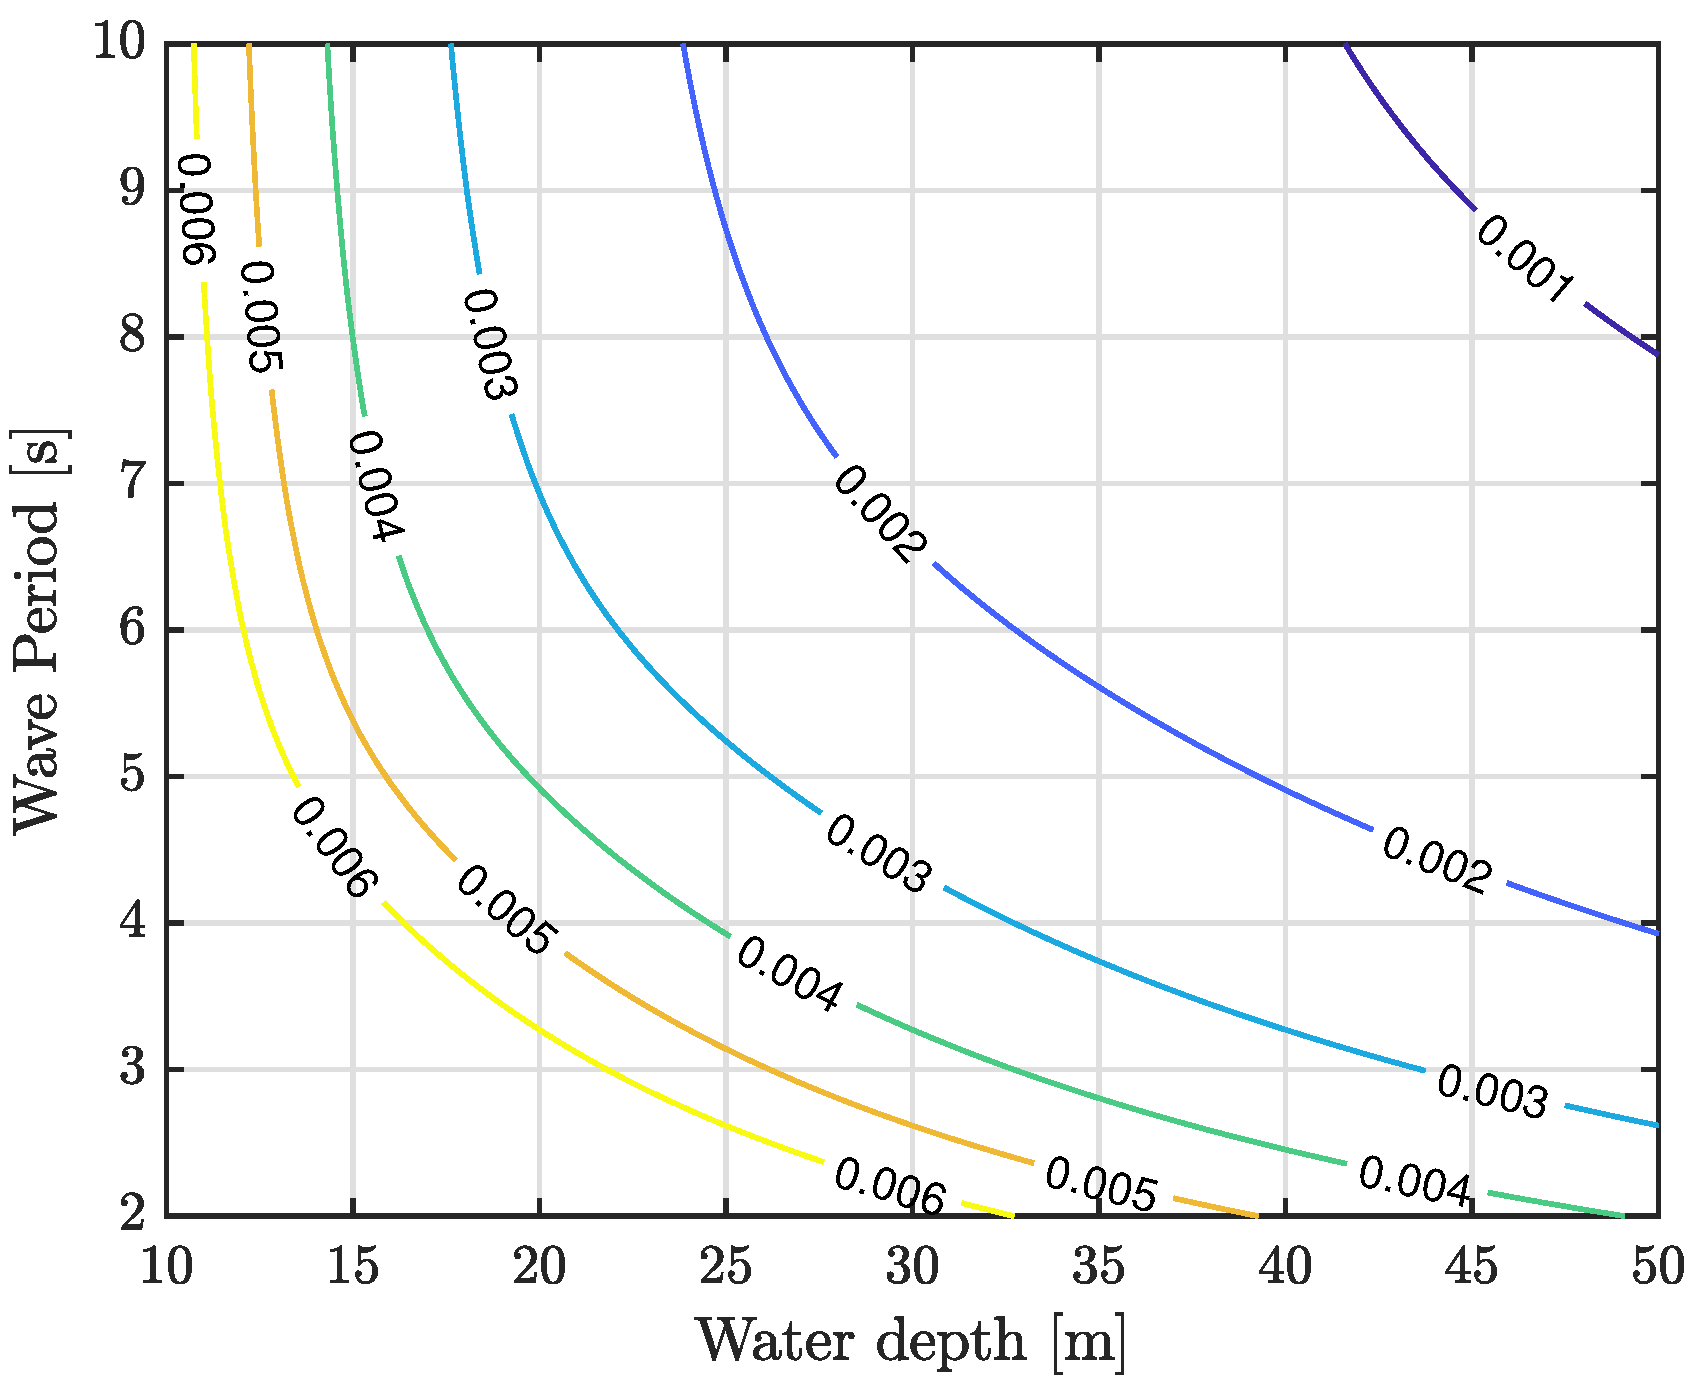
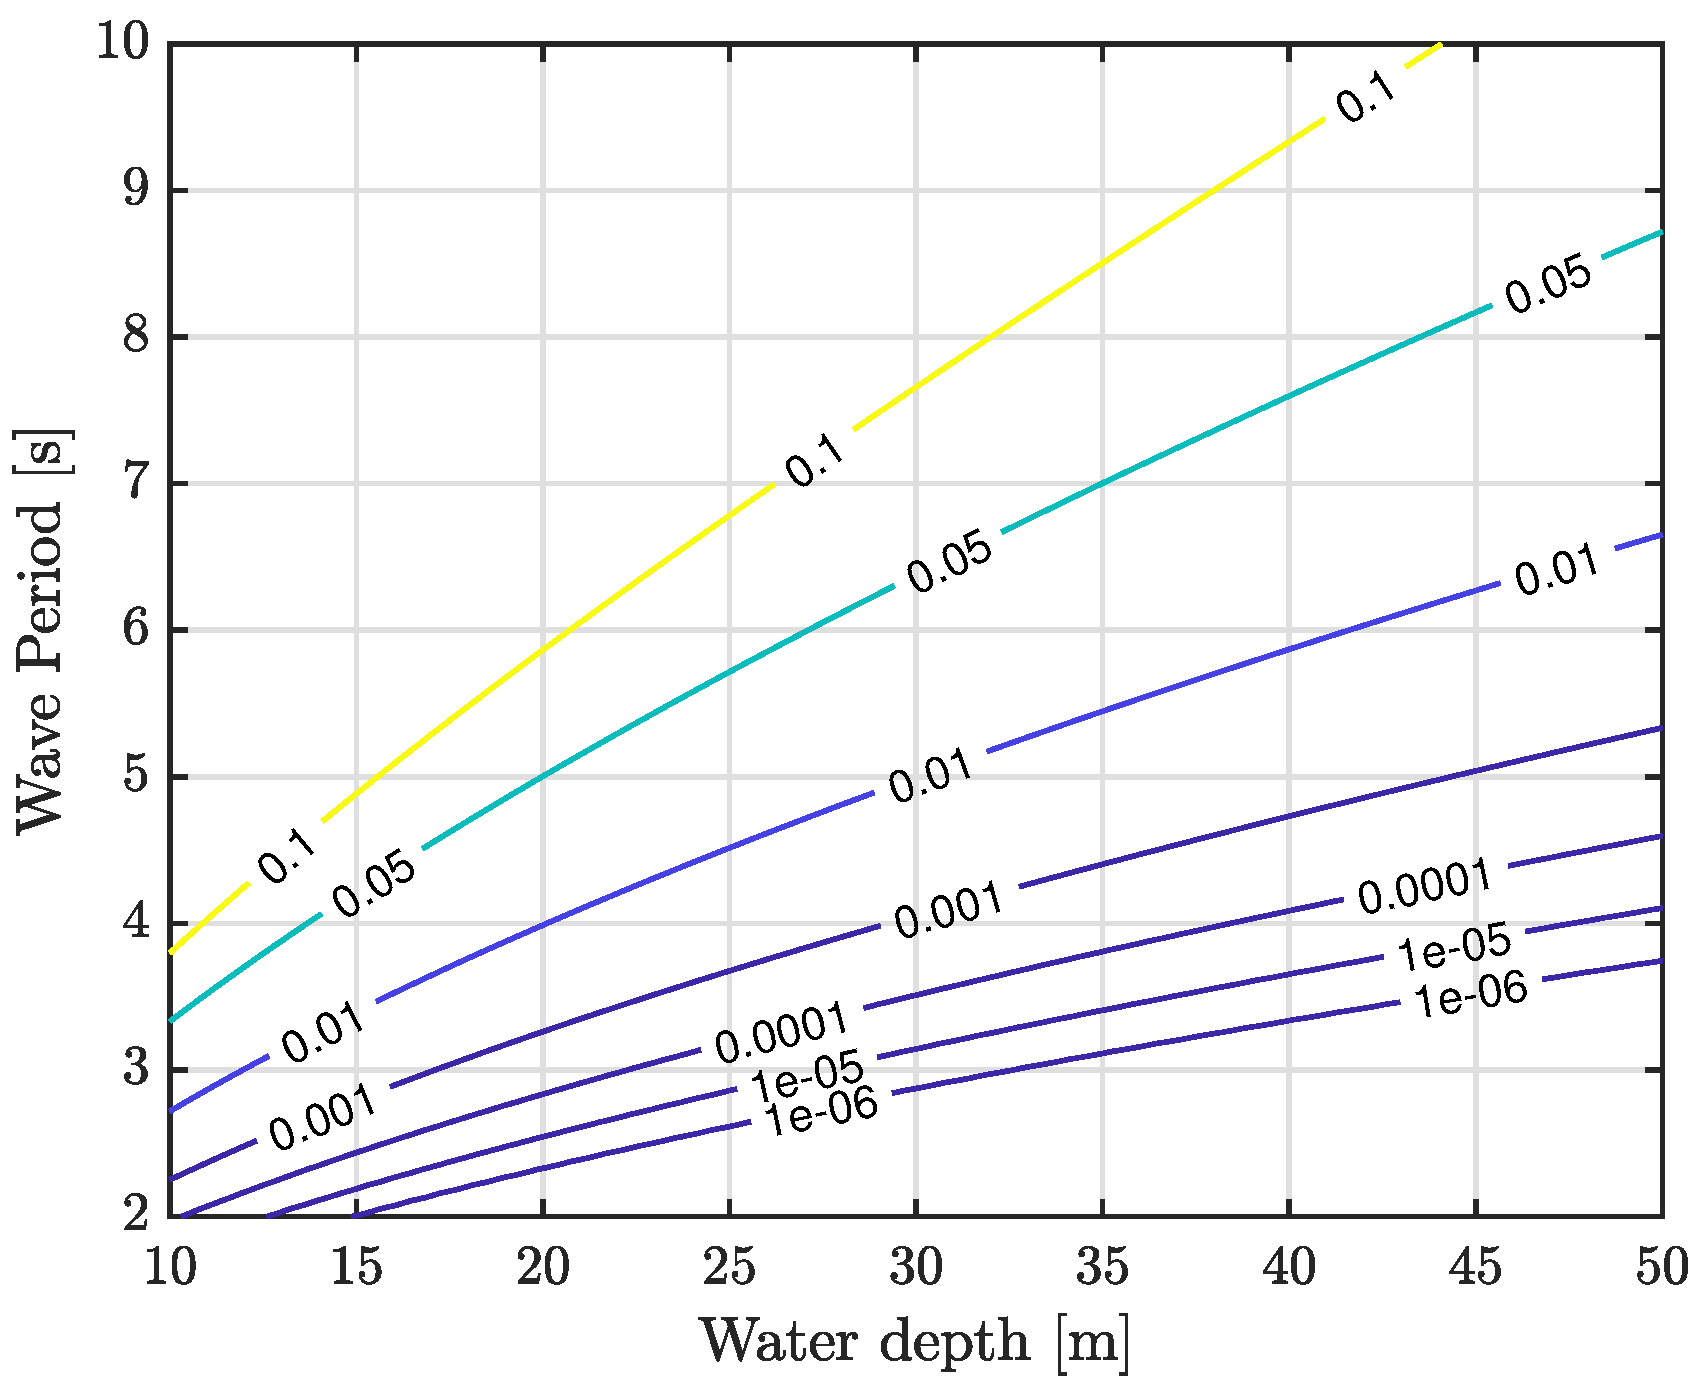
As Stokes drift is a second-order effect, the magnitude increases with the square of the wave height (see (3)). Normalized values of u S / H s 2 are shown in Figure 8 as a function of wave period and water depth. The value of u S / H s 2 decreases with both water depth and wave period. The normalized values are small in comparison to tidal currents at sites relevant for energy extraction. The sites under consideration in the present study have mean water depths in the range 30–50 m. For a sea state with H s = 3 m, T m = 6 s, and water depth h = 30 m, the depth-averaged Stokes drift current would be u S 0.02 m/s.
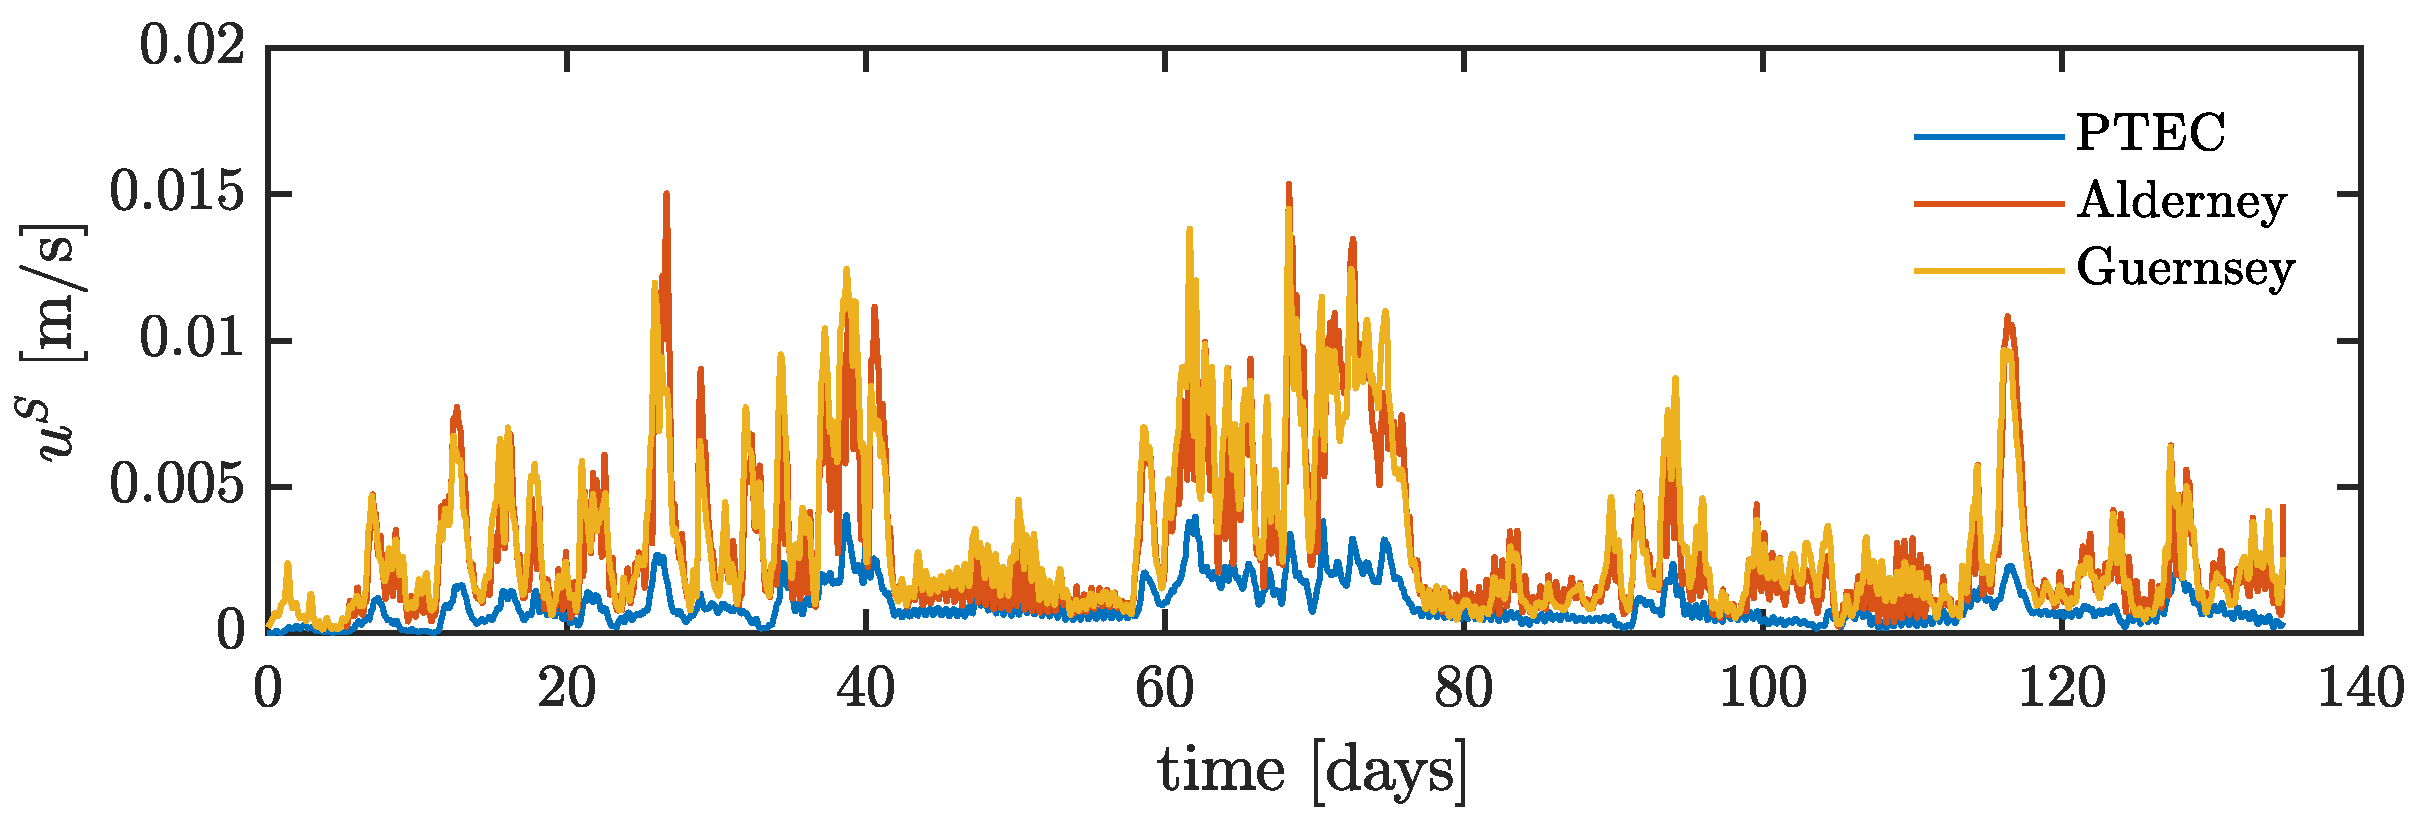
The depth-averaged Stoke’s drift current for the three sites, derived from the numerical model outputs, is shown in Figure 9. The peak values at Alderney and Guernsey are around 0.015 m/s and are lower still at PTEC. This confirms that depth averaged Stokes drift currents are two orders of magnitude smaller than the average flow speed and therefore are considered negligible in comparison to tidal currents at tidal energy sites.

4.2. Enhancement of the Bed Shear Stresses

To give an idea of the relative magnitudes of the bed shear stress due to waves and currents, we can combine (8) and (9) to consider the ratio
| τ w a v e | | τ c u r | = f w 2 g C 2 D 2 | u o r b | | u | 2
Since C 2 D 2 is proportional to the cube root of the water depth, the value does not change much over the tidal cycle. The bed friction coefficient f w is a nonlinear function of wave height, period, and water depth (see (10)). However, in the present simulations, the values of u o r b are small enough at the sites of interest that f w is always fixed at 0.3. Therefore, the dominant influence on the ratio | τ w a v e | / | τ c u r | is the ratio | u o r b | / | u | . Figure 10 shows values of | u o r b | / H s against water depth and wave period. For deeper water or shorter wave periods, the value decreases rapidly, implying that, for this range, the wave bed shear stress term is negligible.
Figure 11 shows scatter plots of concurrent values of | τ w a v e | against | τ c u r | , derived from the outputs of the coupled model. At PTEC, the values of | τ w a v e | are negligible, due to the short wave periods. At Alderney and Guernsey, the values are larger but still at least two orders of magnitude smaller than the values of | τ c u r | . Thus, we can conclude that enhancement of bed shear stress is unlikely to have an impact on the current conditions at the sites of interest.

4.3. Forcing by Radiation Stress Gradients

As discussed in Section 2.1.4, the two dissipation processes which drive currents in intermediate water depths are bottom friction and white-capping. The dissipation due to bottom friction is proportional to | u o r b | 2 (see (6)). Given the large relative water depths (i.e., the ratio of water depth to wave length) for the conditions in the present study, the dissipation due to bottom friction is negligible in comparison to the dissipation from white-capping.
From (5), it can be seen that the white-capping dissipation varies with the square of the wave height and the fourth power of the wave steepness. Since opposing currents (relative to the wave direction) will increase the wave steepness, the dissipation rate due to white-capping will increase strongly when waves are propagating against a current. Since the other mechanisms for waves influencing the mean currents are negligible for the sites considered, forcing from radiation stress due to white-capping appears to be the dominant mechanism. This is in agreement with results shown in Figure 7, which show that, when the current direction is in opposition to the wave direction, the coupled model gives larger flow speeds.

5. Conclusions

This study investigated the modeled wave and current conditions at three tidal energy sites in the English Channel using a Delft3D Flexible Mesh simulation coupled with a SWAN wave model. All sites were subject to strong flows and were also exposed to significant wave action. Comparisons of model outputs from the coupled and uncoupled models showed that inclusion of wave effects in the flow model resulted in a small but non-zero difference in the flow speed and flow power. For the sites considered in the study, differences of ±5–10% in the mean flow power density were found when waves were included in the model. The differences were largest at low flow speeds. They were also strongly correlated with the flow direction, with the largest differences observed when the wave direction is directly aligned with or opposing the current. It was found that the differences between the coupled and uncoupled models are largest at low flow speeds, and they depend on whether the wave direction is with or against the current. Across the whole tidal cycle, these effects largely cancel out. However, due to the asymmetry in the flow speeds between the flood and ebb phases of the tide, the net differences in the mean power were non-zero, since gains or losses in the flood tide were not completely offset by gains or losses in the ebb tide. For the sites considered here, the net differences were between 0.7% and 2.5%. In general, the effect of waves on the mean flow power will be site specific, and they depend on the relative directions between the waves and currents and the asymmetry in the flow.
The results show that the dominant wave–current interaction process, forcing from radiation stress gradients, caused by dissipation of wave energy from white-capping. This process is strongly linked to wave–current interactions, where opposing currents cause waves to steepen, resulting in increased white-capping.
Enhancement of bed shear stress and dissipation from bottom friction were shown to have negligible effect, since the combination of short-period wave conditions and relatively deep water meant that the wave orbital velocities on the sea bed were mostly very small. However, at shallower sites or when longer waves are present, these processes may be important (see [14]).
It was also found that the depth-averaged Stokes drift currents were negligible in comparison to the tidal currents. Stokes Drift may have a non-negligible impact at sites with lower tidal flow. Given the impact is two orders of magnitude below the average flow speed at the sites of interest, this effect is not expected to be significant for tidal stream energy purposes.
This study provided results from a 2D depth-averaged simulation of the domain. Future work should consider expanding the scope of the simulation to a 3D model. 3D processes include further wave–current interaction mechanisms which are not considered in the 2D schemes and may suggest different results, especially considering the intricate bathymetry of the English Channel region. Future work will include detailed model validation, once field data are available from project partners, enabling to estimate the tidal resource characteristics at tidal sites of interest across the channel. It will also allow quantifying the effect of waves on the tidal resource for proposed project installations.
Although the effect of waves on the mean flow power density was relatively small at the sites considered here, it is important to note that waves have other important effects that will influence the feasibility of a tidal energy project. Turbines may shut down at times of large waves in order to reduce structural loading, which will reduce the time available for power generation. It is also important to assess the influence of waves on structural loading, as the increased cyclic loading could affect both fatigue and ultimate loads. Finally, the combination of wave and current conditions will affect site accessibility and should be assessed when estimating operations and maintenance windows.

Author Contributions

Data curation, J.H.; Formal analysis, E.B.L.M.; Funding acquisition, P.R.T.; Methodology, J.H. and E.B.L.M.; Software, J.H.; Supervision, H.C.M.S.; Writing—original draft, J.H. and E.B.L.M.; Writing—review & editing, I.G.C.A., H.C.M.S. and P.R.T. All authors have read and agreed to the published version of the manuscript.

Funding

This work was funded as part of the Tidal Stream Industry Energiser Project (TIGER), a European Union INTERREG V A France (Channel) England Research and Innovation Programme, which is co-financed by the European Regional Development Fund (ERDF).

Institutional Review Board Statement

Not Applicable.

Informed Consent Statement

Not Applicable.

Data Availability Statement

Data available on request due to restrictions eg privacy or ethical The data presented in this study are available on request from the corresponding author. The data are not publicly available due to commercial sensitivity.

Conflicts of Interest

The authors declare no conflict of interest.

References

  1. Crown Estate. UK Wave and Tidal Key Resource Areas Project—Technical Methodology Report; Technical Report; The Crown Estate: London, UK, 2013. [Google Scholar]
  2. Ocean Energy Europe. Ocean Energy: Key Trends and Statistics 2020; Technical Report; OEE: Brussles, Belgium, 2021. [Google Scholar]
  3. Draper, S.; Adcock, T.A.; Borthwick, A.G.; Houlsby, G.T. Estimate of the tidal stream power resource of the Pentland Firth. Renew. Energy 2014, 63, 650–657. [Google Scholar] [CrossRef]
  4. Hashemi, R.; Neill, S.; Davies, G. A numerical study of wave and current fields around Ramsey Island-tidal energy resource assessment. In Proceedings of the XIXth TELEMAC-MASCARET User Conference 2012, Oxford, UK, 18–19 October 2012; pp. 135–141. [Google Scholar]
  5. Coles, D.S.; Blunden, L.S.; Bahaj, A.S. Assessment of the energy extraction potential at tidal sites around the Channel Islands. Energy 2017, 124, 171–186. [Google Scholar] [CrossRef]
  6. Sutherland, G.; Foreman, M.; Garrett, C. Tidal current energy assessment for Johnstone Strait, Vancouver Island. Proc. Inst. Mech. Eng. Part A J. Power Energy 2007, 221, 147–157. [Google Scholar] [CrossRef]
  7. Blanchfield, J.; Garrett, C.; Rowe, A.; Wild, P. Tidal stream power resource assessment for Masset Sound, Haida Gwaii. Proc. Inst. Mech. Eng. Part A J. Power Energy 2008, 222, 485–492. [Google Scholar] [CrossRef]
  8. Karsten, R.H.; McMillan, J.M.; Lickley, M.J.; Haynes, R.D. Assessment of tidal current energy in the Minas Passage, Bay of Fundy. Proc. Inst. Mech. Eng. Part A J. Power Energy 2008, 222, 493–507. [Google Scholar] [CrossRef]
  9. Fairley, I.; Evans, P.; Wooldridge, C.; Willis, M.; Masters, I. Evaluation of tidal stream resource in a potential array area via direct measurements. Renew. Energy 2013, 57, 70–78. [Google Scholar] [CrossRef]
  10. Thiébaut, M.; Sentchev, A. Tidal stream resource assessment in the Dover Strait (eastern English Channel). Int. J. Mar. Energy 2016, 16, 262–278. [Google Scholar] [CrossRef]
  11. Lewis, M.; Neill, S.; Robins, P.; Hashemi, M. Resource assessment for future generations of tidal-stream energy arrays. Energy 2015, 83, 403–415. [Google Scholar] [CrossRef] [Green Version]
  12. Campbell, R.; Martinez, A.; Letetrel, C.; Rio, A. Methodology for estimating the French tidal current energy resource. Int. J. Mar. Energy 2017, 19, 256–271. [Google Scholar] [CrossRef]
  13. Lewis, M.J.; Neill, S.P.; Hashemi, M.R.; Reza, M. Realistic wave conditions and their influence on quantifying the tidal stream energy resource. Appl. Energy 2014, 136, 495–508. [Google Scholar] [CrossRef] [Green Version]
  14. Hashemi, M.R.; Neill, S.P.; Robins, P.E.; Davies, A.G.; Lewis, M.J. Effect of waves on the tidal energy resource at a planned tidal stream array. Renew. Energy 2015, 75, 626–639. [Google Scholar] [CrossRef] [Green Version]
  15. Wiberg, P.L.; Sherwood, C.R. Calculating wave-generated bottom orbital velocities from surface-wave parameters. Comput. Geosci. 2008, 34, 1243–1262. [Google Scholar] [CrossRef]
  16. González-Santamaría, R.; Zou, Q.; Pan, S.; Padilla-Hernandez, R. Modelling wave-tide interactions at a wave farm in the southwest of England. In Proceedings of the Coastal Engineering Conference. American Society of Civil Engineers (ASCE), Shanghai, China, 30 June–5 July 2010; p. 34. [Google Scholar] [CrossRef] [Green Version]
  17. Lewis, M.J.; Palmer, T.; Hashemi, M.R.; Robins, P.; Saulter, A.; Brown, J.; Lewis, H.; Neill, S. Wave-tide interaction modulates nearshore wave height. Ocean. Dyn. 2019, 69, 367–384. [Google Scholar] [CrossRef] [Green Version]
  18. ORE Catapult. Wave and Tidal Energy Yield Uncertainty: Literature Review and Reference Document; Technical Report; ORE Catapult: Glasgow, UK, 2015. [Google Scholar]
  19. O’Cathain, M.; Stock-Williams, C.; Carnus, T. Wave & Tidal Energy Production Estimates: Converting Resource Uncertainties into Energy Uncertainties. In Proceedings of the European Wave and Tidal Energy Conference, Aalborg, Denmark, 2–5 September 2013; 2013. [Google Scholar]
  20. Shah, S.; Buckland, H.; Thies, P.R.; Bruce, T. Combining Tidal Energy Yield Estimates. In Proceedings of the Asian Wave and Tidal Energy Conference, Singapore, 25–27 October 2016. [Google Scholar]
  21. Deltares. Delft3D-FLOW: User Manual; Technical Report; Deltares: Delft, The Netherlands, 2021. [Google Scholar]
  22. TUDelft. SWAN: Scientific and Technical Documentation; Technical Report; TU Delft: Delft, The Netherlands, 2010. [Google Scholar]
  23. Deltares. Delft3D—Flexible Mesh Technical Reference Manual; Technical Report; Deltares: Delft, The Netherlands, 2018. [Google Scholar]
  24. Kernkamp, H.W.; Van Dam, A.; Stelling, G.S.; De Goede, E.D. Efficient scheme for the shallow water equations on unstructured grids with application to the Continental Shelf. Ocean. Dyn. 2011, 61, 1175–1188. [Google Scholar] [CrossRef]
  25. Martyr-Koller, R.C.; Kernkamp, H.W.; van Dam, A.; van der Wegen, M.; Lucas, L.V.; Knowles, N.; Jaffe, B.; Fregoso, T.A. Application of an unstructured 3D finite volume numerical model to flows and salinity dynamics in the San Francisco Bay-Delta. Estuarine Coast. Shelf Sci. 2017, 192, 86–107. [Google Scholar] [CrossRef]
  26. Power Technology. EMEC, PTEC to Develop Large-Scale Tidal Energy Site in UK; Verdict Media Limited. Available online: https://powerlinks.news/emec/news/and-ptec-to-develop-large-scale-tidal-energy-site-in-uk (accessed on 17 June 2021).
  27. Perpetuus; Royal HaskoningDHV. Environmental Impact Statement; Technical Report; Royal HaskoningDHV: Amersfoort, The Netherlands, 2016. [Google Scholar]
  28. Bahaj, A.S.; Myers, L. Analytical estimates of the energy yield potential from the Alderney Race (Channel Islands) using marine current energy converters. Renew. Energy 2004, 29, 1931–1945. [Google Scholar] [CrossRef]
  29. Atlantis, S. Raz Blanchard|Tidal Projects|SIMEC Atlantis Energy. Available online: https://simecatlantis.com/projects/raz-blanchard-alderney/ (accessed on 17 June 2021).
  30. Blunden, L.S.; Bahaj, A.S. Initial evaluation of tidal stream energy resources at Portland Bill, UK. Renew. Energy. Pergamon 2006, 31, 121–132. [Google Scholar] [CrossRef]
  31. EDINA Marine Digimap Service. Arcsecond Gridded Bathymetry [ASC Geospatial Data]; EDINA: Edinburgh, UK, 2013. [Google Scholar]
  32. SHOM. Service Hydrographique et Océanographique de la Marine; SHOM: Brest, France, 2016. [Google Scholar]
  33. GEBCO Bathymetric Compilation Group 2020. The GEBCO_2020 Grid—A Continuous Terrain Model of the Global Oceans and Land; British Oceanographic Data Centre, National Oceanography Centre, NERC: Southampton, UK, 2020. [Google Scholar] [CrossRef]
  34. Egbert, G.D.; Erofeeva, S.Y. Efficient Inverse Modeling of Barotropic Ocean Tides. J. Atmos. Ocean. Technol. 2002, 19, 183–204. [Google Scholar] [CrossRef] [Green Version]
  35. Booij, N.; Ris, R.C.; Holthuijsen, L.H. A third-generation wave model for coastal regions 1. Model description and validation. J. Geophys. Res. Ocean. 1999, 104, 7649–7666. [Google Scholar] [CrossRef] [Green Version]
  36. ECMWF. Copernicus Climate Change Service (C3S); Climate Data Store (CDS), European Centre for Medium Range Weather Forecasts: Reading, UK, 2021; Available online: https://cds.climate.copernicus.eu/ (accessed on 17 June 2021).
  37. Van Nieuwkoop, J.C.C.; Smith, H.C.M.; Smith, G.H.; Johanning, L. Wave resource assessment along the Cornish coast (UK) from a 23-year hindcast dataset validated against buoy measurements. Renew. Energy 2013, 58, 1–14. [Google Scholar] [CrossRef]
  38. Kutupoğlu, V.; Çakmak, R.E.; Akpınar, A.; van Vledder, G.P. Setup and evaluation of a SWAN wind wave model for the Sea of Marmara. Ocean. Eng. 2018, 165, 450–464. [Google Scholar] [CrossRef]
  39. Silva, D.; Soares, C.G. Assessment of the wave power resource at Madeira archipelago with the SWAN model. In Developments in Renewable Energies Offshore: Proceedings of the 4th International Conference on Renewable Energies Offshore (RENEW 2020, Lisbon, Portugal, 12–15 October 2020; CRC Press: Boca Raton, FL, USA, 2020; p. 45. [Google Scholar]
  40. ECMWF. 2D Wave Specta (ERA5); Climate Data Store (CDS), European Centre for Medium Range Weather Forecasts: Reading, UK, 2021; Available online: https://www.ecmwf.int/en/forecasts/documentation-and-support/2d-wave-spectra (accessed on 17 June 2021).
  41. Soulsby, R.L.; Hamm, L.; Klopman, G.; Myrhaug, D.; Simons, R.R.; Thomas, G.P. Wave-current interaction within and outside the bottom boundary layer. Coast. Eng. 1993, 21, 41–69. [Google Scholar] [CrossRef]
  42. Groeneweg, J. Wave-Current Interactions in a Generalized Lagrangian mean Formulation. Ph.D. Thesis, Delft University of Technology, Delft, The Netherlands, 1999. [Google Scholar]
  43. Fredsøe, J.; Deigaard, R. Mechanics of Coastal Sediment Transport; Advanced Series on Ocean Engineering; World Scientific: Singapore, 1992; Volume 3. [Google Scholar] [CrossRef]
  44. Dingemans, M.W.; Radder, A.C.; De Vriend, H.J. Computation of the driving forces of wave-induced currents. Coast. Eng. 1987, 11, 539–563. [Google Scholar] [CrossRef]
  45. Komen, G.J.; Hasselmann, S.; Hasselmann, K. On the Existence of a Fully Developed Wind-Sea Spectrum. J. Phys. Oceanogr. 1984, 14, 1271–1285. [Google Scholar] [CrossRef]
  46. Hasselmann, K.; Barnett, T.; Bouws, E.; Carlson, H.; Cartwright, D.; Enke, K.; Ewing, J.; Gienapp, H.; Hasselmann, D.; Kruseman, P.; et al. Measurements of wind-wave growth and swell decay during the Joint North Sea Wave Project (JONSWAP). Ergaenzungsheft Zur Dtsch. Hydrogr. Z. Reihe A 1973, 12, 1–95. [Google Scholar]
  47. Fredsøe, J. Turbulent Boundary Layer in Wave-current Motion. J. Hydraul. Eng. 1984, 110, 1103–1120. [Google Scholar] [CrossRef]
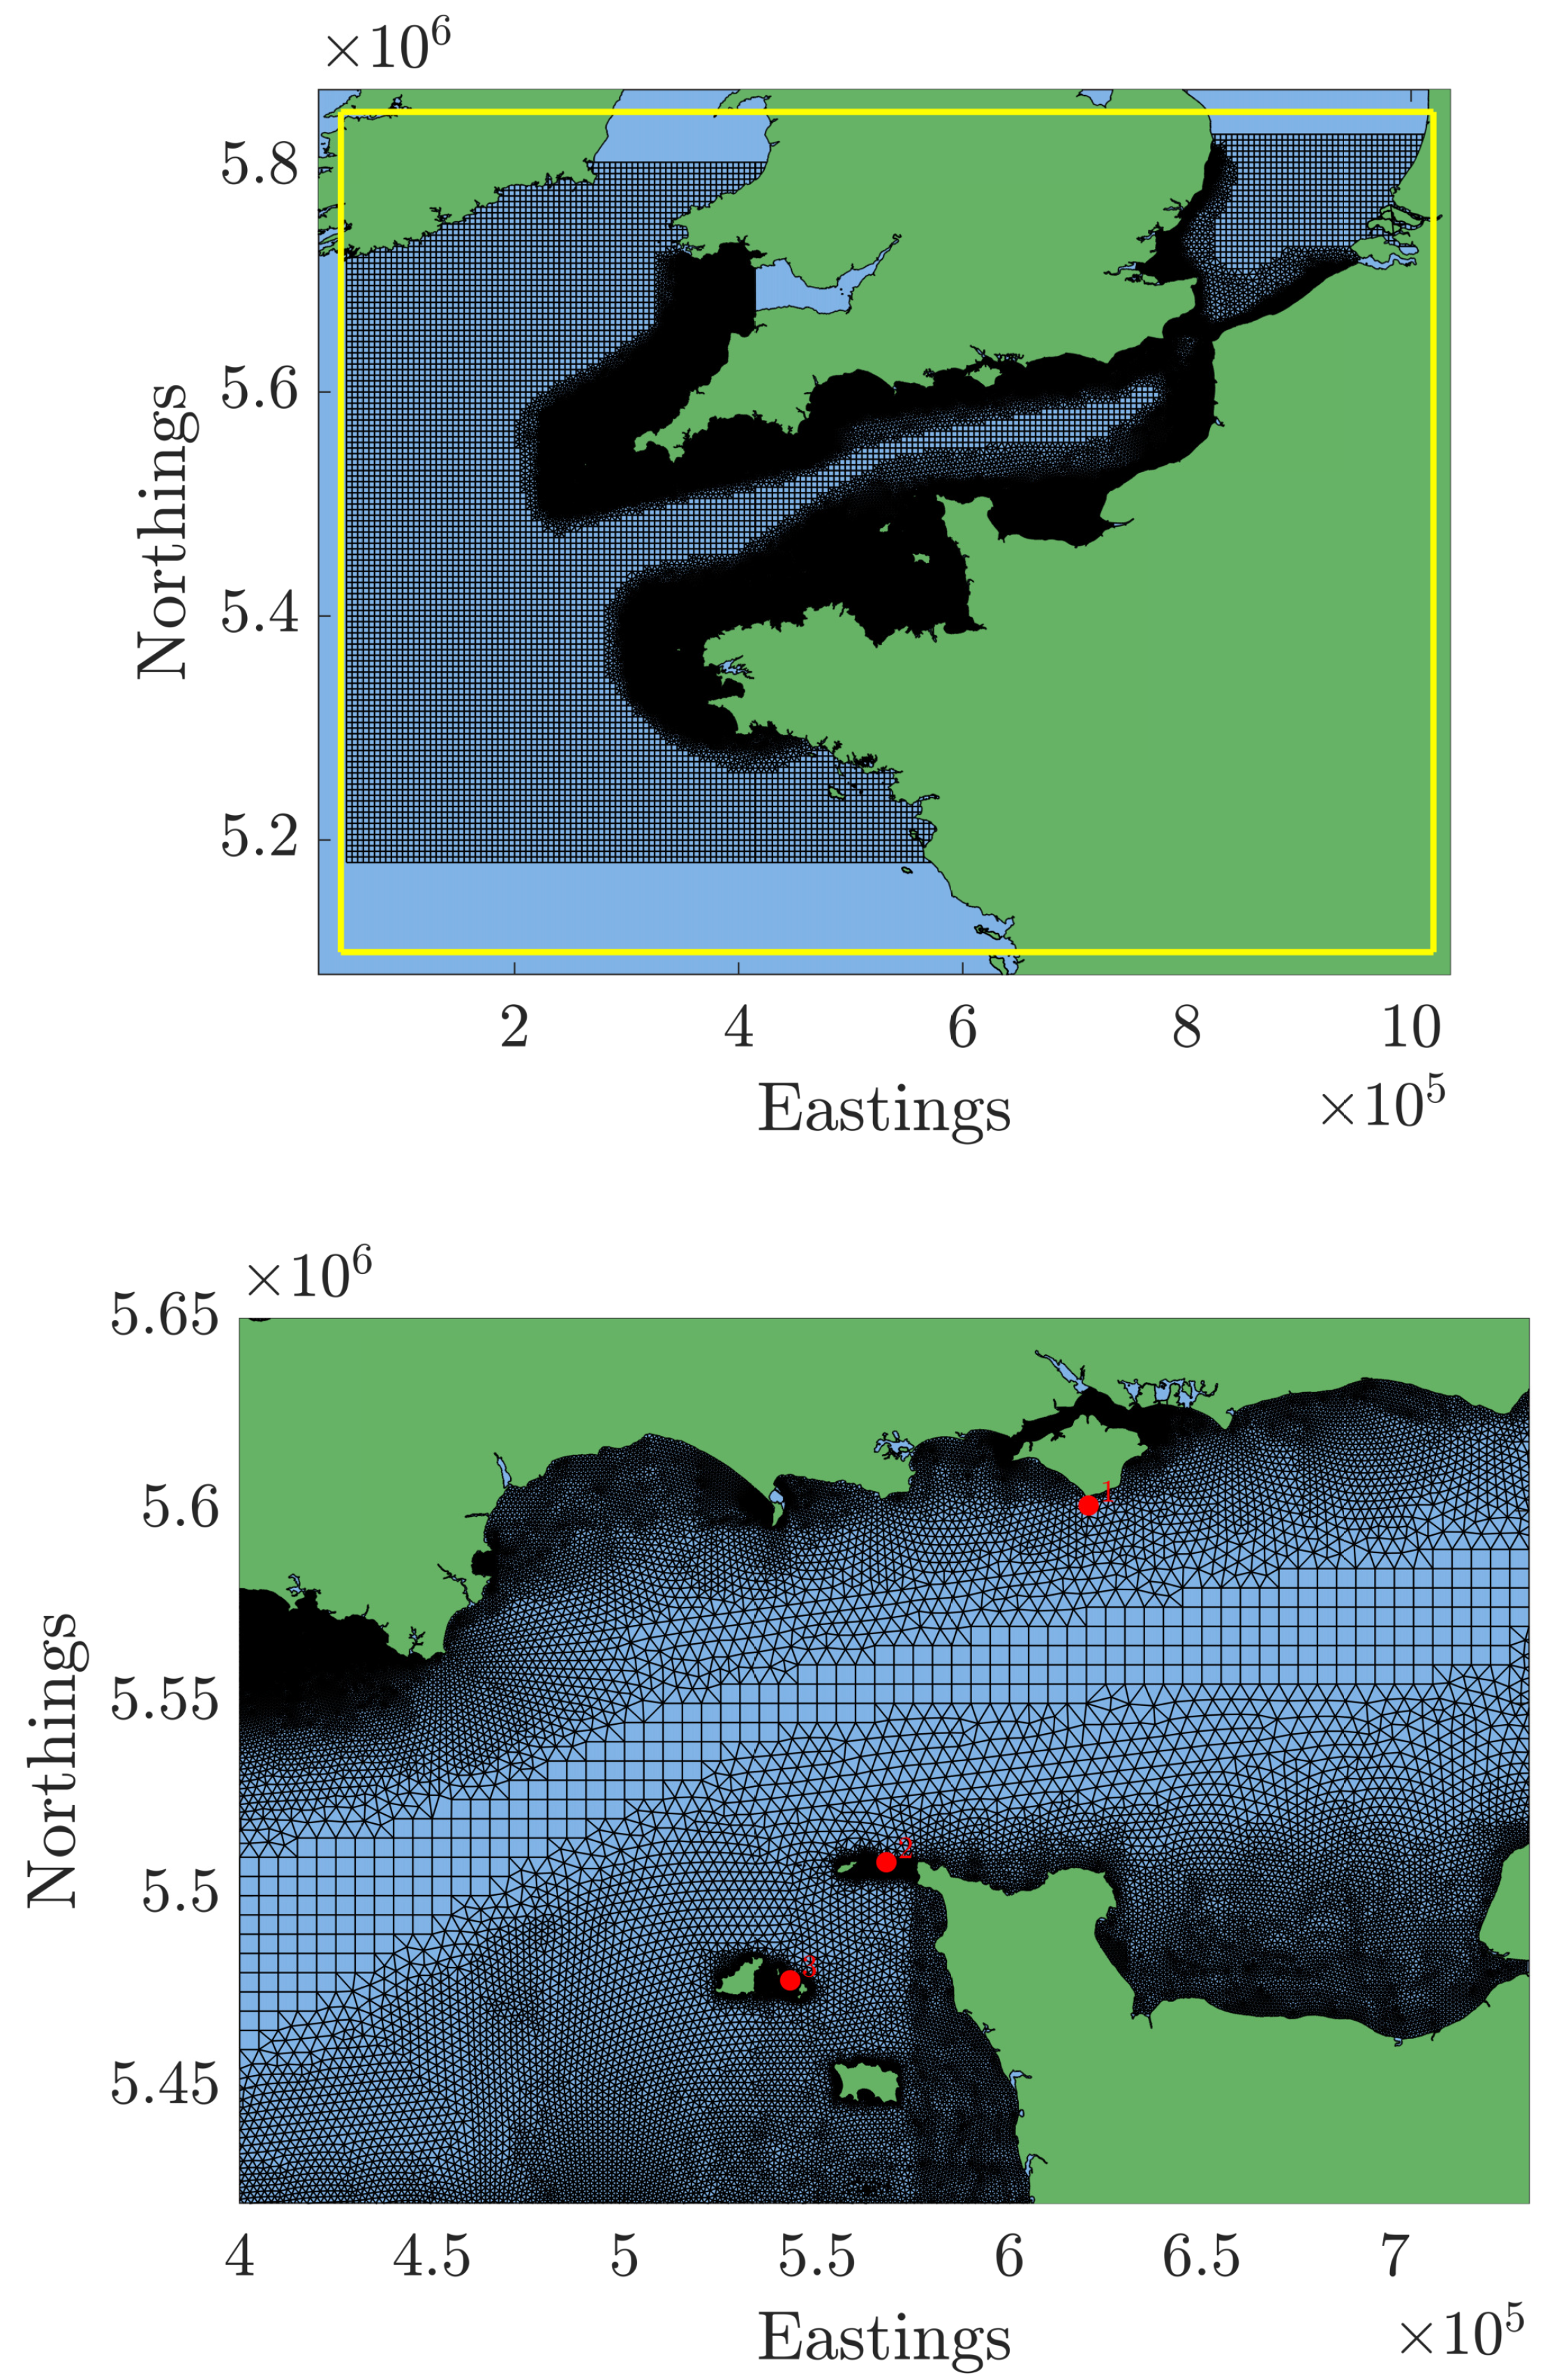
Figure 1. The D-Flow FM computational mesh: (top) the entire grid; and (bottom) a subsection of the domain showing the location of the three points of interest: 1, :PTEC; 2, Alderney Race; 3, Guernsey. The extent of the SWAN model domain is shown as the yellow box.
Energies 14 03625 g001
Figure 2. Seabed bathymetry across the domain using in the models.
Energies 14 03625 g002
Figure 3. Example of the harmonic constituents used to calculate the water level forcing at the boundary. The plot represents the southwest corner of the grid.
Energies 14 03625 g003
Figure 4. Summary of wave and current conditions: (Top row) scatter plots of significant wave height, H s , against mean absolute wave period (as measured in a fixed frame of reference); (Middle row) wave rose; and (Bottom row) current speed versus direction. Note that wave directions are ‘coming from’ and current directions are ‘going to’.
Energies 14 03625 g004
Figure 5. Difference in flow power from uncoupled and coupled models against flow power from uncoupled model. Blue points indicate positive easterly components while green points indicate negative easterly components.
Energies 14 03625 g005
Figure 6. Difference in current speed from uncoupled and coupled models against current speed from the coupled model (positive when easterly component is positive). The color of points indicates concurrent significant wave height.
Energies 14 03625 g006
Figure 7. Difference in current speed from uncoupled and coupled models against relative significant wave height. The color of points indicates concurrent current speed from coupled model.
Energies 14 03625 g007
Figure 8. Contours of normalized Stokes drift current u S / H s 2 (m 1 s 1 ) as a function of water depth and wave period.
Energies 14 03625 g008
Figure 9. Depth-averaged Stokes drift current speeds derived from the wave model for the three sites.
Energies 14 03625 g009
Figure 10. Contours of | u o r b | / H s against water depth and wave period.
Energies 14 03625 g010
Figure 11. Scatter plots of wave bed shear stress against current bed shear stress.
Energies 14 03625 g011
Table 2. Mean values of flow power density from uncoupled model, P u , and percentage difference in flower power density from coupled model, P c , relative to uncoupled model.
EasterlyWesterlyOverall
P u ( P c P u ) / P u P u ( P c P u ) / P u P u ( P c P u ) / P u
[kW/m 2 ] [kW/m 2 ] [kW/m 2 ]
PTEC4.7+7.0%3.5−8.4%4.1+0.7%
Alderney5.9+7.0%8.4−9.6%7.1−2.5%
Guernsey2.0+2.6%1.5−9.0%1.8−1.5%
Publisher’s Note: MDPI stays neutral with regard to jurisdictional claims in published maps and institutional affiliations.