Article

Using Value Stream Mapping to Eliminate Waste: A Case Study of a Steel Pipe Manufacturer

1
Faculty of Production Engineering, Warsaw University of Technology, 00-662 Warsaw, Poland
2
Grenoble Institute of Technology, 46 Avenue Félix Viallet, 38031 Grenoble, France
*
Author to whom correspondence should be addressed.
Energies 2021, 14(12), 3527; https://doi.org/10.3390/en14123527
Submission received: 19 May 2021 / Revised: 10 June 2021 / Accepted: 11 June 2021 / Published: 14 June 2021

Abstract

:
Value Stream Mapping (VSM) is a popular and easy tool for visualizing production processes in enterprise. It allows one to eliminate or reduce waste, i.e., activities that do not create added value for the customer. The versatility of this tool allows it to be used in industry. There are theoretical, methodological, and practical aspects encountered by practitioners in developing Value Stream Mapping (VSM) for a specific manufacturing industry, but they are not fully resolved and require clarification. This paper presents a case study that describes the use of Value Stream Mapping (VSM) in the production of steel pipes. Relevant data from this process were collected and analyzed at the start of the project. An initial process was mapped, associated waste was identified, and then future processes were mapped. The financial results were estimated. Consequently, the process was improved, and savings were achieved. The article should constitute the basis for further development of an improvement project for a selected company aimed at improving the areas identified in a given article.

1. Introduction

Value Stream Mapping (VSM) was established in 1980 at a Toyota assembly plant. After that, Taiichi Ohno and Shigeo Shingo developed a waste visualization tool called Material and information flow mapping. In 1978, for the first time, Taiichi Ohno presented the classification of muda, i.e., wastes occurring in an enterprise [1,2,3,4]. VSM was created as a solution to indicate the areas of waste present in the company and help in the development of possible improvements in order to reduce and eliminate mud [5,6,7,8].
Currently, more and more enterprises feel the need to constantly improve the effects of their activities [9,10,11]. Improving processes in the enterprise becomes necessary for a given organization to be able to survive and stay in the market and ensure its development [12,13,14,15]. It is always possible to improve or design a better production system than the existing one. Increasingly, companies are opting for a “lean” approach as a countermeasure to waste elimination. Currently, the Value Stream Mapping (VSM) method enables continuity in the flow of information and materials in production processes [6,7,8]. Another important feature of a given tool is its versatility, thanks to which it finds its application in many areas where we deal with adding value, especially in the manufacturing industry [16,17,18,19].
The steel products manufacturing sector is one of the largest areas in the global industry. This sector supplies semi-finished and finished products to almost all sectors of the industry (automotive, aviation, transport, and machinery), which is why it is closely related to others. The industry is highly cyclical and dependent on industries such as automotive, aviation, and construction and energy. In 2016, the global market for metal products was estimated at EUR 233,5949 billion. In the same year, the metal sector counted 388,000 business entities. In terms of the number of jobs, the metal industry was second only to the food industry. World leaders in the steel production market are concentrated in the countries of Asia, the European Union, the United States, and Russia [20]. The total production of steel products in selected countries is presented in Table 1.
The production of steel pipes is part of the steel products industry. These products are used especially in the construction, petrochemical, chemical, and automotive sectors, and in the production of furniture and household appliances. In addition, thanks to the development of new technologies, it becomes possible to produce new products with a modified design. The production of steel pipes is characterized by a relatively small amount of waste that is not recyclable and the need to use machines with a specialized structure and dimensions, or the technology used in the plant. Production takes place mainly with the use of electricity [26,27,28].
The article focuses on the analysis of a company producing precise steel pipes of various dimensions for upholstered furniture. The trend in the production of upholstered furniture, especially sofas, is a departure from wooden materials in load-bearing structures and replacing them with a lighter steel structure. This proves the high probability of an increase in the demand for steel pipes in the near future. The main problem noticed in the company is cost increases in the context of changing demand, as long production cycles are not conducive to profitable production. They increase the frozen capital in the form of inventories at various stages of production and translate into lower flexibility and efficiency of the production system. The implementation plan developed using the Value Stream Mapping (VSM) method in the form of a future state map aims to adapt the production pace to the customer ordering pace. The paper presents a very practical approach to VSM, not seen in scientific articles, supported by a detailed analysis of the company and the production process. We hope that the aspects discussed in the article will serve as help for the analyzed enterprise and in enterprises with a similar profile in the metal industry.
Value Stream Mapping, like any other method, has its limitations. Getting to know them allows you to choose the contexts and possibilities of applying the method, and thus obtain its reliability. An example of such an approach is the analysis conducted by A.J. Dal Forno, et al. [29]. The authors reviewed the literature on Value Stream Mapping, as a result of which 57 scientific articles on practical and theoretical considerations about this method were selected. On this basis, they created a catalog of problems/limitations for the use of the method, which boils down to three dimensions:
(a)
Process problems (lack of process definition and documentation, company departmental organizational structure, inadequate layout, unbalanced processes, low integration of information technology between areas, lack of process stability);
(b)
Product problems (lack of continuous flow, inappropriate tools);
(c)
People problems (lack of people training, staff turnover). For each group of problems, guidelines have been developed to reduce the limitations and increase the effectiveness of VSM.
Appropriate preparation at an early stage of VSM implementation extends the possibilities of using this method, making it relatively universal and reliable. Examples of reliability based on the right choice of application context can also be found in the literature presenting case studies [30].
Research conducted by the authors on the application of VSM in a company producing gas ball valves confirm the high efficiency of the planning and production process was obtained thanks to the application of the method in a specific situation. The high effectiveness of the method is also confirmed by the cases of use in the foundry industry [31] or in the ceramics industry, described in the literature [32].
The paper is structured as follows: Its first part is an introduction. Section two explains research methodology. The third part presents the case study. The fourth part presents the financial analysis. The final part of the work presents the conclusions.

2. Research Methodology

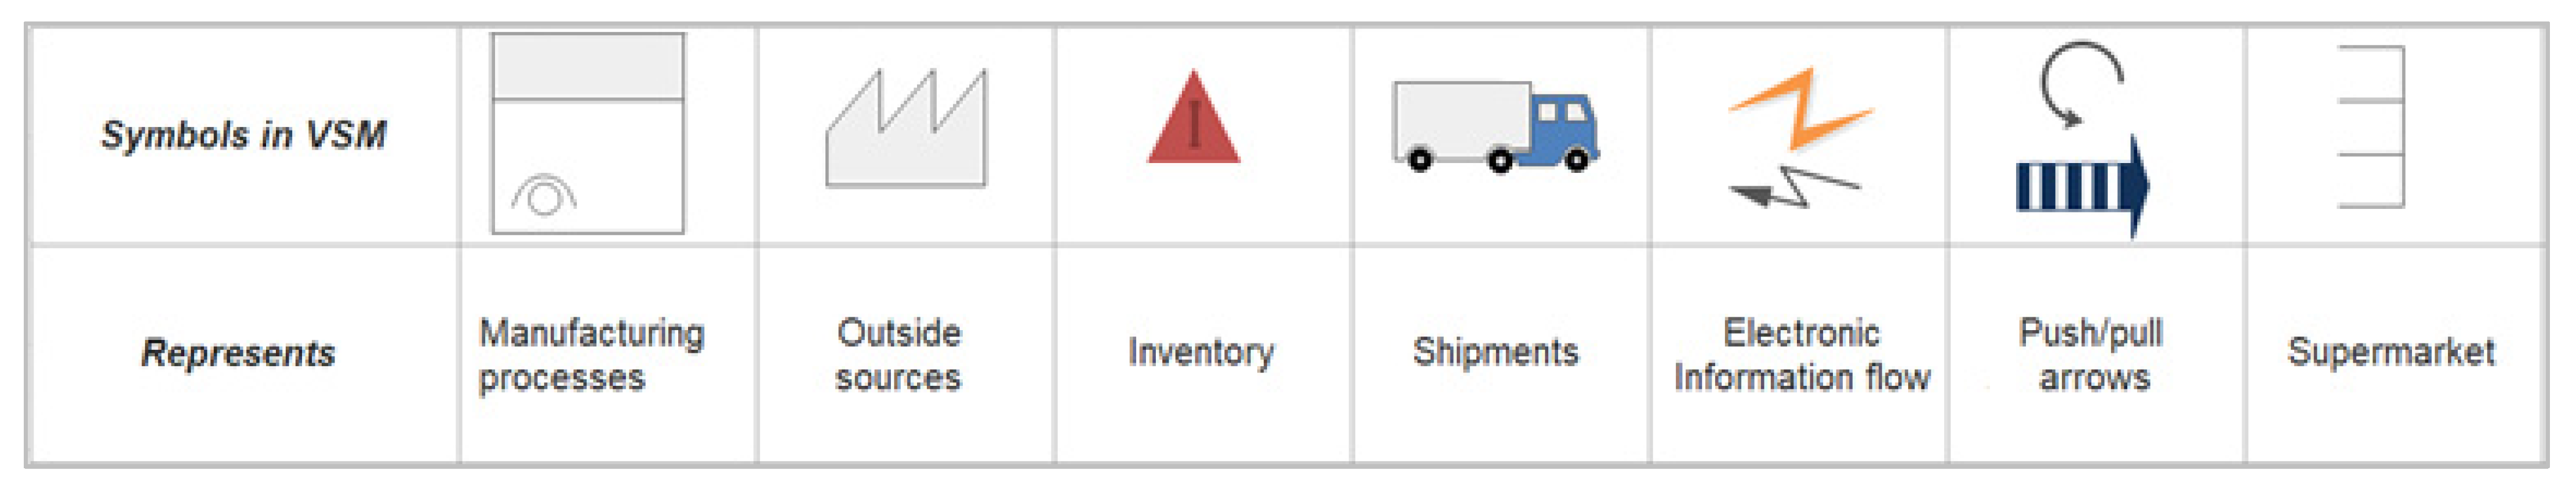
2.1. Value Stream Mapping

The aim of the paper is to use Value Stream Mapping to analyze and improve the production process of precision steel pipes of various dimensions for upholstered furniture. These actions are taken to reduce waste and thus increase the quality and efficiency of the production process. Practical applications of Value Stream Mapping were presented.
Research question formulated in this article are:
  • How does Value Stream Mapping help identify areas for improvement in a steel pipe manufacturing company?
  • How can better production results be achieved while maintaining the same human and time expenditure?
  • What are the limitations of Value Stream Mapping application based on the example of a steel pipe manufacturing company?
  • In order to achieve the aim set out in the paper and answer the research question, we adopted the following research methodology covering:
1.
Analysis of the enterprise. This stage provides basic information about the enterprise. At this stage, consultations with the company’s engineering staff were carried out, which contributed to a better familiarization with the functioning of the company.
2.
Observation of the production process and data collection. The aim of this phase of the research was to observe the working day, to get acquainted with the stages of the pipe production process, to collect data, and analyze them. It was the first step to developing a current state map. The implementation of this stage took place in August 2020, in the steel pipe production plant. We managed to obtain data on the number of machines and operators, machine changeover time, number of changes, production volume, and level of shortages. The following techniques were also used at this stage:
  • A photo of the working day that allowed to determine the working time standard;
  • Individual interviews—examination of operators regarding the course of the production process at individual work stations;
  • Time measurement with a stopwatch—the time of performing individual operations was measured three times, and then the average was taken, which was used in the VSM method. In addition, our own measurements of machine changeovers were also performed;
    In addition, at this stage, consultations with the company’s engineering staff were carried out, which contributed to better familiarization with the production process.
3.
Development of a preliminary map of the present state and a preliminary map of the future. Based on the information obtained, preliminary maps were worked out and improvement measures were proposed;
4.
Expert consultations with the engineering staff of the enterprise. The consultation consisting of three sessions contributed to the improvement of the maps developed at an earlier stage. During the discussion of potential improvements, the suggested proposals were critically assessed by the engineering staff. The discussion allowed for the selection of proposed improvements and the definition of the most important improvements in terms of the cost-effectiveness of the implementation;
5.
Development of a map of the present and future state. At this stage, the best solution was found. On the basis of information and data obtained directly in the production hall and consultations with operators and the company’s engineering staff, maps of the present and future state have been developed. The developed maps reflect the paths traveled by information and products through the production system, taking into account the supplier and the customer. Thanks to the proposed improvements, waste is eliminated, and the time needed for the product to pass through the production system is shortened.

2.2. Lean Manufacturing Metrics (KPI’s)

Performance indicators play an important role in the analysis of the value stream. They are the basis for making decisions about the production system. Their use in VSM is essential to identify and eliminate activities that do not add value. Research shows that when developing VSM maps, it is necessary to use measures such as:
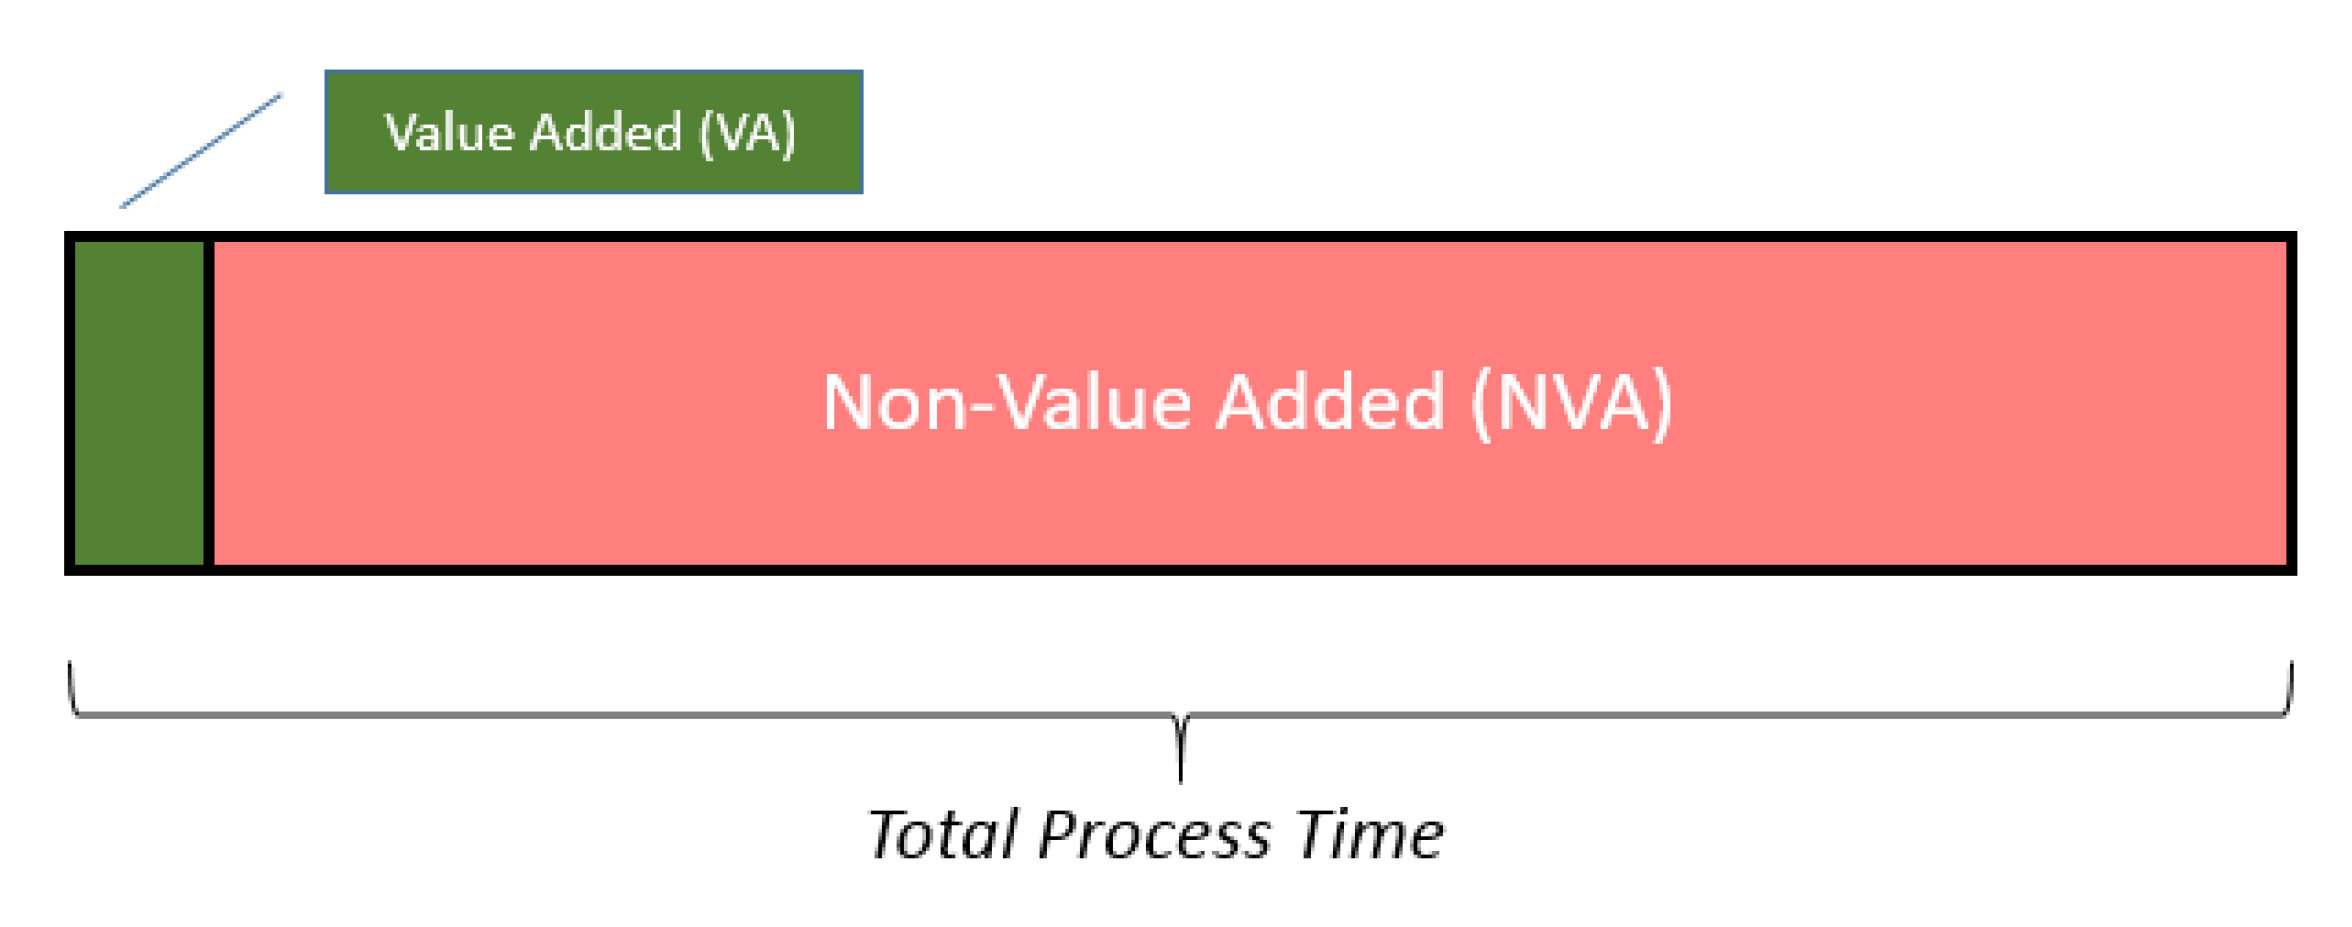
  • Lead Time is the time a product flows through a value stream or process from start to finish, that is, from the moment the raw material is delivered to the end customer.
L e a d   T i m e = D e l i v e r y   d a t e D a t e   o f   o r d e r
  • Value-Added Time (Figure 1) is the duration of operations during which the end product value is added (Value) for which the customer is willing to pay.
  • Cycle Time—period of time during which the input material goes through all production operations and is transformed into a finished product.
C y c l e   T i m e = W o r k i n g   p e r i o d + B r e a k   p e r i o d
The working period includes the duration of technological operations, the duration of control operations, the duration of maintenance, and the duration of transport. On the other hand, the break period is defined as all breaks resulting from the organization of the production process, such as waiting time in warehouses, waiting for the release of a workstation, and breaks resulting from the organization of the working day, namely shift breaks, non-working days, and other breaks.
  • Tact Time is the frequency with which a product should be produced in order to meet customer demand. The tact time can be determined using the formula below:
T a c t   T i m e = A v a i l a b l e   t i m e   C u s t o m e r   d e m a n d
Additionally, the Overall Equipment Effectiveness (OEE) index was calculated. This indicator was used because it is easy to understand and implement. Additionally, they are consistent with the goals and procedures of the analyzed enterprise.

3. The Case Study

3.1. Company Analysis

The analyzed enterprise produces precision steel pipes of various dimensions for upholstered furniture. In 2020, the company produced 10,000 tons of metal products with a total value of EUR 8 million. Currently, the plant employs 82 people. The production in the enterprise takes place in a one-shift system and is divided into two lines:
  • Metal slitting line cutting line—work takes place 5 days a week, and the shift lasts 8 h (8:00–16:00); during the shift there are two breaks, one for 30 min and one for 10 min;
  • Bending and electric welding line—work takes place 7 days a week, and the shift lasts 12 h (8:00–20:00); there are four breaks during the shift: Two 30-min and two 15-min.
The implementation of such a work system results from the specificity of the operation of devices installed on the lines. Another reason is that the cutting operation progresses much faster than in the welding operation.
The raw material for the production of pipes in this plant is cold rolled steel rolls. The headquarters and warehouses of the main supplier of steel rolls are far away from the analyzed enterprise. The average time of order fulfillment for a material in a metallurgical plant is three months. Therefore, the company prepares annual demand forecasts, which are reviewed every six months. Orders for steel rolls are placed once a month.
The company’s customers place orders for the next month no later than on the 25th of the previous month. Verification of orders is possible every day. The estimated monthly demand for the plant’s production is about 700 tons, while deliveries to customers are made daily by trucks with a capacity of 20 tons
Production orders for individual departments are generated based on the received customer orders, the level of inter-operational stocks, the level of stocks of finished products, and the expected level of shortages. The company uses the world-famous concepts of Kaizen, 7 Strat Sheet, 5S, and others.

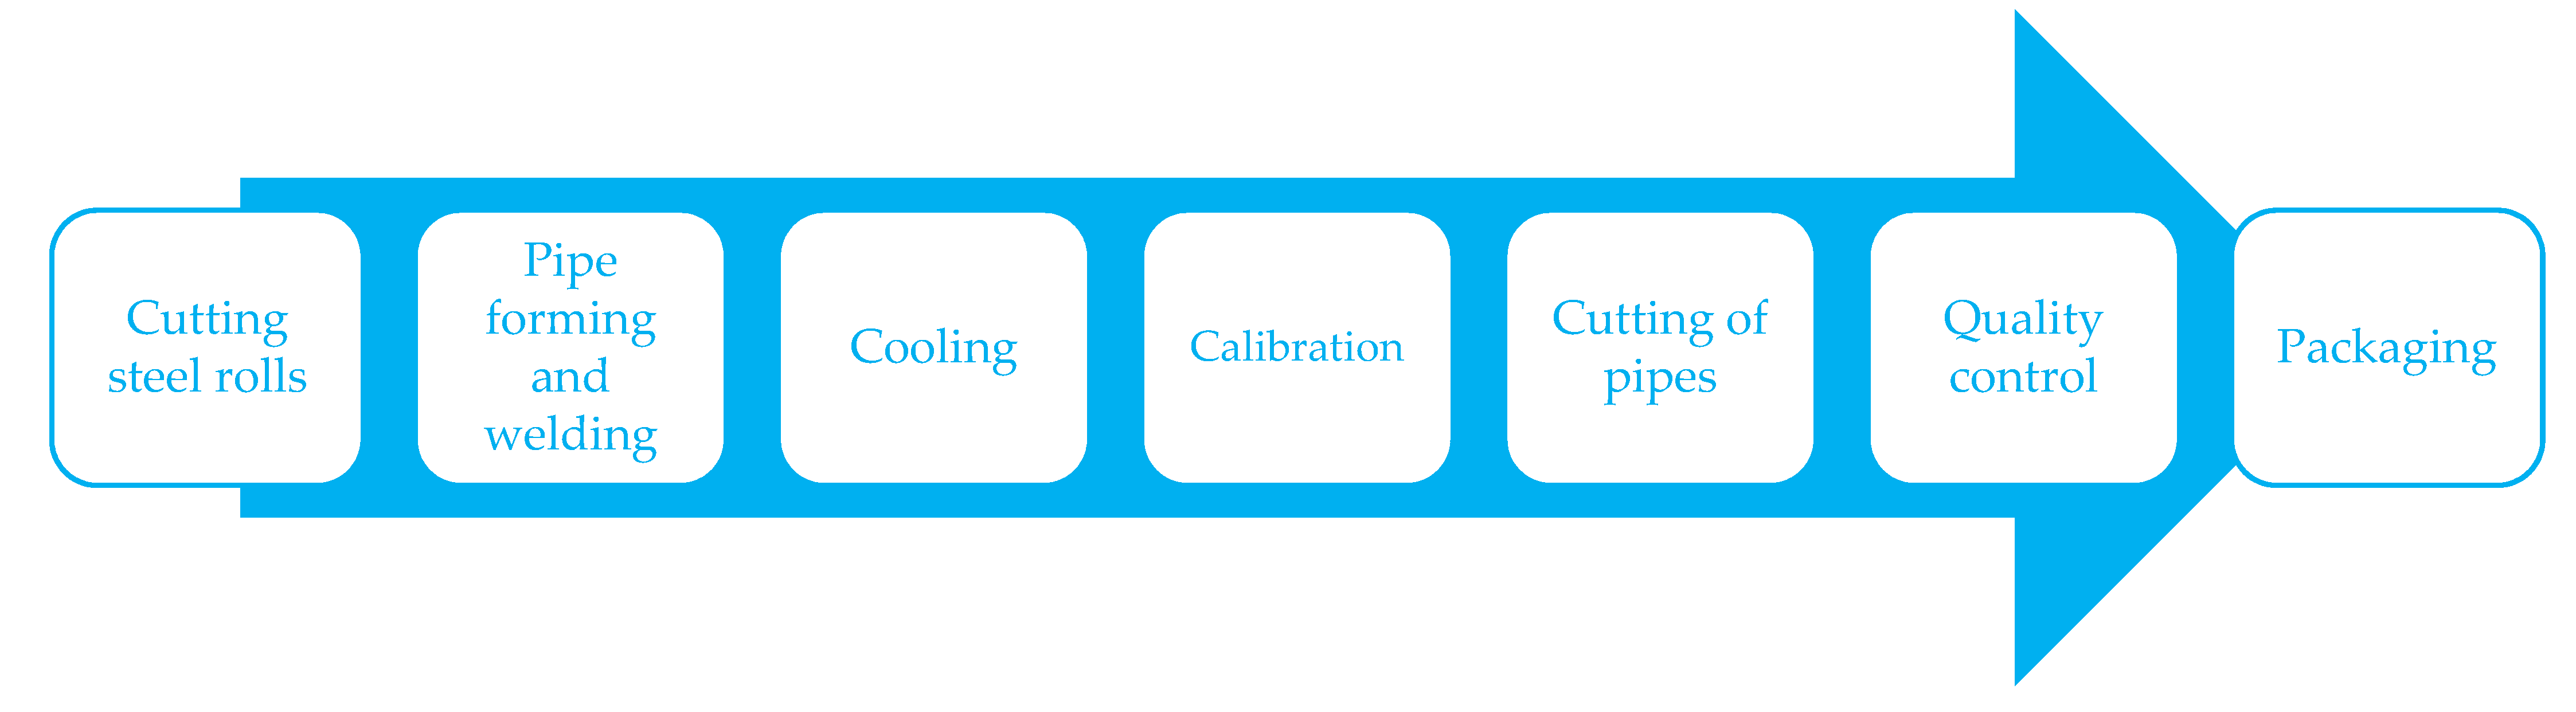
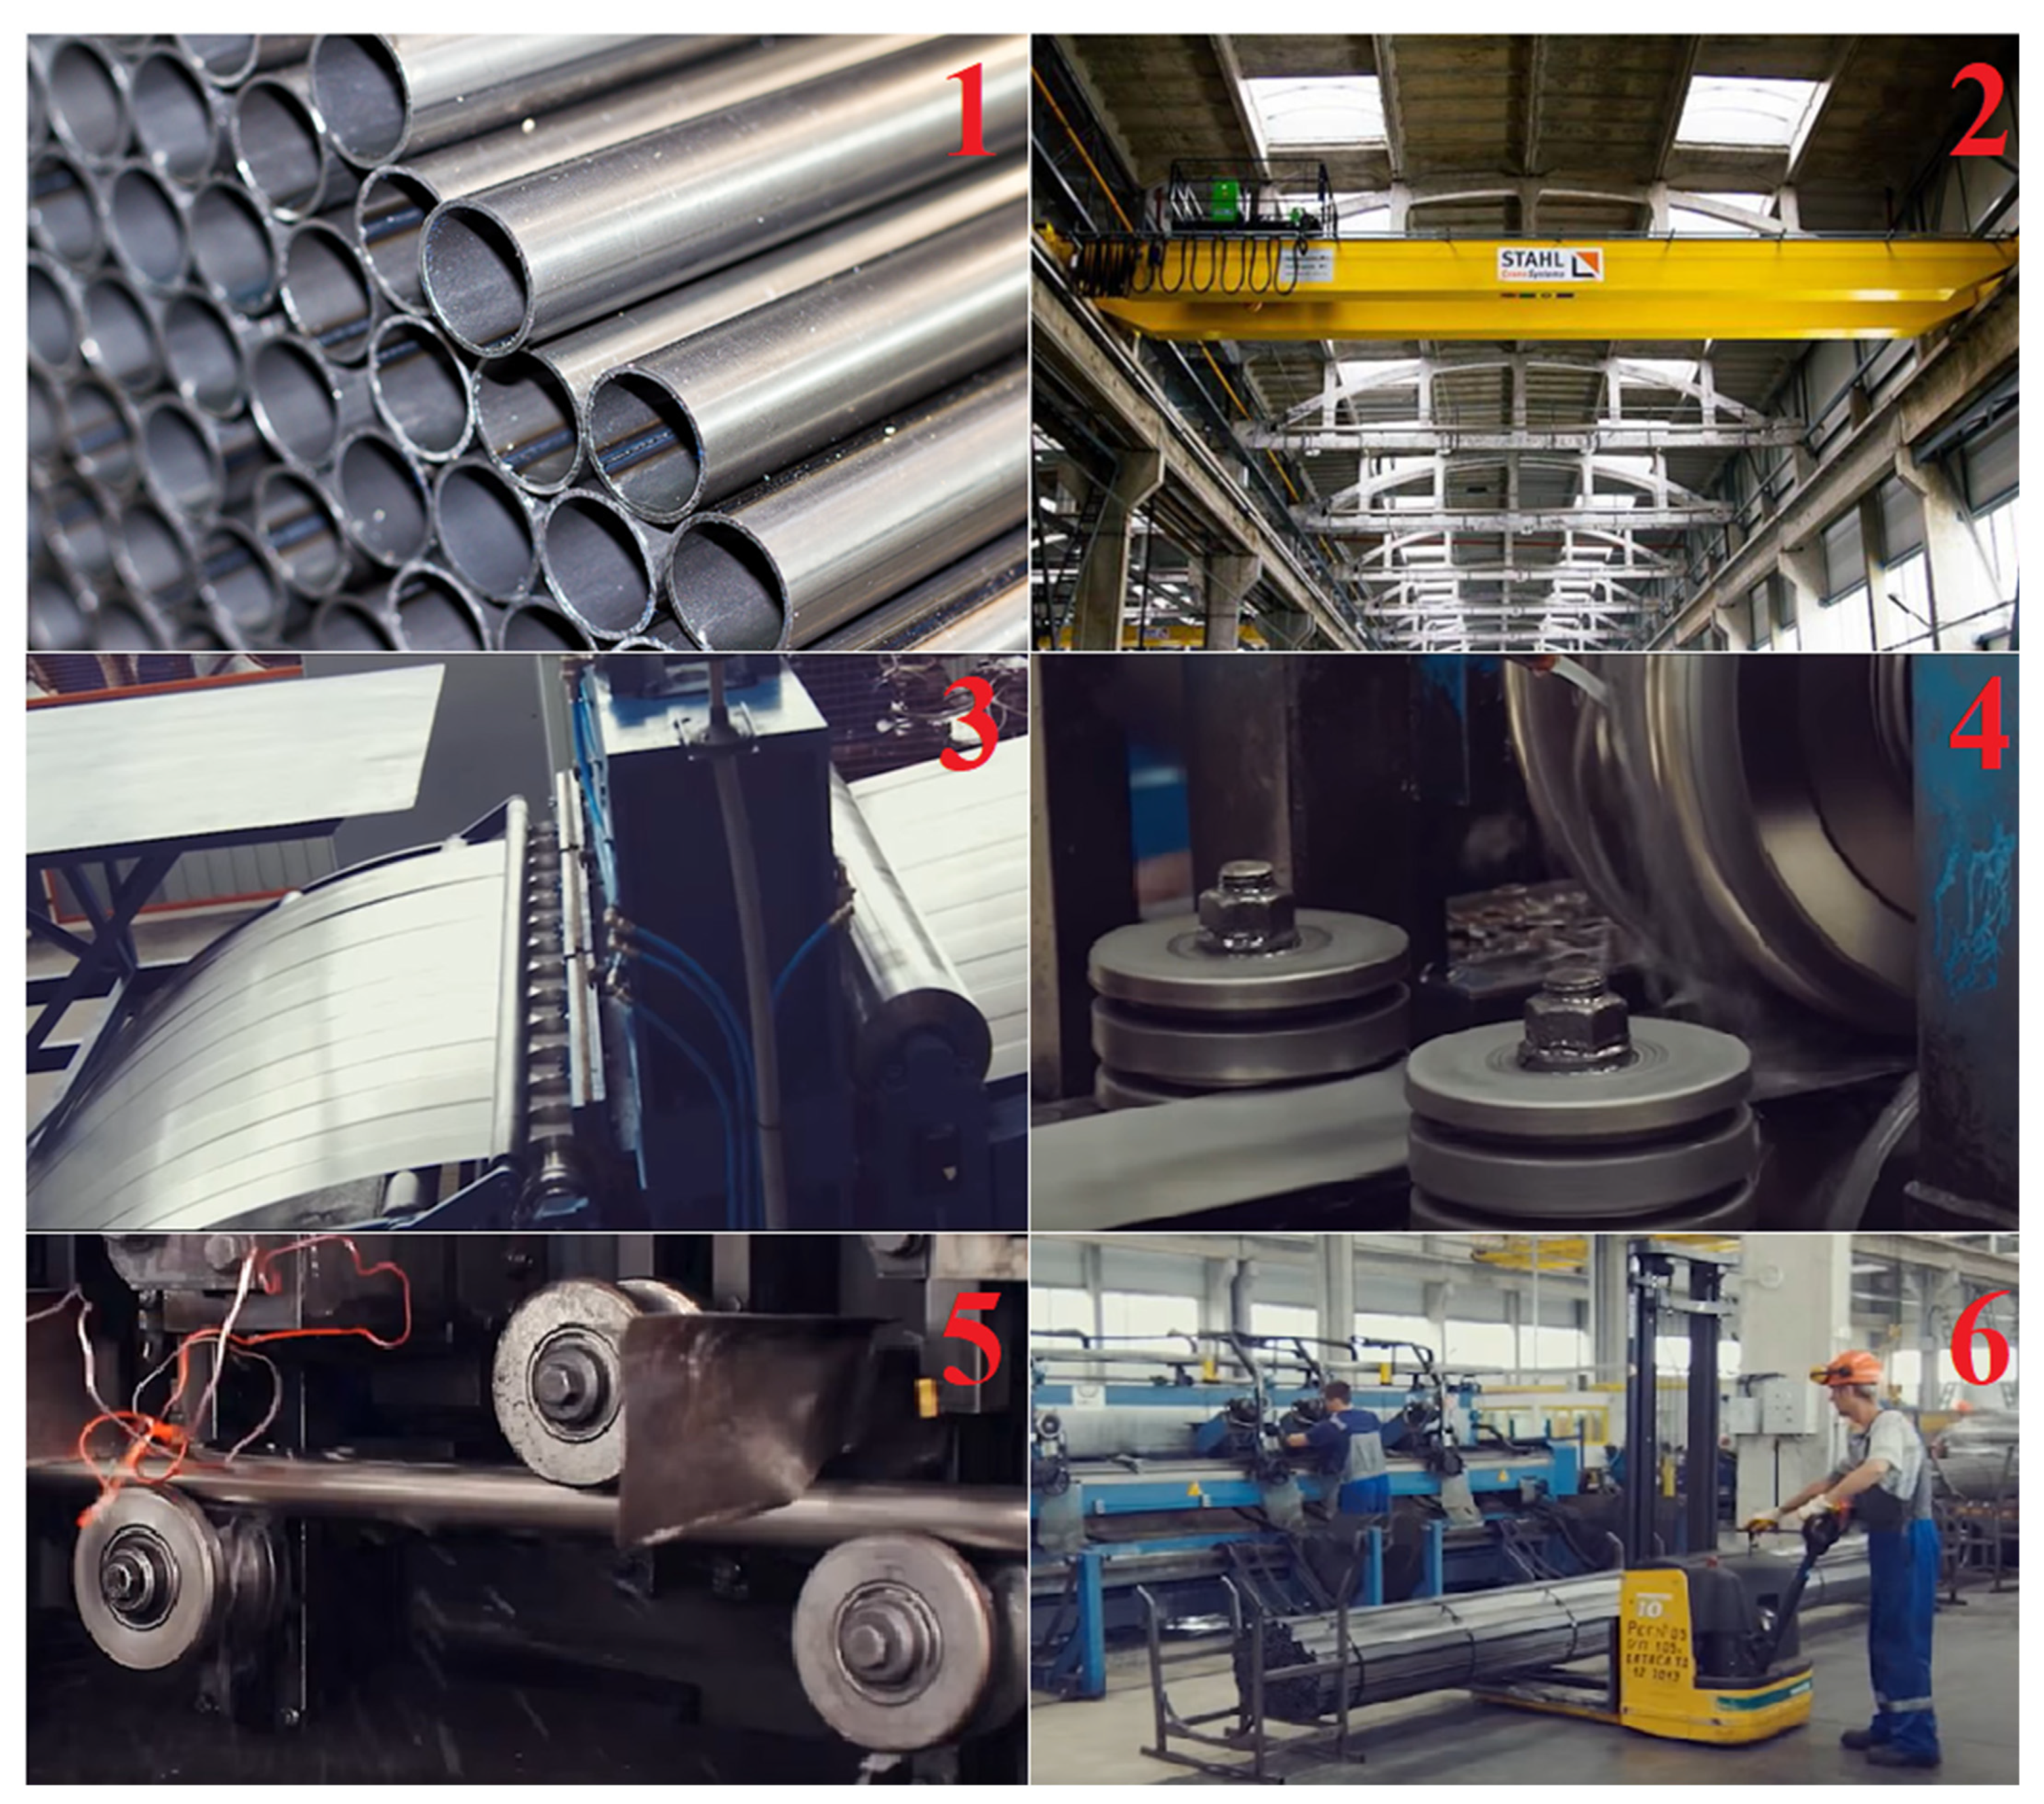
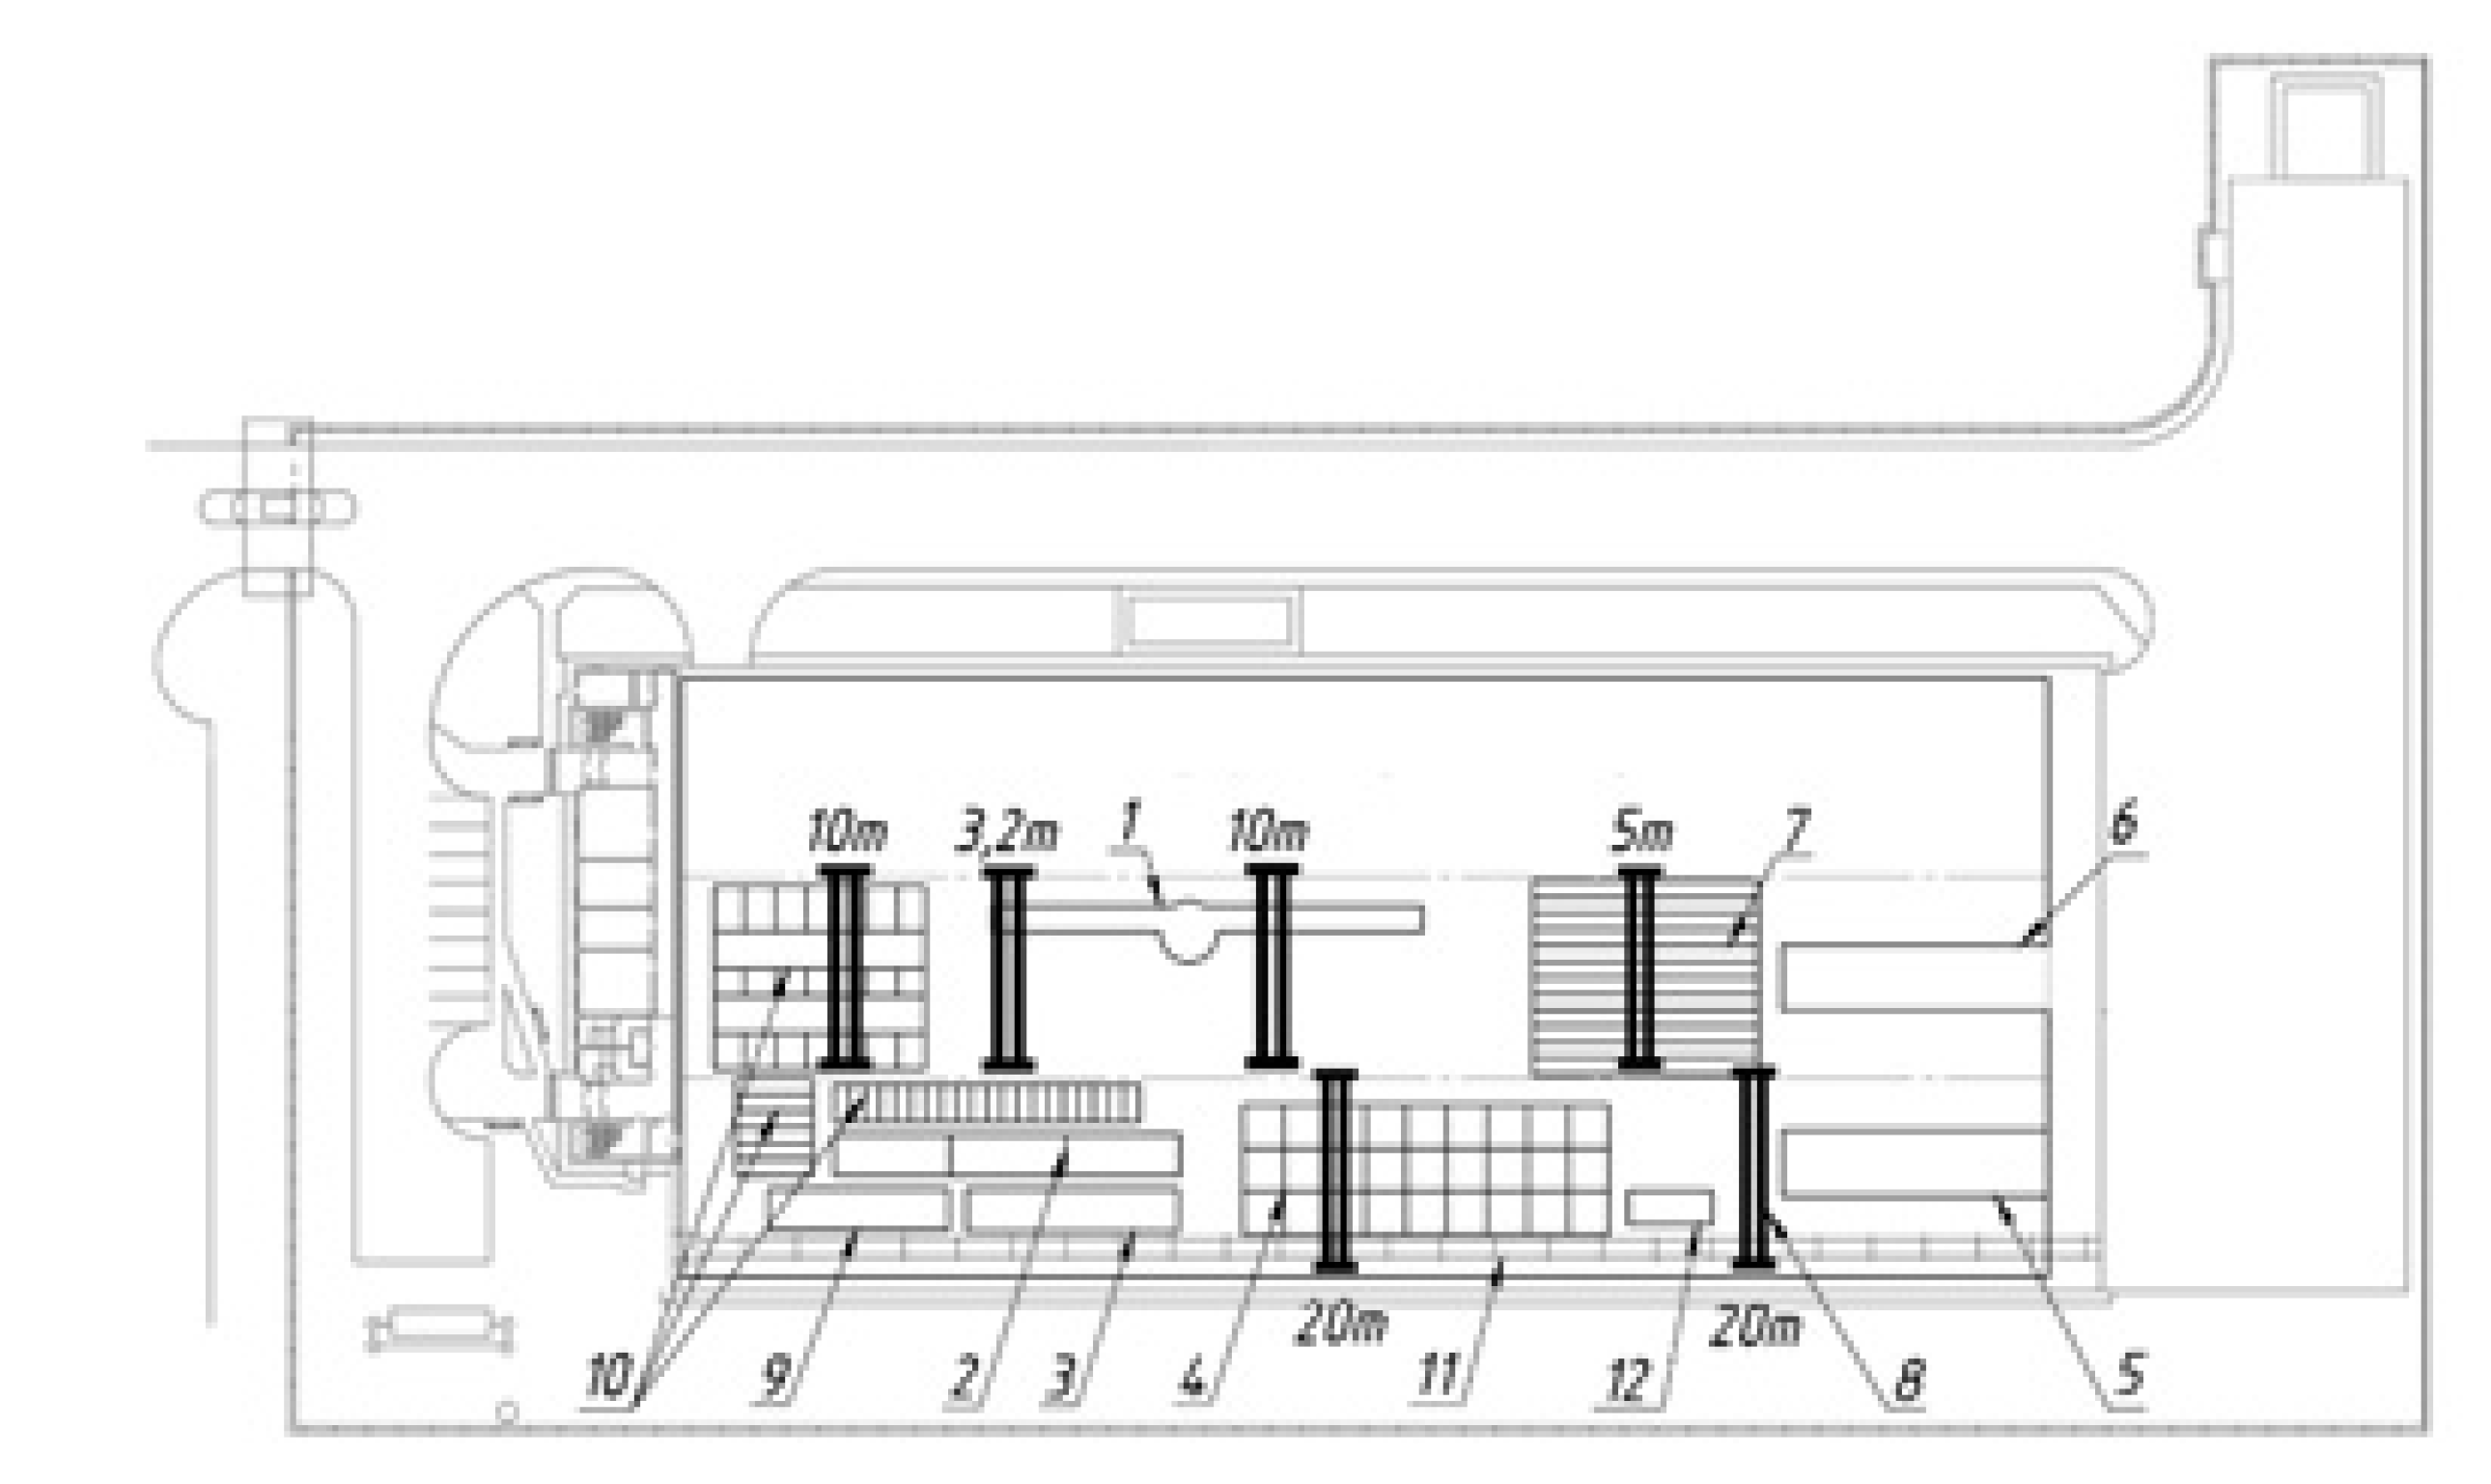
3.2. Description of the Production Process

The production process of steel pipes for upholstered furniture consists of seven stages (Figure 2). The production of steel pipes can be divided into two key stages and is carried out on two production lines—a metal slitting line and a line for bending and electric welding of steel pipes.
The raw material in the form of steel rolls with appropriate parameters is transported to the plant by road transport. The rolls in their original packaging are unloaded using an overhead crane and then sent to the warehouse.
The process begins on the slitting line of the metal. With the help of an overhead crane, the right steel roll goes to the place where the packaging is removed. The roll is then fed onto a line where the metal is cut into strips hereinafter called strips. Finally, the strip is wound on the shaft to form circles. With the help of an overhead crane, the tied strip is transported to the inter-operational stock warehouse, where it awaits the next stage of production.
Then the worker of the bending and electric welding line takes the correct strips using an overhead crane and feeds it to the double-sided line unwinder. After unfolding the first strips, the next one is fed.
The first end of the tape roll is combined with the beginning of the second continuous strips by means of welding machine tungsten electrode in an argon atmosphere. The strip is then fed to the linear forming section, where it is rolled into a round tube blank by means of rolls. A continuous pipe blank with unclosed metal edges is fed to the high-frequency welding section. Thereafter, the blank is compressed by rolls on three sides, followed by the contact of the molten edges with each other. At this point, it can be concluded that the pipe is welded. The pipe is then immersed in a bath with a cooling emulsion, and then directed to the calibration section. The final diameter of the pipe is precisely shaped in the calibration section. The pipe weld is subjected to an ultrasonic test on a stand, and the quality of the weld is also checked. The next step is to shape the round pipe to a specific profile (oval, flat, rectangular, square, and others). The length of the pipe is measured automatically, and the circular saw cuts the continuous pipe into lengths of specified dimensions according to the orders.
In the packing section, the pipes are placed manually by the worker. The outer surface of the pipe is visually inspected. The first tube that goes into the pocket is intended for testing. The pipes are packed in accordance with the specified quantity, depending on the customer’s preferences, and as a result, welds are formed. Using an overhead crane, the seal with the pipes is placed on the stand in an inclined manner to allow the remaining emulsion to drain from the inside of the pipe. A manufacturer’s label is attached to each package. In the final step, the finished pack of dried pipes is transported by an overhead crane to the finished products warehouse.
The photos in Figure 3 show the manufactured products, individual stages of the production process, and the company’s machine park in order to improve the processes taking place in the enterprise. The use of photos in the article has been agreed with the plant management.

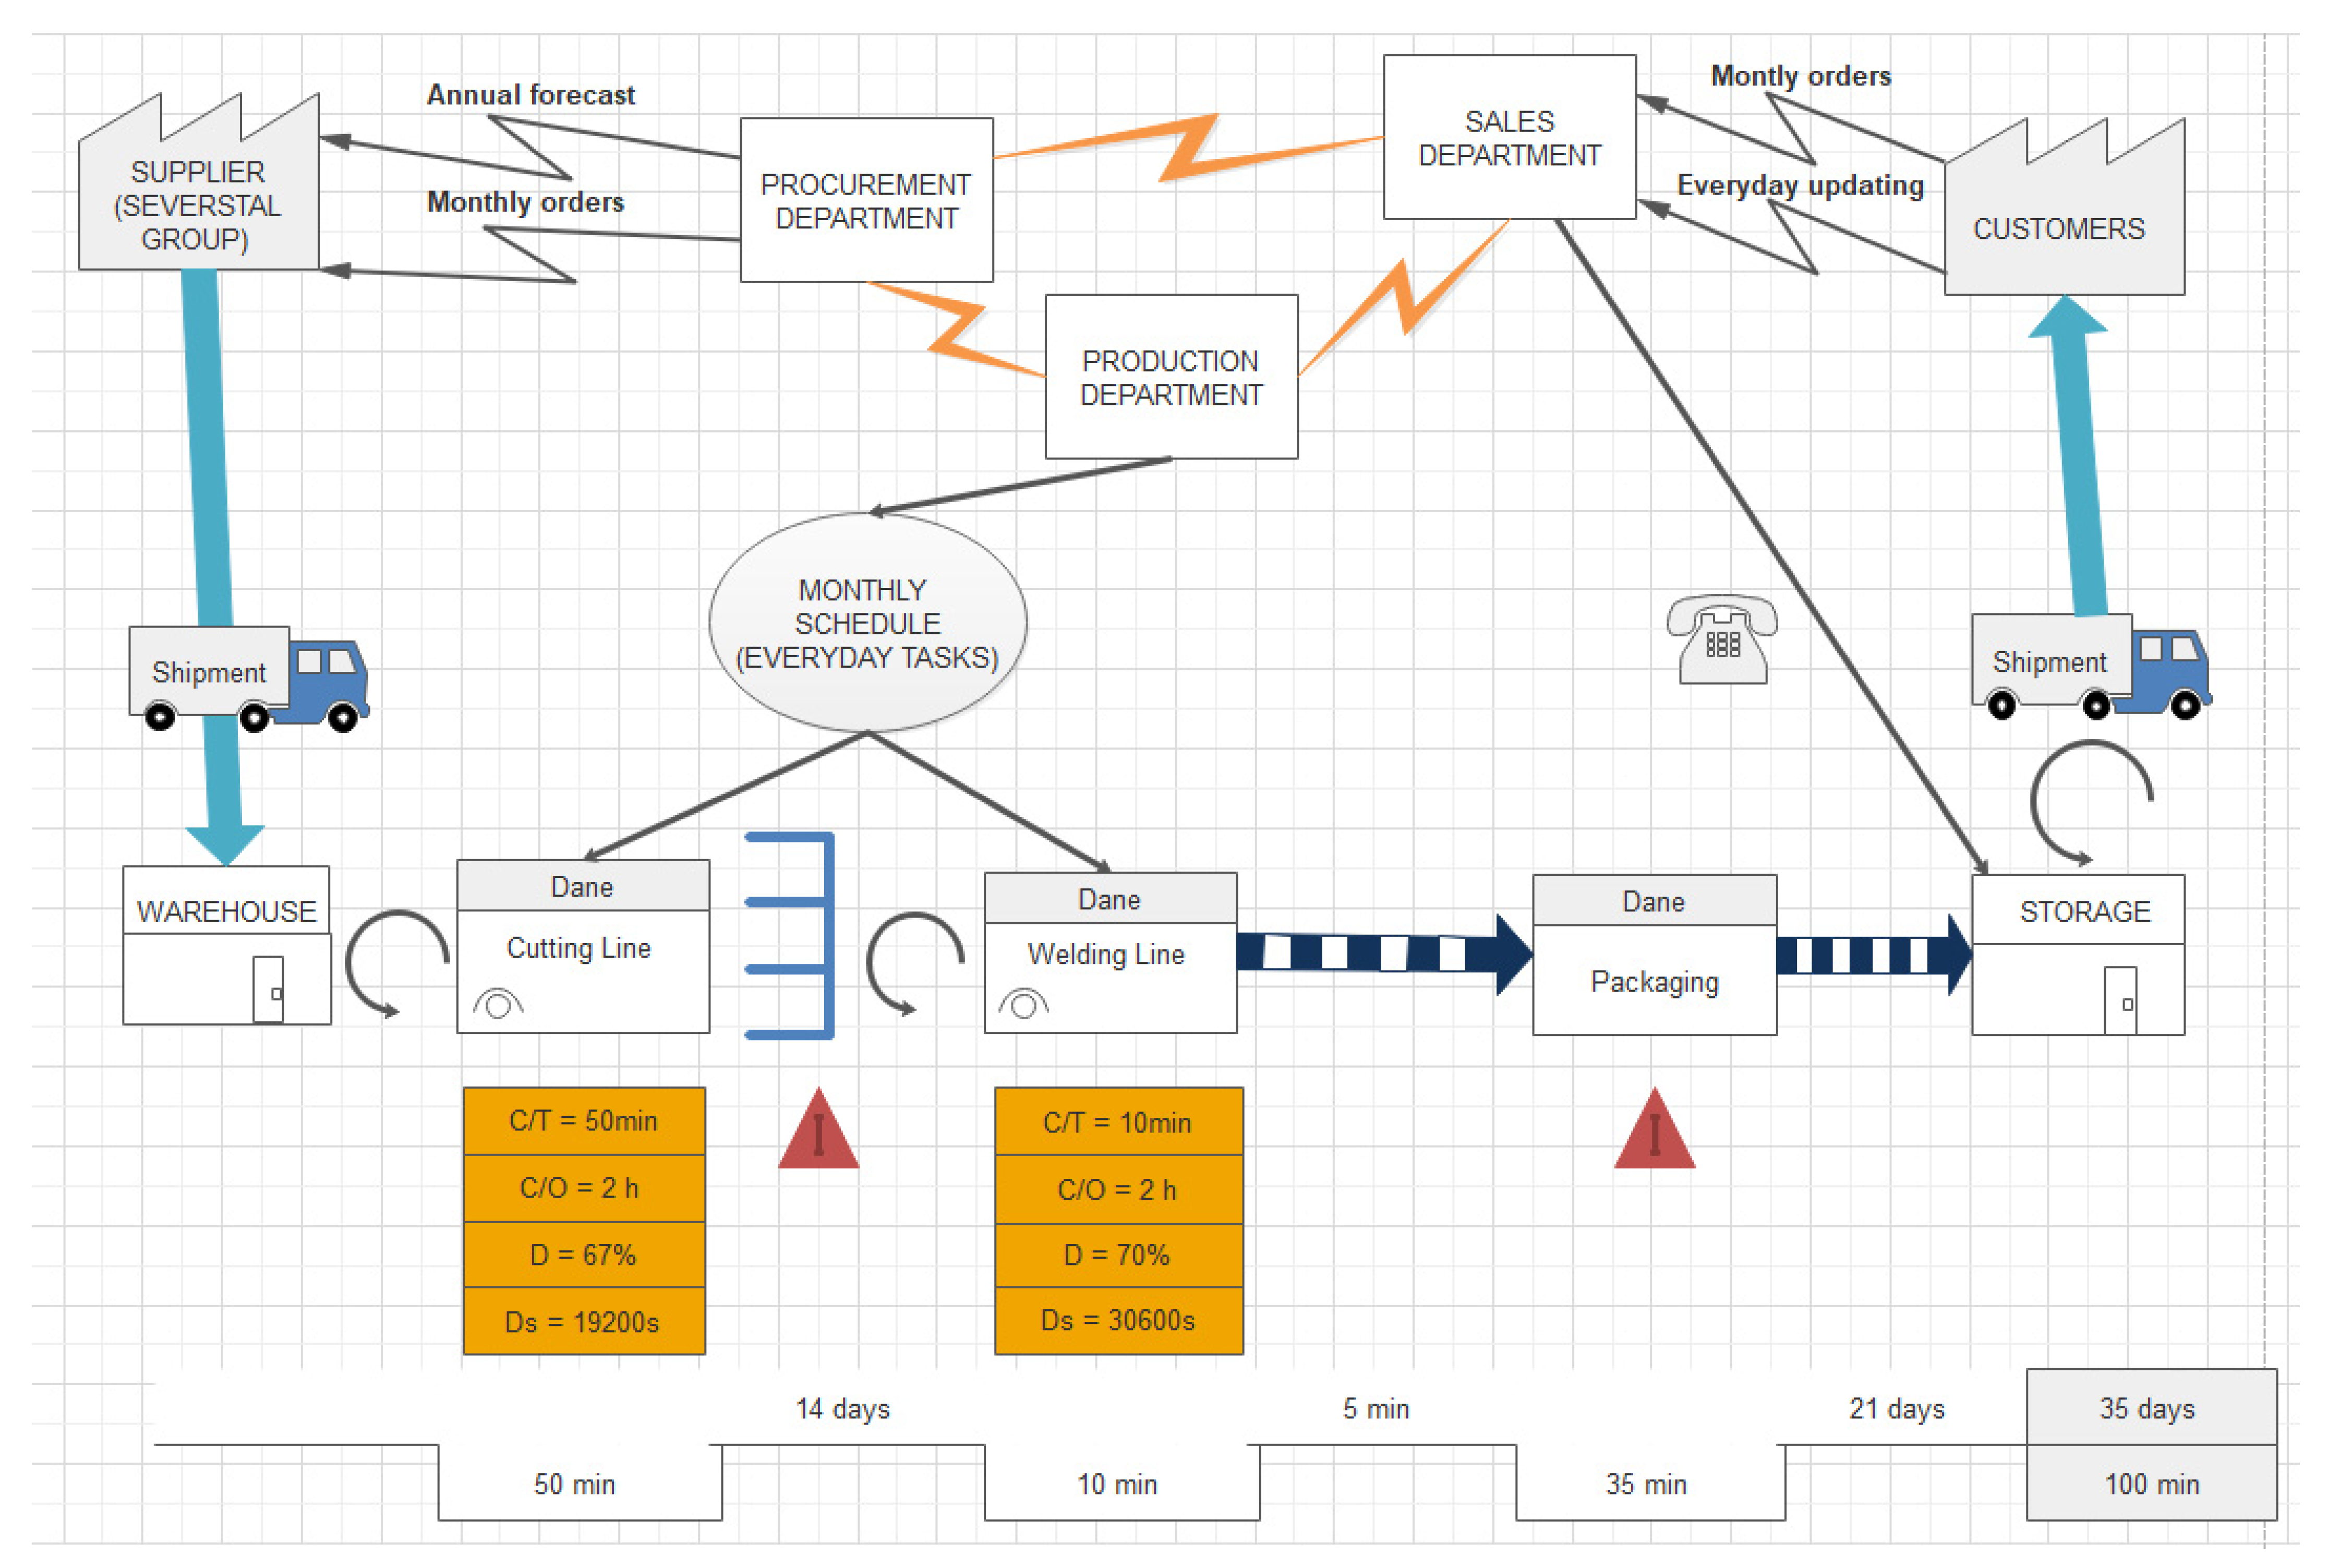
3.3. Mapping the Current State in the Steel Pipe Manufacturing System

VSM allows one to identify the root causes of problems that arise along the entire value chain. It is an analytical tool that cannot actually solve the problem. Therefore, once problems are identified, it is necessary to use other methods or tools to fix them.
Based on the obtained data, analyses of the entire production process, and consultations with the company’s engineers, a final map of the current state of the steel pipe manufacturing system was developed and the map legend (Figure 4). The map (Figure 5) reflects all operations performed in the analyzed enterprise by operators, their duration, and indicator values. It gave a full picture of the company’s situation at the time of the research.
The top part of the map shows the information flows starting from the customer, through internal company communication and ending with suppliers. The material flow is visualized in the lower part. Below it there are tables with individual indicators, where:
  • C/T is the operation time;
  • C/O—changeover time;
  • D—availability in percent, taking into account retooling;
  • Ds—available time.
Value-Added Time is just 100 min. The total order fulfillment time is 35 days. After conversion, it gives a 0.002% share of Value-Added Time in Lead Time. This means that practically the entire production time of products is Non-Value-Added Time. In Figure 4, all activities are divided into three groups:
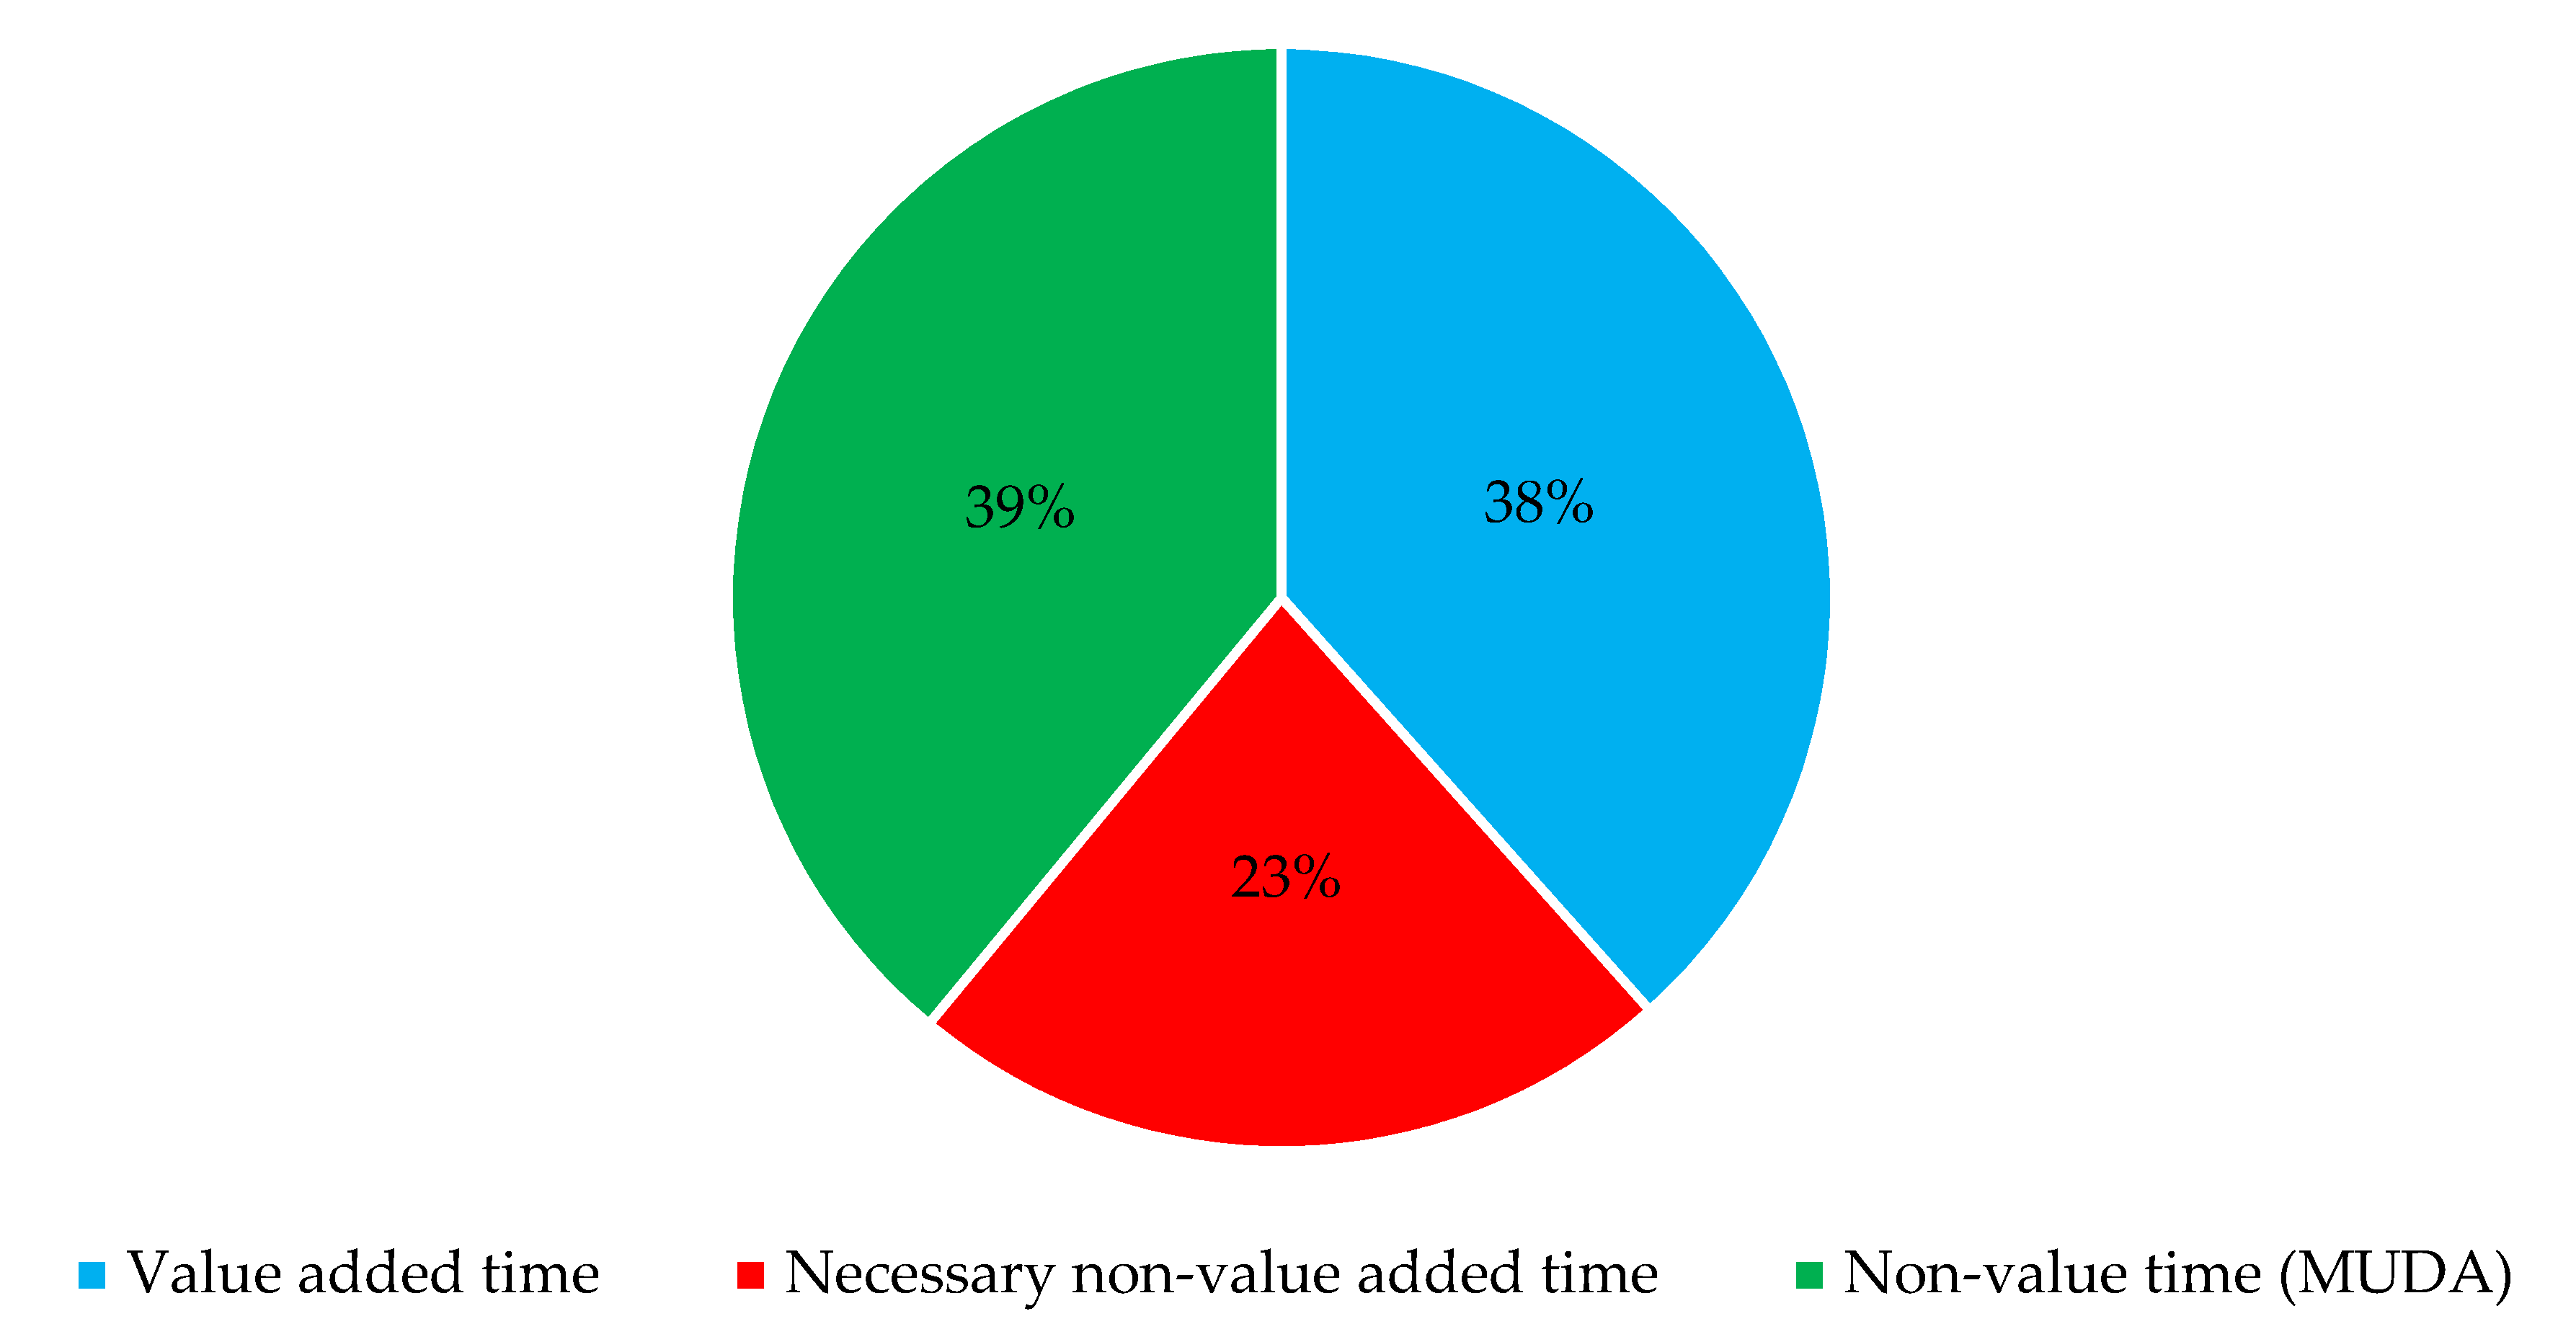
  • Non-value Added—observed activities that do not create added value of the product, such as idleness, conversation between operators on the slitting line;
  • Necessary Non-Value Added—activities that do not directly create added value, but are necessary from the point of view of the continuity of the production process, such as checking the width of a steel roll, entering data into the workflow report, segregating the generated waste or cleaning;
  • Value Added—activities that add value to the final product, which contribute to its direct transformation and give it features for which the customer is potentially willing to pay, for example fixing the roll on the decoiler, marking each roll of stripper, setting the production line, etc.
Figure 6 reflects the time distribution into value adding activities and redundant for the slitting line. We chose this line as an example because it is not fully automated (like a welding line), so we have more to do with Non-Value-Added activities, for example it has manual retooling by operators.
Table 2 presents the collected data and the described metrics regarding the initial state of the analyzed process.
The longitudinal cut line has been included in the critical areas. It was taken into account due to the large number of NVA activities that have a negative impact on the production process. This fact is due to the greater proportion of operators’ manual labor required to unload and load the rolls onto the line, more frequent changeovers, and the waiting time for the machine to finish. The various activities of the NVA prove that the line work is poorly organized, and the working time fund of the line workers is not fully used.
During the observation of the working day, some imperfections were detected in the first seconds of the retooling operation. The essence of the retooling operation is the correct replacement of knives and spacing and mounting them on the shaft in order to achieve the desired cutting parameters. The operation of preparing the line for the production of piping with the desired parameters is performed manually in a manner where an employee at a height of 1.5–2 m replaces the necessary parts. Under current conditions, the average time of line changeover is about 60–80 min. The average weight of one knife is about 10 kg. Visually, it was possible to assess the low comfort of work by an employee at height and a fairly high degree of accident probability. The observed situation provoked the willingness to propose possible changes in the line retooling operation in order to improve the efficiency of work at a given position.

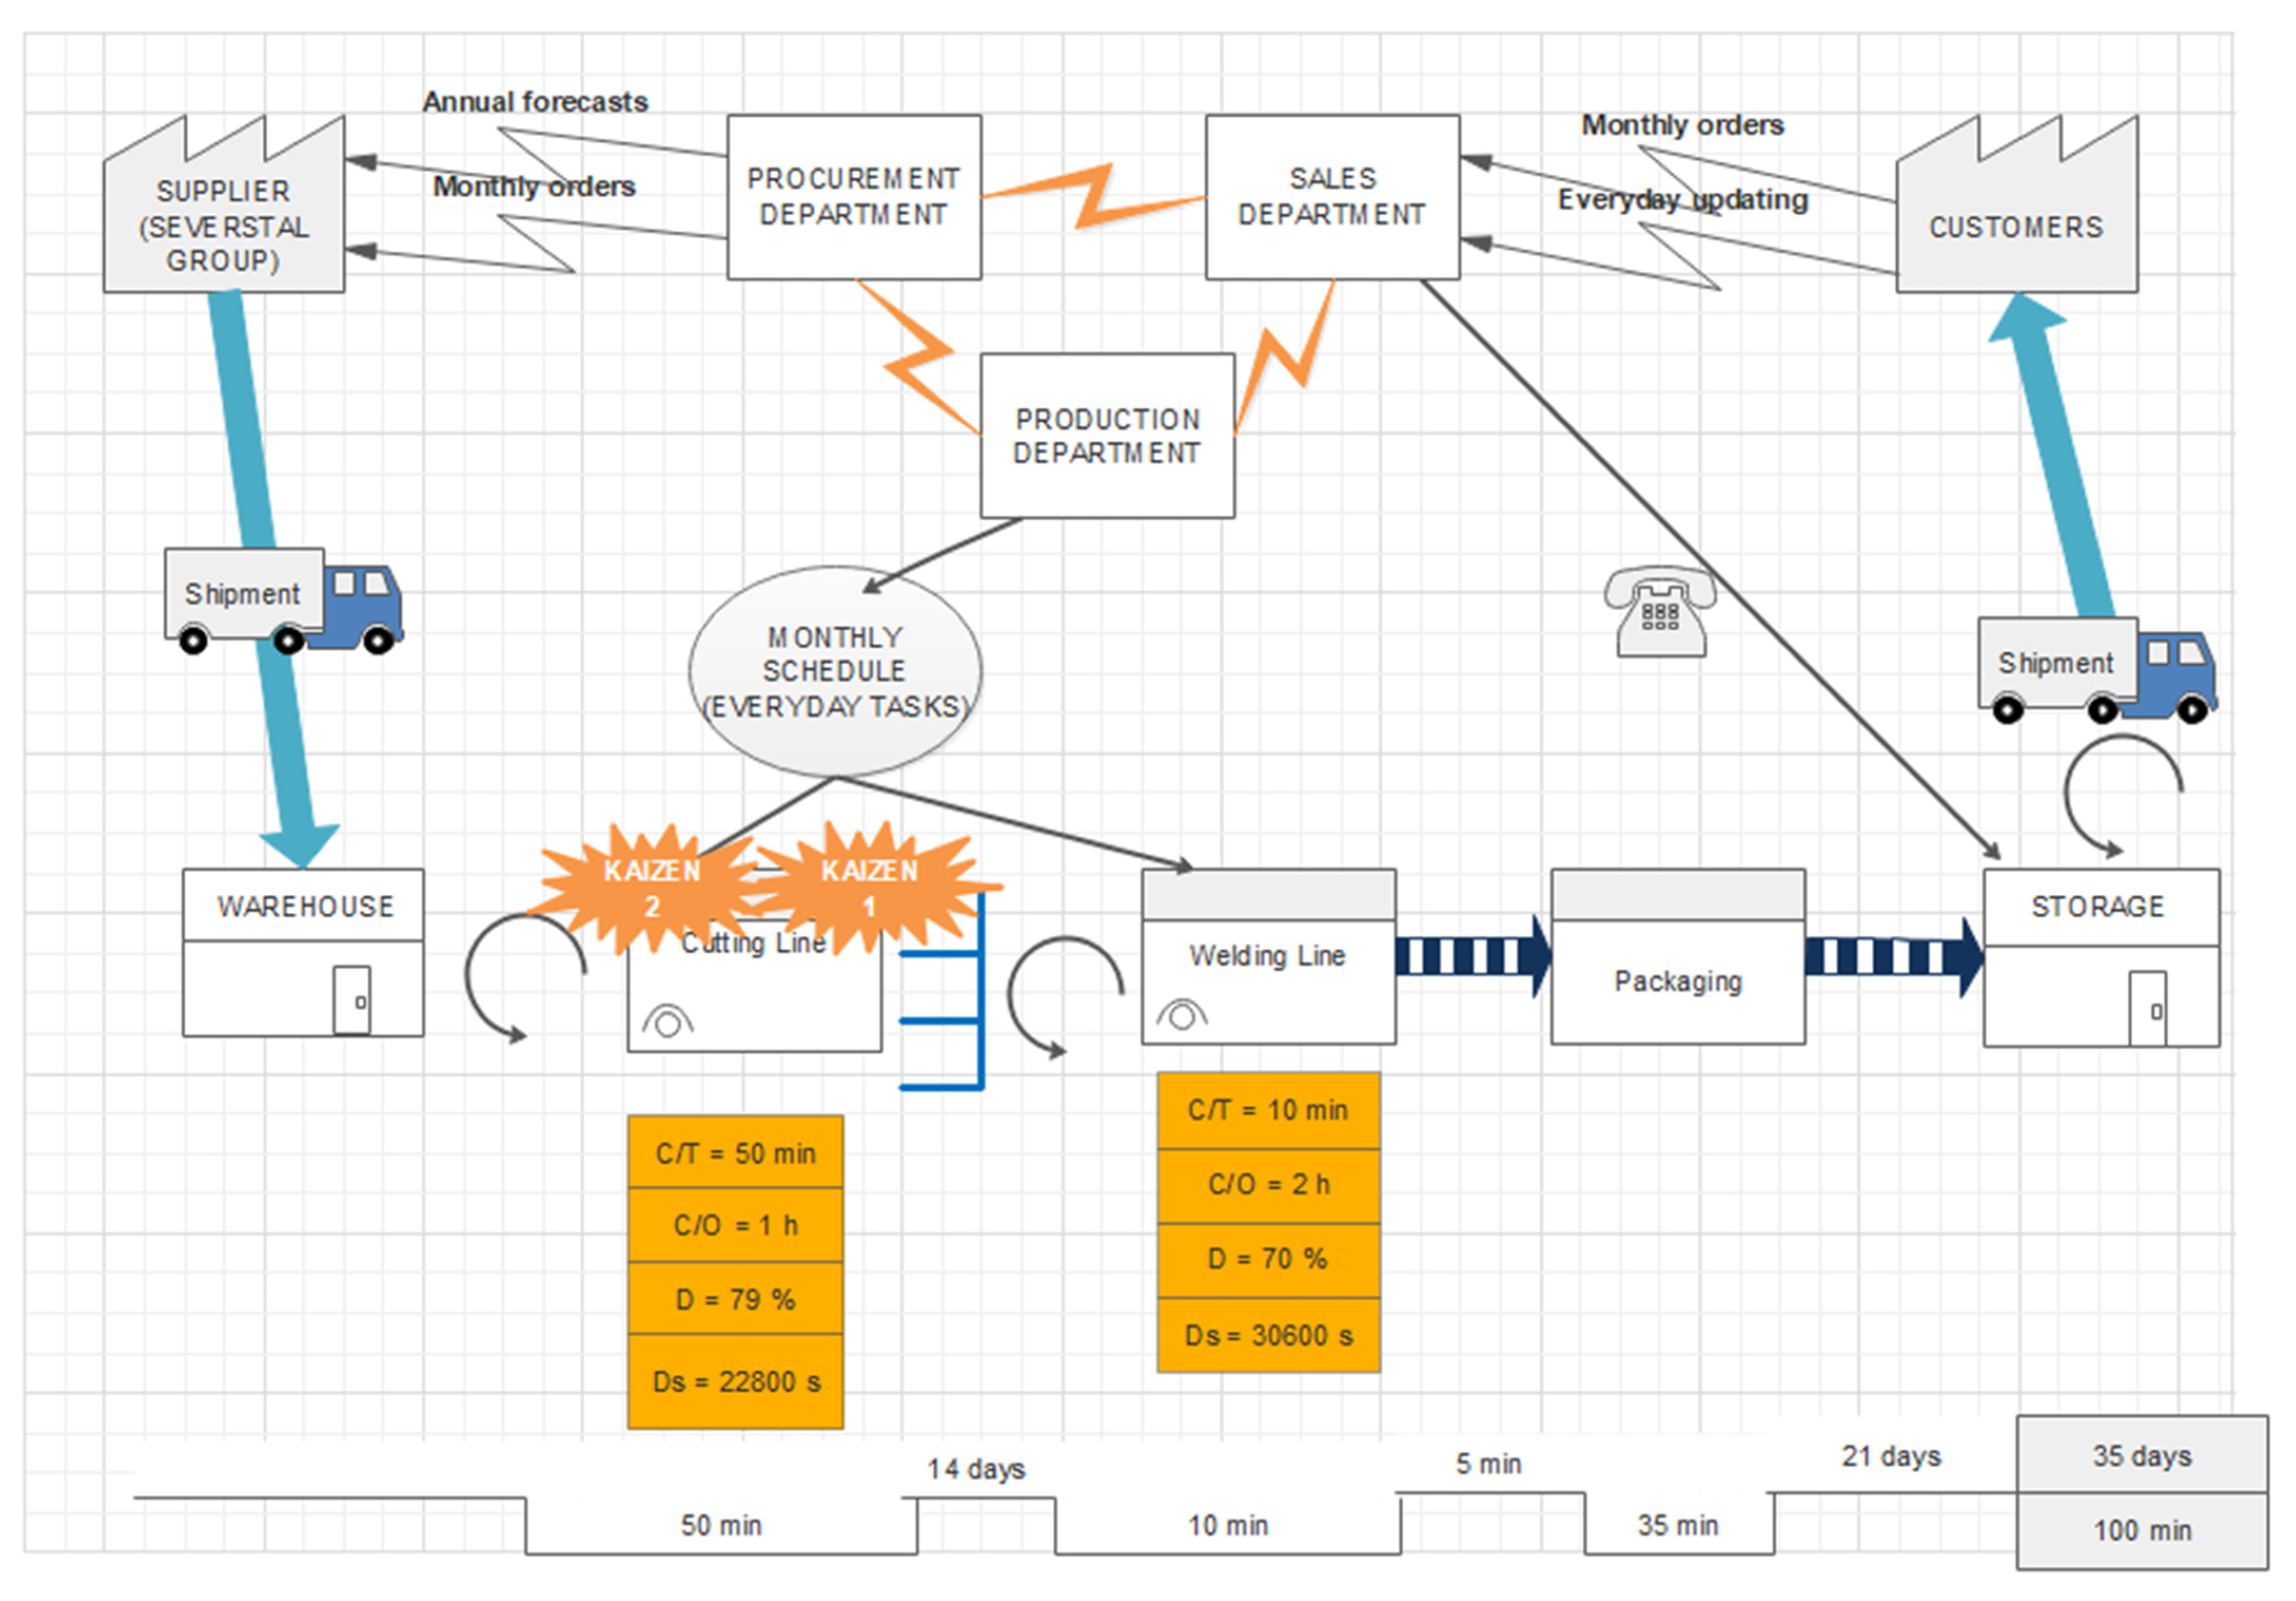
3.4. Future State Map and Proposed Improvements

The constructed map of the current state allows for the identification of problem areas. In the chapter below, we will propose a map of the future state with marked areas for improvement and improvement actions under the KAIZEN philosophy. As part of the development of the future state map, the authors decided to focus on those production areas of the enterprise in which the greatest number of Non-Value-Added activities occur.
The specificity of the steel pipe manufacturing technology is determined by the layout shown in the drawing (Figure 7) below the workstations and their location in the production hall. Production takes place on two production lines, which are connected by a supermarket to store Work-in-Progress (WIP) inter-operational stocks.
The finished goods warehouse is located at the end of the production chain. Any attempts to reorganize the physical flow of materials and products are not appropriate due to the design and size of the devices and the technology used in the plant.
In addition, most of the articles in the literature focus on the study of Lean Manufacturing elements, such as the implementation of continuous flows, the use of supermarkets, Kanban cards (finding the optimal number of cards), push and pull production systems, production leveling and differentiation, indicating the process stimulating the work of the whole, etc. In contrast, other elements of Lean Manufacturing, such as multi-shop work, reduction of production cycle time, and process improvements, etc., have not received sufficient attention. This article aims to focus on areas for improvement of individual operations along the value chain, reducing losses occurring in separate processes and increasing the efficiency of employees working time in these positions, which in turn leads to an increase in the efficiency ratio of the entire organization.

3.4.1. Future State Map

The developed map of the future state (Figure 8) reflects the map of the current state with problem areas marked in the form of clouds. A longitudinal cut line has been included in such areas. The slitting line was taken into account because of the large amount of NVA activities with the aim of reducing the amount of non-value adding activities, and also because of the long duration of the operation to possibly reduce this time. After presenting the map of the future, descriptions of individual improvements in selected areas were placed.

3.4.2. Kaizen 1—An Improvement under SMED

During one work shift, the average number of rolls of steel cut is about six pieces. This means that in one shift, line operators perform six cutting cycles. The essence of the retooling operation is the correct replacement of knives and spacing and mounting them on the shaft in order to achieve the desired cutting parameters. The operation of retooling the strips production line with the desired parameters is performed manually. An employee at a height of 1.5–2 m changes the knives and adjusts the spacing between them depending on the decent dimensions of the strip. It is associated with low work comfort and a fairly high probability of an accident. The average weight of one knife is approximately 10 kg. Currently, the total time for line retooling is approximately 2 h during one shift.
In addition, operators have an average of 15 to 25 min of waiting time per cutting cycle to wait for the machine to finish, which is approximately 120–140 min of inefficient working time per shift for each operator.
The longest-running operation of the line is the cutting operation. The average time for this operation is about 20 min depending on the length of the raw material of the steel roll without the direct involvement of the line operators, except for the initial visual inspection of the correctness of the operation. For one employee, the total Non-Value Added (including activities necessary in the process) in the total working time is about 61%, while the share of value added activities is 39% (Value Added) from the total operating time of the cutting line. Analyzing the structure of the second employee’s working time on the metal cutting line, it is possible to notice a higher percentage of unnecessary activities caused by the longer total waiting time for the machine to work and at the end of the previous operation. On the one hand, too high a percentage of unnecessary activities proves a positive organization of the production process, because they do not result from the occurrence of disturbances or failures or the lack of necessary tools or details. On the other hand, there is a fairly high level of non-utilization of the line operators’ working time, resulting in a high labor cost.
The idea to improve the operation is to purchase an additional replaceable part of the cutting line (more precisely, an additional pair of metal cutting knives and a shaft to which the knives are attached), on which the changeover takes place. By purchasing an additional part, the retooling operation would take place as follows:
A pair of knives is mounted on a special rack with an overhead crane, where it is changed over.
After finishing the cycle of cutting metal on strips of the previous dimensions, the part of the line is disassembled, and in its place, with the help of a crane, the appropriate, already converted part is installed.
The cost of the investment is estimated at around EUR 40,000. Under current conditions, the line retooling time, with two employees, is an average of 120 min per shift. During one work shift, operators should change the line at least twice.
For a better understanding of the proposed solution, below we would like to present a potential scenario for the organization of retooling on a given line.
Now, when they come to work, the operators start retooling by replacing the knives on the line shaft and carrying out this work at a height of 1.5–2 m, which takes an average hour (no steel roll is cut during this time). After retooling, they begin the cutting cycle of steel rolls. In the cutting cycle, the machine time is about 20–25 min, as the employees are not busy with any work during this time. After cutting on three steel rolls, operators should replace the knives again, stopping the line and retooling for an hour.
The proposed purchase of a spare part will allow employees to be busy with work during forced idleness and will eliminate an hour-long break in the line’s operation in the middle of the day. It is impossible to avoid the loss of the first hour of work, while later (when cutting the “first” three steel rolls) employees will be able to install new knives on a replaceable shaft, taking advantage of the interruptions resulting from waiting for the end of the machine’s operation. Once they have finished cutting on three steel rolls, one only needs to change the shafts with an overhead crane. The only condition for the profitability of the above solution is the optimal planning of the work task in advance, so that the line cuts at least three rolls of steel on one changeover.
In the case of the above solution, the waiting time for the completion of the cutting by the machine will be effectively used by the operators to retool the free replaceable part to the next parameters included in the working task. The introduction of the solution will result in a reduction of the changeover time to 1 h per shift, which has been included in the future state map. As a result, the next required retooling will coincide with the machine time and will allow 1 h to be released per shift, during which the next cutting cycle can be performed. Thanks to this change in the organization of the line operation, while maintaining the same human and time expenditure, the production system is able to process one more roll of steel compared to the current state, which means an increase in line productivity by 17%.
In addition, this solution translates into an increase in the comfort of operators’ work during the set-up operation. Working at height is completely eliminated, which also reduces the risk of an accident at work.

3.4.3. Kaizen 2—Streamlining the Packing Operation on the Slitting Line

The operation of packing each coil of already cut strips is characterized by the highest repetition frequency. Two workers are always involved in it, working in tandem. The packing of strips coils consists of several parts. First, a packing machine is taken into which a reinforced polypropylene tape is inserted. Then the strips hanging on the winder are tied one by one with tape. The average time to perform this operation on one piece of strips is 28 s. On average, there are about 10 cut strips on the coiler, which equals 280 s to complete the packing operation. Separate packing of the individual strips is required to prevent it from unrolling during transportation later in the manufacturing process. At the next stage of production, i.e., during cutting, the coils taken from the inter-operational stock warehouse go to the steel pipe production line, where they are unpacked, i.e., the tape is removed. Reusing the tape is not possible due to the insufficient length of the tip (it prevents reinserting the tape into the packing machine). Typically, the worker who performs the packing operations leaves tips about 5–6 cm long. Within a month, the waste from polypropylene tape is about 80 kg.
The main goal of streamlining the packaging operation of strips is to shorten the time of this operation and reduce waste. When analyzing solutions in companies with a similar nature of production, it was decided to use a reinforced aluminum tape instead of a polypropylene tape. When choosing a tape, we were guided by its strength level.
Thanks to this solution, the operation time will be reduced to 5 s for packing one strip, which would consequently lead to a reduction of about 25% of the packing time during one cutting cycle of a steel roll. Moreover, the waste of adhesive tape in this case would constitute a much smaller amount than in the case of polypropylene tape.
Performing a verification test on a strip with a fairly large thickness of 2 mm showed that the given solution is unacceptable to the production reality. Therefore, it was necessary to find a new improvement proposal.
Another suggestion is to reuse the polypropylene tape by planned plugging of the larger ends with a length of 20 cm. Thanks to this solution, the polypropylene tape can be used at least the second time.
Re-performance of the verification test confirmed the usefulness of this solution.
The proposed solution does not reduce the time needed to complete the packaging operation but has a large impact on financial and environmental issues. As a positive effect, after implementing the above solution, we assume that the cost of packaging will decrease by about 1.5 (one and a half) times. When leaving longer ends of the packaging material, it becomes possible to reuse it, and the positive effect estimated by us has been reduced by the probability index of the risk of wear of the belt strength parameters, which is the main disadvantage of this solution. Another positive effect of the above solution from the ecological point of view is the lower demand for the tape during the month. As already mentioned above, the monthly waste of the tape is about 80 kg and is not suitable for recycling.
As the assumed positive effect when implementing the above solution, the cost of packaging will be reduced by one and a half times. The risk of wear of the belt’s strength parameters is the main disadvantage of this solution.

4. Financial and Effectiveness Analysis of the Proposed Solutions

4.1. Purchase of a Replaceable Section of the Line on Which Retooling Takes Place

Before the proposed improvement, the line retooling time is 60 min and does not coincide with the machine time. Two employees are involved in retooling. During one shift, the operators are to change the line twice. The proposed solution consists of using the working time of the operators during the break, resulting from waiting for the end of the machine’s operation, to change over the free replaceable part.
During one cycle, the waiting time for the completion of the cutting of the roll by the machine is from 14 to 19 min, which during one shift is about 50–70 min of inefficiently used working time for each operator. In addition, this solution translates into an increase in the comfort of operators during the set-up operation, as work at height is completely eliminated, which is associated with a high risk of an accident at work. Taking into account the fact that the cutting cycle of one roll is from 50 to 60 min, the calculations show that with the same human and time expenditure, the company is able to produce one more roll during one shift. In its order, the productivity of the line will increase by 17% compared to the current situation.
The investment cost is approximately EUR 40,000.
The cost of producing a cut roll of steel includes labor, material, and energy costs. We assume that the line operator gets a salary of EUR 15 per hour. Taking into account that the production line is operated by two people per shift and one month, the labor cost is EUR 4800. Additionally, the cost of one roll of material is EUR 2300. The average number of skew rolls cut in one shift is 6. We assume that energy costs are constant in both cases and amount to EUR 3000 per month.
Based on the data obtained from the company, a financial analysis was carried out before and after the implementation of the improvements (Table 3).
Before the improvement:
The cost of producing cut skew rolls per month is:
T C = R + M · N + E
T C = 4800   EUR + 13,800   EUR · 20   S h i f t s + 3000   EUR = 283,800   EUR
K = 283,800   EUR 120   R o l l s = 2365   EUR
After implementing the improvement:
The cost of producing cut skew rolls per month is:
T C = R + M · N + E
T C = 4800   EUR + 16,100   EUR * 20   S h i f t s + 3000   EUR = 329,800   EUR
K = 329,800   EUR 140   R o l l s = 2356   EUR
where:
  • Tc—cost of producing cut skew rolls per month;
  • R—the cost of labor;
  • M—the cost of steel rolls;
  • Nr—number of steel rolls (daily);
  • E—energy cost;
  • N—number of shifts in a month;
  • Nm—the number of rolls produced during the month;
  • K—unit cost.
The profit resulting from the difference in unit costs amounts to EUR 9, calculated per year and amounts to:
9   EUR × 7   R o l l s × 20   S h i f t s × 12   M o n t h s = 15,120   EUR
According to the above calculations, the realized investment would pay off in less than 32 months, i.e., a little longer than 2.5 years. Nevertheless, we are increasing the production level by one roll per day, which means increasing the production of steel pipes from an additional 20 steel rolls. The company’s production demand is characterized by a small but steady growth, so we assume that through the presented solution it will achieve higher revenues.

4.2. The Use of Polypropylene Tape for Packaging

Within a month, the company uses about 4000–5000 m of polypropylene tape. The cost of purchasing 1000 m of tape is about EUR 300, so you can see that the maximum cost of a package is EUR 1500 within a month. About 4 m of tape are needed to pack one roll of strips, but so far, the worker used to leave tips about 10 cm long. It follows that before the improvement, about 1224 strips are packed within a month (each steel roll is cut into 10 strips) and the cost of packing 10 strips is EUR 12.5.
After improving the packaging of 1224 strips rolls, we will need 242 m more tape than before, while due to reuse, the amount of tape used is spread over two months, and the cost of packing one roll will be about EUR 6.55. The calculations show that the cost of packaging material per month will decrease by 1.9 times.
Based on the data obtained from the company, a financial analysis was carried out before and after the implementation of the improvements (Table 4).

4.3. Purchase of a Replaceable Section of the Line on Which Retooling Takes Place

The table below (Table 5) shows the changes of individual Lean indicators before and after the introduced improvement under the SMED (marked as Kaizen 1) on the longitudinal cut line. The improvement marked as Kaizen 2 does not translate into a change in any production parameters, as it consists of reducing the amount of waste, therefore it has not been included in the table below. Data such as the number of operators, the duration of the production cycle (Cycle Time), and the duration of the operation (Operation Time) have not changed, while the values of the changeover time of the longitudinal cutting line have changed. Before the improvement, the line changeover time was 2 h per shift (retooling was carried out twice during a shift), but after the improvement, it was possible to achieve the result of 1 h changeover during the shift.
As a result of the change in Changeover Time, the percentage of Value-Added Time and the time needed to make a product increased significantly by almost 20%. After the improvement, the effective time of employees increased to 40 min while cutting one steel roll.
The table below (Table 6) shows the calculation of the Overall Equipment Effectiveness (OEE) of the slitting line. The OEE indicator was selected as one of the key indicators to evaluate the proposed Kaizen 1 improvement. As we can see below, the time of unplanned breaks has significantly decreased due to the reduction of setup and adjustment times. This contributed to the increase in the availability index by 13.63%. It is worth noting that we consider the ideal case without identifying possible failures and other downtimes, because the company did not provide similar data. The quality index remained at the same level and the utilization rate slightly decreased.
The total result of OEE calculations after the improvement was 79.55%, which is an 11% increase compared to the state before the improvement. It should be noted, however, that in practice, most processes are not fully automated and employee productivity also plays an important role in determining production efficiency. In the case of machines working independently, where the role of the operator is limited to setting, switching on, and changing the OEE machine, it may also turn out to be an insufficient measure of the effectiveness of the process, which is why the indicators of time use by operators in the form of Value-Added and Necessary Non-value-Added were also referred to at the beginning.
This indicator showed an additional feature of the analyzed production system, which is high quality. In the case of the analyzed cycle, before the improvement, only one product did not meet the quality standards. After the improvement, it was possible to reduce it. Nevertheless, the annual shortage rate for 2020 was 2%, which is considered low.

5. Conclusions

The aim of the above paper was to present the Value Stream Mapping method as part of the analysis and finding appropriate improvements in the processes taking place in the company producing precise steel pipes of various dimensions for upholstered furniture. The implementation of the VSM tool in the Lean Manufacturing area was aimed at reducing waste, and thus increasing the quality and efficiency of the production process. The first stage was collecting and analyzing data on the processes taking place in the enterprise and their interactions. The information obtained was used as a basis for defining the current state, as well as for identifying critical points. The next step was to propose a map representing the future state of the system. Additionally, a basic financial analysis of the investment profitability was carried out, highlighting the gains resulting from the proposed improvements. Two solutions were highlighted, each of which was adopted by the plant management next year. As a result of the above improvements, productivity rates on the slitting line can improve by 17%, and the amount of polypropylene tape waste should be reduced by 1.7 times compared to the current state. It is also important to emphasize the fact that the comfort and safety of operators should be significantly improved when purchasing a spare part for the slitting line.
In addition to visualizing the entire production process using the current and future state maps, we also marked the change in the Availability index, which we define as the ratio of the scheduled time to the task completion time, on the slitting line from 67% to 79%, which does not directly affect the length of the production cycle but testifies to the transformation of the Non-value-Added time into the Necessary Non-value-Added time of the operators in a given position.
Among the possible disadvantages of using the VSM method, it is worth mentioning its static nature, which means that the method can capture the state of the production hall as a snapshot only at a specific moment. For example, on the day of the current VSM map, production may be running smoothly, but the very next day there may be machine breakdowns or delays in deliveries, so any next VSM map may vary significantly. To overcome this problem, it has been suggested in the research world to use simulation models together with the VSM tool to more effectively define the current and future state of the organization.
Nevertheless, the essence of applying the VSM method is the need for a comprehensive look at the production system, because even minor changes in the system can radically change the effects of these processes.
The directions of further work will include the implementation of new tools that will allow the improvement of the production process in the analyzed enterprise. Particular emphasis will be placed on issues related to environmental protection and rational management of the company’s resources.

Author Contributions

Conceptualization, M.S. and I.J.-G.; methodology, M.S.; validation, D.V., A.G. and M.S.; formal analysis, D.V., A.G. and M.S.; investigation, D.V., A.G., M.S. and M.B.; resources, D.V., A.G. and M.S.; data curation, D.V., A.G. and M.S.; writing—original draft preparation, M.S.; writing—review and editing, M.S.; visualization, D.V., A.G. and M.S.; supervision, I.J.-G. All authors have read and agreed to the published version of the manuscript.

Funding

Acknowledgments to Ilona Jacyna-Gołda for financial support for publication.

Institutional Review Board Statement

Not applicable.

Informed Consent Statement

Not applicable.

Data Availability Statement

Not applicable.

Acknowledgments

Acknowledgments to Ilona Jacyna-Gołda for help with the research.

Conflicts of Interest

The authors declare no conflict of interest.

References

  1. Hidalgo Martins, G.; Gechele Cleto, M. Value stream mapping and earned value analysis: A case study in the paper packaging industry in Brazil. Braz. J. Oper. Prod. Manag. 2016, 13, 360. [Google Scholar] [CrossRef]
  2. Stadnicka, D.; Litwin, P. Value Stream Mapping and System Dynamics Integration for Manufacturing Line Modelling and Analysis. Int. J. Prod. Econ. 2019, 208, 400–411. [Google Scholar] [CrossRef]
  3. Jeong, B.K.; Yoon, T.E. Improving IT Process Management through Value Stream Mapping Approach: A Case Study. JISTEM 2016, 13. [Google Scholar] [CrossRef]
  4. Chiarini, A. Sustainable Manufacturing-Greening Processes Using Specific Lean Production Tools: An Empirical Observation from European Motorcycle Component Manufacturers. J. Clean. Prod. 2014, 85, 226–233. [Google Scholar] [CrossRef]
  5. Gurumurthy, A.; Kodali, R. Design of Lean Manufacturing Systems Using Value Stream Mapping with Simulation: A Case Study. J. Manuf. Technol. Manag. 2011, 22, 444–473. [Google Scholar] [CrossRef]
  6. Zahraee, S.M.; Tolooie, A.; Abrishami, S.J.; Shiwakoti, N.; Stasinopoulos, P. Lean Manufacturing Analysis of a Heater Industry Based on Value Stream Mapping and Computer Simulation. Procedia Manuf. 2020, 51, 1379–1386. [Google Scholar] [CrossRef]
  7. Florescu, A.; Barabaş, B. Integrating the Lean Concept in Sustainable Manufacturing Development. IOP Conf. Ser. Mater. Sci. Eng. 2018, 399, 012018. [Google Scholar] [CrossRef]
  8. Schoeman, Y.; Oberholster, P.; Somerset, V. Value Stream Mapping as a Supporting Management Tool to Identify the Flow of Industrial Waste: A Case Study. Sustainability 2020, 13, 91. [Google Scholar] [CrossRef]
  9. Salwin, M.; Kraslawski, A.; Lipiak, J.; Gołębiewski, D.; Andrzejewski, M. Product-Service System Business Model for Printing Houses. J. Clean. Prod. 2020, 274, 122939. [Google Scholar] [CrossRef]
  10. Salwin, M.; Kraslawski, A.; Lipiak, J. State-of-the-Art in Product-Service System Design. In The 10th International Conference on Engineering, Project, and Production Management; Panuwatwanich, K., Ko, C.-H., Eds.; Lecture Notes in Mechanical Engineering; Springer: Singapore, 2020; pp. 645–658. ISBN 9789811519093. [Google Scholar]
  11. Salwin, M.; Kraslawski, A. State-of-the-Art in Product-Service System Classification. In Advances in Design, Simulation and Manufacturing III; Ivanov, V., Trojanowska, J., Pavlenko, I., Zajac, J., Peraković, D., Eds.; Lecture Notes in Mechanical Engineering; Springer International Publishing: Cham, Switzerland, 2020; pp. 187–200. ISBN 978-3-030-50793-0. [Google Scholar]
  12. Lipiak, J.; Salwin, M. The Improvement of Sustainability with Reference to the Printing Industry—Case Study. In Advances in Manufacturing II; Hamrol, A., Grabowska, M., Maletic, D., Woll, R., Eds.; Springer International Publishing: Cham, Switzerland, 2019; pp. 254–266. ISBN 978-3-030-17268-8. [Google Scholar]
  13. Lipiak, J.; Salwin, M. Improvement of the Warehouse Functioning: A Study Based on an Enterprise in the Printing Industry. In Advanced Manufacturing Processes II; Tonkonogyi, V., Ivanov, V., Trojanowska, J., Oborskyi, G., Grabchenko, A., Pavlenko, I., Edl, M., Kuric, I., Dasic, P., Eds.; Lecture Notes in Mechanical Engineering; Springer International Publishing: Cham, Switzerland, 2021; pp. 61–71. ISBN 978-3-030-68013-8. [Google Scholar]
  14. Chen, J.C.; Li, Y.; Shady, B.D. From Value Stream Mapping toward a Lean/Sigma Continuous Improvement Process: An Industrial Case Study. Int. J. Prod. Res. 2010, 48, 1069–1086. [Google Scholar] [CrossRef]
  15. Ramirez-Peña, M.; Mayuet, P.F.; Vazquez-Martinez, J.M.; Batista, M. Sustainability in the Aerospace, Naval, and Automotive Supply Chain 4.0: Descriptive Review. Materials 2020, 13, 5625. [Google Scholar] [CrossRef] [PubMed]
  16. Lacerda, A.P.; Xambre, A.R.; Alvelos, H.M. Applying Value Stream Mapping to Eliminate Waste: A Case Study of an Original Equipment Manufacturer for the Automotive Industry. Int. J. Prod. Res. 2016, 54, 1708–1720. [Google Scholar] [CrossRef]
  17. Parthanadee, P.; Buddhakulsomsiri, J. Production Efficiency Improvement in Batch Production System Using Value Stream Mapping and Simulation: A Case Study of the Roasted and Ground Coffee Industry. Prod. Plan. Control 2014, 25, 425–446. [Google Scholar] [CrossRef]
  18. Andrade, P.F.; Pereira, V.G.; Del Conte, E.G. Value Stream Mapping and Lean Simulation: A Case Study in Automotive Company. Int. J. Adv. Manuf. Technol. 2016, 85, 547–555. [Google Scholar] [CrossRef]
  19. Settanni, E.; Thenent, N.E.; Newnes, L.B.; Parry, G.; Goh, Y.M. Mapping a Product-Service-System Delivering Defence Avionics Availability. Int. J. Prod. Econ. 2017, 186, 21–32. [Google Scholar] [CrossRef] [Green Version]
  20. World Steel Association Economics Committee. Steel Statistical Yearbook 2020; World Steel Association Economics Committee: Brussels, Belgium, 2020. [Google Scholar]
  21. World Steel Association Economics Committee. Steel Statistical Yearbook 2019; World Steel Association Economics Committee: Brussels, Belgium, 2019. [Google Scholar]
  22. World Steel Association Economics Committee. Steel Statistical Yearbook 2018; World Steel Association Economics Committee: Brussels, Belgium, 2018. [Google Scholar]
  23. World Steel Association Economics Committee. Steel Statistical Yearbook 2017; World Steel Association Economics Committee: Brussels, Belgium, 2017. [Google Scholar]
  24. World Steel Association Economics Committee. Steel Statistical Yearbook 2016; World Steel Association Economics Committee: Brussels, Belgium, 2016. [Google Scholar]
  25. World Steel Association Economics Committee. Steel Statistical Yearbook 2015; World Steel Association Economics Committee: Brussels, Belgium, 2015. [Google Scholar]
  26. Huang, F.; Chen, Q.; Ding, H.; Wang, Y.; Mou, X.; Chen, J. Automotive Steel with a High Product of Strength and Elongation Used for Cold and Hot Forming Simultaneously. Materials 2021, 14, 1121. [Google Scholar] [CrossRef] [PubMed]
  27. Balbuena, J.; Sánchez, L.; Cruz-Yusta, M. Use of Steel Industry Wastes for the Preparation of Self-Cleaning Mortars. Materials 2019, 12, 621. [Google Scholar] [CrossRef] [PubMed] [Green Version]
  28. Knezović, N.; Garašić, I.; Jurić, I. Influence of the Interlayer Temperature on Structure and Properties of Wire and Arc Additive Manufactured Duplex Stainless Steel Product. Materials 2020, 13, 5795. [Google Scholar] [CrossRef] [PubMed]
  29. Forno, A.J.D.; Pereira, F.A.; Forcellini, F.A.; Kipper, L.M. Value Stream Mapping: A Study about the Problems and Challenges Found in the Literature from the Past 15 Years about Application of Lean Tools. Int. J. Adv. Manuf. Technol. 2014, 72, 779–790. [Google Scholar] [CrossRef]
  30. Dadashnejad, A.-A.; Valmohammadi, C. Investigating the Effect of Value Stream Mapping on Overall Equipment Effectiveness: A Case Study. Total Qual. Manag. Bus. Excell. 2019, 30, 466–482. [Google Scholar] [CrossRef]
  31. Costa, A.; Henriques, E.; Domingues, M.; Peças, P. Value Stream Mapping Application on Mould Making Industry: Results and Discussion. In Advances in Sustainable and Competitive Manufacturing Systems; Azevedo, A., Ed.; Lecture Notes in Mechanical Engineering; Springer International Publishing: Heidelberg, Germany, 2013; pp. 1565–1577. ISBN 978-3-319-00556-0. [Google Scholar]
  32. Luna, L.B.; Klökner, P.E.D.; Ferreira, J.C.E. Applying Value Stream Mapping to Identify and Evaluate Waste in a Company of the Ceramic Sector. In Advances in Sustainable and Competitive Manufacturing Systems; Azevedo, A., Ed.; Lecture Notes in Mechanical Engineering; Springer International Publishing: Heidelberg, Germany, 2013; pp. 1515–1525. ISBN 978-3-319-00556-0. [Google Scholar]
Figure 1. A graphical representation of Value-Added Time.
Energies 14 03527 g001
Figure 2. Diagram of the production process in the analyzed enterprise.
Energies 14 03527 g002
Figure 3. Illustration of the basic stages of the production process, view of the crane with which the production hall is equipped, and an example of final products manufactured in the plant (1—manufactured products (steel pipes for upholstered furniture); 2—production hall equipped with overhead cranes; 3—cutting steel rolls on line for longitudinal cutting; 4—forming a blank before starting the welding operation on the bending and electric welding line; 5—the next stage of pipe production—removing the metal allowance from the pipe; 6—section for packing pipes and transporting them later with a forklift truck).
Energies 14 03527 g003
Figure 4. Legend of the map.
Energies 14 03527 g004
Figure 5. Map of current state.
Energies 14 03527 g005
Figure 6. Percentage of activities while working on the longitudinal cutting line.
Energies 14 03527 g006
Figure 7. Layout of workstations in the analyzed enterprise (1. Production line of welded steel pipes (MTM—Tube Mills Machinery); 2. Lines for slitting the tapes; 3. Area for unpacking steel strip rolls; 4. Place of storage of steel strip rolls; 5. Raw materials unloading area; 6. The zone for loading finished products; 7. Warehouse of finished products; 8. Radio-controlled crane; 9. Waste containers (generated when removing the packaging); 10. Racks for storing cut strips circles; 11. Railway tracks; 12. Metal waste containers).
Energies 14 03527 g007
Figure 8. Map of future state.
Energies 14 03527 g008
Table 1. Total production of steel products in thousands of tons [20,21,22,23,24,25].
2009201020112012201420152016201720182019
Total world1,238,7491,433,4321,538,0211,560,4441,650,4231,671,1281,621,5371,629,0961,732,1711,816,611
China577,070638,743701,968731,040822,000822,306803,825807,609870,855928,264
Japan87,534109,599107,601107,232110,595110,666105,134104,775104,661104,319
United States59,38480,49586,39888,69586,87888,17478,84578,47581,61286,607
India63,52768,97673,47177,26481,29987,29289,02695,477101,455109,272
Russia60,01166,94268,85270,20969,00871,46170,89870,45371,49172,042
South Korea48,57258,91468,51969,07366,06171,54369,67068,57671,03072,464
Germany32,67043,83044,28442,66142,64542,94342,67642,08043,29742,435
Brazil26,50632,94835,22034,52434,16333,89733,25831,64234,77835,407
Turkey25,30429,14334,10735,88534,65434,03531,51733,16337,52437,312
Italy19,84825,75028,73527,25224,09323,71422,01823,37324,06824,532
Spain14,35816,34315,50413,63914,25214,24914,84513,61614,44114,320
France12,84015,41415,78015,60915,68516,14314,98414,41315,50515,387
Great Britain10,07497089478957911,85812,03310,907763574917268
Belarus2417253026142687224525132510218823432470
Poland7128799387798366795085589198900110,33210,167
Ukraine29,85533,43235,33232,97532,77127,17022,96824,21821,41721,100
Table 2. Data from the initial state of the production process.
Lean Metrics—Initial StateCutting LineWelding Line
Number of Operators24
Cycle Time50 min15 min
Operation Time20 min10 min
Value Added Time + Necessary Non-value added time30.5 min95% = 13.75 min
Table 3. Situation before and after the implementation of the improvement.
Before Implementing an ImprovementAfter Implementing an Improvement
R4800 EUR4800 EUR
Nr67 (improvement allows you to cut one additional roll)
M13,800 EUR16,100 EUR
N20 shifts20 shifts
E3000 EUR3000 EUR
Tc283,800 EUR329,800 EUR
Nm120 rolls140 rolls
K2365 EUR2356 EUR
Annual difference15,120 EUR
Table 4. Situation before and after the implementation of the improvement.
Before Implementing an ImprovementAfter Implementing an Improvement
Amount of polypropylene tape used (per month)5000 m2621 m
Total cost of purchasing the tape (per month)1500 EUR786 EUR
Unit cost of packing one steel roll12.5 EUR65.5 EUR
Cost of the annual purchase of polypropylene tape18,000 EUR9432 EUR
Annual difference8568 EUR
Table 5. Situation before and after the implementation of the improvement.
Lean MetricsBefore Implementing an ImprovementAfter Implementing an Improvement
Cutting LineWelding LineCutting LineWelding Line
Number of Operators2424
Cycle Time50 min15 min50 min15 min
Operation Time20 min10 min20 min10 min
Changeover Time (per shift)2 h2 h 1 h 2 h
Value Added Time + Necessary Non-value added time61% = 30.5 min95% = 13.75 min80% = 40 min95% = 13.75 min
Table 6. Overall Equipment Effectiveness (OEE)—calculations.
Lean Metrics—Initial StateBefore Implementing an ImprovementAfter Implementing an Improvement
AvailabilityMinutesMinutes
A.Total working time24002400
B.Planned breaks (breaks, planned inspections)200200
C.Planned production time (C = A − B)22002200
D.Unplanned interruptions (D = E + F + G) including:600300
E.Breakdowns00
F.Settings and adjustments600300
G.Other00
H.Operating time (H = C − D)16001900
I.Availability (I = H/C·100) 72.73%86.36%
Performance
J.Produced details (good and bad)30 pieces35 pieces
K.Cycle time50 min50 min
L.Average cycle time (L = H/J) achieved53.33 min54.29 min
M.Performance (M = ((J·K)/H)·100)93.75%92.12%
Quality
N.Number of defectives1 piece0 piece
O.Quality (O = (J − N)/J·100)96.67%100%
Overall Equipment Effectiveness
P.OEE (P = I·M·O)65.91%79.55%
Publisher’s Note: MDPI stays neutral with regard to jurisdictional claims in published maps and institutional affiliations.

