Article

Synergistic Modes and Enhanced Oil Recovery Mechanism of CO2 Synergistic Huff and Puff

1
Unconventional Oil and Gas Institute, China University of Petroleum (Beijing), Beijing 102249, China
2
Jidong Oilfield Company Ltd. Exploration and Development Research Institute, Tangshan 063000, China
3
College of Science, China University of Petroleum (Beijing), Beijing 102249, China
*
Author to whom correspondence should be addressed.
Energies 2021, 14(12), 3454; https://doi.org/10.3390/en14123454
Submission received: 19 April 2021 / Revised: 4 June 2021 / Accepted: 5 June 2021 / Published: 10 June 2021

Abstract

:
With the gradual declining of oil increment performance of CO2 huff-and-puff wells, the overall oil exchange rate shows a downward tendency. In this regard, CO2 synergistic huff-and-puff technologies have been proposed to maintain the excellent effect and extend the technical life of such wells. However, there is no specific research on the mechanism and synergistic mode of CO2 huff and puff in horizontal wells. This study aims to establish the synergistic mode and determine the adaptability and acting mechanism of CO2 synergistic huff and puff. Three synergistic huff-and-puff modes are proposed based on the peculiarity of the fault-block reservoir’s small oil-bearing area and broken geological structure. We establish three typical CO2 synergistic huff-and-puff models and analyze the influence of different geological and development factors on the huff-and-puff performance with numerical simulation. Each factor’s sensitivity is clarified, and the enhanced oil recovery (EOR) mechanism of CO2 synergistic huff and puff is proposed. The sensitivity evaluation results show that the reservoir rhythm, inter-well passage, well spacing, high-position well liquid production rate, and middle-well liquid production rate are extremely sensitive factors; the stratum dip and injection volume allocation scheme are sensitive factors; and the relationship with structural isobaths is insensitive. The EOR mechanism of synergistic huff and puff includes gravity differentiation, supplementary formation energy, CO2 forming foam flooding, and coupling effect of production rate and oil reservoirs. The implementation conditions of the two-well cooperative stimulation mode are the simplest. The two-well model is suitable for thick oil layers with a positive rhythm and large formation dip. The single-well mode requires no channeling between the wells, and the multi-well mode requires multi-well rows and can control the intermediate well’s fluid production rate. Field application at C2X1 block shows a good performance with a total oil increment of 1280 t and an average water-cut reduction of 57.7%.

1. Introduction

In recent years, the greenhouse effect has become one of the 10 major environmental problems that threaten human survival, and it has become a focus of attention. Although excessive CO2 content is an essential factor leading to climate change and even severe natural disasters, it is useful in oilfield development [1]. Reasonable use of CO2 can effectively increase oilfield production and alleviate energy shortage [2,3,4]. The CO2 flooding and storage technology uses CO2 to drive oil to improve oil recovery while realizing the geological storage of CO2. Such technology provides economic and social benefits and is also the most effective manner to reduce greenhouse gas emissions under current economic and technical conditions. The CO2 storages are mainly divided into geological storage, marine storage, and vegetation [5]. There are three types of burial, among which the geological burying technology is relatively mature. At present, the central geological bodies that are internationally recognized as suitable for CO2 burying include oil reservoirs, natural gas reservoirs, saline aquifers, and coal seams [5,6]. The ideal place for CO2 geological storage considering economic and technical aspects is the oil reservoir [7]. During the oilfield development process, a clearer understanding of the oil reservoir’s geological properties has been obtained, enabling the safe and effective storage of CO2 while protecting the ecological environment. In addition, it can significantly improve oil recovery and provide certain economic benefits.
Considering the CO2 application experience in major oilfields at home and abroad, the CO2 enhanced oil recovery (EOR) technology can be applied in high- and low-permeability reservoirs as well as high- and low-viscosity reservoirs. The construction process is relatively simple, the success rate is high, and the cost is low. CO2 can improve the recovery rate and be stored, which is the goal pursued by oil companies [8]. CO2 flooding is the primary technology for improving the recovery rate of low-permeability reservoirs and reducing greenhouse gas emissions. However, as the implementation of CO2 flooding requires a complete injection-production well pattern, there are technical problems such as easy gas channeling and low sweep coefficient [9]. For single oil wells, small oil sand bodies, or small fault-block reservoirs with few oil wells, a CO2 huff-and-puff technology was proposed [10,11,12,13,14]. This technology consists of the injection of liquid CO2, at a pressure lower than the fracture pressure of the formation, to perform reasonable CO2 huff and puff to supplement the formation energy. Thus, it promotes the controlled displacement of CO2 near the well to realize the full spread and effective production of the remaining oil near the well [15,16,17,18,19].
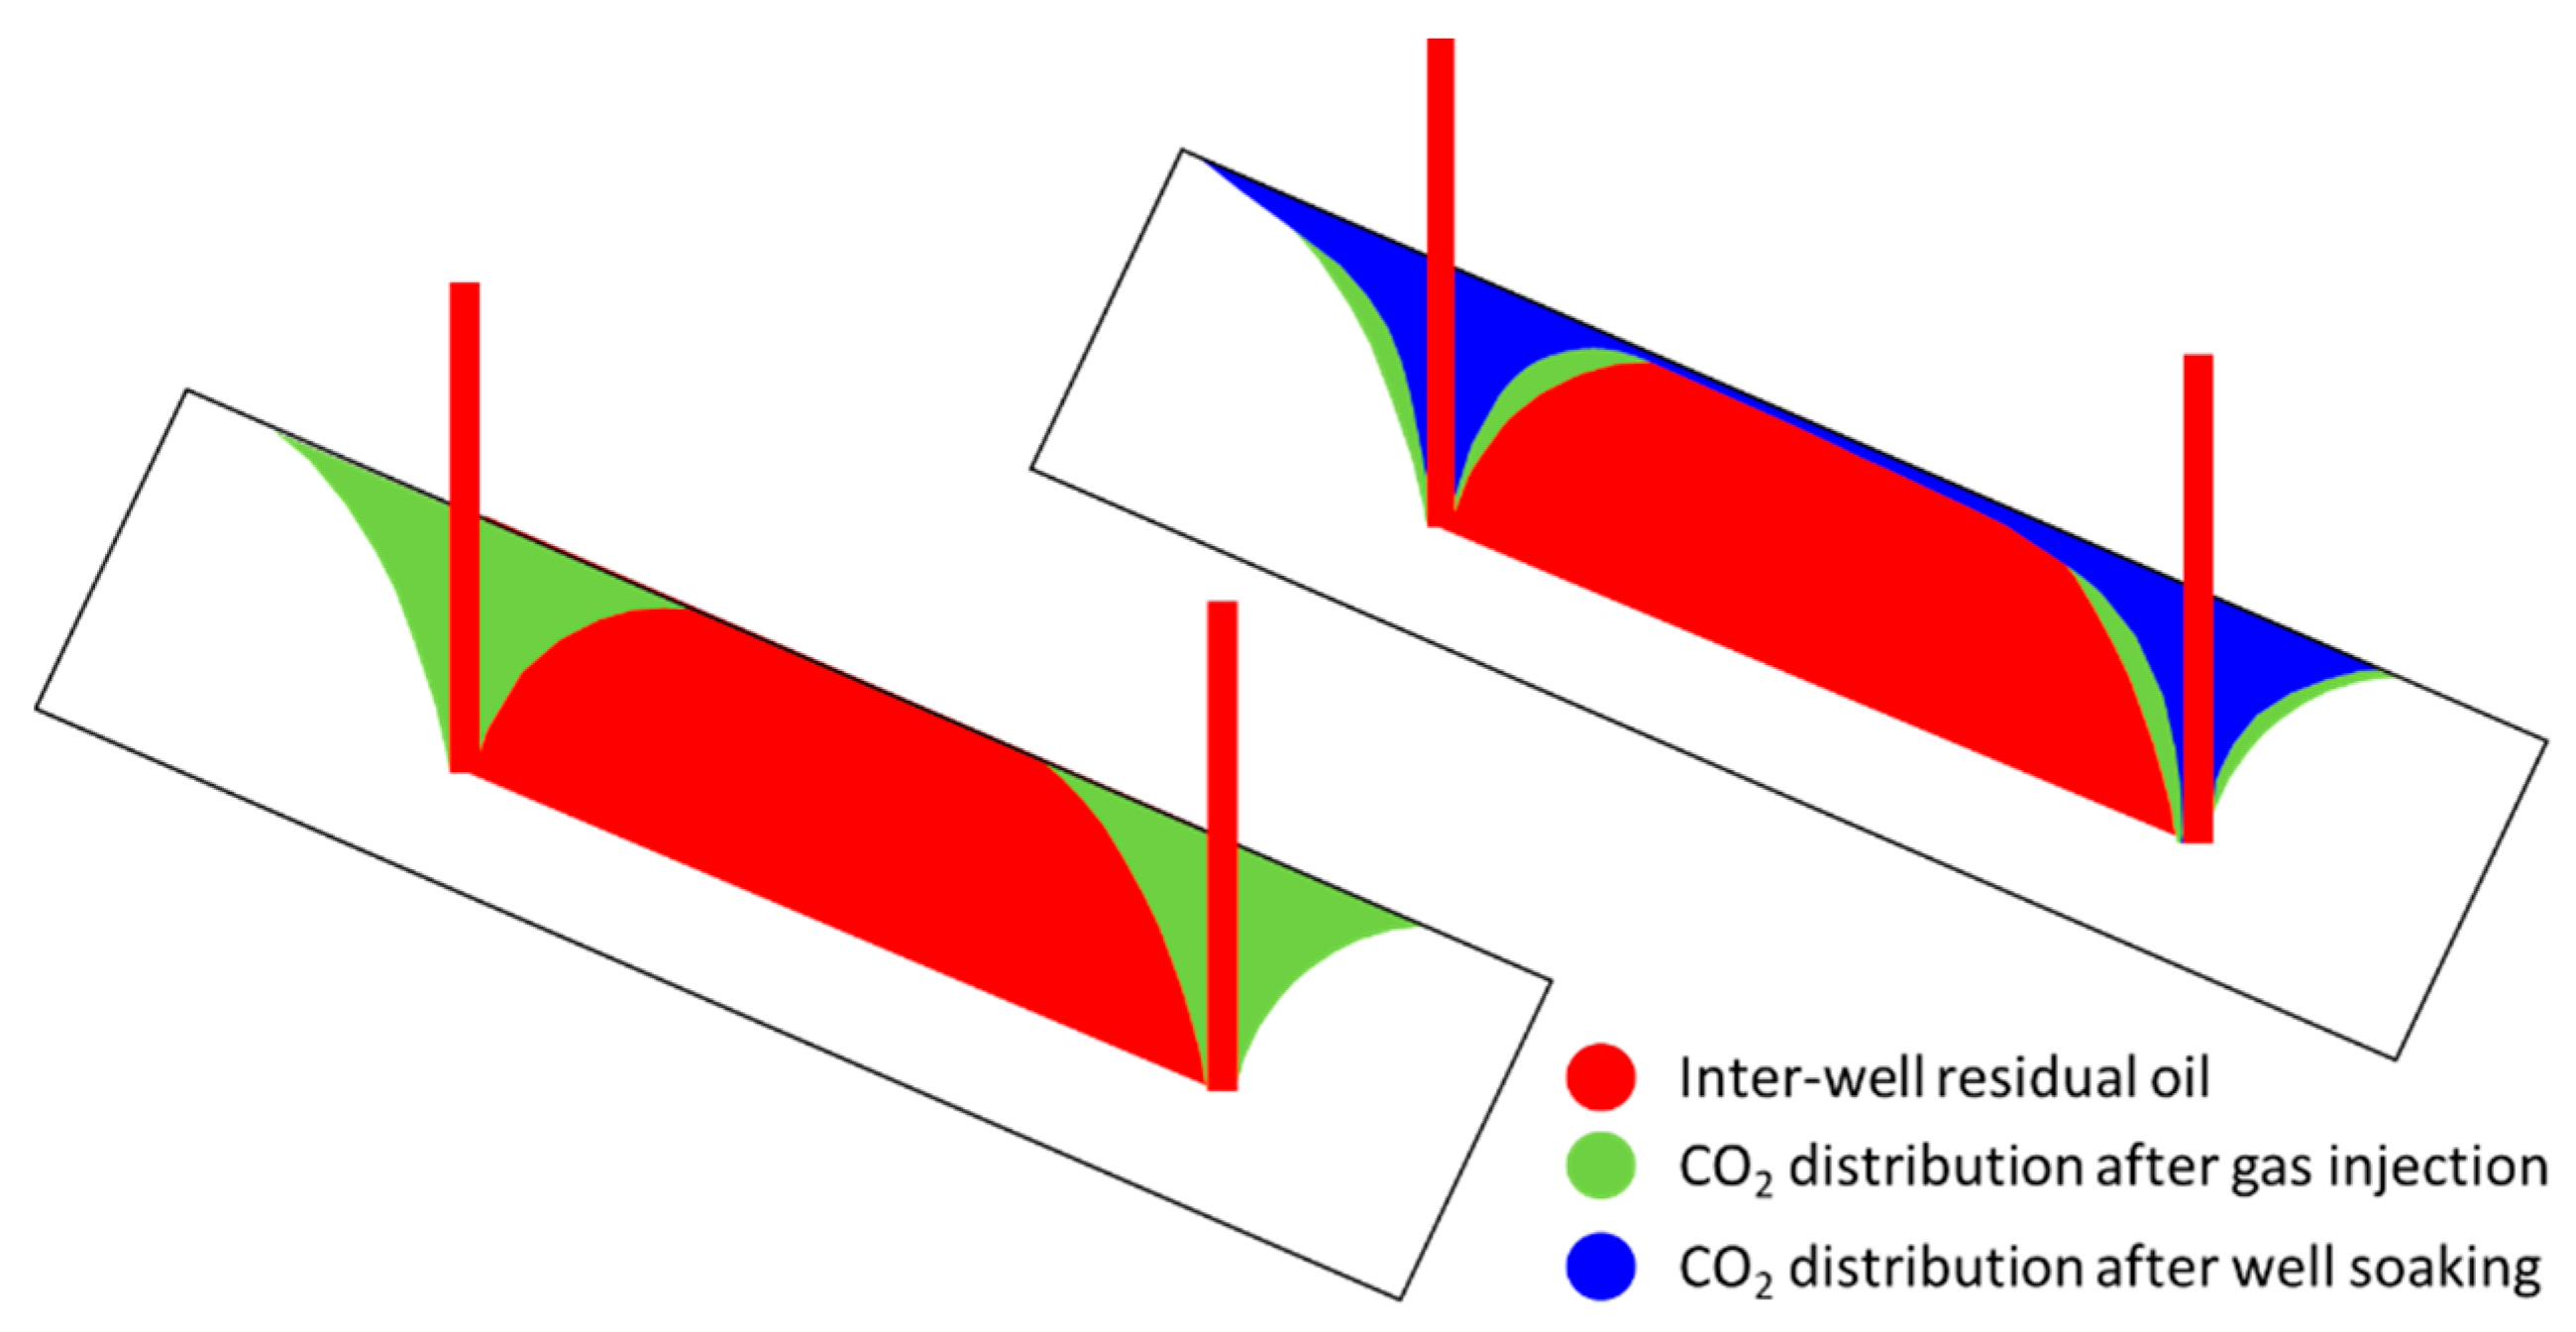
With the declined performance of the first batch of CO2 huff-and-puff wells, multiple rounds of CO2 huff and puff have been gradually performed [20]. Although the overall oil exchange rate has shown a downward tendency from the implementation perspective, it still exhibits high efficiency and input–output ratios. The number of oil wells using this technology and the production of oil in the overall measurements annually increase [21,22,23], which is one of the critical production stimulation measures for onshore oilfields. However, CO2 huff and puff of a single horizontal well holds a small effective range, limited swept volume, and a short practical period for water control and oil increase. Moreover, the irregular well pattern distribution of fault-block reservoirs limits the effect of water control and oil enhancement of single-well CO2 injection of horizontal wells. The onshore oilfield actively develops supporting processes to maintain its excellent effect and extend this measure’s technical life. During the CO2 huff-and-puff process of a single horizontal well, an increase in oil production and a decrease in water cut were observed in adjacent horizontal wells. This implies that there is a synergistic effect between wells that can optimize adjacent wells’ production performance. Researchers [24] performed stimulation measures of CO2 synergistic huff and puff [25] after determining the oil-increasing mechanism of adjacent wells [26] and the reasons for inefficient and ineffective wells of single-well CO2 huff and puff [27,28]. Multi-well synergistic CO2 throughput adopts reasonable and orderly CO2 throughput. Multiple points are balanced to supplement energy formation within the well area and promote CO2 effective sweeping and efficient utilization under controlled displacement near wells. Figure 1 is the schematic diagram of horizontal well synergistic CO2 huff and puff. By comparing the CO2 distribution after gas injection and well soaking, it can be seen that after CO2 moving up along the formation after well soaking, which means in the production period, the inter-well residual oil can be produced out. The effective displacement between wells can optimize displacement including gravity drive [29], elastic drive and viscosity reduction [30], rigid water drive oil production under multiple force conditions [31], and realize effective production and balanced use of wells in well groups [32].
However, there is no specific research on the enhanced oil recovery (EOR) mechanism and synergistic mode of CO2 synergistic huff and puff in horizontal wells. Based on fault-block reservoirs’ characteristics with small oil-bearing area, broken structure, and lack of well-developed well patterns, three synergistic huff-and-puff modes are proposed. Through numerical simulation, we study the influence of geological and development factors on CO2 synergistic huff-and-puff performance. Based on the variation of oil increment, water cut, water saturation distribution, and oil viscosity distribution, each factor’s sensitivity is clarified. The EOR mechanism and adaptability of synergistic modes are summarized. A field application of CO2 synergistic huff and puff is performed to verify the applicability and development performance of CO2 synergistic huff and puff.

2. Numerical Simulation Model

There are many geological and development factors that need to be considered [33,34,35]. On the one hand, the physical simulation experiment is time consuming, and there are many uncontrollable factors during the experiment. On the other hand, the numerical model is highly controllable, and a factor analysis can be reliably performed. Therefore, numerical simulation methods are used to establish a typical model based on the target block reservoir parameters to study the influence of geological and development factors on the throughput effect under different throughput modes.

2.1. Model Design

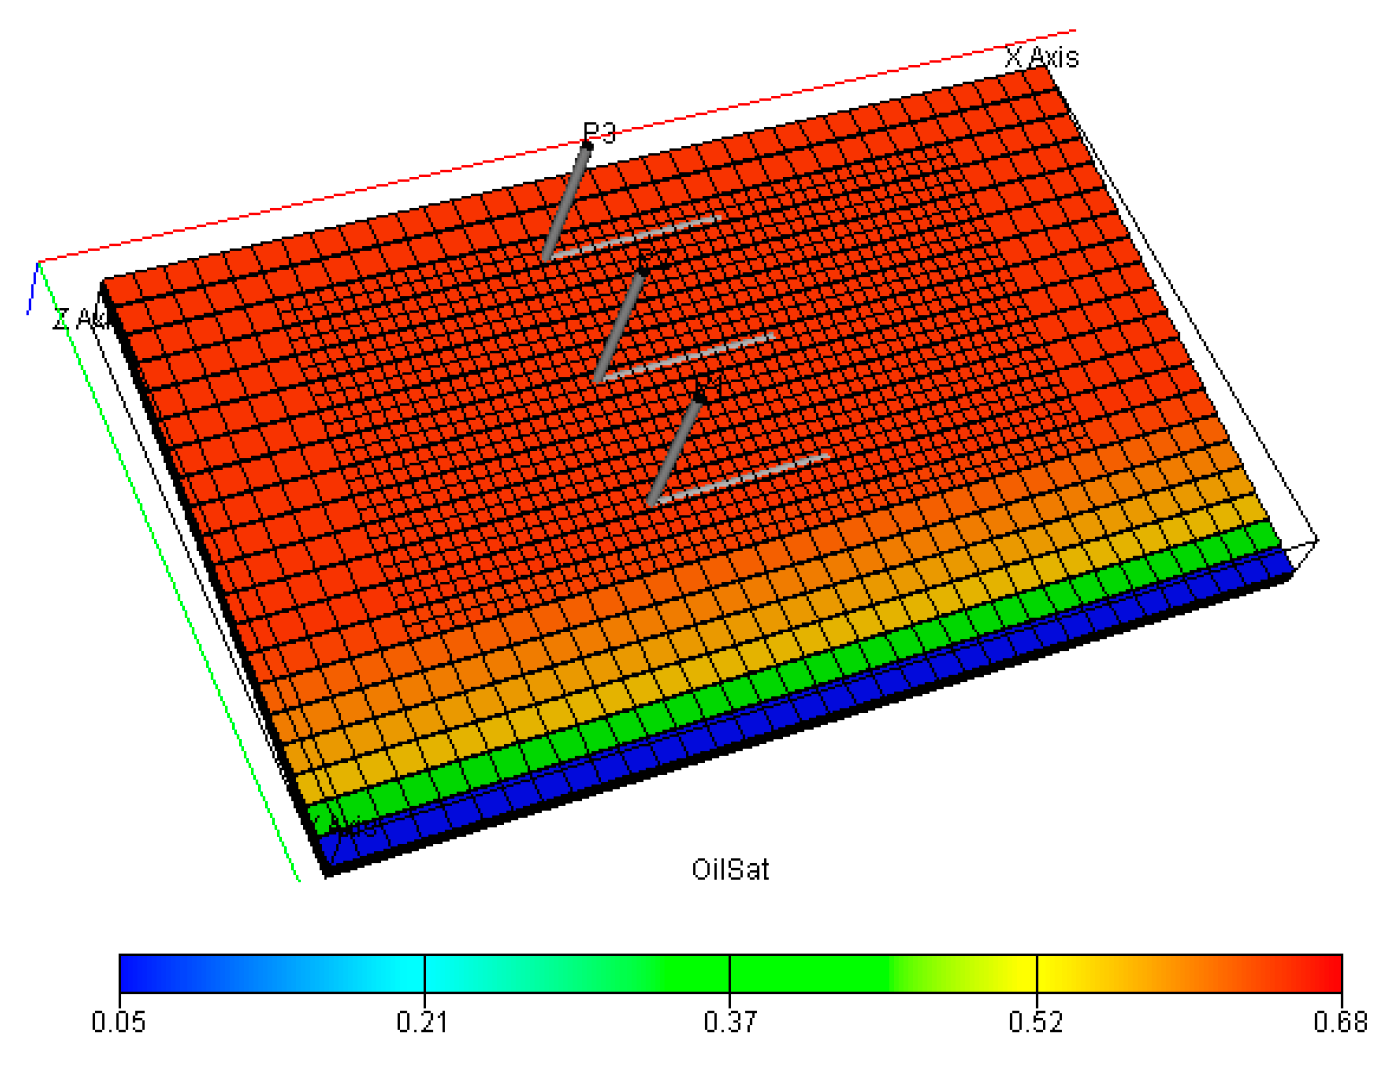
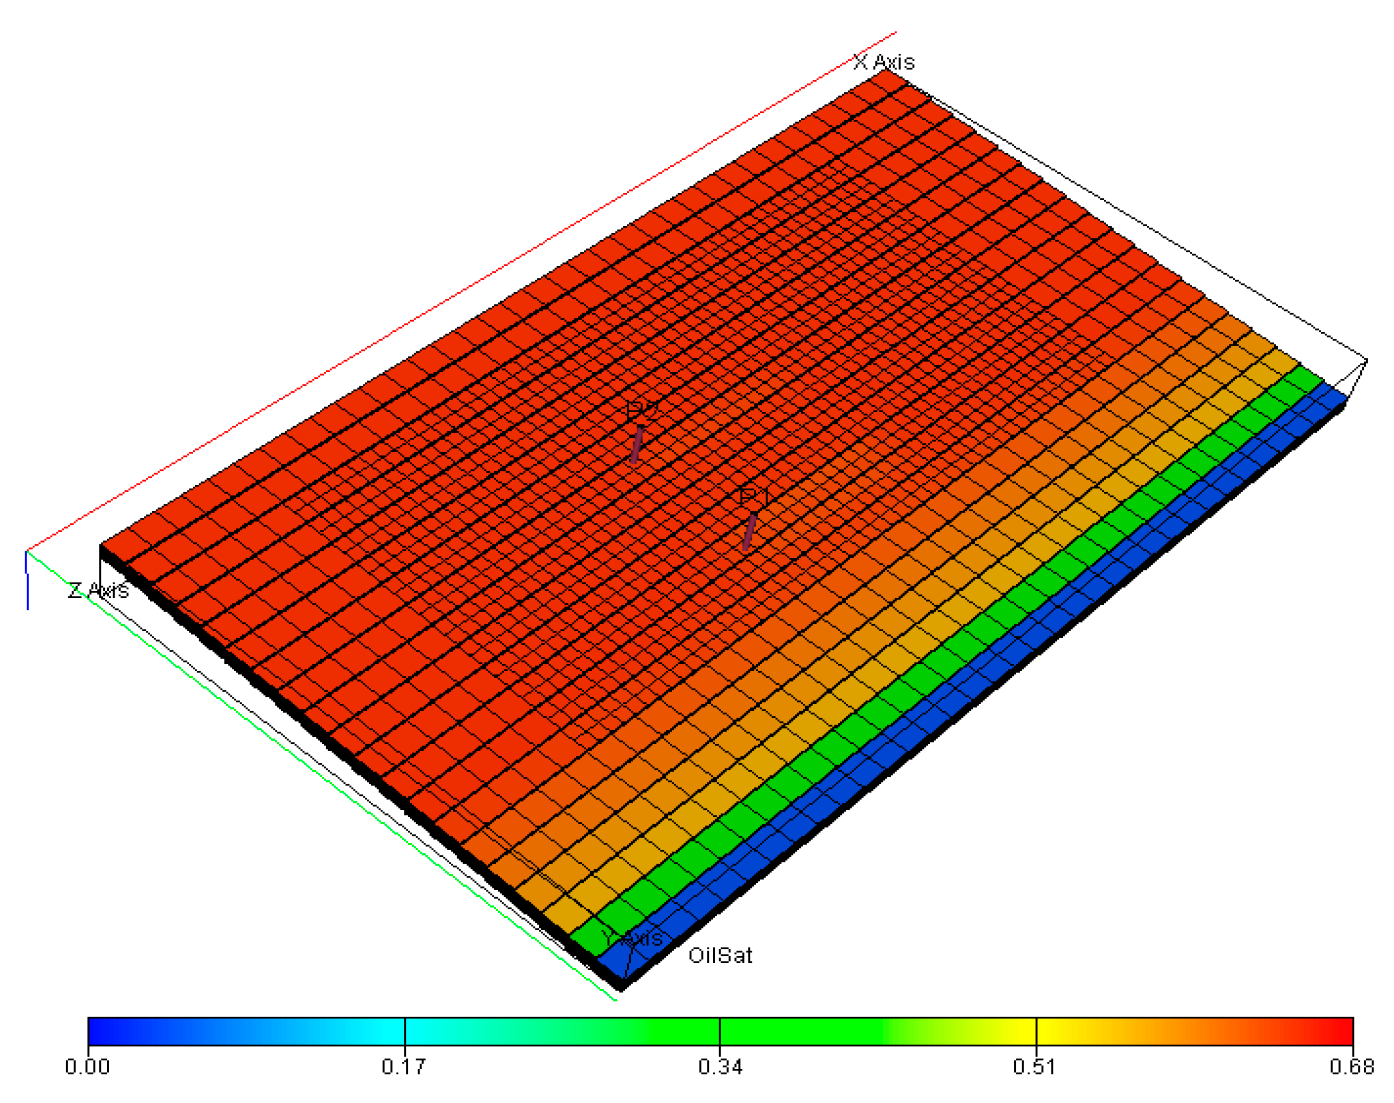
An eclipse digital simulation software and component modules were used to establish a typical model of synergistic CO2 huff and puff. The simulation area is 350 m long and 200 m wide, and the model uses horizontal well production. The third layer is produced by default; that is, the horizontal section of the horizontal well is located one third away from the top of the oil layer. The grid size of the area near the horizontal well is 5 m × 5 m, whereas the grid of other areas is 10 m × 10 m. A total of 11 grids are divided in the Z direction, and the total grid number of the typical model after encryption is 17,600. The model parameters are set according to the reservoir parameters of the C2X1 block. The model porosity is 0.26; the permeability increases with the depth from 30 to 800 mD to simulate a positive rhythm reservoir; the initial average oil saturation is 0.55, which decreases with the increase in the structural depth; the initial formation pressure is 17.7 MPa; and the crude oil viscosity at formation temperature is 50 mPa·s. Two typical models are designed, one with two production wells (model I) and the other with three production wells (model II), to study the geological parameters and development parameter change laws under different synergistic huff-and-puff modes. P1 and P2 in model I are located in the low and high parts of the structure, respectively. In model II, P1 is located in the low part, P2 is located in the middle, and P3 is located in the high part of the structure. The two models share the same gridding partition, fluid properties, and pressure characteristics. Similarly, the oil saturation distribution of each model is shown in Figure 2 and Figure 3.

2.2. Model Simulation Parameters

2.2.1. CO2–Oil System Phase Behavior

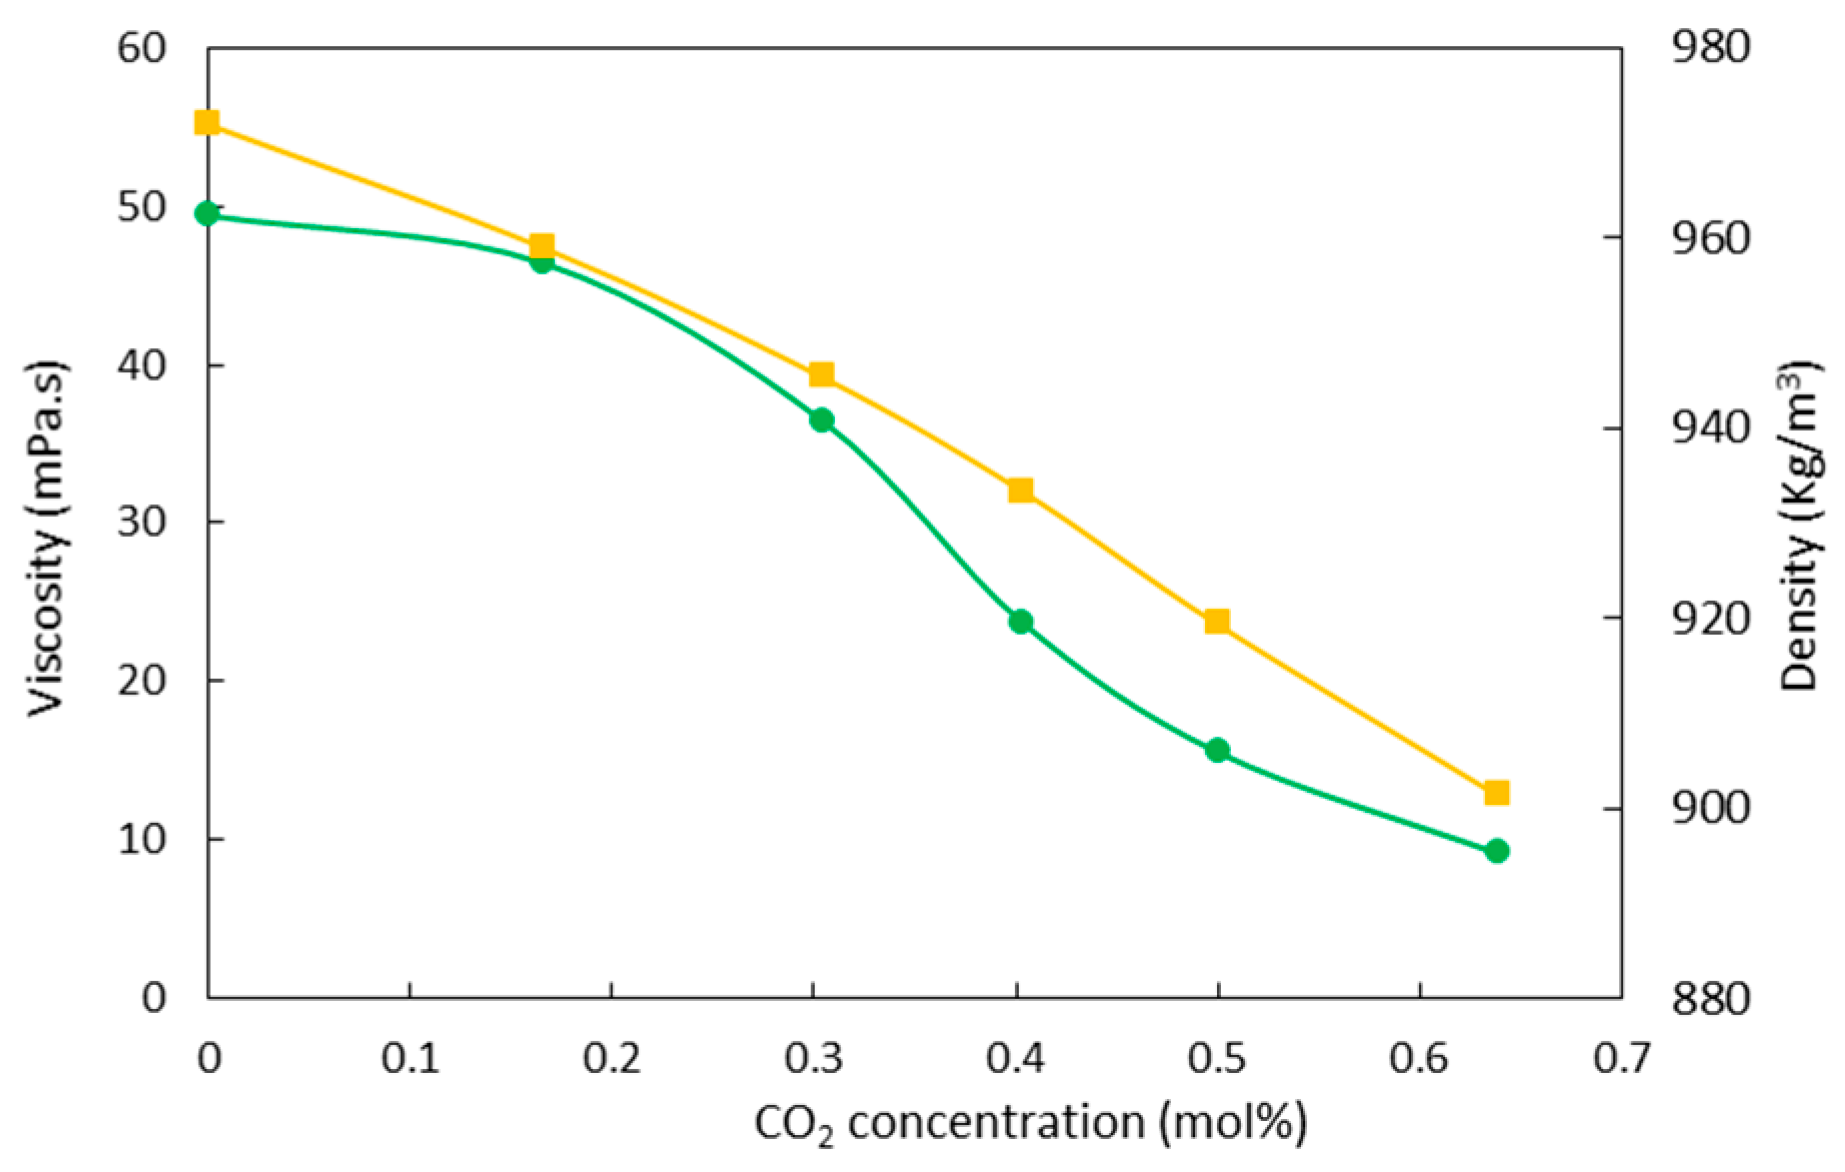
In order to calculate the CO2 concentration accurately in the process of CO2 huff and puff, the components of production well output content were analyzed to conduct the system phase behavior matching [36], and the output content composition was shown in Table 1. The dissolution and molecular diffusion [37] of CO2 in crude oil lead to oil swelling, oil viscosity reduction, and gravity number changing [38]. CO2–oil mixing effect is crucial for enhancing oil recovery in the process of CO2 synergistic huff and puff [39]. Therefore, the viscosity and density of the CO2–oil system with different CO2 concentrations were tested to present the properties of CO2 and oil in the simulation. Figure 4 and Table 2 show the viscosity and density of CO2–oil system, and it can be seen that the viscosity and density decrease with the increase in CO2 concentration. The critical properties of CO2–oil system including bubble point pressure, critical pressure, and critical temperature are 5.94 MPa, 2.27 MPa, and 785.02 °C, respectively.

2.2.2. Basic Simulation Parameters

In the research process, in addition to the target parameters of the study, the default parameters of the model are the stratum dip angle of 6°, oil layer thickness of 6.6 m, and a large body of water with sufficient energy. The reservoir has positive rhythm, Lorentz coefficient of 0.5, and crude oil viscosity at formation temperature is 50 mPa·s. The horizontal section length is 70 m, parallel to the oil layer, and the entire horizontal section is perforated to the production oil. There is no interlayer, the horizontal section is located in the middle and upper parts of the oil layer, and the horizontal well is directly opposite. Then, we perform CO2 huff and puff when the water cut of production well reaches 98%. The daily gas injection rate of a single well is 100 t with the total injection volume of 400 t. In sequence, the gas injection well is shut down for 30 days. After well soaking, P1 and P2 switch to open simultaneously. The basic parameters of the typical model are shown in Table 3.

2.3. Research Methodology

This paper aims to propose the particular mechanism of enhanced oil recovery and the applicable conditions of the synergistic mode of CO2 synergistic huff and puff in fault-block reservoirs.
According to the feature of fault-block reservoir, we design three synergistic modes to conduct quantitative study of the influence of the geological and development factors to oil increment and water cut. Furthermore, the quantitative research results were used to determine the main control factors through sensitivity analysis based on the indicator parameter of sensitivity degree.
Then, making use of the sensitivity research results, from two aspects of reservoir conditions and development conditions, the qualitative and partial quantitative applicable situations of different synergistic modes were proposed to guide the implementation of CO2 huff and puff.
Besides ordinary enhanced oil recovery mechanism of CO2, there must be other mechanisms to strengthen the enhanced oil recovery efficiency for CO2 synergistic huff and puff. By analyzing the distribution of CO2, residual oil and water in the process of CO2 synergistic huff and puff at different levels of geological and development factors, the particular enhance oil recovery mechanisms were summarized.

2.4. Research Program

2.4.1. Synergistic Mode

Fault-block reservoirs have small oil-bearing areas and fractured structures, which hinder the establishment of a completed injection-production well pattern [11,17]. The inclination angle of the fault-block reservoir controlled by the structure is the key factor that affects the development performance. In addition, the development performances of wells in different structural positions of the fault-block reservoir are different. Several CO2 huff-and-puff field practices at home and abroad, comprehensive analysis results of implementation plans, and development effects of CO2 huff-and-puff field applications in heavy oil and fault-block reservoirs have indicated that wells in the lower structural position show better performance in CO2 huff and puff. Moreover, for the fault-block reservoir, the limitation of horizontal well arrangement along the direction of structural rise is identified as three rows [40,41]. We have calculated the development conditions of the CO2 synergistic huff-and-puff well group, which include the number of synergistic huff-and-puff wells, structural position of synergistic wells, positional relationship between the synergistic wells’ ligature and structural contour, synergistic well spacing, CO2 injection volume, and type of well pattern. Based on statistical data, the synergistic modes are summarized. According to the number of huff-and-puff wells, the implementation modes can be divided into three categories: single-well, two-well, and multi-well synergistic modes. Based on these three types, the distribution of oil, gas, and water movement before and after the stimulation treatment were evaluated. The synergistic modes are shown in Table 4.

2.4.2. Simulation Scheme

By means of reservoir numerical simulation, the geological and development factors that have a higher impact on oil increase and water-cut reduction are selected. The geological factors are objective and internal principal contradictions, whereas the development factors are subjective and external secondary contradictions. The structural conditions of geological factors, heterogeneity of the reservoir, and liquid production rate of development factors are the key aspects that affect the performance of CO2 synergistic stimulation development. By considering the value levels of different factors, the influence law of each factor on the synergistic huff-and-puff performance is studied to provide a reference for the reservoir adaptability study of horizontal well CO2 synergistic huff and puff.
(1) Two-well synergistic mode
When two horizontal wells perform CO2 synergistic huff and puff, geological factors, such as stratum dip, sedimentary rhythm, and permeability contrast of inter-well channel, need to be considered. It is necessary to study the allocation of CO2 injection volume between high- and low-structural-position wells, the well spacing, and the relationship with the depth isobaths. The parameter values of each factor are designed based on the parameter range of fault-block reservoirs. Geological and development factors and the parameter level of each factor of the two-well synergistic mode are shown in Table 5.
(2) Single-well synergistic mode
Single-well synergistic huff and puff means that when two rows of horizontal wells are used in reservoir development, CO2 huff and puff is implemented in lower position horizontal wells, while normal production is maintained in higher position horizontal wells. Compared with the two-well synergistic huff-and-puff mode, the research factors including injection volume allocation and the relationship with structural isobaths are uninvolved. Moreover, the influence law of stratum dip and sedimentary rhythm on production performance is universal. Under this mode, it is necessary to study the effect of permeability contrast of inter-well channel, well spacing, and liquid production rate of high-structural-position wells on the performance of CO2 synergistic huff and puff. The factors and parameter levels of the single-well synergistic mode are shown in Table 6.
(3) Multi-well synergistic mode
Multi-well synergistic huff and puff means that when there are three rows of horizontal production wells, and CO2 huff and puff is performed in high- and low-position wells, while the middle-position well is normally opened for production. This mode is clearly different from the previous two modes, particularly the liquid production rate of the middle well. Factors and parameter levels are shown in Table 7.

3. Simulation Results and Discussion

3.1. Simulation Results

3.1.1. Two-Well Synergistic Mode

For this mode, the following conditions are applied: stratum dip of 6°, thickness of the oil layer of 6.6 m, a large body of water with sufficient energy, positive rhythm, Lorentz coefficient of 0.5, length of the horizontal section of 70 m parallel to the oil layer, entire section discharged, viscosity of the crude oil of 90 mPa·s, no interlayers, and horizontal section located in the middle-upper part of the oil layer. The two horizontal wells are facing each other: P1 is in the lower position, and P2 is in the higher position. After the water cut of P1 reaches 98%, P1 and P2 simultaneously perform CO2 huff and puff. The daily gas injection volume of the well is 100 t, a total of 400 t is injected, and the wells are closed for 30 days. After well stuffy, P1 and P2 are opened for simultaneous production. During the simulation process, the model parameter settings are modified according to the parameter value.
(1) Stratum dip
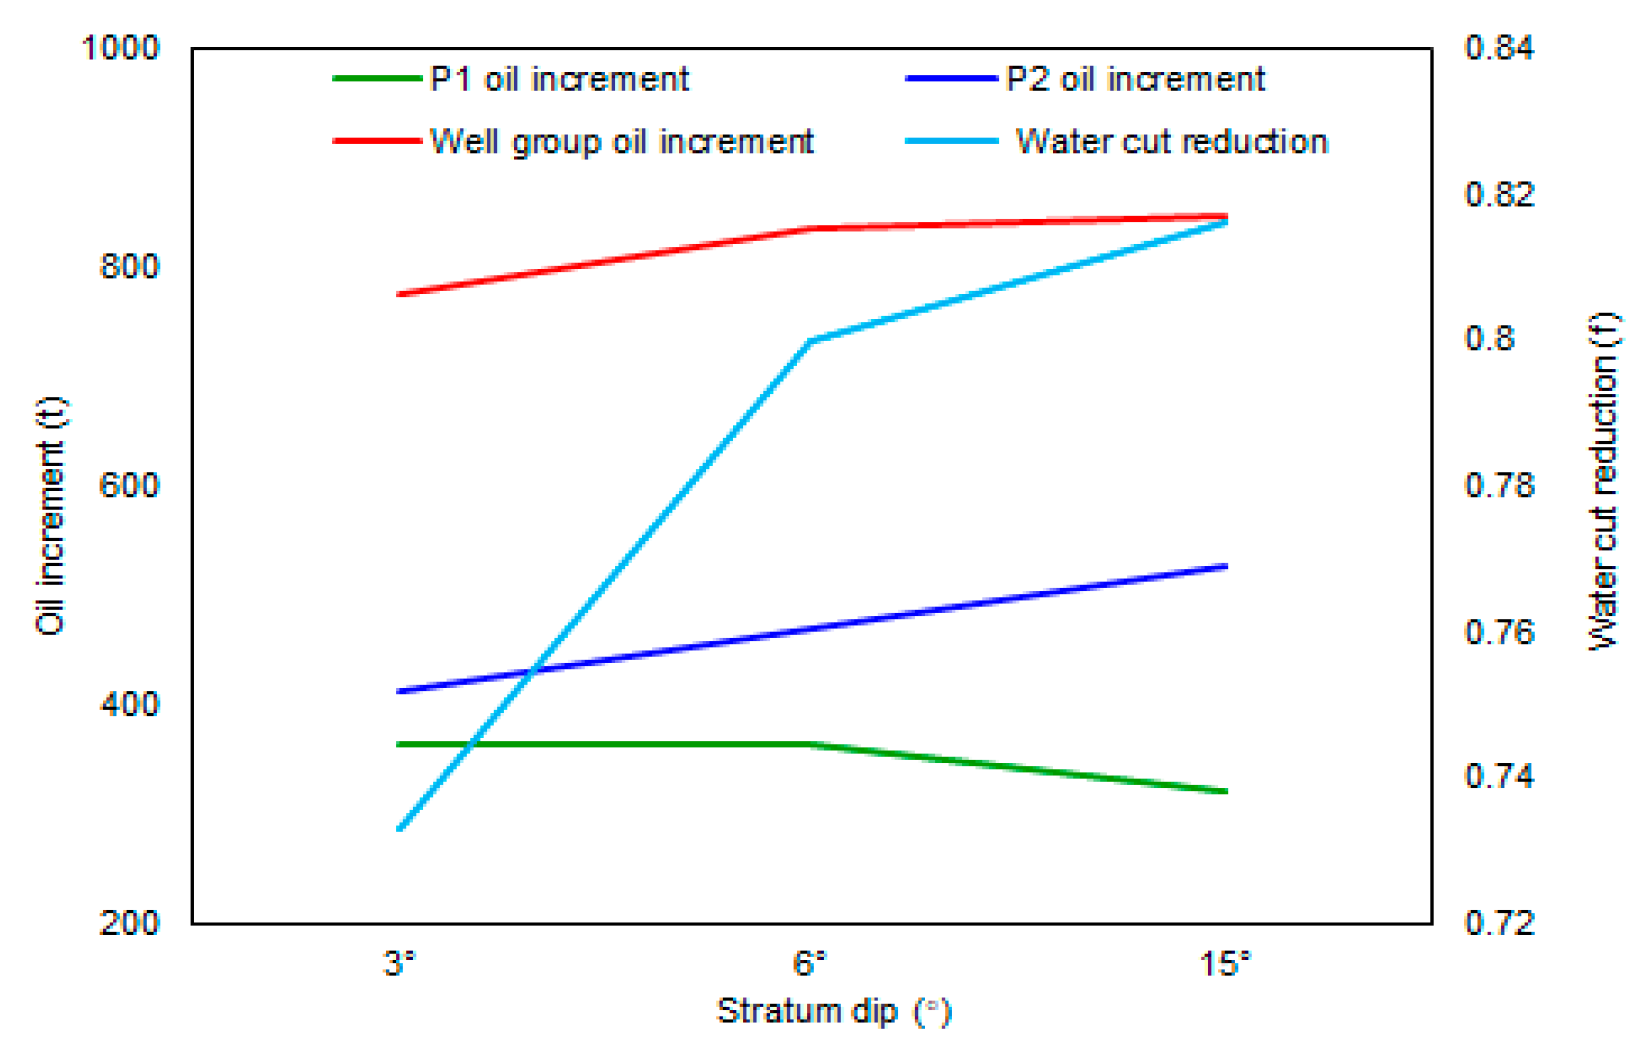
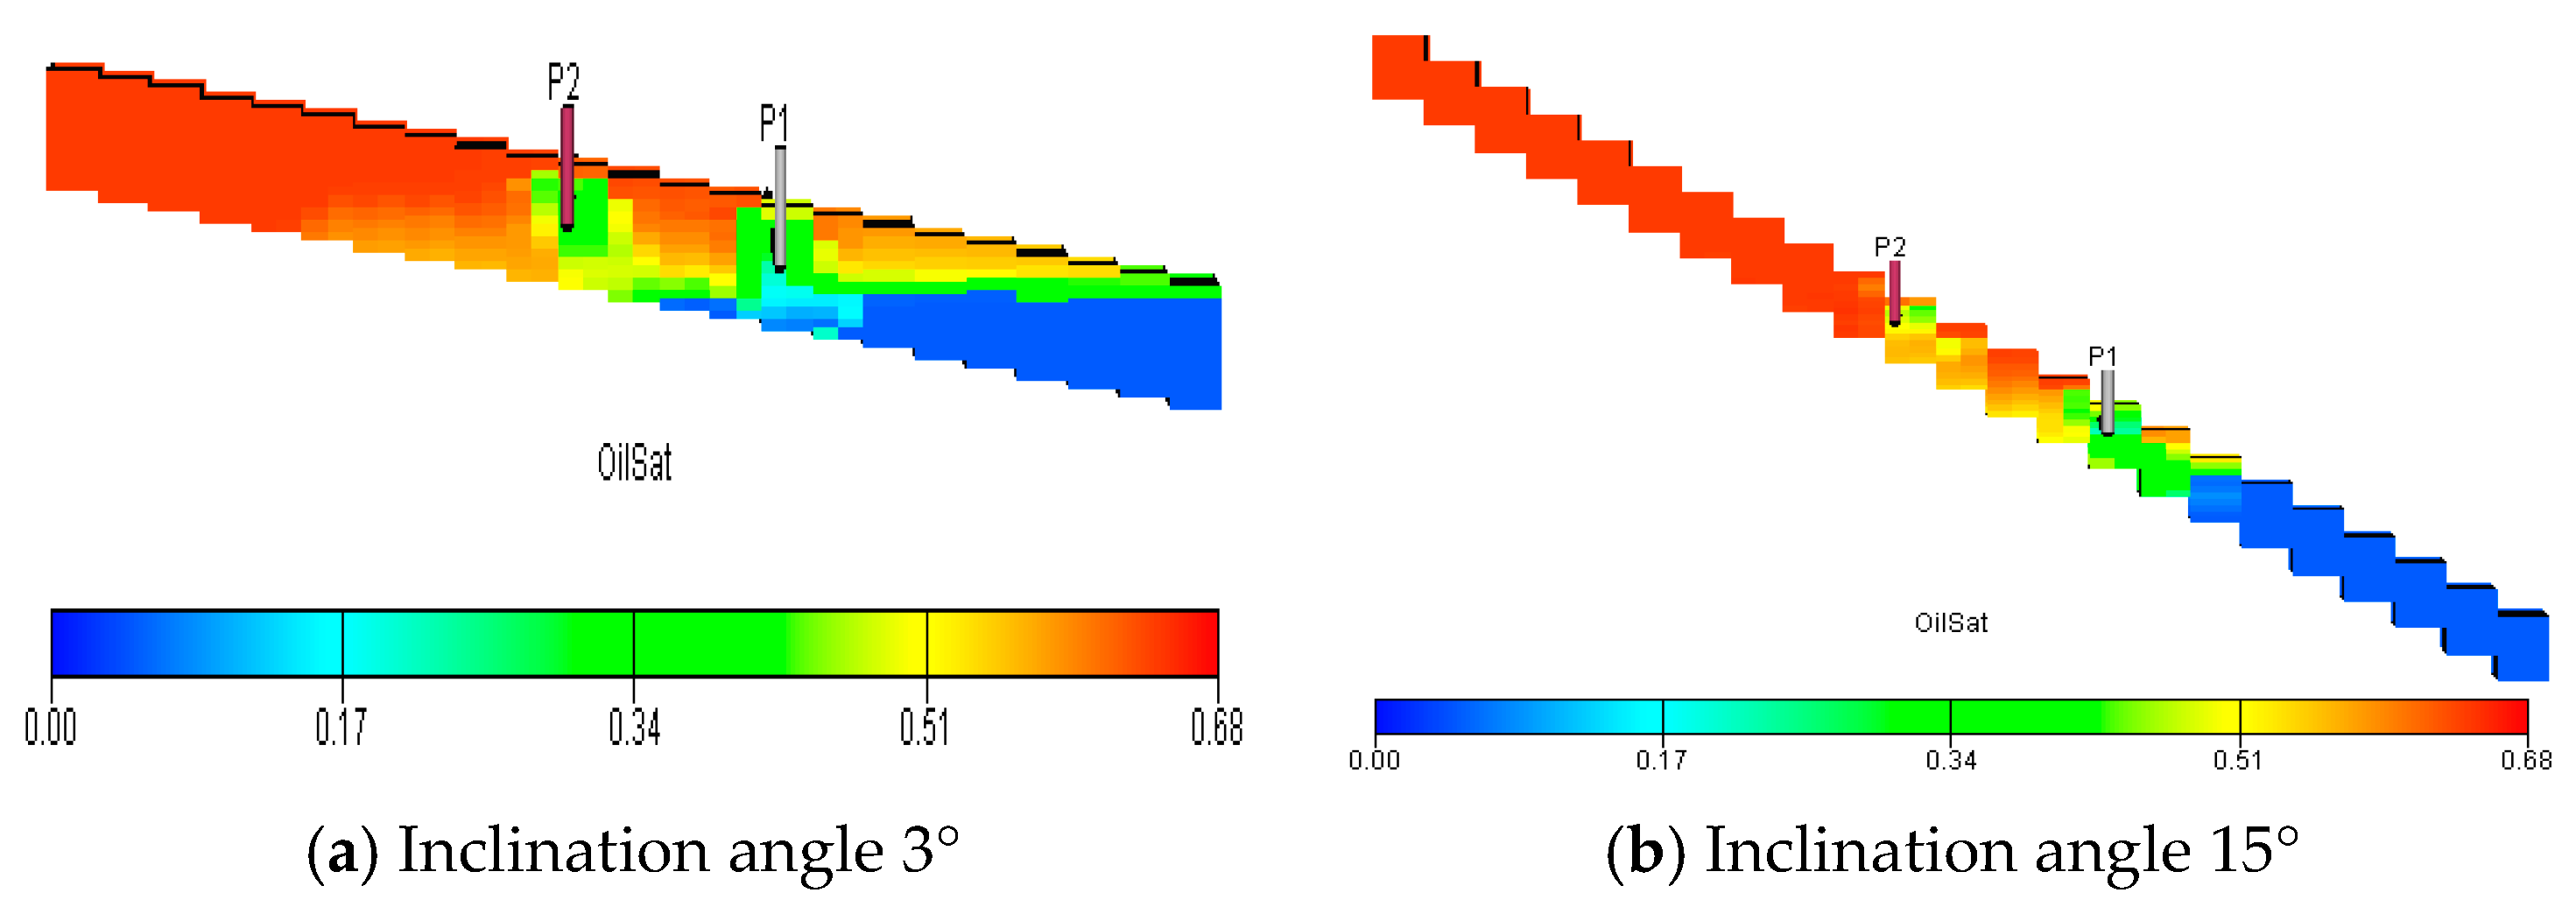
The stratum dip has a non-negligible effect on the water flooding development. When the local dip exists, the performance of the production wells in different structural positions is different [42]. In low structural positions, the water cut of the production wells rises faster, whereas water breakthrough occurs later for production wells in high structural positions. To analyze the influence of the stratum dip on the synergistic CO2 huff-and-puff development performance, we set the stratum dip to 3, 6, and 15° in the typical model.
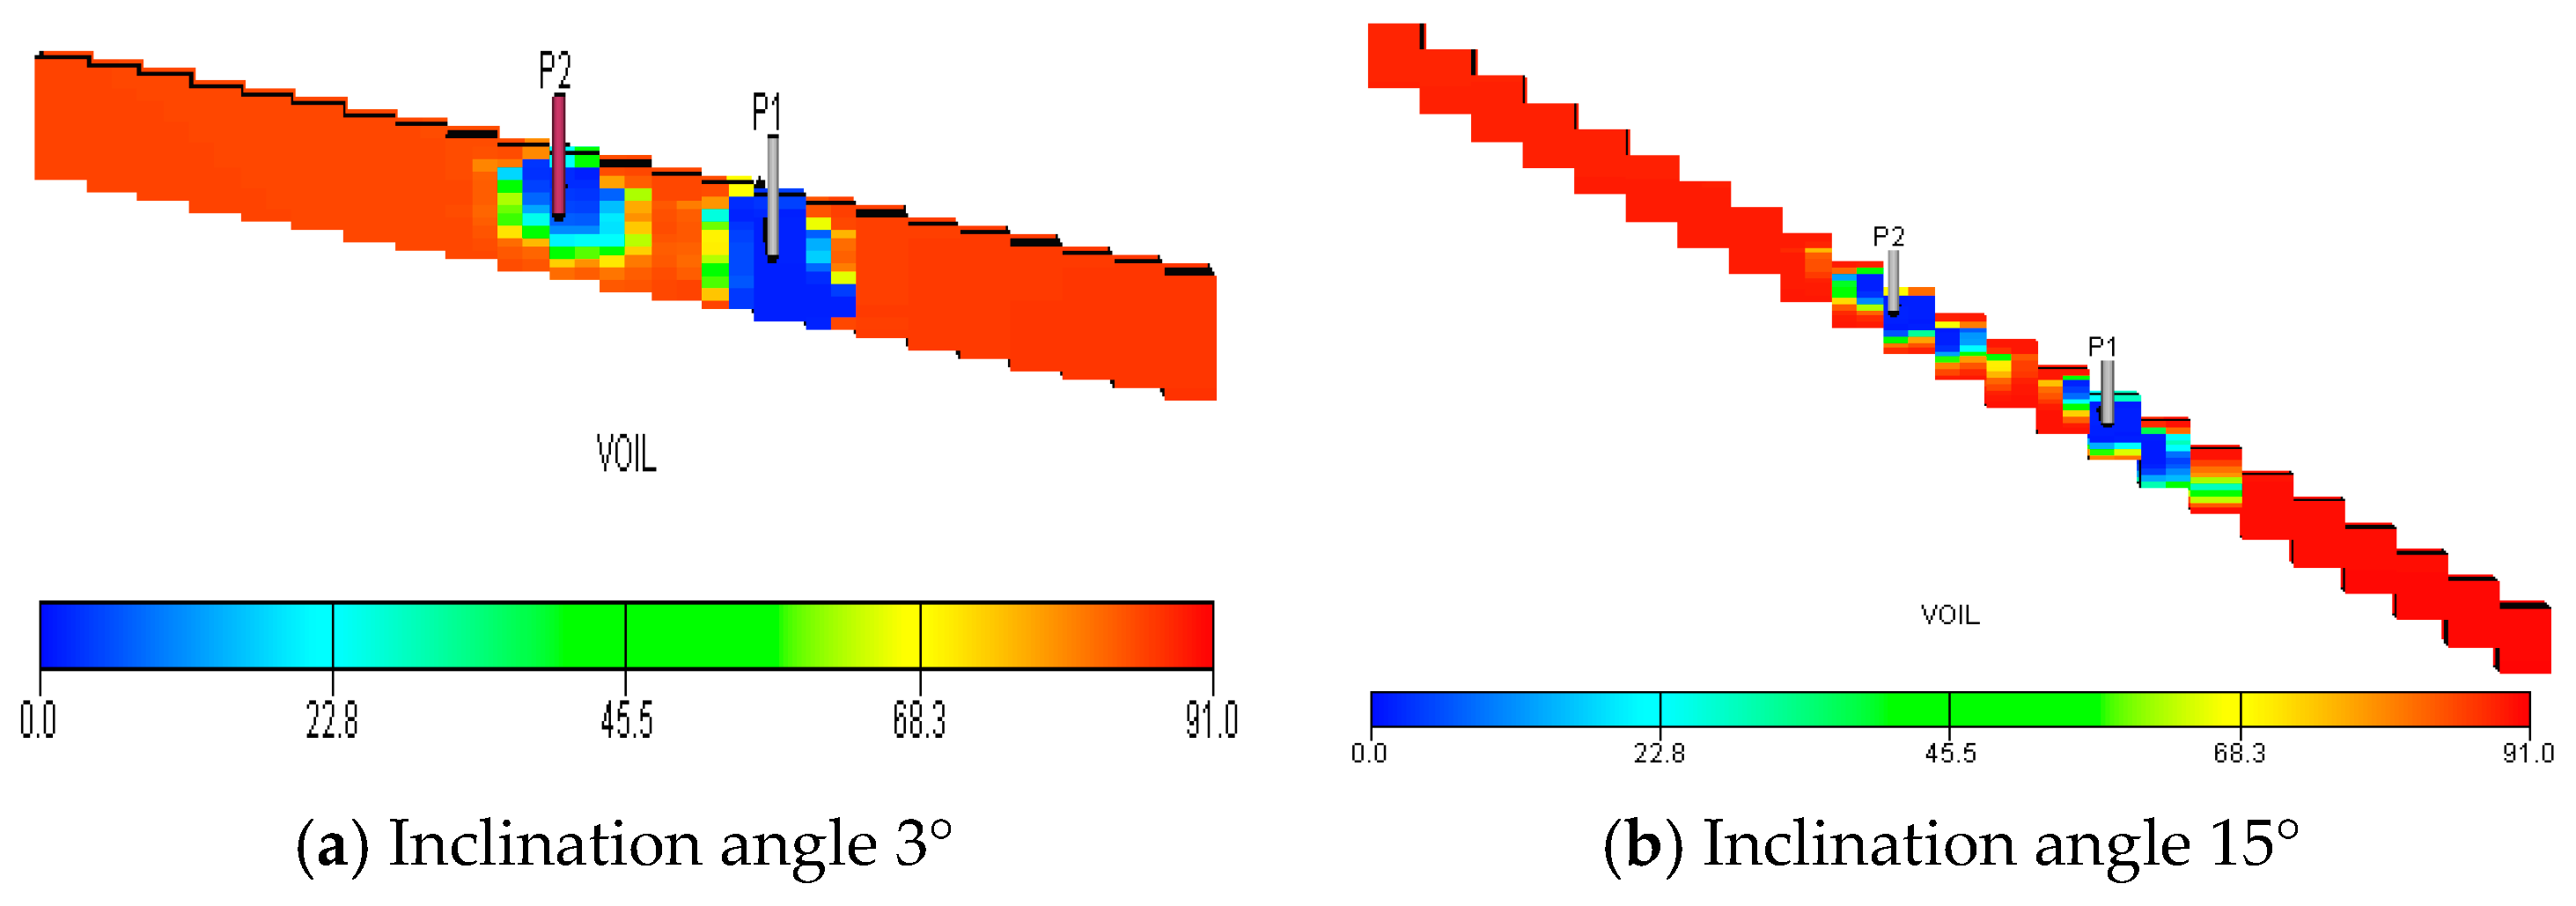
Figure 5 shows the oil increment and water-cut reduction of P1, P2, and well groups during the validity period. From Figure 5, it is observed that as the stratum dip increases, the oil increment of low-position production wells decreases, whereas it increases for high-position production wells. After the stratum dip angle exceeds 6°, the oil increment and water cut of the well group change slightly. They show a tendency of first increasing and then stabilizing with the increase in the stratum dip. Figure 6 shows the oil viscosity distribution after well stuffy. The figure indicates that when the stratum dip is 3°, the viscosity of the crude oil near the production well decreases, but there is no significant change in the density of the crude oil between P1 and P2. When the stratum dip increases to 15°, the range of oil viscosity reduction between wells continues to increase, indicating that under the action of gravity, the higher the stratum dip, the more evident the effect of gravity differentiation, which expands the action range of CO2. Hence, the stratum dip is a favorable factor for synergistic CO2 huff and puff. Figure 6 shows the distribution of oil saturation after the validity period. In Figure 7, we can see that as the stratum dip increases, the production range of P1 decreases because the injected gas moves upward under the action of gravity. As a result, the CO2 that acts on the low structural part decreases, and the performance of well P1 becomes worse. For the high structural and inter-well parts, as the stratum dip increases, the production range becomes larger, and the performance of P2 gradually improves.
(2) Sedimentary rhythm and well type
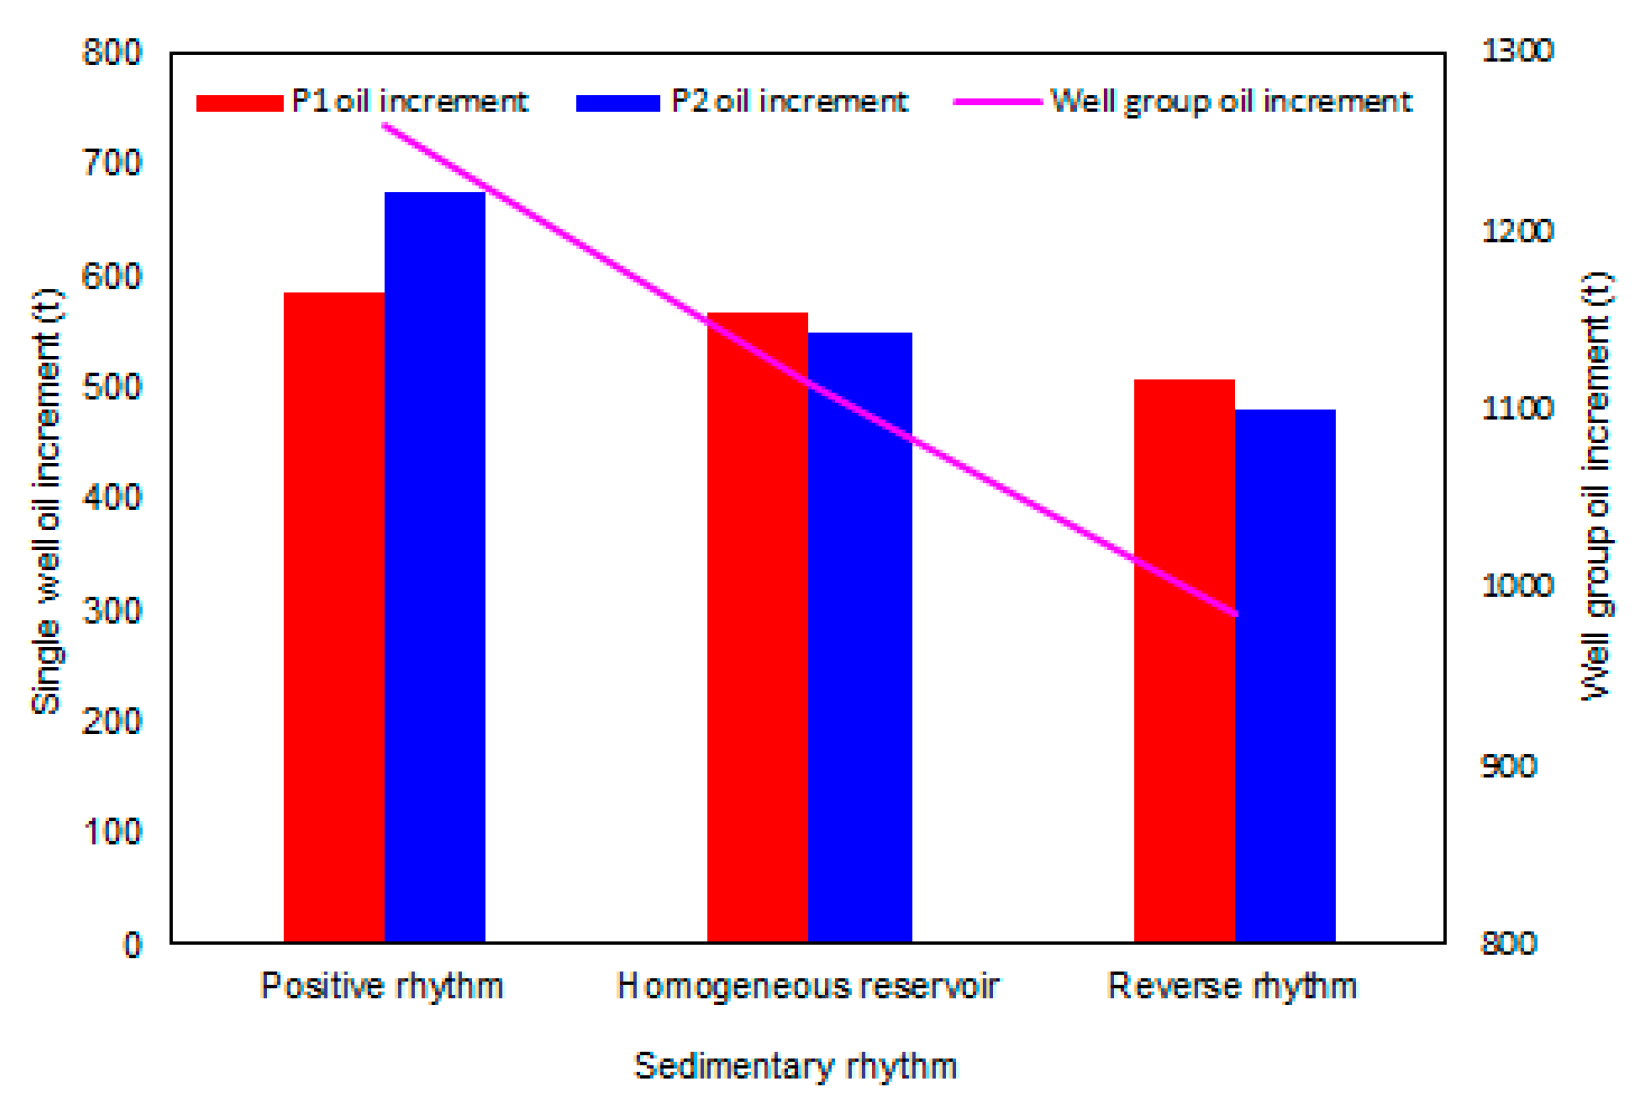
The water flooding field application indicates that the sedimentary rhythm mode of the reservoir is closely related to reservoir development performance [43]. The physical properties and oil saturation of the lower part of positive rhythm oil layer are better than those of the upper part, and the utilization degree of the lower part is also higher. The main productive zone of reverse rhythm oil layer is located in the upper part. This means that the lower part does not produce oil; thus, the performance of water flooding development is poor. The longitudinal oil–water distribution of homogeneous oil layers is relatively uniform, and the development performance is the relation between positive- and negative-rhythm reservoirs. For fault-block oil reservoirs, edge and bottom water are common. The positive rhythm, homogeneous, and reverse rhythm models are established to study the influence of well types and different formation sedimentary rhythms on the performance of synergistic CO2 huff and puff when the production well is close to the edge and bottom water. In addition, horizontal and vertical wells are used for CO2 synergistic huff and puff.
The oil increment of horizontal well P1, vertical well P2, and well groups are shown in Figure 8. It can be seen from Figure 8 that the oil increment of P1 and P2 decreases with the changing of sedimentary rhythm. For the P1 well, the oil increment decreases from 586 t of positive rhythm and 566 t of homogeneous reservoir to 506 t of reverse rhythm. For the P2 well, the oil increment decreases from 675 t of positive rhythm and 549 t of homogeneous reservoir to 480 t of reverse rhythm. Comparing the oil increment of horizontal well P1 and vertical well P2, it was observed that the oil increasing performance of vertical wells in positive rhythm reservoirs is slightly better than that of horizontal wells. For homogeneous and reverse rhythm reservoirs, the development performance of horizontal wells is slightly better than that of vertical wells. The total oil increment of the well group is 1260 t for positive rhythm, 1115 t for the homogeneous oil reservoir, and 986 t for the reverse rhythm reservoir, and the total oil increment of the well group gradually decreases. Therefore, when the mixed well pattern of vertical and horizontal wells is implemented for synergistic CO2 huff and puff, positive rhythm is the optimal choice, followed by the homogeneous reservoir, and the reverse rhythm is the worst option.
Figure 9 shows the oil viscosity distribution after well stuffy. Comparing the viscosity reduction range, we can conclude that crude oil viscosity reduction is the largest for the positive rhythm reservoir, followed by homogeneous and reverse rhythm reservoirs. In addition, the viscosity reduction range of the reverse rhythm reservoir is concentrated in the upper part of the reservoir, and the longitudinal sweep effect is poor. Figure 10 shows the oil saturation distribution after validity period. Comparing the oil saturation distribution of the three different sedimentary rhythms, it was found that the decreasing range of oil saturation in the positive rhythm reservoir is evidently large, that is, the range of reservoir utilization during the validity period is larger. The porosity and permeability of the lower part of the positive rhythm reservoir are relatively high. Under the action of CO2 injection, the crude oil expands, and the gravity differentiation is more effective. The positive rhythm reservoir shows better performance of synergistic CO2 huff and puff. The oil saturation of the lower part of positive rhythm reservoir is lower after validity period, indicating that bottom water cresting occurs. The closer to the edge and bottom water, the more evident the edge and bottom water intrusion. Comprehensive analysis results of well performance of these two types of wells in different sedimentary rhythms indicate that the performance of synergistic CO2 huff and puff is considerably affected by the sedimentary rhythm.
(3) Permeability contrast of inter-well channel
The dominant flow channels between wells are considerably important in distributing the remaining oil during water flooding development [44]. For gas flooding development, existing studies have shown that the existence of dominant flow channels causes gas channeling along the flow channel and worsens the development performance of gas flooding. To clarify the influence of the advantageous flow channels between wells on the performance of synergistic CO2 huff and puff, we set advantages flow channel in 3–11 simulation layers. The channel permeability contrasts are 1, 20, 50, and 100, and the permeability profiles diagrams of permeability contrast 1 and 100 are shown in Figure 11.
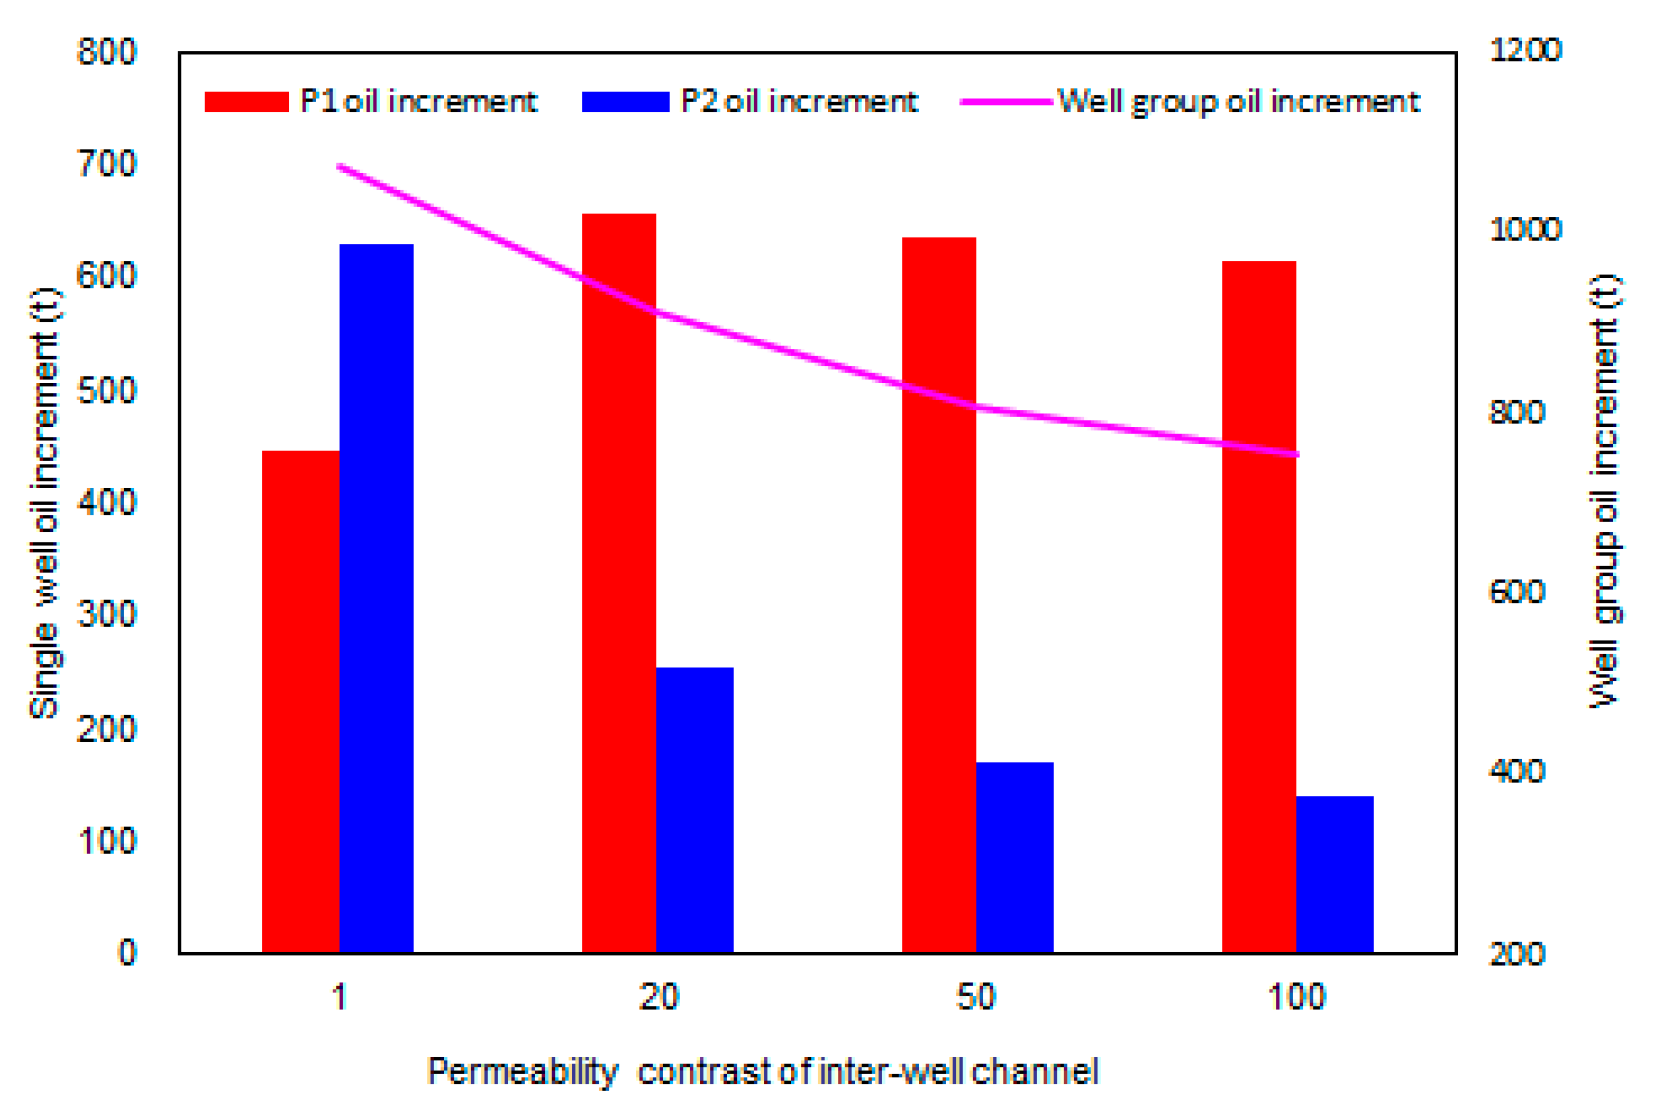
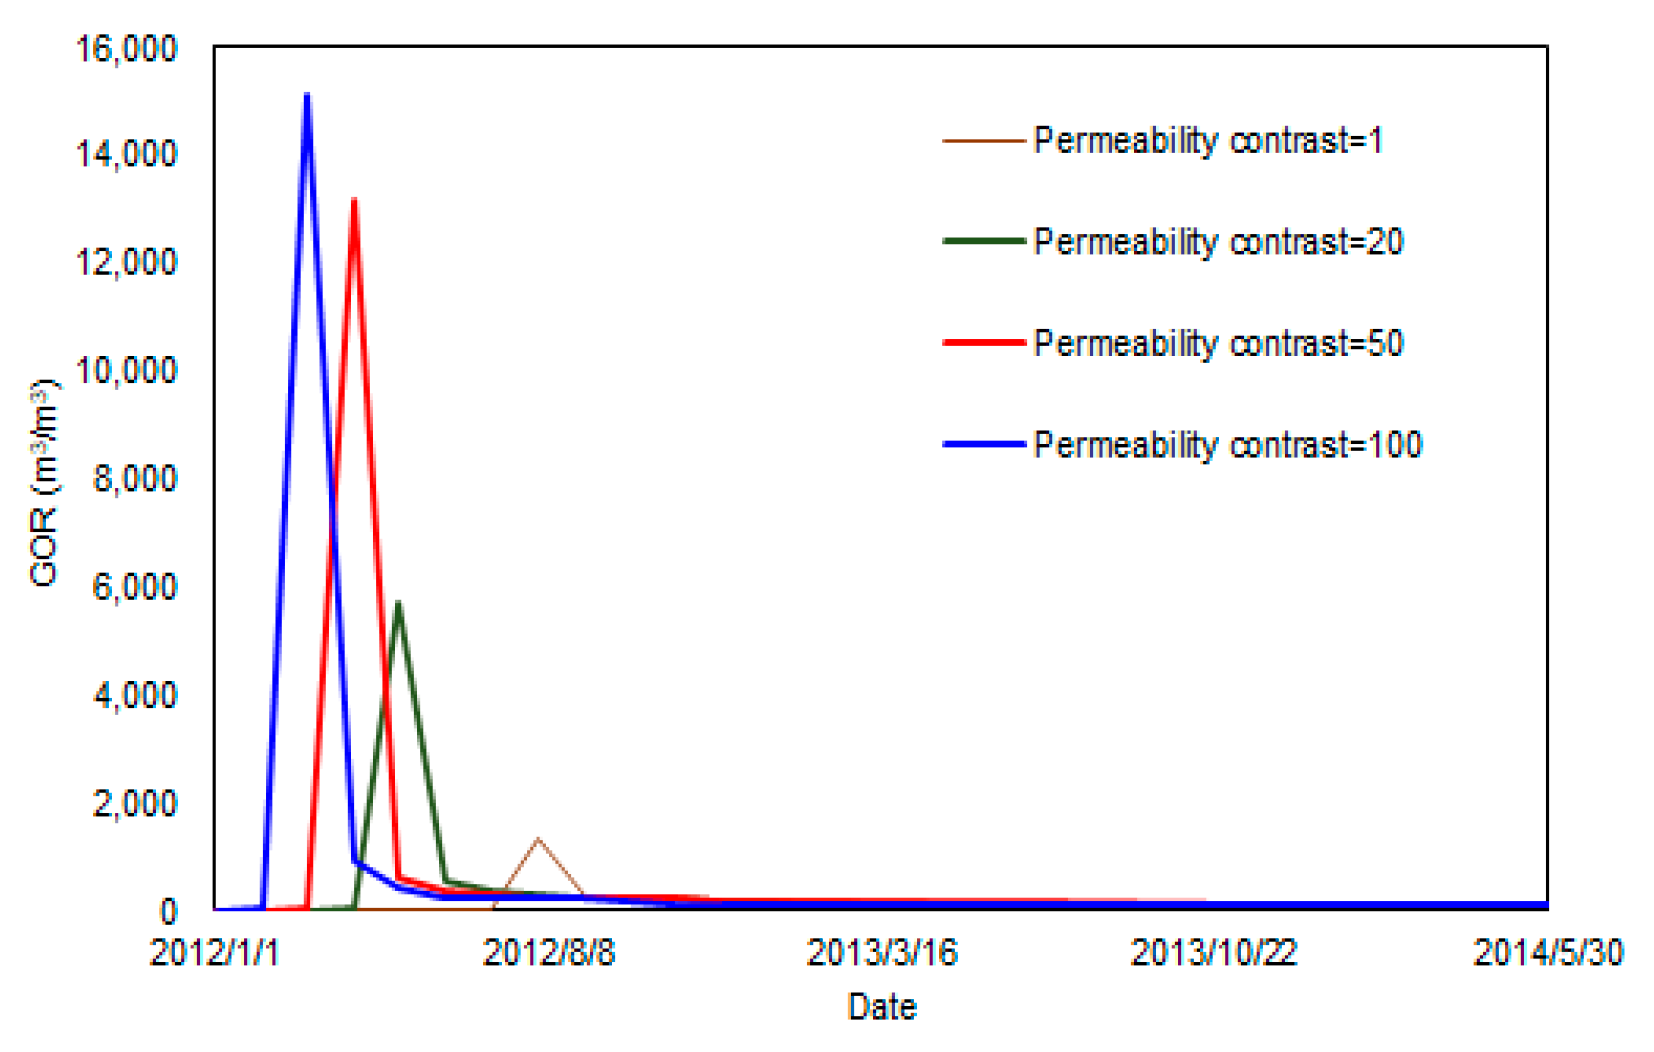
The oil increment of P1, P2, and well group under different channel permeability contrasts is shown in Figure 12. The oil increment of well P1 increases with the increase in permeability contrast, whereas it decreases for well P2 as the channel permeability level difference increases. When the channel permeability contrast is 1, the oil increment of P1 well is 445 t, which is less than 628 t of P2. As the channel permeability contrast increases to 20, the oil increment of P1 increases to 657 t, but the oil increment of P2 decreases to 254 t. Subsequently, with the further increase in permeability contrast, the oil increment of both production wells decreases slightly. When there is no main flow channel, the high-position well presents a higher oil increment. Figure 13 shows the production gas–oil ratio (GOR) curve of P2. As the channel permeability contrast increases from 1 to 100, the GOR rises from 1600 to 15,000 m3/m3. The larger the channel permeability contrast, the more CO2 is consumed in the strong water washing layer, and the worse the well group oil increases.
Comparing the oil saturation before and after gas injection, shown in Figure 14 and Figure 15, respectively, it was found that without channel, the oil saturation between production wells and near P1 increases. When the channel permeability contrast exceeds 1, the oil saturation between production wells decreases, and crude oil migrates down the channel. Therefore, in the presence of channels, CO2 is transported to the upper part of the oil layer under the influence of gravity differentiation, and crude oil migrates and accumulates to the lower part, resulting in a high oil increment of low-structural-position wells.
(4) Allocation scheme of injection volume
The total gas injection volume of the two wells is 800 t, which remains unchanged, and the injection volume allocation schemes are shown in Table 8.
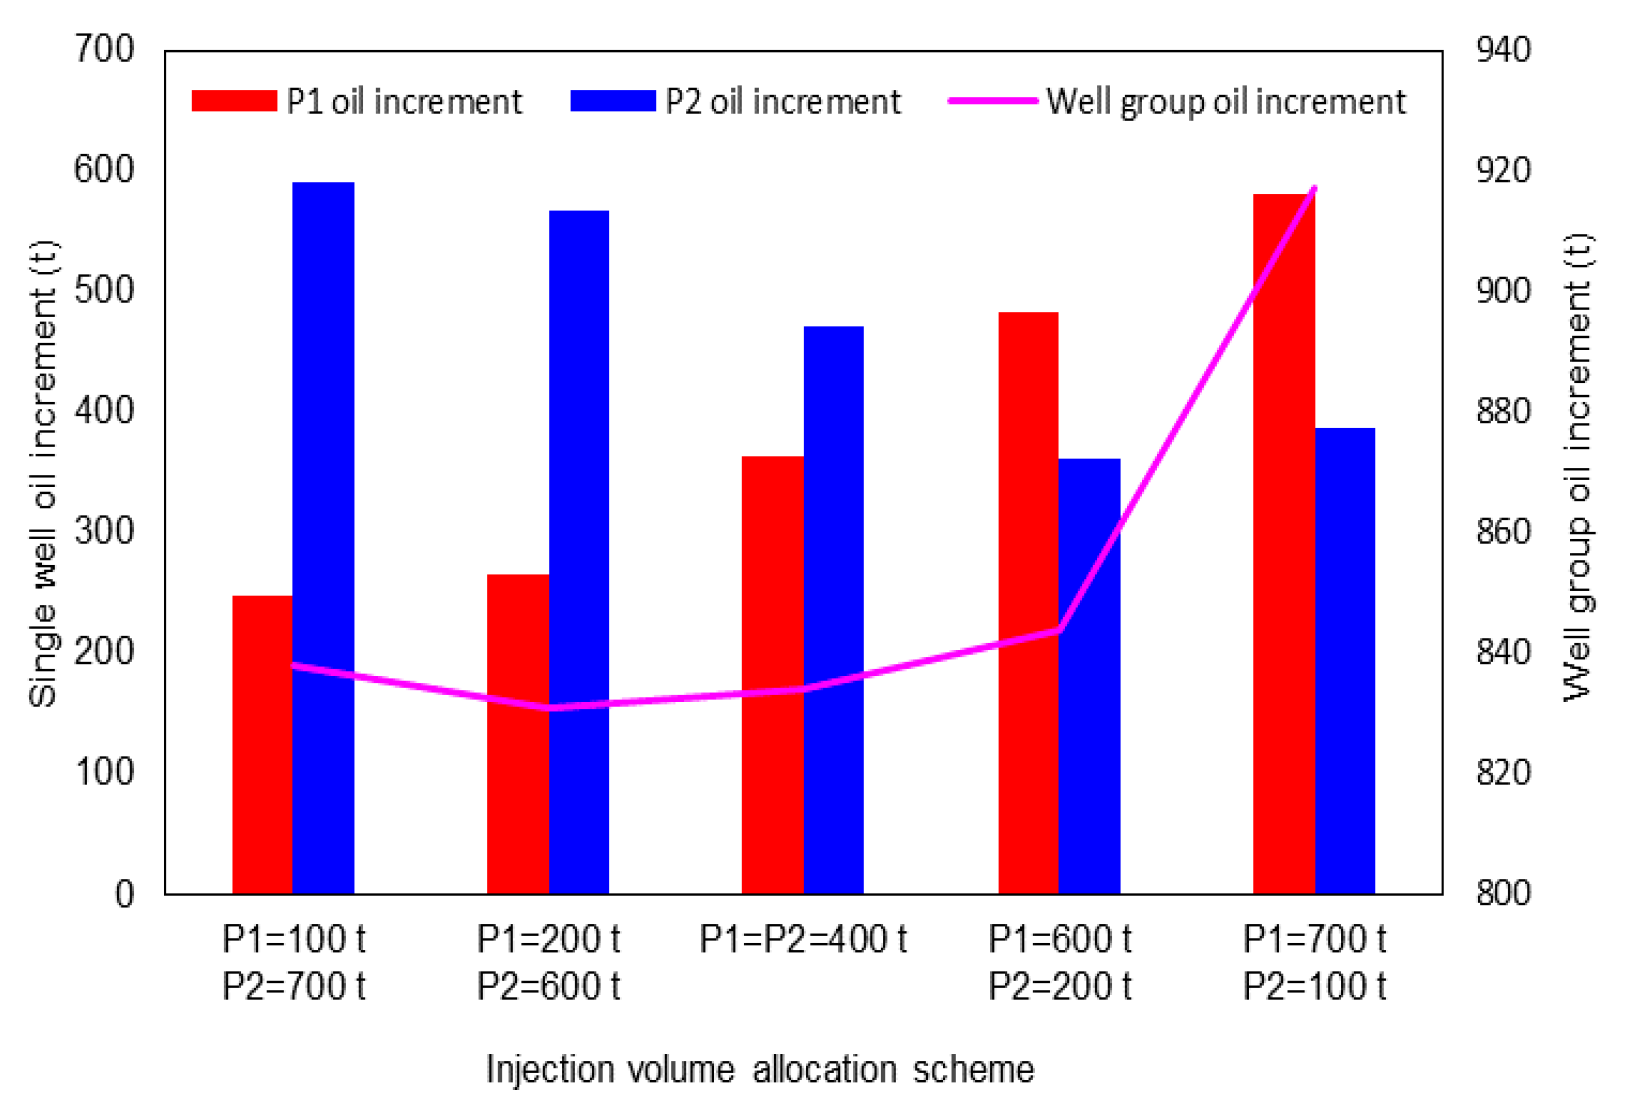
Figure 16 shows the oil increment in each injection volume allocation scheme. As the injection volume of the low-structural-position well P1 increases from 100 to 700 t, the oil increment increases from 247 to 581 t, and the oil increment of the well group increases from 838 to 917 t. As the injection volume of P2 decreases, the oil increment decreases from 591 to 386 t. Although the oil increment of P2 gradually decreases, the synergistic CO2 huff and puff still shows a good performance because the oil increment of P1 is higher than the decrease in P2.
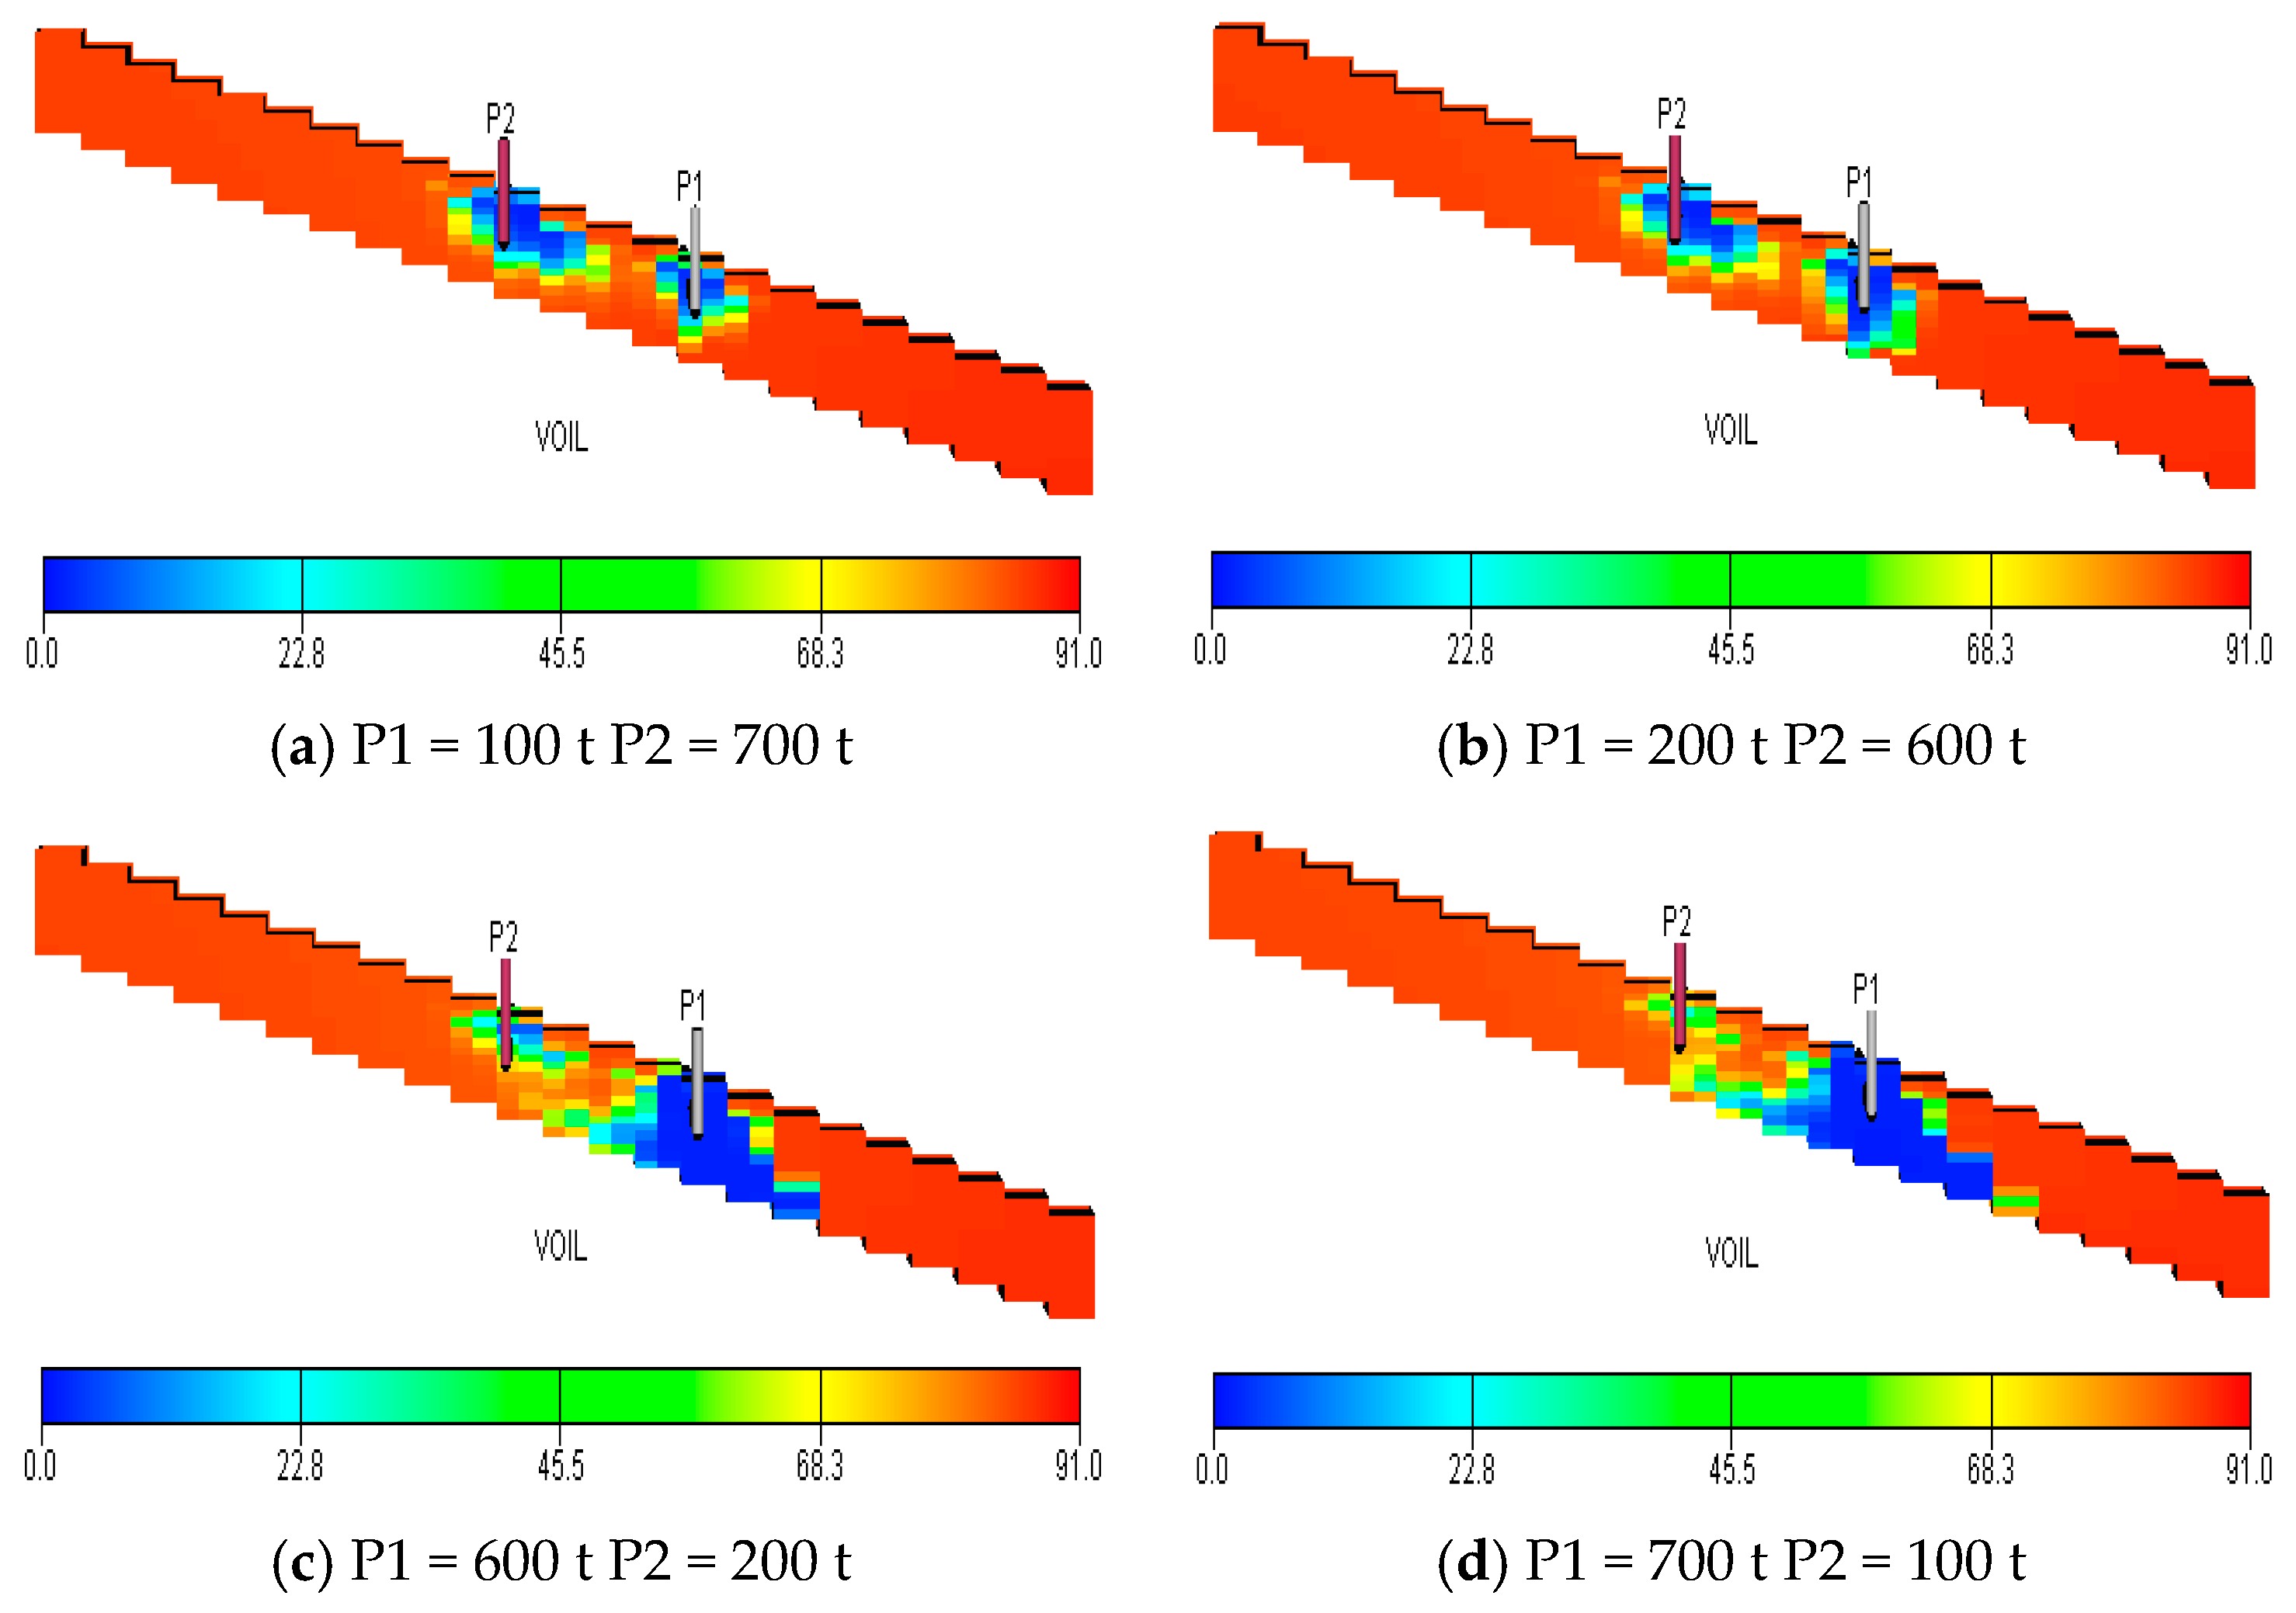
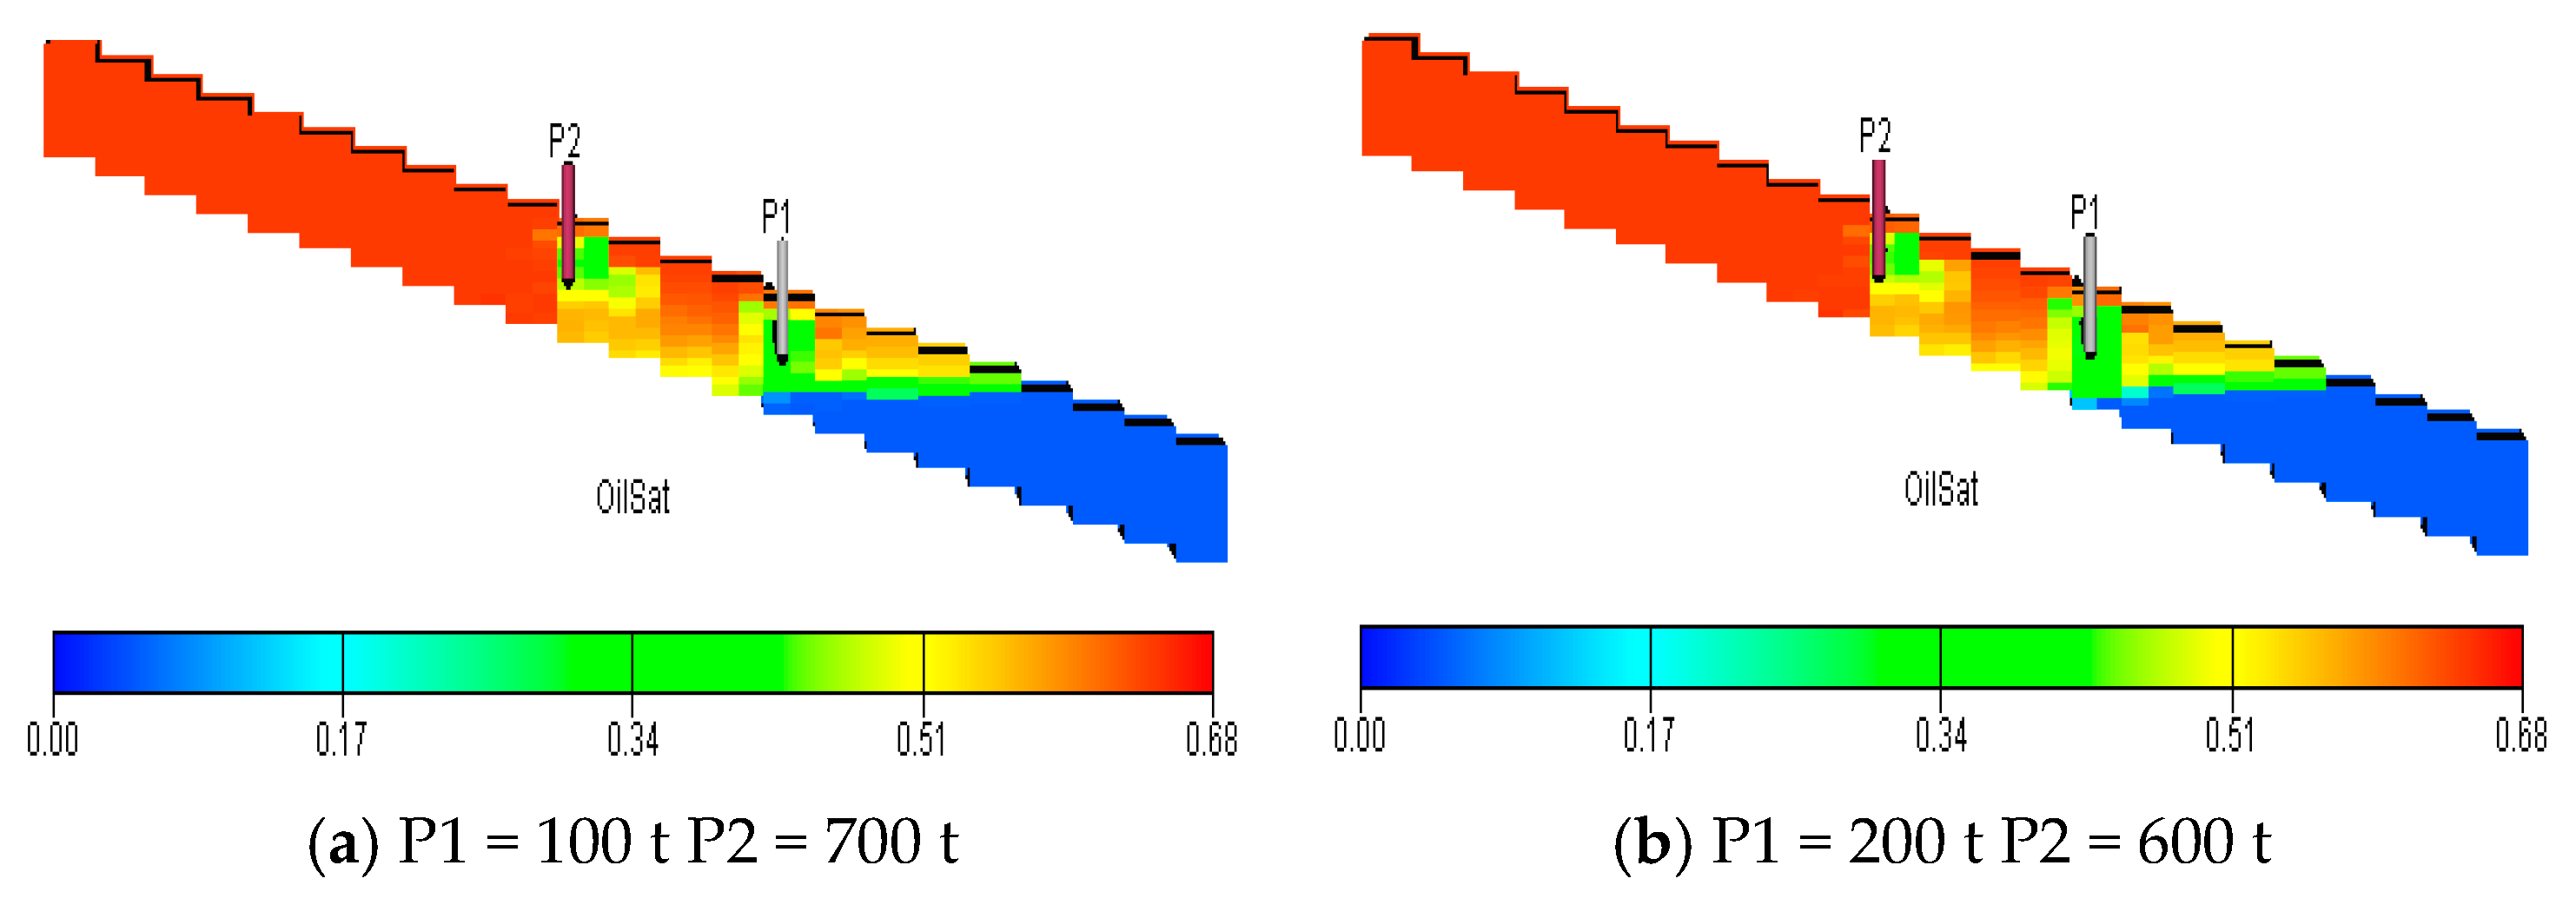
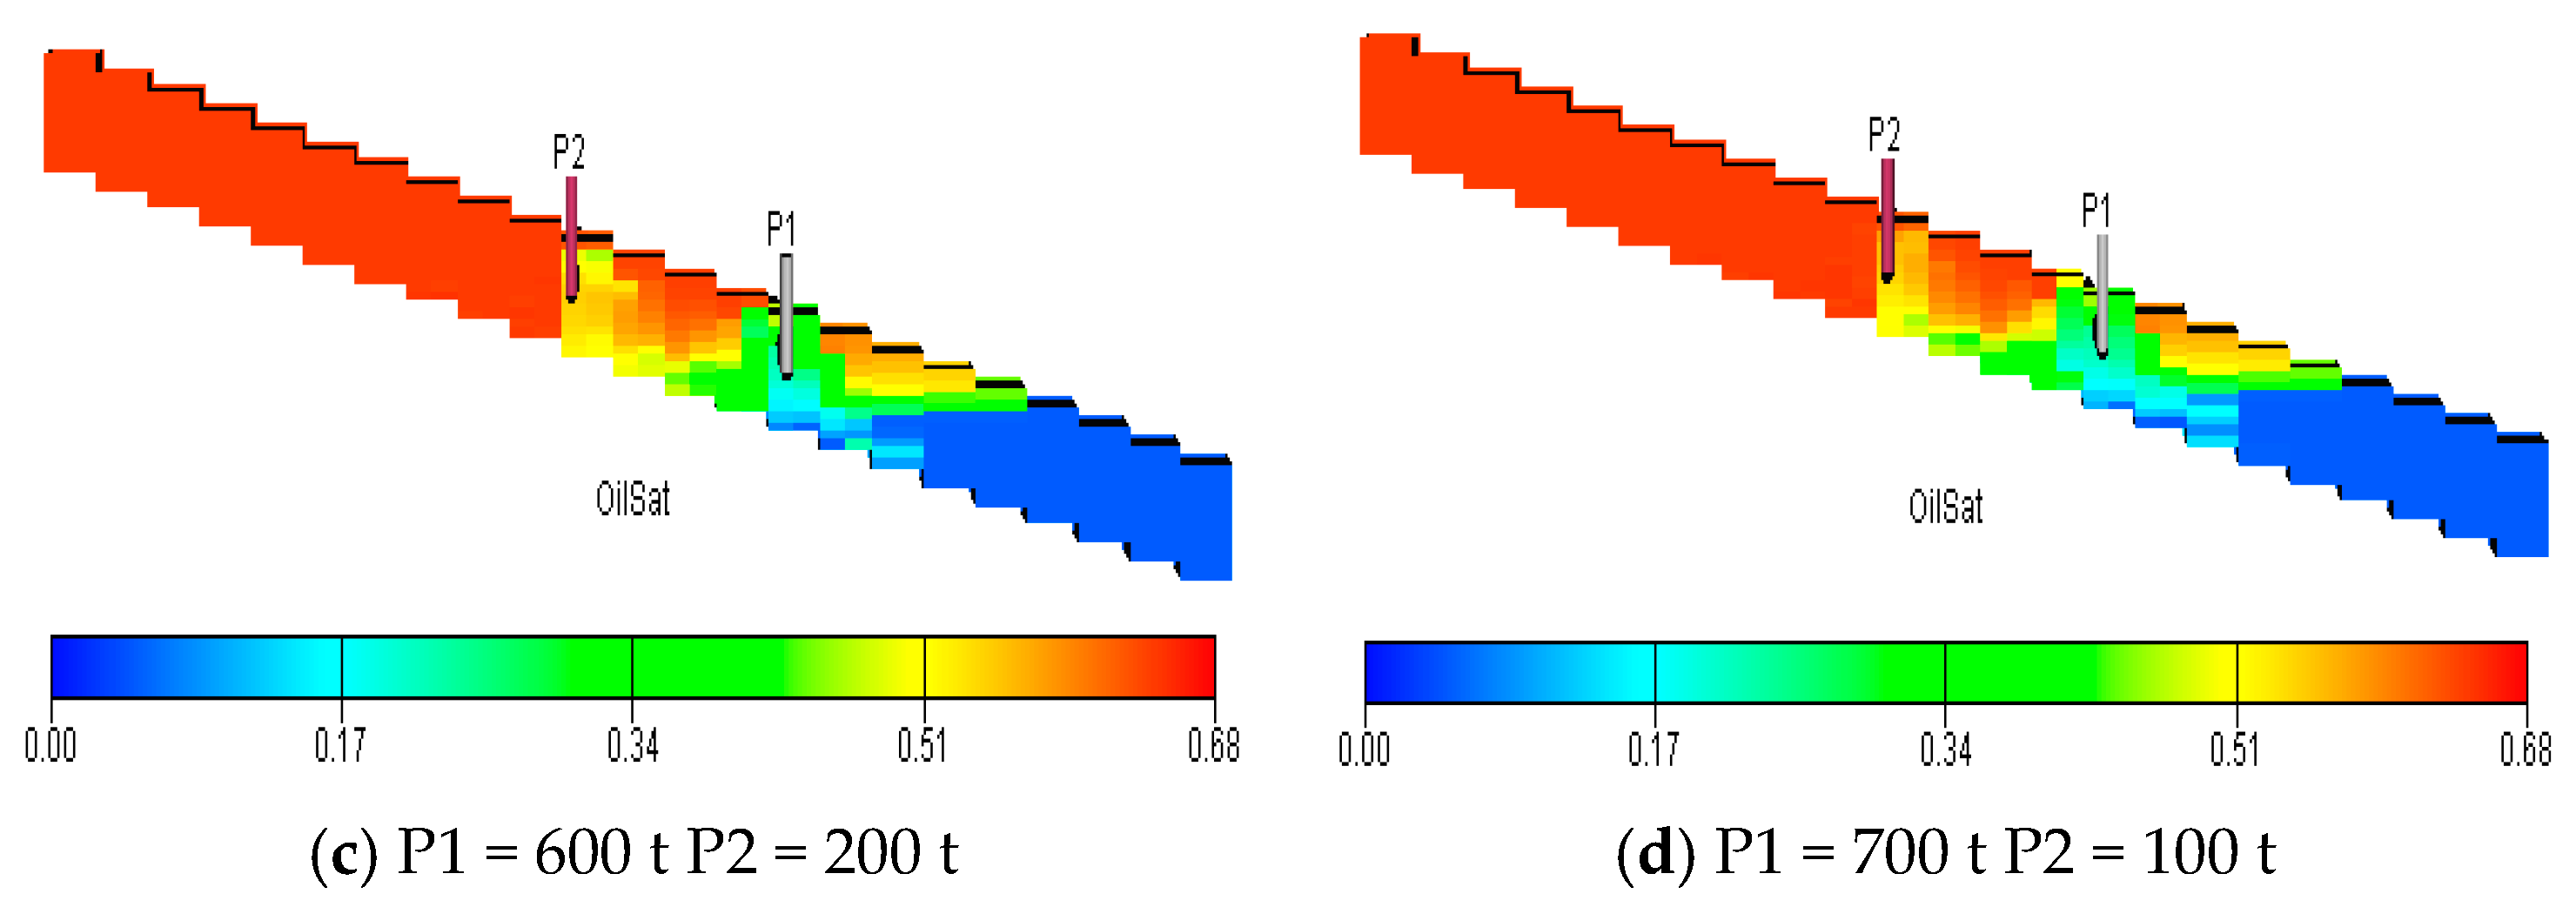
The viscosity distributions after well stuff of different injection volume allocation schemes are shown in Figure 17. According to Figure 17, as the injection volume of P1 increases, the viscosity reduction range near the well P1 becomes larger, and the oil viscosity between P1 and P2 also decreases. Thus, the action range of CO2 increases. Comparing the oil saturation of different injection schemes, shown in Figure 18, it was found that as the injection volume of the lower-structural-position well P1 increases, the average oil saturation decreases after validity period and the production degree and production action range increases. Under the influence of gravity differentiation and edge–bottom water propulsion, the effect of CO2 to drive crude oil to a higher position is more evident; thus, the larger the injection amount at the lower-structural-position well, the better the development performance of CO2 synergistic huff and puff.
(5) Well spacing
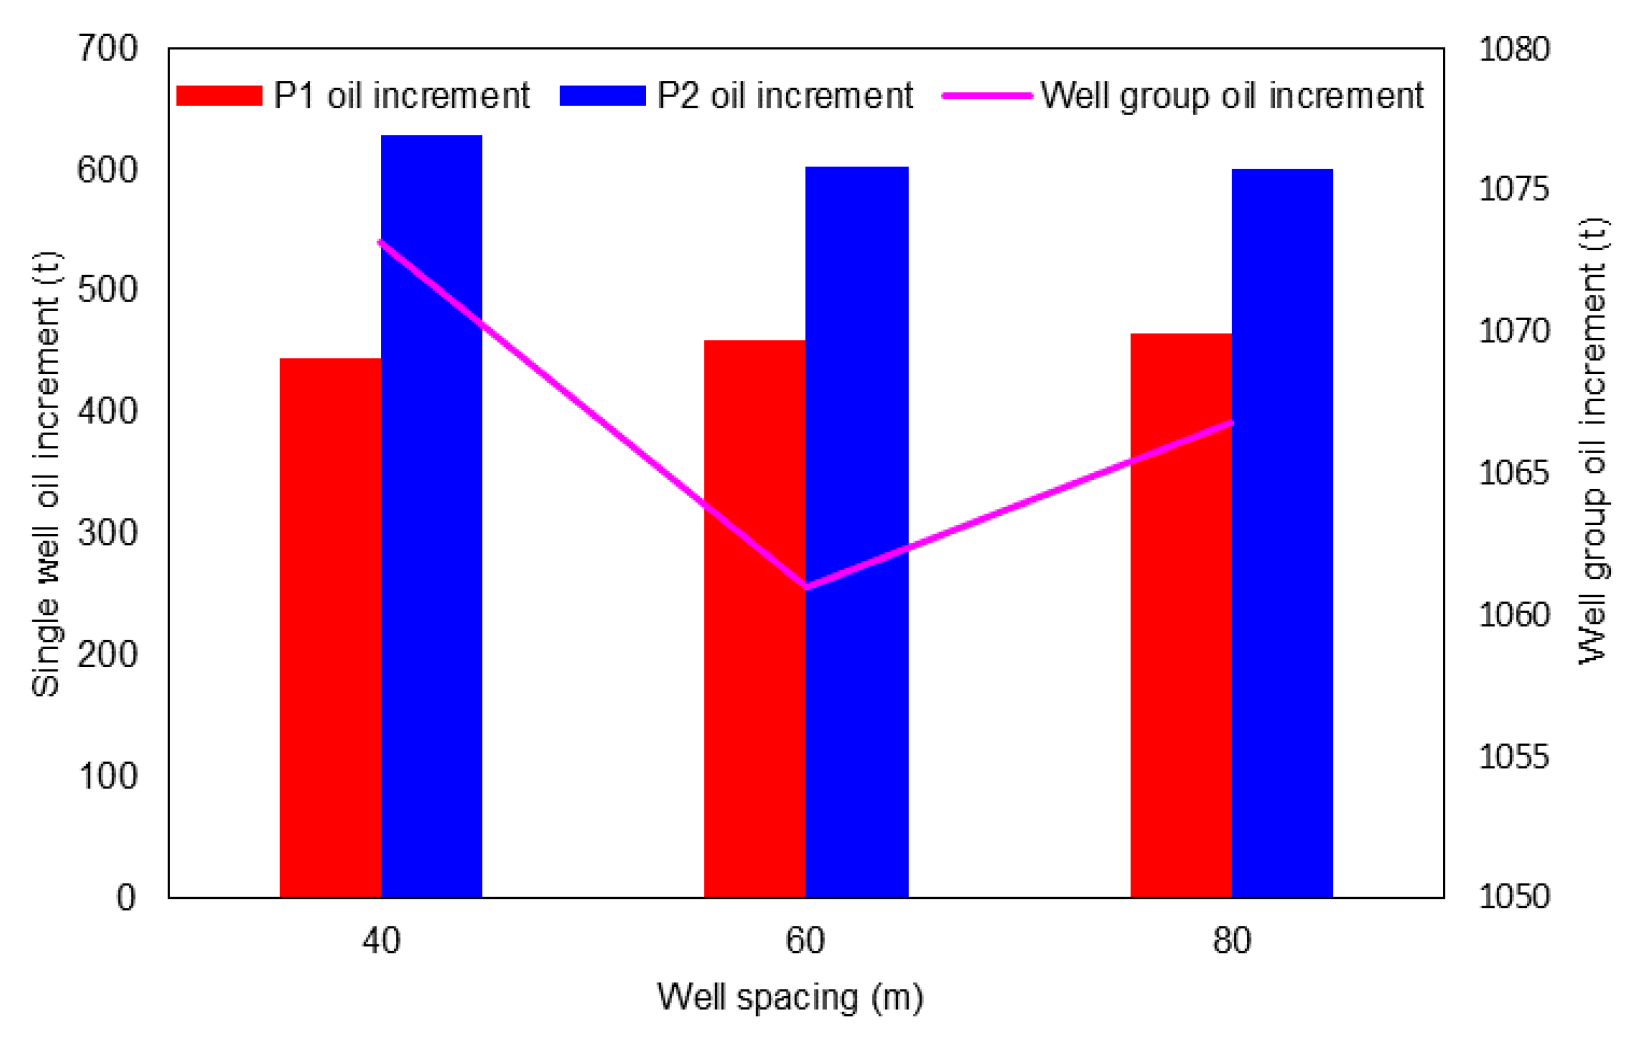
Figure 19 shows the oil increment of P1, P2, and well group with different well spacing. It can be seen from the figure that as the well spacing increases, the oil increment of P1 increases, whereas it decreases for P2. The oil increment in the well group decreases and then increases, forming a V shape. When the well spacing is higher than 60 m, it has little influence on the performance of higher-structural-position wells.
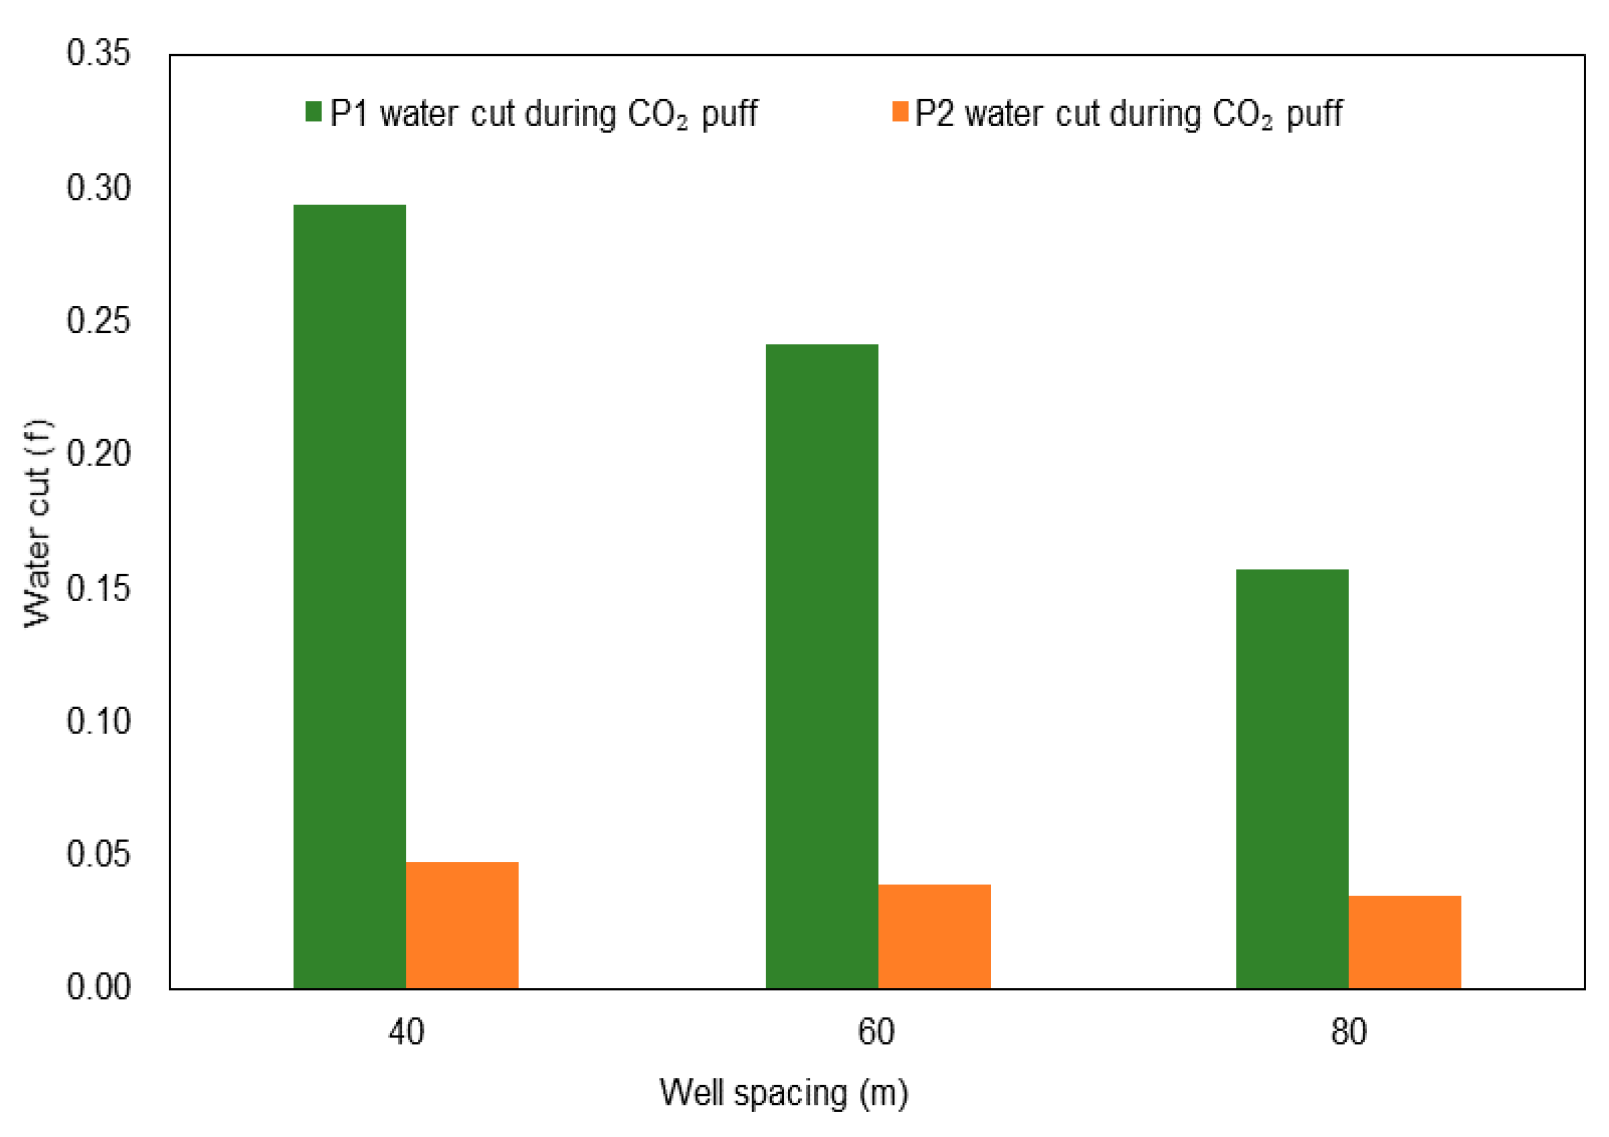
The production water cut of P1 and P2 after well stuffy is shown in Figure 20. It can be seen from Figure 20 that as the well spacing increases, the lower-structural-position well P1 gradually decreases, whereas the water cut of P2 remains unchanged. Figure 21 shows the oil distribution after the production validity period, and the well spacing mainly affects the lower-structural-position well. The larger the well spacing, the higher the CO2 sweep volume, the lower the production water cut after well stuffy, and the higher the oil increment of the lower-structural-position well. If the well spacing exceeds 60 m, it has little effect on the performance of synergistic CO2 huff and puff of high-position wells.
(6) Relationship with structural isobaths
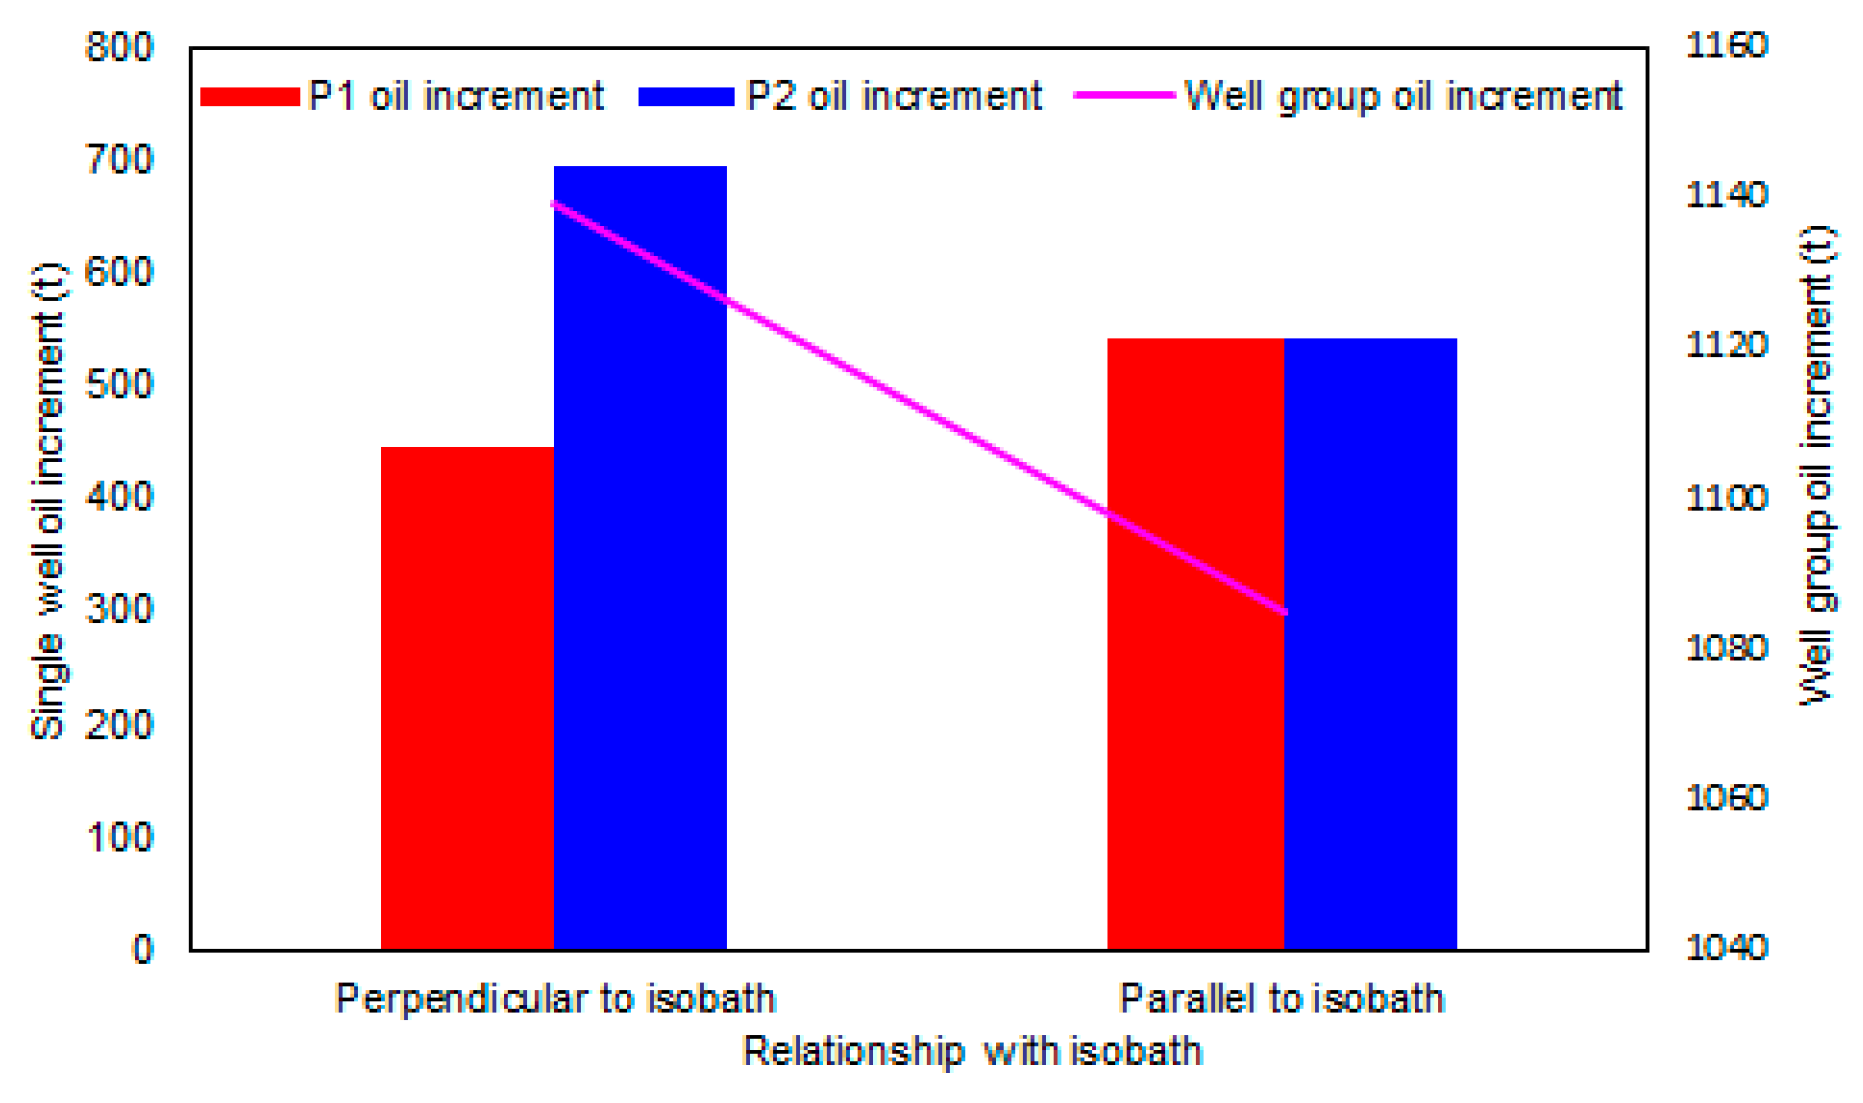
For horizontal wells, the relative direction of the horizontal section and the structural contours affect the performance of huff and puff [45]. To determine the influence of the relative direction of the horizontal section and structural isobaths on the development performance of synergistic CO2 huff and puff, a comparative study was made on the oil increment when the horizontal well line and the structural isobaths line are perpendicular and parallel. Figure 22 shows the oil increment of P1, P2, and well group of different relationships with structural isobaths. It was found that when the line of the huff-and-puff well is parallel to the isobaths, the oil increment is lower than that when the line is perpendicular to the isobaths. Thus, a better performance is obtained for the perpendicular case. This is because when the horizontal well is parallel to isobaths, it is affected by strong edge water, and water cut rapidly rises, which leads to a lower oil increment.

3.1.2. Single-Well Synergistic Mode

The model parameters are consistent with the two-well synergistic mode. However, under the single-well synergistic mode, the high-position well P2 maintains production during the entire program of CO2 huff and puff of low-position well P1. Single-well synergistic CO2 huff and puff does not involve the allocation of injection volume and the relationship with isobaths. In addition, the influence of permeability contrast of inter-well channel, stratum dip, and sedimentary rhythm on the development performance is generally applicable. Therefore, the main controlling factors in this mode are well spacing and daily liquid production rate of higher-structural-position wells.
(1) Permeability contrast of inter-well channel
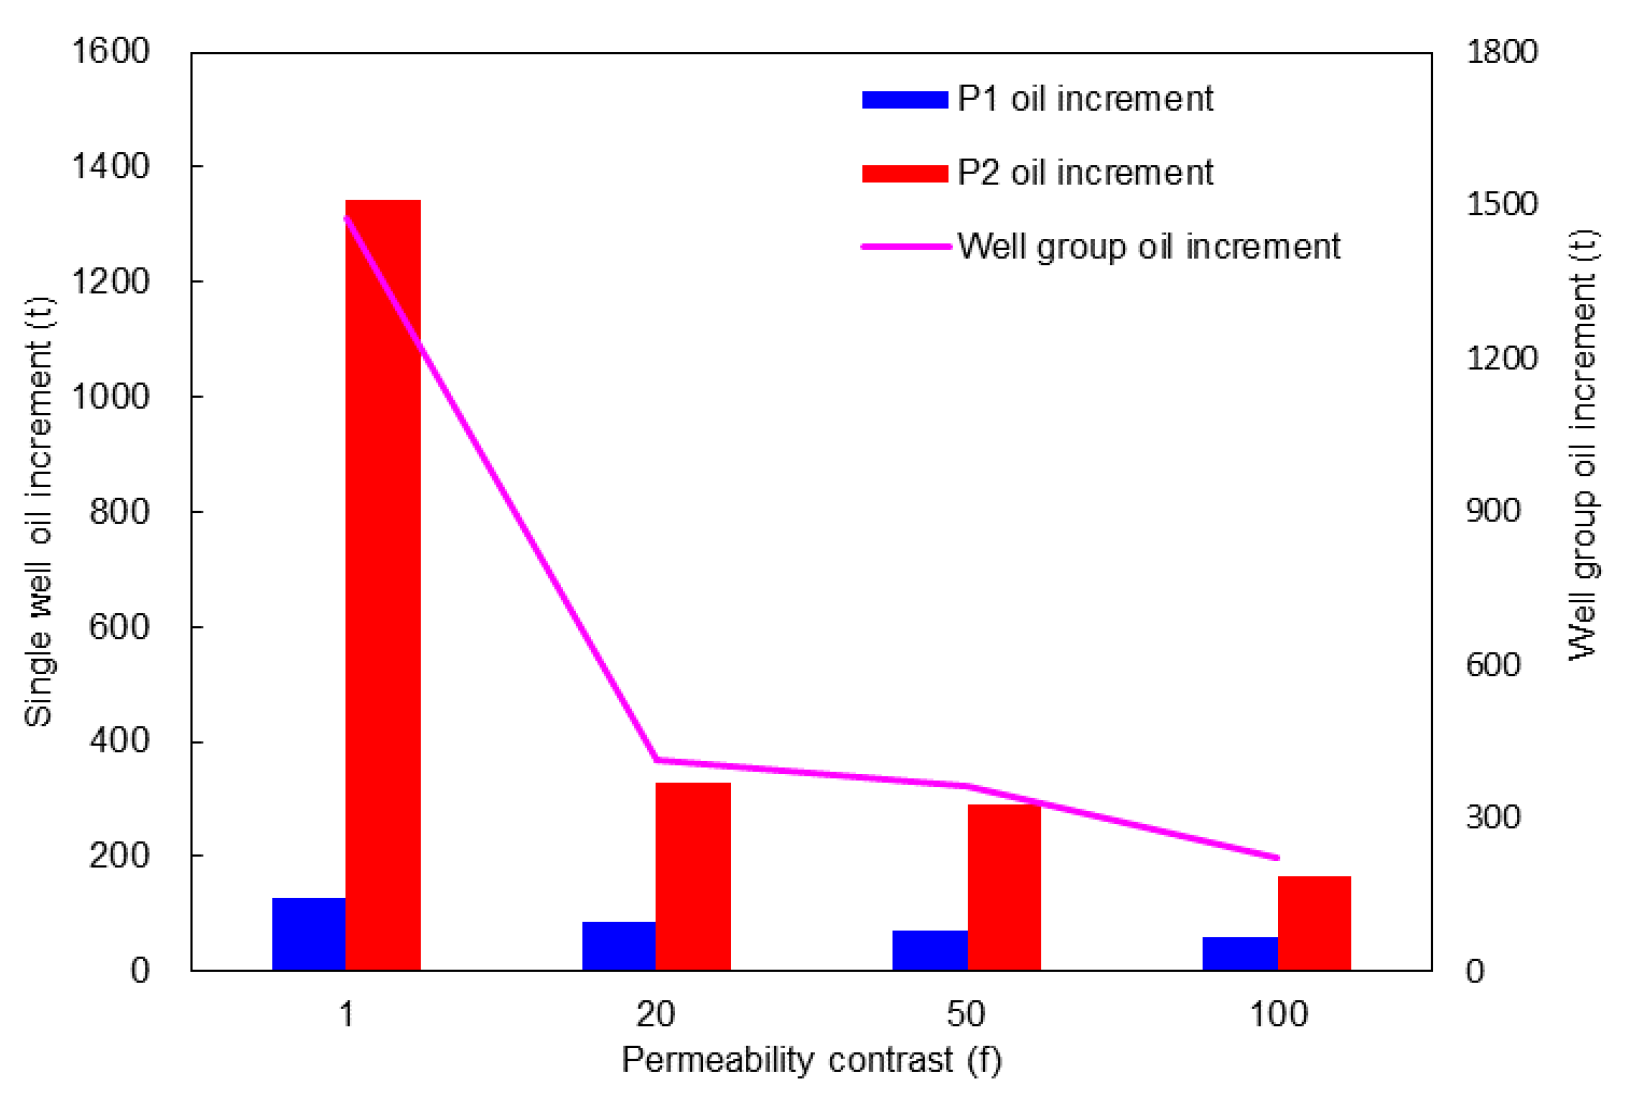
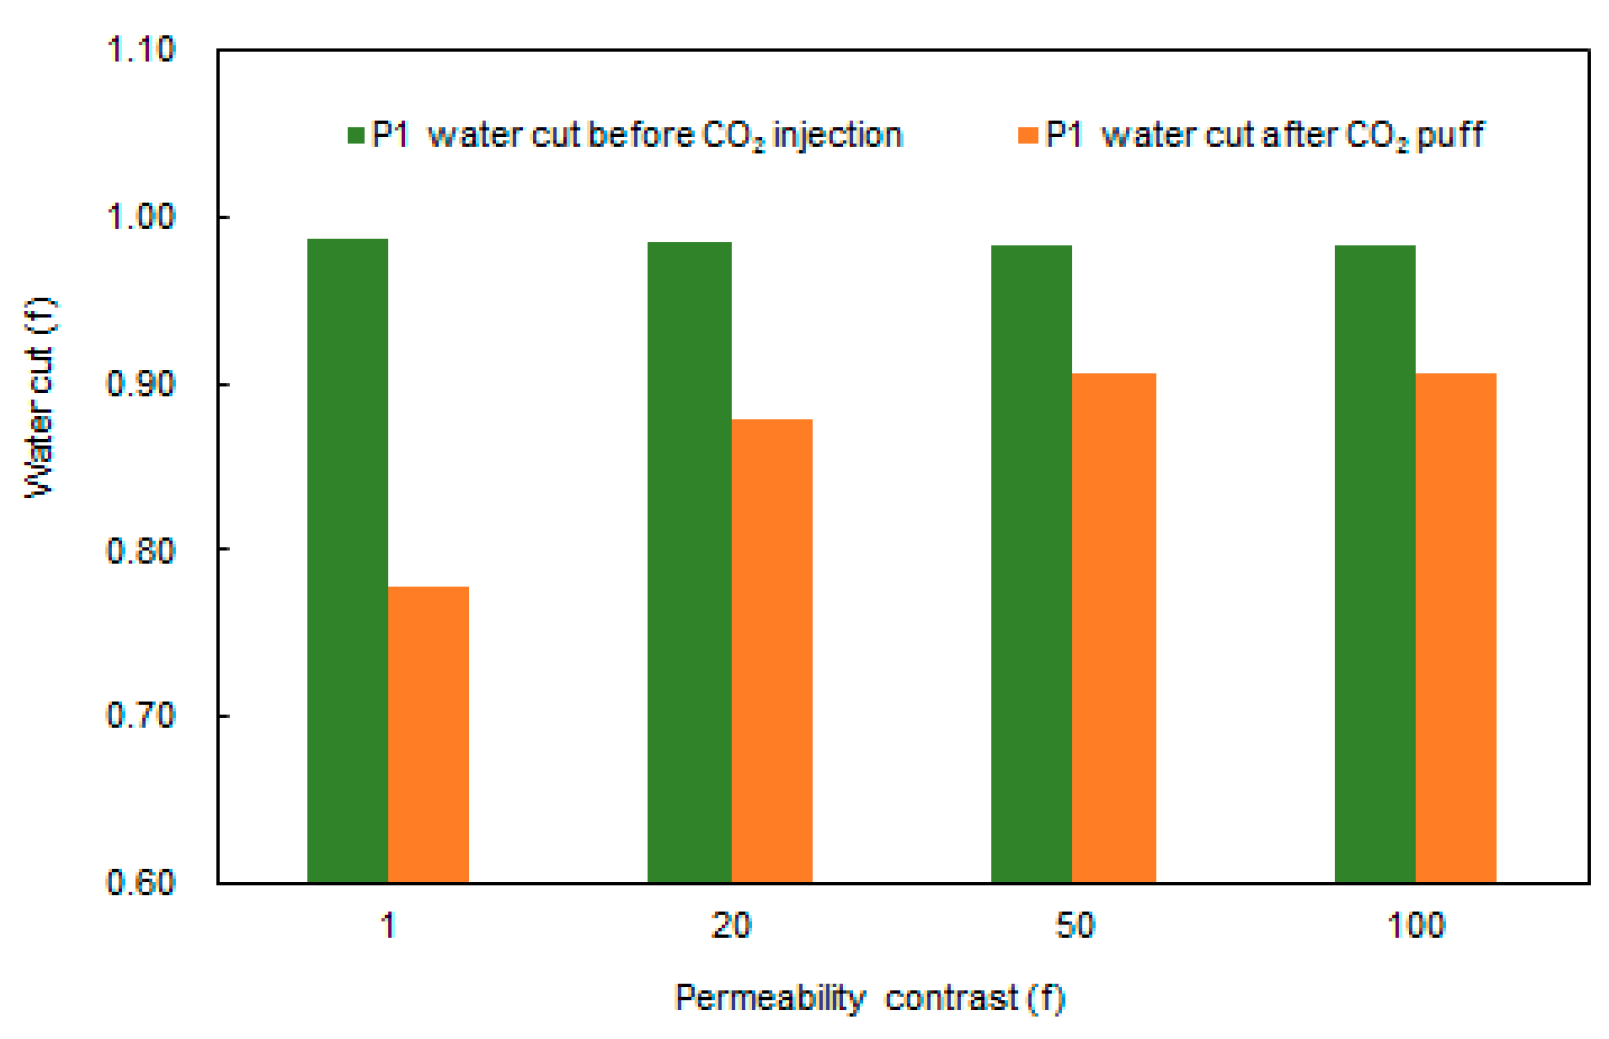
The dominant flow channels between wells are important in distributing the remaining oil during water flooding development. For gas flooding development, existing studies have shown that the existence of dominant flow channels causes gas channeling along the flow channel and worsen the development performance of gas flooding. The oil increment of P1, P2, and well group under different channel permeability contrasts is shown in Figure 23. The oil increment of well P1 increases with the increase in permeability contrast, and the oil increment of well P2 decreases as the channel permeability level difference increases. When the channel permeability contrast is 1, the oil increment of P1 well is 130 t, which is less than 1343 t of P2. As the channel permeability contrast increases to 20, the oil increment of P1 decreases to 85 t, and the oil increment of P2 decreases to 329 t. Subsequently, with further increase in permeability contrast, the oil increment of both production wells decreases slightly. When there is no main flow channel, the high-position well present a higher oil increment. Figure 24 shows the comparison of P1 water cut before and after CO2 huff and puff. It can be seen that with the increase in permeability contrast of inter-well channel, the water cut after CO2 huff and puff increases. This indicates that the higher the permeability contrast, the worse the water cur reduction ability.
(2) Well Spacing
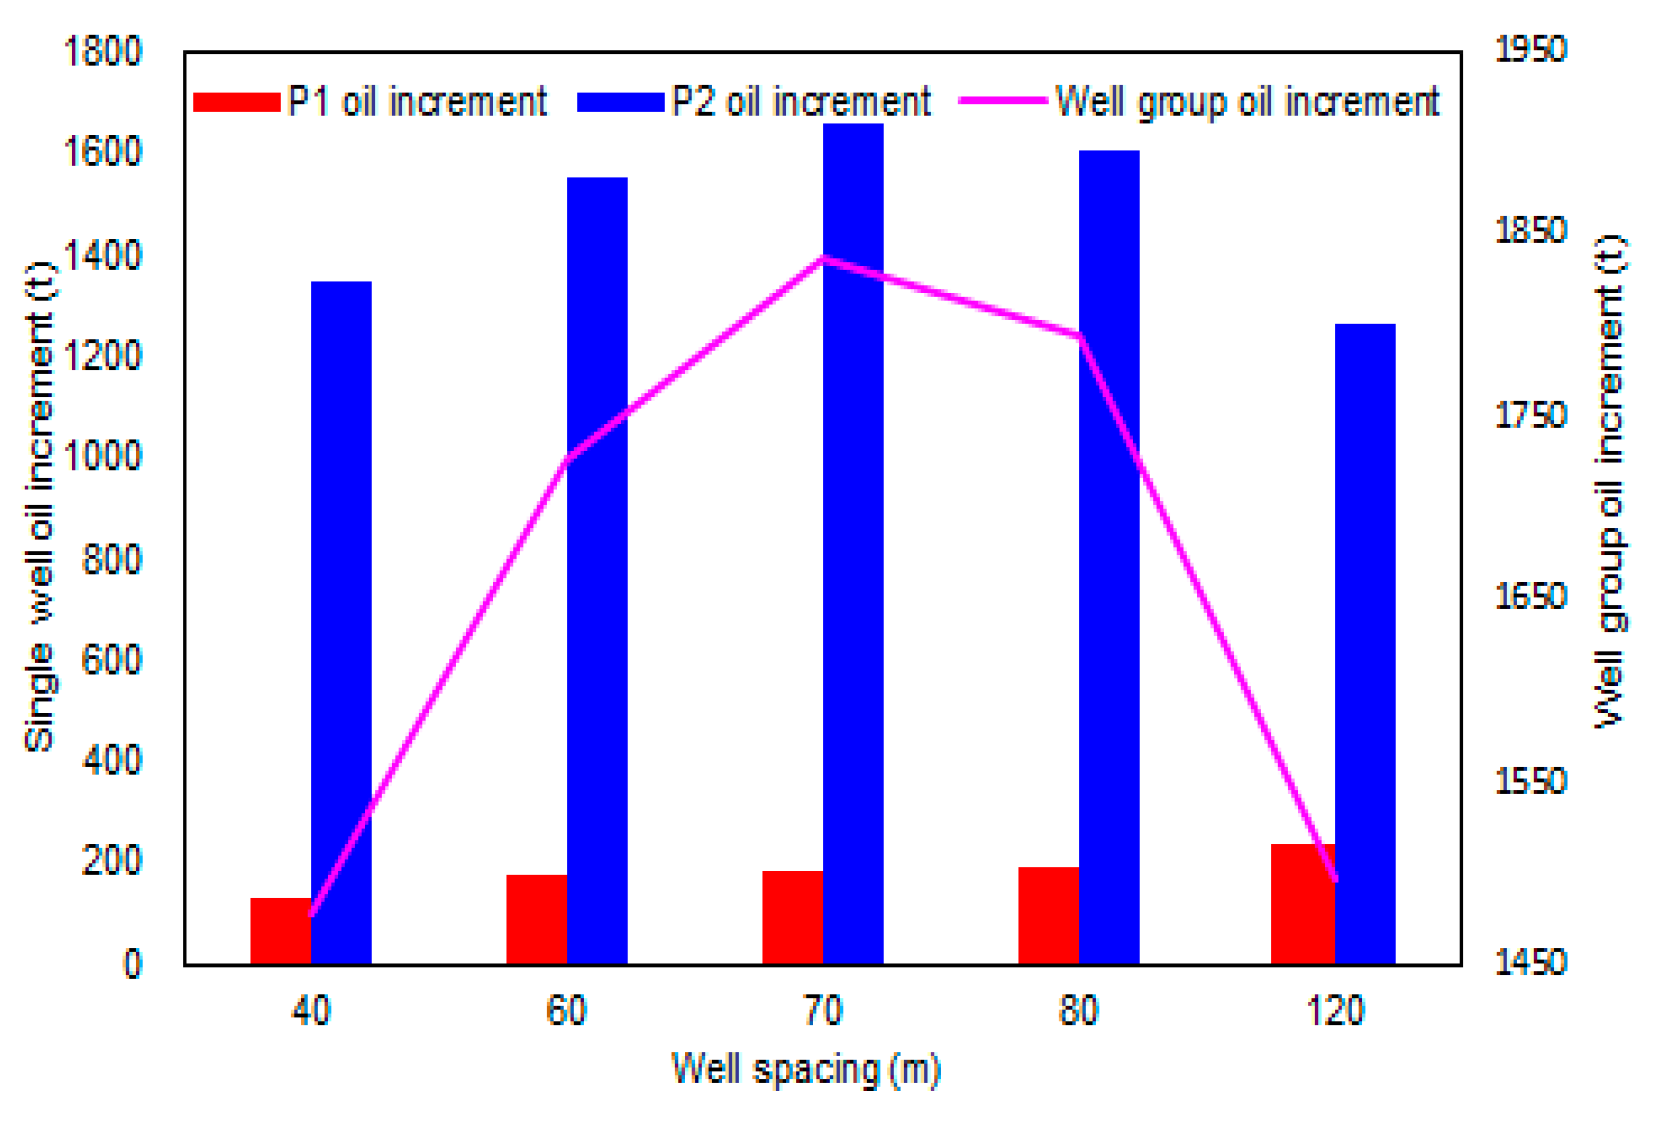
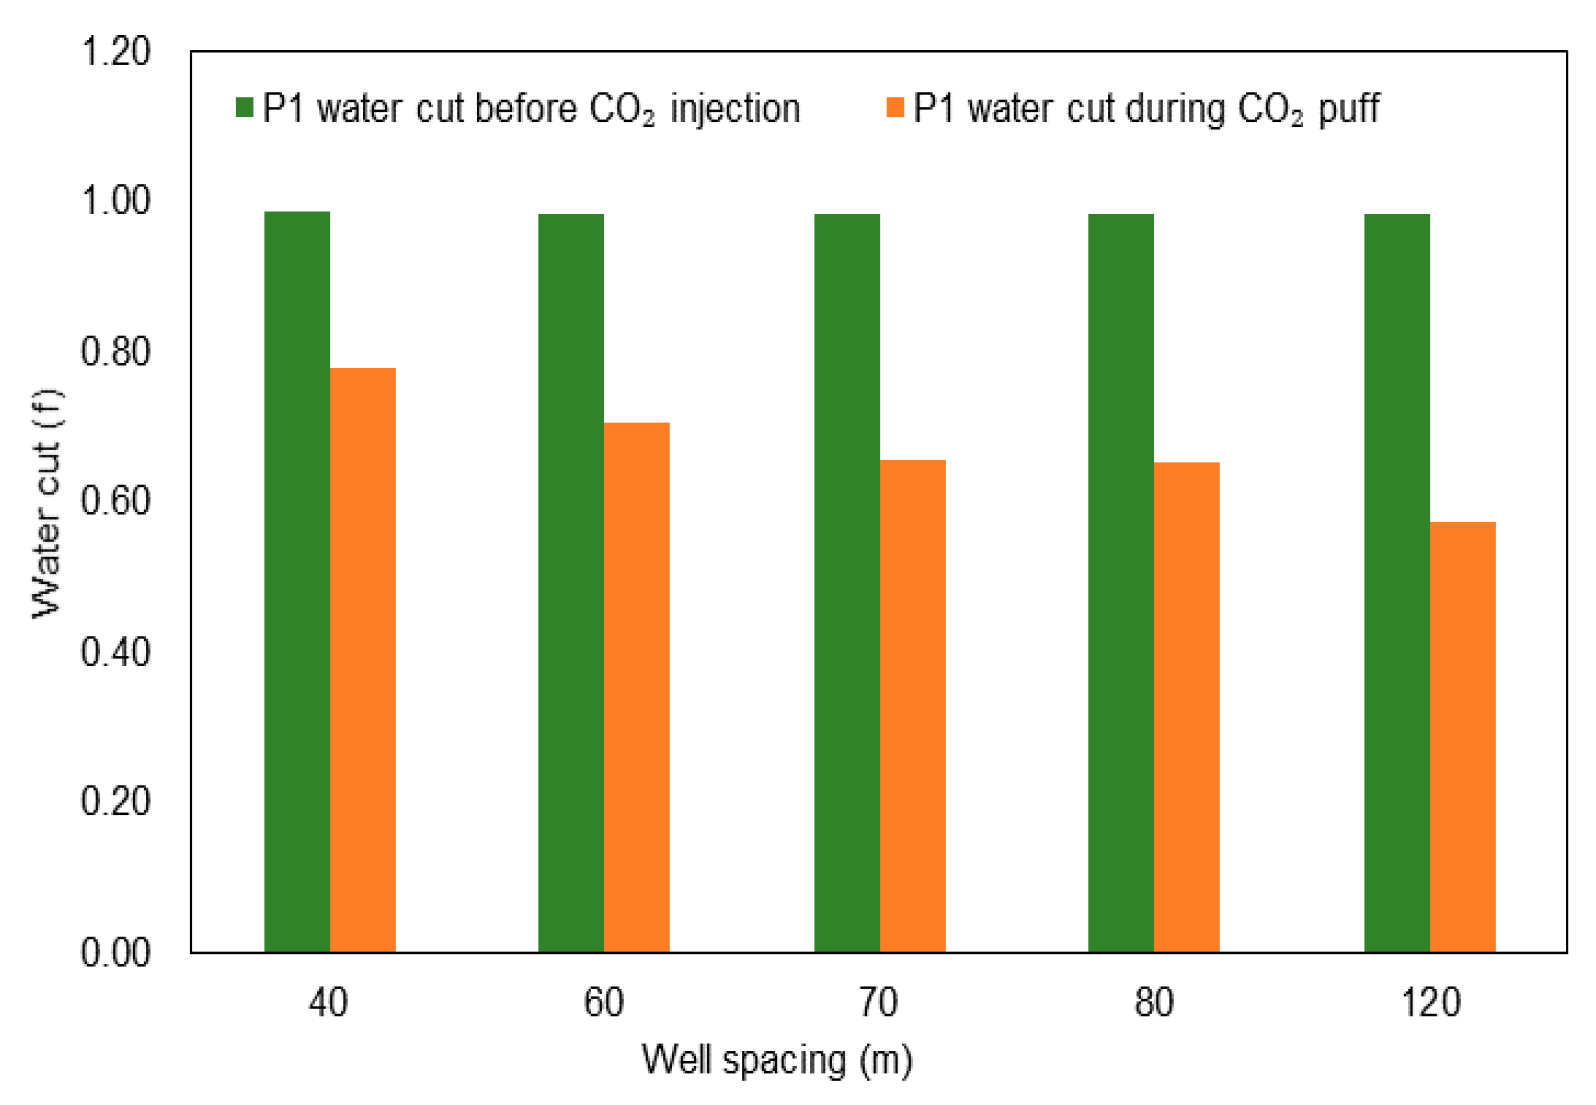
For the single-well synergistic mode, five levels of 40, 60, 70, 80, and 120 m are designed to investigate the impact of well spacing on the performance of synergistic CO2 huff and puff. The influence of well spacing on the oil increase and water cut is shown in Figure 25 and Figure 26. The results indicate that for the lower-structural-position well P1, as the well spacing increases, the CO2 swept volume increases. The lower the water cut after well stuffy, the higher the oil increase. When the well spacing exceeds 70 m, the higher-structural-position well P2 is less affected by the huff and puff of lower-structural-position well P1. With the increase in well spacing, the total oil increment continues to increase. When the well spacing exceeds 70 m, the total oil increment decreases. These results indicate that CO2 has a certain sweep radius after injection into the formation.
(3) Liquid production rate of high-position well
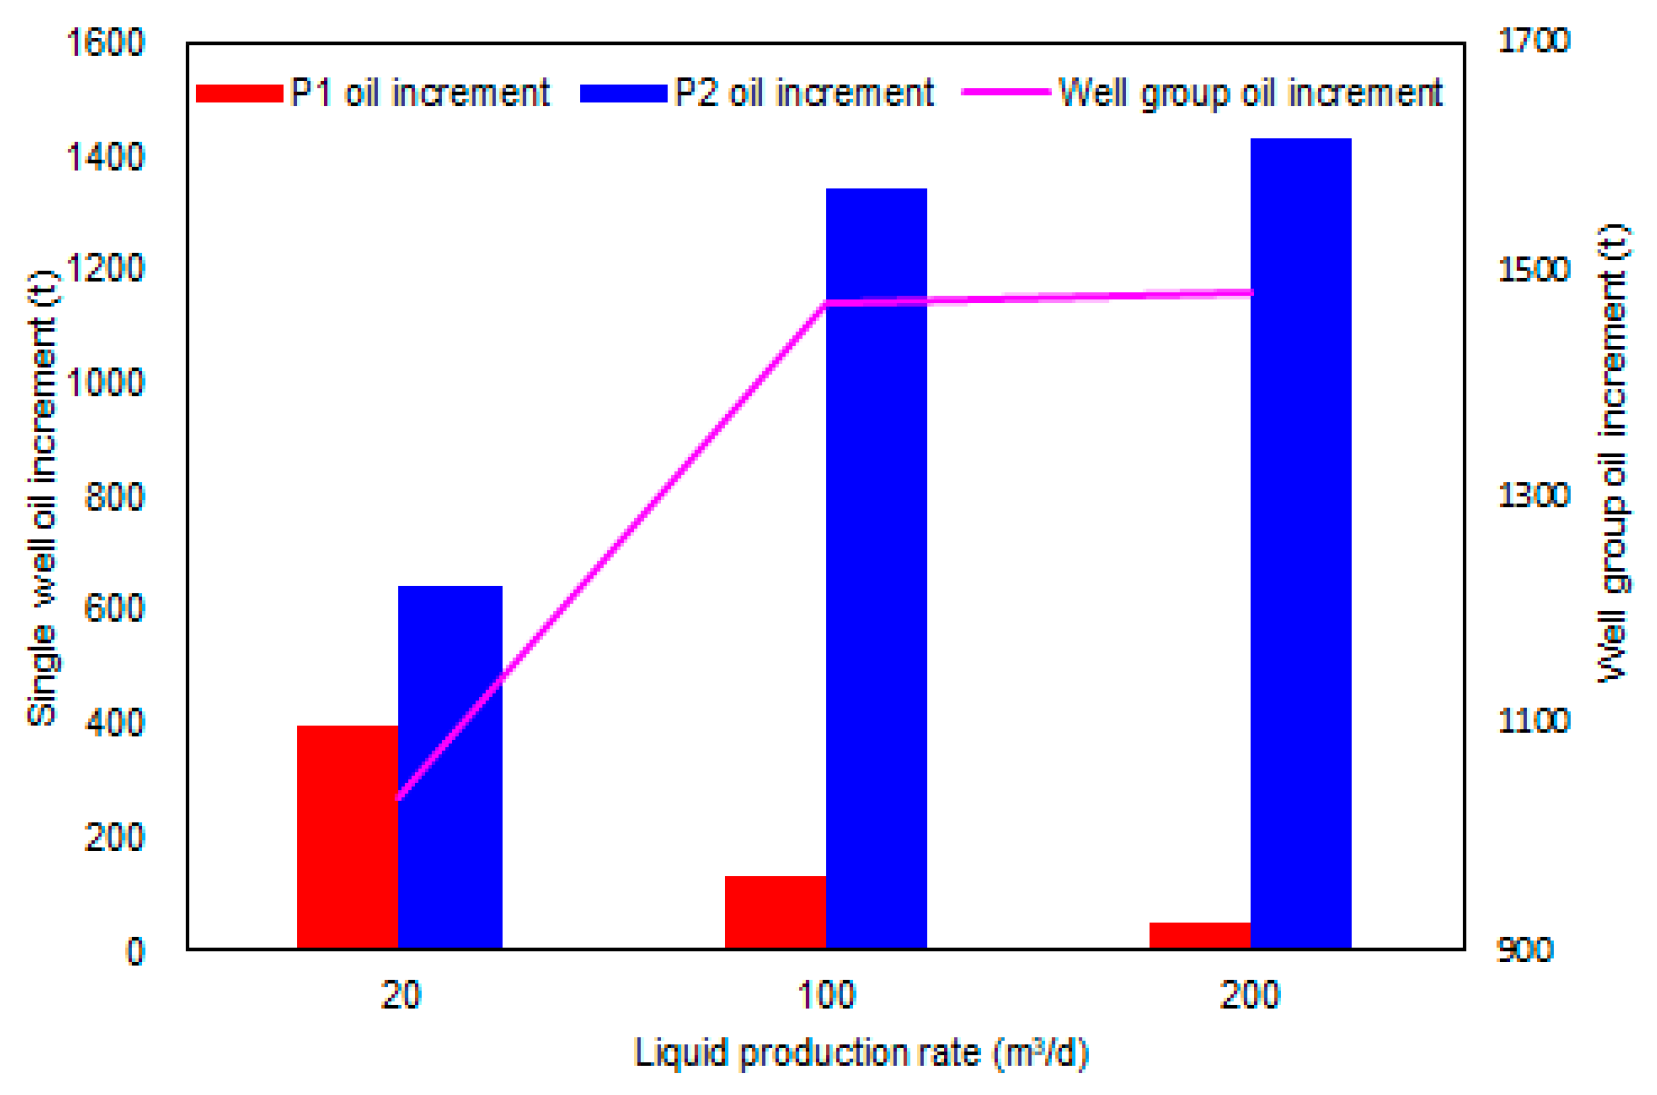
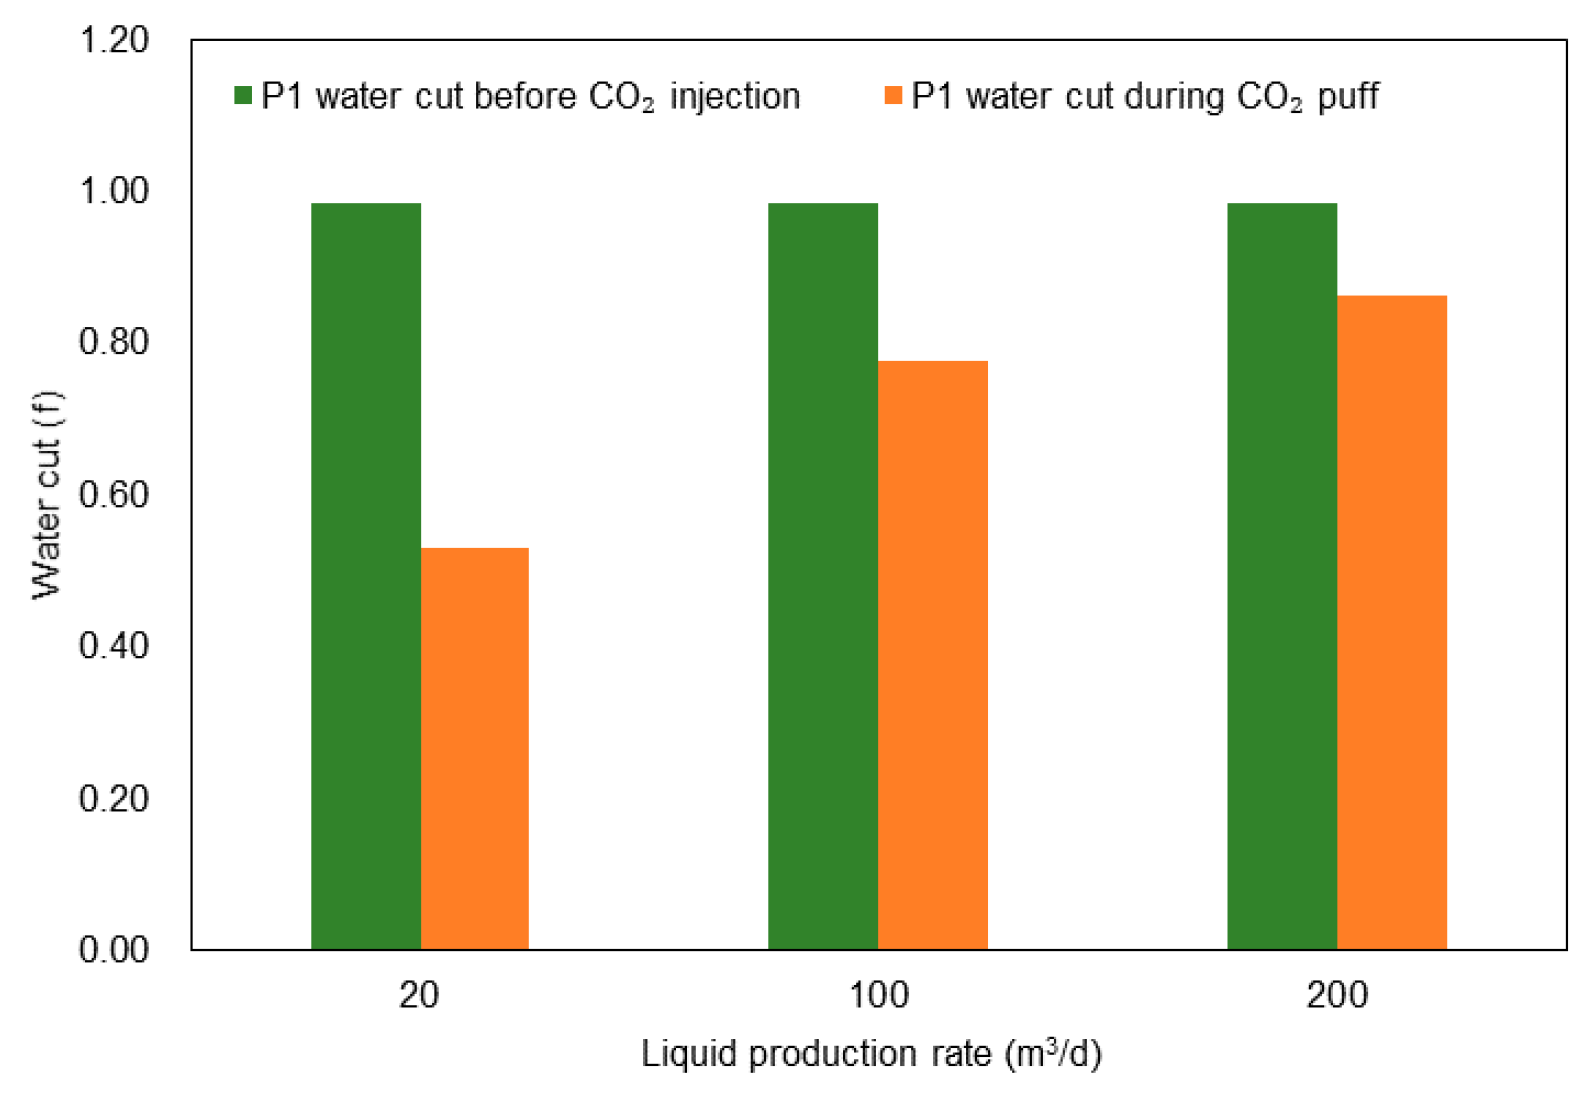
The liquid production rate of high-position wells mainly affects the gas migration speed in the formation [46]. To clarify the influence of the high-position well liquid production rate on the performance of CO2 huff and puff, three levels of 20, 100, and 200 m3/d are designed. Statistical results of the oil increase and water cut after well opening at different liquid production rates are shown in Figure 27 and Figure 28. It can be seen from Figure 27 that with the increase in liquid production rate of P2, the oil increment of P1 well decreases, whereas that of P2 well increases, and the oil increment of the well group first increases and then basically remains unchanged. From Figure 28, it is observed that the production water cut of well P1 after well stuffy decreases. With the increase in well spacing, the production water cut increases, and the water cut reduction capacity of synergistic CO2 huff and puff decreases.
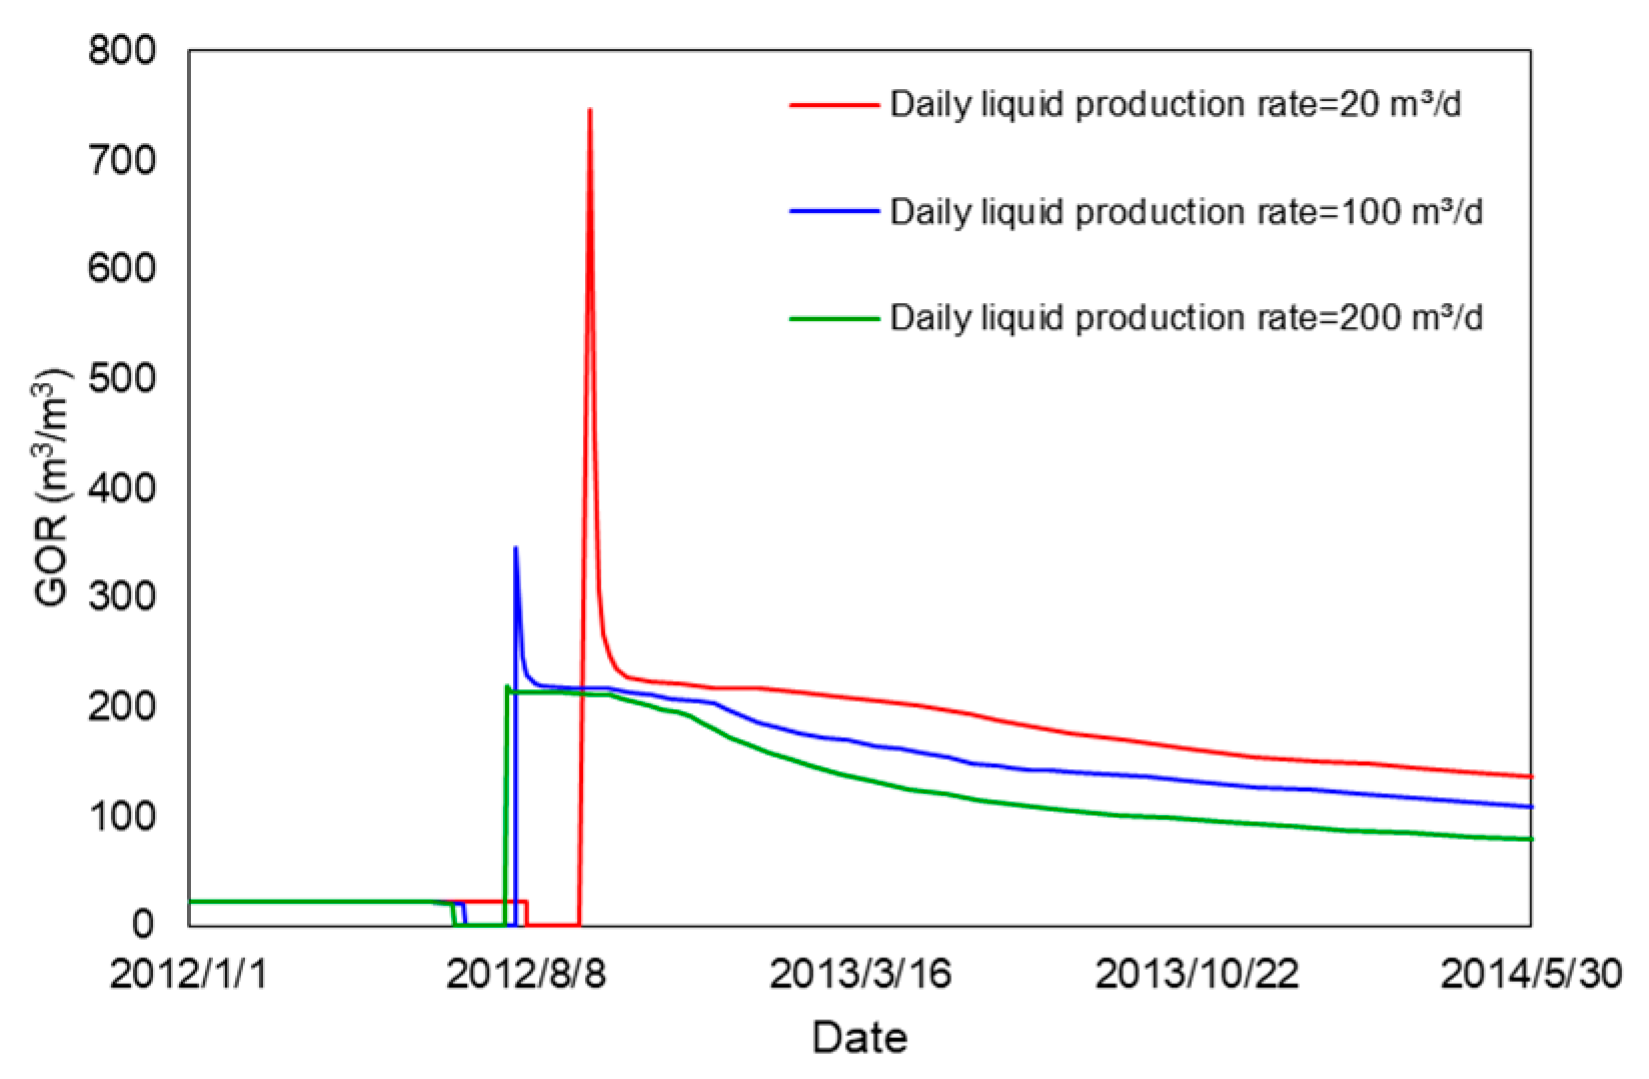
The production GOR of P1 is shown in Figure 29. It can be seen that as production progresses, gas channeling occurs in the high-structural-position well. The higher the liquid production rate of the high-position well, the earlier the gas channeling but the smaller the maximum GOR. This is because the higher the liquid production rate, the higher the rate of CO2 migration to high-position wells, and the earlier the gas channeling in high-position wells. When the liquid production rate is small, the CO2 migration speed is slow. In the process of slow upward migration, a large amount of CO2 is accumulated and stored between the wells. After the gas reaches the P1 well, the inter-well percolation resistance rapidly decreases, such that the CO2 quickly migrates to the bottom of the well and the GOR rises sharply. When the liquid production rate is high, the CO2 migration is relatively fast. During the upward migration process, there is less accumulated CO2; thus, the maximum gas oil is relatively small. The simulation results indicate that the higher the liquid production rate of higher-structural-position wells, the earlier the gas channeling, the smaller the decrease in water cut after well stuffy of low-position well, and the smaller the oil increase.
3.1.3. Multi-Well Synergistic Mode

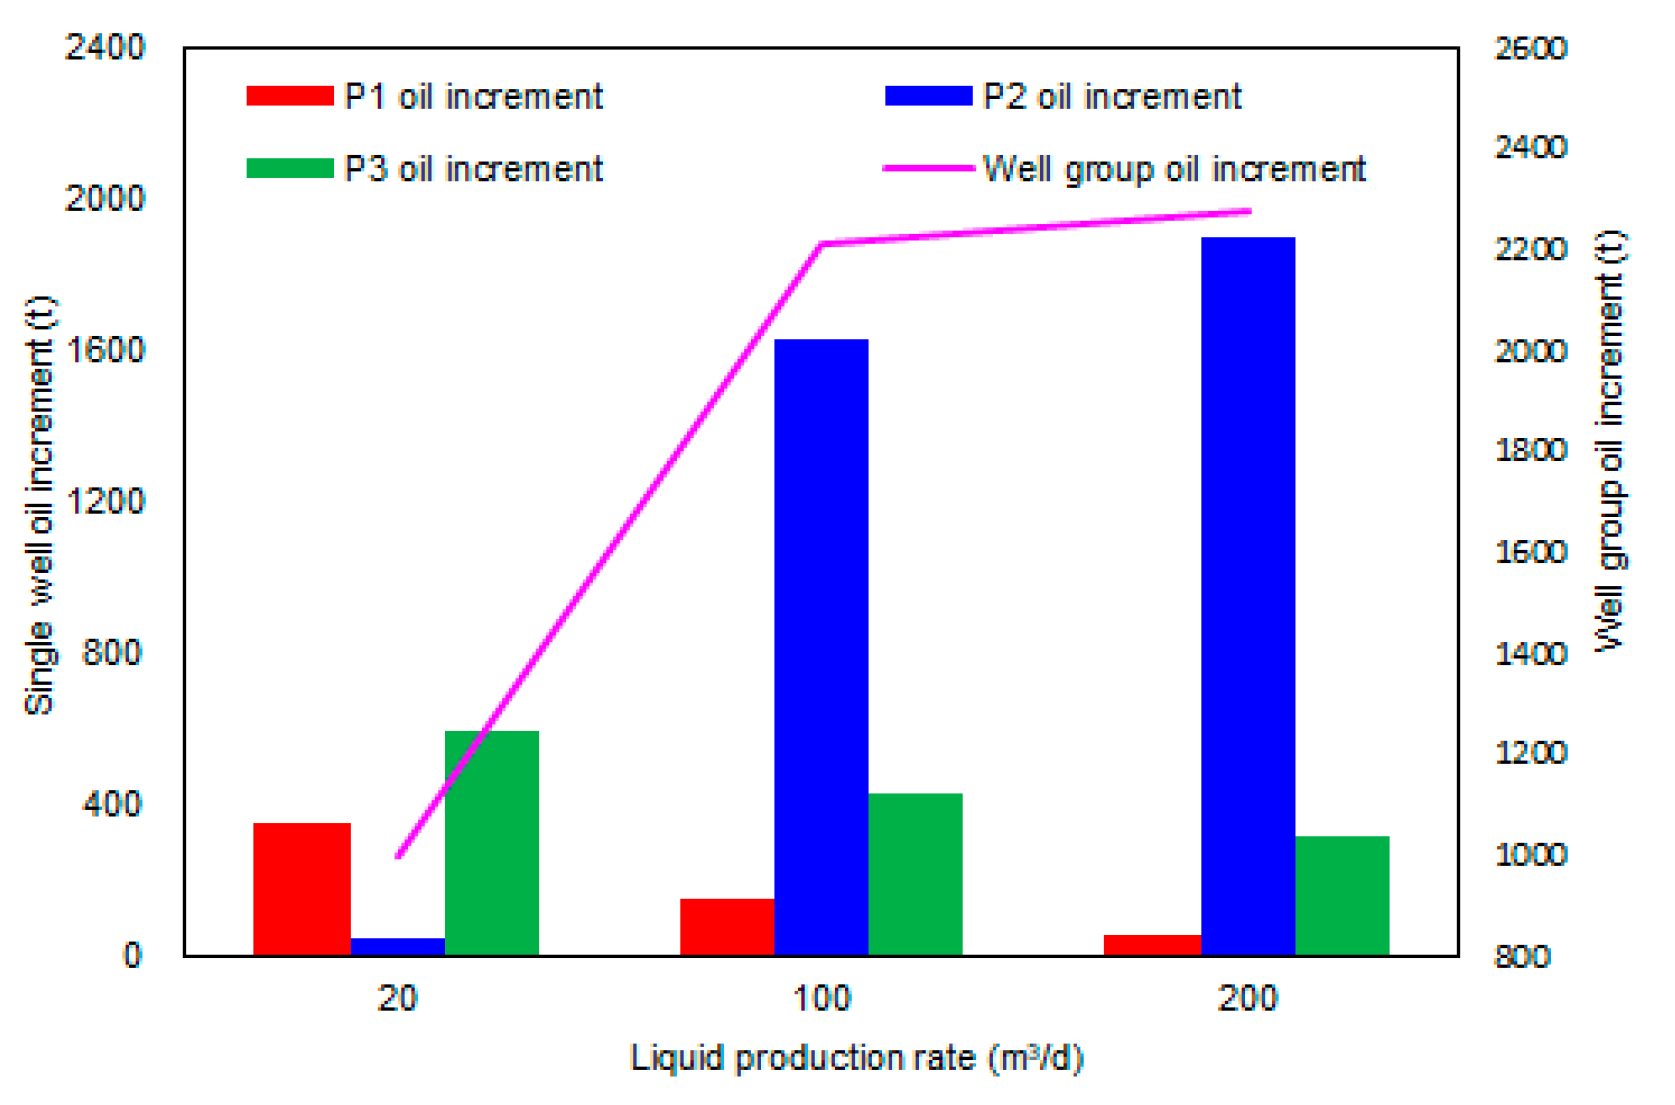
The model parameters are consistent with the two-well and single-well synergistic modes. The difference from the other two models is that the typical model of multi-well synergistic mode has three horizontal wells. P1, P2, and P3 are located at the low part, middle, and high part of the structure, respectively. P1 and P3 perform CO2 huff and puff when water cut reaches 98%, and P2 maintains production in the process of huff and puff. In this mode, the only main control factor that we need to study is liquid production rate of the middle-position well.
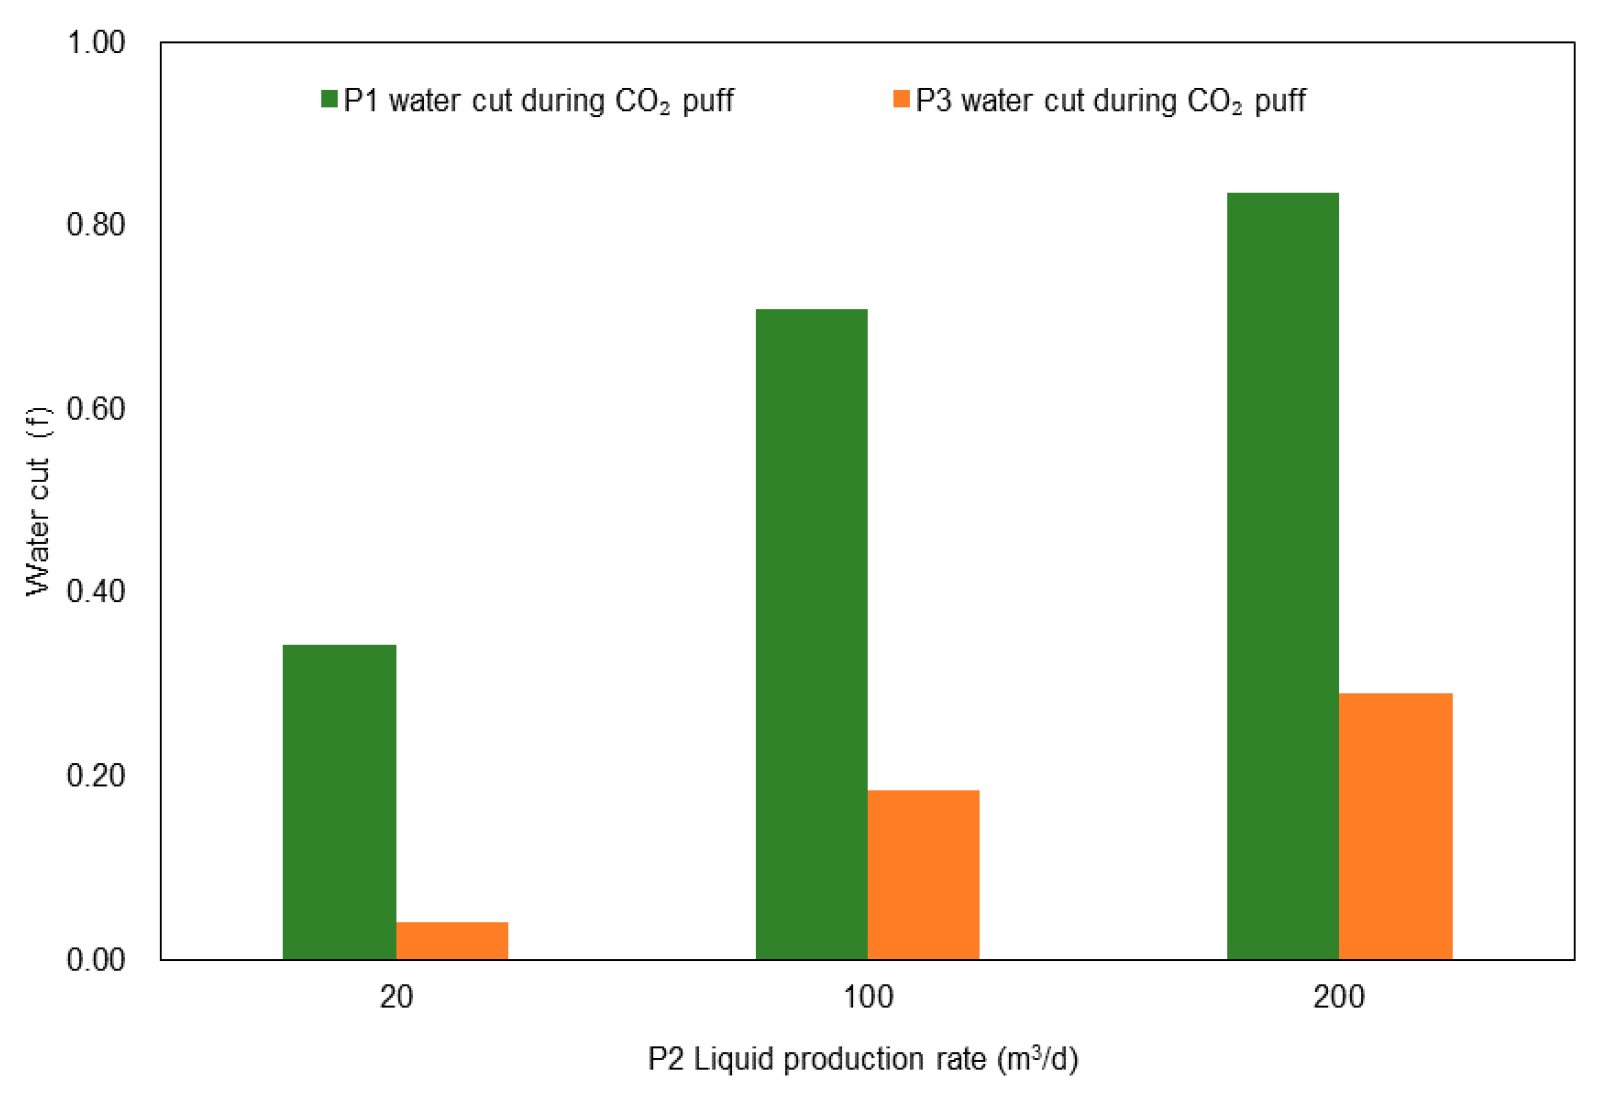
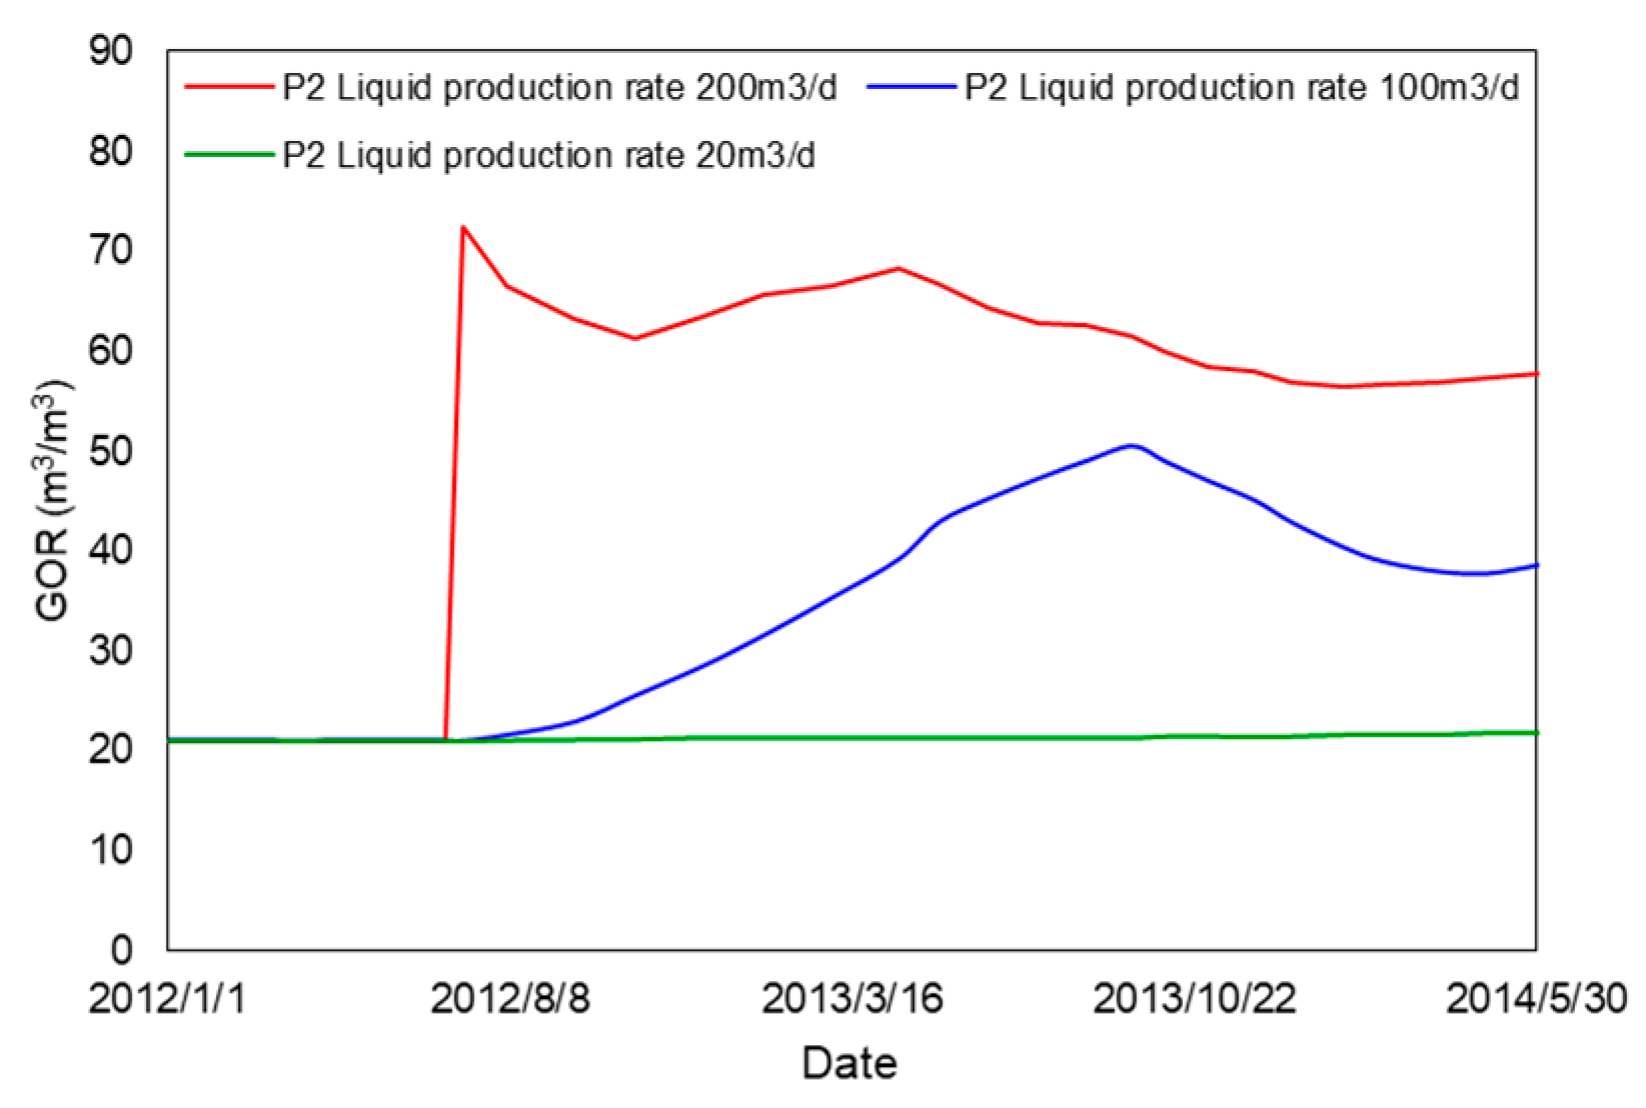
The dissolution and distribution of injected CO2 are affected by the dynamic parameter of pressure and liquid production rate [47]. To clarify the influence of liquid production rate of middle well, three levels of 20, 100, and 200 m3/d were designed. The oil increment of each single well and well group are shown in Figure 30. Figure 30 and Figure 31 indicate that the higher the liquid production rate, the lower the oil increment, and the worse the water cut reduction. Figure 31 shows the water cut of wells P1 and P3. It can be seen that the higher the liquid production rate of the middle well, the higher the water cut of the well, and the smaller the precipitation rate. Figure 32 shows the GOR of P2 well. The higher the fluid production rate of the middle well, the more evident the gas channeling of CO2 to the middle well.

3.2. Results Discussion

3.2.1. Sensitivity of Main Control Factors

The sensitivity degree is taken as an indicator to evaluate the sensitivity of factors and is defined as:
s   =   Q o max Q o min
where s is the degree of sensitivity, and Qomax and Qomin are the maximum and minimum oil increase, respectively. If the sensitivity degree is higher than 1.2, the considered factor is a very sensitive factor. When choosing a block for the implementation of CO2 synergistic huff and puff, this factor should be considered first, and its optimal value should be selected. If the sensitivity degree is higher than 1.1, the factor is a sensitive factor and should be considered when selecting the block that implements CO2 synergistic huff and puff, but the value of this factor can be required. When the sensitivity degree is less than 1.1, the factor is an insensitive factor, which can be considered last in the constituency. The sensitivity of each factor is shown in Table 9.
From the evaluation results, among the geological factors, the reservoir rhythm and permeability contrast of inter-well are extremely sensitive factors, the stratum dip is a sensitive factor, and the relationship with the isobaths is an insensitive factor. Among the development factors, well spacing, liquid production rate of high-position wells, and middle wells are extremely sensitive factors, and the injection volume allocation scheme is a sensitive factor.
Regardless of the synergistic huff-and-puff mode, geological factors are decisive for the implementation of the synergistic huff and puff. Reservoirs with a larger stratum dip show more evident gravity differentiation of CO2 capacity, which is beneficial for tapping the residual oil in the high potential area and expands the action range of CO2. For the synergistic huff and puff based on horizontal wells, the reservoir rhythm is very important, and the bottom water rises slowly in the reverse rhythm reservoir, in which CO2 huff-and-puff performance is the best. The positive rhythm oil reservoir can easily cause a horizontal ridge incursion due to the proper physical properties of the lower part of the reservoir, and the CO2 validity period is short. The overall performance of synergistic huff and puff is poor. The influence of inter-well channels permeability contrast on synergistic huff and puff can be divided into two categories. The first class is conducive to synergistic huff and puff. For synergistic well groups with large well spacing, gas channeling is a medium for full contact between CO2 and crude oil, which is conducive to the use of residual oil between wells. The other is adverse effects on synergistic huff and puff. Characteristics of this type include the residual oil saturation in adjacent wells of huff-and-puff wells, which are low and do not meet the conditions that can make the synergistic huff and puff effective, and injected gas channels along unsealed faults and the reservoir channel that connect the edge and bottom water. These conditions cause unnecessary consumption of CO2 in the formation and reduce the contact area between CO2 and crude oil.
Under different synergistic huff-and-puff modes, the concerned development factors are different. Under the two-well synergistic huff-and-puff mode, the injection volume allocation is a sensitive factor. For the same injection volume conditions, increasing the CO2 injection ratio of the low part of the well is conducive for improving oil increment and water-cut reduction of CO2 synergistic huff and puff.
In the single-well synergistic huff-and-puff mode, the liquid production rate of higher-structural-position wells is an extremely sensitive factor. The higher the fluid production rate, the earlier the gas channeling in the higher-structural-position wells, and the more serious the interference with the lower-structural-position wells. In this mode, well spacing is also an extremely sensitive factor. After the CO2 is injected into formation, there is a limited migration distance. The small well spacing is conducive for producing residual oil between wells. If the well spacing is too large, the synergistic effect is weakened. In the multi-well synergistic huff-and-puff mode, the liquid production rate of the middle well is an extremely sensitive factor, and its intensity determines the migration velocity of CO2 to the middle well. The higher the liquid production rate, the earlier the gas channeling, and the worse the synergetic huff-and-puff performance.

3.2.2. Adaptability of Synergistic Mode

Based on the actual development of various reservoirs at home and abroad, as well as the research results of the influence law of main control factors, from two aspects of reservoir conditions and development conditions, the applicable situations of different synergistic mode are proposed to guide the implementation of CO2 huff and puff.
(1) Two-well Synergistic Mode
For the actual areas which tend to conduct CO2 synergistic huff and puff, the preferential selection are blocks with large stratum dips or well groups clearly controlled by microstructure. Large stratum dip angles are conducive to strengthening gravity differentiation. Priority is given to those oil reservoirs with positive sedimentary rhythm and larger oil layer thickness, which have higher potential for oil increment through CO2 synergistic huff and puff. In addition, the heavy oil reservoirs with larger crude oil viscosity are a potential selection from the perspective of crude oil viscosity. Due to the large difference in fluid viscosity and the influence of static heterogeneity, the water cut quickly rises after water flooding development, and the residual oil near and between wells is rich.
For the areas that meet the implementation requirements of CO2 synergistic huff and puff, development factors are another important consideration in the mode selection of CO2 synergistic huff and puff. For development areas, the development well can be clearly divided into two-well rows. Reservoirs with strong edge and bottom water have inter-well channels when the well group is close to the oil–water boundary. The inter-well channel has a limited impact on the development performance of the two-well synergistic mode. Therefore, if there are inter-well channels, the two-well synergistic mode is recommended.
The two-well synergistic mode shows a good tolerance of well spacing for the small oil increment difference between 40 and 80 m. The well spacing is better controlled within 120 m. CO2 has a limited migration distance after injected into the formation, and excessively large well spacing is not conducive to balance the pressure between wells and inhibits gas channeling. For well groups with evident gas channeling channels, the well spacing can be appropriately enlarged.
(2) Single-Well Synergistic Mode
The reservoir conditions required by this mode are similar to those of the two-well synergistic mode, except that there should be no dominant inter-well channels between injection and production wells. Comparing the influence of the dominant inter-well channel in the two modes on the development effect, it was found that the inter-well channel has a particularly large impact on the development performance of the single-well synergistic mode. When there are channels between wells, the total oil increment of the well group decreases by three times. Therefore, it is not recommended when there are numerous dominant inter-well channels with larger permeability contrast in the reservoir.
According to the change law of well spacing and well group oil increment, it was found that when the well spacing exceeds 70 m, the performance of huff and puff sharply deteriorates. If the reservoir development well spacing is higher than 70 m, this model is not applicable. Regardless of the synergistic mode, the well spacing should not be excessively large to achieve a good development performance.
(3) Multi-well Synergistic Mode
This mode is a combination of the first two modes. The reservoir situation is similar to that of the two-well synergistic mode. If the reservoir development well pattern can be clearly divided into three well rows (high, middle, and low) and the liquid production rate of the middle well can be controlled, then this mode can be used for CO2 synergistic huff and puff.
Synergistic huff-and-puff modes can be divided into two categories: one is a mode that is conducive to oil increment and water-cut reduction, and the other is a mode in which the performance is weakened by the existence of gas channeling. This type of mode needs to be reasonably avoided during the mode selection process.
Synergistic effects are beneficial to CO2 synergistic huff and puff for increasing oil and precipitation. The situations conducive to synergistic performance are the cases in which the synergistic wells’ ligature is perpendicular or parallel to the structural contour. When the synergistic wells’ ligature is perpendicular to the structure isobaths, the following modes show good synergistic performance: (1) single-well huff and puff for horizontal and adjacent wells present synergistic effects due to gas channeling; (2) huff-and-puff measures are implemented for horizontal wells, and synergistic wells need to be located at the high structure part; (3) mixed well patterns of vertical and horizontal wells perform synergistic huff and puff.
Synergy effects not conducive to the performance of CO2 huff and puff should be avoided. In the first case, the huff and puff’s adjacent well is a continuous product with large liquid volume. In this case, inter-well interference occurs and easily induces gas channeling, which weakens the performance of huff-and-puff wells. In the second situation, there are channels between wells, but adjacent wells do not have synergistic conditions and exhibit low residual oil saturation. The unnecessary consumption of CO2 in the formation caused by inter-well channel connected to the margin water leads to a decreasing contact area of CO2 and crude oil. These two disadvantageous conditions can be mitigated by adjusting the production parameters or work regime of interfering wells, such as reducing liquid production capacity, closing the production well, or staggering the well’s production time.

3.2.3. EOR Mechanism of Synergistic Huff and Puff

The application of synergistic CO2 stimulation in multi-horizontal wells is targeted at well group units, and multi-well combined stimulation is adopted to enhance near-well residual oil production and to further excavate residual oil between wells. The synergistic CO2 huff-and-puff mechanism includes:
(1) Replenishment of formation energy, balance of the pressure distribution between wells, and suppression of gas channeling. When horizontal wells are produced, low-pressure areas are formed near the wells. The synergistic well group simultaneously injects gas, stuffs wells, and then opens wells, which unifies the working system of huff-and-puff wells and avoids gas channeling caused by pressure tendency surface formed during production of adjacent wells;
(2) Gravity differentiation cooperation to tap potential residual oil of inter-well, high structural part, and top of oil layer;
(3) Inhibition of static heterogeneity. After stuff, the well is opened to produce oil, and a large amount of foam is generated when the side and bottom water displace CO2. The formed foam increases the additional pressure in the porous medium and strengthens the Jamin effect. The Jamin effect reduces the water-phase percolation capacity of the high water-cut layer, which suppresses the effects of water channeling and gas channeling caused by static heterogeneity and ultimately improves the utilization degree of crude oil enrichment area;
(4) The coupling effect of dynamics and oil reservoirs suppresses the impact of dynamic heterogeneity. In the process of synergistic huff and puff, the dissolution and distribution of CO2 are affected by the dynamic parameter of pressure and fluid production rate.

4. Field Application

4.1. Oilfield Overview

The C2X1 fault block is located in Jidong oilfield with a depth of 1700 m and a main layer NG13 and presents the following characteristics: average permeability of 700 mD, average porosity of 26%, formation pressure of 17 MPa, pressure coefficient of 0.97, reservoir temperature of 60 °C, formation crude oil density of 265 mPa·s, and surface crude oil density of 0.96 g/cm3. It is a typical structurally controlled small fault block ordinary heavy oil reservoir with edge and bottom water. This fault block has seven horizontal production wells, but there is no injection well.

4.2. Application Senario

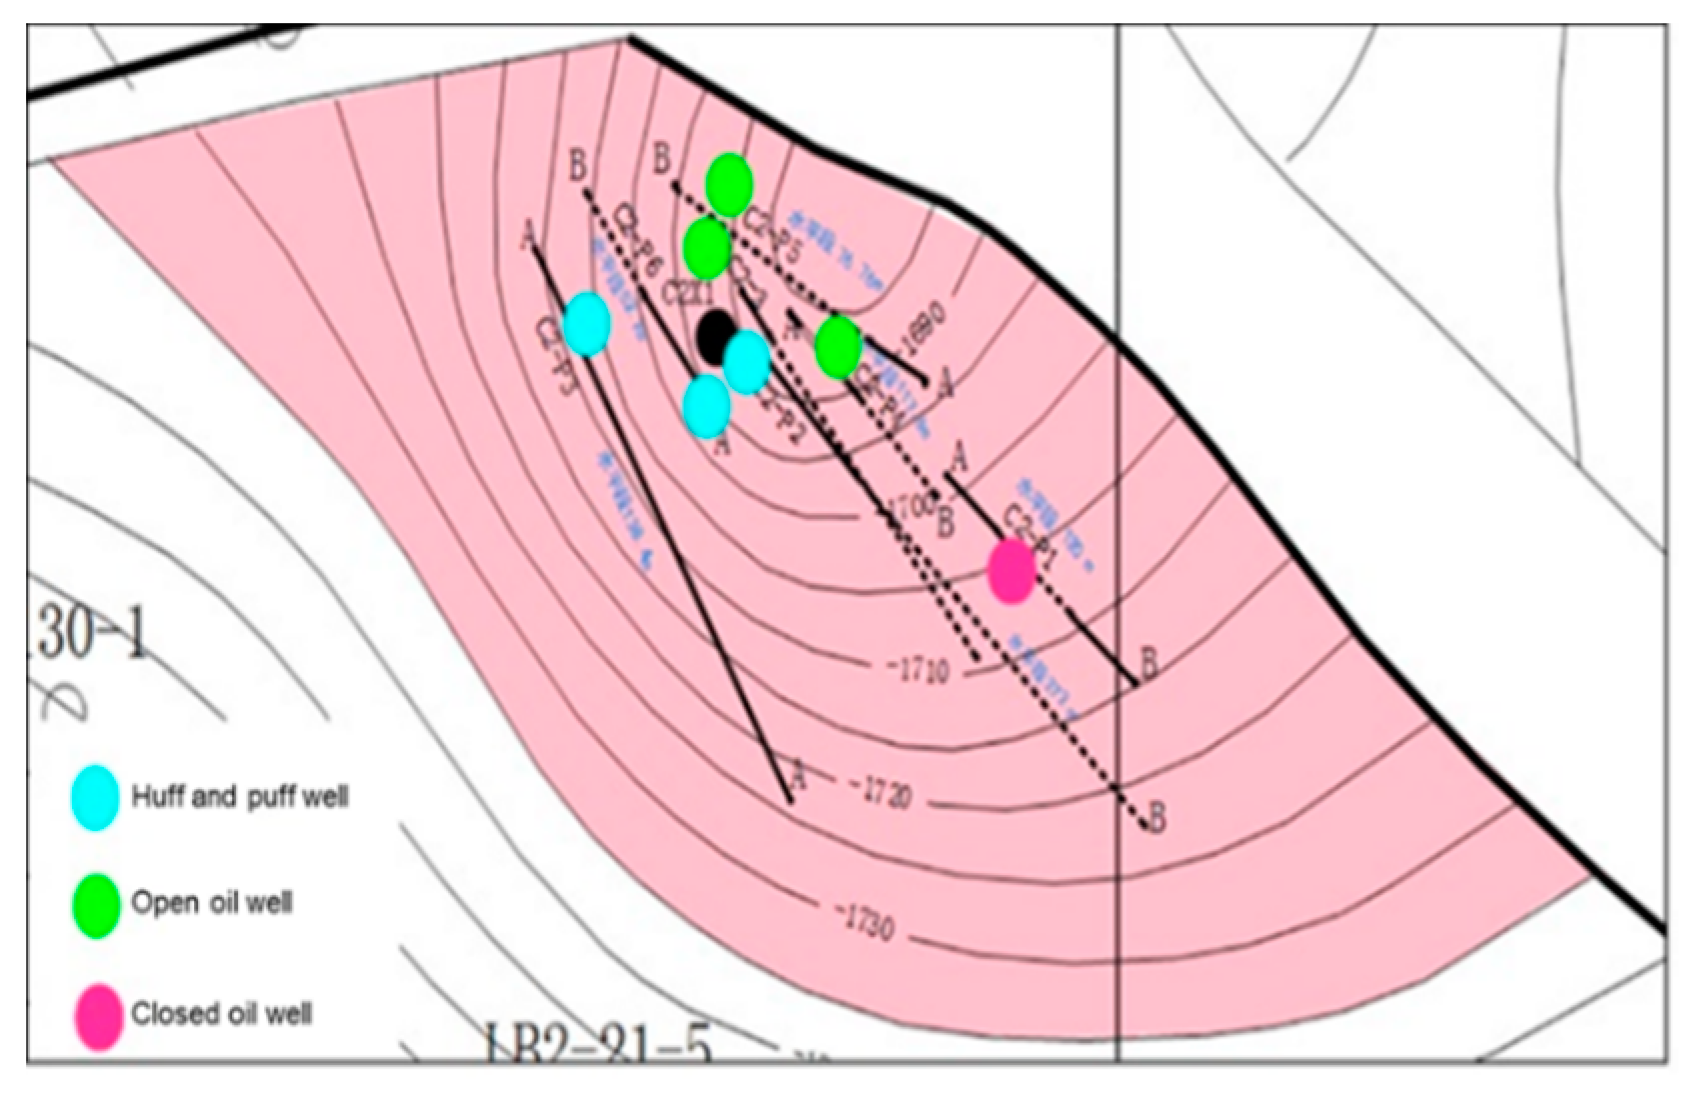
CO2 synergistic huff and puff was conducted on 15 April 2014. The CO2 injecting wells are C2–P2, C2–P3, and C2–P6. The adjacent wells that need to be observed are C2X1, C2–3, C2–P4, and C2–P5. C2–3 and C2–P4 are closed during the gas injection process. Well C2–P1 is permanently closed. The locations of CO2 synergistic huff-and-puff wells are shown in Figure 33, and the implementation plan is presented in Table 10.

4.3. Performance Evaluation

Statistics and calculation of parameters, including production GOR, oil increment, water cut, working fluid level, and daily liquid production volume before and after the CO2 synergistic huff and puff, are performed to evaluate the performance of CO2 synergistic huff and puff. The CO2 EOR mechanism reduces crude oil viscosity, crude oil volume expansion, extraction, light hydrocarbons, and dissolved gas flooding in vaporized crude oil, which reflects the oil increase ability [48,49]. The oil increment of synergistic CO2 huff and puff is the most intuitive parameter to characterize the oil increase ability. The effect of CO2 huff and puff is in addition to oil increase and water-cut reduction. When the CO2 injection well is opened for production, the edge and bottom water form a large amount of foam during the process of displacing CO2, which increases the additional pressure in the porous medium and reduces the water-phase percolation capacity of the severe water flooded layer. The enhancing mechanism is reflected in the reduction of water cut in production. Therefore, the water cut reflects the ability of CO2 water-cut reduction. In the process of oilfield development, insufficient formation energy causes a rapid decline in production and reduces recovery efficiency [50,51]. The injection of CO2 can supplement the formation energy balance pressure distribution between wells and decelerate the gas channeling to improve oil recovery. The changing tendency of the working fluid level and daily liquid production reflects the ability of injected CO2 to supplement the formation of energy. Through the changes of the moving liquid level and liquid production, it can be known whether the injected CO2 has supplemented the formation energy.

4.3.1. Oil Increment

In this CO2 synergistic huff-and-puff stimulation program, all CO2 injection wells are effective, and C2–3 and C2–P4 wells in adjacent wells are synergistically effective, but C2X1 and C2–P5 are not effective. The performance of each well is shown in Table 11. The oil increment of effective wells is higher than that of synergistic effective wells. The total oil increment is 6400.7 t, and the CO2 synergistic effective well increases oil by 995.84 t; thus, the synergistic efficiency is 50%.
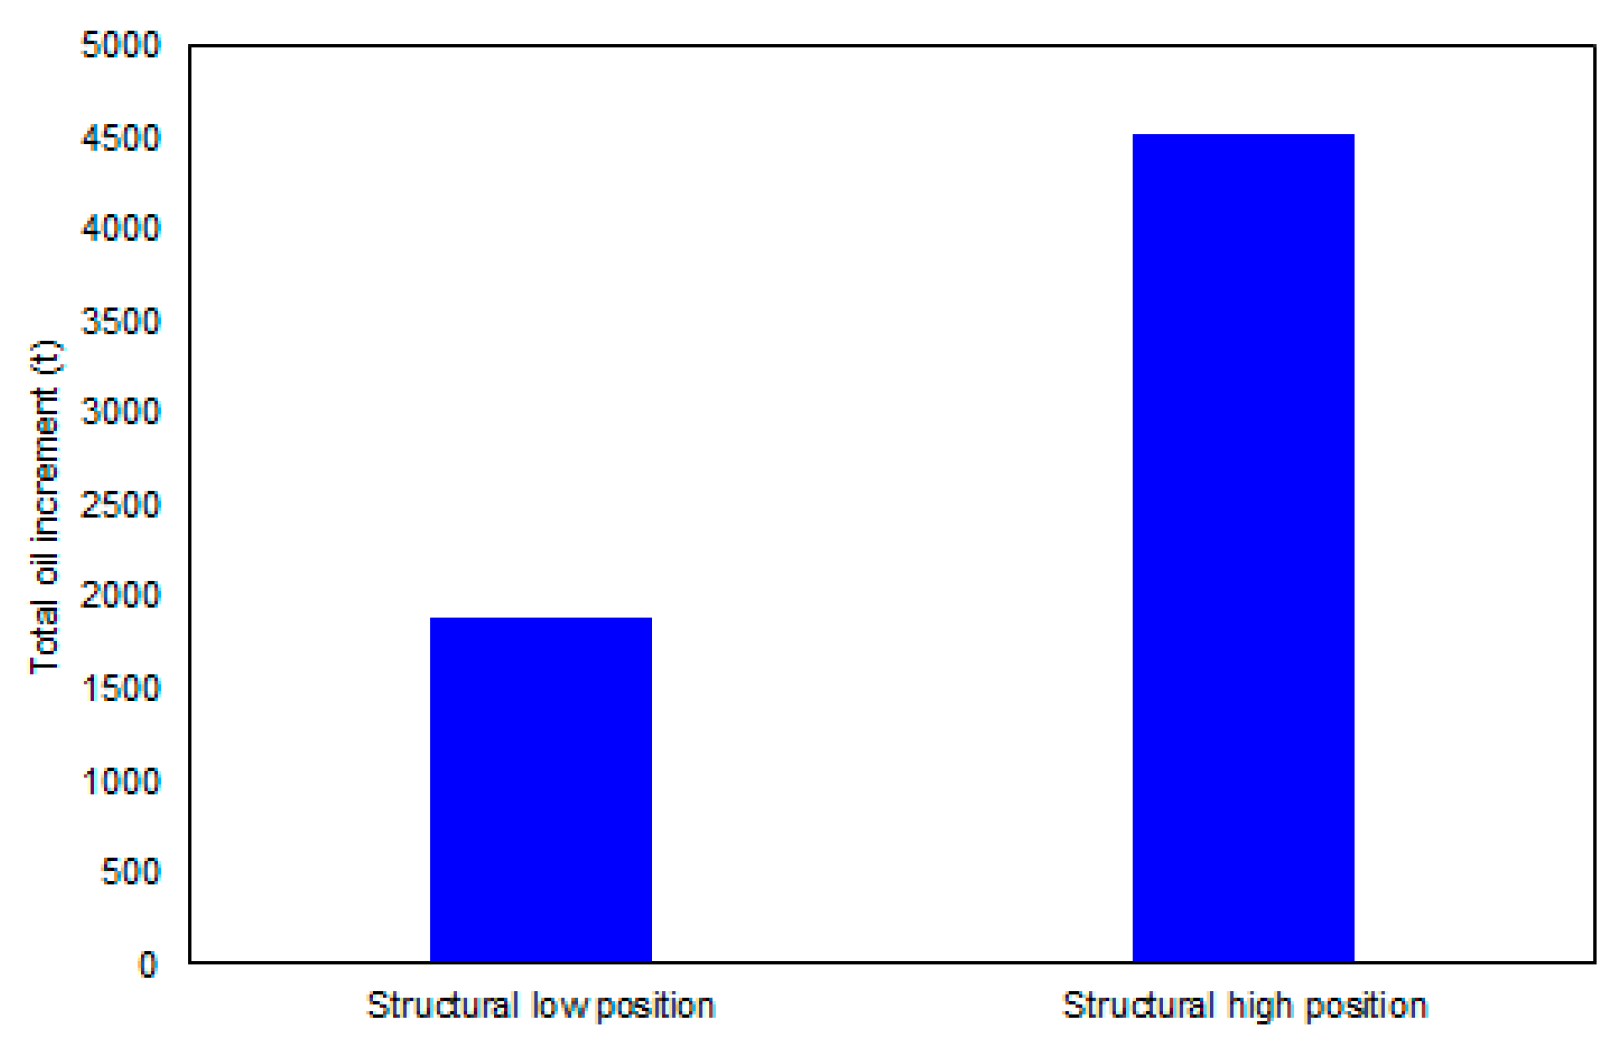
Statistics of the oil increment of production wells at different structural positions indicate that the oil increment of C2–P3 in the lower structural part is significantly less than that of wells in the high structural position, which is shown in Figure 34. The oil increment of 1878.54 t is significantly lower than the oil increment of the high part wells of 4521.16 t. The reason for this performance is that under the action of gravity differentiation, the injected CO2 migrates upwards; thus, the amount of CO2 acting on the high part wells is larger. The effectiveness of C2–3 and C2–P4 is mainly caused by the CO2 huff and puff of well C2–P2; thus, the oil increment of wells in higher structural positions is better than that in low positions.

4.3.2. Water-Cut Reduction

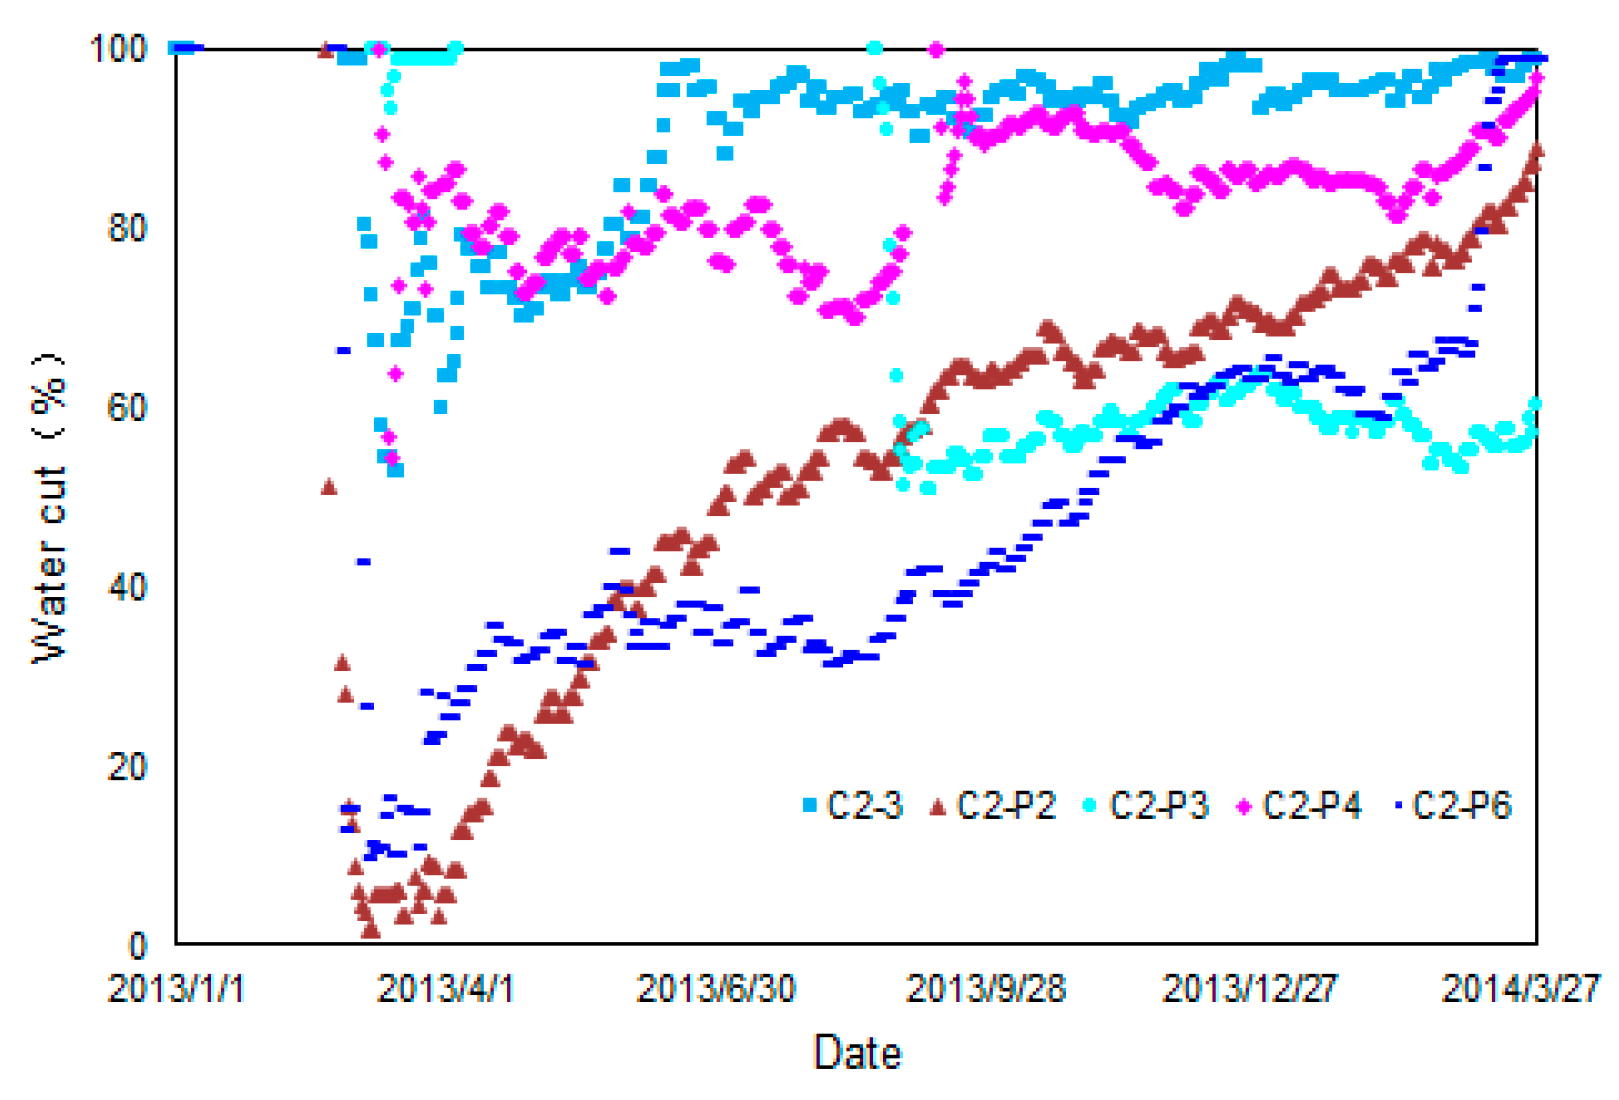
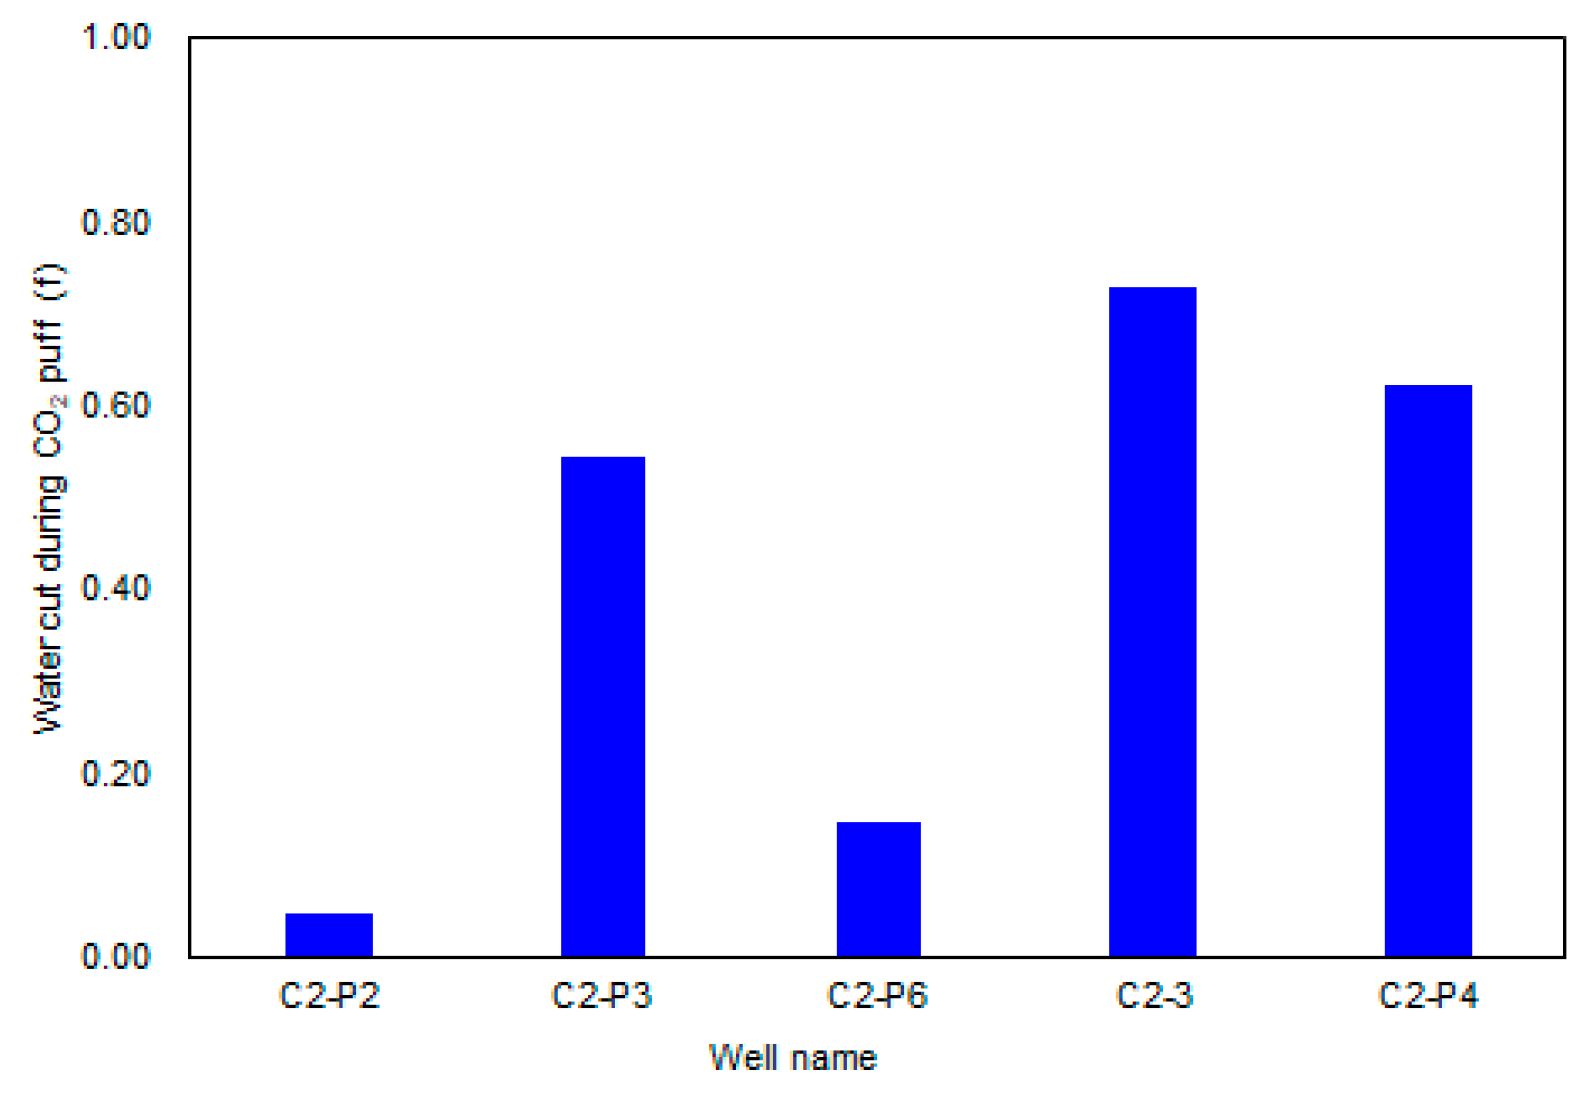
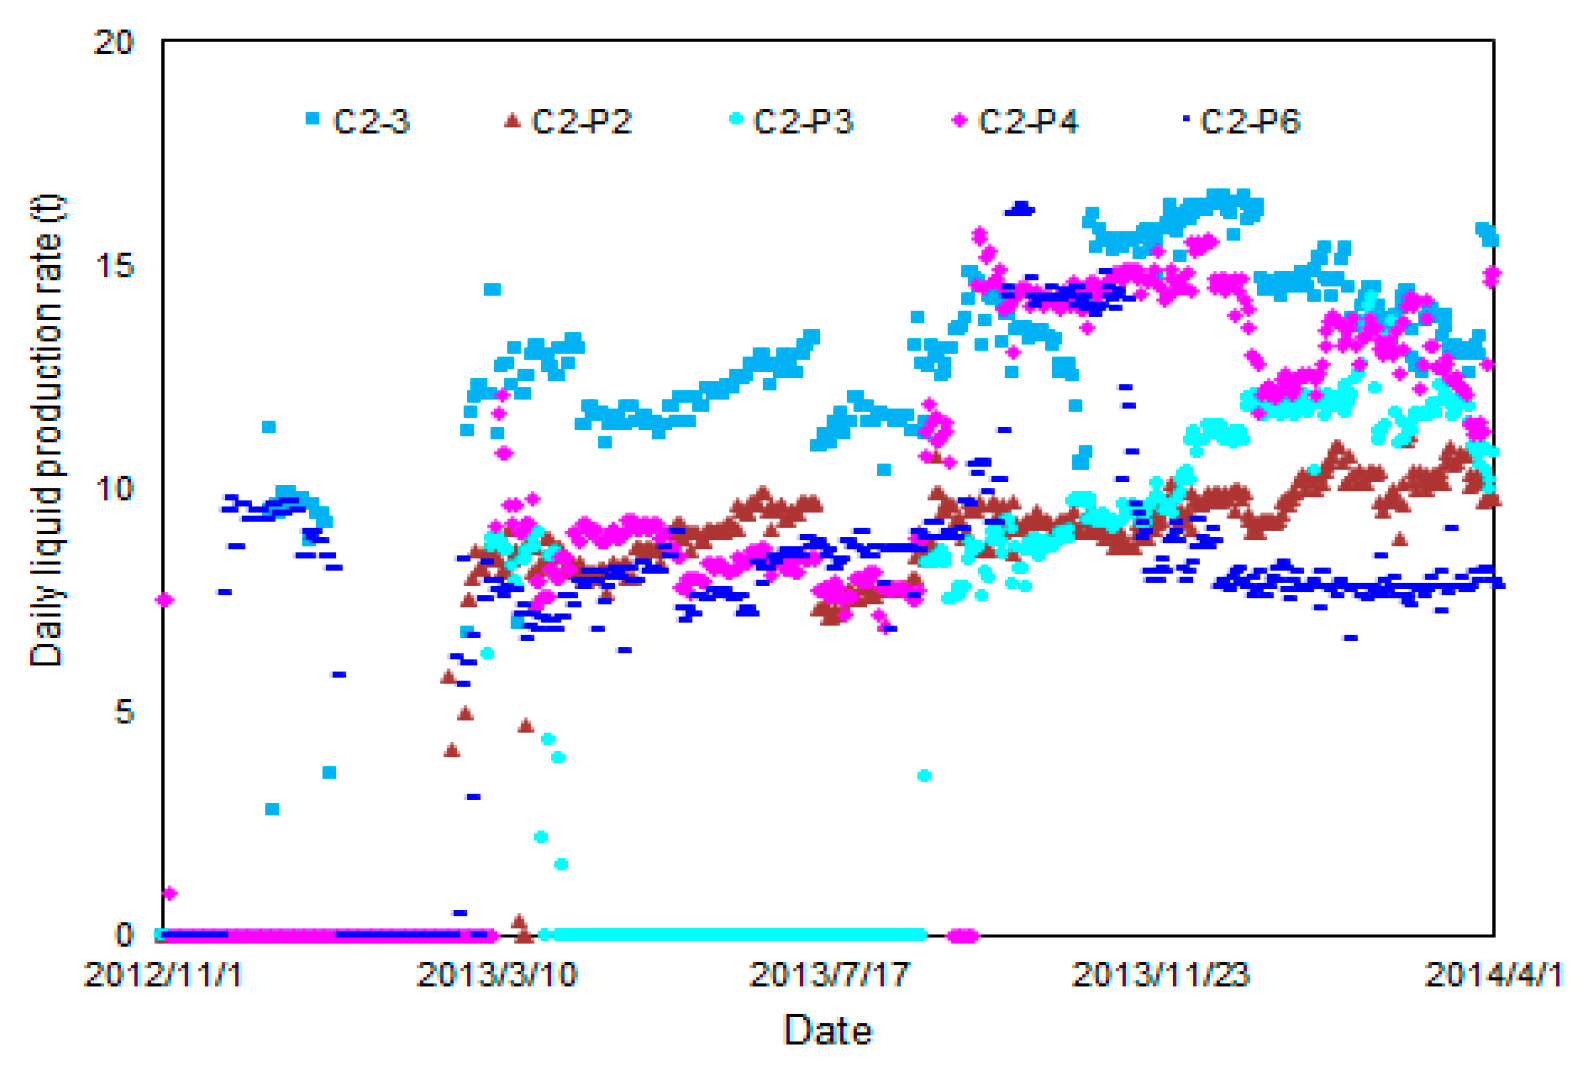
The water cut of the effective wells is shown in Figure 35. After the wells are opened, the water cut of the synergistic effective wells, C2–3 and C2–P4, slightly decrease and then rise until they return to the level before the huff and puff. After well opening, the water cut of CO2 huff-and-puff wells is very low, less than 20%. After nearly 11 months, it slowly rises to the level observed before the well is opened, indicating that the CO2 huff-and-puff well has a good water control effect. For synergistic wells, the water cut is higher than that of effective wells, and the water cut exhibits a downward tendency after the well is opened for some time. This indicates that as the production proceeds, CO2 migrates to the synergistic well, and the water control effect is evident. As the production progresses, the water cut begins to rise. This is due to the limited amount of CO2 that migrates to the synergistic well; thus, the water control effect time is short. Figure 36 shows a comparison chart of water cut before and after the well is opened. The water cut of the first five effective wells of the huff and puff is close to 100%. After well stuffy, the water cut significantly decreases, which shows that the CO2 has a better water control effect. The average water-cut reduction of CO2 synergistic huff and puff is 57.7%.

4.3.3. Formation Energy Supplement

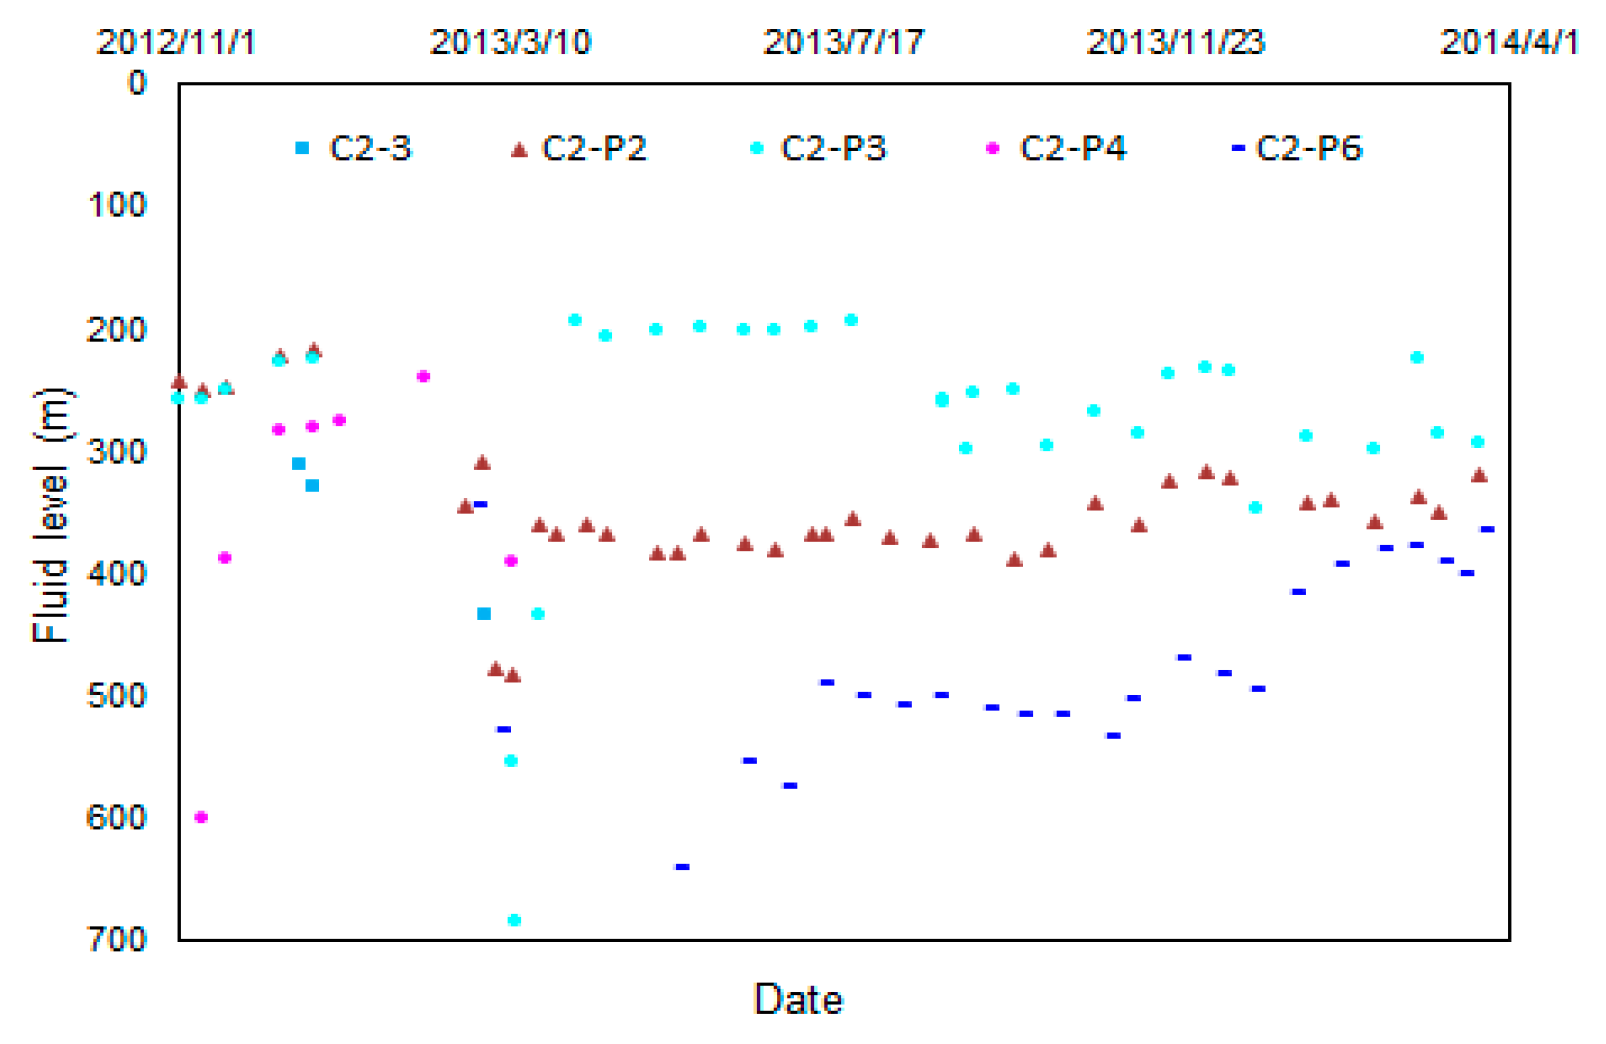
The daily liquid production volume of the effective wells is shown in Figure 37 and indicates that the daily liquid production of each well has significantly increased compared to that before the implementation of synergistic CO2 huff and puff. Figure 38 shows the working fluid level of effective wells, and it can be seen that the working fluid level of C2–P2 well decreases from 230 to 300 m, that of C2–P3 well rises from 250 to 200 m, and the working fluid level of C2–P6 slightly rises. The working fluid level of synergistic effective well C2–P4 significantly rises from 600 to 300 m. The rise of daily liquid production volume and working fluid level indicates that the CO2 synergistic huff and puff has supplemented the formation energy and reduced the decline rate of reservoir development.

5. Conclusions

Based on the characteristics of fault-block reservoirs with small oil-bearing area, broken structure, and lack of well-developed well patterns, three synergistic stimulation modes are proposed. The sensitivity of each factor is evaluated according to the sensitivity degree calculated by oil increment. The well selection principle and EOR mechanism of CO2 synergistic huff and puff are also proposed.
(1) Synergistic CO2 huff and puff is a reasonable and orderly huff and puff with multiple wells, which can maintain good development performance and extend the technical life of CO2 stimulation. According to the actual fault-block reservoir conditions and development situation, the appropriate synergistic huff-and-puff mode is selected to conduct synergistic huff and puff and to identify the sensitivity of main control factors;
(2) The evaluation results show that the reservoir rhythm and inter-well passage are extremely sensitive factors among geological factors; the stratum dip is a sensitive factor; and the relationship with isobaths is an insensitive factor. Among the development factors, the well spacing, liquid production rate of high-position wells, and liquid production rate of middle wells are extremely sensitive factors, and the injection volume distribution method is a sensitive factor;
(3) The EOR mechanism of synergistic CO2 huff and puff includes gravity differentiation, replenishment of formation energy, balance of the pressure distribution between wells, inhibition of static heterogeneity, and suppression of gas channeling. CO2 forms a foam in the reservoir, exhibiting the Jamin effect;
(4) The implementation conditions of the two-well cooperative stimulation mode are the simplest. The two-well model is suitable for thick oil layers with a positive rhythm and large formation dip. The other two modes have special implementation requirements. The single-well mode requires no channeling between wells, and the multi-well mode involves multi-well rows and can control the intermediate well’s fluid production rate;
(5) When the appropriate implementation mode is determined, CO2 synergistic huff and puff shows an excellent performance of field application, with total oil increment and average water-cut reduction of C2X1 block of 1280 t and 57.7%, respectively.

Author Contributions

Conceptualization, T.L. and G.H.; methodology, W.Z.; software, G.H.; validation, P.D., W.Z. and G.H.; formal analysis, X.M.; investigation, W.Z.; resources, X.M.; data curation, W.Z.; writing—original draft preparation, W.Z.; writing—review and editing, W.Z.; visualization, G.H.; supervision, J.H.; project administration, T.L.; funding acquisition, T.L. All authors have read and agreed to the published version of the manuscript.

Funding

This work was supported by National Science and Technology Major Projects (No.2018YFB0605500, 2017ZX05009004).

Institutional Review Board Statement

Not applicable.

Informed Consent Statement

Not applicable.

Data Availability Statement

Data sharing not applicable.

Acknowledgments

We would like to thank the Ministry of science and technology for funding this research.

Conflicts of Interest

The authors declare no conflict of interest.

References

  1. Li, S.; Tang, Y.; Hou, C. Present situation and development trend of CO2 injection enhanced oil recovery technology. Reserv. Eval. Dev. 2019, 9, 1–8. [Google Scholar] [CrossRef]
  2. Peng, L.; Yin, H.; Zhong, C. A search of Application and Development of Carbon Dioxide Flooding. Guangdong Chem. Ind. 2017, 44, 143–144. [Google Scholar]
  3. Pranesh, V. Subsurface CO2 storage estimation in Bakken tight oil and Eagle Ford shale gas condensate reservoirs by retention mechanism. Fuel 2018, 215, 580–591. [Google Scholar] [CrossRef]
  4. Deng, R.; Tian, W.; Li, Z.; Zhao, L.; Dai, H. Microscopic Limits of Reservoir Producing for Carbon Dioxide Flooding. Spec. Oil Gas Reserv. 2019, 26, 133–137. [Google Scholar] [CrossRef]
  5. Hu, Y.; Hao, M.; Chen, G.; Sun, R.; Li, S. Technologies and practice of CO2 flooding and sequestration in China. Petrol. Explor. Dev. 2019, 46, 716–727. [Google Scholar] [CrossRef]
  6. Sun, S. Discussion on the feasibility of carbon dioxide oil enrichment technology. Chem. Eng. Equip. 2019, 2, 103–105. [Google Scholar]
  7. Zhou, X.; Yuan, Q.; Peng, X.; Zeng, F.; Zhang, L. A critical review of the CO2 huff ‘n’ puff process for enhanced heavy oil recovery. Fuel 2018, 215, 813–824. [Google Scholar] [CrossRef]
  8. Li, S.; Sun, L.; Chen, Z.; Li, J.; Tang, Y.; Pan, Y. Further discussion on reservoir engineering concept and development mode of CO2 flooding-EOR technology. Reserv. Eval. Dev. 2020, 10, 1–14. [Google Scholar] [CrossRef]
  9. Cao, X.; Lv, G.; Wang, J.; Zhang, D.; Ren, M. Present situation and further research direction of CO2 flooding technology in Shengli Oilfield. Reserv. Eval. Dev. 2020, 10, 51–59. [Google Scholar] [CrossRef]
  10. Wang, Z.; Zhao, F.; Feng, H.; Song, L.; Li, Y.; Hao, H. Experimental research on injection volumes optimization of CO2 huff and puff in horizontal well group in fault block reservoirs with edge water. Petrol. Geol. Recov. Eff. 2020, 27, 75–80. [Google Scholar]
  11. Zhao, F.; Song, L.; Hou, J.; Li, W.; Wang, P.; Hao, H. Experiment of nitrogen compound huff and puff for fault-block reservoirs with shallow edge water. Petrol. Geol. Recov. Eff. 2019, 26, 85–91. [Google Scholar] [CrossRef]
  12. Wang, Z.; Zhao, F.; Hou, J.; Hao, H. Synergistic effects during CO2 huff and puff of horizontal well groups in a fault-block reservoir and gas injection optimization under laboratory conditions. Petrol. Sci. Bull. 2018, 3, 183–194. [Google Scholar]
  13. Liu, H.; Zheng, J.; Shi, Q.; Qin, X.; Yang, X. Study on Injection-production Parameters Optimization of Horizontal Well CO2 Huff and Puff Technology in Complex Fault Block Reservoir. Oilfield Chem. 2017, 34, 84–86, 91. [Google Scholar] [CrossRef]
  14. Liu, L.; Jiang, H.; Chen, M.; Ma, H.; Wu, X. Technical Policy for Horizontal Well Steam Soak of Viscous Oil Reseroirs in Small Fault Blocks. J. Oil Gas Tech. 2006, 28, 127–129. [Google Scholar] [CrossRef]
  15. Li, B.; Zhang, Q.; Li, S.; Li, Z. Enhanced heavy oil recovery via surfactant-assisted CO2 huff-n-puff processes. J. Petrol. Sci. Eng. 2017, 159, 25–34. [Google Scholar] [CrossRef]
  16. Liu, X.; Qu, Z.; Du, Y. Experiment research on water control with CO2 in bottom water reservoir. Fault Block Oil Gas Field 2016, 23, 350–353. [Google Scholar] [CrossRef]
  17. Ma, H.; Wang, B.; Yan, X. Parameter optimization and field test of CO2 huff and puff of complex fault reservoir. Reserv. Eval. Dev. 2016, 6, 40–43. [Google Scholar] [CrossRef]
  18. Gao, L.; Zhou, Y.; Yuan, S.; Chen, X. Optimal design of CO2 huff and puff in Jidong Oilfield. Chem. Enterp. Manag. 2015, 30, 189. [Google Scholar] [CrossRef]
  19. Zhang, Y. A brief analysis of the application of CO2 combined huff and puff oil recovery technology in oilfield production. Inn. Mong. Petrochem. Ind. 2015, 5, 93–94. [Google Scholar]
  20. Wang, J. Dicussion on well selection conditions of CO2 huff and puff in low permeability reservoir. Reserv. Eval. Dev. 2019, 9, 57–61. [Google Scholar] [CrossRef]
  21. Qian, W.; Lin, G.; Wang, B.; Hu, W.; Liang, Z.; Zhang, J. Multi–cycle CO2 huff and puff matching technology and parameter evaluation for horizontal wells in heavy oil reservoirs with bottom water drive—By taking HZ block of Subei oilfield as an example. Petrol. Geol. Eng. 2020, 34, 107–111. [Google Scholar]
  22. Wang, G. Field Experiment of CO2 Assisted Steam Stimulation Technology. Sino Glob. Energy 2015, 20, 68–71. [Google Scholar]
  23. Li, J.; Yang, B.; Zhang, X.; Zheng, W.; Feng, X.; Zhang, W. Research on horizontal well compound huff and puff technology of heavy oil reservoir. Reserv. Eval. Dev. 2014, 42–46. [Google Scholar] [CrossRef]
  24. Alfarge, D.; Wei, M.; Bai, B. CO2-EOR mechanisms in huff-n-puff operations in shale oil reservoirs based on history matching results. Fuel 2018, 226, 112–120. [Google Scholar] [CrossRef]
  25. Ma, L.; Ouyang, C.; Wang, C.; Lin, F. Research on CO2 huffing technology in horizontal wells in low permeability reservoirs. Chem. Eng. 2018, 277, 38–47. [Google Scholar]
  26. Liu, D.; Shi, Y.; Xuan, L.; Wang, Y.; Li, X. In-Depth profile control and carbon dioxide huff-puff in the late stage of ultra-high water-cut oil reservoir development. Spec. Oil Gas Reserv. 2018, 25, 65–69. [Google Scholar] [CrossRef]
  27. Hou, L.; Zhao, J.; Li, F.; Xu, L.; Sui, C.; Song, Y. Study on oil Stabilization technology of dege bottom water reservoir CO2 huff and puff control water. Inn. Mong. Petrochem. Ind. 2017, 43, 72–74. [Google Scholar] [CrossRef]
  28. Tang, M.; Zhao, H.; Ma, H.; Lu, S.; Chen, Y. Study on CO2 huff-n-puff of horizontal wells in continental tight oil reservoirs. Fuel 2017, 188, 140–154. [Google Scholar] [CrossRef]
  29. Ding, M.; Wang, Y.; Wang, Y.; Gao, M.; Liu, D.; Chen, W. Experimental investigation of bypassed-oil recovery via CO2 soaking and huff and puff injection: Effects of miscibility and bypassed-oil size. Fuel 2019, 248, 152–160. [Google Scholar] [CrossRef]
  30. Guo, X. Study on microscopic migration characteristics of heavy oil by CO2 flooding at high temperature and high pressure. Petrol. Geol. Recov. Eff. 2019, 26, 99–104. [Google Scholar] [CrossRef]
  31. Zhou, X.; Yuan, Q.; Rui, Z.; Wang, H.; Feng, J.; Zhang, L.; Zeng, F. Feasibility study of CO2 huff ‘n’ puff process to enhance heavy oil recovery via long core experiments. Appl. Energy 2019, 236, 526–539. [Google Scholar] [CrossRef]
  32. Du, C.; Li, M.; Zhu, Y.; Li, W.; Yuan, G. Feasibility Study on Applying CO2-flooding Micro-visualization Technology in Ultra-low Permeability Reservoirs: A Case Study in Ordos Basin. Geoscience 2019, 33, 911–918. [Google Scholar]
  33. Jia, Y. Evaluation on Carbon Dioxide Huff and Puff Effect and Analysis of Its Influencing Factors in Qikeshu Oilfield. Adv. Fine Petrochem. 2019, 20, 15–18. [Google Scholar]
  34. Zhang, J.; Zhang, X.; Zhang, L.; Zhang, M.; Mei, H. Enhanced Oil Recovery Mechanism and Influence Factors of CO2 Puff and Huff in Horizontal Well. Oilfield Chem. 2017, 34, 475–481. [Google Scholar] [CrossRef]
  35. Wang, P.; Liu, C.; Wan, X.; Meng, X.; Zhang, H. Laboratory study on influencing factors of CO2 huff and puff in heavy oil reservoir. Petrol. Geol. Eng. 2016, 30, 115–118. [Google Scholar] [CrossRef]
  36. Hsu, H.-H.; Brugman, R.J. CO2 Huff-Puff Simulation using a compositional reservoir simulator. In Proceedings of the SPE Annual Technical Conference and Exhibition, New Orleans, LA, USA, 5–8 October 1986. [Google Scholar] [CrossRef]
  37. Hussein, H.; Abbas, F. Numerical modeling of diffusion in fractured media for gas-Injection and -recycling schemes. SPE J. 2009, 14, 323–337. [Google Scholar] [CrossRef] [Green Version]
  38. Hussein, H. Modeling diffusion and gas–oil mass transfer in fractured reservoirs. J. Petrol. Sci. Eng. 2013, 105, 1–17. [Google Scholar] [CrossRef]
  39. Alali, Z.; Cesar, P.C.; Jubril, O.; Saudi, A. Assessment of Supercritical Injection of CO2 Using Huff-N-Puff Approach in a Complex Reservoir Environment. In Proceedings of the SPE Asia Pacific Oil & Gas Conference and Exhibition, Virtual, 17–19 November 2020. [Google Scholar] [CrossRef]
  40. Yu, H.; Qi, S.; Chen, Z.; Cheng, S.; Xie, Q.; Qu, X. Simulation Study of Allied In-Situ Injection and Production for Enhancing Shale Oil Recovery and CO2 Emission Control. Energies 2019, 12, 3961. [Google Scholar] [CrossRef] [Green Version]
  41. Nguyen, P.; Carey, J.W.; Viswanathan, H.S.; Porter, M. Effectiveness of supercritical-CO2 and N2 huff-and-puff methods of enhanced oil recovery in shale fracture networks using microfluidic experiments. Appl. Energy 2018, 230, 160–174. [Google Scholar] [CrossRef]
  42. Wang, J. The Effect of Angle of Bedding on Water Flooding Development. J. Chongqing Univ. Sci. Tech. (Nat. Sci. Ed.) 2013, 15, 49–51. [Google Scholar] [CrossRef]
  43. Cui, C.; Zhu, G.; Liu, H.; Wang, Y.; Zhao, X. Energy Supplement Mode Optimization for Horizontal Well Development in Thick Positive Rhythm Oil Reservoir. Drill Petrol. Tech. 2010, 38, 88–91. [Google Scholar] [CrossRef]
  44. Zhang, J.; Leng, R.; Liu, Z.; Zou, W.; Pan, Q.; Zhao, Y. Study on identification method of dominant channel and distribution of residual oil in Badaowan sand group of 530 block. China Petrol. Chem. Stand. Qual. 2019, 39, 138–139. [Google Scholar] [CrossRef]
  45. Bo, D.; Wei, L.; Jian, L. Study on steam throttling production characteristics and development optimization of edge-bottom-water heavy oil reservoirs. China Energy Environ. Prot. 2020, 42, 145–147, 174. [Google Scholar] [CrossRef]
  46. Shi, Y.; Gai, C.; Yan, F.; Zhou, W.; Zeng, Y.; Li, C. Reasonable cyclic times of CO2 huff and puff for heavy oil reservoirs. Petrol. Geol. Oilfield Dev. Daqing 2017, 36, 129–133. [Google Scholar] [CrossRef]
  47. Hou, G.; Liu, T.; Yuan, X.; Hou, J.; Diwu, P. Study on the Variation Rule of Produced Oil Components during CO2 Flooding in Low Permeability Reservoirs. Comput. Model Eng. Sci. 2020, 123, 1223–1246. [Google Scholar] [CrossRef]
  48. Liu, J.; Li, M.; Liu, Y.; Zhao, H. Visualization experiment on micro mechanism of CO2 huff and puff. Fault Block Oil Gas Field 2017, 24, 230–232. [Google Scholar] [CrossRef]
  49. Sun, L.; Pang, H.; Sun, Y.; Hou, D.; Pan, Y. Mechanism Study on Water Control and Enhanced Oil Recovery by CO2 Huff-puff for Shallow Heavy Oil Reservoir. J. Southwest Petrol. Univ. (Sci. Tech. Ed.) 2014, 36, 88–94. [Google Scholar] [CrossRef]
  50. Xu, W. Study on the technical countermeasures for the development and adjustment of low permeability oilfields. Yunnan Chem. Tech. 2020, 47, 119–120. [Google Scholar]
  51. Su, W.; Hou, J.; Liu, J.; Zhu, D.; Xi, Y. Evaluation of EOR Effect of Gas Huff-n-puff in Fractured Vuggy Carbonate Reservoirs. J. Southwest Petrol. Univ. (Sci. Tech. Ed.) 2017, 39, 133–139. [Google Scholar] [CrossRef]
Figure 1. Schematic diagram of horizontal well synergistic CO2 huff and puff.
Energies 14 03454 g001
Figure 2. Initial oil saturation distribution in model I.
Energies 14 03454 g002
Figure 3. Initial oil saturation distribution in model II.
Energies 14 03454 g003
Figure 4. Oil viscosity and oil density with different CO2 concentrations.
Energies 14 03454 g004
Figure 5. Oil increment and water-cut reduction under different stratum dips.
Energies 14 03454 g005
Figure 6. Viscosity distribution after well stuffy.
Energies 14 03454 g006
Figure 7. Distribution of oil saturation after validity period.
Energies 14 03454 g007
Figure 8. Oil increment of different sedimentary rhythms and well types.
Energies 14 03454 g008
Figure 9. Viscosity distribution diagram after well stuffy.
Energies 14 03454 g009
Figure 10. Oil saturation at the end of the validity period.
Energies 14 03454 g010
Figure 11. Permeability field profile.
Energies 14 03454 g011
Figure 12. Oil increment with different permeability contras of inter-well channel.
Energies 14 03454 g012
Figure 13. Channel level difference to the GOR of well P2.
Energies 14 03454 g013
Figure 14. Oil saturation profiles before gas injection.
Energies 14 03454 g014
Figure 15. Oil saturation profiles after well stuffy.
Energies 14 03454 g015
Figure 16. Influence of CO2 injection ratio on the oil increment.
Energies 14 03454 g016
Figure 17. Viscosity distribution diagram after borehole bored with different injection volume schemes.
Energies 14 03454 g017
Figure 18. Distribution of oil saturation after validity period.
Energies 14 03454 g018aEnergies 14 03454 g018b
Figure 19. Oil increment of different well spacing.
Energies 14 03454 g019
Figure 20. Production water cut after well stuffy.
Energies 14 03454 g020
Figure 21. Oil saturation distribution after validity period.
Energies 14 03454 g021
Figure 22. Oil increment of different relationships with isobaths.
Energies 14 03454 g022
Figure 23. Oil increment with different permeability contrasts.
Energies 14 03454 g023
Figure 24. P1 well water cut with different permeability contrasts.
Energies 14 03454 g024
Figure 25. Effect of well spacing on oil increase.
Energies 14 03454 g025
Figure 26. Effect of well spacing on water cut.
Energies 14 03454 g026
Figure 27. Influence of fluid production rate on the oil increase in well P2.
Energies 14 03454 g027
Figure 28. Influence of fluid production rate on water cut.
Energies 14 03454 g028
Figure 29. Production GOR of well P2.
Energies 14 03454 g029
Figure 30. Oil increment at different liquid production rates.
Energies 14 03454 g030
Figure 31. Water cut after opening of the middle well at different liquid production rates.
Energies 14 03454 g031
Figure 32. GOR of middle-well P2 with different liquid production rates.
Energies 14 03454 g032
Figure 33. Structural well location map of C2X1.
Energies 14 03454 g033
Figure 34. Oil increment at different structural positions.
Energies 14 03454 g034
Figure 35. Water-cut curve of effective wells.
Energies 14 03454 g035
Figure 36. Average water cut before and after huff and puff.
Energies 14 03454 g036
Figure 37. Daily liquid production curve of the effective wells.
Energies 14 03454 g037
Figure 38. Working fluid level of the effective wells.
Energies 14 03454 g038
Table 1. Results of component analysis.
Componentsmol%Componentsmol%Componentsmol%
CO21.16C111.41C250.75
N20.15C121.13C260.73
C114.26C131.11C270.62
C21.01C141.12C280.61
C30.42C150.93C290.73
IC40.22C160.92C300.72
NC40.25C170.95C310.67
IC50.32C180.92C320.66
NC50.05C190.91C330.61
C66.16C200.85C340.61
C73.61C210.82C350.53
C83.46C220.81C36+43.12
C92.42C230.83
C102.72C240.72
Table 2. Viscosities and densities of the heavy oil–CO2 system with different CO2 concentrations.
CCO2 (mol%)Viscosity (mPa·s)Density (Kg/m3)
01.851.8300
0.1661.421.4100
0.3041.111.1500
0.4030.950.9900
0.50.820.8400
0.6390.680.7100
Note: CCO2 = concentration of CO2 in heavy oil–CO2 systems.
Table 3. Basic parameters of the typical numerical simulation model.
Serial NumberFactorParameter Level
1Stratum dip (°)6
2Effective thickness of oil layer (m)6.6
3EnergySufficient water on the sides and bottom
4Sedimentary rhythmPositive rhythm
5Heterogeneity (Lorentz coefficient)0.5
6Crude oil viscosity (mPa·s)50
7InterlayerNo compartment
8Horizontal section length (m)70
9Well spacing (m)40
10Injection volume (t)400
11Well stuffy time (d)30
12Actual length of liquid productionEntire horizontal section
Table 4. Synergistic mode of CO2 huff and puff.
Mode TypeSynergistic Mode
Two-well synergistic modeTwo production wells with simultaneous injection of gas
Single-well synergistic modeTwo production wells, gas injected into low-position wells
Multi-well synergistic modeThree production wells, gas injected into lower- and higher-structural-position wells
Table 5. Factors and parameter levels of the two-well synergistic mode.
Classification of FactorsParameter Level
Geological factorsStratum dip (°)3
6
15
Sedimentary rhythmPositive rhythm
Reverse rhythm
Homogeneous
Permeability contrast1
20
50
100
Development factorsInjection volume allocation (t)P1 = P2 = 400 t
P1 = 100 t  P2 = 700 t
P2 = 100 t  P1 = 700 t
P1 = 200 t  P2 = 600 t
P2 = 200 t  P1 = 600 t
Well spacing (m)30
40
70
100
Relationship with structural isobathsPerpendicular to isobaths
Parallel to isobaths
Note: The mass of CO2 is the volume multiplied by density under the standard condition, and then the kilogram or gram is converted to ton.
Table 6. Factors and parameter levels of the single-well synergistic mode.
Factor ClassificationParameter Level
Development factorsWell spacing (m)40
60
70
80
120
Liquid production rate of
high-position well (m3/d)
20
100
200
Table 7. Factors and parameter levels of multi-well synergistic mode.
Factor ClassificationParameter Level
Development factorLiquid production rate
of middle well (m3/d)
20
100
200
Table 8. Injection volume allocation.
Injection SchemeInjection Volume
No. 1P1 = 100 t  P2 = 700 t
No. 2P1 = 200 t  P2 = 600 t
No. 3P1 = P2 = 400 t
No. 4P1 = 600 t  P2 = 200 t
No. 5P1 = 700 t  P2 = 100 t
Table 9. Oil increment and sensitivity of each factor.
Main Controlling FactorsQOmax (m3)QOmin (m3)S
Geological factorsStratum dip8467751.09
Sedimentary rhythm12609861.28
Permeability contrast10737531.42
Relationship with structural isobaths113910851.05
Development factorsWell spacing183514771.24
Injection volume allocation9178311.10
Liquid production rate of high-position wells147710351.43
Liquid production rate of middle wells9483762.52
Table 10. Synergistic throughput implementation plan.
Well NameCO2 Injection DateInjection Volume (t)Well Stuffy Days (d)Well Opening Date
C2–P22013.1.7–1.12550382013.2.26
C2–P32013.1.7–1.12550422013.3.7
C2–P62013.1.7–1.10450372013.2.24
Table 11. Parameter statistics before and after CO2 huff and puff.
Well NameWater Cut Before CO2 Injection (%)Water Cut After Well Stuffy (%)Oil Increment (t)
C2–P20.990.051626.42
C2–P30.990.541878.54
C2–P61.000.151899.9
C2–31.000.73324.45
C2–P40.990.62671.39
C2X11.001.00Not effective
C2–P50.10no effectNot effective
Publisher’s Note: MDPI stays neutral with regard to jurisdictional claims in published maps and institutional affiliations.