Abstract
Internal combustion engine emissions are a serious worldwide problem. To combat this, emission regulations have become stricter with the goal of reducing the proportion of transportation emissions in global air pollution. In addition, the European Commission passed the real driving emissions–light-duty vehicles (RDE-LDV) regulation that evaluates vehicle emissions by driving on real roads. The RDE test is significantly dependent on driving conditions such as traffic or drivers. Thus, the RDE regulation has the means to evaluate driving dynamics such as the vehicle speed per acceleration (v·apos) and the relative positive acceleration (RPA) to determine whether the driving during these tests is normal or abnormal. However, this is not an appropriate way to assess the driving dynamics because the v⋅apos and the RPA do not represent engine load, which is directly related to exhaust emissions. Therefore, in the present study, new driving dynamic variables are proposed. These variables use engine acceleration calculated from wheel force instead of the acceleration calculated from the vehicle speed, so they are proportional to the engine load. In addition, a variable of driving dynamics during braking is calculated using the negative wheel force. This variable can be used to improve the accuracy of the emission assessment by analyzing the braking pattern.
1. Introduction
Greenhouse gas and air pollutant emissions are two of the most important issues currently discussed in the automotive market. Particulate matter and nitrogen oxide are mainly emitted from road transport sources and are key reasons for establishing strict regulatory policies on exhaust and greenhouse gas worldwide [1,2,3]. These regulatory policies have encouraged the development of emission-reduction technologies for automobiles. However, they could not prevent the use of a special software that could detect emission test mode and change its driving pattern to meet emission levels [4]. As a result, there is a significant difference between the amount of exhaust gas that is emitted during certification tests and that is emitted during on-road driving [5,6,7]. Therefore, the European Union has developed and applied the real driving emission–light-duty vehicles (RDE-LDV) test method that measures and evaluates exhaust while driving on actual roads.
The RDE-LDV uses the portable emissions measurement system (PEMS). This system is installed in a vehicle to measure the exhaust gas emitted as it moves on a road. Since this method evaluates vehicle emissions while driving on actual roads under random traffic and/or weather conditions, it has the advantage of measuring emissions under realistic driving situations. In addition, it does not allow automobile manufacturers to target specific driving conditions by setting up controlled driving strategies. However, because of these random conditions, all the emission data from on-road driving are not considered valid. The RDE tests must fulfill standard test procedures and driving conditions for their results to be accepted as valid. When compared to conventional driving, if a test shows excessive exhaust emission due to abnormal acceleration or deceleration or minimal exhaust emission due to soft driving, the results would be considered invalid. Ro et al. [8] also pointed out that the on-road driving exhausted 2.1 to 6.9 times higher emissions than the conventional driving tests. In determining the validity of the test data, parameters that represent driving dynamics are defined, such as vehicle speed per positive acceleration (v·apos) and relative positive acceleration (RPA). This validity determination strategy rules out the test cases that contain excessive or abnormal driving conditions due to the operator’s driving habits or traffic conditions [9,10,11].
Despite these considerations, there are still doubts regarding the reasonableness of the evaluation of emissions under on-road driving conditions. For example, exhaust emissions from a vehicle running at a constant velocity on a flat road differ from the emissions from a vehicle running on a hill at the same constant velocity [9,12], but the RDE standard driving dynamics analysis regards these two driving conditions as the same. Skobiej and Pielecha [13] were also aware of a need of a better way to evaluate the exhaust emission for on-road driving tests. In addition, the current RDE standards only address driving dynamics since they focus on driving conditions. However, fuel consumption is also affected by braking. Therefore, additional analysis of driving dynamics under a braking condition is required to estimate the degree of braking under on-road driving conditions.
In the present study, the real driving test was conducted according to the RDE standard procedure. The driving dynamics results of the current analysis method (focusing on acceleration) and of a new analysis method (considering all driving resistances) were compared. The present study also suggests a new method to estimate driving dynamics during braking that can be used to analyze the effect of the braking pattern on exhaust emissions.
2. Real Driving Emission Test Methodologies
2.1. Real Driving Emission Test Vehicles and Routes
The tested vehicle was a passenger car with a 1.6 L 4-cycle turbocharged gasoline direct injection engine and a 7-speed dual clutch transmission. The maximum engine power was 134.2 kW and the maximum torque was 264.8 Nm. Table 1 summarizes the vehicle specifications. The curb weight was 1470 kg, but the driver, the PEMS, and batteries to supply power to the measurement system were added to the final weight. The PEMS were used to acquire the driving and exhaust data during the on-road driving test. The system consisted of an exhaust gas analyzer, a global positioning system (GPS) measuring device, and an on-board diagnostics (OBD) connector that measured exhaust gas and vehicle driving information in real time at a velocity of 1 Hz. It acquired the data from each sensor and performed time alignment [14,15]. Although the PEMS is a portable exhaust gas measuring device with a simple structure, a previous study verified the reliability of its measured data by simultaneously measuring the exhaust data with a constant volume sampler system used in the chassis dynamometer [16,17]. Table 2 summarizes the exhaust gas analyzer specifications of the system.

Table 1.
Specifications of the test vehicle.

Table 2.
Specifications of PEMS.
Figure 1 shows the driving route and altitude information utilized in this study. According to RDE standards [18], the driving route must include urban, rural, and motorway roads sequentially, and the distance ratio and velocity of each section must be within a specified range to be accepted as a valid test. The test vehicle entered the urban area on the right side of the map and drove approximately 27 km from the starting point. Afterward, it drove on rural roads, moving from right to left on the map, for approximately 35 km. Finally, the vehicle drove the motorway section, moving from the left to the top right of the map, for approximately 30 km. The driving route configuration met the distance ratio criteria. The start and end points had similar altitudes [19], with a gentle uphill slope in the rural section and a gentle downhill slope in the motorway section.
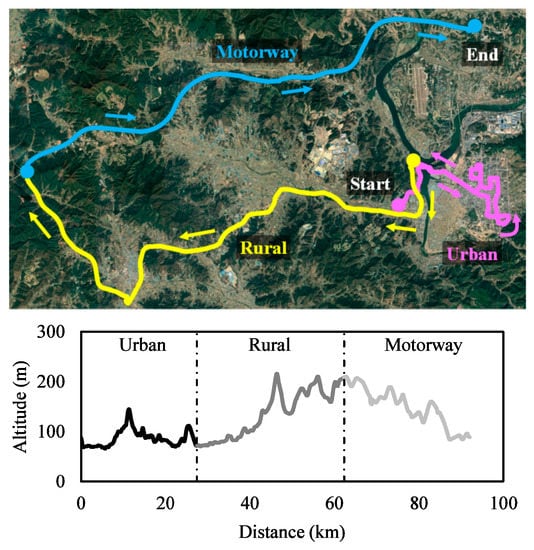
Figure 1.
Real driving test route and altitude.
2.2. Analysis Methods
After the driving test is conducted according to specified test procedure and driving conditions, the results must be verified per RDE standards. Data completeness and normality are verified through the moving average window (MAW) and the power binning method. If the test results are determined as valid, carbon dioxide (CO2) amounts measured during the real road test and measured under the worldwide harmonized light vehicles test procedure (WLTP) mode are compared to correct exhaust emissions.
The present study focused on data analysis, the step before final exhaust emission correction. In on-road driving data analysis, the MAW method configures consecutive average windows of a certain distance at one-second intervals intervals from the starting point to the end point. It also verifies the completeness and normality of the driving data based on the average velocity and exhaust data in each window. The distance of the window is determined so that the CO2 emission in the window is the same as half of the total CO2 emission by the test vehicle in the WLTP mode.
Vehicle velocity data were obtained from the GPS and the OBD, and they were judged to be reliable since they were nearly the same [17]. However, since the GPS signals were occasionally disconnected in some areas, this study used the velocity data acquired from the OBD for the analysis. Since the acceleration resolution calculated from the velocity data was not high enough (ares > 0.01 m/s2), the velocity data was smoothed with a T4253H filter (as suggested in the RDE regulation). The altitude data were obtained from the GPS at 1-s intervals. The interval of altitude data was then converted into 1 m of vehicle movement to calculate the slope of the road. The converted altitude data were not high in resolution, so they were corrected through a two-step smoothing process. The v⋅apos (m2/s3 or W/kg) and RPA (m/s2) were used as parameters for analyzing the driving dynamics. In v·apos, v refers to the vehicle velocity (m/s) and apos refers to the vehicle acceleration (m/s2) that exceeds 0.1 m/s2. The unit is (W/kg), referring to the power per unit mass (specific power). RPA was calculated separately for the urban, rural, and motorway sections with the following equations:
where
j: 1 to Mk
i: 1 to Nk
k: urban, rural, motorway
Δt: time step (s) (=1 s)
di,k: distance covered in time step i considering the urban, rural and motorway shares (m)
Mk: number of samples for urban, rural and motorway shares with apos
Nk: total number of samples for urban, rural and motorway shares
3. Results and Discussions
The present study analyzed the on-road driving data with the MAW method to check the completeness and normality of the data. The driving dynamics of the vehicle were analyzed by calculating the v·apos and RPA according to the method suggested by RDE standards. Afterward, various driving resistances, such as air drag or rolling resistance, were calculated. A new vehicle speed per acceleration (v·aeng) and RPA were calculated using these driving resistances. These new driving dynamics variables were then compared with the existing results. Finally, one more new parameter (v·aneg) that can evaluate the driving dynamics during the braking process was suggested. This was done by identifying when the engine does not generate power (e.g., inertial driving or braking).
3.1. Data Analysis According to the Real Driving Emission Standard
The present study verified the completeness and normality of the real road test results according to the MAW method. The MAW method uses the average velocity in each window to identify urban, rural, or motorway roads. The window with an average velocity of less than 45 km/h is defined as urban. The window with an average velocity of 45 km/h or more, but less than 80 km/h, is defined as rural. The window with an average velocity of 80 km/h or more, but less than 145 km/h, is defined as motorway. In Figure 2, the CO2 emissions per unit distance is plotted on the CO2 characteristics curve. The dot data on the graph are the CO2 emissions per unit distance (g/km), calculated by dividing the CO2 emissions in each window by the moving distance. The black solid line is the CO2 characteristic curve based on CO2 emissions in WLTP mode, and the two pairs of gray dotted lines refer to the primary and secondary allowable limits. The data within the primary limits are defined as normal testing conditions. Data equal to or higher than the primary limit and below the secondary limit are defined as severe testing conditions, and data equal to or lower than the primary limit and above the secondary limit are defined as soft testing conditions. In other words, a higher CO2 emission per unit distance is considered a more severe condition. If a datum point falls outside of the secondary allowable limits it is considered invalid in the data correction process.
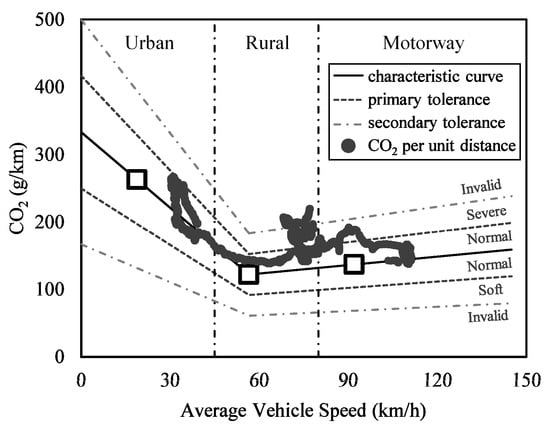
Figure 2.
CO2 emissions per unit distance and CO2 characteristic curve.
As is shown if Figure 2, all the urban data were in normal conditions. However, a significant portion of rural data in the 70–80 km/h section were in the severe testing condition or outside of the allowable limit. Although most data were in the normal condition in the motorway section, some fell in severe testing conditions. Table 3 summarizes the quantitative analysis of the data. In the MAW method, the driving distance ratios in the urban, rural, and motorway sections must be configured to be about 34%, 33%, and 33%, respectively, and none can be less than 15%. As is shown in Table 3, the driving distance ratios in the urban, rural, and motorway sections were 34%, 43%, and 23%, respectively. This met the completeness requirement since all were 15% or more. The normality criterion states that at least 50% of the data should be in the normal condition in each window. The rural section showed the lowest normal data rate and was at 54%. This demonstrated that the test data met the normality requirement. Therefore, the on-road driving data fulfilled all validity criteria required by the MAW method. The severity index parameter checks the deviation of data from the CO2 characteristic curve and indicates a severe driving condition when the value is high. As is shown in Figure 2, most datum points fell above the black solid line, indicating a positive severity in all driving windows. The rural section had the highest record of 27.33% as most datum points fell in the severe driving condition area.

Table 3.
Validity criteria required by the MAW method.
The validity of the driving dynamics was also checked. There are two representative driving dynamics in RDE standard: v·apos and RPA. Figure 3a,b shows the graphs that confirm the validity of v·apos and RPA, respectively. The urban, rural, and motorway sections were based on spontaneous velocity instead of average velocity. The urban section was defined as 60 km/h or less. The rural section was defined as between 60 km/h and 90 km/h, and the motorway section was defined as more than 90 km/h. Figure 3a defines the v·apos corresponding to the top 95% in each section (urban, rural, and motorway) as v·apos_(95). It defines the average v·apos in each window as v·apos_(mean). Each small gray dot represents individual v⋅apos values, and the solid black line is the highest line that v·apos_(95) should not exceed for this test to be recognized as valid. The driving time in the urban section was longer than in the other sections and showed more frequent acceleration and deceleration due to traffic signals. Therefore, more data exceeded 0.1 m/s2 (=apos) and were displayed on the urban section than on the other sections [20]. The driving duration was relatively short in the motorway section, and the speed change was not large when compared with the other sections. Therefore, only a small number of data were displayed. Since v·apos_(95) and v·apos_(mean) contain the multiplied velocity term, they increase as velocity increases. The test vehicle drove below the upper limit during the whole test procedure, and it was judged that there was no excessively severe driving from the aspect of the driving dynamics.
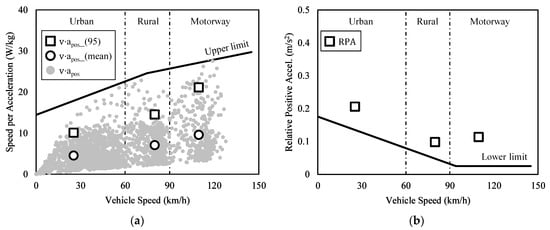
Figure 3.
Verification of trip validity using MAW method. (a) Speed per acceleration vs. vehicle speed. (b) Relative positive acceleration vs. vehicle speed.
The lower limit of acceleration was set for the RPA in Figure 3b to check validity of driving dynamics. The RPA was obtained by summing the v·apos calculated in each driving section and dividing it by the moving distance in the section. Due to this, the highest value was shown in the urban section since it had the largest data set even though the v⋅apos_(mean) was small. Since the data in the rural and motorway sections were not significantly different, the RPA was determined according to the v·apos_(mean). The actual road driving test conducted in this study confirmed that the PRA was above the lower limit in all windows.
Table 4 summarizes the quantitative analysis results for the data. According to RDE standard, the valid moving distance ratio in the urban section is 29–44% and 23–43% in the rural and motorway sections. All the ratios were in the valid range. Since the range of the total valid driving period is 90–120 min, 107 min of it was valid. As is shown in Figure 3a, the amount of data in each section were the highest at 1259 in the urban section and the lowest at 351 in the motorway section. The analysis confirmed that this test had satisfied all the validity criteria required by the RDE standard.

Table 4.
Trip information analysis.
3.2. Driving Resistances
Ruling out excessive exhaust emission test cases (due to excessive power) and minimal exhaust emission test cases (due to unusual cruising speeds), both of which deviate from typical driving patterns, are the reasons behind verifying the validity of driving dynamics in on-road driving tests. Therefore, driving dynamics must reflect engine load, which is directly related to exhaust emissions. However, since the v·apos calculated by the conventional method does not reflect the deceleration and acceleration due to external forces, it is difficult to say that it represents engine load. For example, air resistance at a higher velocity is greater than that at a lower velocity, even under the same cruising driving conditions with zero acceleration, and it requires a higher engine load. The load that the engine faces even differs when driving uphill and downhill at the same speed. Therefore, the driving dynamics calculation must consider these driving resistances to reflect the engine load. Figure 4 depicts standard driving resistances applied to a moving vehicle, and the resistances have the following correlation.
where
Fw = Rd + Rr + Rg + Ra
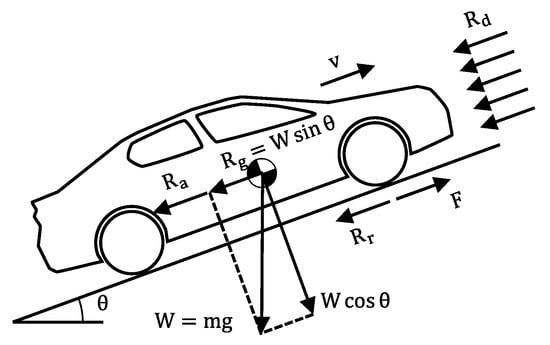
Figure 4.
Driving resistance forces affecting on a moving vehicle.
Fw: wheel force (N)
Rd: drag resistance (N)
Rr: rolling resistance (N)
Rg: gradient resistance (N)
Ra: acceleration resistance (N)
This section calculates the driving resistances of the test vehicle and compares them to examine how these resistances (other than acceleration) affect engine load.
3.2.1. Air Resistance (Ra)
The air resistance applied to a vehicle is calculated as follows:
where
Rd = 0.5CdAρv2
Cd: drag coefficient
A: full projected area (m2)
ρ: air density (kg/m3)
v: vehicle speed (m/s)
The drag coefficient (Cd) of the test vehicle used in this study was 0.272, and the full projected area (A) was assumed to be 80% of the product of the vehicle’s overall width and height. The PEMS measured the air density (ρ) and velocity (v).
Figure 5a shows the air resistance calculated using Equation (3) over a wide vehicle velocity range. Since the air resistance is proportional to the square of the vehicle velocity, it rapidly increased as the velocity increased. Air resistance was approximately 283 N at 100 km/h.
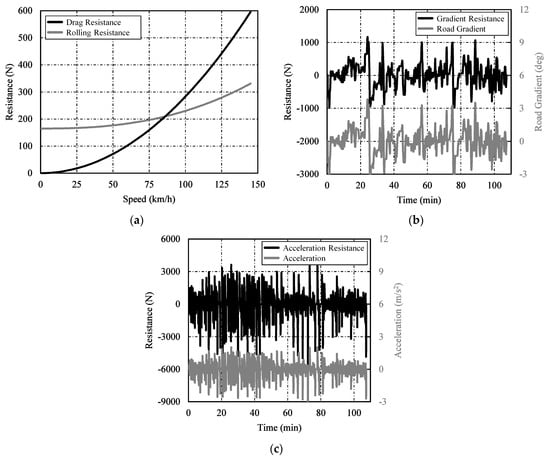
Figure 5.
Calculated driving resistance forces. (a) Drag and rolling resistance. (b) Road gradient resistance. (c) Acceleration resistance.
3.2.2. Rolling Resistance (Rr)
It is difficult to find an accurate formula to calculate rolling resistance because tire size, tire type, and even road conditions affect it. It is known that rolling resistance generally increases as the vehicle weight increases, as the tire inflation pressure decreases, and as the velocity increases [21,22]. Since the vehicle weight and inflation pressure were fixed in this study, the parameter that affected the rolling resistance was the vehicle velocity, and it was calculated using the equation below [23].
where
Rr = (Csr + Cdr(v/100)2.5) × Wcosθ
Csr = −514.7(Ptire/100)3 + 53.72(Ptire/100)2 − 1.877(Ptire/100) + 0.03051
Cdr = −793.1(Ptire/100)3 + 83.98(Ptire/100)2 − 2.977(Ptire/100) + 0.03759
v: vehicle speed (km/h)
W: vehicle weight (N)
θ: road gradient (deg)
Ptire: inflation pressure (bar)
The equation uses the road gradient because wheel load varies according to the road gradient. The road gradient was calculated using the altitude data (see Figure 1) obtained with the GPS. Figure 5a shows the rolling resistance calculated with Equation (4) over a wide vehicle velocity range. Although the rolling resistance was much higher than the air resistance in low-velocity sections (approximately 180 N), it increased slowly as the velocity increased. It was surpassed by the air resistance at the velocity of approximately 88 km/h. The rolling resistance was roughly 233 N (about 83% of the air resistance) at the vehicle velocity of 100 km/h. Due to this tendency, the rolling resistance variation throughout the test process was very small compared to the other resistances. For example, the air resistance increased by about 283 N when the velocity increased from 0 km/h to 100 km/h, while the rolling resistance only increased by approximately 66 N. The changes in gradient resistance and acceleration resistance were much larger. Therefore, the wheel force in Equation (2) was mostly affected by the gradient resistance and the acceleration resistance, while the impact of the rolling resistance was relatively small. As mentioned above, it is difficult to find an accurate formula to calculate the rolling resistance, so the calculation accuracy can be poor. However, the error from calculation inaccuracy is also relatively small because of its small impact.
3.2.3. Gradient Resistance (Rg)
The gradient resistance is the resistance caused by the vehicle weight. It depends on the slope of the road. It becomes a resistance on an uphill slope and an acceleration force on a downhill slope, as the following equation shows.
where
Rg = Wsinθ
W: vehicle weight (N)
θ: road gradient (deg)
Figure 5b shows the road gradient converted from the GPS altitude data. It also shows the gradient resistance calculated using Equation (5). The maximum road gradient in the driving route was about 3.8° (6.6%), and its gradient resistance was about 1160 N. The maximum road gradient on a downhill was about −3.2° (−5.6%), and its acceleration force was about 980 N. The gradient resistance on a typical road gradient of 1° (1.7%) was approximately 306 N, higher than air resistance or rolling resistance at 100 km/h [24].
3.2.4. Acceleration Resistance (Ra)
Acceleration resistance is a force needed for vehicle acceleration (rather than a resistance) and is calculated with the following equation:
where
Ra = ma
m: vehicle mass (kg)
a: vehicle acceleration (m/s2)
The graph in Figure 5c depicts the measured acceleration and the acceleration resistance. The maximum acceleration that occurred during the driving test was about 2.0 m/s2, and its acceleration resistance was approximately 3600 N. This was much larger than the other resistances. Deceleration by braking was controlled within −3 m/s2, except for one sudden braking event at 73 min in the graph.
During the entire driving process, the variation ranges in air resistance, rolling resistance, gradient resistance, and acceleration resistance were ±233 N, ±57 N, ±1078 N, and ±1825 N, respectively. Acceleration resistance showed the largest variation range, even though only positive acceleration was considered. Rolling resistance showed the smallest range. This indicates the impact of the wheel force on the calculation. While the rolling resistance does not significantly affect the result even when using a constant value, the acceleration resistance or gradient resistance must be calculated. The air resistance also requires an accurate calculation.
3.2.5. Wheel Force (Fw)
Conventional methods calculated v·apos and RPA using the acceleration (a) of the acceleration resistance. However, since this study aimed to evaluate the driving dynamics based on the load applied to the engine, a new characteristic acceleration was calculated by dividing the wheel force (calculated in Equation (2)) according to the relationship of force = mass times acceleration in Equation (6). Here, the wheel force was the force delivered from the engine through the transmission. Therefore, this new acceleration was defined as the engine acceleration (aeng) and the v·aeng calculated with it can be considered the vehicle’s specific power.
3.3. Data Analysis Considering Driving Resistances
Figure 6 shows the v·aeng and RPAeng. Since v·aeng considered the air resistance, rolling resistance, and gradient resistance (in addition to the acceleration resistance), the values were generally larger, as is shown in Figure 6a when compared to Figure 3a. In particular, since the air resistance sharply increased as velocity increased, the v⋅aeng_(95) increased to near the upper limit in the motorway section.
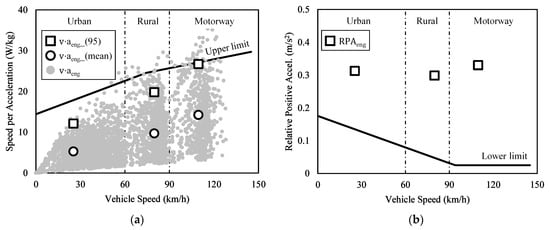
Figure 6.
Verification of driving dynamics for the new analysis method. (a) Speed per acceleration vs. vehicle speed. (b) Relative positive acceleration vs. vehicle speed.
This tendency is clearly demonstrated in Figure 7, which shows the v⋅aeng_(mean) for each driving resistance. As was explained above, the v·a by air resistance sharply increased as the vehicle moved from the urban section to the motorway. However, the v·a by acceleration resistance in the urban section was not significantly different than in the motorway section even though it had a multiplied velocity term. This indicates that vehicle acceleration in the urban section was larger than that in the motorway section. This was also different to the v·apos in Figure 3a that used vehicle acceleration, too. In Figure 3a, the v·apos_(mean) increased as the vehicle speed increased. The reason for the difference between the v·a by acceleration resistance and the v·apos is that while the v·apos excluded vehicle acceleration of 0.1 m/s2 or less, the v·a included even negative acceleration if the aeng was larger than 0.1 m/s2. This can also explain the significantly higher data frequency in Figure 6a than in Figure 3a. For the v·a by rolling resistance, the acceleration by rolling resistance did not change much as explained above. However, the v·a by rolling resistance increased as velocity increased since the velocity was multiplied. The v·a by gradient resistance was a characteristic of the driving route. As is shown in Figure 1, the rural section had positive v·a values by gradient resistance because it was a gradual uphill section. However, the v·a values were negative in the motorway section because it was a gradual downhill section.
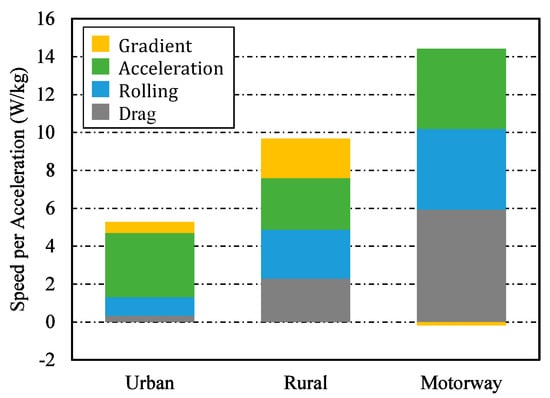
Figure 7.
Composition of the v·aeng_(mean).
Similar to the v·aeng, the RPAeng showed a tendency to increase when compared to the conventional calculation method. The RPA in Figure 3b was high in the urban section, and it decreased as velocity increased since the number of valid datum points decreased. However, the PRAeng in Figure 6b did not decrease but even increased with velocity increase because it had more valid datum points. Since the v·aeng and the RPAeng are new parameters defined in this study, it was not feasible to apply existing upper and lower limits to them. It is necessary to establish new allowable limits suitable for the new parameters.
It was checked how the newly defined v·aeng reflected the actual engine load characteristics (compared to the existing v·apos) by comparing its relationship with CO2 emissions. Since CO2 emissions are proportional to fuel consumption, and higher fuel consumption indicates higher power, checking the relationship between v·a and CO2 is practically the same as checking the relationship between v·a and engine power. Although fuel consumption is not exactly proportional to engine power since the ignition timing and/or injection strategy are dependent on driving conditions, a linear relationship of some degree was expected. Figure 8a shows the relationship between the v·apos and CO2 emissions. As the graph shows, the v·apos increased as the CO2 emission increased and had a linearity level of 0.5244 based on the determination coefficient (R2). As explained in Section 3.2.4, the v·apos that considered only acceleration resistance can show some level of linearity since it had the most impact among the driving resistances on the calculation of wheel force. However, the data became more distributed as CO2 emissions increased, and it became more difficult to identify a correlation. Figure 8b shows the relationship between the v·aeng and CO2 emissions. Compared to Figure 8a, Figure 8b displays a clear linear relationship without data distribution even as CO2 emissions increased. Since the determination coefficient of 0.7815 was closer to 1 than the coefficient of 0.5244 from the conventional calculation, it was determined that the v·aeng reflects engine load characteristics better than the v·apos.
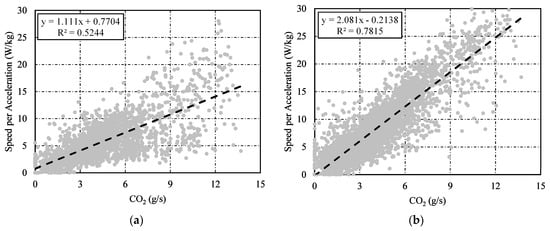
Figure 8.
Correlation between CO2 and speed per acceleration. (a) Correlation between CO2 and v·apos. (b) Correlation between CO2 and v·aeng.
3.4. Driving Dynamics during Braking
So far, the process has focused on analyzing the driving dynamics while the driver steps on the accelerator. All driving resistances were considered to calculate wheel force, and only positive wheel forces were used in the driving dynamics analysis. Driving dynamics calculated through these procedures were used to determine whether the on-road driving test was under severe or soft testing conditions. Thus, it was possible to rule out these unusual test cases that could lead to wrong exhaust emission results. However, in reality, braking also affects exhaust emissions. For example, severe braking dissipates significant kinetic energy, so a large amount of fuel is required to compensate for it. Therefore, it is necessary to analyze the braking dynamics, in addition to the driving dynamics, to accurately evaluate exhaust emissions.
It was possible to analyze the driving dynamics during braking by using negative wheel force out of the wheel force calculated above. Since the characteristic acceleration (calculated by dividing the negative wheel force by the vehicle mass) is negative, this study defined the absolute value of this acceleration as the negative acceleration (aneg). The graph in Figure 9 demonstrates the v·aneg. As is shown in the graph, the number of v⋅aneg data was large in the urban section because both acceleration and deceleration frequently occur in urban driving. On the other hand, the number of datum points was relatively small in the rural and motorway sections because the brake was rarely used. In addition, most data in these sections remained below 10 W/kg, which means that the aneg values were very small.
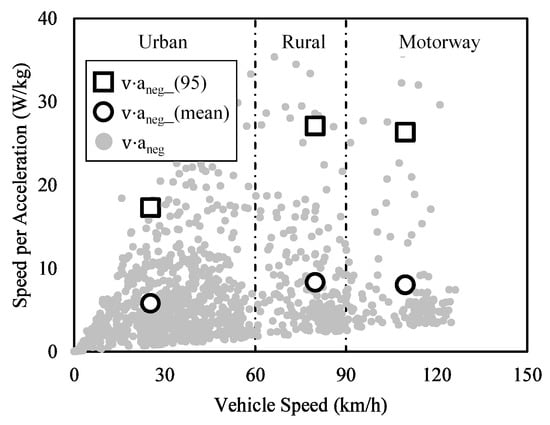
Figure 9.
Verification of driving dynamics for braking.
The overall scale of the v·a under braking conditions was not much different from the v·aeng or the v·apos scales. The graph in Figure 10 compares the scales of the v·aeng and the v·aneg for each section. The hollow marks in the graph represent the data of the on-road driving test case of this study. The graph also shows the v·apos for reference. The filled marks represent the data of the additional nine on-road driving test cases (for a total of 10 test cases) of various routes in addition to the route shown in Figure 1 (for a total of three driving routes). All test cases used the same vehicle. Figure 10b demonstrates that while the v·aeng_(mean) and the v·aneg_(mean) values were almost the same in the urban section, the v·aneg_(mean) values were much smaller than the v·aeng_(mean) values in the motorway section. This is due to the fact that the driver was forced to continuously press on the accelerator pedal to maintain the velocity on the motorway since the air and rolling resistances were large. In contrast, there were few cases where the driver was required to step on the brake pedal since the traffic flow was smooth on the motorway. Figure 10a shows the 95th quartile data and indicates that the v·aeng_(95) and the v·aneg_(95) values were similar to each other on the motorway. This is a kind of error caused by the lack of valid v·aneg data in the motorway section. The amount of data from the motorway section shown in Figure 6a was large, but the amount in Figure 9 was relatively small. In addition, most of the v⋅aneg data were distributed below 10 W/kg. However, some data had a high value of 25 W/kg or greater, since the motorway was a high-velocity section and the v·aneg values increased sharply even when the aneg values only increased slightly. Accordingly, the 95th quartile data were overestimated by the small number of large values, although the average value was low. Due to this error, the v·aeng_(95) and the v·aneg_(95) values were almost the same. For the same reason, the deviation between the tests of the v·aneg_(95) in the rural and motorway sections (the filled marks on the graph) was also very large. In the case of aeng_(95), the data of all tests were concentrated within the range of ±5 W/kg, regardless of the driving route. However, the datum points of the v·aneg_(95) were distributed over a wide range of up to ±18 W/kg.
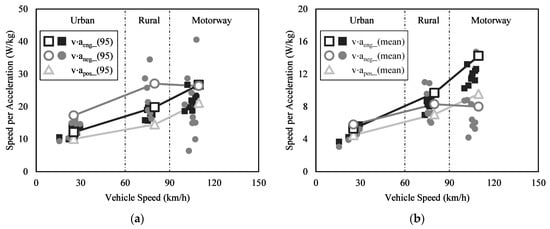
Figure 10.
Comparisons of speed per acceleration for the 10 test cases. (a) The v·a_(95) comparisons. (b) The v·a_(mean) comparisons.
These deviations in braking dynamics between tests are also presented in the average values. In the urban section, drivers must use a brake to decelerate. In rural or motorway driving, on the other hand, some drivers may prefer to slow down naturally through inertial driving without using brakes. Because of these differences in braking patterns, braking dynamics showed the larger deviation than driving dynamics. Although the current RDE standard evaluates driving validity based only on acceleration, not controlling for the braking dynamics can cause inaccurate evaluation of exhaust emissions because of the braking pattern differences.
The total energy (v·a_(total)) consumed by driving and braking in each section of the on-road road driving test was calculated by adding all data in Figure 6a and Figure 9. The unit of an individual datum point was (W/kg), but since each datum point was acquired at 1-s intervals, the unit of their sum can be considered as (kJ/kg). The graph in Figure 11 shows the total energy consumed for driving and braking in each section, as well as the ratio of the braking energy to the driving energy. In Figure 11a, v·aeng_(total) is the total energy consumed for driving in each section. It was 8.6 kJ/kg in the urban section, 10.4 kJ/kg in the rural section, and 9.8 kJ/kg in the motorway section. The large deviation between the tests was due to driving route differences. The total energy required for each driving route was similar. For example, the two lowest v·aeng_(total) values in the urban and rural sections were from the same driving route. On the other hand, v·aneg_(total) was the total energy lost by braking. It showed a tendency to gradually decrease as the vehicle velocity increased; 4.8 kJ/kg in the urban section, 1.9 kJ/kg in the rural section, and 1.1 kJ/kg in the motorway section. This was due to the small number of valid datum points in the motorway section. A driver was less likely to brake on a motorway than in an urban section, as confirmed in Figure 9. Therefore, the amount of energy lost by braking was less on the motorway.
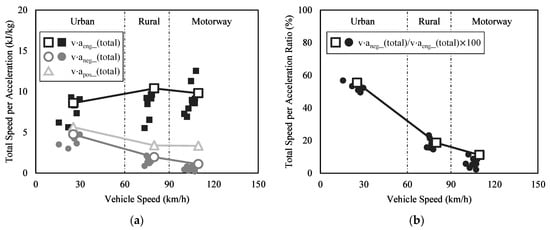
Figure 11.
Comparisons of v·a_(total) and v·a_(total) ratio for the 10 test cases. (a) The v·a_(total) comparisons. (b) The v·a_(total) ratio comparisons.
As is shown in Figure 11b, the ratios of the energy lost by braking to the energy used for driving were 54%, 18%, and 7% in the urban, rural, and motorway sections, respectively. The deviations between the 10 test cases were ±5% or less. For the urban driving, the deviation between the tests from 49% to 57% is very small. However, for the motorway driving, the data distribution from 2% to 12% is relatively large compared to the values. The acceptable range of deviation between tests is not known yet. In the future work, the relation between the exhaust emission and braking dynamics will be analyzed and the acceptable range of the deviation will also be clearly defined.
4. Conclusions
The present study conducted on-road road driving tests with a passenger gasoline vehicle according to RDE standards, and driving data were acquired with the PEMS. The data analysis process applied a new method of analyzing driving dynamics that considered all driving resistances to improve the conventional driving dynamics analysis method that utilizes acceleration only. This study also proposed a method of analyzing driving dynamics during the braking process. The conclusions drawn from this study are presented below.
- The newly calculated v·aeng values are generally larger than the existing v·apos values because they reflect air, rolling, and gradient resistances in addition to acceleration resistance. For the same reason, the RPA values are also larger overall when compared to the conventional method. Therefore, it is necessary to establish new allowable limit criteria to evaluate the validity of the new driving dynamics.
- Comparing the correlation between the existing v·apos and the newly calculated v⋅aeng with CO2 emissions, the v·aeng values show a clearer linear relationship, indicating that v·aeng reflects the engine load characteristics better than v·apos does. This signifies that v·aeng is a more suitable criterion for determining the validity of driving data.
- The deviation of braking dynamics between tests is particularly large in the motorway due to the differences in braking patterns. Although the current RDE standard evaluates the driving validity based on positive acceleration only, it is necessary to establish a regulation on braking patterns since the braking pattern also can affect the exhaust emissions.
- The ratio of the total energy lost by braking to the total energy consumed by driving in urban, rural, and motorway areas of each driving section was about 54%, 18%, and 7%, respectively. The deviation between tests was not larger than ±5%. However, the deviation was relatively large compared to the value in the motorway. Therefore, it is necessary to calculate the acceptable energy ratio range by analyzing the relation between exhaust emissions and braking dynamics.
Author Contributions
Conceptualization, J.C.; methodology, J.S.; validation, J.S.; investigation, J.S.; writing—original draft preparation, J.S.; writing—review and editing, J.C.; supervision, J.C.; funding acquisition, J.C. All authors have read and agreed to the published version of the manuscript.
Funding
This research received no external funding.
Acknowledgments
This research was supported by the National Research Foundation of Korea (NRF-2019R1I1A3A01062771). This research was supported by the Korea Evaluation Institute of Industrial Technology (Keit, 20002762).
Conflicts of Interest
The authors declare no conflict of interest.
References
- European Commission. Amending Regulation (EC) No 692/2008 as Regards Emissions from Light Passenger and Commercial Vehicles (Euro 6); European Union: Luxembourg, 2016; Regulation (EU) 2016/646. [Google Scholar]
- The European Parliament and of the Council, EU. Setting CO2 Emission Performance Standards for New Passenger Cars and for New Light Commercial Vehicles; Official Journal of the European Union: Brussels, Belgium, 2019; Regulation (EU) 2019/631. [Google Scholar]
- Kim, J.; Kim, S.; Yeo, S.; Lee, K.; Lee, H.; Seol, S. National air pollutants emission. Nat. Inst. Environ. Res. Incheon 2016, 1, 1–125. [Google Scholar]
- Zachariadis, T. After ‘dieselgate’: Regulations or economic incentives for a successful environmental policy? Atmos. Environ. 2016, 138, 1–3. [Google Scholar] [CrossRef]
- Giechaskiel, B.; Suarez-Bertoa, R.; Lähde, T.; Clairotte, M.; Carriero, M.; Bonnel, P.; Maggiore, M. Evaluation of NOx emis-sions of a retrofitted Euro 5 passenger car for the Horizon prize “Engine retrofit”. Environ. Res. 2018, 166, 298–309. [Google Scholar] [CrossRef] [PubMed]
- Suarez-Bertoa, R.; Valverde, V.; Clairotte, M.; Pavlovic, J.; Giechaskiel, B.; Franco, V.; Kregar, Z.; Astorga, C. On-road emis-sions of passenger cars beyond the boundary conditions of the real-driving emissions test. Environ. Res. 2019, 176, 108572. [Google Scholar] [CrossRef] [PubMed]
- Weiss, M.; Bonnel, P.; Hummel, R.; Steininger, N. A Complementary Emissions Test for Light-Duty Vehicles: Assessing the Technical Feasibility of Candidate Procedures; Publications Office of the European Union: Luxembourg, 2013; Report EUR 25572 EN. [Google Scholar]
- Ro, S.; Park, J.; Shin, M.; Lee, J. Developing on-Road NOx Emission Factors for Euro 6b Light-Duty Diesel Trucks in Korean Driving Conditions. Energies 2021, 14, 1041. [Google Scholar] [CrossRef]
- Gallus, J.; Kirchner, U.; Vogt, R.; Benter, T. Impact of driving style and road grade on gaseous exhaust emissions of passenger vehicles measured by a Portable Emission Measurement System (PEMS). Transp. Res. Part D Transp. Environ. 2017, 52, 215–226. [Google Scholar] [CrossRef]
- Park, J.; Lee, J.; Kim, S.; Kim, J.; Ahn, K. A Study on the Emission Characteristics of Korean Light-duty Vehicles in Real-road Driving Conditions. Trans. Korean Soc. Automot. Eng. 2013, 21, 123–134. [Google Scholar] [CrossRef]
- Lee, Y.; Lee, S.; Lee, S.; Choi, H.; Min, K. Characteristics of NOx emission of light-duty diesel vehicle with LNT and SCR system by season and RDE phase. Sci. Total Environ. 2021, 782, 146750. [Google Scholar] [CrossRef] [PubMed]
- Frey, H.C.; Zhang, K.; Rouphail, N.M. Fuel Use and Emissions Comparisons for Alternative Routes, Time of Day, Road Grade, and Vehicles Based on in-Use Measurements. Environ. Sci. Technol. 2008, 42, 2483–2489. [Google Scholar] [CrossRef] [PubMed]
- Skobiej, K.; Pielecha, J. Plug-in Hybrid Ecological Category in Real Driving Emissions. Energies 2021, 14, 2340. [Google Scholar] [CrossRef]
- Giechaskiel, B.; Lähde, T.; Drossinos, Y. Regulating particle number measurements from the tailpipe of light-duty vehicles: The next step? Environ. Res. 2019, 172, 1–9. [Google Scholar] [CrossRef] [PubMed]
- Huang, H.; Hu, H.; Zhang, J.; Liu, X. Characteristics of volatile organic compounds from vehicle emissions through on-road test in Wuhan, China. Environ. Res. 2020, 188, 109802. [Google Scholar] [CrossRef] [PubMed]
- Cha, J.; Lee, J.; Chon, M.S. Evaluation of real driving emissions for Euro 6 light-duty diesel vehicles equipped with LNT and SCR on domestic sales in Korea. Atmos. Environ. 2019, 196, 133–142. [Google Scholar] [CrossRef]
- Lee, D.I.; Yu, Y.S.; Chon, M.S.; Cha, J. A Study of Cold-start and Evaluation Method for Real Driving Emissions of Diesel Light-duty Vehicle. Trans. Korean Soc. Automot. Eng. 2019, 27, 199–206. [Google Scholar] [CrossRef]
- Kang, G.; Lee, J.; Junhong, P.; Cha, J.; Chon, M.S. Development of Korean RDE Routes for on-road Emissions Measurement of Light Duty Vehicles. Trans. KSAE 2017, 25, 287–296. [Google Scholar] [CrossRef]
- Wang, H.; Ge, Y.; Hao, L.; Xu, X.; Tan, J.; Li, J.; Wu, L.; Yang, J.; Yang, D.; Peng, J.; et al. The real driving emission characteristics of light-duty diesel vehicle at various altitudes. Atmos. Environ. 2018, 191, 126–131. [Google Scholar] [CrossRef]
- Luján, J.M.; Bermúdez, V.; Dolz, V.; Monsalve-Serrano, J. An assessment of the real-world driving gaseous emissions from a Euro 6 light-duty diesel vehicle using a portable emissions measurement system (PEMS). Atmos. Environ. 2018, 174, 112–121. [Google Scholar] [CrossRef]
- Gent, A.N.; Walter, J.D. Pneumatic Tire; University of Akron: Akron, OH, USA, 2006. [Google Scholar]
- Mozharovskii, V.V.; Shil’ko, S.V.; Anfinogenov, S.B.; Khot’ko, A.V. Determination of resistance to rolling of tires in de-pendence on operating conditions. Part Method of multifactorial experiment. J. Frict. Wear 2007, 28, 154–161. [Google Scholar] [CrossRef]
- Wiegand, B.P. Estimation of the Rolling Resistance of Tires. In SAE Technical Paper Series; SAE International: Warrendale, PA, USA, 2016. [Google Scholar]
- Costagliola, M.A.; Costabile, M.; Prati, M.V. Impact of road grade on real driving emissions from two Euro 5 diesel vehicles. Appl. Energy 2018, 231, 586–593. [Google Scholar] [CrossRef]
Publisher’s Note: MDPI stays neutral with regard to jurisdictional claims in published maps and institutional affiliations. |
© 2021 by the authors. Licensee MDPI, Basel, Switzerland. This article is an open access article distributed under the terms and conditions of the Creative Commons Attribution (CC BY) license (https://creativecommons.org/licenses/by/4.0/).