
Sizing and Management of Energy Storage Systems in Large-Scale Power Plants Using Price Control and Artificial Intelligence


Abstract
1. Introduction
2. Methods
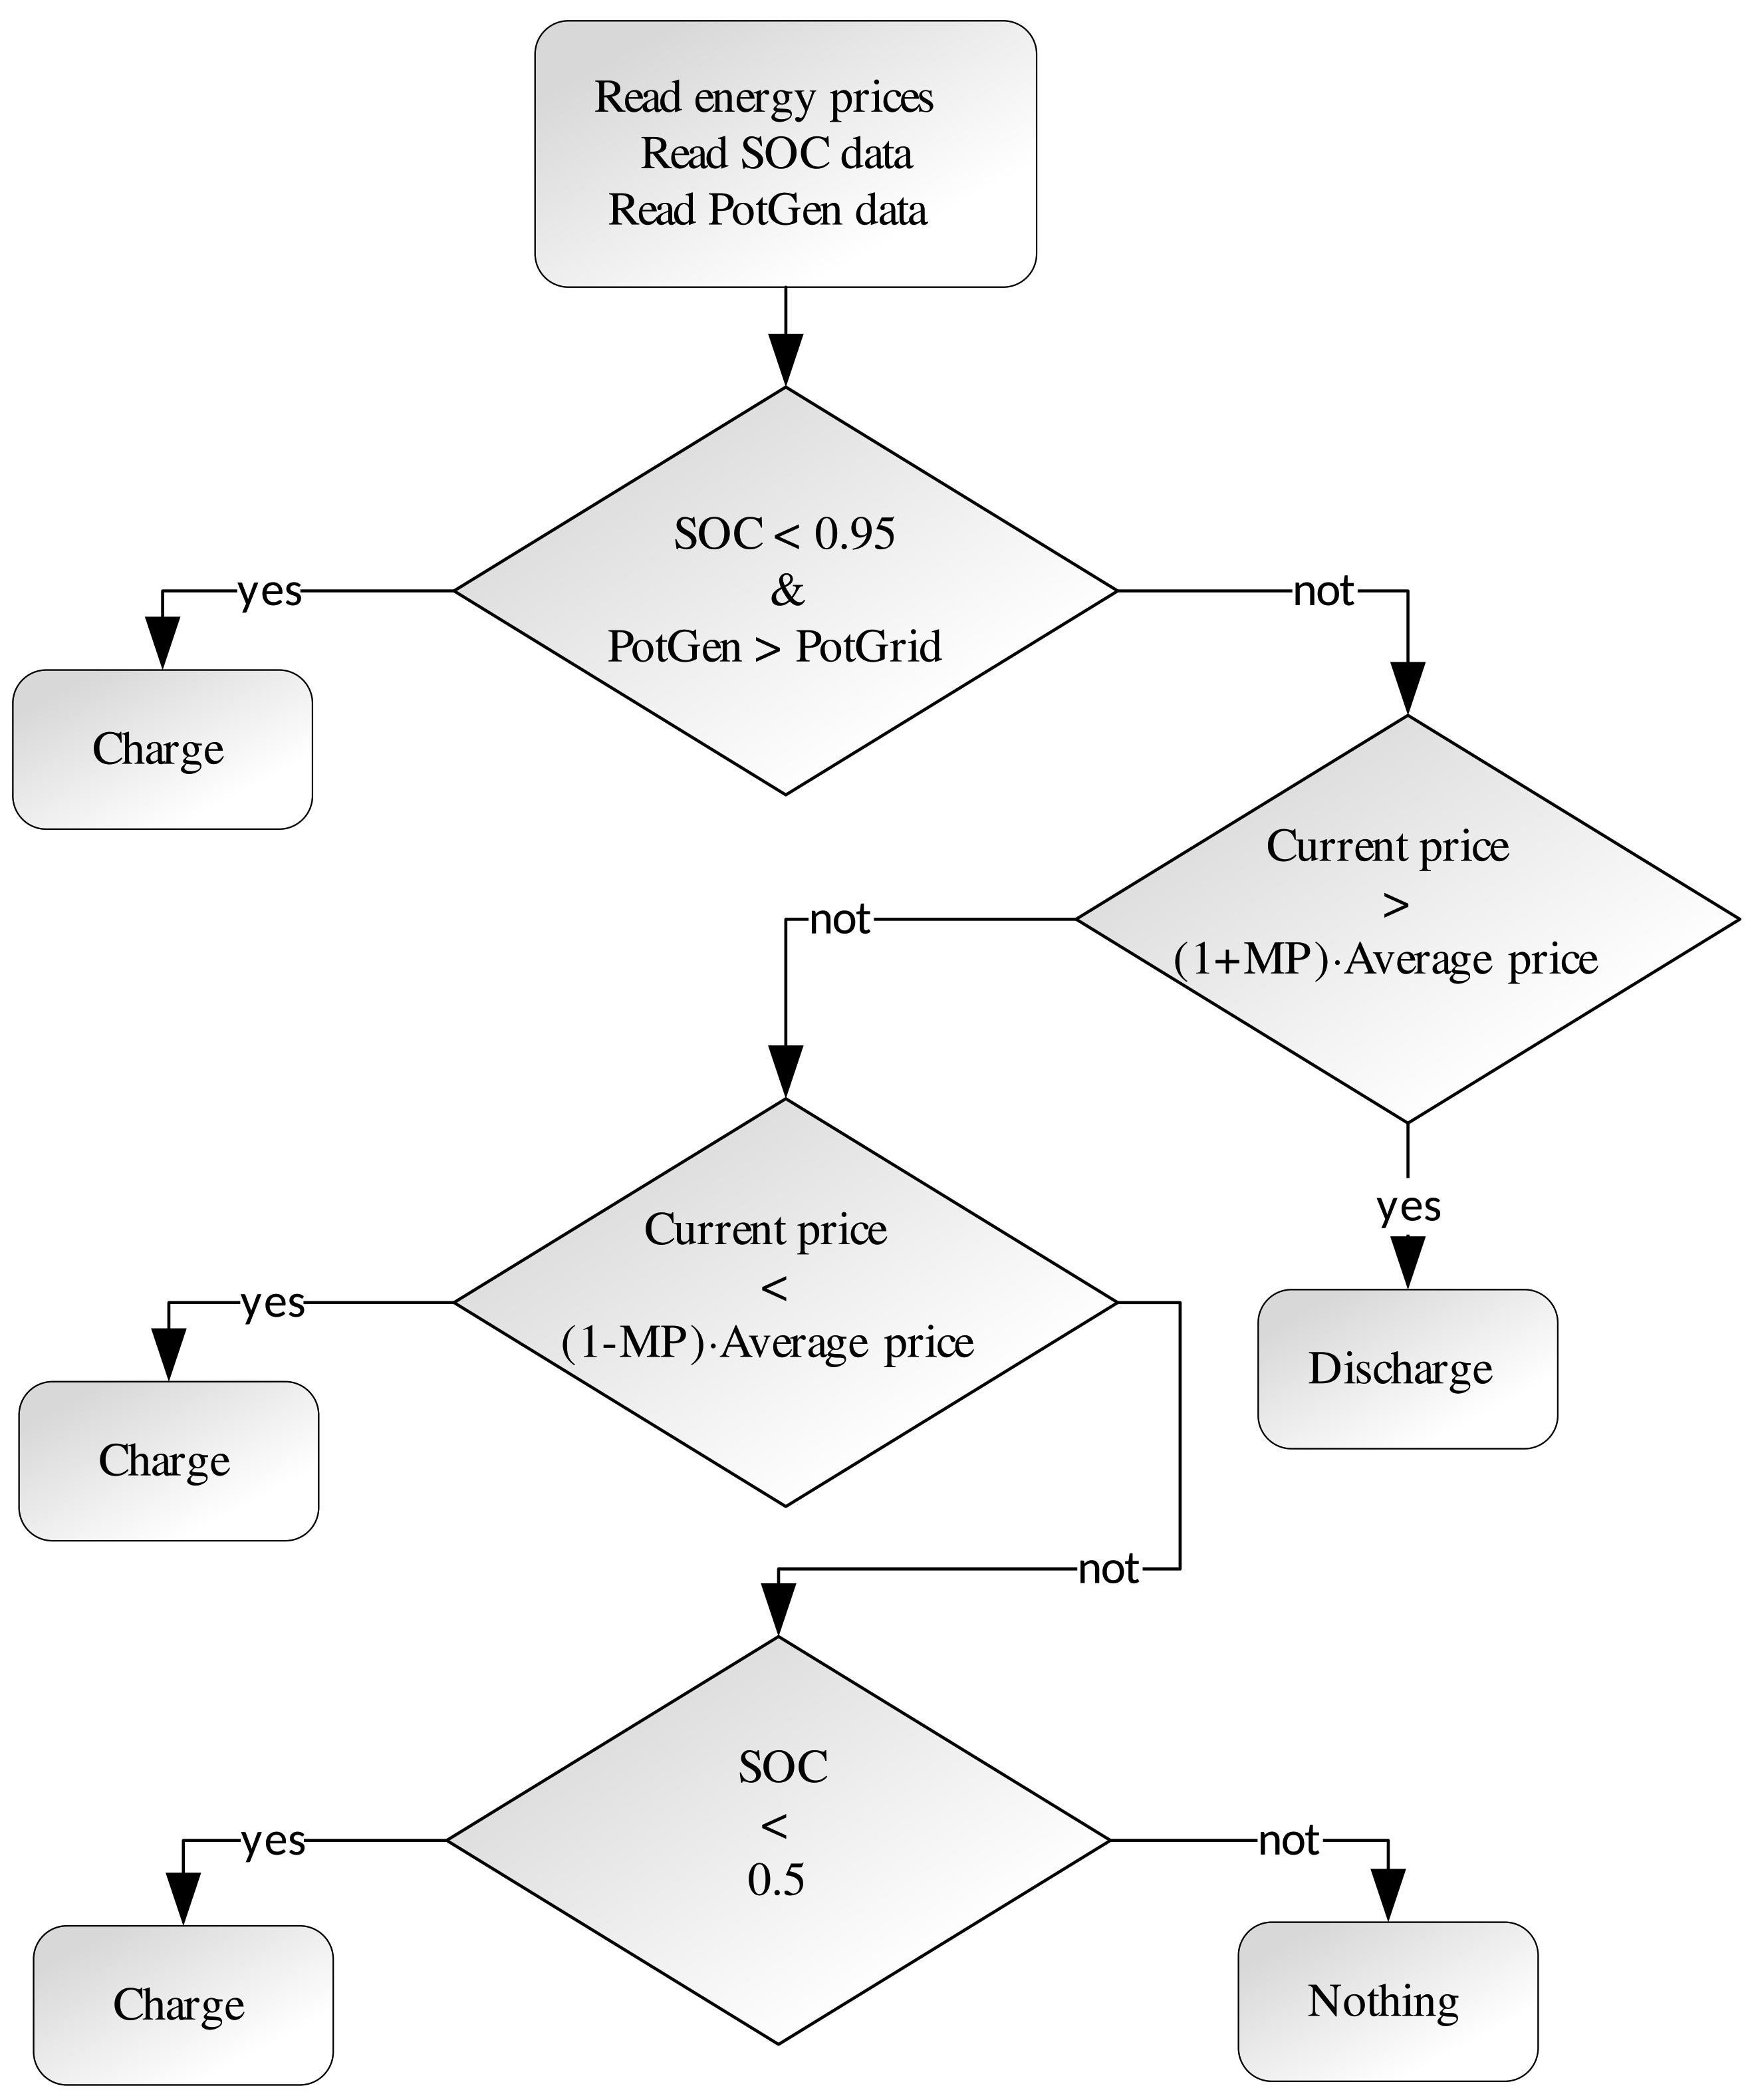
2.1. Expert System
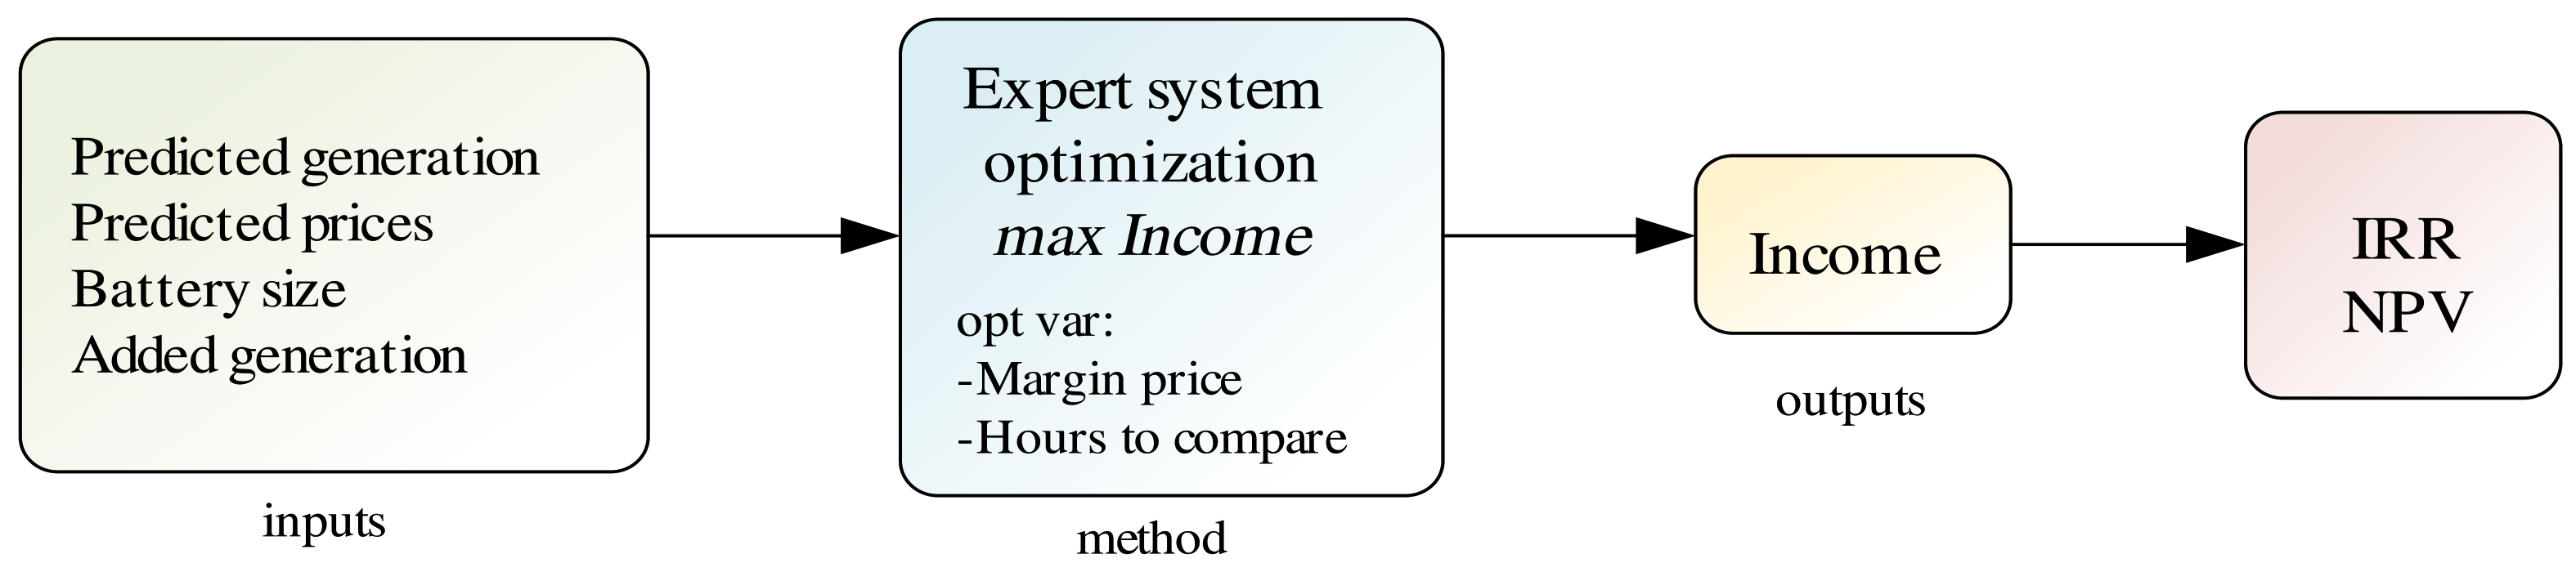
2.2. Optimised Expert System
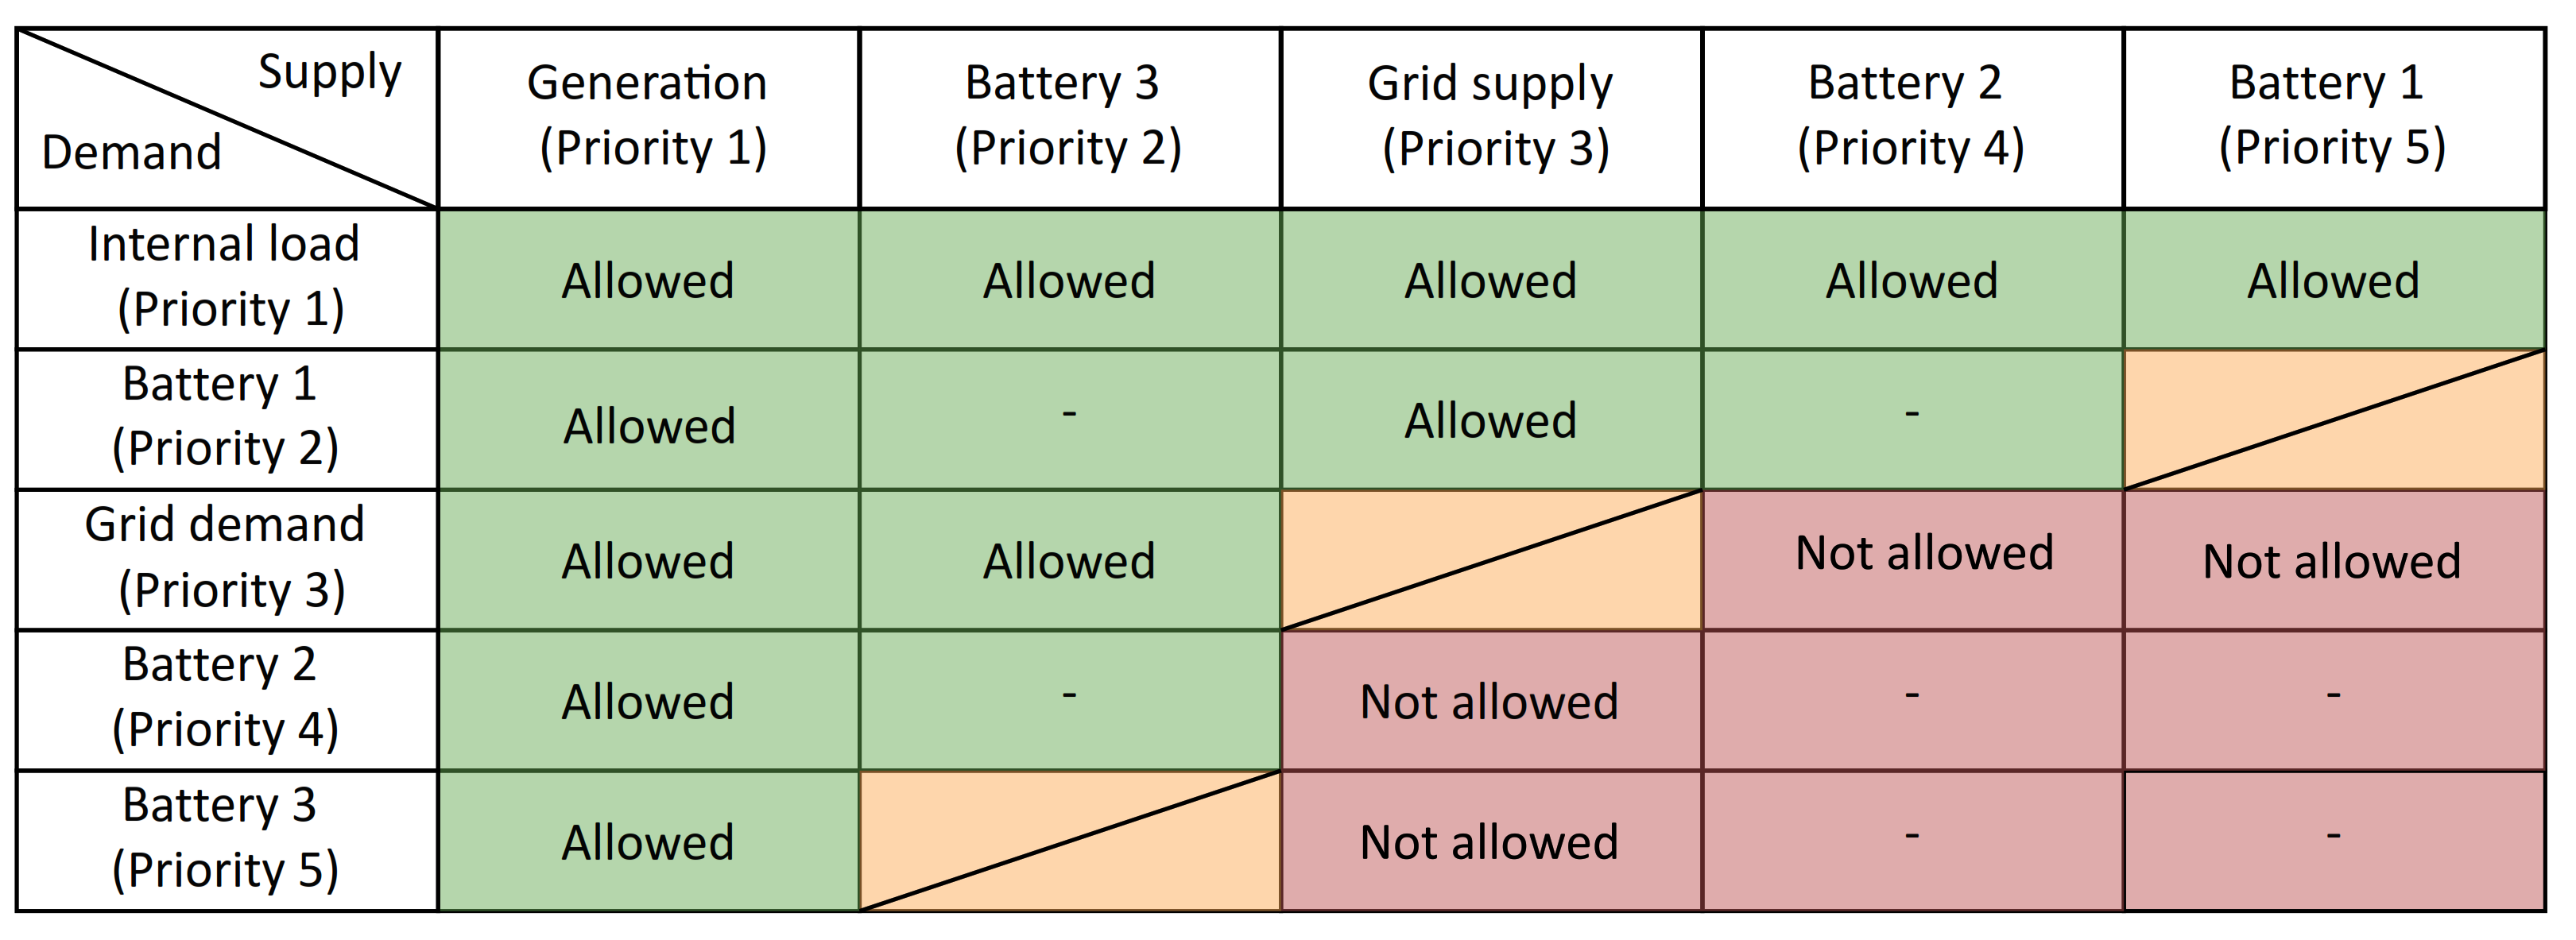
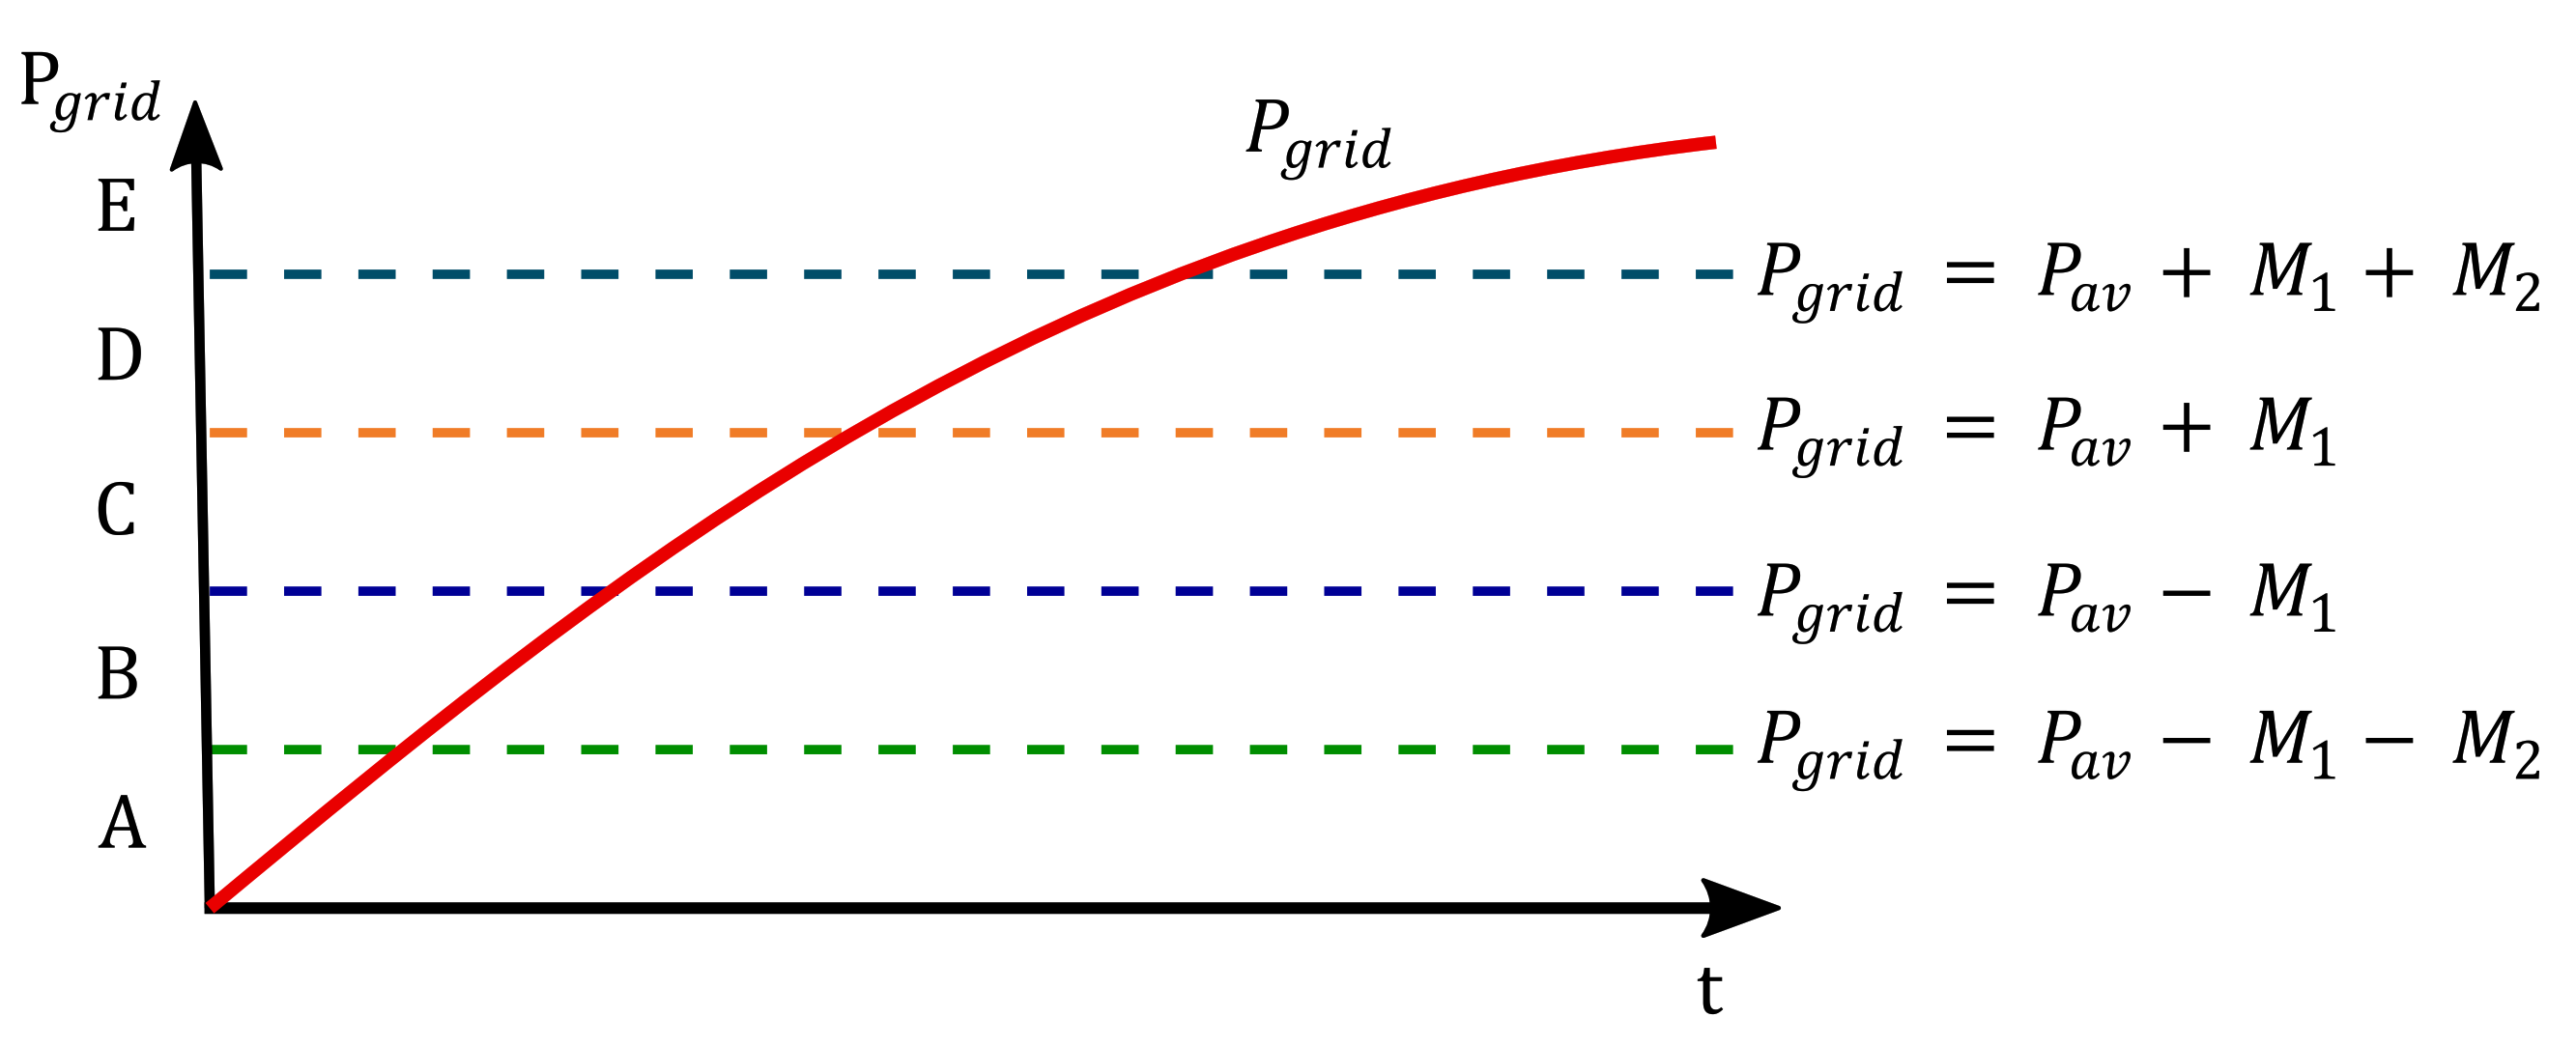
2.3. Proposed Artificial Intelligence Method
2.4. Multi-Objective Sizing
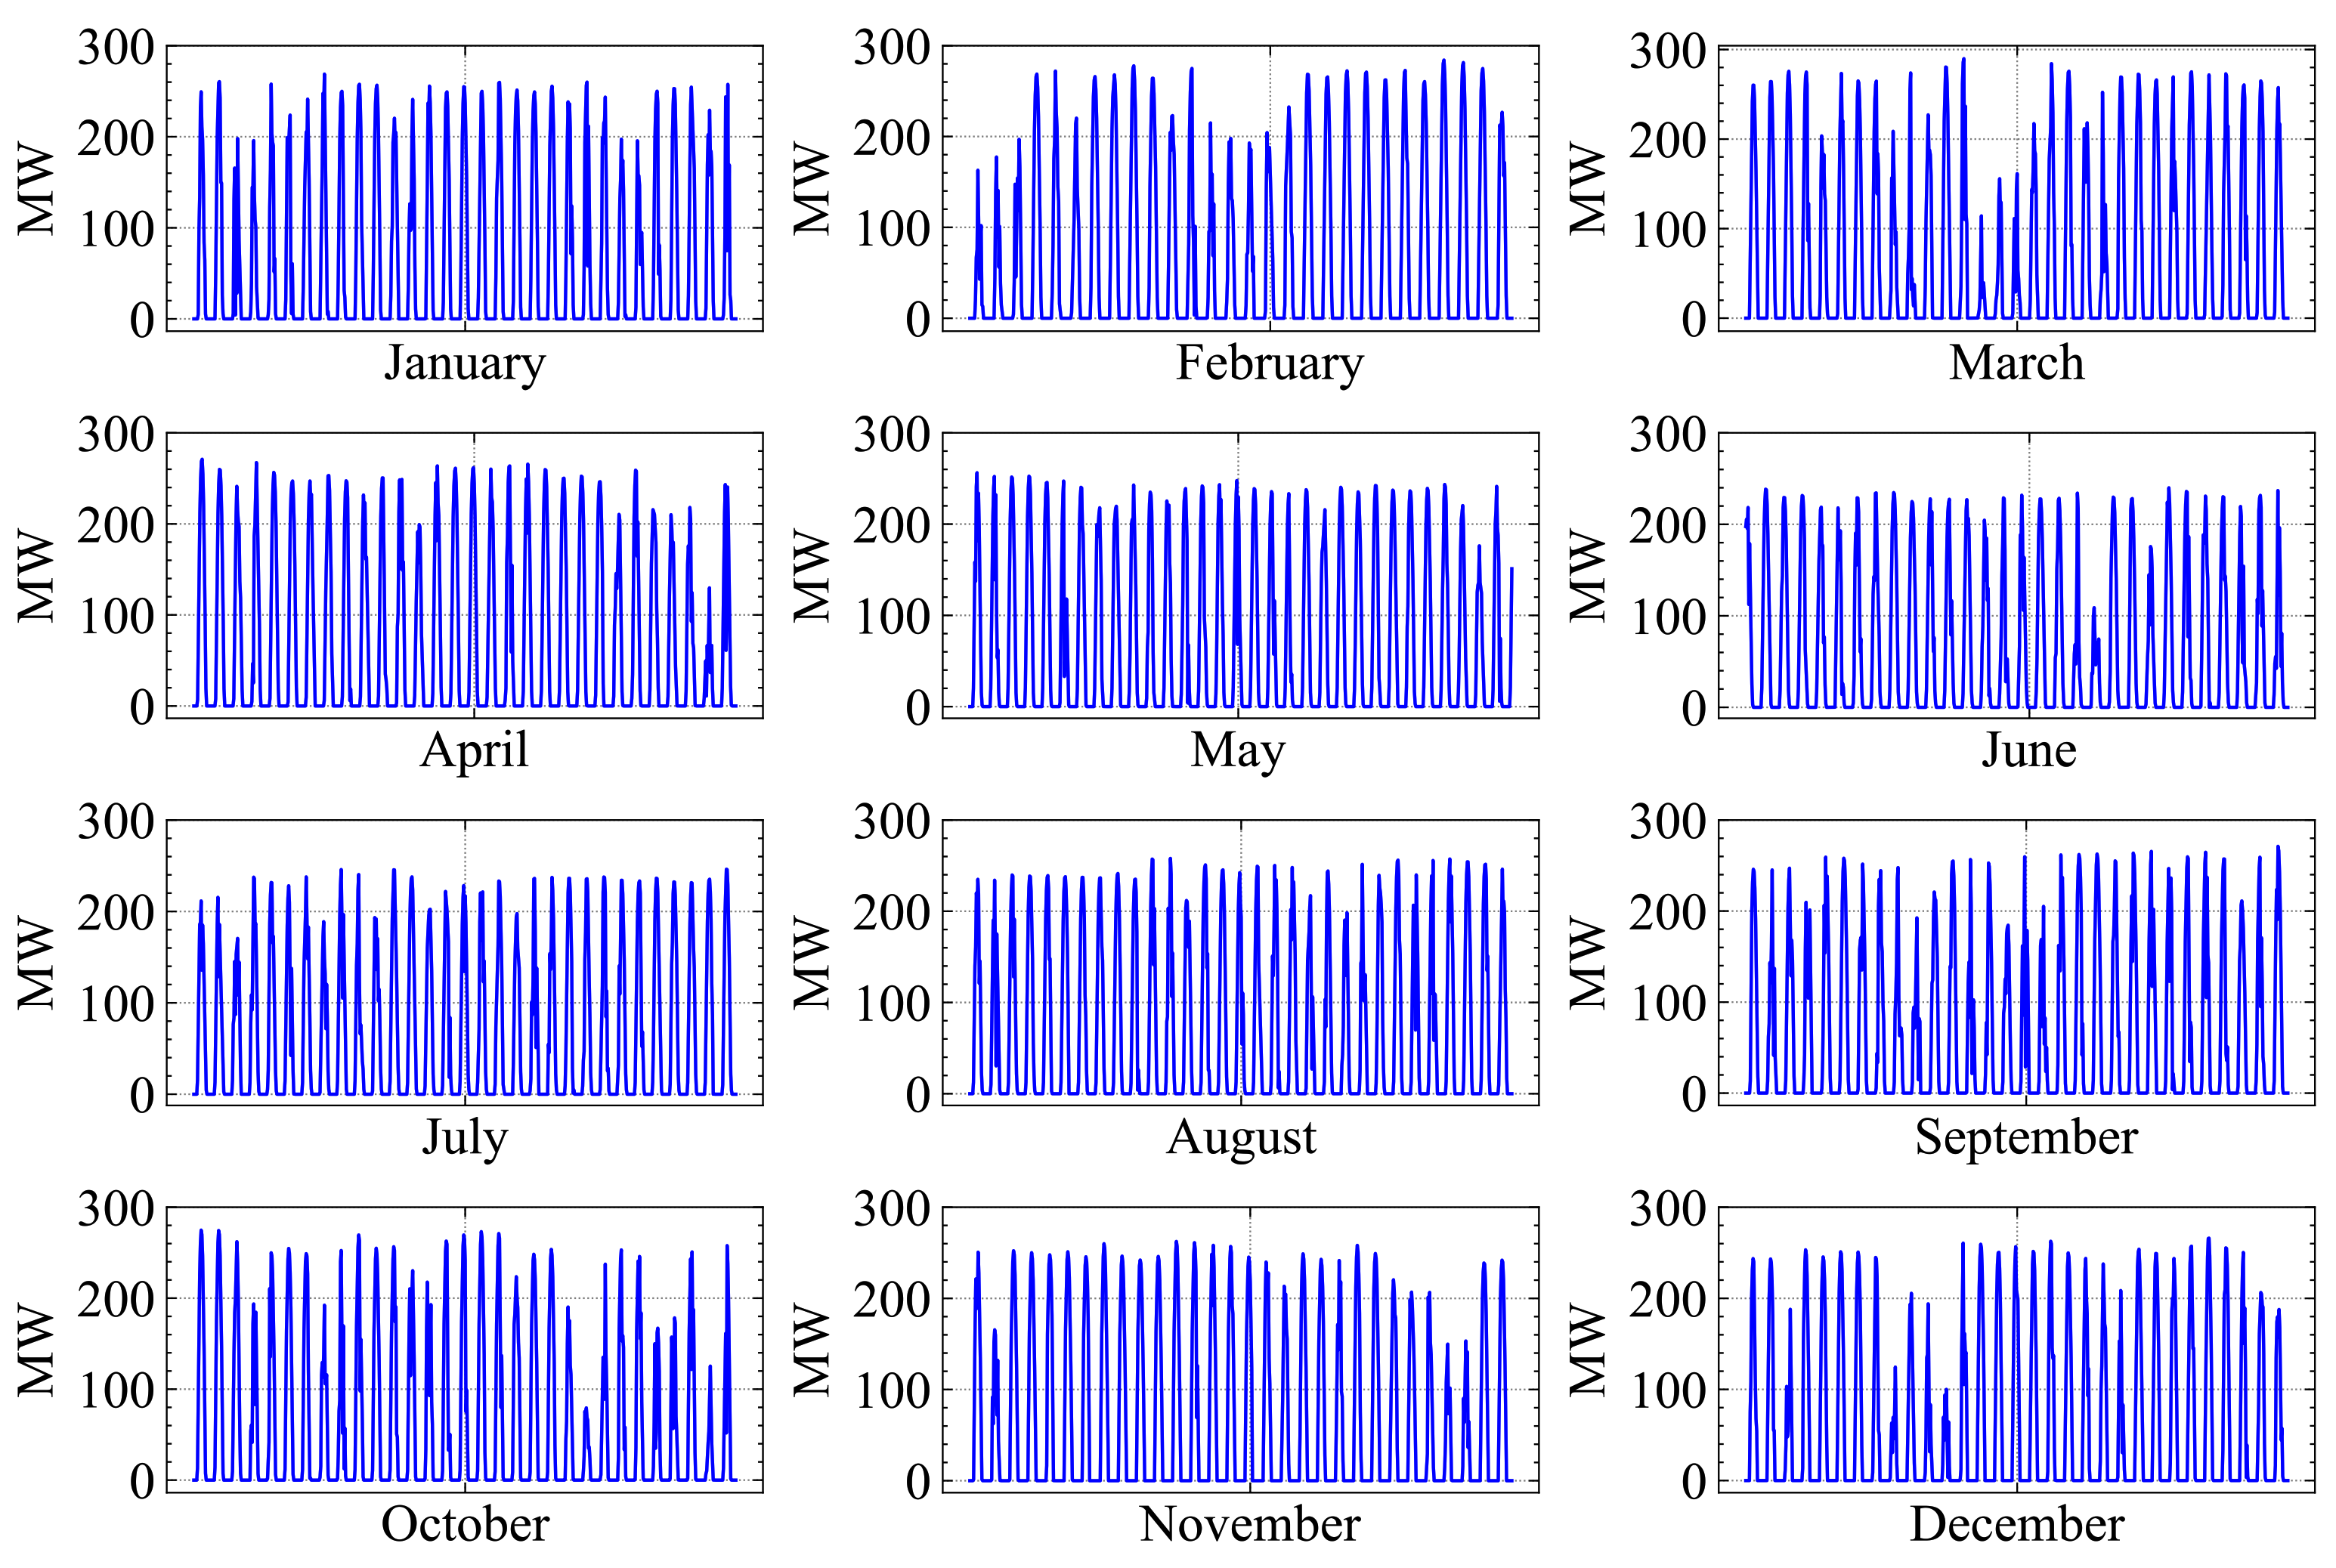
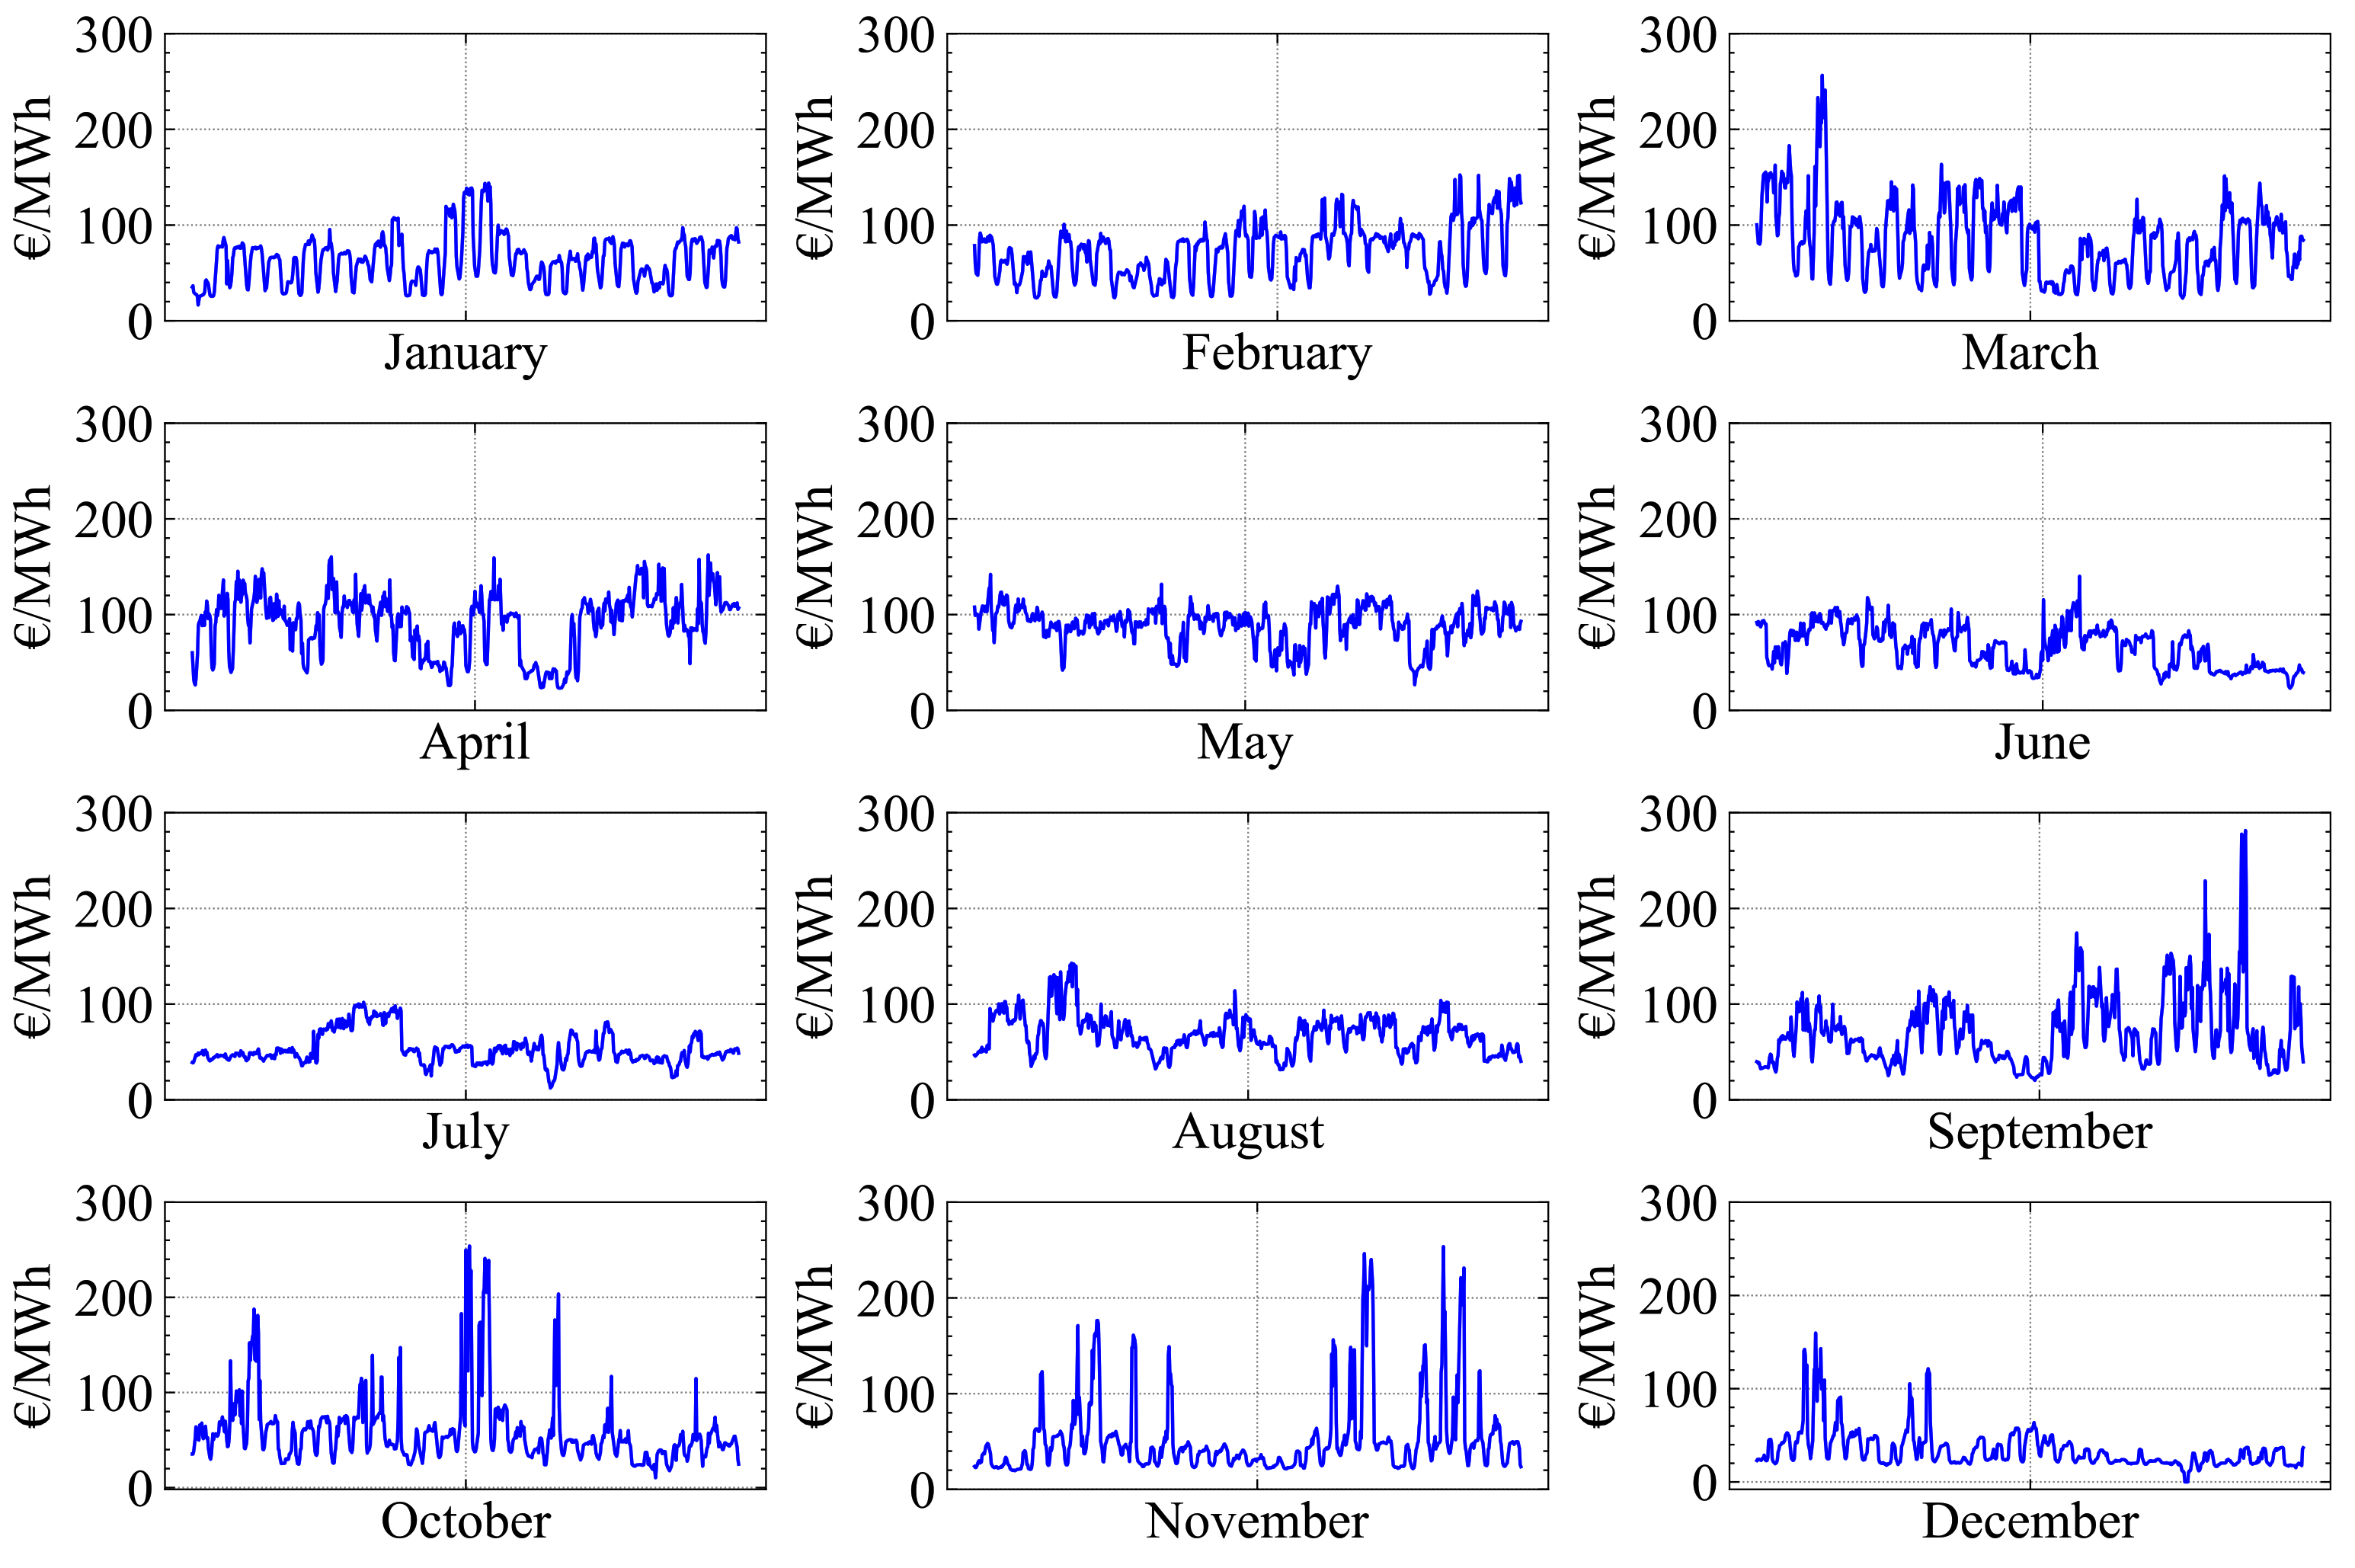
3. Test Data
4. Simulation and Results
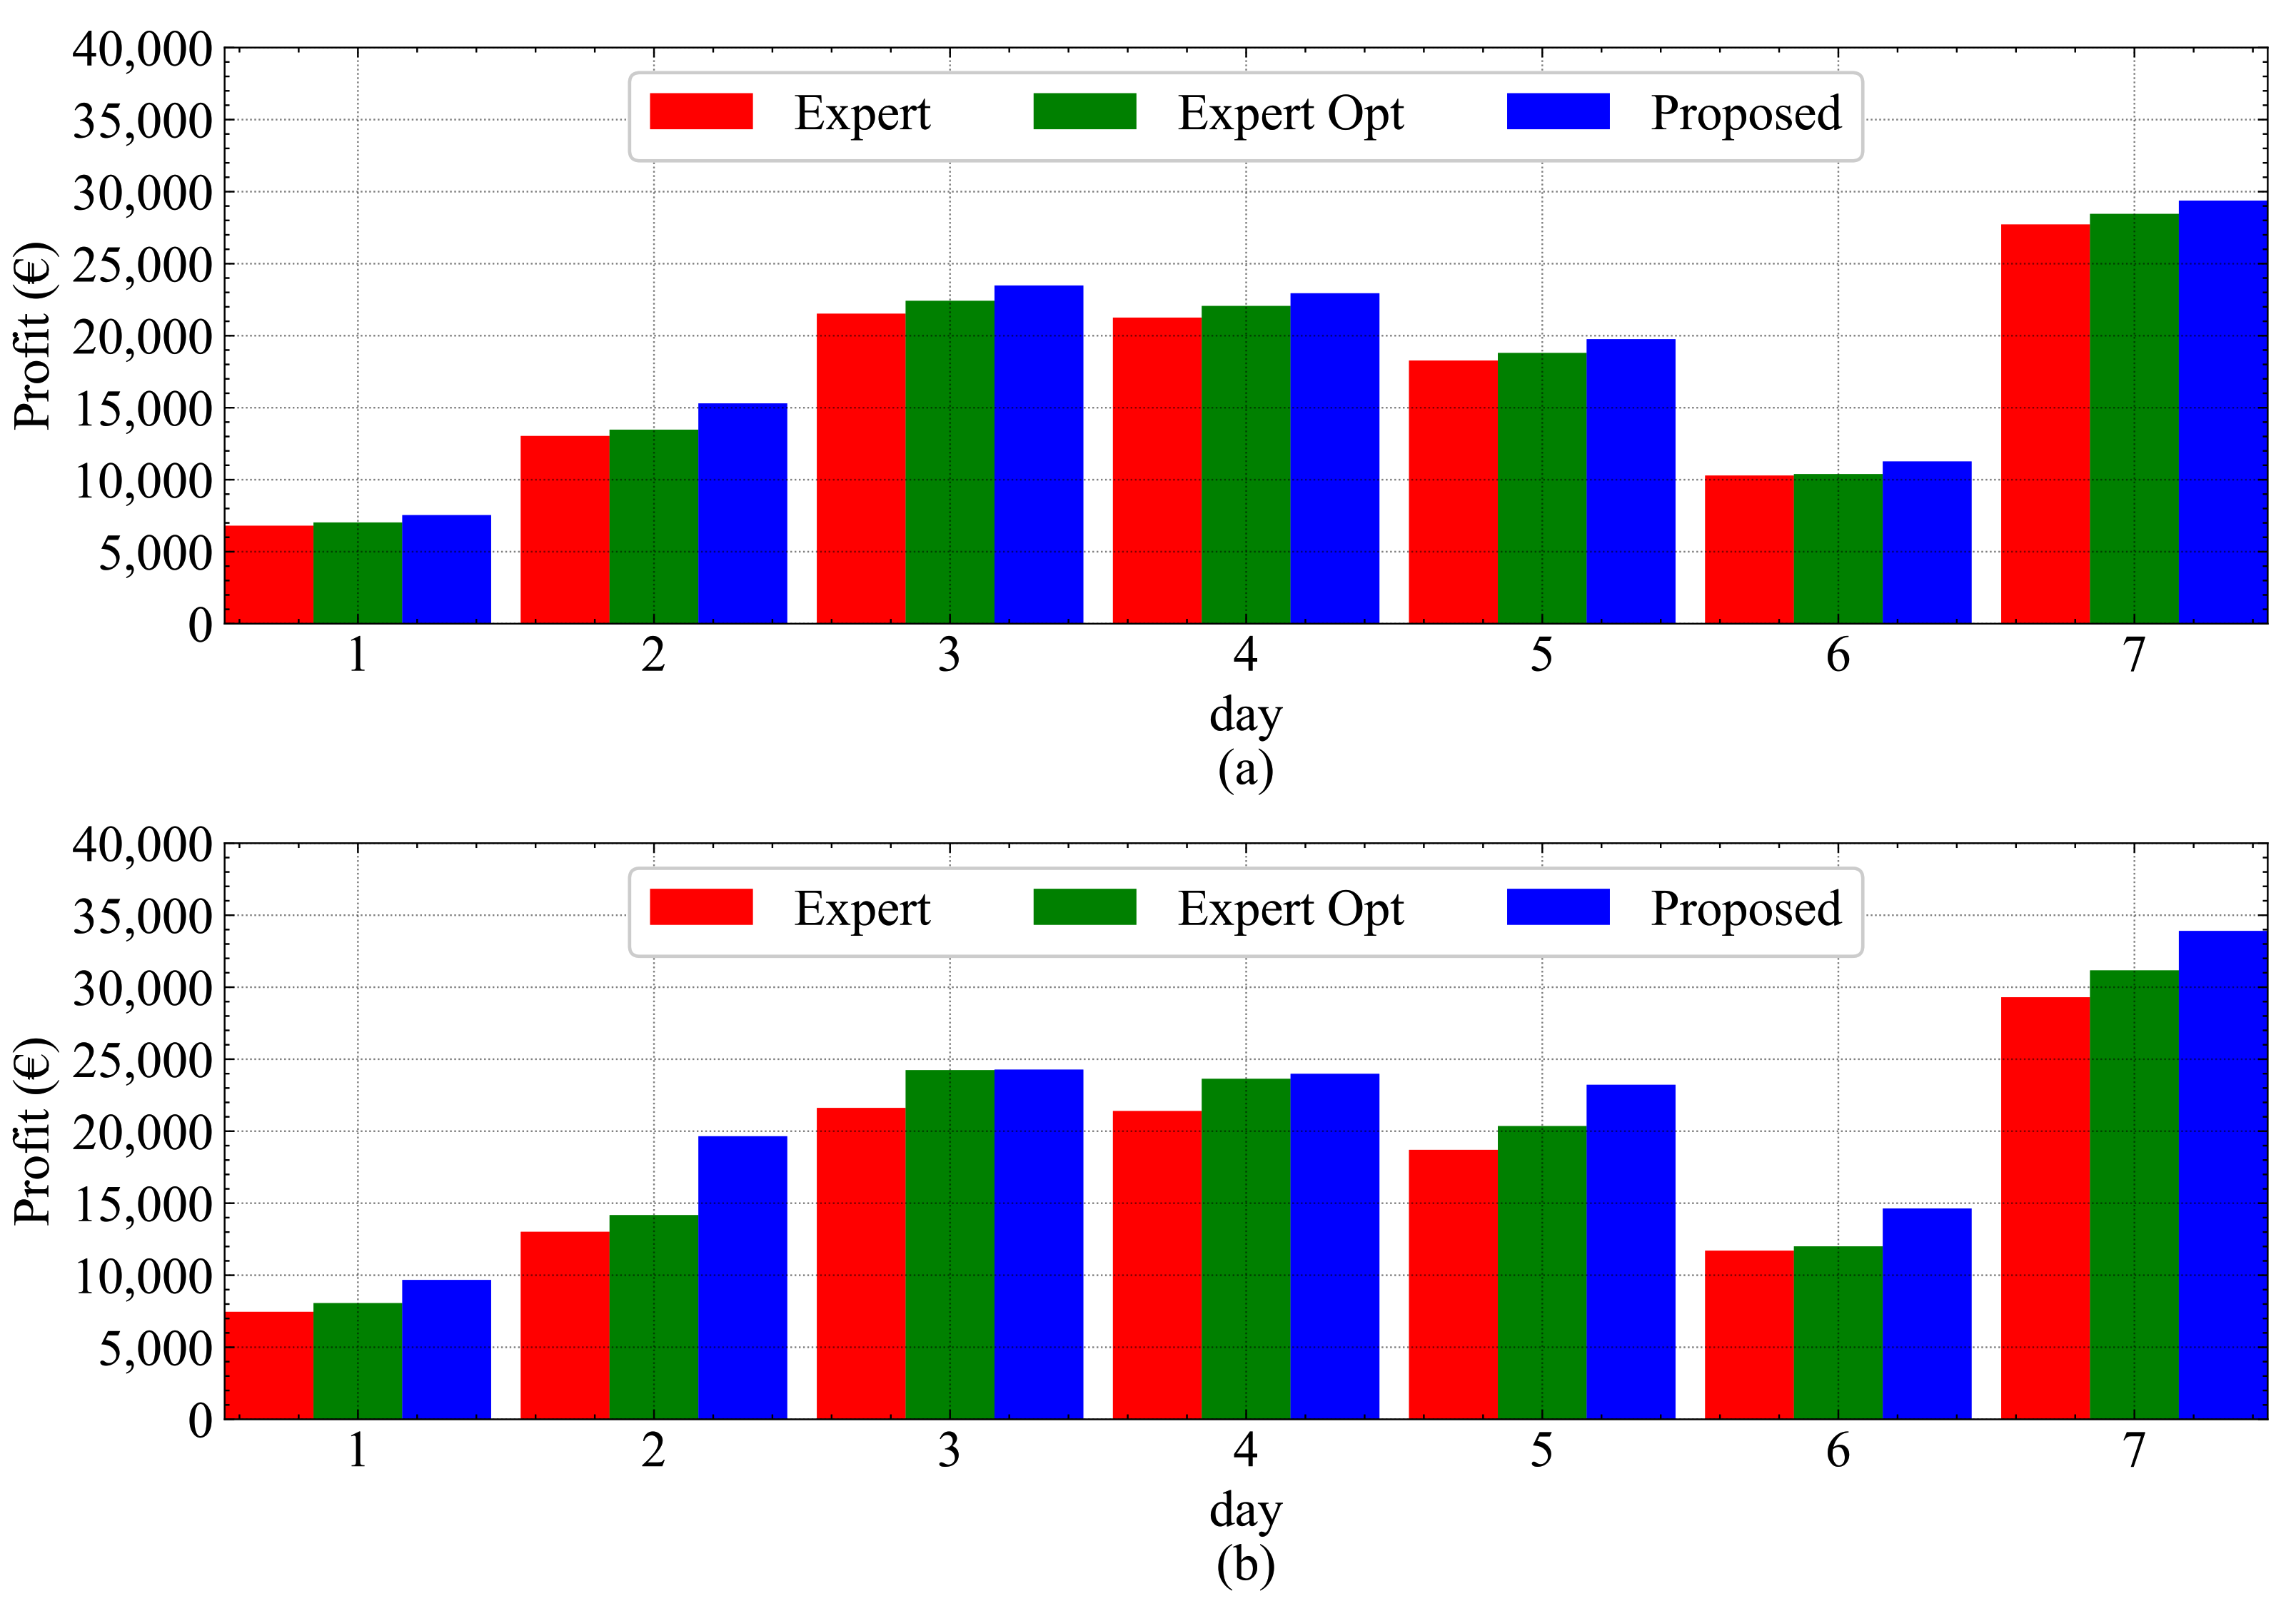
4.1. Management
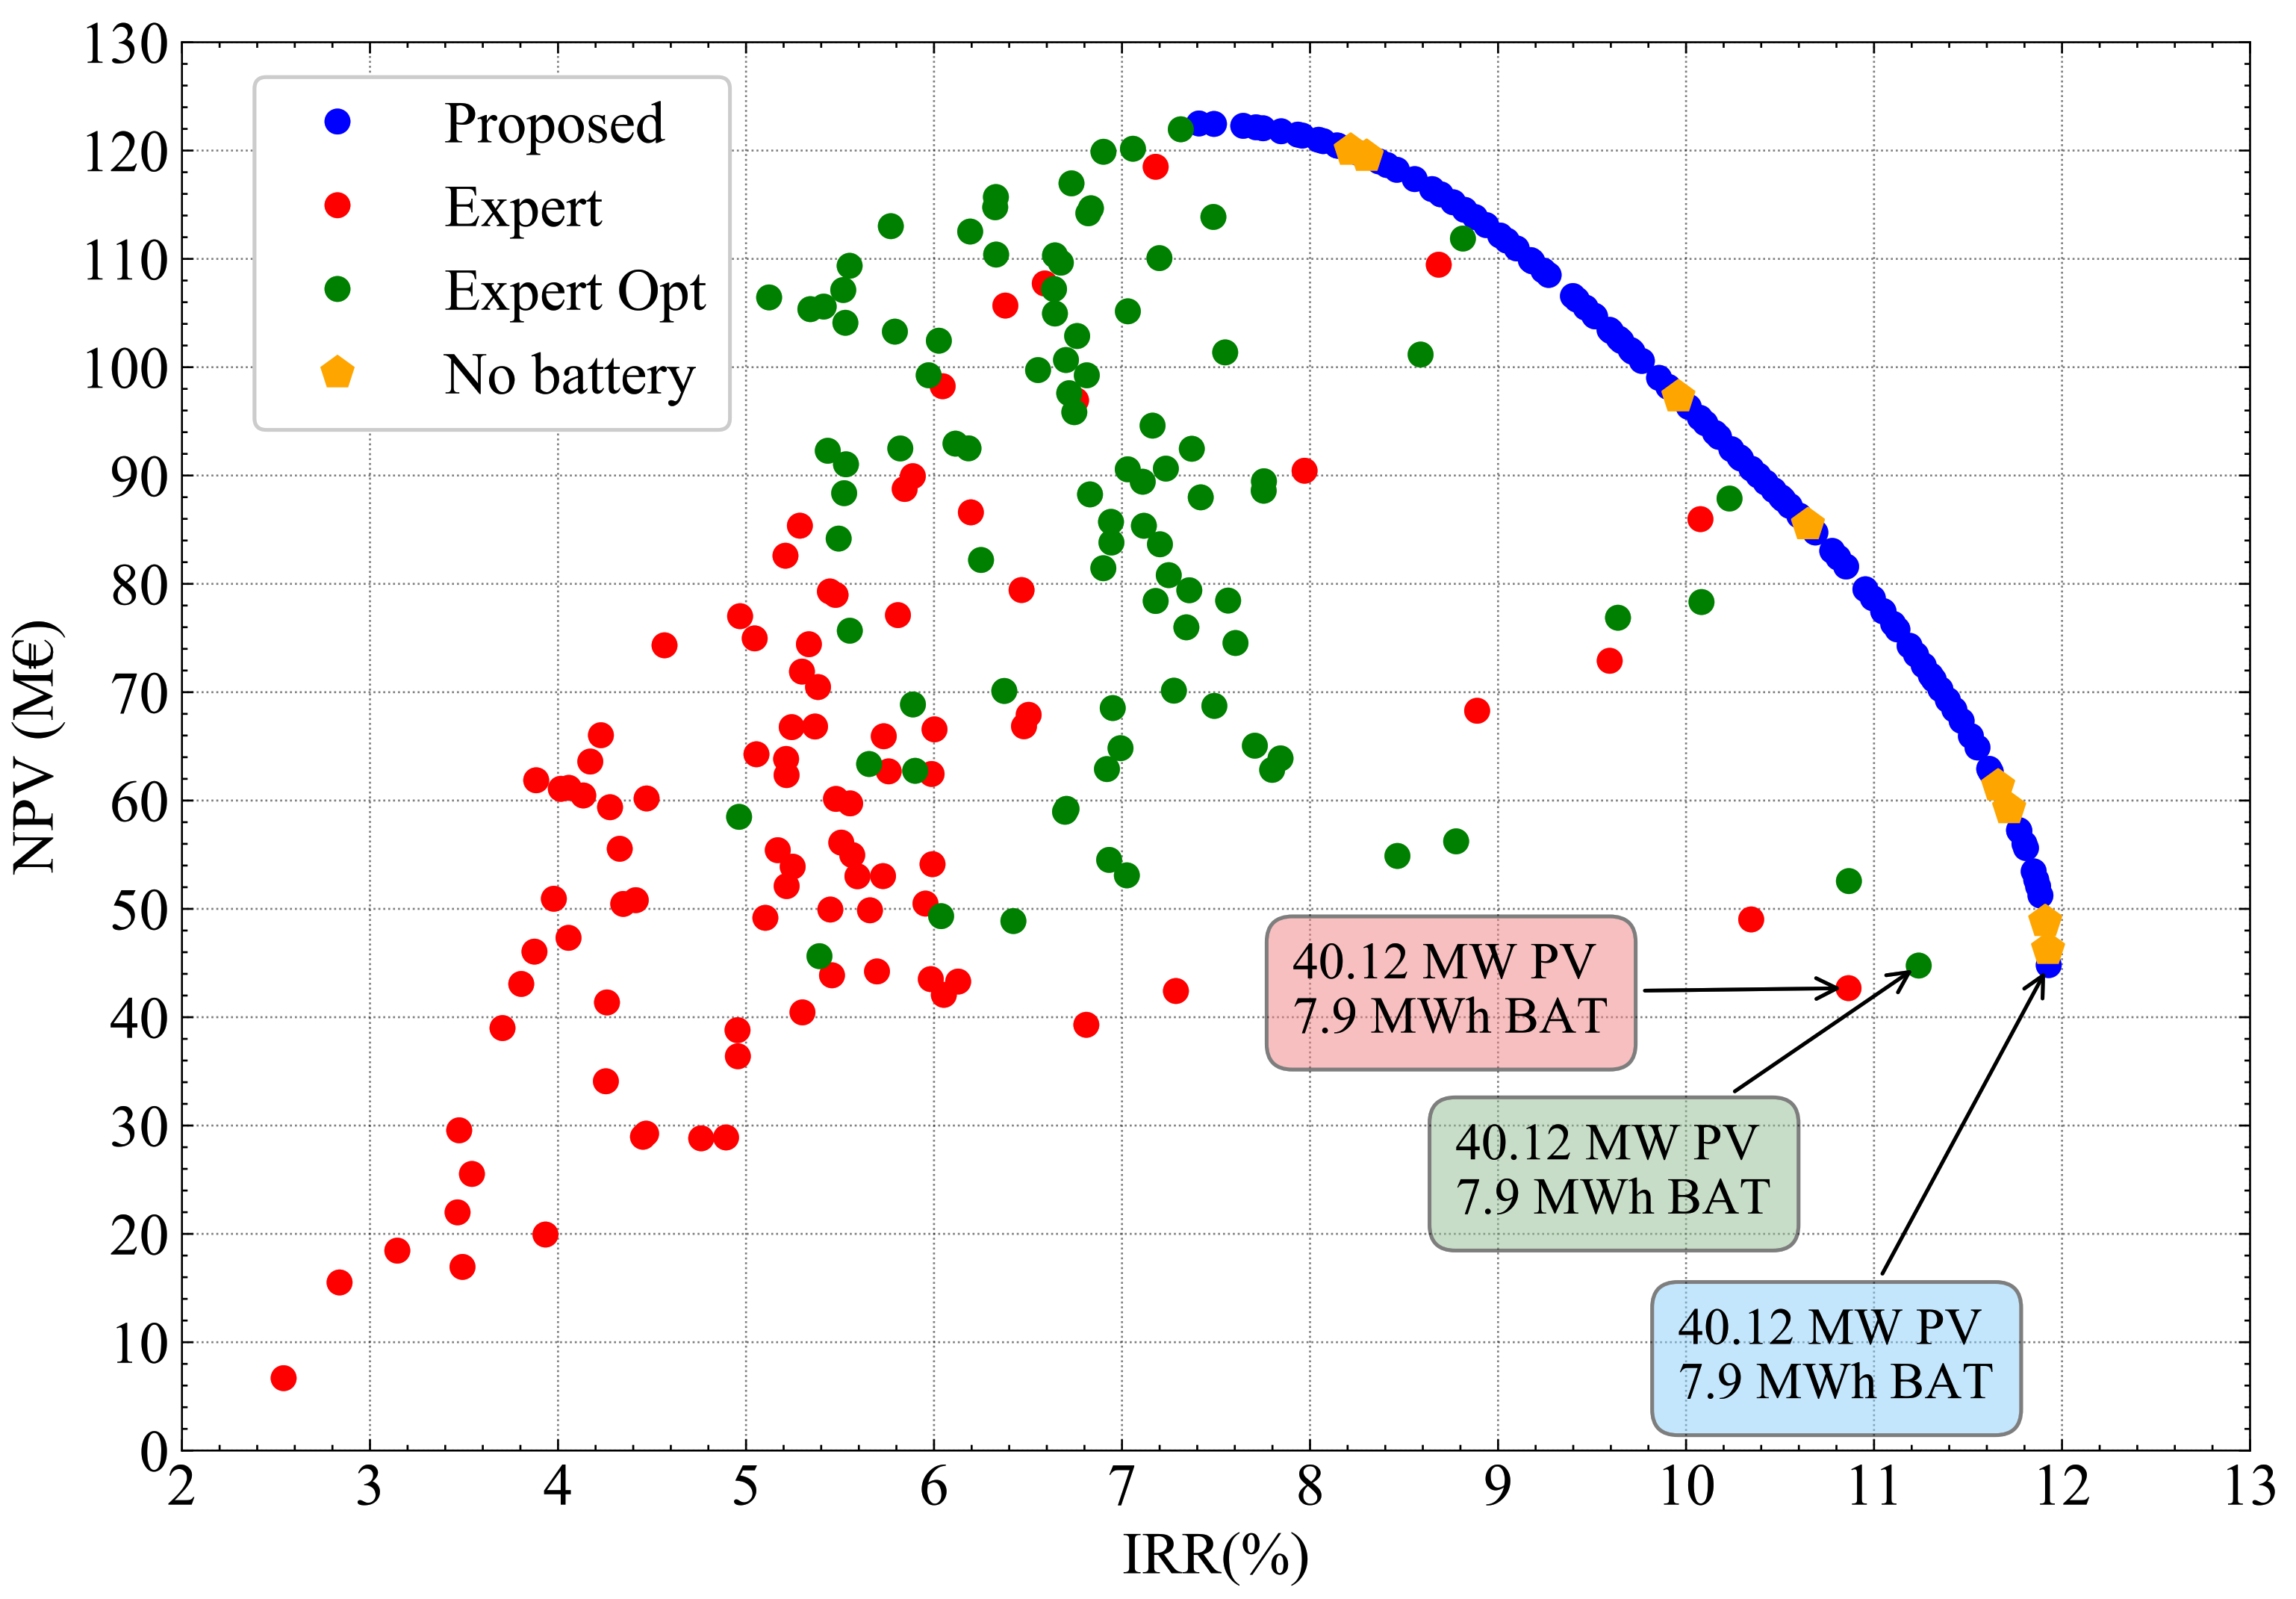
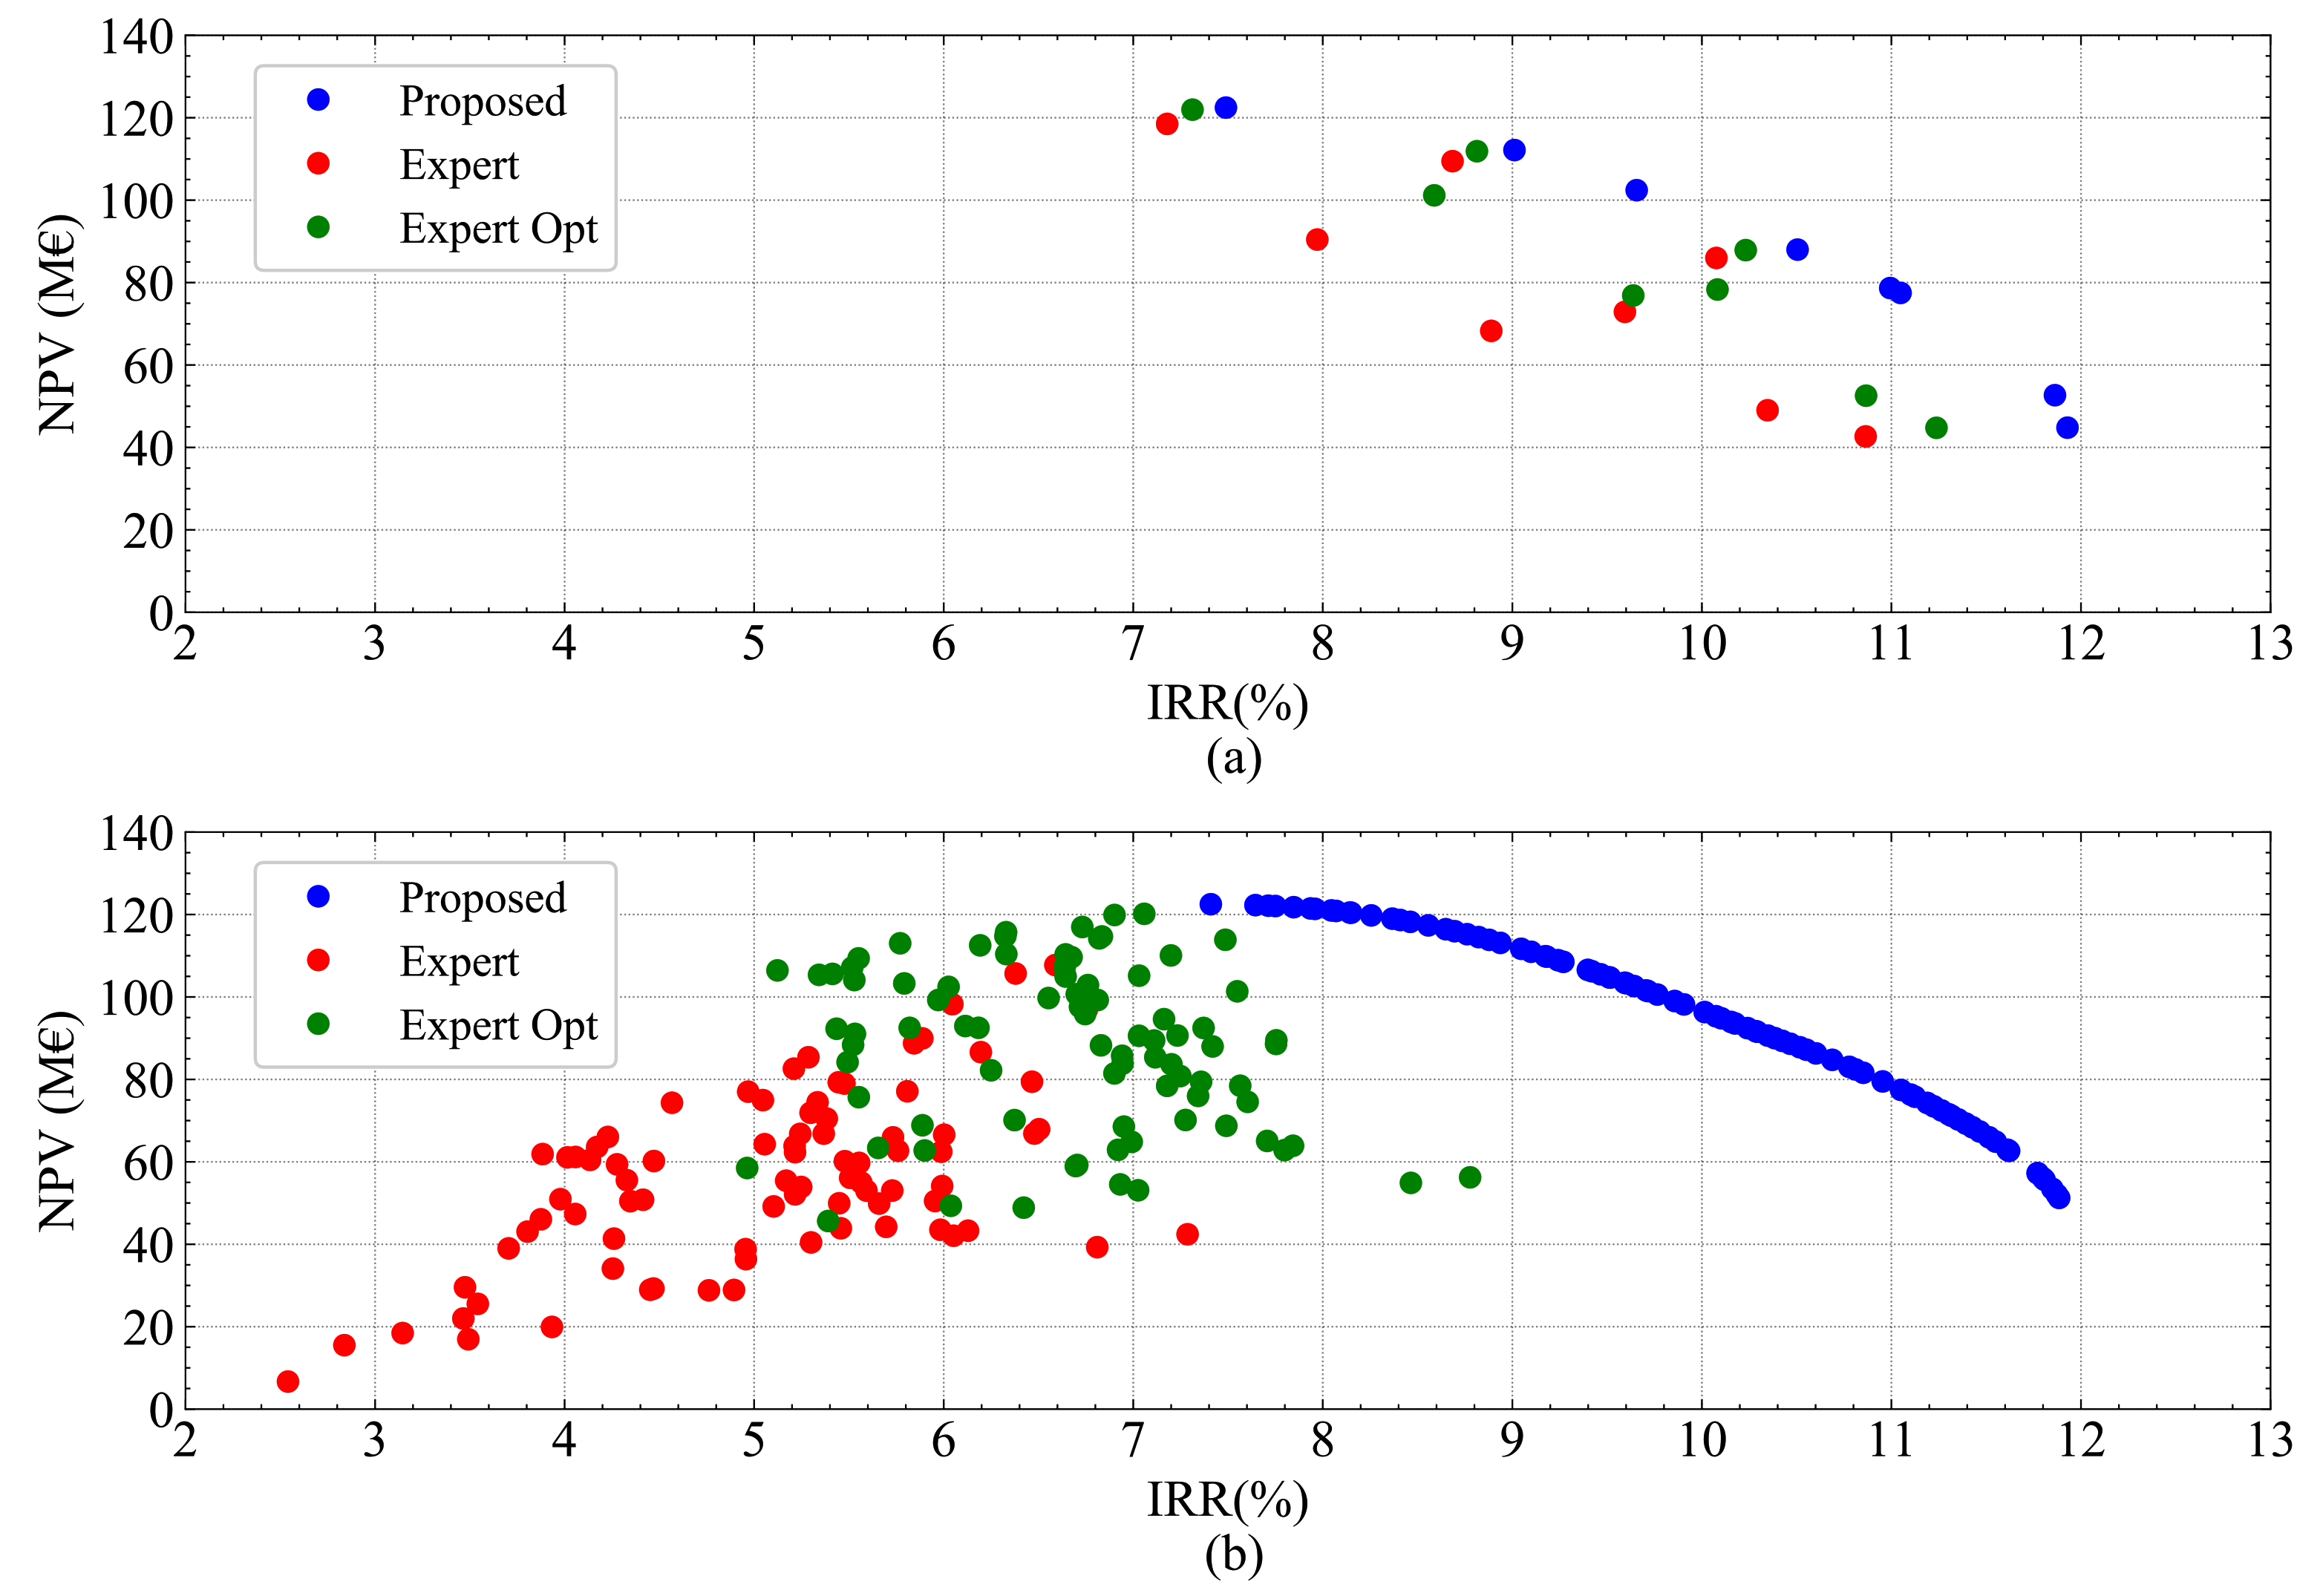
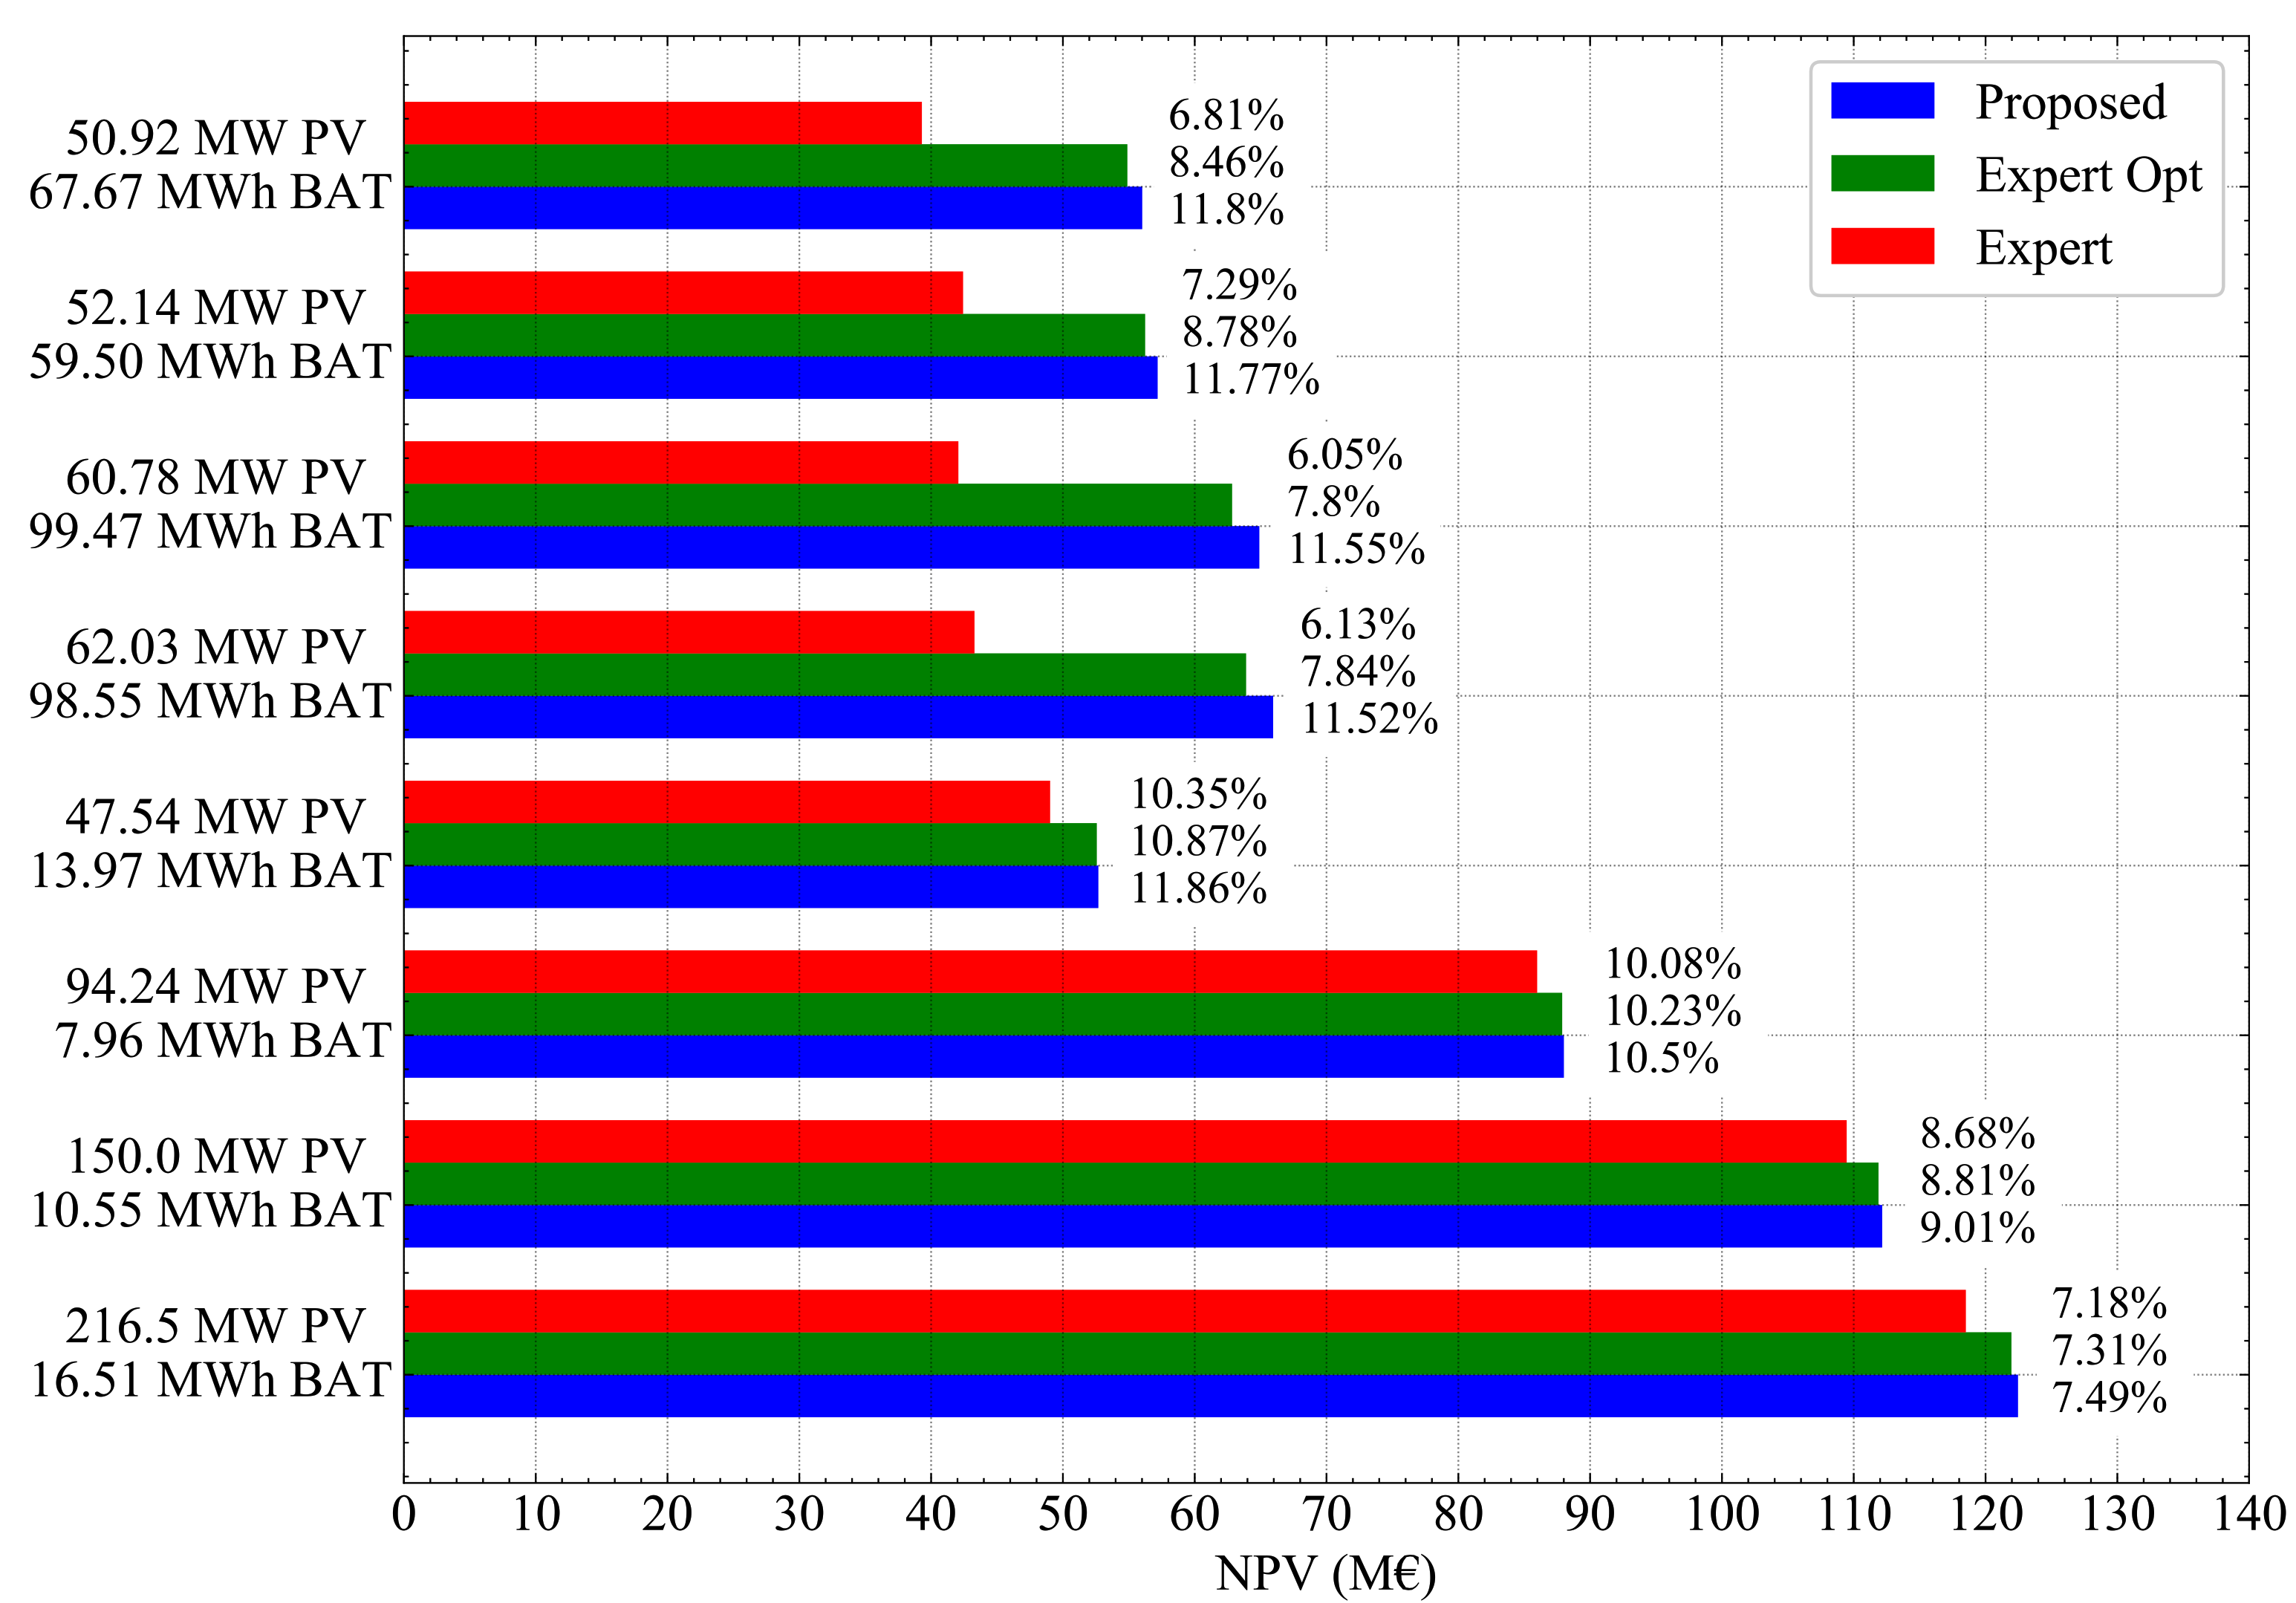
4.2. Sizing
5. Conclusions
Author Contributions
Funding
Conflicts of Interest
References
- UNFCCC. Paris Agreement to the United Nations Framework Convention on Climate Change; T.I.A.S. No. 16-1104; UNFCCC: Bonn, Germany, 12 December 2015. [Google Scholar]
- European Union. Directive (EU) 2018/2001 of the European Parliament and of the Council of 11 December 2018 on the promotion of the use of energy from renewable sources. Off. J. Eur. Union 2018, L328, 82–209. [Google Scholar]
- European Union. Directive 2012/27/EU of the European Parliament and of the Council of 25 October 2012 on energy efficiency. Off. J. Eur. Union 2012, L 315, 1–56.
- Breyer, C.; Khalili, S.; Bogdanov, D. Solar photovoltaic capacity demand for a sustainable transport sector to fulfil the Paris Agreement by 2050. Prog. Photovoltaics Res. Appl. 2019, 27, 978–989. [Google Scholar] [CrossRef]
- Jäger-Waldau, A.; Huld, T.; Bódis, K.; Szabo, S. Photovoltaics in Europe after the Paris Agreement. In Proceedings of the 2018 IEEE 7th World Conference on Photovoltaic Energy Conversion (WCPEC) (A Joint Conference of 45th IEEE PVSC, 28th PVSEC & 34th EU PVSEC), Waikoloa, HI, USA, 10–15 June 2018; pp. 3835–3837. [Google Scholar] [CrossRef]
- Díaz-Reyes, F.; Giammatteo, M.; Déniz-Quintana, F. Photovoltaic energy promotion in Europe: Italy and Spain, two visions, one aim. In Proceedings of the 2008 5th International Conference on the European Electricity Market, Lisboa, Portugal, 28–30 May 2008; pp. 2–6. [Google Scholar] [CrossRef]
- Xu, L.; Ruan, X.; Mao, C.; Zhang, B.; Luo, Y. An improved optimal sizing method for wind-solar-battery hybrid power system. IEEE Trans. Sustain. Energy 2013, 4, 774–785. [Google Scholar] [CrossRef]
- Ibrahim, I.A.; Mohamed, A.; Khatib, T. Optimal modeling and sizing of a practical standalone PV/battery generation system using numerical algorithm. In Proceedings of the 2015 IEEE Student Conference on Research and Development, Kuala Lumpur, Malaysia, 13–14 December 2015; pp. 43–48. [Google Scholar] [CrossRef]
- Wang, G.; Ciobotaru, M.; Agelidis, V.G. PV power plant using hybrid energy storage system with improved efficiency. In Proceedings of the 2012 3rd IEEE International Symposium on Power Electronics for Distributed Generation Systems, Aalborg, Denmark, 25–28 June 2012; pp. 808–813. [Google Scholar] [CrossRef]
- Knap, V.; Chaudhary, S.K.; Stroe, D.I.; Swierczynski, M.; Craciun, B.I.; Teodorescu, R. Sizing of an energy storage system for grid inertial response and primary frequency reserve. IEEE Trans. Power Syst. 2016, 31, 3447–3456. [Google Scholar] [CrossRef]
- You, S.; Liu, Y.; Liu, Y.; Till, A.; Li, H.; Su, Y.; Zhao, J.; Tan, J.; Zhang, Y.; Gong, M. Energy Storage for Frequency Control in High Photovoltaic Power Grids. In Proceedings of the EUROCON 2019—18th International Conference on Smart Technologies, Novi Sad, Serbia, 1–4 July 2019; pp. 1–6. [Google Scholar] [CrossRef]
- Vaca, S.M.; Patsios, C.; Taylor, P. Sizing of hybrid energy storage systems for frequency response of solar farms in Ecuador. In Proceedings of the 2017 IEEE PES Innovative Smart Grid Technologies Conference, Arlington, VA, USA, 23–26 April 2017. [Google Scholar] [CrossRef]
- Muqbel, A.; Aldik, A.; Al-Awami, A.T.; Alismail, F. Fuzzy optimization-based sizing of a battery energy storage system for participating in ancillary services markets. In Proceedings of the 2018 IEEE Industry Applications Society Annual Meeting, Portland, OR, USA, 23–17 September 2018; pp. 5–11. [Google Scholar] [CrossRef]
- Kadri, A.; Raahemifar, K. Optimal Sizing and Scheduling of Battery Storage System Incorporated with PV for Energy Arbitrage in Three Different Electricity Markets. In Proceedings of the 2019 IEEE Canadian Conference of Electrical and Computer Engineering, Edmonton, AB, Canada, 5–8 May 2019; pp. 1–6. [Google Scholar] [CrossRef]
- Krishnamurthy, D.; Uckun, C.; Zhou, Z.; Thimmapuram, P.R.; Botterud, A. Energy Storage Arbitrage Under Day-Ahead and Real-Time Price Uncertainty. IEEE Trans. Power Syst. 2018, 33, 84–93. [Google Scholar] [CrossRef]
- Zakeri, B.; Syri, S. Economy of electricity storage in the Nordic electricity market: The case for Finland. In Proceedings of the International Conference on the European Energy Market, Krakow, Poland, 28–30 May 2014. [Google Scholar] [CrossRef]
- Shu, Z.; Jirutitijaroen, P. Optimal operation strategy of energy storage system for grid-connected wind power plants. IEEE Trans. Sustain. Energy 2014, 5, 190–199. [Google Scholar] [CrossRef]
- Aldeek, A.; Al-Awami, A.T. Optimal storage sizing for profit maximization of a wind power producer in energy market environment. In Proceedings of the 2014 Saudi Arabia Smart Grid Conference, Jeddah, Saudi Arabia, 14–17 December 2014. [Google Scholar] [CrossRef]
- Abdeltawab, H.; Mohamed, Y.A.I.; Member, S. Energy Storage Planning for Profitability Maximization by Power Trading and Ancillary Services Participation. IEEE Syst. J. 2021. [Google Scholar] [CrossRef]
- Siface, D. Optimal Economical and Technical Sizing Tool for Battery Energy Storage Systems Supplying Simultaneous Services to the Power System. In Proceedings of the International Conference on the European Energy Market, Ljubljana, Slovenia, 18–20 September 2019; pp. 1–6. [Google Scholar] [CrossRef]
- Shaobo, Y.; Liang, M.; Lei, W.; Wen, Z.; Xuekai, H.; Peng, Y. Analysis of energy storage power station investment and benefit. In Proceedings of the 2020 4th International Conference on HVDC, Xi’an, China, 6–9 November 2020; pp. 454–458. [Google Scholar] [CrossRef]
- Dykes, K.; King, J.; Diorio, N.; King, R.; Gevorgian, V.; Corbus, D.; Blair, N.; Anderson, K.; Stark, G.; Turchi, C.; et al. Opportunities for Research and Development of Hybrid Power Plants. May 2020. Available online: https://www.nrel.gov/docs/fy20osti/75026.pdf (accessed on 17 January 2021).
- Root, C.; Presume, H.; Proudfoot, D.; Willis, L.; Masiello, R. Using battery energy storage to reduce renewable resource curtailment. In Proceedings of the 2017 IEEE Power and Energy Society Innovative Smart Grid Technologies Conference, Arlington, VA, USA, 23–26 April 2017; pp. 1–5. [Google Scholar] [CrossRef]
- Dimopoulou, S.; Oppermann, A.; Boggasch, E.; Rausch, A. A Markov Decision Process for managing a Hybrid Energy Storage System. J. Energy Storage 2018, 19, 160–169. [Google Scholar] [CrossRef]
- Katsigiannis, Y.A.; Georgilakis, P.S.; Karapidakis, E.S. Hybrid simulated annealing-tabu search method for optimal sizing of autonomous power systems with renewables. IEEE Trans. Sustain. Energy 2012, 3, 330–338. [Google Scholar] [CrossRef]
- Miletić, M.; Pandžić, H.; Yang, D. Operating and investment models for energy storage systems. Energies 2020, 13, 4600. [Google Scholar] [CrossRef]
- Shen, Z.; Wei, W.; Wu, D.; Ding, T.; Mei, S. Modeling arbitrage of an energy storage unit without binary variables. CSEE J. Power Energy Syst. 2021, 7, 156–161. [Google Scholar] [CrossRef]
- Vejdan, S.; Grijalva, S. The expected revenue of energy storage from energy arbitrage service based on the statistics of realistic market data. In Proceedings of the 2018 IEEE Texas Power and Energy Conference, Portland, OR, USA, 5–9 August 2018; pp. 1–6. [Google Scholar] [CrossRef]
- Hashmi, M.U.; Mukhopadhyay, A.; Busic, A.; Elias, J. Optimal storage arbitrage under net metering using linear programming. arXiv 2019, arXiv:1905.00418. [Google Scholar]
- Hesse, H.C.; Kumtepeli, V.; Schimpe, M.; Reniers, J.; Howey, D.A.; Tripathi, A.; Wang, Y.; Jossen, A. Ageing and efficiency aware battery dispatch for arbitrage markets using mixed integer linear programming. Energies 2019, 12, 999. [Google Scholar] [CrossRef]
- Adebayo, A.I.; Zamani-Dehkordi, P.; Zareipour, H.; Knight, A.M. Economic viability of price arbitrage operation of Vanadium Redox Battey in Alberta’s energy market. In Proceedings of the 12th IET International Conference on AC and DC Power Transmission (ACDC 2016), Beijing, China, 28–29 May 2016. [Google Scholar] [CrossRef]
- Ross, M.; Hidalgo, R.; Abbey, C.; Joós, G. An expert system for optimal scheduling of a diesel-Wind-Energy storage isolated power system. In Proceedings of the 2009 35th Annual Conference of IEEE Industrial Electronics, Porto, Portugal, 3–5 November 2009; pp. 4293–4298. [Google Scholar] [CrossRef]
- Mingru, Z.; Huliang, Z.; Wei, H. Optimization for the storage management and job scheduling based on expert system. In Proceedings of the 2009 IITA International Conference on Services Science, Management and Engineering, Zhangjiajie, China, 11–12 July 2009; pp. 47–49. [Google Scholar] [CrossRef]
- Wangbiao, Q.; Zhiyuan, Q. Design for symmetrical management of storage battery expert system based on single battery. In Proceedings of the 2006 IEEE International Conference on Mechatronics and Automation, Luoyang, China, 25–28 June 2006; pp. 1141–1146. [Google Scholar] [CrossRef]
- Sharma, V.; Haque, M.H.; Aziz, S.M. Annual electricity cost minimization for south australian dwellings through optimal battery sizing. In Proceedings of the 2019 IEEE Milan PowerTech, Milan, Italy, 23–27 June 2019. [Google Scholar] [CrossRef]
- Chiandussi, G.; Codegone, M.; Ferrero, S.; Varesio, F.E. Comparison of multi-objective optimization methodologies for engineering applications. In Computers and Mathematics with Applications; Elsevier: Amsterdam, The Netherlands, 2012; Volume 63. [Google Scholar] [CrossRef]
- Narimani, M.R.; Asghari, B.; Sharma, R. Optimal Sizing and Operation of Energy Storage for Demand Charge Management and PV Utilization. In Proceedings of the IEEE Power Engineering Society Transmission and Distribution Conference, Denver, CO, USA, 16–19 April 2018. [Google Scholar] [CrossRef]
- Parashar, S.; Swarnkar, A.; Niazi, K.R.; Gupta, N. Multiobjective optimal sizing of battery energy storage in grid-connected microgrid. J. Eng. 2019, 18, 5280–5283. [Google Scholar] [CrossRef]
- Khlifi, F.; Cherif, H.; Belhadj, J. Sizing and multi-objective optimization of a multisource micro-grid with storage for an economic activity zone. In Proceedings of the International Conference on Advanced Systems and Emergent Technologies, Hammamet, Tunisia, 19–22 March 2019; pp. 369–374. [Google Scholar] [CrossRef]
- Nebro, A.J.; Durillo, J.J.; Nieto, G.; Coello, C.A.C.; Luna, F.; Alba, E. SMPSO: A new pso-based metaheuristic for multi-objective optimization. In Proceedings of the 2009 IEEE Symposium on Computational Intelligence in Multi-Criteria Decision-Making, Nashville, TN, USA, 30 March–2 April 2009; Volume 2, pp. 66–73. [Google Scholar] [CrossRef]
- Martín, P.; Galván, L.; Galván, E.; Carrasco, J.M. System and Method for the Distributed Control and Management of a Microgrid. Patent No. WO2015113637, 6 August 2015. [Google Scholar]
- Galván, L.; Navarro, J.M.; Galván, E.; Carrasco, J.M.; Alcántara, A. Optimal scheduling of energy storage using a new priority-based smart grid control method. Energies 2019, 12, 579. [Google Scholar] [CrossRef]
- The European Commission’s Science and Knowledge Service. Photovoltaic Geographical Information System (PVGIS). Available online: ec.europa.eu/jrc/en/pvgis (accessed on 18 August 2020).
- CENACE. Precios Marginales Locales. Available online: www.cenace.gob.mx/Paginas/SIM/Reportes/PreciosEnergiaSisMEM.aspx (accessed on 18 August 2020).


| Cost | Value |
|---|---|
| PV generation costs | 632,500 €/MW |
| Battery cost | 170,000 €/MWh |
| PCS cost | 46,800 €/MWh |
| Engineering cost | 35,000 €/MWh |
| Containers cost | 30,000 €/MWh |
| EPC cost | 14,000 €/MWh |
| Refurbished cost | 125,000 €/MWh |
| Generation | Method | 50 MW | 100 MW | 150 MW | 200 MW | |
|---|---|---|---|---|---|---|
| Storage | ||||||
| Proposed | 181,435.89€ | 284,259.48 € | 363,612.18 € | 430,733.96 € | ||
| 25 MWh | Expert Opt | 173,848.68 € | 272,551.11 € | 351,613.59 € | 417,836.83 € | |
| Expert | 166,150.08 € | 264,617.73 € | 344,043.69 € | 411,097.68 € | ||
| Proposed | 200,440.45 € | 308,132.58 € | 391,363.26 € | 457,554.24 € | ||
| 50 MWh | Expert Opt | 189,418.42 € | 288,158.09 € | 367,273.84 € | 433,320.13 € | |
| Expert | 173,108.54 € | 273,019.45 € | 354,085.77 € | 420,165.98 € | ||
| Proposed | 217,415.82 € | 322,320.99 € | 414,244.28 € | 485,230.63 € | ||
| 75 MWh | Expert Opt | 205,005.00 € | 303,807.89 € | 382,757.15 € | 448,803.44 € | |
| Expert | 182,831.97 € | 281,711.76 € | 365,051.73 € | 430,032.63 € | ||
| Proposed | 233,156.28 € | 356,133.64 € | 440,545.50 € | 511,452.97 € | ||
| 100 MWh | Expert Opt | 220,639.13 € | 319,308.72 € | 398,240.45 € | 464,290.54 € | |
| Expert | 192,887.85 € | 293,311.60 € | 373,138.86 € | 439,876.02 € | ||
| Combination | MO vs. ES | MO vs. ESO | ESO vs. ES | ||||
|---|---|---|---|---|---|---|---|
| Generation | Storage | IRR (%) | NPV (%) | IRR (%) | NPV (%) | IRR (%) | NPV (%) |
| 40.12 MW | 7.90 MWh | 9.80 | 4.98 | 6.15 | 0.09 | 3.44 | 4.88 |
| 150 MW | 10.55 MWh | 3.76 | 2.46 | 2.25 | 0.25 | 1.48 | 2.21 |
| 60.78 MW | 99.46 MWh | 90.84 | 54.28 | 48.11 | 3.29 | 28.85 | 49.37 |
| 129.26 MW | 108.93 MWh | 47.17 | 31.80 | 26.06 | 3.27 | 16.75 | 27.62 |
Publisher’s Note: MDPI stays neutral with regard to jurisdictional claims in published maps and institutional affiliations. |
© 2021 by the authors. Licensee MDPI, Basel, Switzerland. This article is an open access article distributed under the terms and conditions of the Creative Commons Attribution (CC BY) license (https://creativecommons.org/licenses/by/4.0/).
Share and Cite
García-Santacruz, C.; Galván, L.; Carrasco, J.M.; Galván, E. Sizing and Management of Energy Storage Systems in Large-Scale Power Plants Using Price Control and Artificial Intelligence. Energies 2021, 14, 3296. https://doi.org/10.3390/en14113296
García-Santacruz C, Galván L, Carrasco JM, Galván E. Sizing and Management of Energy Storage Systems in Large-Scale Power Plants Using Price Control and Artificial Intelligence. Energies. 2021; 14(11):3296. https://doi.org/10.3390/en14113296
Chicago/Turabian StyleGarcía-Santacruz, Carlos, Luis Galván, Juan M. Carrasco, and Eduardo Galván. 2021. "Sizing and Management of Energy Storage Systems in Large-Scale Power Plants Using Price Control and Artificial Intelligence" Energies 14, no. 11: 3296. https://doi.org/10.3390/en14113296
APA StyleGarcía-Santacruz, C., Galván, L., Carrasco, J. M., & Galván, E. (2021). Sizing and Management of Energy Storage Systems in Large-Scale Power Plants Using Price Control and Artificial Intelligence. Energies, 14(11), 3296. https://doi.org/10.3390/en14113296