Article

Assessment of Energy Use Based on an Implementation of IoT, Cloud Systems, and Artificial Intelligence

by
Ciprian Mihai Coman
1,2,*,
Adriana Florescu
2 and
Constantin Daniel Oancea
2
1
ITC Department, Tesagon International SRL, Ploiesti 100029, Romania
2
Department of Applied Electronics and Information Engineering, Faculty of Electronics, Telecommunications and Information Technology, Politehnica University of Bucharest, Bucharest 060042, Romania
*
Author to whom correspondence should be addressed.
Energies 2021, 14(11), 3202; https://doi.org/10.3390/en14113202
Submission received: 19 April 2021 / Revised: 20 May 2021 / Accepted: 27 May 2021 / Published: 30 May 2021
(This article belongs to the Collection Feature Papers in Energy, Environment and Well-Being)

Abstract

:
Nowadays products are developed at a rapid pace, with shorter and shorter times between concept and go to market. With the advancement in technology, product designers and manufacturers can use new approaches to obtain information about their products and transform it into knowledge that they can use to improve the product. We developed the Poket Framework platform to facilitate the generation of product knowledge. In order to increase the reliability and safety in operation of electrical equipment, an evaluation is proposed, through tests and studies, using the original Poket Framework platform. Thus, several tests and studies were performed, which included testing and analyzing the correct integration in several use cases and remote data acquisition, and testing and analysis of the Poket Framework using literature established data sets of household appliances and electrical systems. Possible evolutions and Poket platform extensions are also considered.

1. Introduction

Advances in the field of digital communications have allowed remote control and monitoring of equipment and installations in real time, the interconnection of industrial complexes, laboratories located at long distances of hundreds of kilometers, etc. [1,2,3,4].
The term “Industry 4.0” was first introduced publicly in 2011 by a group of representatives from various fields (such as business, politics, and academia), as part of an initiative to increase German competitiveness in the manufacturing industry. The German federal government adopted the idea in its High Technology Strategy for 2020. Subsequently, a working group was formed to provide further advice on the implementation of Industry 4.0 [5,6].
“Industry 4.0” is a term often used to refer to the development process in production management and chain production. The term also refers to the fourth industrial revolution. The fourth industrial revolution encompasses areas that are not normally classified as industry, such as smart cities, for example [7].
Although the terms “Industry 4.0” and “fourth industrial revolution” are often used interchangeably, “Industry 4.0” factories have machines that are complemented by connectivity and wireless sensors, connected to a system that can view the entire production line and take decisions about its own operation [8,9,10].
The digitization of the production process has benefited from other novel technologies, such as blockchain [11]. There are also innovative approaches to sensor data manipulation and storage using blockchain technologies, thus providing decentralization, transparency, and immutability [12,13].
In essence, Industry 4.0 is the trend towards automation and data exchange in technologies and manufacturing processes that include cyber–physical systems (CPS), the Internet of Things (IoT), the Industrial Internet of Things (IIOT), cloud computing, cognitive computing, and artificial intelligence [14,15,16,17].
Industry 4.0 favors what has been called the “smart factory”. In modular structured intelligent factories, cyber–physical systems monitor physical processes, create a virtual copy of the physical world, and make decentralized decisions. On the Internet of Things, cyber–physical systems communicate and cooperate with each other and with people in real time, both internally and through the organizational services offered and used by value chain participants [18,19].
As a successor to technologies such as RFID and Wireless Sensor Networks (WSN), the IoT has stumbled into vertical silos of proprietary systems, providing little or no interoperability with similar systems. As the IoT represents future state of the Internet, an intelligent and scalable architecture is required to provide connectivity between these silos, enabling discovery of physical sensors and interpretation of messages between the things [20]. The determining factor is the pace of change. The correlation of the speed of technological development and, as a result, the socio-economic and infrastructural transformations with human life allows us to see a qualitative grow in the speed of development, which marks a transition to a new era [21,22].
In Industry 4.0, there are four design principles. These principles support companies in identifying and implementing Industry 4.0 scenarios [23].
  • Interconnection: The ability of machines, devices, sensors, and people to connect and communicate with each other through the Internet of Things (IoT) or Internet of People (IoP).
  • Transparency of information: The transparency offered by Industry 4.0 technology provides operators with a wealth of useful information needed to make the right decisions.
  • Technical assistance: First, the ability of maintain systems to support people by aggregating and visualizing information comprehensively to make informed decisions and resolve urgent issues in a short time. Second, the ability of physical cybernetic systems to physically support people by performing a series of unpleasant, too strenuous, or unsafe tasks for their human counterpart.
  • Decentralized decisions: The ability of physical cybernetic systems to make decisions on their own and to perform their tasks as autonomously as possible. Only in case of exceptions, interferences or conflicting objectives, tasks are delegated to a higher level.
Industry 4.0 provides sustainable production for the environment through environmentally friendly manufacturing processes, green supply chain management, and green products [24]. These concepts refer to both manufacturing and logistics and they represent a link between the real world and the virtual world, where “reality” is determined by cyber-systems featuring a certain level of artificial intelligence [25].
“Industry 4.0” is an abstract and complex multi-component term when we take a closer look at society and current digital trends. To understand how extensive these components are, here are some examples of digital technologies that are part of the concept: mobile devices [26], Internet of Things (IoT) platforms [27], location detection technologies [28], advanced human–machine interfaces [29], authentication and fraud detection [30,31], 3D printing [32], smart sensors [33,34], data analysis and advanced algorithms [35,36], multi-level customer interaction and customer profiling [37], augmented reality [38], and cloud [39]. Mainly, these technologies can be summarized in four major components, defining the term “Industry 4.0” or “smart factory”:
  • Cyber–physical systems;
  • Internet of things;
  • Cloud computing;
  • Cognitive computing.
With the help of cyber–physical systems that monitor physical processes, a virtual copy of the physical world can be designed. Thus, these systems have the ability to make decentralized decisions on their own and achieve a high degree of autonomy. As a result, Industry 4.0 is a network with a wide range of new technologies to create value [40].
Vertically, Industry 4.0 integrates organization-wide processes, for example, product development, manufacturing, logistics, and service processes, while horizontally, Industry 4.0 includes internal operations from suppliers to customers, plus all key partners.
In the following sections we present the Poket framework designed to monitor and record product parameters in the broader context of Industry 4.0. The system uses data analysis and data visualization algorithms to create product knowledge to be used to improve the product design, the manufacturing process, the maintenance and service procedures, etc. Section 2 presents the general methods and materials used to create the Poket framework, followed by several experiments in different contexts in Section 3, including one use case with data gathered from our custom use case in Section 3.1 and standard literature datasets used to test the Poket data analysis tool in Section 3.2. The final discussions and conclusions are presented in Section 4.

2. Materials and Methods

Integrating new methods of data collection and analysis, for example, by expanding existing products or creating new digitized products, helps companies generate product usage data and thus refine products to better meet customer needs.
Generating customer satisfaction is a multi-stage process that never ends, because customer needs are constantly changing. Therefore, companies are expanding their offerings by establishing disruptive digital business models to provide their customers with digital solutions that best meet their needs.
The business potential of the Fourth Industrial Revolution lies not only in optimizing the operational processes, but also in its services for a wide range of applications. Therefore, the Internet of Things is complemented by the so-called “Internet of Services”, because smart products offer their capabilities as smart services.
There are four industrial revolutions, starting with the 18th century mechanization based on the invention of the steam engine. At the end of the 19th century came the next massive technological advancements in the field of industries and the use of new energy sources: electricity, gas, and oil. Adding chemical synthesis, methods of communication, the automobile and the plane makes this the Second Industrial Revolution one of the most important [41].
Building on the third industrial revolution that included the creation of computers and the Internet, Industry 4.0 takes technology to the next evolution by blurring the lines between the digital and the physical world. Industry 4.0 is an all-encompassing term to refer to how computers, data, and automation evolve and come together to change the way work is done, and especially, the fabrication process. Elements such as automation, Artificial Intelligence (AI), IoT and others are becoming more widespread. While past industrial revolutions have essentially focused on the progress of technology, Industry 4.0 is more about the development of technology and its impact on everyday life.
The topic of integrating sensors, networks, cloud, and artificial intelligence into complete systems with objectives such as automatic decision making, knowledge generation or monitoring is in progress. Sensor networks are nowadays used in various configurations, wired or wireless, only by monitoring or operating, independently or connected to Industry 4.0. The multitude of data taken and taken, determined a specific approach in terms of architecture and data. An important role is played by virtual representation and modeling of sensor networks [42].
The virtual model is used to evaluate performance and cost-effectiveness indicators, showing that the sensor–cloud architecture outperforms the traditional wireless network by increasing sensor life, decreasing power consumption, improving sensor availability and data reliability in monitoring remote, stabilization of multi-agent sensor systems.
All of the above come together into the data acquisition part of Poket, using sensors and single board computers to gather product data and send it through the Internet to a cloud system responsible for receiving, processing, storing, and serving information.
Clustering is one of the most commonly used exploratory data analysis techniques that can provide an image of the data structure. It can be seen as the task of identifying groups so that the data in the same cluster are very similar, while the data points in different clusters are very different. The decision of the similarity measure to be used is application specific. Clustering analysis can be done based on the characteristics in which we try to find subgroups based on similarities [43,44].
An example of analysis uses K-means. K-means clustering is one of the simplest and most popular unsupervised machine learning algorithms. Usually, unsupervised algorithms make inferences from data sets using only input vectors without referring to known or labeled results [45].
The goal of K-means is simple: group similar data points and search for underlying patterns. Thus, K-means looks for a fixed number (k) of clusters in a data set. A cluster refers to a collection of data points aggregated together because of certain similarities. The “means” in K-means refer to data mediation; that is, finding the central statistical indicator.
The algorithms described above are used by the artificial intelligence component of the Poket system in order to transform sensor data into product knowledge.
The first equipment used to test in a real environment the possibility of obtaining data from electronic devices, was a commercial product developed by ALI6 srl—Italy. HyREI is a complex electronic device capable of managing the production of electricity from renewable and non-renewable sources, in a rational and efficient way, satisfying the partial or total energy needs of domestic and/or industrial consumers.
HyREI is a SMART GRID equipment capable of creating customized electrical networks. It is an extremely flexible and modular product, adaptable to different applications and scalable for different powers, from 500 W to 1000 kW and over.
The monitored product consists of a hybrid energy production, storage and management system using the electrical management and control panel (HyREI), which, combined with a photovoltaic system and energy storage batteries, is able to ensure energy savings and autonomy, even in the absence of a direct connection to the power supply.
HyREI is an integrated SMART GRID equipment, which was created to meet the partial or total energy needs of electricity users of any kind. HyREI is an extremely flexible and modular system, suitable for off-grid or on-grid installations being a support of the electricity network in standby mode and is able to meet electricity needs by optimizing production from renewable energy sources, energy accumulation, and distribution based on user needs, Figure 1.
The equipment provides consumers with electricity in the form of alternating current, through an inverter, which converts the direct current from the bus of renewable sources and storage batteries into alternating current, Figure 2.
For a system of 1 kW rated power, it consists of:
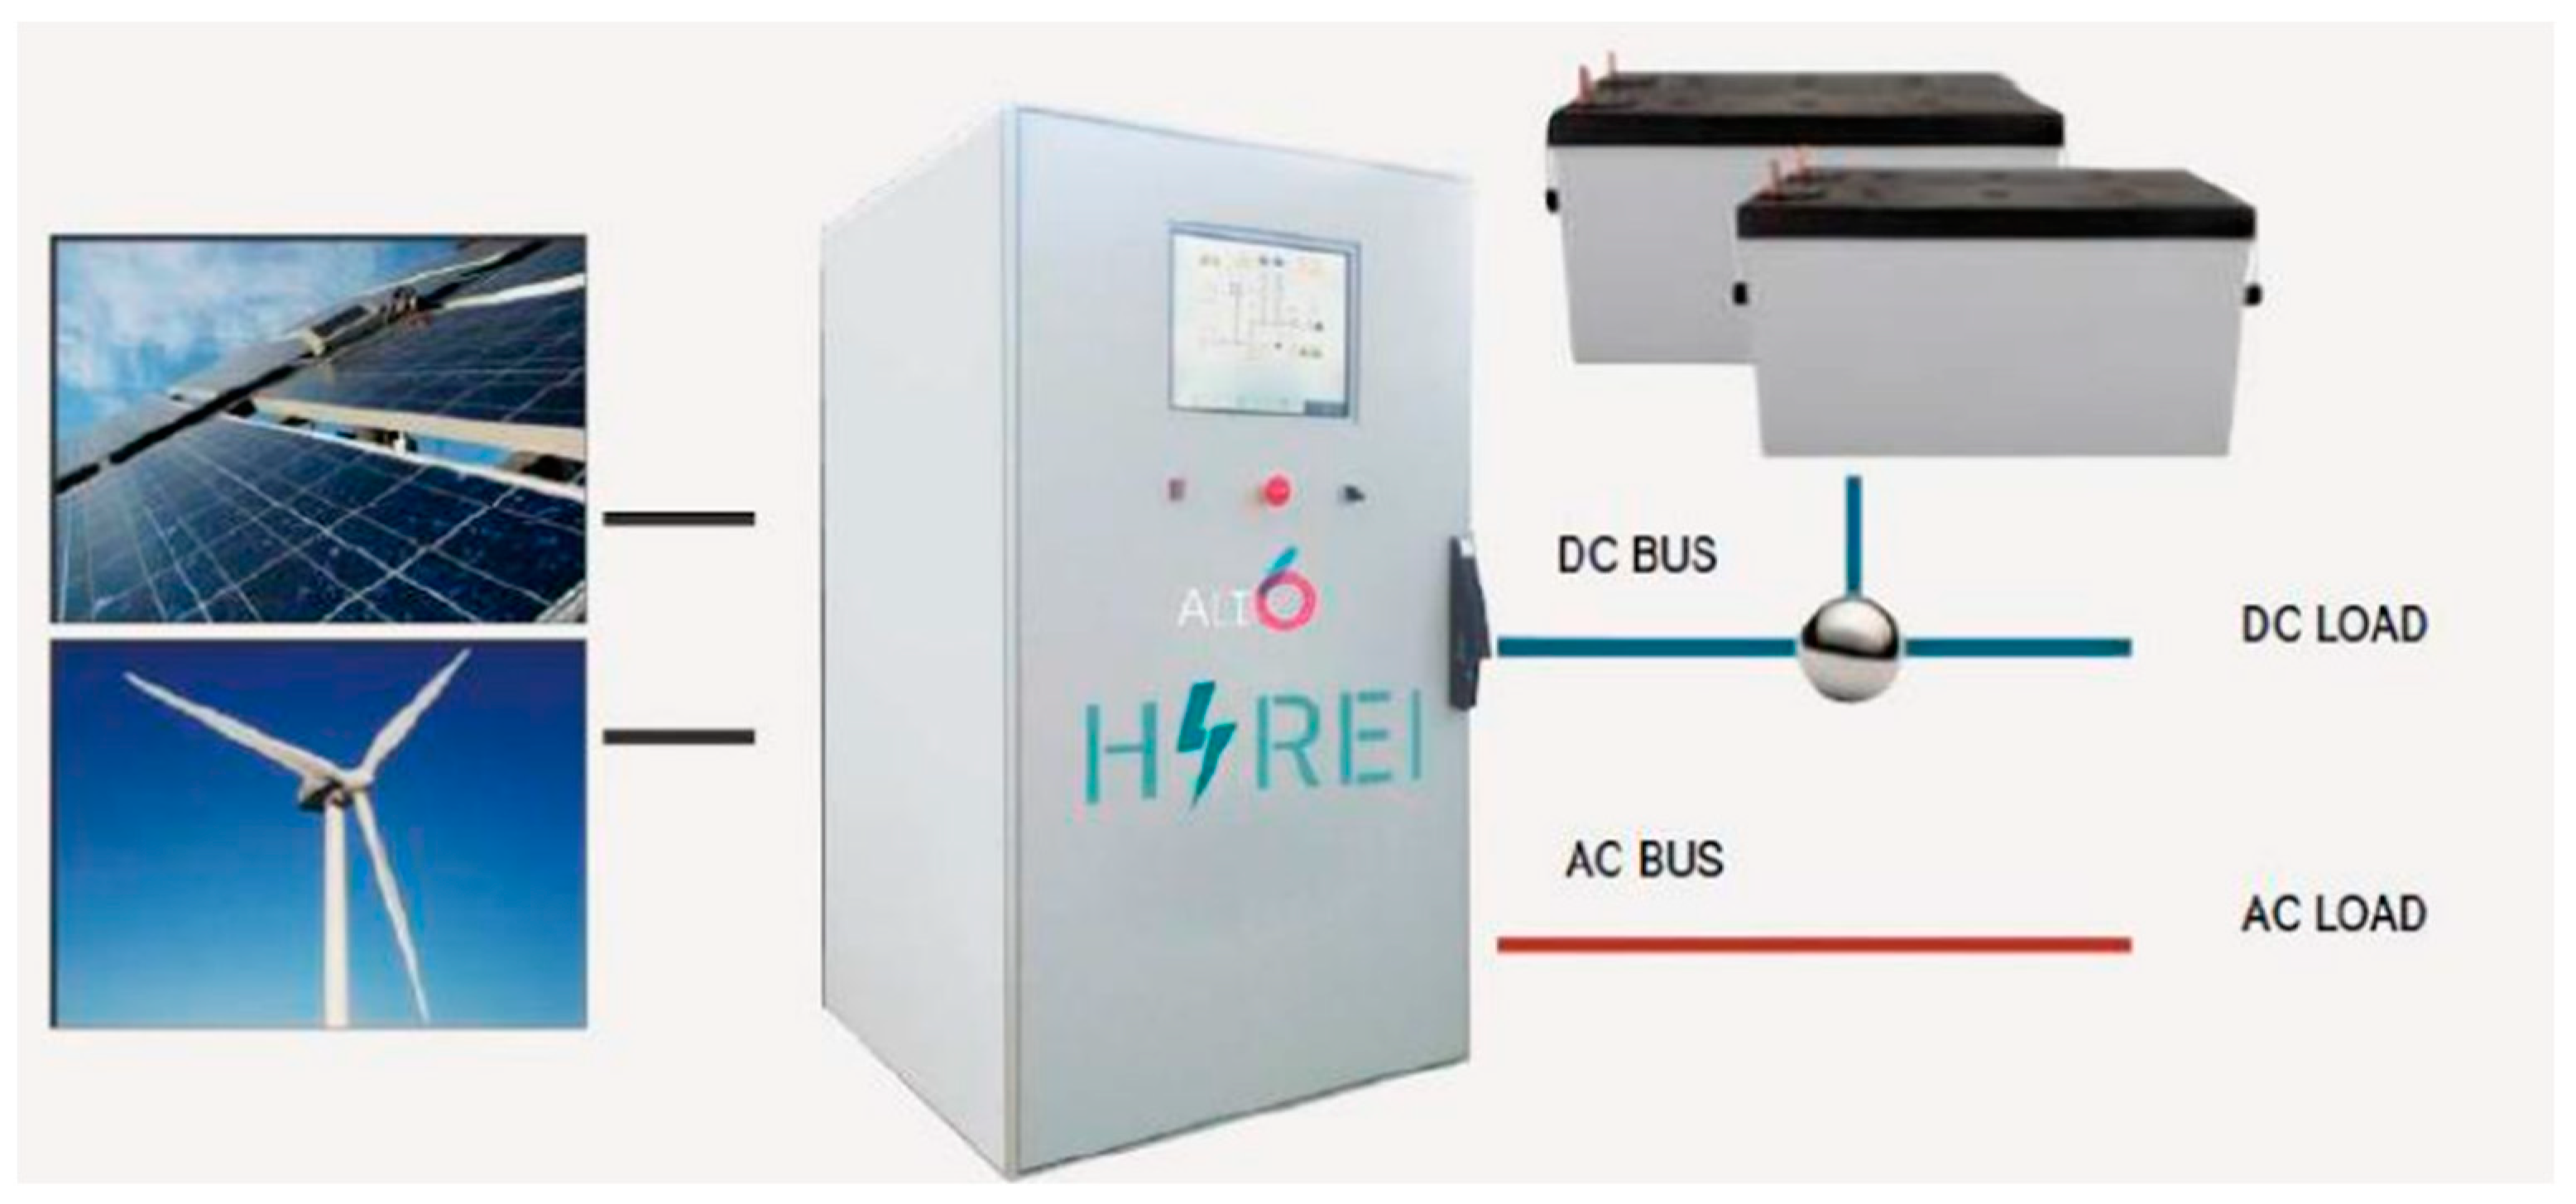
  • Photovoltaic system (4 photovoltaic panels) for a total power of approximately 1 kWp;
  • Pack with 4 batteries 240 Ah @ 12V, 5 h autonomy (42.8 A at 10.2 Volts);
  • Electrical control panel and system management (HyREI).
The Poket platform was designed and developed to gather data and generate knowledge about intelligent products. By feeding product usage information back to the earlier design and production phases and forwards to support areas (e.g., maintenance), the project aims to provide key players effective instruments to create better uses, services, design improvements, and then added value.
Development of the Poket framework platform took into account reliability issues that often affect IoT implementations. Further details of the Poket configuration and our research into reliability improving techniques in five main areas of the Sensor–Cloud Systems: network communication performance, auto recovery, local backup, automated software testing, and system security are presented in a separate article [46].
During the experimental phase, the Poket platform was introduced in parallel with the HyREI control system, in order to record its characteristic parameters (current, voltage, and temperature) and, finally, to analyze the recorded data, Figure 3.

3. Results

3.1. Product Monitoring and Analysis of a Hybrid Power System

In the first phase, the correct operation of data acquisition and storage was tested, using the Poket platform. The system is currently in the monitoring phase, to obtain more data and to allocate analysis. Table 1 is an extract (from 09/11/2020 to 10/11/2020) of the data obtained (voltage and output current at the inverter and the temperature of the photovoltaic panel).
Figure 4 shows the acquired and processed data (power output from the inverter calculated from the voltage and current of power line and temperature of the photovoltaic panels) of the same HyREI equipment over 30 days (from 12/10/2020 to 11/11/2020).
To provide users with a data analysis tool using machine learning, the “Dataiku” tool has been integrated into the Poket platform. To integrate the data acquired by the Poket portal into the Dataiku tool, it is possible to use the connection to the MySQL Manunet database.
Monitoring data was uploaded to the Poket data analysis section. By using the tool provided by ‘Dataiku’, it is possible to perform a simplified analysis of the data acquired through the Poket portal. In particular, once the dataset has been uploaded, it is possible to perform machine learning and data grouping analyzes to identify the “hidden” links between use cases and to create added value for designers and users.
Given the purpose of the system and the inertia in the variation of renewable energy sources (in this case HyREI was connected to a photovoltaic system), it was decided to perform sampling at a rate of about four samples per hour.
Once the features have been identified, it is possible to select the type of algorithm that will be used in the data analysis. Once the training procedure has been performed, the interface provides a comparison of the results of different algorithms using different metrics. Figure 5 shows the scatter plot of the results of the three-cluster group, while Figure 6 shows the scatter plot of the results of the five-cluster group
In particular, by dividing the data into three clusters, Figure 5, the algorithm highlighted three centroids with increasing powers. The first centroid, yellow in color, appears at low temperatures and powers; the second centroid, red in color, appears at medium temperatures and high powers; the third centroid, green, appears at high temperatures and medium powers. These results and this graph are an important source for a designer, as they show very important information about the sizing of the electricity generation system.
From the graph, in fact, it can be seen that as the temperature increases (an event that certainly corresponds to a higher irradiation), electricity production increases to a certain value, beyond which there is a deterioration in system performance. This, from a design point of view, may be related to an undersizing of the electrical cables which, having an inadequate section, implies a loss of energy caused by the Joule effect, when the currents involved increase. This consideration is one of many that can be made through data analysis.
The same data can be summarized through an interface that allows reporting of both the data set and the spreadsheets in the form of a table, Figure 7.

3.2. Data Testing and Analysis from Electrical Appliances and Systems

To evaluate the potential of the Poket framework, in addition to validation tests on HyREI, additional studies and data analyzes were performed using different data sets found in the literature. The reason for this choice was to validate the idea behind the Poket framework, namely to provide small and medium-sized enterprises with an efficient system capable of transforming information into knowledge throughout the life cycle of the product.
For more comprehensive tests, the “UK-DALE” data set, present in the literature and widely used in sectoral studies, was chosen [47]. UK-DALE is an open access data set from the UK that records household electricity consumption at a sampling rate of 16 kHz for the whole house and 1/6 Hz for individual appliances. This is the first open access data set in the UK to have this temporal resolution. The authors recorded data from five houses, one of which was recorded for 655 days, the longest duration we know of for any set of energy data at this sampling rate.
The individual device monitoring systems used for the UK-DALE dataset have a button to allow users to turn the connected device on and off. The authors recorded the activity of this switch in a channel_ <X> _button_press.dat file. If the switch has just been activated, a “1” is recorded. If the switch has just been turned off, a “0” is recorded. The reason behind recording the events related to storing a switch is that they provide (imperfect) information about room use. Startup events should be a perfectly clean record (ie the only possible reason for a data startup event to occur is that the user pressed the switch). Unfortunately, deactivation events can include false positive signals. From time to time, electronic devices stop spontaneously (an event that is indistinguishable from the actual push of a button). Moreover, if the power is interrupted and returned within 12 s, it will be recorded as a shutdown event.
Dataiku’s machine learning capabilities allow analysts, regardless of their level of experience, to reap the benefits of data science without advanced coding or training. Dataiku’s visual and automated platform covers the entire data flow, making data science and machine learning an extension rather than a limit to the current skills of analysts. Dataiku integration can be seen as an asset for using the Poket platform even by users who are not very good at machine learning. Once the data was uploaded, it was possible, through the graphical interface, to stack the individual files and analyze them using grouping algorithms and evaluate the “hidden” content useful for the analysis phase.
Using the clustering algorithms, no interesting data can be derived from the grouping, Figure 8, while useful information can be obtained by representing the use of kettles over time, Figure 9. From this graph, in fact, it can be deduced that such devices are usually used in a discontinuous manner and are therefore not subject to wear and tear due to incorrect heat dissipation during their use.
The same consideration arose when evaluating a typical use of non-professional printers. To fully understand the potential of the idea behind the Poket system, another data set available in the literature was considered. Energy consumption data include actual power, reactive power, Root Mean Square (RMS) current, RMS voltage, frequency, and voltage phase relative to current. Two hundred and twenty-five devices were recorded in two one-hour sessions. The database is balanced with 15 different brands/models divided into 15 categories. The database is made available free of charge to the scientific community for the reproducibility of the experiment [48]. Figure 10 shows the power trends absorbed during typical printer use; from the absorbed power it is possible to derive the moments of activation and use by a user of the device itself.
The data show that, in most cases (approximately 90%), printers are used intermittently and therefore, if equipped with preheating systems, this is not energy sustainable; stand-by should therefore be less energy consuming. In some printers there is a standby power consumption of up to 30W; from an energy point of view, the size, and operation of this printer model should be reviewed. From this analysis it is clear how important it is for a designer and a user to identify the problems behind the use of products.

3.3. Data Analysis and Prediction Examples Using the Poket Platform

An example of the use of the Poket platform for the analysis of data regarding the comparison of energy consumption in three different sites is shown, Figure 11. In particular, a data set describing the consumption of two hotels and a chemical production site was identified. In addition to the time stamp, both energy consumption and temperatures in degrees Celsius were reported in the data set with a sampling time of 10 s.
After pre-processing, various analyzes of the data were performed. Figure 12 shows the data flow developed. Using the graphical interface, it is possible to trace all the results obtained to analyze them and evaluate any “hidden” information from the acquired data. Below are the consumption trends for the three places of interest, depending on the temperature, Figure 13, Figure 14 and Figure 15.
From the data it is possible to point out that for the chemical plant site there are no obvious correlations between temperature trends and consumption. With regard to the data from the two hotel sites, it is clear that, in the first case, energy consumption triples from an external temperature of 10 °C to a temperature of −10 °C, whereas, in the second case, the variation is 20% compared to the value recorded at 10 °C. These data suggest that, in the case of the ID18 site, the insulation system of the entire property should be revised, as there are exponential energy losses at low temperatures.
Through the Poket platform it is also possible to perform value prediction analysis. Figure 16 shows the comparison between the energy consumption values present in the database and the consumption values predicted by the regression obtained in the previous training phase on another data section. This predictive approach, applied to energy consumption data, can be extended to predict the behavior of machines and appliances and can be a valid help for end users. In addition, this approach gives the way for predictive machine maintenance. Predictive maintenance is one of the most interesting concepts among many related to Industry 4.0, i.e., what is now unanimously defined as the fourth industrial revolution. In particular, the ability to predict with increasing accuracy any malfunctions or failures affecting machinery and equipment is of great interest to all companies that would suffer a significant economic and productive response to the temporary interruption of their activity.

4. Discussion

The original Poket framework was successfully used to assess the energy usage in several scenarios, both real case experiments and scientific dataset found in the literature. In the first experiment, using a hybrid AC/DC power system, our system was able to correctly monitor current parameters as well as automatically provide clustering information using the k-means method. The most significant centroid appears at low temperatures and powers, suggesting that is the usage scenario that would benefit the most from efficiency and reliability improving product engineering. Furthermore, we see that electricity production increases to a certain value, beyond which there is a deterioration in system performance. This, from a design point of view, may be related to an under-sizing of the electrical cables, leading to a loss of energy caused by the Joule effect when the currents involved increase.
The second experiment analyzed in this paper used a data set found in the literature under the name UK-DALE, containing household appliances electricity consumption from five houses in UK, recorded over a period of two years. This data set was loaded into the Poket framework and processed by the clustering algorithm and the timeline data representation algorithm. The most pregnant centroid was visible as a sustained consumption around the 2400 W mark, attributed to heating systems and kettles.
A third experiment also used a data set found in the literature, containing non-professional printing devices. In total, 225 devices are recorded, covering 15 categories of printer brands and models. The Poket system was able to showcase significant differences between the printers in this dataset and prove its valuable contribution to product knowledge generation, that in turn can be used to improve the products themselves.
The next experiment presented in this paper covers three business locations: two hotels and a chemical production site. The influence of outside temperature on the business energy consumption was measured and the results show that for the chemical plant site there are no obvious correlations between temperature trends and consumption. In the case of the first hotel the energy consumption grew significantly while the external temperature went down and sub-freezing. The second hotel has the lowest energy requirement while the outside temperature is between 10 and 15 °C, with slight rise when heating or cooling systems are used.
The last experiment was designed to test the predictive algorithm built into the Poket system. The results were very promising when predicting energy consumption based on historical data. In addition, this approach leads the way for predictive machine maintenance, one of the most interesting concepts related to what is now unanimously defined as the fourth industrial revolution.
For the Poket system, the tests were used for the optimization and integration phases. Various tests have been performed to cover various issues that may affect the Poket system. In terms of network communication, this is a complex issue, with a multitude of modules and protocols involved. At the same time, cloud sensor systems use distributed equipment that is most often limited in terms of power consumption, computing power, memory, and storage.
So far, with IoT advances, a significant part of the research effort has been in comparing different communication protocols that could be used in related applications and scenarios. These efforts include comparisons based on the different characteristics of these protocols (the underlying transport protocol, the interaction model, security, and quality of service), as well as the strengths and weaknesses of their individual performance in different systems related to the Internet of Things. In general, there is no comparative study of all the protocols mentioned in a scenario covering a broader architectural paradigm that combines IoT systems, the cloud transition zone and cloud computing, leaving it as a major challenge for future research. The next step towards this goal would be to evaluate the performance of the various protocols examined in a useful application scenario. The use of solutions with multiple communication protocols presents, in fact, an important new direction of research: interoperability and their interaction models.

Author Contributions

Conceptualization, C.M.C.; methodology, C.M.C.; software, C.M.C.; validation, C.M.C., C.D.O., and A.F.; formal analysis, C.M.C.; investigation, C.D.O.; resources, C.M.C.; data curation, A.F.; writing—original draft preparation, C.D.O.; writing—review and editing, A.F. and C.D.O.; visualization, C.M.C.; supervision, A.F.; project administration, C.M.C.; funding acquisition, A.F. All authors have read and agreed to the published version of the manuscript.

Funding

This work was supported in part by MANUNET through two agencies: UEFISCDI (Executive Unit for Financing Higher Education, Research, Development and Innovation) under Grant COFUND-ERANET MANUNET III-Poket, and the Apulia Region POR FESR-FSE 2014-2020—Priority Axis 1—Research, Technological Development, Innovation—Action 1.6 (Interventions for Strengthening the Regional and National Innovation System and Increasing Collaboration Between Companies and Research Structures and Their Enhancement) under Grant MNET18/ICT-3415.

Institutional Review Board Statement

Not applicable.

Informed Consent Statement

Not applicable.

Data Availability Statement

Not applicable.

Conflicts of Interest

The authors declare no conflict of interest. The funders had no role in the design of the study; in the collection, analyses, or interpretation of data; in the writing of the manuscript, or in the decision to publish the results.

References

  1. Zarnescu, A.; Ungurelu, R.; Secere, M.; Coman, C.M.; Varzaru, G. Putting Internet-Of-Things at the Service of Sustainable Agriculture. Case Study: Sysagria. Lucr. Ştiinţifice 2019, 62, 9–14. [Google Scholar]
  2. Bhuiyan, M.Z.A.; Wang, G.; Cao, J.; Wu, J. Deploying Wireless Sensor Networks with Fault-Tolerance for Structural Health Monitoring. IEEE Trans. Comput. 2015, 64, 382–395. [Google Scholar] [CrossRef]
  3. Coman, C.M.; Florescu, A.; Stigliano, G. Distributed Sensors Array for Composite Materials Manufacturing Quality Assurance. In Proceedings of the 2019 11th International Symposium on Advanced Topics in Electrical Engineering (ATEE), Bucharest, Romania, 28–30 March 2019; IEEE: Piscataway, NJ, USA, 2019; pp. 1–6. [Google Scholar]
  4. Dubey, K.; Shams, M.Y.; Sharma, S.C.; Alarifi, A.; Amoon, M.; Nasr, A.A. A Management System for Servicing Multi-Organizations on Community Cloud Model in Secure Cloud Environment. IEEE Access 2019, 7, 159535–159546. [Google Scholar] [CrossRef]
  5. Romero, C.A.T.; Castro, D.F.; Ortiz, J.H.; Khalaf, O.I.; Vargas, M.A. Synergy between Circular Economy and Industry 4.0: A Literature Review. Sustainability 2021, 13, 4331. [Google Scholar] [CrossRef]
  6. Almada-Lobo, F. The Industry 4.0 Revolution and the Future of Manufacturing Execution Systems (MES). J. Innov. Manag. 2016, 3, 16–21. [Google Scholar] [CrossRef]
  7. Qi, L.; Hu, C.; Zhang, X.; Khosravi, M.R.; Sharma, S.; Pang, S.; Wang, T. Privacy-Aware Data Fusion and Prediction with Spatial-Temporal Context for Smart City Industrial Environment. IEEE Trans. Ind. Inf. 2021, 17, 4159–4167. [Google Scholar] [CrossRef]
  8. Maktedar, P.P.; Deshpande, V.S. Interpretation of Reliability in Wireless Sensor Networks. In Proceedings of the 2013 International Conference on Cloud & Ubiquitous Computing & Emerging Technologies, Pune, India, 15 November 2013; IEEE Xplore: Piscataway, NJ, USA, 2013. [Google Scholar]
  9. Misra, S.; Chatterjee, S.; Obaidat, M.S. On Theoretical Modeling of Sensor Cloud: A Paradigm Shift from Wireless Sensor Network. IEEE Syst. J. 2017, 11, 1084–1093. [Google Scholar] [CrossRef]
  10. Fernandes, J.; Reis, J.; Melão, N.; Teixeira, L.; Amorim, M. The Role of Industry 4.0 and BPMN in the Arise of Condition-Based and Predictive Maintenance: A Case Study in the Automotive Industry. Appl. Sci. 2021, 11, 3438. [Google Scholar] [CrossRef]
  11. Stodt, J.; Schönle, D.; Reich, C.; Ghovanlooy Ghajar, F.; Welte, D.; Sikora, A. Security Audit of a Blockchain-Based Industrial Application Platform. Algorithms 2021, 14, 121. [Google Scholar] [CrossRef]
  12. Florea, B.C.; Taralunga, D.D. Blockchain IoT for Smart Electric Vehicles Battery Management. Sustainability 2020, 12, 3984. [Google Scholar] [CrossRef]
  13. Florea, B.C. Blockchain and Internet of Things Data Provider for Smart Applications. In Proceedings of the 2018 7th Mediterranean Conference on Embedded Computing (MECO), Budva, Montenegro, 7–10 June 2018; IEEE: Piscataway, NJ, USA, 2008; pp. 1–4. [Google Scholar]
  14. Martín-Gómez, A.; Ávila-Gutiérrez, M.J.; Aguayo-González, F. Holonic Reengineering to Foster Sustainable Cyber-Physical Systems Design in Cognitive Manufacturing. Appl. Sci. 2021, 11, 2941. [Google Scholar] [CrossRef]
  15. Sahal, R.; Alsamhi, S.H.; Breslin, J.G.; Brown, K.N.; Ali, M.I. Digital Twins Collaboration for Automatic Erratic Operational Data Detection in Industry 4.0. Appl. Sci. 2021, 11, 3186. [Google Scholar] [CrossRef]
  16. Coman, C.M.; Florescu, A.; Oancea, C.D. Improving the Efficiency and Sustainability of Power Systems Using Distributed Power Factor Correction Methods. Sustainability 2020, 12, 3134. [Google Scholar] [CrossRef] [Green Version]
  17. Coman, C.M.; Florescu, A. Electric Grid Monitoring and Control Architecture for Industry 4.0 Systems. In Proceedings of the 2018 International Symposium on Fundamentals of Electrical Engineering (ISFEE), Bucharest, Romania, 1–3 November 2018; IEEE: Piscataway, NJ, USA, 2008; pp. 1–6. [Google Scholar]
  18. Serrano-Magaña, H.; González-Potes, A.; Ibarra-Junquera, V.; Balbastre, P.; Martínez-Castro, D.; Simó, J. Software Components for Smart Industry Based on Microservices: A Case Study in pH Control Process for the Beverage Industry. Electronics 2021, 10, 763. [Google Scholar] [CrossRef]
  19. Skarlat, O.; Schulte, S.; Borkowski, M.; Leitner, P. Resource Provisioning for IoT Services in the Fog. In Proceedings of the 2016 IEEE 9th International Conference on Service-Oriented Computing and Applications (SOCA), Macau, China, 4–6 November 2016; IEEE: Piscataway, NJ, USA, 2016; pp. 32–39. [Google Scholar]
  20. Desai, P.; Sheth, A.; Anantharam, P. Semantic Gateway as a Service Architecture for IoT Interoperability. In Proceedings of the 2015 IEEE International Conference on Mobile Services, New York, NY, USA, 27 July 2015; IEEE: Piscataway, NJ, USA, 2008. [Google Scholar]
  21. Cotet, G.B.; Carutasu, N.L.; Chiscop, F. Industry 4.0 Diagnosis from an IMillennial Educational Perspective. Educ. Sci. 2020, 10, 21. [Google Scholar] [CrossRef] [Green Version]
  22. Botlíková, M.; Botlík, J. Local Extremes of Selected Industry 4.0 Indicators in the European Space—Structure for Autonomous Systems. J. Risk Financ. Manag. 2020, 13, 13. [Google Scholar] [CrossRef] [Green Version]
  23. Dastjerdi, A.V.; Gupta, H.; Calheiros, R.N.; Ghosh, S.K.; Buyya, R. Fog Computing: Principles, architectures, and applications. In Internet of Things; Elsevier: Amsterdam, The Netherlands, 2016; pp. 61–75. ISBN 9780128053959. [Google Scholar]
  24. Jung, H.; Jeon, J.; Choi, D.; Park, J.-Y. Application of Machine Learning Techniques in Injection Molding Quality Prediction: Implications on Sustainable Manufacturing Industry. Sustainability 2021, 13, 4120. [Google Scholar] [CrossRef]
  25. Stanisławski, R.; Szymonik, A. Impact of Selected Intelligent Systems in Logistics on the Creation of a Sustainable Market Position of Manufacturing Companies in Poland in the Context of Industry 4.0. Sustainability 2021, 13, 3996. [Google Scholar] [CrossRef]
  26. Santos, G.L.; Endo, P.T.; Sadok, D.; Kelner, J. When 5G Meets Deep Learning: A Systematic Review. Algorithms 2020, 13, 208. [Google Scholar] [CrossRef]
  27. Muntjir, M.; Rahul, M.; Alhumyani, H. An Analysis of Internet of Things (IoT): Novel Architectures, Modern Applications, Security Aspects and Future Scope with Latest Case Studies. Int. J. Eng. Res. Technol. 2017, 6, 422–447. [Google Scholar]
  28. González, C.; Fernández-León, J. A Machine Learning Model to Detect Flow Disturbances during Manufacturing of Composites by Liquid Moulding. J. Compos. Sci. 2020, 4, 71. [Google Scholar] [CrossRef]
  29. Ardanza, A.; Moreno, A.; Segura, Á.; de la Cruz, M.; Aguinaga, D. Sustainable and Flexible Industrial Human Machine Interfaces to Support Adaptable Applications in the Industry 4.0 Paradigm. Int. J. Prod. Res. 2019, 57, 4045–4059. [Google Scholar] [CrossRef]
  30. Li, X.; Niu, J.; Bhuiyan, M.Z.A.; Wu, F.; Karuppiah, M.; Kumari, S. A Robust ECC-Based Provable Secure Authentication Protocol with Privacy Preserving for Industrial Internet of Things. IEEE Trans. Ind. Inf. 2018, 14, 3599–3609. [Google Scholar] [CrossRef]
  31. Miettinen, M.; Nguyen, T.D.; Sadeghi, A.-R.; Asokan, N. Revisiting Context-Based Authentication in IoT. In Proceedings of the DAC ’18: Proceedings of the 55th Annual Design Automation Conference, San Francisco, CA, USA, 24–29 June 2018; pp. 1–6. [Google Scholar]
  32. Rajamani, P.K.; Ageyeva, T.; Kovács, J.G. Personalized Mass Production by Hybridization of Additive Manufacturing and Injection Molding. Polymers 2021, 13, 309. [Google Scholar] [CrossRef] [PubMed]
  33. Nur-A-Alam; Ahsan, M.; Based, M.A.; Haider, J.; Rodrigues, E.M.G. Smart Monitoring and Controlling of Appliances Using LoRa Based IoT System. Designs 2021, 5, 17. [Google Scholar] [CrossRef]
  34. Pech, M.; Vrchota, J.; Bednář, J. Predictive Maintenance and Intelligent Sensors in Smart Factory: Review. Sensors 2021, 21, 1470. [Google Scholar] [CrossRef] [PubMed]
  35. Hollowell, J.C.; Kollar, B.; Vrbka, J.; Kovalova, E. Cognitive Decision-Making Algorithms for Sustainable Manufacturing Processes in Industry 4.0: Networked, Smart, and Responsive Devices. Econ. Manag. Financ. Mark. 2019, 14, 9. [Google Scholar] [CrossRef] [Green Version]
  36. Gröger, C. Building an Industry 4.0 Analytics Platform: Practical Challenges, Approaches and Future Research Directions. Datenbank Spektrum 2018, 18, 5–14. [Google Scholar] [CrossRef]
  37. Sturari, M.; Liciotti, D.; Pierdicca, R.; Frontoni, E.; Mancini, A.; Contigiani, M.; Zingaretti, P. Robust and Affordable Retail Customer Profiling by Vision and Radio Beacon Sensor Fusion. Pattern Recognit. Lett. 2016, 81, 30–40. [Google Scholar] [CrossRef]
  38. Stark, E.; Kučera, E.; Haffner, O.; Drahoš, P.; Leskovský, R. Using Augmented Reality and Internet of Things for Control and Monitoring of Mechatronic Devices. Electronics 2020, 9, 1272. [Google Scholar] [CrossRef]
  39. Ooi, B.Y.; Beh, W.L.; Lee, W.-K.; Shirmohammadi, S. Using the Cloud to Improve Sensor Availability and Reliability in Remote Monitoring. IEEE Trans. Instrum. Meas. 2019, 68, 1522–1532. [Google Scholar] [CrossRef]
  40. Mukherjee, M.; Shu, L.; Wang, D. Survey of Fog Computing: Fundamental, Network Applications, and Research Challenges. IEEE Commun. Surv. Tutor. 2018, 20, 1826–1857. [Google Scholar] [CrossRef]
  41. Pozdnyakova, U.A.; Golikov, V.V.; Peters, I.A.; Morozova, I.A. Genesis of the Revolutionary Transition to Industry 4.0 in the 21st Century and Overview of Previous Industrial Revolutions. In Industry 4.0: Industrial Revolution of the 21st Century; Popkova, E.G., Ragulina, Y.V., Bogoviz, A.V., Eds.; Springer International Publishing: Cham, Switzerland, 2019; Volume 169, pp. 11–19. ISBN 9783319943091. [Google Scholar]
  42. Jurado Pérez, L.; Salvachúa, J. Simulation of Scalability in Cloud-Based IoT Reactive Systems Leveraged on a WSAN Simulator and Cloud Computing Technologies. Appl. Sci. 2021, 11, 1804. [Google Scholar] [CrossRef]
  43. Fan, Y.; Zou, R.; Fan, X.; Dong, R.; Xie, M. A Hierarchical Clustering Method to Repair Gaps in Point Clouds of Powerline Corridor for Powerline Extraction. Remote Sens. 2021, 13, 1502. [Google Scholar] [CrossRef]
  44. Valdez, F.; Castillo, O.; Melin, P. Bio-Inspired Algorithms and Its Applications for Optimization in Fuzzy Clustering. Algorithms 2021, 14, 122. [Google Scholar] [CrossRef]
  45. Wu, J. Advances in K-Means Clustering; Springer Theses; Springer: Berlin/Heidelberg, Germany, 2012; ISBN 9783642298066. [Google Scholar]
  46. Coman, C.M.; D’amico, G.; Coman, A.V.; Florescu, A. Techniques to Improve Reliability in an IoT Architecture Framework for Intelligent Products. IEEE Access 2021, 9, 56940–56954. [Google Scholar] [CrossRef]
  47. Kelly, J.; Knottenbelt, W. The UK-DALE Dataset, Domestic Appliance-Level Electricity Demand and Whole-House Demand from Five UK Homes. Sci. Data 2015, 2, 150007. [Google Scholar] [CrossRef] [PubMed] [Green Version]
  48. Ridi, A.; Gisler, C.; Hennebert, J. ACS-F2–A New Database of Appliance Consumption Signatures. In Proceedings of the 2014 6th International Conference of Soft Computing and Pattern Recognition (SoCPaR), Tunis, Tunisia, 11–14 August 2014; IEEE: Piscataway, NJ, USA, 2014. pp. 145–150.
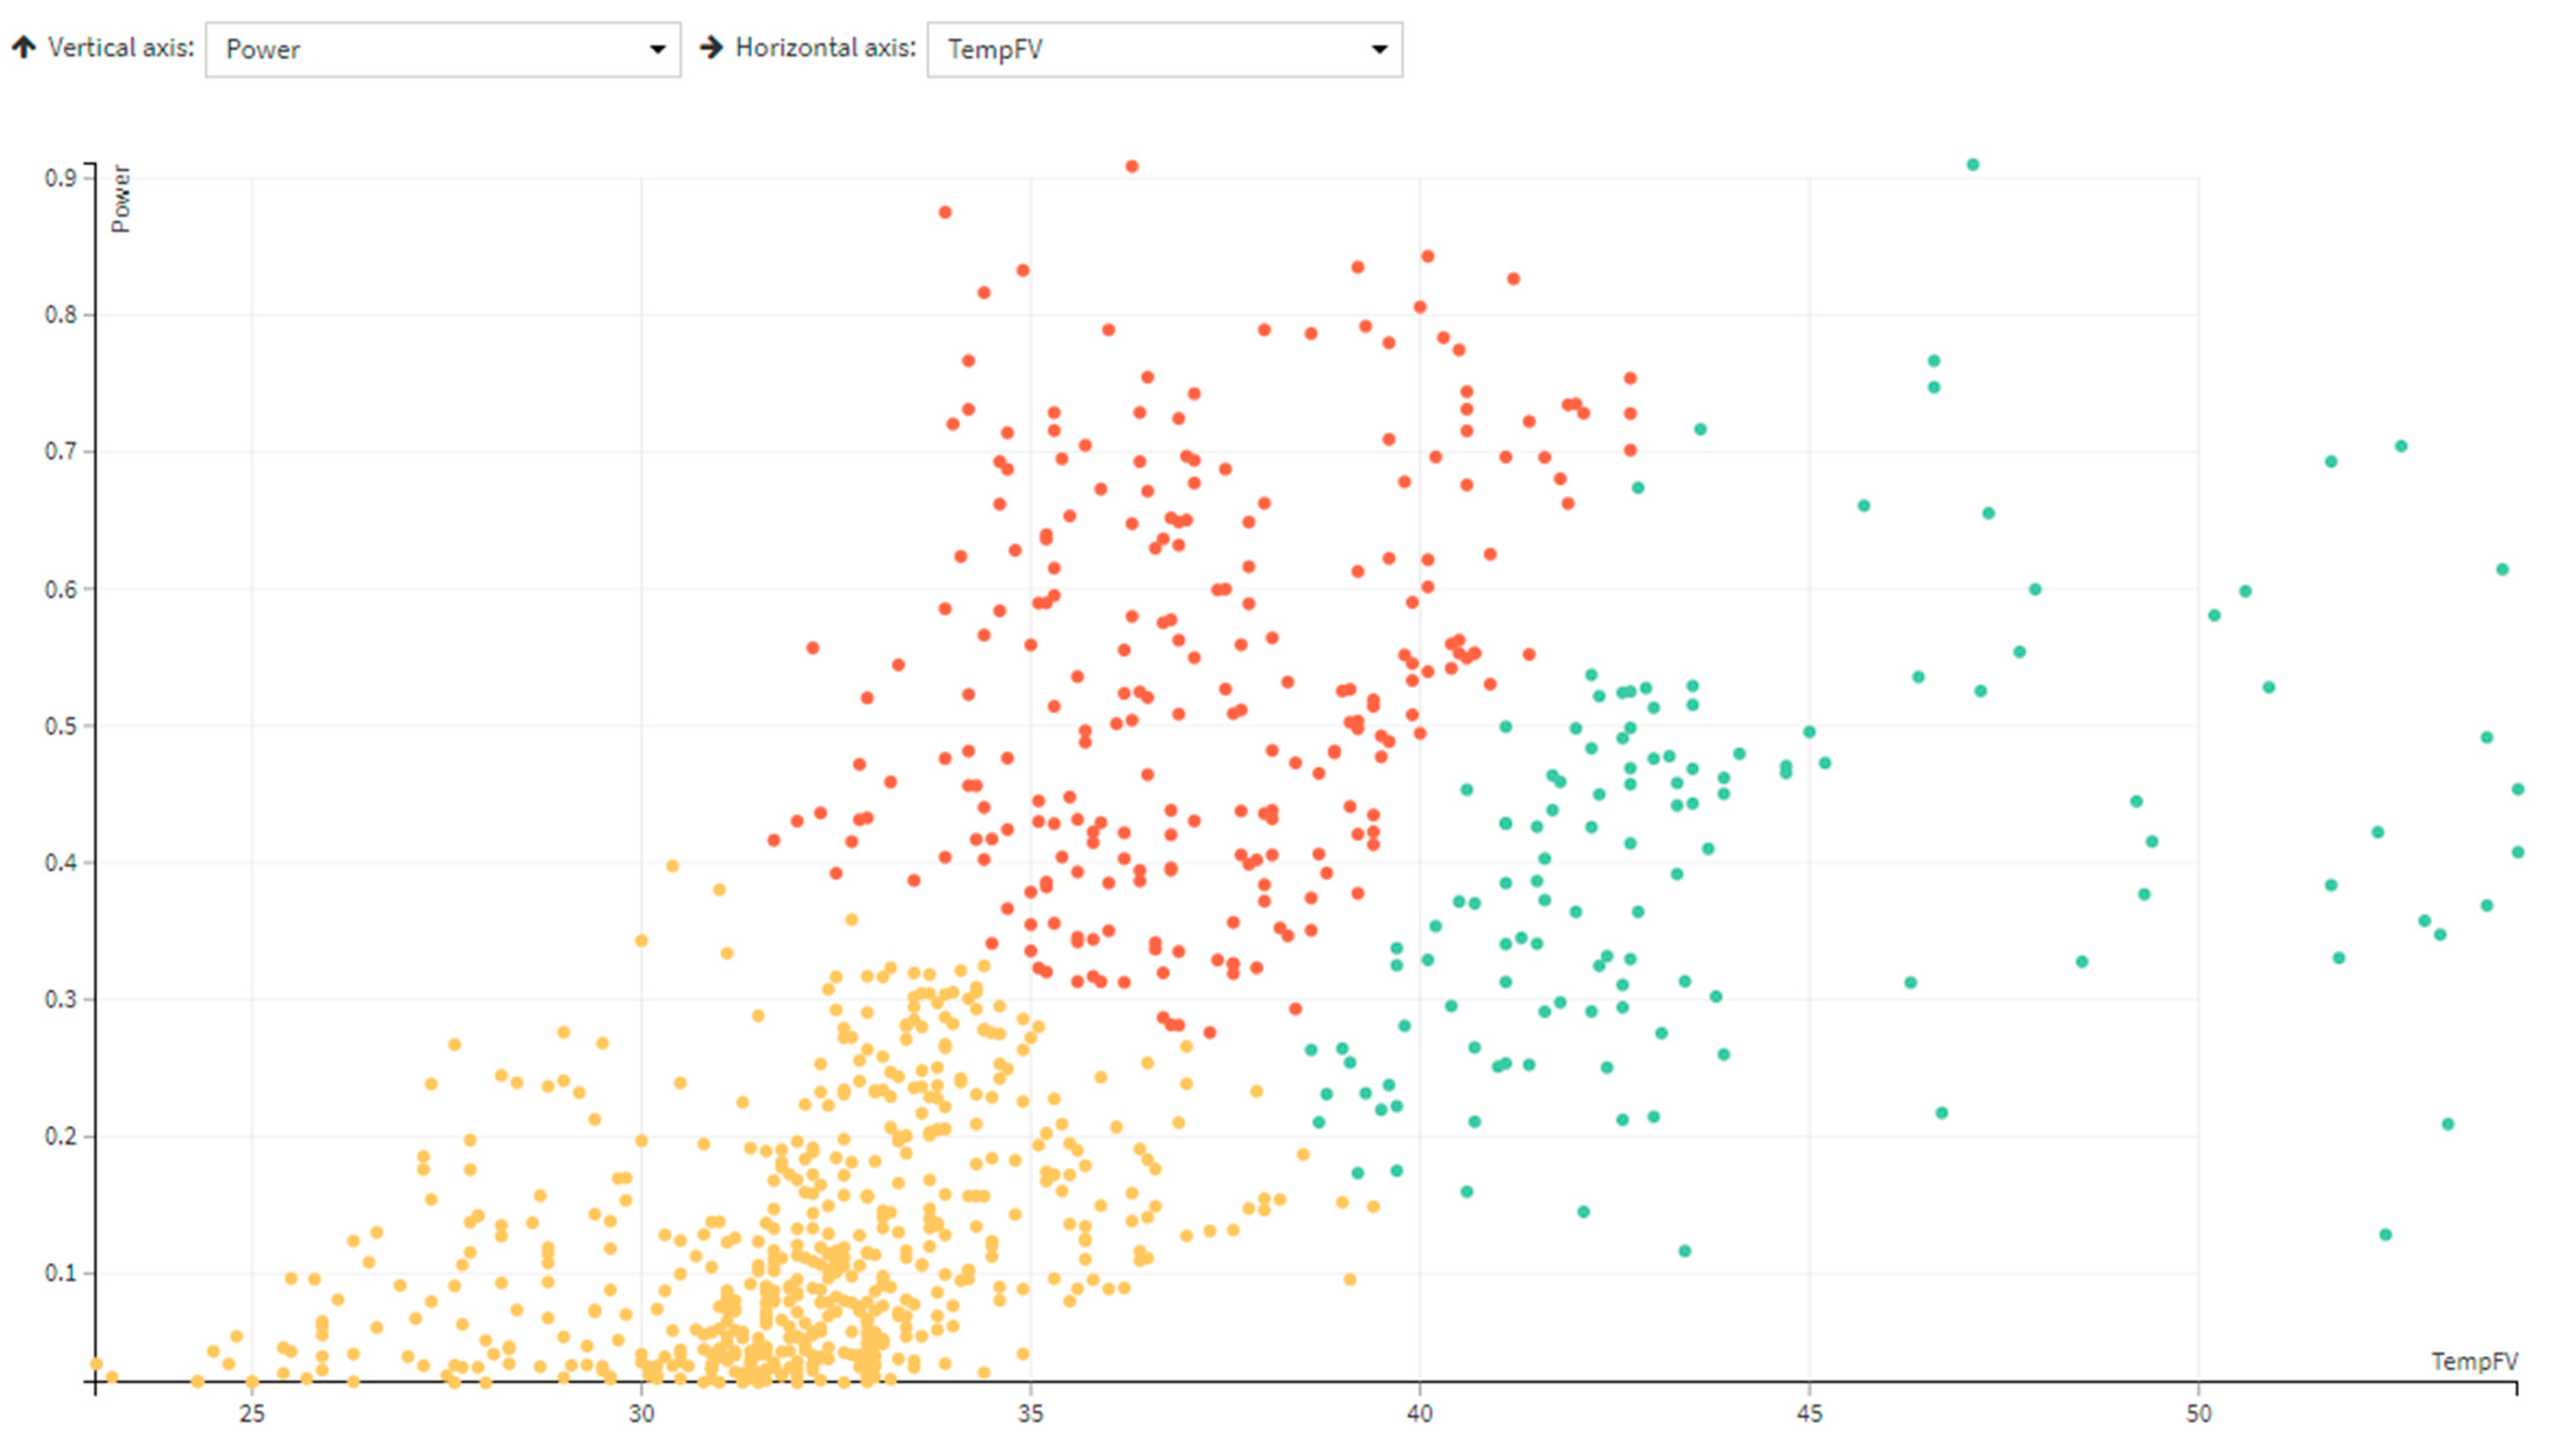
Figure 1. Appearance of HyREI equipment (developed by ALI6 srl-Italy).
Energies 14 03202 g001
Figure 2. Typical structure for hybrid uses of the equipment.
Energies 14 03202 g002
Figure 3. HiREI scheme and connection with Poket platform.
Energies 14 03202 g003
Figure 4. Data samples for the analyzed period.
Energies 14 03202 g004
Figure 5. Data group scatter plot (KMeans 3).
Energies 14 03202 g005
Figure 6. Data group scatter plot (KMeans 5).
Energies 14 03202 g006
Figure 7. Summary of results obtained and analyzed using the dashboard.
Energies 14 03202 g007
Figure 8. Post-clustering chart.
Energies 14 03202 g008
Figure 9. Graphic representation of the use of kettles/heater over time.
Energies 14 03202 g009
Figure 10. The trend of power absorbed during typical use of printers.
Energies 14 03202 g010aEnergies 14 03202 g010bEnergies 14 03202 g010c
Figure 11. Extracted from data acquired.
Energies 14 03202 g011
Figure 12. Data flow.
Energies 14 03202 g012
Figure 13. Energy consumption trend for a chemical plant.
Energies 14 03202 g013
Figure 14. Energy consumption trend for a hotel.
Energies 14 03202 g014
Figure 15. Energy consumption trend for another hotel.
Energies 14 03202 g015
Figure 16. The tendency of real and predicted values.
Energies 14 03202 g016
Table 1. Extract with the purchased data, using the Poket portal, in two days of monitoring, of the HyREI product.
TimestampTemp PV (°C)(V)(A)
160502778032.0235.90.006
160502694032.6230.90.089
160502598032.9224.20.152
160502514032.8227.50.320
160502424033.7230.80.520
160502328033.7231.80.636
160502238033.7230.50.609
160502148033.9237.20.666
160502058034.2237.30.660
160501968034.3224.80.929
160501878034.9233.70.964
160501788036.0234.61.492
160501698036.0229.81.676
160501608043.3224.32.042
160501518043.9229.52.012
160501428043.7224.71.825
160501338044.1224.32.138
160500894040.6233.31.942
160500438036.6225.70.782
160500348036.1237.50.871
160500264036.4224.90.850
160500168041.8234.31.271
160500078042.3227.61.426
160499988035.9229.00.654
160499898035.5222.60.774
160499808032.5229.60.508
160499718031.1225.60.389
160499628031.6231.10.393
160499538028.0234.60.218
160499448027.6237.80.140
160499358027.0233.30.011
160494102032.7233.80.010
160494012032.6226.70.058
160493922032.7224.80.043
160493832033.8229.50.257
160493742034.0232.90.329
160493652033.8232.80.371
160493562034.2226.90.424
160493472034.2225.60.455
160493418034.9235.41.118
160493334036.3232.90.682
160493238036.6222.71.513
160493148036.8226.71.747
160493058037.7235.91.855
160492974036.5227.02.045
160492878036.6223.71.527
160492788036.3230.92.183
160492698036.9236.02.155
160492608036.9226.72.481
160492518037.5237.22.221
160492428037.7224.12.282
160492278039.5227.82.162
160492188039.5233.32.046
160492098041.1223.41.918
160491978041.1235.21.822
160491888052.9223.11.603
160491804053.7224.41.643
160491708053.1236.91.466
160491618046.3229.91.359
160491528046.7228.30.951
160491438041.1233.41.085
160491348035.4230.30.697
160491258034.5233.10.516
160491168036.5224.70.496
160491078037.6222.20.594
160490988033.6232.60.233
160490898029.3225.80.209
160490808029.1229.10.144
160490718028.7234.10.003
Publisher’s Note: MDPI stays neutral with regard to jurisdictional claims in published maps and institutional affiliations.

